Article

Surface Area Variability of a North-Central Tanzanian Crater Lake

Department of Physical Geography and the Bolin Centre for Climate Research, Stockholm University, Stockholm 106 91, Sweden
*
Author to whom correspondence should be addressed.
Geosciences 2016, 6(2), 27; https://doi.org/10.3390/geosciences6020027
Submission received: 18 February 2016 / Revised: 30 May 2016 / Accepted: 31 May 2016 / Published: 8 June 2016
(This article belongs to the Special Issue Climate Change and Geosciences)

Abstract

:
A history of modern (1973–2015) surface area variability for Lake Basotu in north-central Tanzania has been reconstructed using archived Landsat images from the dry season between June and October. This record was compared to local weather data as well as larger scale weather patterns. The lake has been in a state of decline interrupted by major flood events since the beginning of the satellite record. From 1973 to 1997, the lake area was between 0.97 km2 and 4.28 km2. Lake extent abruptly increased to 13.86 km2 in 1998, when a co-occurrence of El Niño and a positive Indian Ocean Dipole led to extensive flooding. It is hypothesized that local agricultural practices leading to soil erosion and subsequent basin sedimentation have most likely increased the sensitivity of Lake Basotu to climatic fluctuations.

Graphical Abstract

1. Introduction

With food and water security issues at the forefront of concerns over global climate change, it is imperative to understand the sensitivity of freshwater resources, especially in semi-arid regions. Reconstructing the temporal variability of lakes may be the key to distinguishing which changes are human-made and which are due to natural variability.
The authors present a record of surface area variation for a Tanzanian crater lake created via a simple and effective method using archived Landsat images. Lake Basotu (4°22′11′′ S, 35°4′22′′ E) in the Hanang district is an important freshwater resource that has been at the center of social conflict in recent years [1,2,3]. Intensive agriculture practices have been cited as responsible for increased siltation, pollution, and reduction in water level. As this area mainly comprises soils with a high clay content (locally known as “mbuga”), it is highly susceptible to extreme weather events and is, therefore, a suitable location for investigating climatic effects in a semi-arid environment. Moreover, logistically, flood prediction is important to infrastructure, the economy, and preventing loss of life.
The Tanzanian government increased budgeted funds for climate change-related activities by 57% between 2009–2010 and 2012–2013, with 70% allocated for mitigation and adaptive strategies [4]. In March 2015, dozens of lives were lost and hundreds of people were left homeless due to flooding in Dar es Salaam and the Shinyanga region of Tanzania [5,6].
It is very likely for the frequency of heavy precipitation events to increase over tropical regions in the 21st century [7]. During times of drought, soil becomes compacted. This, combined with periodic and extreme precipitation events, increases the chance of flooding and less effective recharge of groundwater, which will negatively impact agricultural viability. Mbuga soils are rich in clay and characterized by developing deep cracks upon drying, which is typical of vertisols. Upon rewetting, the cracks fill and close due to swelling of clays, making the soil nearly impervious to further infiltration [8]. This leads to runoff, and vertisols are consequently susceptible to gully formation. Even in low rainfall areas, many Tanzanian storms surpass rainfall intensities required for surficial erosion [9].
Flood events in Tanzania have been linked to the co-occurrence of an abnormally strong El Niño coinciding with a positive phase of the Indian Ocean Dipole (IOD) [10]. The effects can be generally positive in Tanzania, with an increase in rain leading to gains in crop yields, although experiences from the 1997–1998 El Niño actually resulted in localized losses and damages to infrastructure. Losses associated with heavy rainfall were greatest in low-lying areas with predominantly heavy clay soils, such as mbuga [11].
An El Niño event is evident when the five-month running means of sea surface temperature (SST) anomalies exceed 0.4 °C for six months or more in the region between 5° N–5° S and 120°–170° W [12]. One result of this disturbance on global climate is the equator-ward shift of the ITCZ. Due to this, equatorial eastern Africa experiences wetter than normal conditions during its rainy season, with the strongest relationship evident from October to December [13,14].
The IOD signifies the difference in SST between Sumatra and the western Indian Ocean. During a positive phase, warmer waters are present along the eastern coast of Africa, with a reversal of the easterly trade winds, resulting in increased precipitation over tropical East Africa [15]. The IOD is commonly represented as the Dipole Mode Index (DMI), which is the difference between these anomalies. Using the Hadley Center Sea Ice and Sea Surface Temperature dataset, with the linear trend of SST removed, monthly DMI was calculated from 1960 to 2014 [16].
A greater understanding of the mechanisms behind flood events is integral to planning efforts for the agricultural sector as well as disaster preparation and mediation. This study aims to provide a record of surface area variation for Lake Basotu in Tanzania. Lake extent data are compared to both indices of large-scale weather patterns and local meteorological data in order to ascertain what is associated with natural variability and what may be an effect of human influence on the environment.

2. Materials and Methods
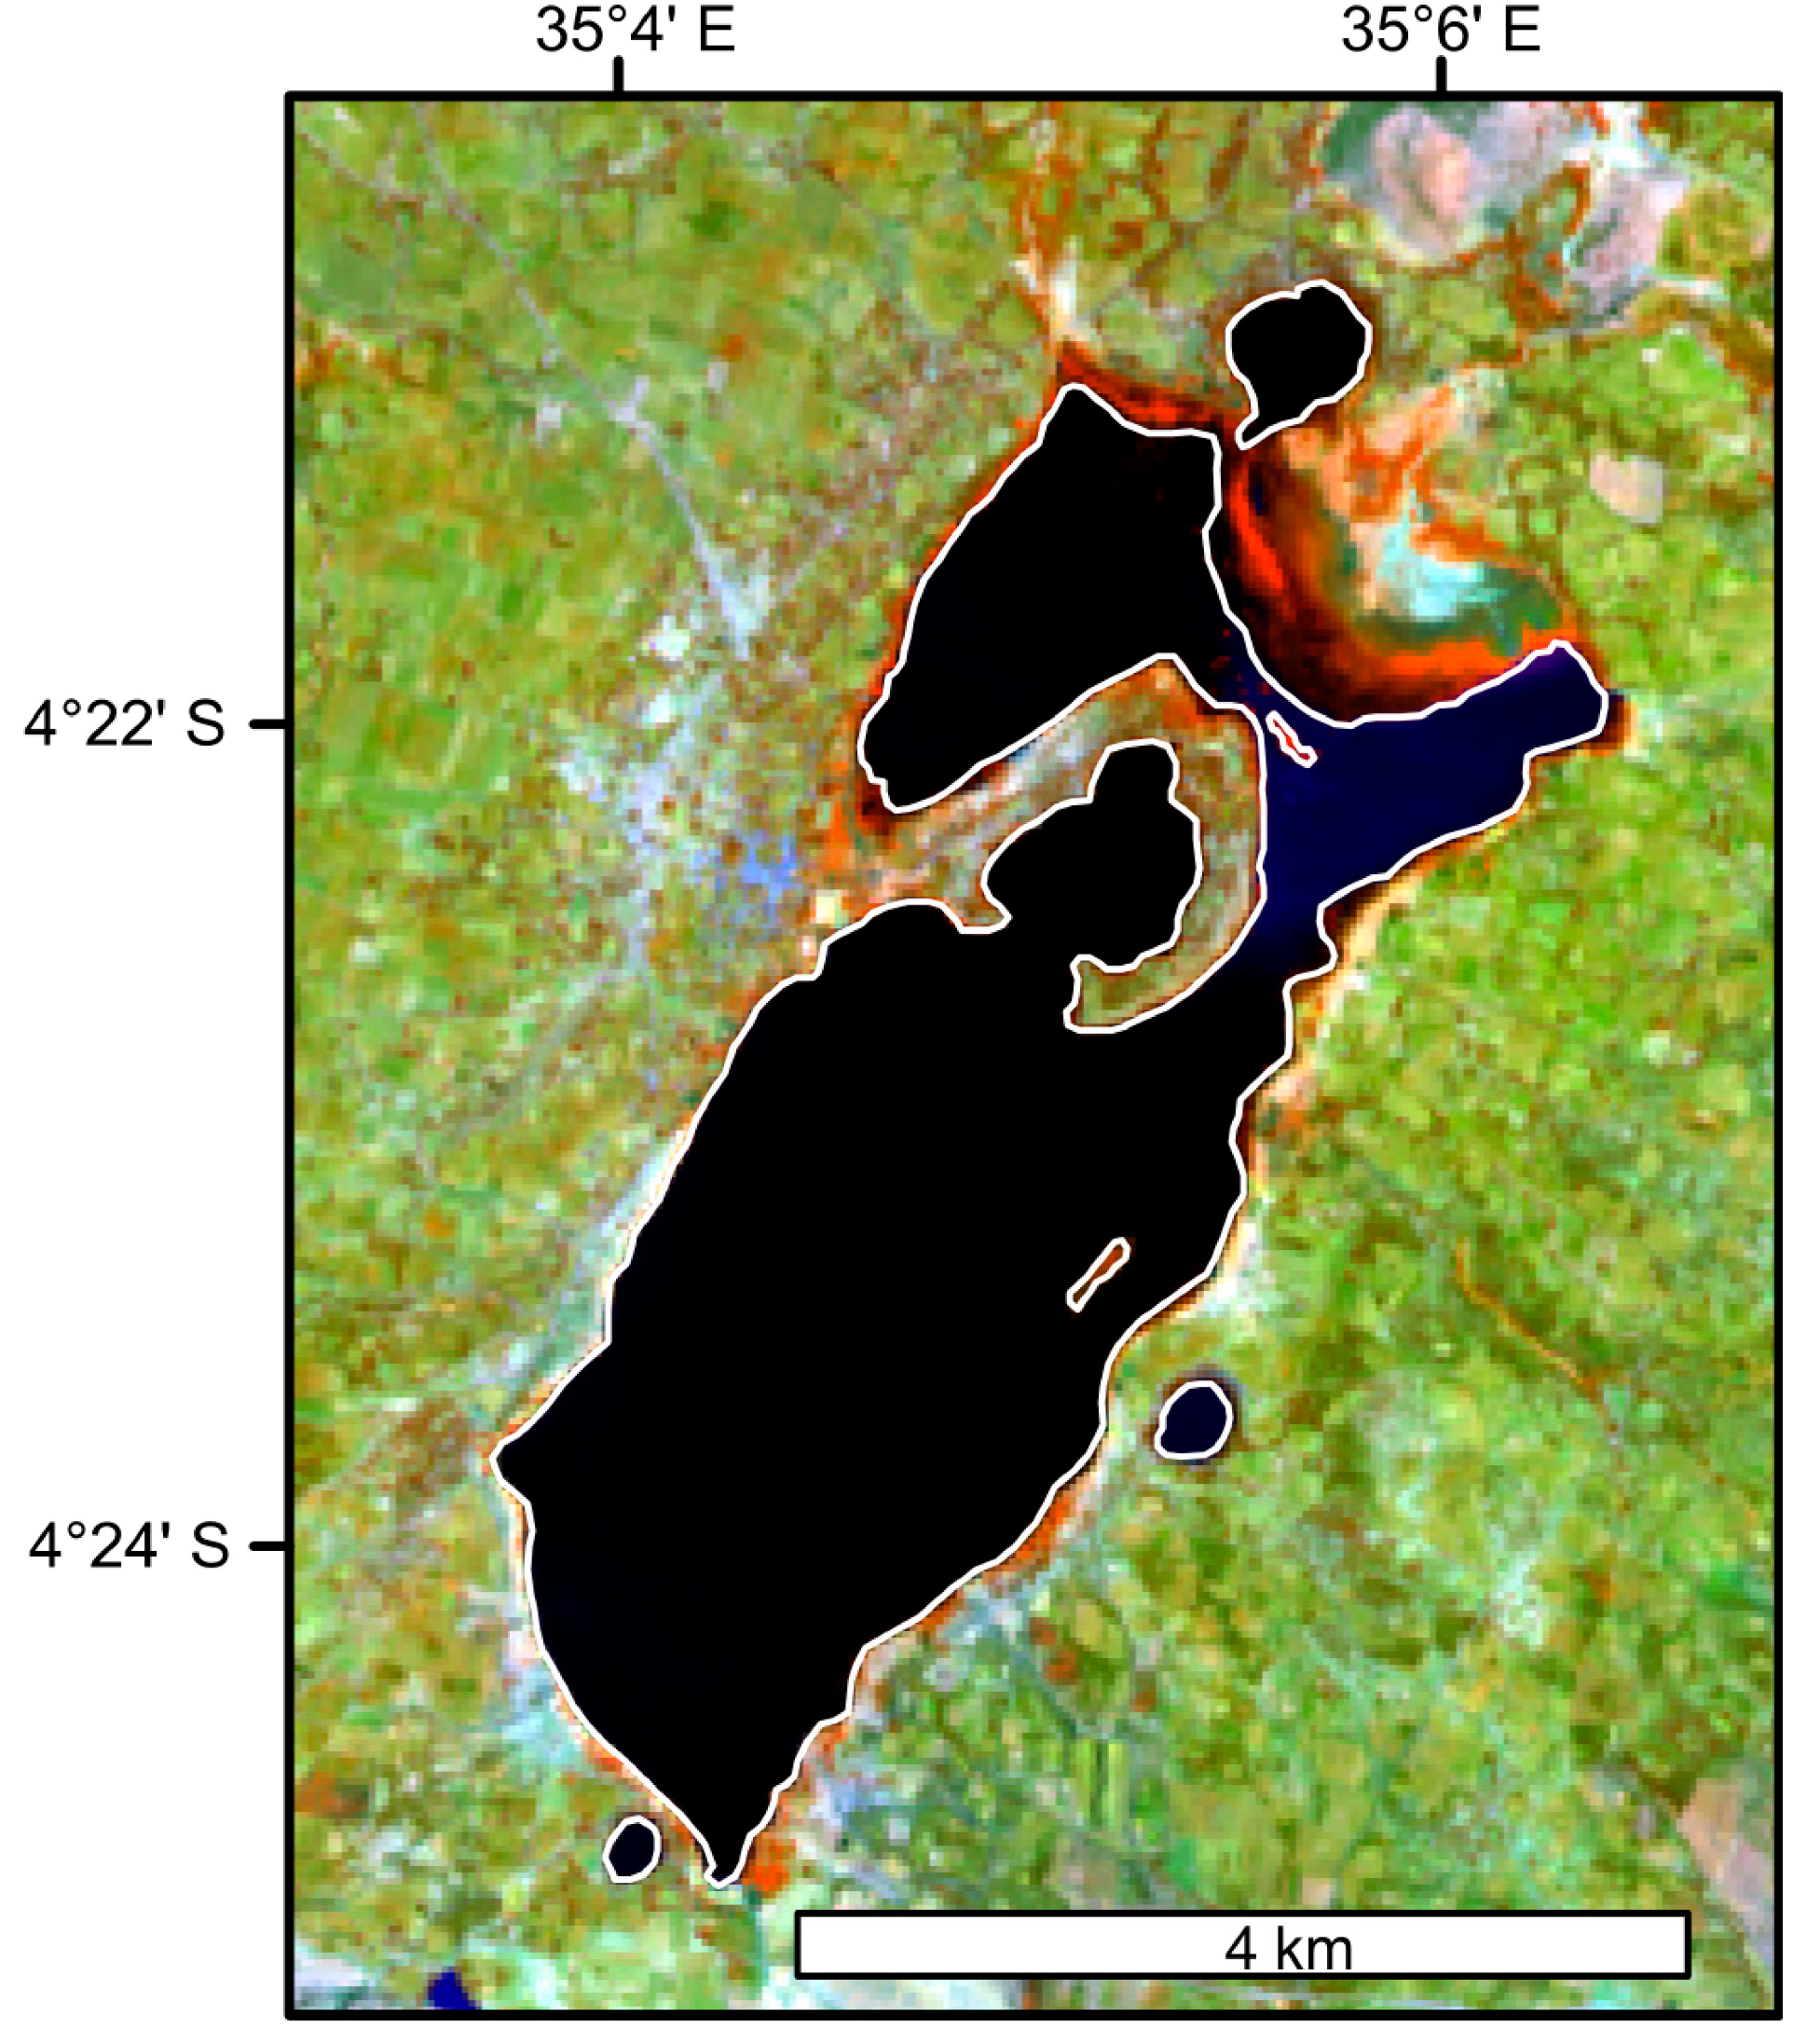
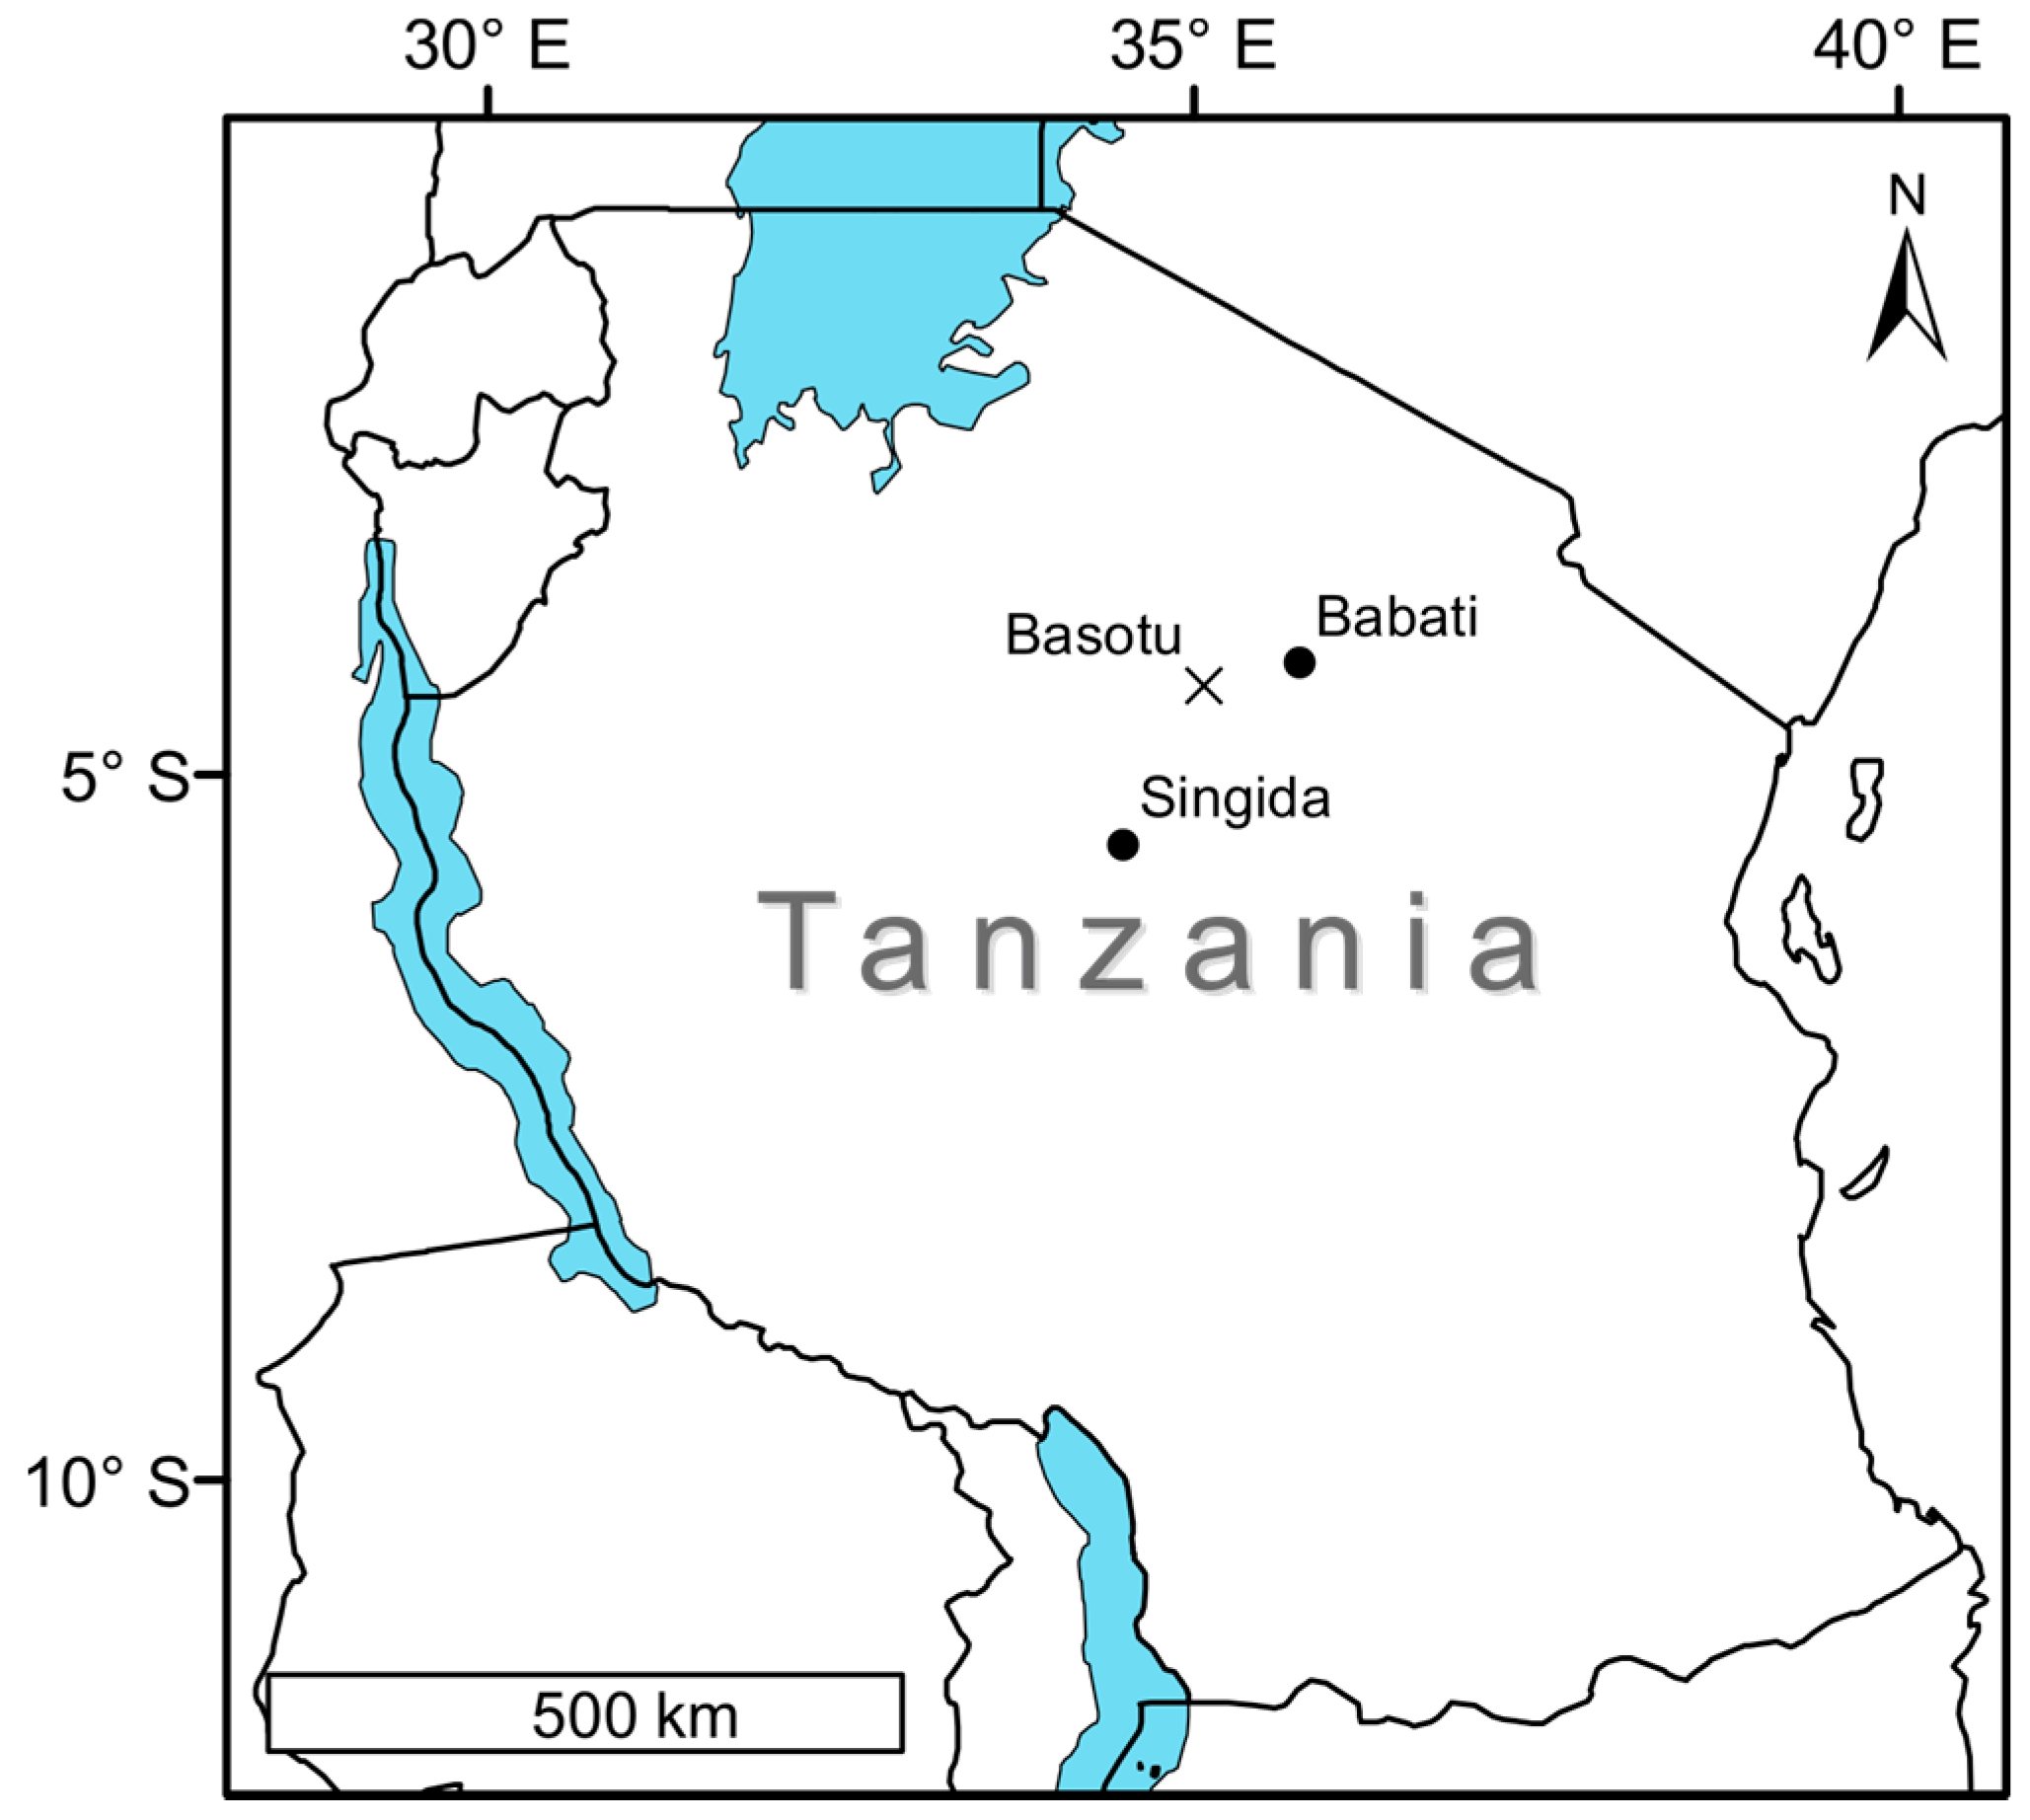
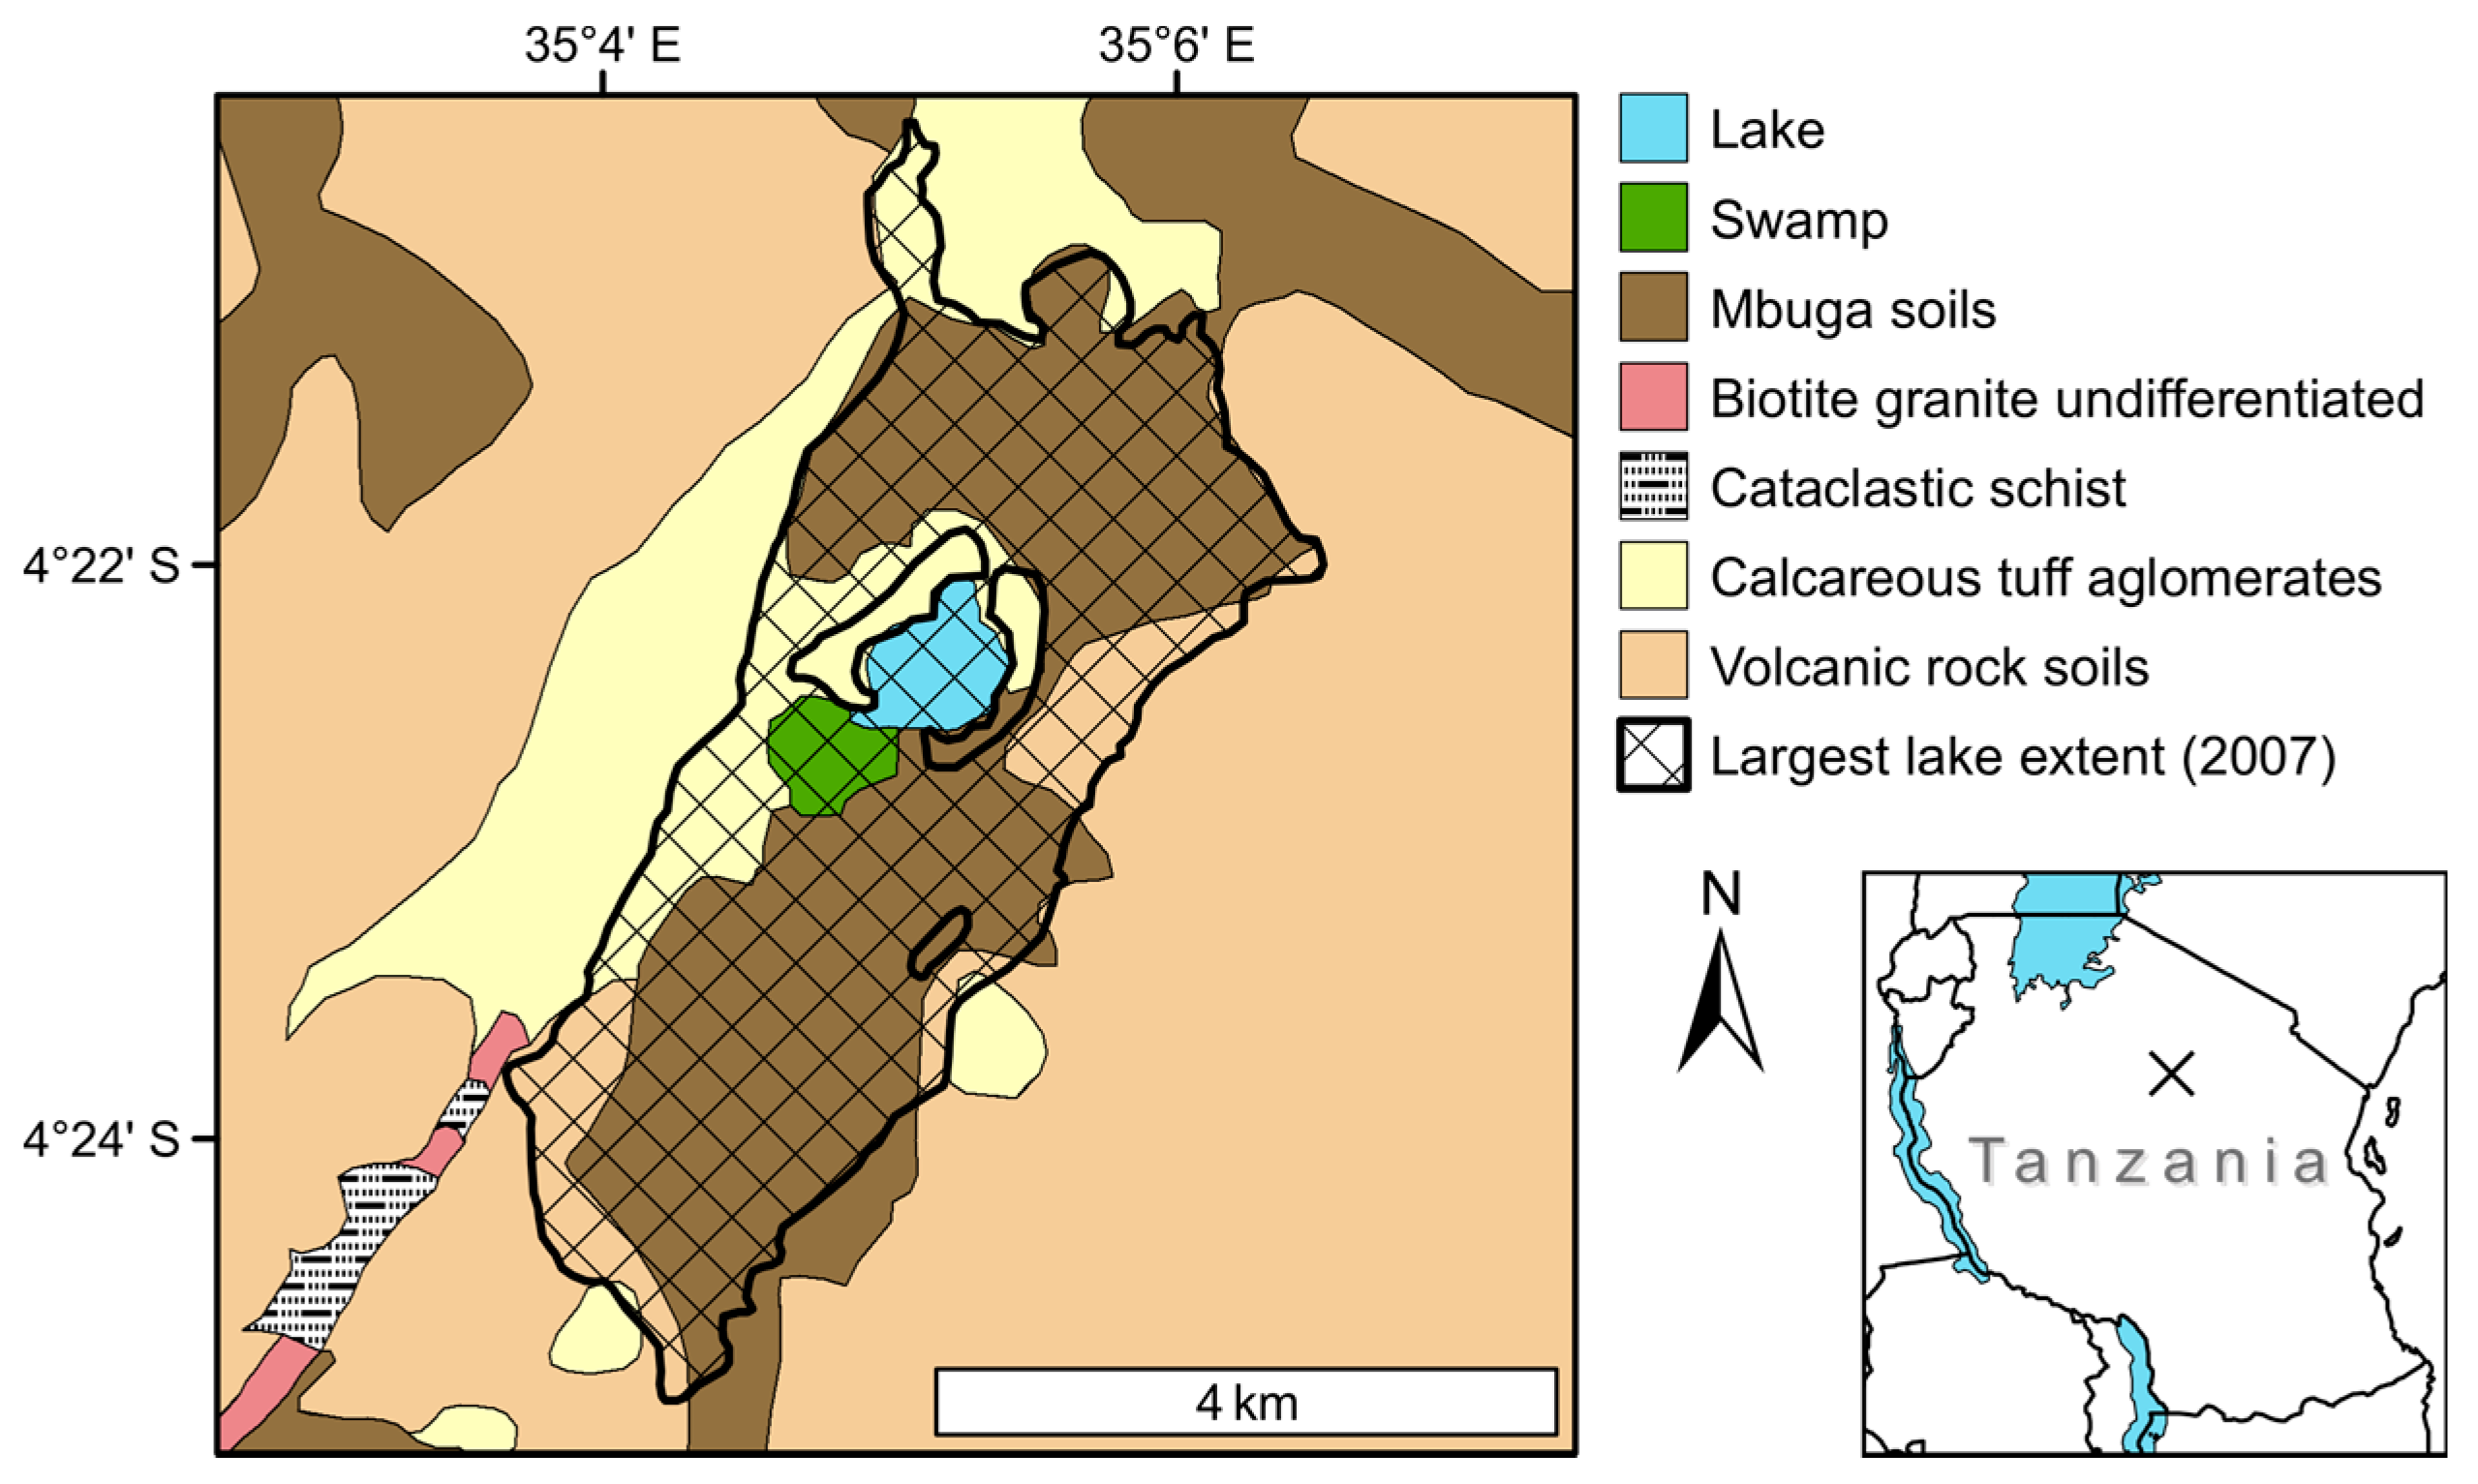
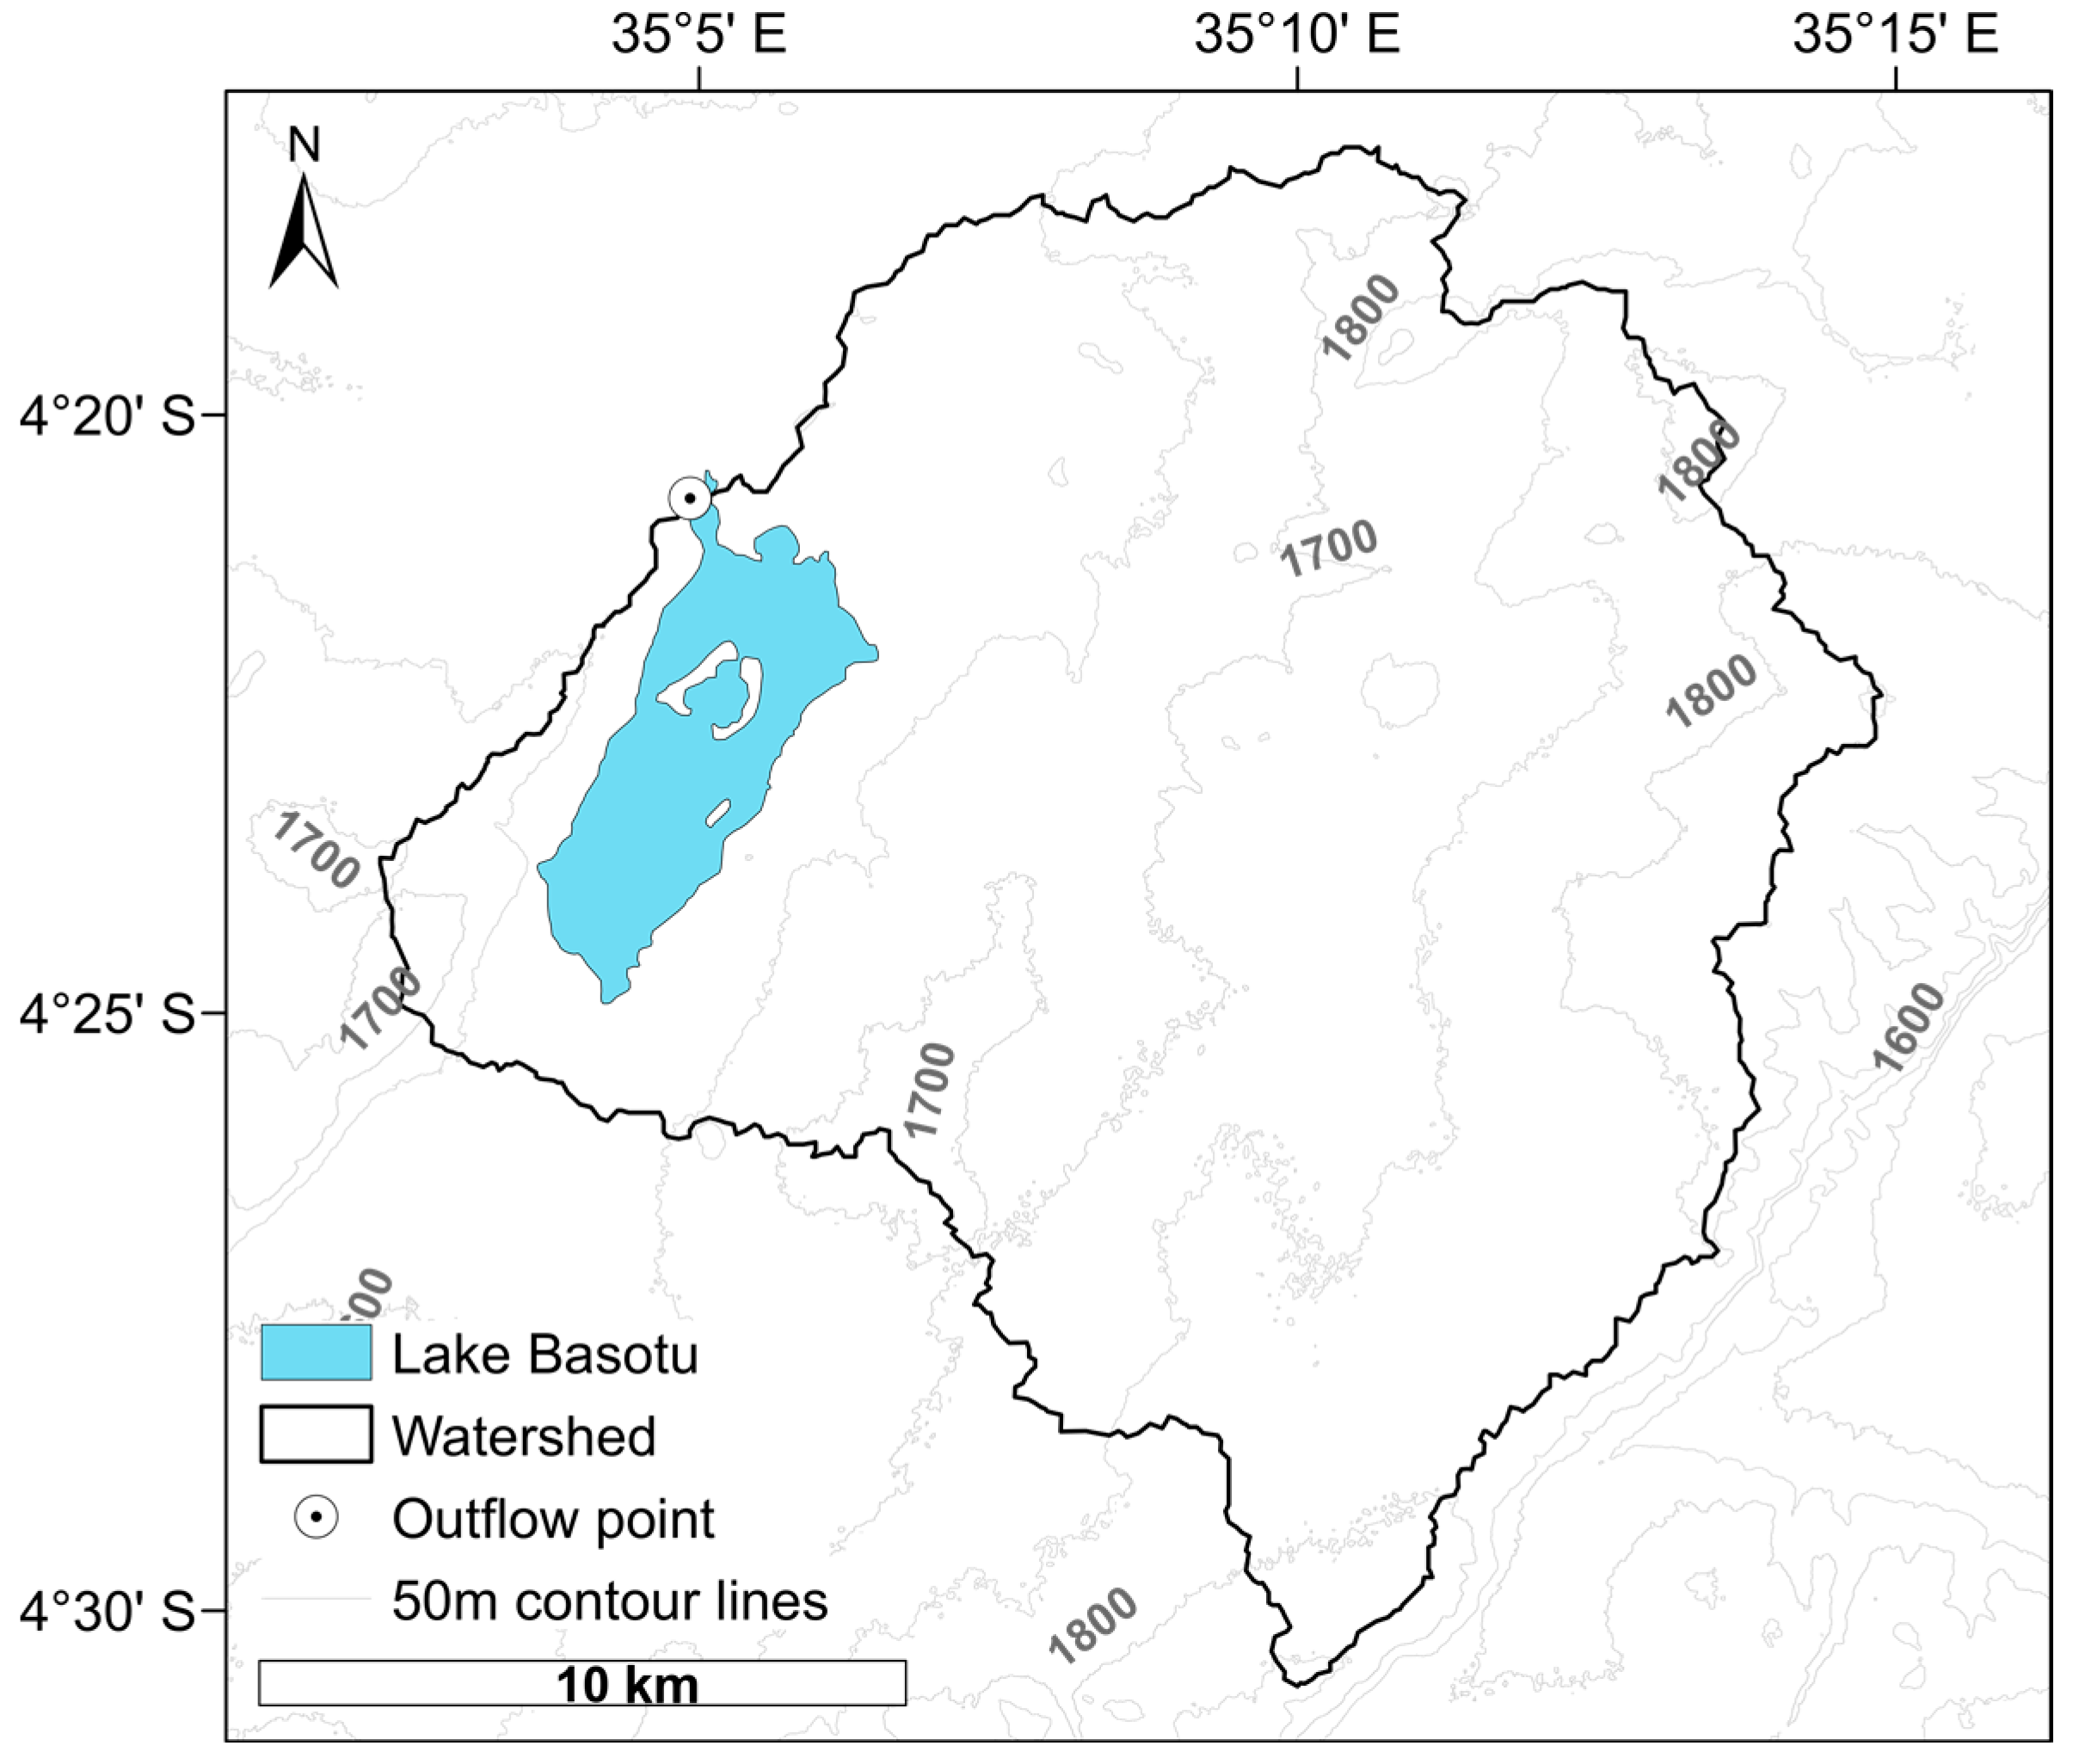
2.1. Study Location

The Basotu plains of the Hanang district contain 13 shallow maar lakes that act as the primary freshwater source for local people, as there are no perennial rivers. The area directly surrounding Lake Basotu (4°22′11′′ S, 35°4′22′′ E) is comprised of mainly acacia savanna, with soils derived from volcanic rocks and calcareous tuffs (Figure 1). Precipitation in this area is driven by the movement of the ITCZ, and results in two rainy seasons. The primary rains come from March to June, centered on April–May, with a secondary season from September to December, centered on October–November.
Lake Basotu and its surrounding land have been at the center of conflict since the 1960s, when local pastoralists, the Barabaig, were displaced in order to implement mechanized wheat farming [17,18]. Since then, the lake has suffered from sediment input, drainage from irrigation, and eutrophication due to increasing nutrient loads [19]. As the lake continues to decrease in size, the concentration of pollutants will likely increase, which will also have implications for local fishing and the viability of this lake as a source of drinking water.

2.2. Methods

A geologic map compiled by the Survey Division of the Ministry of Lands, Settlement and Water Development of the Government of Tanzania (1963) was obtained from the Geological Survey of Sweden [20]. All available georeferenced Landsat images of the Basotu area captured during the long dry season as well as the one-second digital elevation model (DEM) by the Shuttle Radar Topography Mission (SRTM) were obtained from the United States Geological Survey (USGS) EarthExplorer via their bulk download service [21]. Landsat products are terrain-corrected using the Level 1 Product Generation System [22]. All scenes in this study were processed by Standard Terrain Correction (Level 1T), which is the highest level possible, and no additional co-registration was performed.
From the available Landsat images, 20 years of dry-season captures were suitable for analysis. A gap in coverage from 1974 to 1978 can be explained by a more conservative approach to image acquisition with the launch of Landsat-2, which was restricted to on-board data storage and primarily responsible for the years 1975 to 1977. A second gap in coverage occurred from 1980 to 1983. Landsat-3 (1978–1983) was prone to technical problems, and it was not until 1984 that acquisition rates were increased with the launch of Landsat-5 [23].
Due to the strong contrast between land and water reflectance in relatively shallow lakes, use of the Landsat satellite series in tracking extent changes is appropriate [24]. Dry season images were chosen to avoid atmospheric interference by cloud cover and to maximize the reflective differences between land and water. Maximum lake extent (5 April 2007) and seasonal in/outflows were determined from cloud-free rainy season images. Lake shorelines were digitized manually using false-color composites alternating between the near-infrared (NIR), shortwave-infrared (SWIR), and blue-light wavelengths of available Landsat images (Figure 2). The NIR bands were chosen to emphasize shorelines, while SWIR offered the potential to discriminate the moisture content of soil. In Landsat 1–3, where the SWIR and blue bands are not available, composites were alternated between the two NIR (land-water boundaries) and green (shallow water) bands.
The surface area of Lake Basotu was calculated by manually digitizing the lake extent from 20 years using ArcGIS 10.3.1® (Environmental Systems Research Institute, Inc., Redlands, CA, USA) (Table 1) [25]. Due to the unavailability of bathymetric information, calculations of lake volume were not possible. Manual digitization of satellite images is both subjective and time-consuming, and so applied to small study areas. The error from this method was found to be between ±1.5 m for distinct shorelines, and ±3.0 m for diffuse shorelines, when no binary encoding was used to facilitate land-water boundaries [26]. Values for uncertainty in manual delineation of shorelines were determined by an experiment of multiple operators with different levels of expertise. Levels of expertise were based on field and remote sensing experience related to the study area, and users were divided into groups as either having one or both. In this experiment, manual delineation was found to be more accurate than semi-automatic classification when data quality was poor or uncertain.
Another source of uncertainty may arise from intra-annual variability, as this study does not account for seasonality of the lake. In 2007, the year of greatest lake extent, the wet season lake extent was calculated to be 16.11 km2, which is roughly 14% more than the dry season value of 14.12 km2. The selection of dry season images offers continuity in analysis, and should provide a reliable assessment of inter-annual variability that is adequate for the scope of this investigation.
As separating shallow water from fen-like vegetation is the most challenging aspect of the manual classification, using false color composites is the most appropriate way possible to delineate these borders. Other sources of errors may stem from differences in resolution between Landsat 1–3 (79 m) and 4–8 (30 m) as well as the 2003 failure of the Scanning Line Corrector in Landsat 7, which resulted in coverage gaps [27].
The Lake Basotu watershed was delineated in ArcGIS 10.3.1® using the hydrology toolbox and the SRTM 30 m DEM [28]. The historical outflow point for the maximum lake extent was determined based on the flow paths derived from the DEM (Figure 3).
Discontinuous time series of precipitation, acquired from the Tanzanian Meteorological Agency, were available for two nearby stations, namely Babati and Singida agricultural stations (Figure 4). The two stations had coverage of 81% and 91%, respectively, for the period of 1970–2010. A distance-weighted average of both stations was used to estimate precipitation for this period. An additional station, Singida meteorological station, was also available for the period 2000–2015, with coverage of 93% for the period. Precipitation for the period 2010–2015 was estimated based on a linear regression between the distance-weighted average of Babati and Singida agricultural stations and the Singida meteorological station for 2000–2010 (r2 = 0.80).
Global Precipitation and Climatology Center v6 (GPCC) (The National Oceanic and Atmospheric Administration – Earth System Research Laboratory, Boulder, Colorado, USA) data were used to fill the missing data. GPCC was used since it had previously been shown to provide good precipitation estimates in Tanzania [29,30]. The GPCC data were downscaled using quantile mapping considering the scale of the catchment [31]. The downscaled data were then further corrected based on a linear regression between the distance-weighted gauge average and the downscaled GPCC data for the period 1970–2010 (r2 = 0.75).

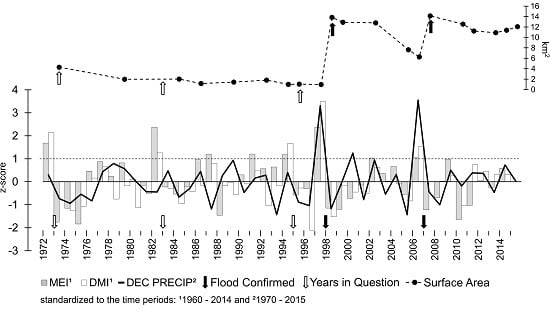
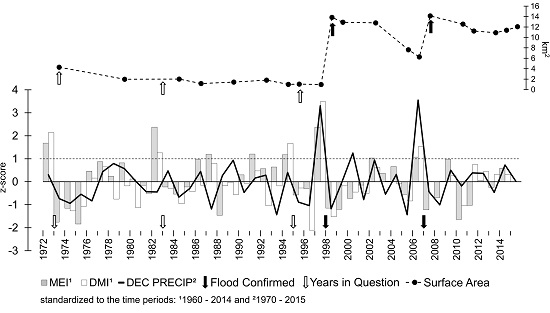
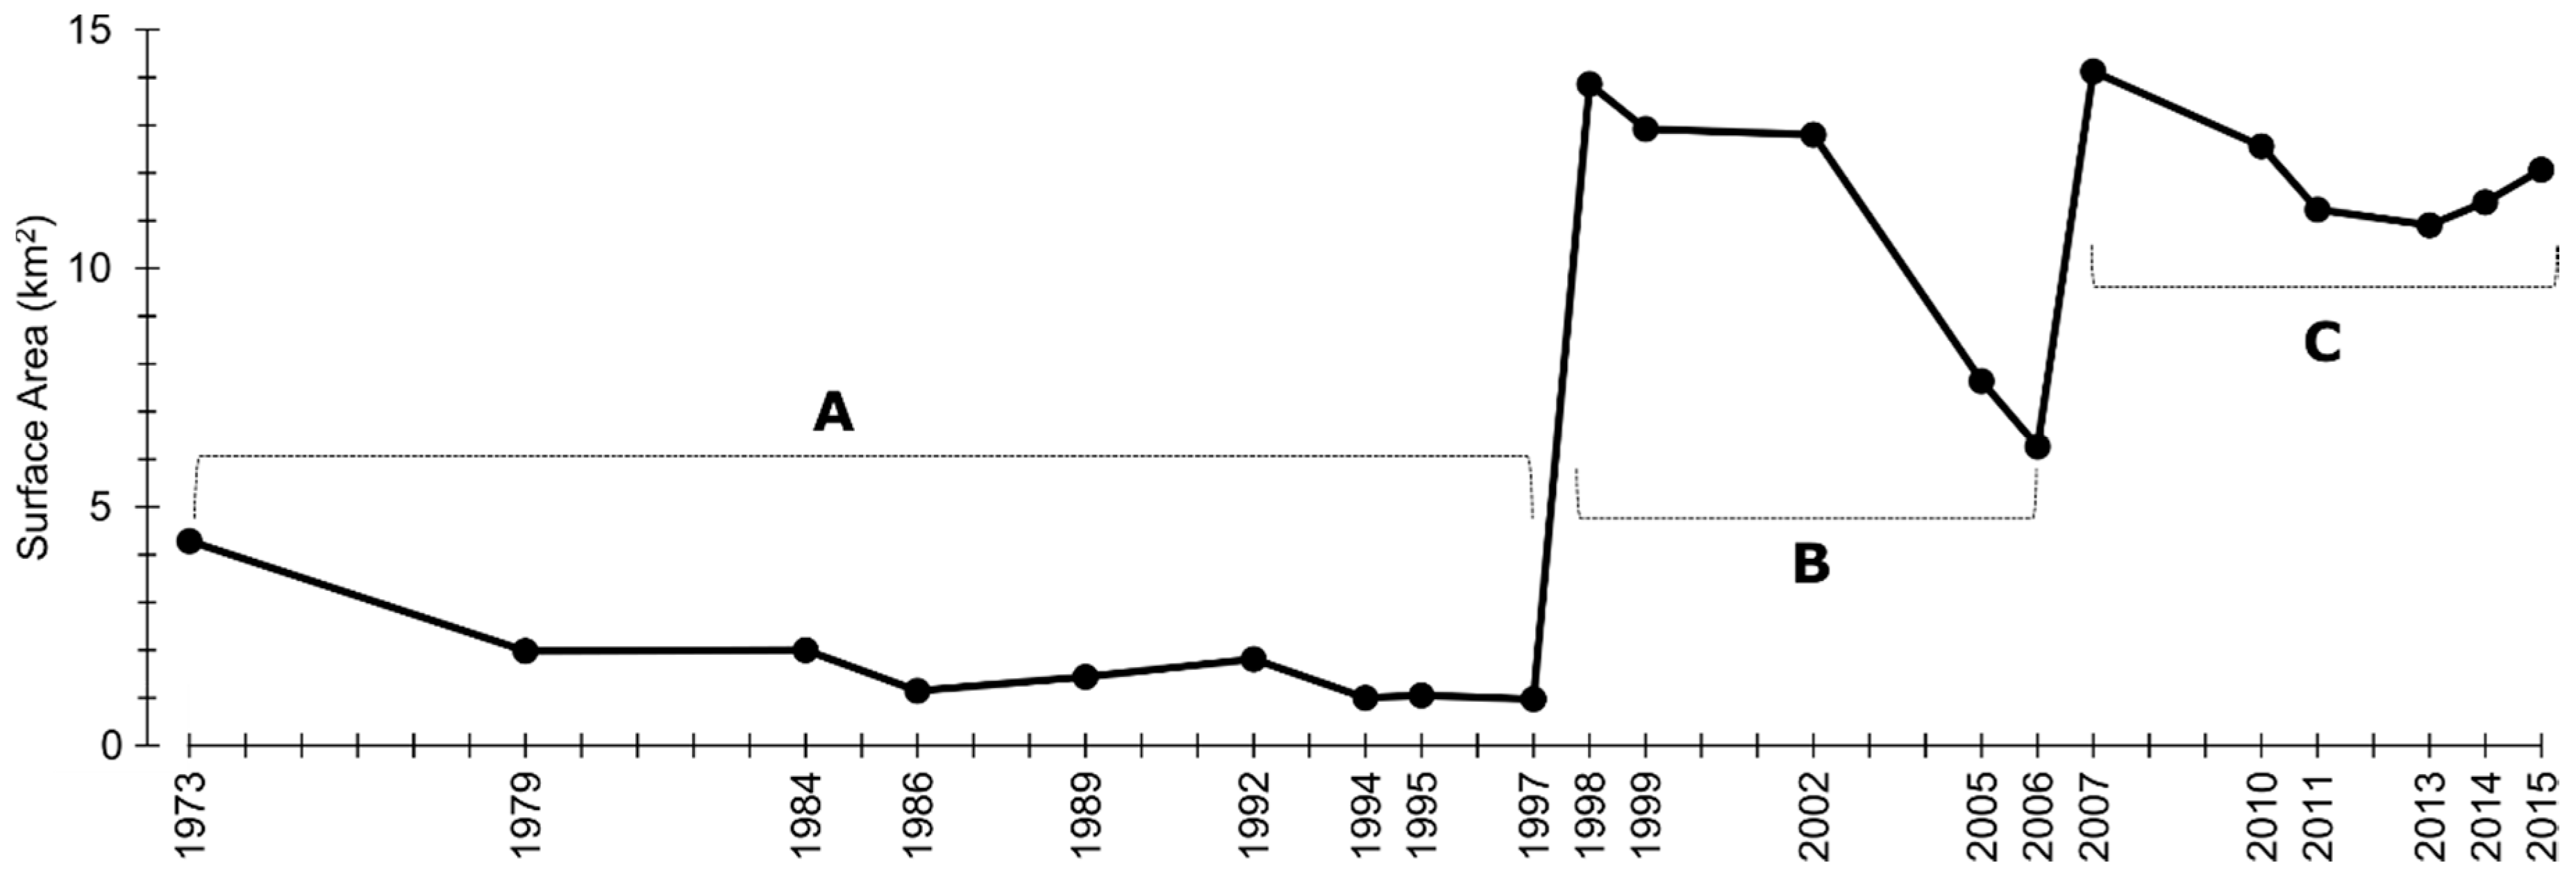
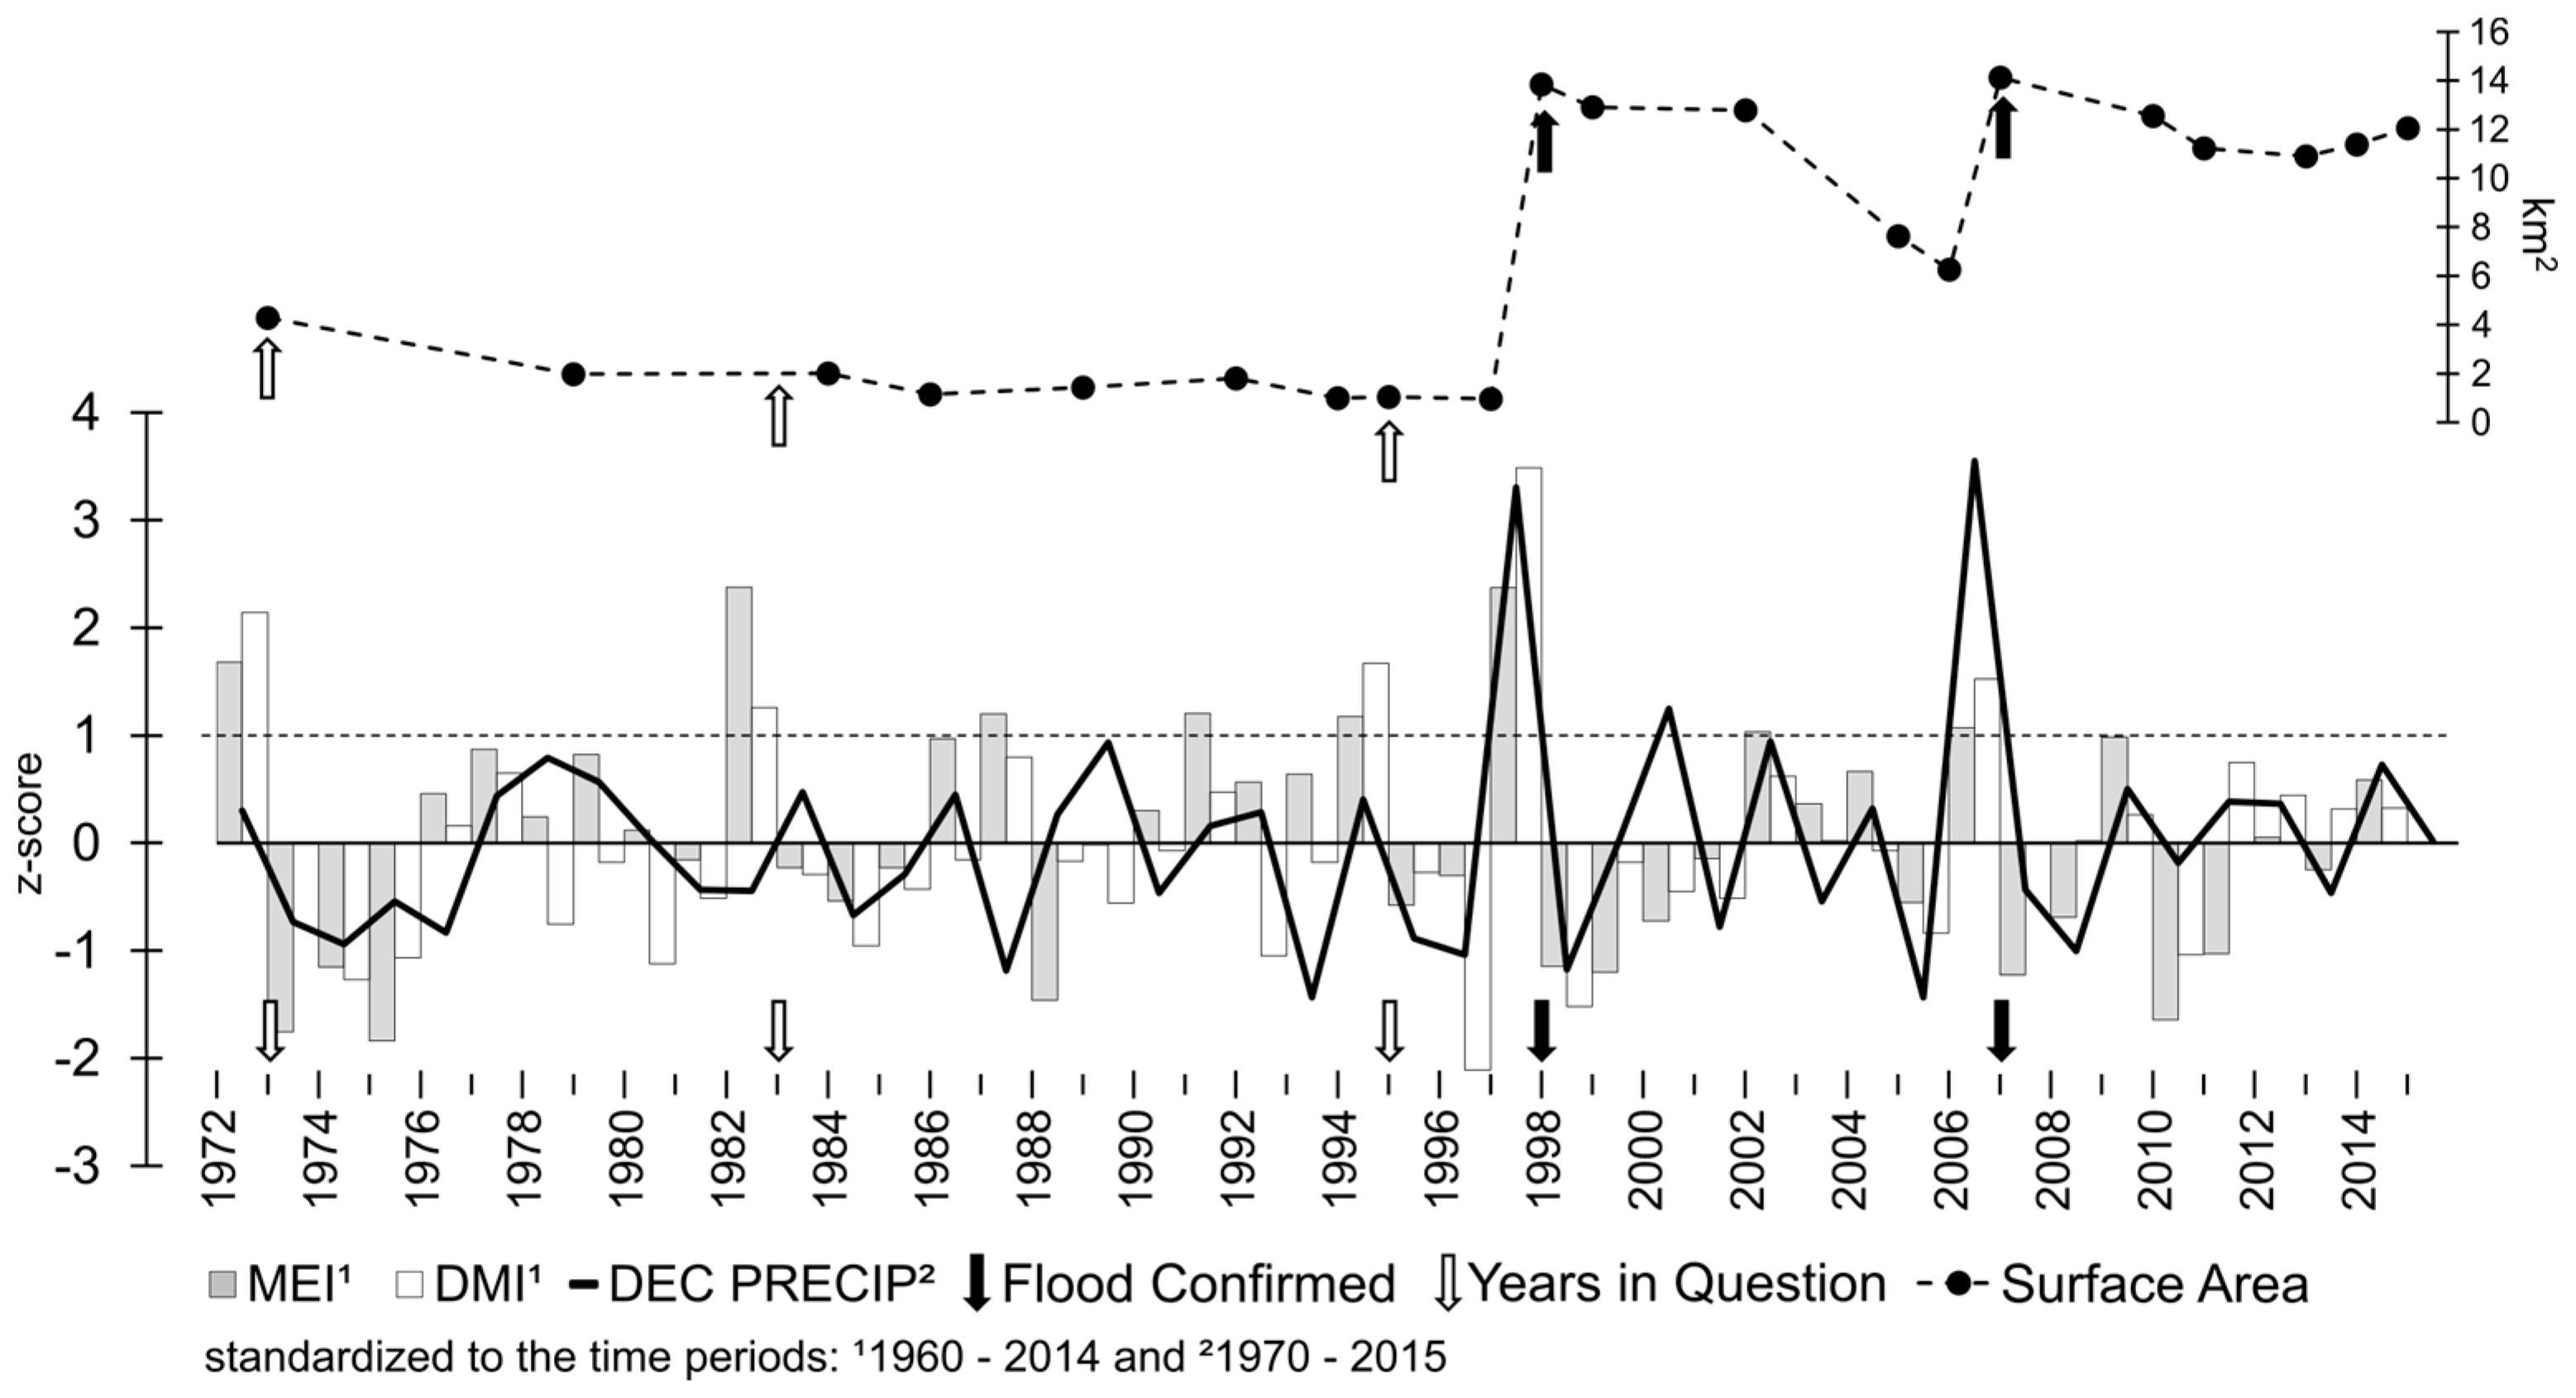
3. Results with Discussion

In maar lakes, sedimentation by diatreme and subsequent lacustrine material seal the explosion crater from its feeder vent [32,33]. The closed basin state of Lake Basotu was confirmed by testing of geochemical mechanisms and solute evolution pathways. For this reason, groundwater is not believed to be a current source of variability in lake size [32]. There have been three distinct periods of lake extent decline observed since 1973 (A–C in Figure 5). Between these are the major flood events of 1997–1998 and 2006–2007, which were observed in various locations across eastern Africa [10,34,35].
Period A, from 1973 to 1997 shows a general decreasing trend of ~0.11 km2/year. After the dramatic increase in lake size from 1997 (0.97 km2) to 1998 (13.86 km2), there was a more rapid decline of ~0.92 km2/year until the next flood event from 2006 to 2007. Since 2008, the general trend has been a reduction of ~0.32 km2/year; however, a slight increase has been noted since 2013. The surface area level towards the end of Part C may have been affected by local conflicts over irrigation leading to a stabilization of lake levels. In 2011, an organized protest of local women demanded government officials to end the large-scale drawing of lake water, which they depend on for their daily water supplies [36].
The DMI and Multivariate El Niño-Southern Oscillation Index (MEI) from October to December (OND) were averaged and standardized for the period 1960–2014 in order to search for similar patterns when flood events would be expected to occur (Figure 6). As both indices for 1997 and 2006 are above z-scores of +1, this was chosen as the base level for flood events. Based on this, flooding would have been expected in the 1972–1973, 1982–1983, and 1994–1995 seasons. Although there are no satellite images from 1980 to 1983, it is unlikely that a large flood event would have occurred due to the similarly low values in 1979 and 1984. Of all monthly precipitation values, the indices for OND, DMI, and MEI were found to be most significantly correlated to December precipitation during the time period of 1970 to 2014 (MEI: r(43) = 0.425, p = 0.004: DMI: r(43) = 0.561, p = 0.000). To facilitate comparison, precipitation values were standardized to the period of 1970–2015. For both 1997 and 2006, above average precipitation is observed in conjunction with the suggested base level for flooding (+1 STD, DMI, and MEI).
To improve flood prediction in East Africa, it would be helpful to understand the driving mechanisms behind enhanced precipitation events. The co-occurrence of El Niño and a positive IOD alone is not enough to accurately predict flood-level precipitation evident in the 1982–1983 and 1994–1995 seasons, when enhanced precipitation was not observed in the reanalysis data.
The mechanized wheat farming program, developed in response to declining food security, was a cooperation between the Tanzanian Government and the Canadian International Development Agency, and was primarily based in the district surrounding Lake Basotu [36]. Between 1973 and 1997, there was a negative correlation (r(23) = −0.902, p = 0.000) between the calculated surface area of Lake Basotu and the number of hectares (ha) seeded in the Hanang Wheat Complex (Figure 7). The values for the seeded area were based on statistics reported by Folster [37]. The measurements for 1998 were excluded due to the large flood event, which is considered to be an outlier. Missing values were calculated using linear interpolation before a Pearson correlation was performed. The negative correlation observed contradicts the wheat project being reported as exclusively rainfed [38]. Between 1973 and 1997, there is no significant relationship between lake surface area and precipitation. Correlations were calculated between surface area and precipitation totals for both the short wet season of the previous year (November–December) (r(25) = 0.129, p = 0.540) and the sum of the months preceding the dry season of the same year (January–May) (r(25) = -0.316, p = 0.124). Additional information is needed to determine if and how this agricultural program affected the decline in lake extent.
Increased soil erosion and sediment transport can be assumed to have occurred during the time period of intensive wheat farming in the area around Lake Basotu, causing further infilling of the lake basin. Financial support for the Canadian-Tanzanian wheat program officially ended in 1993, but wheat farming continued until 1998. Flood events since 1996 may be due to filling of vertisol cracks by agricultural runoff, bringing erosional material into the lake basin and preventing infiltration of water into the already dense soil. This process should be visible in Landsat satellite images by the formation of gilgai, which are alternating micro-depressions and micro-mounds common to vertisols [39]. With an altitudinal difference of <1 m, these features would not be captured by the available DEM. If the distance between the gilgai features were at a range that would be visually distinguishable in Landsat images, the presence of swamp conditions in the basin prevents this observation.
Using Landsat images, the area of cultivation within the Basotu watershed was determined and digitized manually. The percentage of this watershed dedicated to agriculture increased from approximately 23% in 1973 to 43% in 1997 (Figure 8).

4. Conclusions

According to the evidence presented, it is concluded that fluctuations in Lake Basotu appear to be tied to both climatological factors and anthropogenic influences resulting from agricultural practices. In order to use the flooding of Lake Basotu as an indicator of weather patterns with the potential for large flood events, it would be beneficial to understand the reasons behind non-flooding years in the past. Flood events occurring after 1996 may be an effect of increased sedimentation within the lake basin from the mechanized wheat farming program implemented in the Hanang district. This is feasible, as the local news has stated the lake is “overwhelmed with sediments” [40].
There is high confidence that the strongest ocean warming due to climate change will be experienced in the tropics, and it is “very likely” that this will increase the intensity of El Niño events [7] (p. 60). As Lake Basotu is an important freshwater resource, further investigation into past lake fluctuations is required to determine if these modern fluctuations are beyond the scope of normal environmental variability.

Supplementary Materials

The following are available online at www.mdpi.com/2076-3263/6/2/27/s1, Figure S1: Map of Lake Basotu surroundings (adapted from a 1963 topographic map published by the Survey Division of the Ministry of Lands, Settlement and Water Development of the Government of Tanzania), Figure S2: False-color composite Landsat image (July 2015) of Lake Basotu with manual shore delineation shown in white, Figure S3: Lake Basotu watershed (with elevational contours in m a.s.l.), Figure S4: Tanzanian Meteorological Agency station locations, Figure S5: Calculated lake surface area record for Lake Basotu, Figure S6: Lower graph: Standardized indices for El Niño and the Indian Ocean Dipole and regional precipitation records. Upper graph: Lake surface area, Figure S7: Area of wheat seeded (thousands of ha) in the Hanang district versus Lake Basotu surface area calculations (km2), Figure S8: Agricultural area within the Basotu watershed.

Acknowledgments

The authors acknowledge financial support from the Swedish International Development Agency (SIDA) and The Bolin Centre for Climate Research. Additional thanks are given to Qiong Zang for her help in calculating the DMI dataset and Ian Brown for GIS support.

Author Contributions

L.H. conceived this project, designed the methodology, and performed all analyses. A.J.K. contributed data. L-O.W. and J.R. contributed to the interpretation of data analysis. L.H. wrote the paper, aside from description of data contribution from A.J.K.

Conflicts of Interest

The authors declare no conflict of interest.

Abbreviations

The following abbreviations are used in this manuscript:
IODIndian Ocean Dipole
ITCZIntertropical Convergence Zone
SSTSea Surface Temperature
DMIDipole Mode Index
DEMDigital Elevation Model
SRTMShuttle Radar Topography
USGSUnited States Geologic Survey
NIRNear Infrared
SWIRShortwave Infrared
GPCCGlobal Precipitation and Climatology Center v6
MEIMultivariate El Niño-Southern Oscillation Index
ONDOctober, November, December
STDStandard Deviation

References

  1. Generators’ Disturbing Lake Bassuto Gods and Spirits’. The Arusha Times. 30 July–5 August 2011. Available online: http://www.arushatimes.co.tz/2011/28/Local%20News_5.htm (accessed on 7 April 2016).
  2. RC Mbwilo Wants Lasting Solution for Lake Bassotu Crisis. The Arusha Times. 10–16 December 2011. Available online: http://www.arushatimes.co.tz/2011/45/Local%20News_7.html (accessed on 7 April 2016).
  3. District Authorities Fail to Protect Lake Bassotu. The Citizen Reporter. 9 February 2013. Available online: http://www.thecitizen.co.tz/News/District-authorities-fail-to-protect-Lake-Bassotu/-/1840392/1976394/-/2h8so2/-/index.html (accessed on 7 April 2016).
  4. The Overseas Development Institute. Tanzania National Climate Change Finance Analysis. 2014. Available online: http://www.odi.org/publications/7908-tanzania-national-climate-change-finance-analysis (accessed on 8 February 2016).
  5. FloodList. Tanzania—Floods in Dar es Salaam Leave 12 Dead. 13 May 2015. Available online: http://floodlist.com/africa/tanzania-floods-dar-es-salaam-may-2015 (accessed on 8 February 2016).
  6. FloodList. 38 Dead after Floods in Tanzania. 4 March 2015. Available online: http://floodlist.com/africa/38-dead-floods-tanzania-shinyanga (accessed on 8 February 2016).
  7. Intergovernmental Panel on Climate Change (IPCC). Climate Change 2014: Synthesis Report. Contribution of Working Groups I, II and III to the Fifth Assessment Report of the Intergovernmental Panel on Climate Change. Available online: http://ar5-syr.ipcc.ch/ipcc/ipcc/resources/pdf/IPCC_SynthesisReport.pdf (accessed on 8 February 2016).
  8. Brady, N.C.; Weil, R.R. The Nature and Properties of Soils, 13th ed.; Prentice Hall: Upper Saddle River, NJ, USA, 2008; pp. 100–103. [Google Scholar]
  9. Berry, L. Environmental Impact of Agricultural Development in Tanzania; Clark University: Worcester, MA, USA, 1975. [Google Scholar]
  10. Kijazi, A.L.; Reason, C.J.C. Analysis of the 2006 floods over northern Tanzania. Int. J. Climatol. 2009, 29, 955–970. [Google Scholar] [CrossRef]
  11. Food and Agriculture Organization of the United Nations. Special Report: Heavy Rains Attributed to El Niño Cause Extensive Crop Damage in Parts of Eastern Africa. 1998. Available online: http://www.fao.org/docrep/004/w7832e/w7832e00.HTM (accessed on 10 August 2015).
  12. Trenberth, K.E. The definition of El Niño. Bull. Am. Meteorol. Soc. 1997, 78, 2771–2777. [Google Scholar] [CrossRef]
  13. Ropelewski, C.F.; Halpert, M.S. Global and regional scale precipitation patterns associated with the El Niño/Southern Oscillation. Mon. Weather Rev. 1987, 115, 985–996. [Google Scholar] [CrossRef]
  14. Anyamba, A.; Tucker, C.J.; Eastman, J.R. NDVI anomaly patterns over Africa during the 1997/98 ENSO warm event. Int. J. Remote Sens. 2001, 22, 1847–1859. [Google Scholar]
  15. Saji, N.H.; Goswami, B.N.; Vinayachandran, P.N.; Yamagata, T. A dipole mode in the tropical Indian Ocean. Nature 1999, 401, 360–363. [Google Scholar] [CrossRef] [PubMed]
  16. Rayner, N.A.; Parker, D.E.; Horton, E.B.; Folland, C.K.; Alexander, L.V.; Rowell, D.P.; Kenty, E.C.; Kaplan, A. Global analyses of sea surface temperature, sea ice, and night marine air temperature since the late nineteenth century. J. Geophys. Res. 2003, 108. [Google Scholar] [CrossRef] [Green Version]
  17. Mvungi, S.E. Study on Options for Pastoralists to Secure Their Livelihoods: Experiences in the Defense of Pastoralists Resource Rights in Tanzania: Lessons and Prospects. 2007. Available online: http://www.tnrf.org/files/E-INFO-RLTF_VOL2-PART4_Mvungi-S_2008_Experiences_in_the_defence_of_pastoralist_rights_PART-B.pdf (accessed on 8 February 2016).
  18. Legal and Human Rights Centre. Human Rights and Business Report in Tanzania—2013. 2014. Available online: http://www.humanrights.or.tz/downloads/LHRC%20Business%20Rep%202013.pdf (accessed on 8 February 2016).
  19. Anonymous. Sediment Based Paleoenvironmental Variations of Lake Basotu, Tanzania. Manuscript in Preparation.
  20. Survey Division of the Ministry of Lands, Settlement and Water Development. Geological Map. Tanzania Quarter Degree Sheet 84 [map]; Hanang. Scale: 1:125,000; Government of Tanzania: Dodoma, Tanzania, 1966.
  21. United States Geological Survey. EarthExplorer. Available online: http://earthexplorer.usgs.gov/ (accessed on 26 April 2016).
  22. United States Geological Survey. Landsat Processing Details. 2016. Available online: http://landsat.usgs.gov/Landsat_Processing_Details.php (accessed on 26 March 2016). [Google Scholar]
  23. Goward, S.; Arvidson, T.; Williams, D. Historical record of landsat global coverage. Photogramm. Eng. Remote Sens. 2006, 72, 1155. [Google Scholar] [CrossRef]
  24. Ballatore, T.J.; Bradt, S.R.; Olaka, L.; Cózar, A.; Loiselle, S.A. Chapter 20: Remote Sensing of African Lakes: A Review. In Remote Sensing of the African Seas; Springer Netherlands: Dordrecht, The Netherlands, 2014; pp. 403–422. [Google Scholar]
  25. Environmental Systems Resource Institute (ESRI). ArcMap 10.3.1; ESRI: Redlands, CA, USA, 2015. [Google Scholar]
  26. Sannel, A.B.K.; Brown, I.A. High-resolution remote sensing identification of thermokarst lake dynamics in a subarctic peat plateau complex. Can. J. Remote Sens. 2010, 36, S26–S40. [Google Scholar] [CrossRef]
  27. Markham, B.L.; Storey, J.C.; Williams, D.L.; Irons, J.R. Landsat sensor performance: History and current status. IEEE Trans. Geosci. Remote Sens. 2004, 42, 2691–2694. [Google Scholar] [CrossRef]
  28. United States Geological Survey (USGS). Shuttle Radar Topography Mission, 1 Arc-Second Global scenes SRTM1S04E033V3, SRTM1S04E034V3, SRTM1S04E035V3, SRTM1S04E036V3, SRTM1S05E033V3, SRTM1S05E034V3, SRTM1S05E035V3, SRTM1S05E036V3, SRTM1S06E033V3, SRTM1S06E034V3, SRTM1S06E035V3, & SRTM1S06E036V3, Global Land Cover Facility; University of Maryland: College Park, MD, USA, 2000.
  29. Becker, A.; Finger, P.; Meyer-Christoffer, A.; Rudolf, B.; Schamm, K.; Schneider, U.; Ziese, M. A description of the global land-surface precipitation data products of the global precipitation climatology centre with sample applications including centennial (trend) analysis from 1901–present. Earth Syst. Sci. Data 2013, 5, 71–99. [Google Scholar] [CrossRef]
  30. Koutsouris, A.J.; Chen, D.; Lyon, S.W. Comparing global precipitation data sets in eastern Africa: A case study of Kilombero Valley, Tanzania. Int. J. Climatol. 2015, 36, 2000–2014. [Google Scholar] [CrossRef]
  31. Themeßl, J.M.; Gobiet, A.; Leuprecht, A. Empirical-statistical downscaling and error correction of daily precipitation from regional climate models. Int. J. Climatol. 2010, 31, 1530–1544. [Google Scholar] [CrossRef]
  32. Kilham, P.; Cloke, P.L. The evolution of saline lake waters: Gradual and rapid biogeochemical pathways in the Basotu Lake District, Tanzania. Hydrobiologia 1990, 197, 35–50. [Google Scholar] [CrossRef]
  33. White, J.D.L.; Ross, P.S. Maar-diatreme volcanoes: A review. J. Volcanol. Geotherm. Res. 2011, 201, 1–29. [Google Scholar] [CrossRef]
  34. Conway, D. Extreme rainfall events and lake level changes in East Africa: recent events and historical precedents. In The East African Great Lakes: Limnology, Palaeolimnology and Biodiversity; Springer Netherlands: Dordrecht, The Netherlands, 2002; pp. 63–92. [Google Scholar]
  35. Conway, D.; Allison, E.; Felstead, R.; Goulden, M. Rainfall variability in East Africa: Implications for natural resources management and livelihoods. Philos. Trans. A Math. Phys. Eng. Sci. 2005, 363, 49–54. [Google Scholar] [CrossRef] [PubMed]
  36. The Arusha Times. Local Conflicts Fueled by Politicians—Claim. 13–19 August 2011. Available online: http://www.arushatimes.co.tz/2011/30/Local%20News_4.htm (accessed on 8 February 2016).
  37. Folster, N. Systemic Constraints on Aid Policy and Aid Outcomes: The History of Canadian Official Development Assistance to Tanzania. Ph.D. Thesis, London School of Economics and Political Science, London, UK, 2001. [Google Scholar]
  38. Antapa, P.L. An analysis of research required to address constraints to rainfed, large-scale, mechanized wheat production in Northern Tanzania. In Proceedings of the 1994 Regional Travelling Workshop on Long-Term Wheat-Based Sustainability Trials in East Africa, Addis Ababa, Ethiopia, 7–18 February 1994; pp. 47–61.
  39. Florinsky, I.G.; Arlashina, H.A. Quantitative topographic analysis of gilgai soil morphology. Geoderma 1998, 82, 359–380. [Google Scholar] [CrossRef]
  40. Human activities threaten Lake Bassotu. PESA Times. 30 July 2013. Available online: http://pesatimes.co.tz/news/environment/human-activities-threaten-lake-bassotu/ (accessed on 7 April 2016).
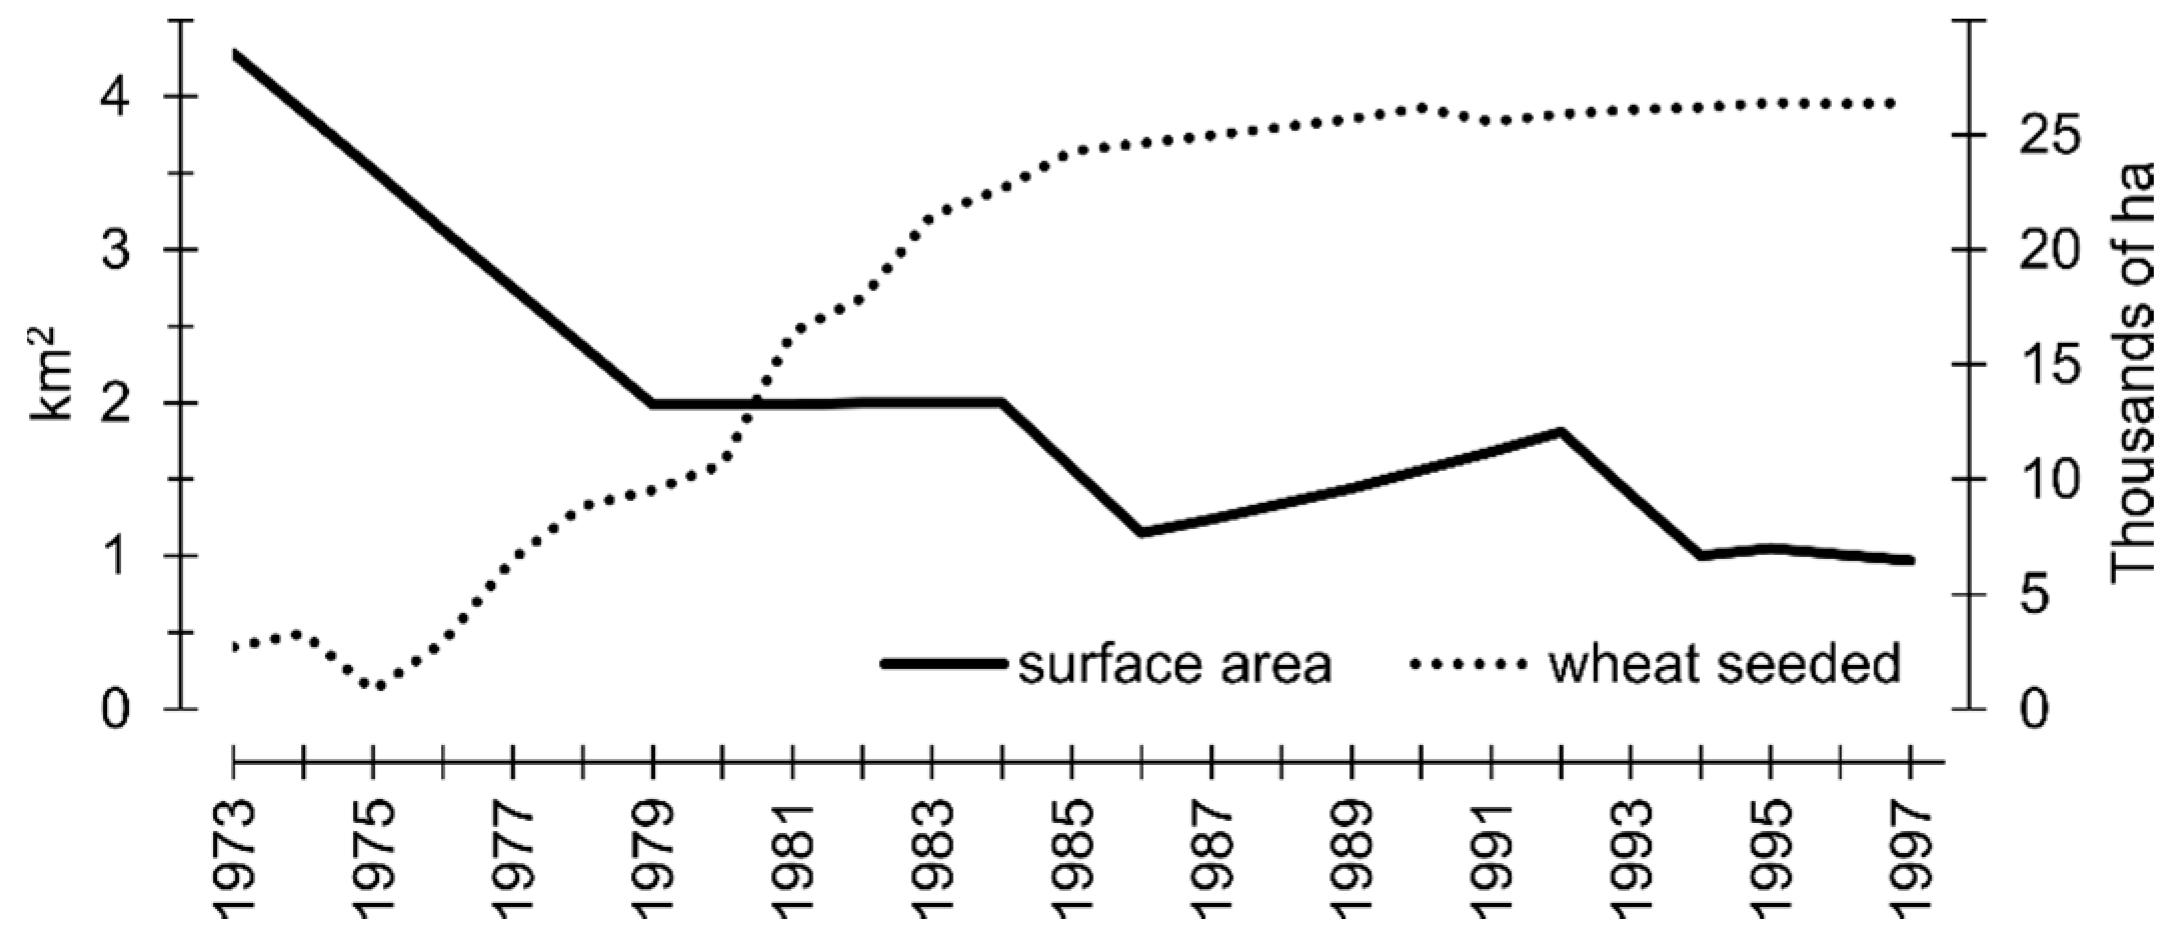
Figure 1. Map of Lake Basotu surroundings (adapted from a 1963 topographic map published by the Survey Division of the Ministry of Lands, Settlement and Water Development of the Government of Tanzania [20]).
Geosciences 06 00027 g001
Figure 2. False-color composite Landsat image (July 2015) of Lake Basotu with manual shore delineation shown in white.
Geosciences 06 00027 g002
Figure 3. Lake Basotu watershed (with elevational contours in m a.s.l.).
Geosciences 06 00027 g003
Figure 4. Tanzanian Meteorological Agency station locations.
Geosciences 06 00027 g004
Figure 5. Calculated lake surface area record for Lake Basotu.
Geosciences 06 00027 g005
Figure 6. (Lower graph): Standardized indices for El Niño and the Indian Ocean Dipole and regional precipitation records. (Upper graph): Lake surface area.
Geosciences 06 00027 g006
Figure 7. Area of wheat seeded (thousands of ha) in the Hanang district versus Lake Basotu surface area calculations (km2).
Geosciences 06 00027 g007
Figure 8. Agricultural area within the Basotu watershed.
Geosciences 06 00027 g008
Table 1. Manually digitized lake extent of 20 years selected, 1973–2015 (based on [24]).
DateSurface Area (km2)DateSurface Area (km2)
22 September 19734.285 September 199912.92
29 June 19791.9915 October 200212.80
3 September 19842.007 October 20057.64
8 August 19861.1516 October 20066.27
17 September 19891.4429 October 200714.12
11 October 19921.815 October 201012.56
17 October 19941.0022 September 201111.23
30 June 19951.0521 October 201310.90
22 August 19970.9724 October 201411.38
26 September 199813.8623 July 201512.07

