
Integrating Expert Knowledge with Statistical Analysis for Landslide Susceptibility Assessment at Regional Scale


 ,
, 

Abstract
:
1. Introduction
2. Study Area
3. Materials and Methods
3.1. Landslide Inventory
3.2. Landslide-Influencing Factors
3.3. Methodology
- (a)
- Categorization of all landslide-influencing factors. In this step, the ‘‘Natural Breaks (Jenks)’’ categorization (five categories) was implemented for the “dynamic” factors (MAP and PGA), whereas for the other two factors with continuous values (elevation and slope angle) the categorization was executed in a manual way based on their presented values. ‘‘Natural Breaks (Jenks)’’ method is a data classification method that minimizes variance within groups of data and maximizes variance between groups of data [83]. For land cover, lithology, and aspect, all the categories of the nominal scale were preserved.
- (b)
- Calculation of LSI for all factor categories (Table 1) based on Equation (1) [26]:with Ni, j the number of landslides in category j of the factor i, Ai,j the area of this category, NT the total number of landslides and AT the total area under investigation. Thus, the calculation of the landslide density in each category and of the area for each category was implemented using GIS-based overlay functions.
- (c)
- The maximum value, the range and the standard deviation of LSI values for all factors were calculated in order to interpret the importance of each factor. The range is the difference between the maximum and minimum LSI values. The standard deviation measures the spread of the LSI values about the mean value.
- (d)
- Definition of linguistic variables and fuzzy numbers for LS categories in order to incorporate uncertainty in the analysis. All fuzzy numbers were expressed as (ak, bk, ck, dk). The definition of these fuzzy numbers is presented in [12].
- (e)
- Three independent experts, with scientific background in the fields of geosciences and engineering geology, and with experience and scientific knowledge of the study area, were invited to assign a linguistic importance weighting for every category of each factor. From these linguistic judgments we obtained the corresponding fuzzy numbers. Such judgments are inevitably subjective, but, by proposing several possible scenarios, followed by the systematic testing and elimination of options, as a result of additional investigation and discussion, it is possible to develop reliable estimates. Experimental evidence suggests that group judgments appear to be more accurate than judgments of a typical group member [84]. In this case, we considered a homogeneous group of experts with equal degree of importance for each one. Accordingly, the overall expert-based judgment is the mean value of the three judgment values. The sum of these numbers is still a fuzzy number. Thus, we proceeded to the computation of the aggregated fuzzy weights of individual categories (Table 1).
- (f)
- A fourth “statistical expert” judgment was added in the above list on the basis of the statistical analysis (Table 1). This statistical interpretation was based on the LSI values for each category according to the following rules:
- In a category with LSI value between –0.15 and 0.15, a “Moderate” susceptibility was assigned.
- Categories with negative (<–0.15) LSI values were defined as zones of “Very Low” or “Low” susceptibility according to their ascending order.
- Categories with positive (>0.15) LSI values were defined as zones of “Very High” or “High” susceptibility according to their descending order.
- In a factor with range between 1.00 and 1.50, a “Moderate” susceptibility was assigned.
- Factors with range <1 were characterized with “Very Low” or “Low” susceptibility according to their ascending order.
- Factors with range >1.50 were characterized with “Very High” or “High” susceptibility according to their descending order.
- (g)
- (h)
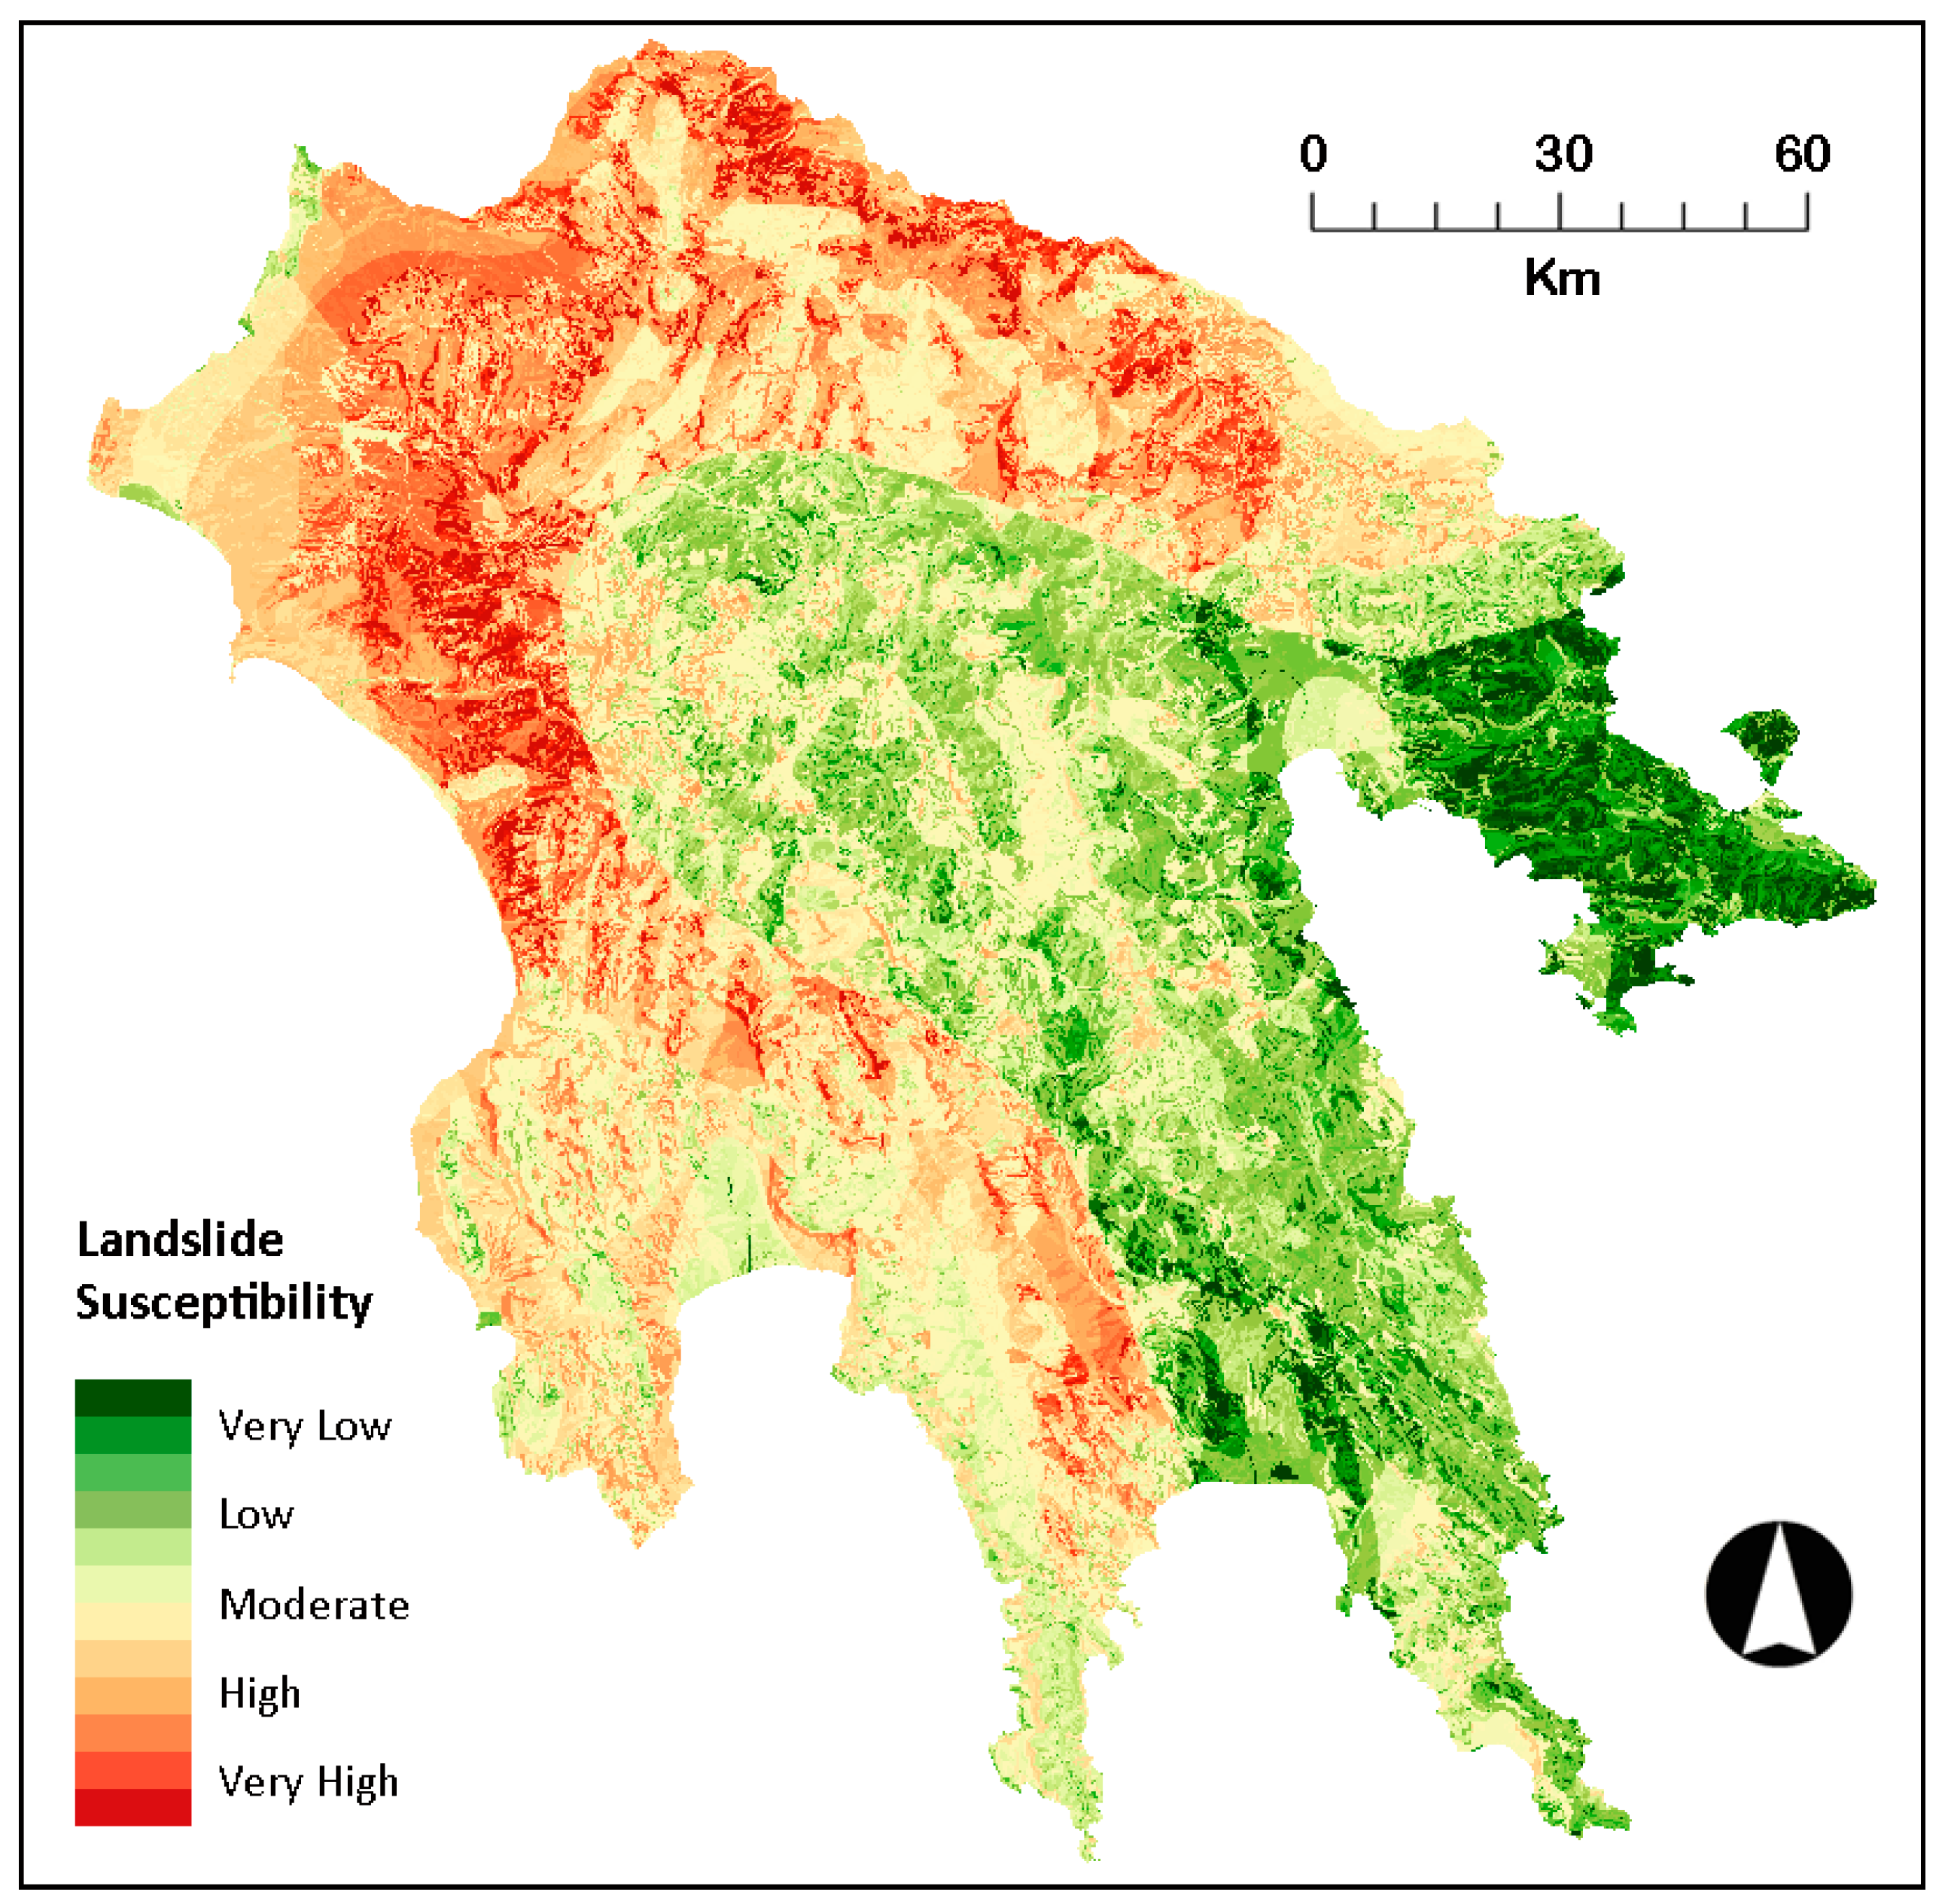
- The last step is the aggregation of relative values, and the generation of the final LS map (Figure 2). This step was implemented by using the WLC method [85]. We classified the final LS map into five discrete categories: “Very Low”, “Low”, “Moderate”, “High” and “Very High” landslide susceptibility according to the standard deviation classification method. This method uses the mean value to generate class breaks by adding or subtracting one standard deviation at a time [70]. Moreover, in order to maintain five categories, we embedded low and high outliers into “Very Low” and “Very High” susceptibility categories, respectively.
4. Results—Validation
5. Discussion
6. Conclusions
Acknowledgments
Author Contributions
Conflicts of Interest
References
- Smith, K.; Petley, D.N. Environmental Hazards: Assessing risk and reducing disaster, 5th ed.; Routledge: Abingdon, UK, 2009. [Google Scholar]
- Centre for Research on the Epidemiology of Disasters (CRED). EM-DAT: International Disaster Database; Université Catholique de Louvain: Brussels, Belgium, 2014. [Google Scholar]
- Aleotti, P.; Chowdhury, R. Landslide hazard assessment: Summary review and new perspectives. Bull. Eng. Geol. Environ. 1999, 58, 21–44. [Google Scholar] [CrossRef]
- Brabb, E.E. Innovative approaches to landslide hazard mapping. In Proceedings of the 4th International Symposium on Landslides, Toronto, ON, Canada, 16–21 September 1984; Volume 1, pp. 307–324.
- Varnes, D.J. Landslide Hazard Zonation: A Review of Principles and Practice; UNESCO: Paris, France, 1984; Volume 3. [Google Scholar]
- Santangelo, M.; Cardinali, M.; Rossi, M.; Mondini, A.C.; Guzzetti, F. Remote landslide mapping using a laser rangefinder binocular and GPS. Nat. Hazards Earth Syst. Sci. 2010, 10, 2539–2546. [Google Scholar] [CrossRef]
- Listo, F.L.R.; Vieira, B.C. Mapping of risk and susceptibility of shallow-landslide in the city of Sao Paulo, Brazil. Geomorphology 2012, 169–170, 30–44. [Google Scholar] [CrossRef]
- Castellanos Abella, E.A.; van Westen, C.J. Qualitative landslide susceptibility assessment bymulticriteria analysis: A case study from San Antonio del Sur, Guantánamo, Cuba. Geomorphology 2008, 94, 453–466. [Google Scholar] [CrossRef]
- Avtar, R.; Singh, C.K.; Singh, G.; Verma, R.L.; Mukherjee, S.; Sawada, H. Landslide susceptibility zonation study using remote sensing and GIS technology in the Ken-Betwa River Link area, India. Bull. Eng. Geol. Environ. 2011, 70, 595–606. [Google Scholar] [CrossRef]
- Intarawichian, N; Dasananda, S. Analytical hierarchy process for landslide susceptibility mapping in lower Mae Chaem watershed, northern Thailand. Suranaree J. Sci. Technol. 2010, 17, 277–292. [Google Scholar]
- Demir, G.; Aytekin, M.; Akgün, A.; Ikizler, S.B.; Tatar, O. A comparison of landslide susceptibility mapping of the eastern part of the North Anatolian Fault Zone (Turkey) by likelihood-frequency ratio and analytic hierarchy process methods. Nat. Hazards 2013, 65, 1481–1506. [Google Scholar] [CrossRef]
- Chalkias, C.; Ferentinou, M.; Polykretis, C. GIS supported landslide susceptibility modeling at regional scale: An expert-based fuzzy weighting method. ISPRS Int. J. Geo-Inf. 2014, 3, 523–539. [Google Scholar] [CrossRef]
- Kayastha, P.; Dhital, M.R.; De Smedt, F. Application of the Analytical Hierarchy Process (AHP) for landslide susceptibility mapping: A case study from the Tinau watershed, west Nepal. Comput. Geosci. 2013, 52, 398–408. [Google Scholar] [CrossRef]
- Pourghasemi, H.R.; Moradi, H.R.; Fatemi Aghda, S.M. Landslide susceptibility mapping by binary logistic regression, analytical hierarchy process, and statistical index models and assessment of their performances. Nat. Hazards 2013, 69, 749–779. [Google Scholar] [CrossRef]
- Feizizadeh, B.; Blaschke, T. An uncertainty and sensitivity analysis approach for GIS-based multicriteria landslide susceptibility mapping. Int. J. Geogr. Inf. Sci. 2014, 28, 610–638. [Google Scholar] [CrossRef]
- Kavzoglu, T.; Sahin, E.K.; Colkesen, I. Landslide susceptibility mapping using GIS-based multi-criteria decision analysis, support vector machines, and logistic regression. Landslides 2014, 11, 425–439. [Google Scholar] [CrossRef]
- Michel, G.P.; Kobiyama, M.; Goerl, R.F. Comparative analysis of SHALSTAB and SINMAP for landslide susceptibility mapping in the Cunha River basin, southern Brazil. J. Soils Sediments 2014, 14, 1266–1277. [Google Scholar] [CrossRef]
- Dahal, R.K.; Bhandary, N.P.; Hasegawa, S.; Yatabe, R. Topo-stress based probabilistic model for shallow landslide susceptibility zonation in the Nepal Himalaya. Environ. Earth Sci. 2014, 71, 3879–3892. [Google Scholar] [CrossRef]
- Wu, X.; Niu, R.; Ren, F.; Peng, L. Landslide susceptibility mapping using rough sets and backpropagation neural networks in the Three Gorges, China. Environ. Earth Sci. 2013, 70, 1307–1318. [Google Scholar] [CrossRef]
- Bi, R.; Schleier, M.; Rohn, J.; Ehret, D.; Xiang, W. Landslide susceptibility analysis based on ArcGIS and Artificial Neural Network for a large catchment in Three Gorges region, China. Environ. Earth Sci. 2014, 72, 1925–1938. [Google Scholar] [CrossRef]
- Conforti, M.; Pascale, S.; Robustelli, G.; Sdao, F. Evaluation of prediction capability of the artificial neural networks for mapping landslide susceptibility in the Turbolo River catchment (northern Calabria, Italy). Catena 2014, 113, 236–250. [Google Scholar] [CrossRef]
- Polykretis, C.; Ferentinou, M.; Chalkias, C. A comparative study of landslide susceptibility mapping using landslide susceptibility index and artificial neural networks in the Krios River and Krathis River catchments (northern Peloponnesus, Greece). Bull. Eng. Geol. Environ. 2015, 74, 27–45. [Google Scholar] [CrossRef]
- Pradhan, B. A comparative study on the predictive ability of the decision tree, support vector machine and neuro-fuzzy models in landslide susceptibility mapping using GIS. Comput. Geosci. 2013, 51, 350–365. [Google Scholar] [CrossRef]
- Sdao, F.; Lioi, D.S.; Pascale, S.; Caniani, D.; Mancini, I.M. Landslide susceptibility assessment by using a neuro-fuzzy model: A case study in the Rupestrian heritage rich area of Matera. Nat. Hazards Earth Syst. Sci. 2013, 13, 395–407. [Google Scholar] [CrossRef]
- Park, I.; Lee, S. Spatial prediction of landslide susceptibility using a decision tree approach: A case study of the Pyeongchang area, Korea. Int. J. Remote Sens. 2014, 35, 6089–6112. [Google Scholar] [CrossRef]
- He, Y.; Beighley, R.E. GIS-based regional landslide susceptibility mapping: A case study in southern California. Earth Surf. Process. Landf. 2008, 33, 380–393. [Google Scholar] [CrossRef]
- Pourghasemi, H.R.; Pradhan, B.; Gokceoglu, C.; Mohammadi, M.; Moradi, H.R. Application of weights-of-evidence and certainty factor models and their comparison in landslide susceptibility mapping at Haraz watershed. Iran. Arab. J. Geosci. 2013, 6, 2351–2365. [Google Scholar] [CrossRef]
- Epifânio, B.; Zêzere, J.L.; Neves, M. Susceptibility assessment to different types of landslides in the coastal cliffs of Lourinhã (Central Portugal). J. Sea Res. 2014, 93, 150–159. [Google Scholar] [CrossRef]
- Sujatha, E.R.; Kumaravel, P.; Rajamanickam, G.V. Assessing landslide susceptibility using Bayesian probability-based weight of evidence model. Bull. Eng. Geol. Environ. 2014, 73, 147–161. [Google Scholar] [CrossRef]
- Youssef, A.M.; Al-Kathery, M.; Pradhan, B. Landslide susceptibility mapping at Al-Hasher Area, Jizan (Saudi Arabia) using GIS-based frequency ratio and index of entropy models. Geosci. J. 2015, 19, 113–134. [Google Scholar] [CrossRef]
- Bathrellos, G.D.; Kalivas, D.P.; Skilodimou, H.D. GIS-based landslide susceptibility mapping models applied to natural and urban planning in Trikala, Central Greece. Estud. Geol. 2009, 65, 49–65. [Google Scholar] [CrossRef]
- Bai, S.B.; Wang, J.; Thiebes, B.; Cheng, C.; Chang, Z.Y. Susceptibility assessments of the Wenchuan earthquake-triggered landslides in Longnan using logistic regression. Environ. Earth Sci. 2014, 71, 731–743. [Google Scholar] [CrossRef]
- Reichenbach, P.; Busca, C.; Mondini, A.C.; Rossi, M. The influence of land use change on landslide susceptibility zonation: The Briga catchment test site (Messina, Italy). Environ. Manag. 2014, 54, 1372–1384. [Google Scholar] [CrossRef] [PubMed]
- Bourenane, H.; Bouhadad, Y.; Guettouche, M.S.; Braham, M. GIS-based landslide susceptibility zonation using bivariate statistical and expert approaches in the city of Constantine (Northeast Algeria). Bull. Eng. Geol. Environ. 2015, 74, 337–355. [Google Scholar] [CrossRef]
- Chalkias, C.; Ferentinou, M.; Polykretis, C. GIS-based landslide susceptibility mapping on the Peloponnese Peninsula, Greece. Geosciences 2014, 4, 176–190. [Google Scholar] [CrossRef]
- Tien Bui, D.; Pradhan, B.; Lofman, O.; Revhaug, I.; Dick, O.B. Spatial prediction of landslide hazards in Hoa Binh province (Vietnam): A comparative assessment of the efficacy of evidential belief functions and fuzzy logic models. Catena 2012, 96, 28–40. [Google Scholar] [CrossRef]
- Sujatha, E.R.; Rajamanickam, V. Landslide susceptibility mapping of Tevankarai Ar sub-watershed, Kodaikkanal taluk, India, using weighted similar choice fuzzy model. Nat. Hazards 2011, 59, 401–425. [Google Scholar] [CrossRef]
- Zhu, A.X.; Wang, R.; Qiao, J.; Qin, C.Z.; Chen, Y.; Liu, J.; Du, F.; Lin, Y.; Zhu, T. An expert knowledge-based approach to landslide susceptibility mapping using GIS and fuzzy logic. Geomorphology 2014, 214, 128–138. [Google Scholar] [CrossRef]
- Pourghasemi, H.R.; Pradhan, B.; Gokceoglu, C. Application of fuzzy logic and Analytical Hierarchy Process (AHP) to landslide susceptibility mapping at Haraz watershed, Iran. Nat. Hazards 2012, 63, 965–996. [Google Scholar] [CrossRef]
- Kayastha, P.; Bijukchhen, S.M.; Dhital, M.R.; De Smedt, F. GIS based landslide susceptibility mapping using a fuzzy logic approach: A case study from Ghurmi-Dhad Khola area, eastern Nepal. J. Geol. Soc. India 2013, 82, 249–261. [Google Scholar] [CrossRef]
- Wang, W.D.; Xie, C.M.; Du, X.G. Landslides susceptibility mapping based on geographical information system, GuiZhou, south-west China. Environ. Geol. 2009, 58, 33–43. [Google Scholar] [CrossRef]
- Wang, W.D.; Guo, J.; Fang, L.G.; Chang, X.S. A subjective and objective integrated weighting method for landslides susceptibility mapping based on GIS. Environ. Earth Sci. 2012, 65, 1705–1714. [Google Scholar] [CrossRef]
- Rozos, D.; Bathrellos, G.D.; Skillodimou, H.D. Comparison of the implementation of rock engineering system and analytic hierarchy process methods, upon landslide susceptibility mapping, using GIS: A case study from the Eastern Achaia County of Peloponnesus, Greece. Environ. Earth Sci. 2011, 63, 49–63. [Google Scholar] [CrossRef]
- Kritikos, T.; Davies, T.R.H. GIS-based multi-criteria decision analysis for landslide susceptibility mapping at northern Evia, Greece. Z. Deutsch. Ges. Geowiss. 2011, 162, 421–434. [Google Scholar]
- Kouli, M.; Loupasakis, C.; Soupios, P.; Rozos, D.; Vallianatos, F. Landslide susceptibility mapping by comparing the WLC and WofE multi-criteria methods in the West Crete Island, Greece. Environ. Earth Sci. 2014, 72, 5197–5219. [Google Scholar] [CrossRef]
- Papathanassiou, G.; Valkaniotis, S.; Ganas, A.; Pavlides, S. GIS-based statistical analysis of the spatial distribution of earthquake-induced landslides in the island of Lefkada, Ionian Islands, Greece. Landslides 2013, 10, 771–783. [Google Scholar] [CrossRef]
- Chalkias, C.; Kalogirou, S.; Ferentinou, M. Landslide susceptibility, Peloponnese Peninsula in South Greece. J. Maps 2014, 10, 211–222. [Google Scholar] [CrossRef]
- Tsangaratos, P.; Benardos, A. Estimating landslide susceptibility through an artificial neural network classifier. Nat. Hazards 2014, 74, 1489–1516. [Google Scholar] [CrossRef]
- Gemitzi, A.; Falakakis, G.; Eskioglou, P.; Petalas, C. Evaluating landslide susceptibility using environmental factors, fuzzy membership functions and GIS. Glob. NEST J. 2011, 13, 28–40. [Google Scholar]
- Ferentinou, M.; Chalkias, C. Mapping mass movement susceptibility across Greece with GIS, ANN and statistical methods. Landslide Sci. Pract. 2013, 321–327. [Google Scholar]
- Sabatakakis, N.; Koukis, G.; Vassiliades, E.; Lainas, S. Landslide susceptibility zonation in Greece. Nat. Hazards 2013, 65, 523–543. [Google Scholar] [CrossRef]
- Gournellos, T.; Chalkias, C.; Tsagas, D. Landslide susceptibility zonation of Greece using fuzzy logic and GIS. Geographies 2006, 12, 114–126. [Google Scholar]
- Hellenic Statistical Authority (ELSTAT). Population and Housing Census: Resident Population; ELSTAT: Piraeus, Greece, 2011. [Google Scholar]
- Pnevmatikos, J.D.; Katsoulis, B.D. The changing rainfall regime in Greece and its impact on climatological means. Meteorol. Appl. 2006, 13, 331–345. [Google Scholar] [CrossRef]
- Koukis, G.; Tsiambaos, G.; Sabatakakis, N. Landslides movements in Greece: Engineering geologicalcharacteristics and environmental consequences. In Proceedings of the 7th International Symposium of Engineering Geology and Environment, Athens, Greece, 23–27 June 1997; Volume 1, pp. 789–792.
- Hellenic Military Geographical Service (HMGS). Aerial Photography of Various Areas of Greece, Scale 1:40,000; HMGS: Athens, Greece, 1969. [Google Scholar]
- Che, V.B.; Kervyn, M.; Suh, C.E.; Fontijn, K.; Ernst, G.G.J.; del Marmol, M.A.; Trefois, P.; Jacobs, P. Landslide susceptibility assessment in Limbe (SW Cameroon): A field calibrated seed cell and information value method. Catena 2012, 92, 83–98. [Google Scholar] [CrossRef]
- De Guidi, G.; Scudero, S. Landslide susceptibility assessment in the Peloritani Mts. (Sicily, Italy) and clues for tectonic control of relief processes. Nat. Hazards Earth Syst. Sci. 2013, 13, 949–963. [Google Scholar] [CrossRef]
- Youssef, A.M.; Pradhan, B.; Pourghasemi, H.R.; Abdullahi, S. Landslide susceptibility assessment at Wadi Jawrah Basin, Jizan region, Saudi Arabia using two bivariate models in GIS. Geosci. J. 2015, 19, 449–469. [Google Scholar] [CrossRef]
- Cruden, D.M.; Varnes, D.J. Landslide types and processes. In Landslides: Investigation and Mitigation, Special Report; Turner, A.K., Schuster, R.L., Eds.; National Academy Press: Washington, DC, USA, 1996. [Google Scholar]
- Fell, R. Landslide risk assessment and acceptable risk. Can. Geotech. J. 1994, 31, 261–272. [Google Scholar] [CrossRef]
- Magliulo, P.; Lisio, A.; Russo, F.; Zelano, A. Geomorphology and landslide susceptibility assessment using GIS and bivariate statistics: A case study in southern Italy. Nat. Hazards 2008, 47, 411–435. [Google Scholar] [CrossRef]
- Das, O.; Sonmez, H.; Gokceoglu, C.; Nefeslioglu, H. A study on the effect of the ground acceleration on landslide susceptibility maps. Geophys. Res. Abstr. 2010, 12, EGU2010-5885-1. [Google Scholar]
- Yalcin, A. GIS-based landslide susceptibility mapping using analytical process and bivariate statistics in Ardesen (Turkey): Comparisons of results and confirmations. Catena 2008, 72, 1–12. [Google Scholar] [CrossRef]
- Hasekioǧullari, G.D.; Ercanoglu, M. A new approach to use AHP in landslide susceptibility mapping: A case study at Yenice (Karabuk, NW Turkey). Nat. Hazards 2012, 63, 1157–1179. [Google Scholar] [CrossRef]
- Heymann, Y.; Steenmans, C.; Croisille, G.; Bossard, M. CORINE Land Cover: Technical Guide; Office for Official Publications of the European Communities: Luxembourg City, Luxembourg, 1994. [Google Scholar]
- Carrara, A.; Cardinali, M.; Detti, R.; Guzzetti, F.; Pasqui, V.; Reichenbach, P. GIS techniques and statistical models in evaluating landslide hazard. Earth Surf. Process. Landf. 1991, 16, 427–445. [Google Scholar] [CrossRef]
- Institute of Geology and Mineral Exploration (IGME). Geological Map of Greece, Scale 1:500,000, 2nd ed.; IGME: Athens, Greece, 1983. [Google Scholar]
- Underhill, J.R. Late Cenozoic deformation of the Hellenide foreland, western Greece. Geol. Soc. Am. Bull. 1989, 101, 613–634. [Google Scholar] [CrossRef]
- Ayalew, L.; Yamagishi, H. The application of GIS-based logistic regression for landslide susceptibility mapping in the Kakuda-Yahiko Mountains Central Japan. Geomorphology 2005, 65, 15–31. [Google Scholar] [CrossRef]
- Rahmani, M.; Hosieni, S.A.; Molla Aghajanzadeh, A.; Mashayekhan, A.; Mahalleh, S.M.M. Landslide hazard zonation using the MCE method (Case study: Agh Mashhad, Mazandaran Province, Iran). Int. J. AgriSci. 2013, 3, 240–244. [Google Scholar]
- Ahmed, M.F.; Rogers, J.D.; Ismail, E.H. A regional level preliminary landslide susceptibility study of the upper Indus river basin. Eur. J. Remote Sens. 2014, 47, 343–373. [Google Scholar] [CrossRef]
- Sato, H.P.; Hasegawa, H.; Fujiwara, S.; Tobita, M.; Koarai, M.; Une, H.; Iwahashi, J. Interpretation of landslide distribution triggered by the 2005 Northern Pakistan earthquake using SPOT 5 imagery. Landslides 2007, 4, 113–122. [Google Scholar] [CrossRef]
- Owen, L.A.; Kamp, U.; Khattak, G.A.; Harp, E.L.; Keefer, D.K.; Bauer, M.A. Landslides triggered by the 8 October 2005 Kashmir earthquake. Geomorphology 2008, 94, 1–9. [Google Scholar] [CrossRef]
- Huade, G.; Wilson, J.L.; Makhnin, O. Geostatistical mapping of mountain precipitation incorporating autosearched effects of terrain and climatic characteristics. J. Hydrometeorol. 2005, 6, 1018–1031. [Google Scholar]
- Arjun, C.R.; Kumar, A. Artificial neural network-based estimation of peak ground acceleration. ISET J. Earthq. Technol. 2009, 46, 19–28. [Google Scholar]
- Stournaras, G.; Tsimpidis, G.; Tsoumanis, P.; Yannatos, G.; Guillande, R. Instability Phenomena in the Neogenne Deposits of Northern Peloponnese. Bull. Eng. Geol. Environ. 1998, 57, 65–68. [Google Scholar] [CrossRef]
- Papathanassiou, G. Estimating slope failure potential in an earthquake prone area: A case study at Skolis Mountain, NW Peloponnesus, Greece. Bull. Eng. Geol. Environ. 2012, 71, 187–194. [Google Scholar] [CrossRef]
- Dounias, G.; Fikiris, I.F.; Kollios, A.; Kabbadas, M.; Marinos, P. The Nemea Landslide. Trigger Mechanism–Remedial Measures. In Proceedings of the 5th Panellenic Conference of Geotechnics and Geoenvironmental Engineering, Xanthi, Greece, 31 May–2 June 2006.
- Papadopoulos, G.A.; Plessa, A. Magnitude-distance relations for earthquake-induced landslides in Greece. Eng. Geol. 2000, 58, 377–386. [Google Scholar] [CrossRef]
- Chousianitis, K.; Del Gaudio, V.; Sabatakakis, N.; Kavoura, K.; Drakatos, G.; Bathrellos, G.D.; Skilodimou, H.D. Assessment of earthquake-induced landslide hazard in Greece: From Arias Intensity to spatial distribution of slope resistance demand. Bull. Seismol. Soc. Am. 2016. [Google Scholar] [CrossRef]
- Van Westen, C.J. Statistical landslide hazard analysis. In ILWIS 2.1 for Windows Application Guide; ITC Publication: Utrecht, The Netherlands, 1997; pp. 73–84. [Google Scholar]
- Jenks, G.F. The data model concept in statistical mapping. Int. Yearb. Cartogr. 1967, 7, 186–190. [Google Scholar]
- Lee, E.M.; Jones, D.K.C. Landslide Risk Assessment; Thomas Telford: London, UK, 2004; p. 161. [Google Scholar]
- Malczewski, J. GIS and Multicriteria Decision Analysis; John Wiley & Sons: New York, NY, USA, 1999. [Google Scholar]
- Remondo, J.; González-Díez, A.; Díaz de Terán, J.R.; Cendrero, A. Landslide susceptibility models utilizing spatial data analysis techniques. A case study from the Lower Deba Valley, Guipúzcoa (Spain). Nat. Hazards 2003, 30, 267–279. [Google Scholar] [CrossRef]
- Nandi, A.; Shakoor, A. Preparation of a landslide susceptibility map of summit county, Ohio, USA, using numerical models. In Proceedings of the 10th IAEG Congress, Nottingham, UK, 6–10 September 2006.
- Frattini, P.; Crosta, G.; Carrara, A. Techniques for evaluating the performance of landslide susceptibility models. Eng. Geol. 2010, 111, 62–72. [Google Scholar] [CrossRef]
- Fawcett, T. An introduction to ROC analysis. Pattern Recognit. Lett. 2006, 27, 861–874. [Google Scholar] [CrossRef]
- Dragićević, S.; Lai, T.; Balram, S. GIS-based multicriteria evaluation with multiscale analysis to characterize urban landslide susceptibility in data-scarce environments. Habitat Int. 2015, 45, 114–125. [Google Scholar] [CrossRef]
- Faraji Sabokbar, H.; Shadman Roodposhti, M.; Tazik, E. Landslide susceptibility mapping using geographically-weighted principal component analysis. Geomorphology 2014, 226, 15–24. [Google Scholar] [CrossRef]
- Yang, Z.H.; Lan, H.X.; Gao, X.; Li, L.P.; Meng, Y.S.; Wu, Y.M. Urgent landslide susceptibility assessment in the 2013 Lushan earthquake-impacted area, Sichuan Province, China. Nat. Hazards 2015, 75, 2467–2487. [Google Scholar] [CrossRef]
- Van Westen, C.J.; Rengers, N.; Terlien, M.T.J.; Soeters, R. Prediction of the occurrence of slope instability phenomena through GIS-based hazard zonation. Geol. Rundsch. 1997, 86, 404–414. [Google Scholar] [CrossRef]
- Ayalew, L.; Yamagishi, H.; Maruib, H.; Takami, K. Landslides in Sado Island of Japan: Part II. GIS-based susceptibility mapping with comparisons of results from two methods and verifications. Eng. Geol. 2005, 81, 432–445. [Google Scholar] [CrossRef]
- Tien Bui, D.; Lofman, O.; Revhaug, I.; Dick, O. Landslide susceptibility analysis in the Hoa Binh province of Vietnam using statistical index and logistic regression. Nat. Hazards 2011, 59, 1413–1444. [Google Scholar]
- Van Westen, C.J.; Rengers, N.; Soeters, R. Use of geomorphological information in indirect landslide susceptibility assessment. Nat. Hazards 2003, 30, 399–419. [Google Scholar] [CrossRef]
- Saboya, F., Jr.; da Glória Alves, M.; Dias Pinto, W. Assessment of failure susceptibility of soil slopes using fuzzy logic. Eng. Geol. 2006, 86, 211–224. [Google Scholar] [CrossRef]
- Bathrellos, G.D.; Gaki-Papanastassiou, K.; Skilodimou, H.D.; Papanastassiou, D.; Chousianitis, K.G. Potential suitability for urban planning and industry development by using natural hazard maps and geological—Geomorphological parameters. Environ. Earth Sci. 2012, 66, 537–548. [Google Scholar] [CrossRef]
- Rozos, D.; Skilodimou, H.D.; Loupasakis, C.; Bathrellos, G.D. Application of the revised universal soil loss equation model on landslide prevention. An example from N. Euboea (Evia) Island, Greece. Environ. Earth Sci. 2013, 70, 3255–3266. [Google Scholar] [CrossRef]


| Layers (Factors) | Categories (Classes) | Landslide Density | LSI | (Experts), STAT Fuzzy Value | LSI/TFNW Weight |
|---|---|---|---|---|---|
| Land cover | Artificial surfaces | 0.09 | 2.04 | (H, M, M), VH | 0.45 |
| Agricultural areas | 0.66 | 0.42 | (M, H, H), H | 0.42 | |
| Forest and semi-natural land | 0.25 | –0.79 | (L, L, M), VL | 0.13 | |
| Lithology | Phyllites/Gneiss (metamorphic) | 0.07 | 0.16 | (L, M, L), H | 0.14 |
| Limestones—Marbles | 0.20 | –0.77 | (L, L, L), VL | 0.05 | |
| Schists (metamorphic) | 0.01 | –0.51 | (M, M, M), VL | 0.08 | |
| Neogene | 0.44 | 0.69 | (H, VH, M), VH | 0.22 | |
| Quaternary | 0.12 | –0.06 | (H, VH, M), M | 0.16 | |
| Flysch | 0.09 | 0.06 | (VH, VH, VH), M | 0.19 | |
| Cherts—Schists | 0.06 | 0.36 | (M, L, M), H | 0.15 | |
| MAP | <663 mm | 0.03 | –1.69 | (L, VL, M), VL | 0.07 |
| 663–884 mm | 0.30 | 0.14 | (M, L, H), M | 0.19 | |
| 885–1079 mm | 0.43 | 0.29 | (M, M, H), H | 0.25 | |
| 1080–1295 mm | 0.19 | –0.03 | (H, H, VH), M | 0.25 | |
| >1295 mm | 0.05 | –0.22 | (VH, VH, VH), L | 0.23 | |
| PGA | <1.16 m/s2 | 0.02 | –0.14 | (L, VL, L), M | 0.16 |
| 1.16–1.88 m/s2 | 0.01 | –0.98 | (L, L, L), VL | 0.08 | |
| 1.89–2.53 m/s2 | 0.17 | –0.81 | (M, M, M), VL | 0.13 | |
| 2.54–3.11 m/s2 | 0.67 | 0.53 | (H, H, H), VH | 0.37 | |
| >3.11 m/s2 | 0.13 | –0.28 | (VH, VH, VH), L | 0.27 | |
| Elevation | <234 m | 0.36 | 0.17 | (L, VL, L), H | 0.25 |
| 234–524 m | 0.27 | 0.11 | (L, L, M), M | 0.22 | |
| 525–851 m | 0.22 | –0.03 | (H, M, M), M | 0.28 | |
| >851 m | 0.15 | –0.43 | (Μ, H, H), L | 0.24 | |
| Slope angle | <5° | 0.31 | –0.16 | (VL, VL, L), L | 0.09 |
| 5°–10° | 0.30 | 0.19 | (L, L, L), H | 0.21 | |
| 11°–15° | 0.22 | 0.23 | (M, M, M), H | 0.25 | |
| 16°–20° | 0.12 | 0.08 | (H, H, H), M | 0.25 | |
| >20° | 0.05 | –0.77 | (VH, VH, VH), VL | 0.21 | |
| Slope aspect | North | 0.31 | 0.31 | (H, H, M), H | 0.31 |
| East | 0.21 | –0.15 | (M, M, M), M | 0.23 | |
| South | 0.16 | –0.47 | (M, M, M), L | 0.18 | |
| West | 0.32 | 0.16 | (H, H, H), M | 0.28 |
| Parameter | Parameter Importance (Expert Judgment), STAT | LSI/TFNW Weight |
|---|---|---|
| Land cover | (M, M, H), M | 0.12 |
| Lithology | (VH, VH, H), H | 0.17 |
| MAP | (VH, VH, VH), VH | 0.20 |
| PGA | (H, H, H), H | 0.16 |
| Elevation | (M, L, H), L | 0.08 |
| Slope angle | (VH, VH, VH), H | 0.18 |
| Slope aspect | (H, M, M), L | 0.09 |
© 2016 by the authors; licensee MDPI, Basel, Switzerland. This article is an open access article distributed under the terms and conditions of the Creative Commons by Attribution (CC-BY) license (http://creativecommons.org/licenses/by/4.0/).
Share and Cite
Chalkias, C.; Polykretis, C.; Ferentinou, M.; Karymbalis, E. Integrating Expert Knowledge with Statistical Analysis for Landslide Susceptibility Assessment at Regional Scale. Geosciences 2016, 6, 14. https://doi.org/10.3390/geosciences6010014
Chalkias C, Polykretis C, Ferentinou M, Karymbalis E. Integrating Expert Knowledge with Statistical Analysis for Landslide Susceptibility Assessment at Regional Scale. Geosciences. 2016; 6(1):14. https://doi.org/10.3390/geosciences6010014
Chicago/Turabian StyleChalkias, Christos, Christos Polykretis, Maria Ferentinou, and Efthimios Karymbalis. 2016. "Integrating Expert Knowledge with Statistical Analysis for Landslide Susceptibility Assessment at Regional Scale" Geosciences 6, no. 1: 14. https://doi.org/10.3390/geosciences6010014
APA StyleChalkias, C., Polykretis, C., Ferentinou, M., & Karymbalis, E. (2016). Integrating Expert Knowledge with Statistical Analysis for Landslide Susceptibility Assessment at Regional Scale. Geosciences, 6(1), 14. https://doi.org/10.3390/geosciences6010014