


Abstract
The preferential concentration of metals into finer size fractions (<19 mm) during breakage can be exploited for early rejection of low-grade material, reducing non-ore processing and improving energy and water efficiency. The Cooperative Research Centre for Optimising Resource Extraction (CRC ORE) established a testing regime and developed the Response Ranking (RR) factor to compare fractionation behavior across deposits. RR values range from 200 to negative, with higher values indicating breakage patterns favorable for ore liberation. This study evaluates geological parameters controlling rock breakage in the Gramalote and Telfer West Dome deposits, both intrusion-related gold systems. For this purpose, macroscopic description of drill core was carried out using the Anaconda methodology, along with uncrushed run-of-mine (ROM) samples. In addition, petrophysical datasets including hardness, magnetic susceptibility, hyperspectral data, geochemistry, and calculated mineralogy were used. These datasets were systematically compared with RR values to investigate the relationship between geological attributes and grade-by-size fractionation behavior. Geological description provides a practical basis to identify early separation opportunities and model optimization potential through grade-by-size fractionation.
Keywords:
grade engineering®; upgrade potential; response ranking; pre-concentration; gold; vein; breakage 1. Introduction
The development of procedures to reject uneconomic material early in the mining value chain will improve the efficiency of the mining industry, thus helping to meet the demand for metals required in the technological advancement of modern societies [1,2]. The Cooperative Research Centre for Optimising Resource Extraction (CRC ORE) developed a suite of methodologies referred to as Grade Engineering® with the approach that gangue can be rejected at coarse scales based on a series of rock properties [1,3,4,5,6,7]. Part of these methodologies is preferential grade-by-size fractionation, which is the tendency for specific mineral phases to preferentially fractionate into different size fractions during breakage [8].
One of the most significant field applications of Grade Engineering® was conducted at the San Cristóbal mine in Bolivia, one of the largest Zn–Ag–Pb operations in the world. CRC ORE, in collaboration with Minera San Cristóbal, tested bulk ore sorting and size-based separation as part of a Grade Engineering® trial [9,10]. The program demonstrated that approximately 66% of the contained metal could be concentrated into only 25% of the mass, achieving a ~2.7× upgrade factor for previously marginal “mineralized waste” halos [9]. This approach not only showed potential for extending mine life by up to two years but also indicated energy savings of 15–20% in SAG milling when blended with conventional feed. The successful implementation of Grade Engineering® at San Cristóbal highlights the practical potential of pre-concentration strategies to reduce processing costs, increase resource utilization, and improve sustainability outcomes in large-scale base-metal mining.
CRC ORE supported Carrasco et al.’s (2015, 2016) research [8,11,12,13] and developed a mathematical model that relates metal upgrade with the proportion of mass contained in specific size fractions to describe preferential grade-by-size fractionation through an upgrade factor called the Response Ranking (RR) [12]. This factor allows comparison of grade-by-size fractionation across different styles of geological deposits (e.g., stock-work vein hosted, breccia, porphyries, etc.), sample types and sizes (i.e., drill core and run-of-mine (ROM)), as well as between deposits or domains within a deposit. RR values decrease from 200 to negative values [10,11,14]. A RR above 80 shows potential for grade-by-size fractionation that could be used to upgrade the ore stream via screening to separate the preferred size fractions, i.e., the size fraction that contains a significant portion of the valuable phase. A RR from 80 to 20 indicates that the material may be suitable for Grade Engineering® if sizing is supplemented by other methods, such as differential blasting. A RR 20 to 0 means that the material is unsuitable for upgrading by sizing [11,12]. A negative RR generally indicates that the metal reports to the coarse fraction during crushing [14].
More recently, Morales Leiva (2022) [10] showed that geological attributes such as vein density, mineralization style, and hardness contrasts are strong predictors of high RR values, while homogeneous lithologies exhibit weaker responses. Similarly, Baizhiyen et al. (2024) [15] applied discrete element modeling (DEM) to simulate rock breakage, demonstrating that textural heterogeneity and mineralized veins favor metal concentration in finer fractions, confirming the potential of preferential grade deportment by size to be predicted numerically.
Additionally, previous work demonstrated that samples from the Gramalote and Telfer West Dome (WD) intrusion-related gold systems, were highly amenable to the implementation of grade-by-size screening to upgrade the ore [8,16,17,18]. Therefore, samples and data from these deposits have been used to understand the geological controls on grade-by-size fractionation, and the results are summarized in this paper. Detailed descriptions are presented in Guerrero [19].
2. Analytical Methods
2.1. Macroscopic Rock Description
A total of 110 m of drill core from Gramalote and 104 m from Telfer WD were described using the Anaconda method [20,21] with an observation scale of 0.5 m for Gramalote samples and 0.25 m for Telfer WD samples. Drill core intervals observations took note of: (1) rock type, (2) hydrothermal alteration assemblages, (3) percentage of least-altered rock (LAR), (4) different sets of veins, and (5) number of veins and the percentage or vein density (vein + selvage was described as a single texture). Note that the designation LAR is a relative term and is based on an altered tonalite host rock.
Additionally, five uncrushed ROM bulk samples were collected from the Gramalote deposit directly after blasting, without any additional crushing. Each sample was screened into ten different size-fractions, >200 mm, 200–175 mm, 175–150 mm, 150–106 mm, 106–75 mm, 75–53 mm, 53–37.5 mm, 37.5–26.5 mm, 26.5–19 mm and <19 mm. Visual logging of the bulk sample size fractions >19 mm was used to identify the same features as those seen in the drill core samples, such as the characteristic color of dominant minerals (e.g., pink K-feldspar). The size fraction <19 mm was not macroscopically described because particles were considered too small for reliable visual classification.
All ROM samples described were manually washed and visually separated into six groups (Table 1), with most of the rock pieces having a low presence of veins. To be classified as vein-type (V1, V2, V3, QV, Q), it was decided that the rock pieces must have more than 20% vein material, or the vein must cut the rock in the center of the sample piece.
Table 1.
Classification groups used for bulk samples at Gramalote.
2.2. Petrophysical and Hyperspectral Analyses
Gramalote rocks contain visible disseminated magnetite; for that reason, magnetic susceptibility was measured. Site personnel carried out measurements using a KT-9 MAGSUS device [22] along every 20 cm of core. The Telfer WD samples did not give a magnetic response.
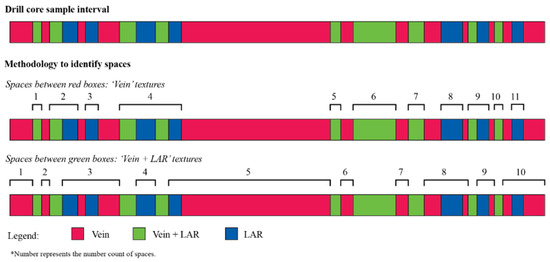
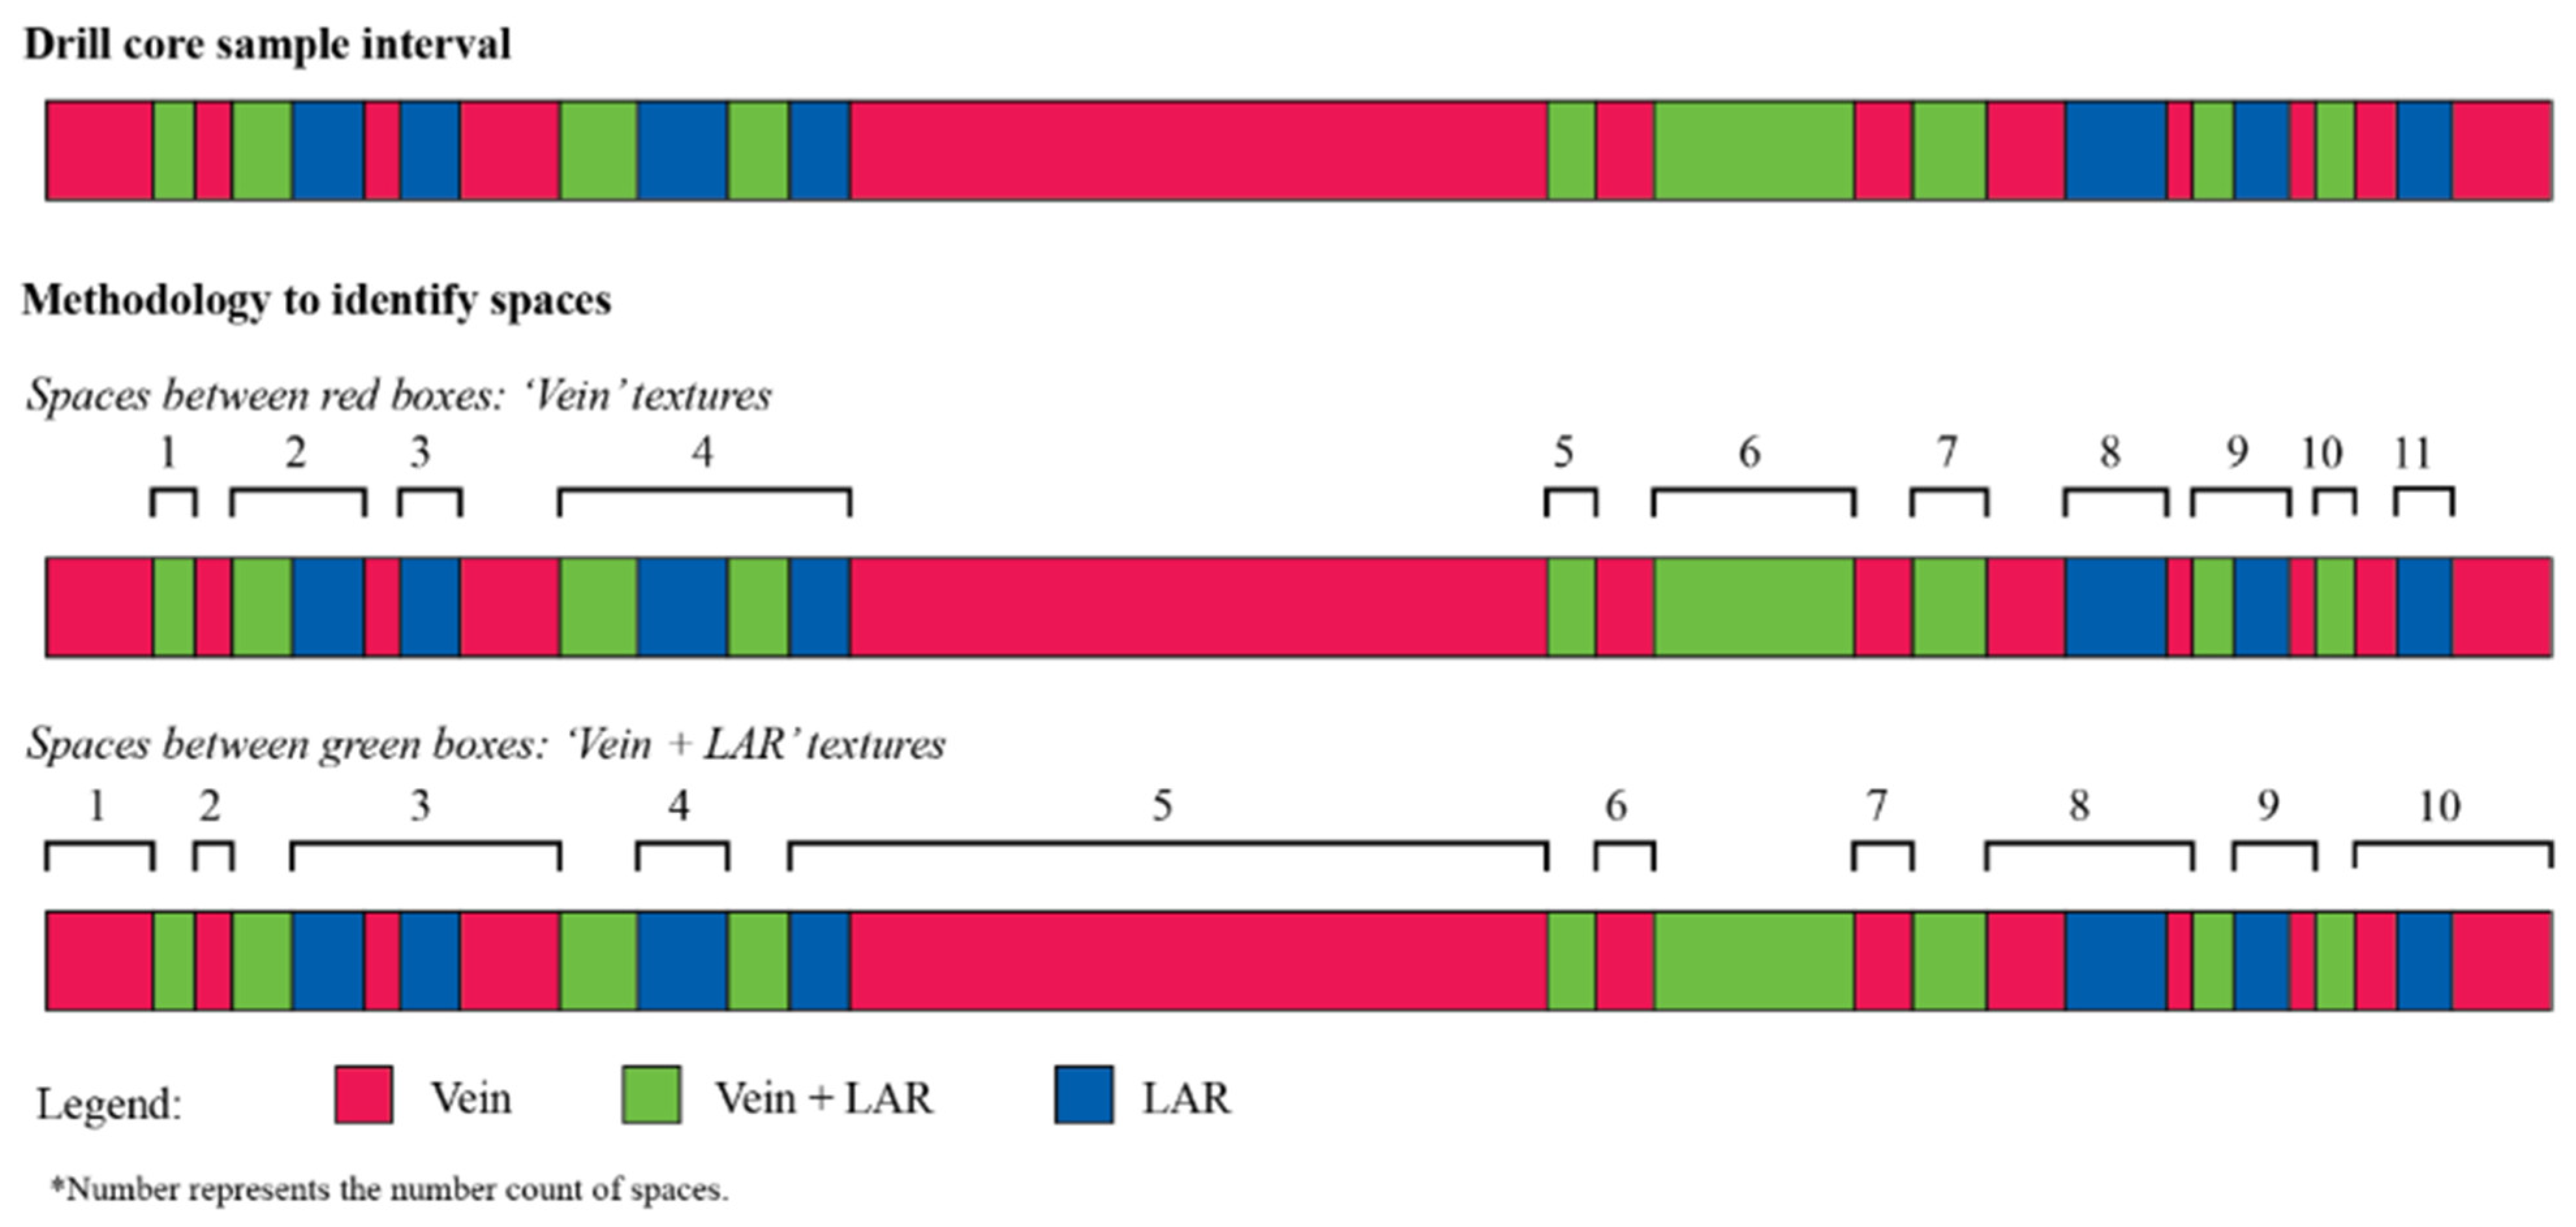
Analysis of the magnetic susceptibility of each sample permitted the discrimination between the least-altered rock (LAR) and altered rock with veins groupings. LAR is readily identifiable by its high magnetic susceptibility values (>6 ×10⁻³ SI) and is classified as ‘LAR texture’ in the remainder of this study. Tonalite with thin veins (<2 cm) has medium magnetic susceptibility values (between 3 × 10⁻³ and 6 × 10⁻³ SI) and is thus classified as ‘vein + LAR texture’. Altered rock with thick (>2 cm) veins has low magnetic susceptibility values (<3 × 10⁻³ SI) and is classified as ‘vein texture’. In addition to these textural groupings, the number of spaces between domains was also recorded (Figure 1). The number of spaces refers to the number of intervals between a specific type of vein texture in a 1 m sample; for example, in Figure 1, 11 spaces were recognized in the 1 m sample between intervals categorized as ‘vein texture’ and 10 spaces between intervals categorized as ‘vein + LAR texture’.
Figure 1.
Example of the methodology to determine spaces between textures based on magnetic susceptibility response.
Rebound hardness information was collected directly from the drill core intervals using an EQUOtip portable electronically controlled device [23]. Point measurements were taken on the previously identified textures, to better understand the different hardness of each texture. Those measurements were integrated with an EQUOtip dataset collected previously from Gramalote by CRC ORE which were taken approximately every 2 cm [24]. The spaces void of EQUOtip data are due to sampling issues around cracks, faults, or thin drill core pieces. Rebound hardness data, collected approximately every 2 cm from drill core, and averaged every meter for Telfer WD was provided by the project sponsor. Additionally, the project sponsor supplied density measurements for each meter of drill core.
Hyperspectral data were collected from 104 m of drill core from Telfer WD using the HyLogger-3 system at Mineral Resources Tasmania (MRT). This system scans a profile line centered on the drill core with a field of view on the sample of 10 mm. The system operates one high-resolution camera and three coupled spectrometers to map the relative abundance of an extensive suite of minerals within the VNIR-SWIR (visible to near-infrared–shortwave infrared) and TIR (thermal infrared) region of the electromagnetic spectrum [25]. These data were interpreted with The Spectral Geologist (TSGTM 8) software with the help of MRT staff.
2.3. Geochemistry
For Gramalote, 100 drill core assay reject samples of an intrusive-hosted ore (from a tonalite rock) were sieved into four size fractions (>1.70 mm, 1.7–0.3 mm, 0.3–0.15 mm, <0.15 mm) [12]. Both chemical analyses and the mass of each size fraction were obtained via Australian Laboratory Services (ALS) and used to calculate a RR for each sample (Gustavson Associates, 2014). Gold was analyzed via fire assay with atomic absorption spectroscopy (AAS) and fire assay fusion (ALS procedure Au-AA25; ALS, 2023). Other elements were analyzed via inductively coupled plasma–mass spectrometry—ICP-MS (ALS procedure Au ME-MS61).
Samples from 10 drill holes from Telfer WD were selected, with sampling intervals between 1 and 2 m, resulting in a combined length of 104 m of half drill core. Geochemical analyses were conducted for 53 drill core samples, where each sample was subsampled into four different size fractions (>2.36, 2.36–1.7, 1.7–0.6, <0.6 mm) [10]. Gold was analyzed by fire assay with AAS (ALS procedure Au-AA25) and multi-element analyses by XRF + Li borate ICP-MS + base metals + trace metals + total S + total C (ALS procedure CCP-PKG03) at ALS [26].
Note: the Telfer samples were size-fractioned following CRCORE’s standard drill-core protocol [11]. Because the Telfer material was available only in limited quantity, the Gramalote-specific sizing scheme [14] could not be applied, resulting in different particle-size intervals between the two datasets.
2.4. Mineral Composition by Calculated Mineralogy
Modal mineralogy for the Gramalote samples was estimated using the chemical assays and a weighted least squares (WLSQ) approach with the “Solver” analysis tool in Microsoft Excel software following the methods described in Escolme et al. (2019) [27]. The assay data does not contain silica; hence this element was not available for the calculation of mineralogy. It was assumed that the percentage of silica corresponds to the remaining percentage of the elements used for the calculation, subtracted from 100%. The mineralogical calculation was performed on 100 samples of drill core and 400 samples of size fractions from the Gramalote deposit.
Modal mineralogy was calculated only for Gramalote due to its diverse mineral assemblages and balanced host-rock composition. The Telfer samples, dominated by quartz-rich sedimentary rocks and quartz veins, lacked sufficient mineralogical variability for meaningful modal reconstruction. Additionally, the four-acid digestion procedure used does not dissolve quartz; in Telfer, the undissolved fraction was dominated by quartz, making modal estimation unreliable.
2.5. Calculation of Response Ranking Values and Validation
The RR is calculated using Equations (1)–(3) [12,14]. For these calculations, two factors are determined for each size fraction (i) in each sample: the response factor (RF) and response slope (RS). The average RS value for the sample is then calculated and multiplied by a factor of 200 to obtain the RR.
where i are individual size fractions, % metal represents the cumulative metal distribution in the size fraction, % mass retained is the cumulative mass retained in the size fraction, and n is the number of size fractions in the sample.
3. Geological Parameters
3.1. Gramalote Deposit
The Gramalote deposit is an intrusive related gold system hosted in the Late Cretaceous (50.2 ± 1.2 to 88.5 ± 0.6 My) Antioquia Batholith, located in the northern portion of the Central Cordillera of Colombia [28,29]. The Antioquia Batholith is located between two important regional fault systems: San Jeronimo (to the west) and Otú-Pericos (to the east) [28,30,31]. These regional structures are linked by ‘horse tail’ regional extensional structures like the Nus River Lineaments to the north of Gramalote, and the Cristales Shear Zone to the south [29], which controls the occurrence and distribution of hydrothermal alteration and mineralization [32].
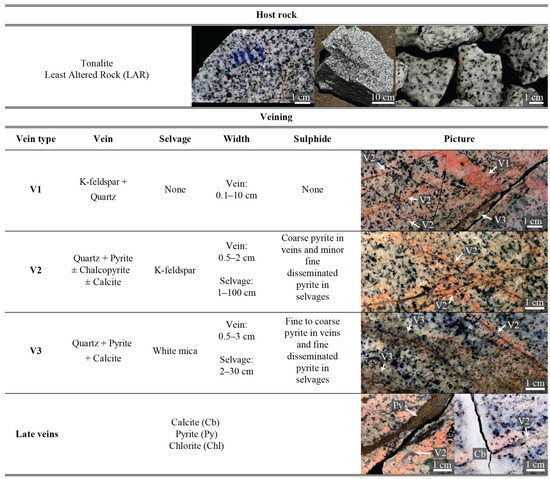
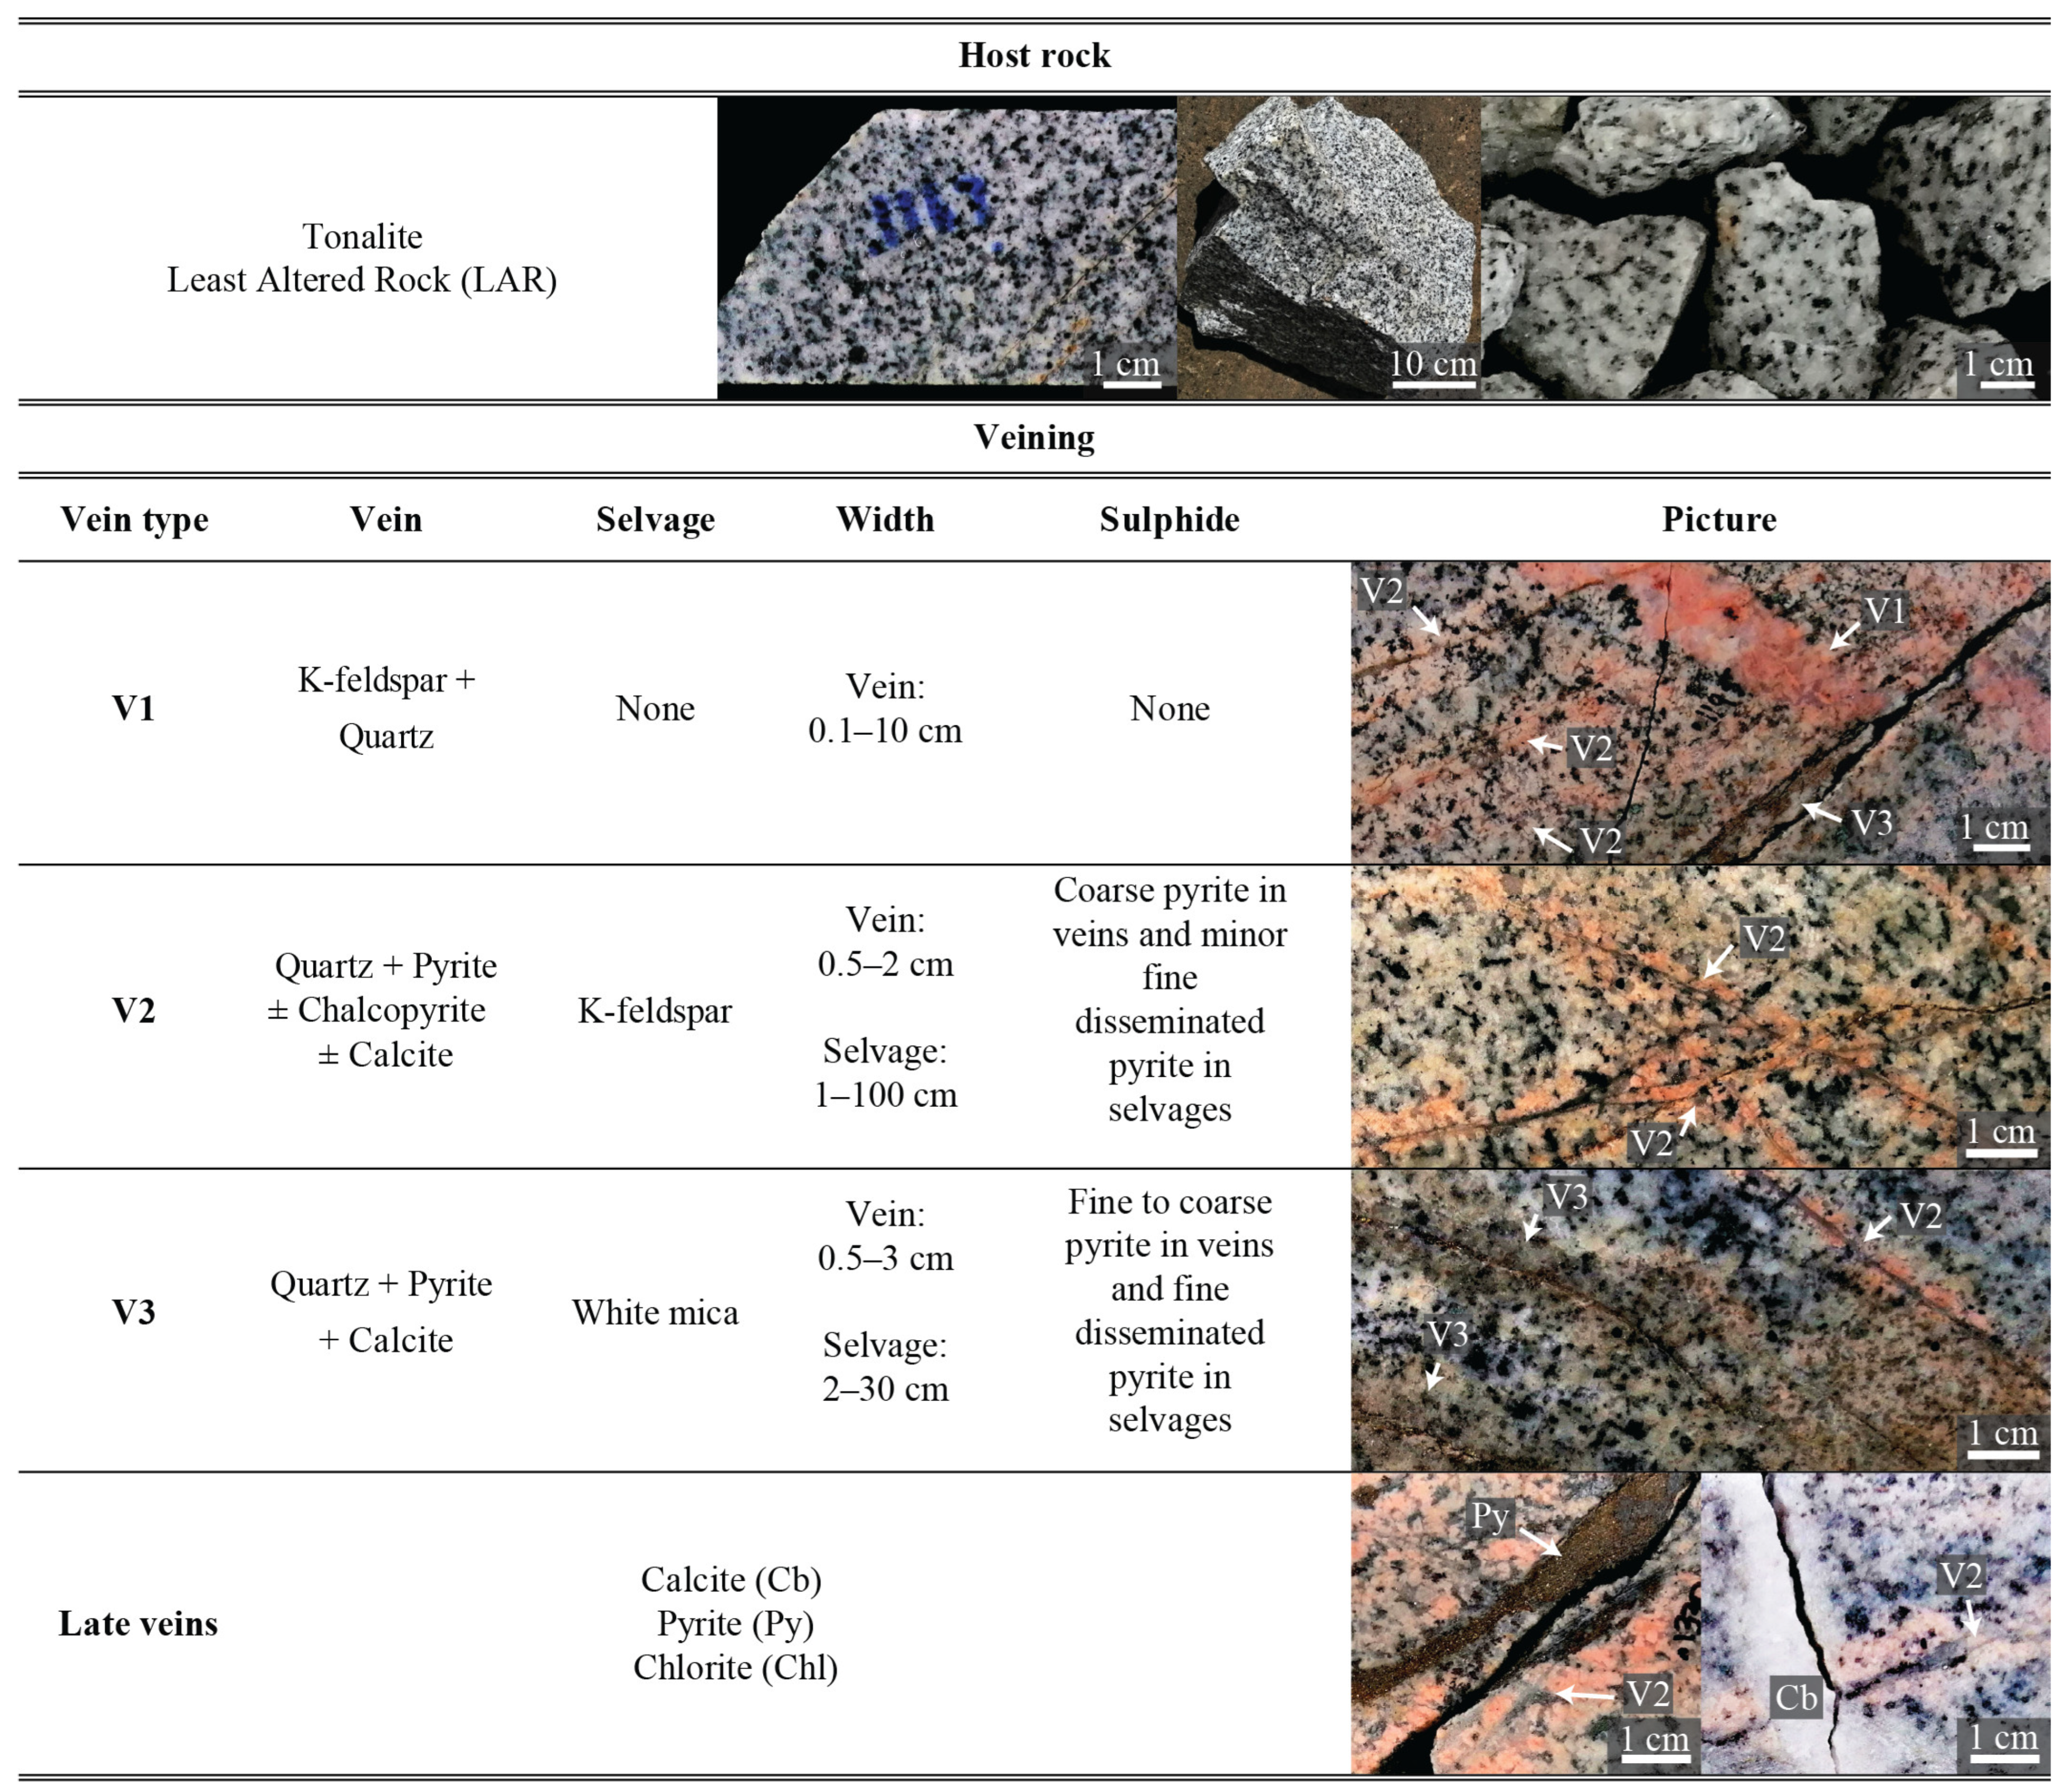
The deposit host rock is a hard intrusive rock classified as tonalite, as shown in Figure 2, which comprises 50% quartz, 40% plagioclase, less than 10% orthoclase and <3% biotite. Mineralization and hydrothermal alteration are structurally controlled associated with veins and alteration selvages around these veins.
Figure 2.
Summary description of host rock and the different vein types in the Gramalote deposit.
Figure 2 shows a summary of the main characteristics of the different vein assemblages identified in the drill core used for this study. These are (a) ‘V1’, which vary in thickness from 0.1 to 10 cm and are characterized by K-feldspar and quartz without sulfides; (b) ‘V2’, which vary in thickness from 0.5 to 2 cm and consist mainly of quartz and pyrite; V2 veins have an alteration selvage of K-feldspar; (c) ‘V3’ are irregular-edged quartz veins, approximately 0.5 to 3 cm thick, with an alteration selvage of white mica; V3 veins contain pyrite in the vein and disseminated into the selvages; and (d) late veins of chlorite, carbonates, or massive pyrite. For full details, see Guerrero (2022) [19].
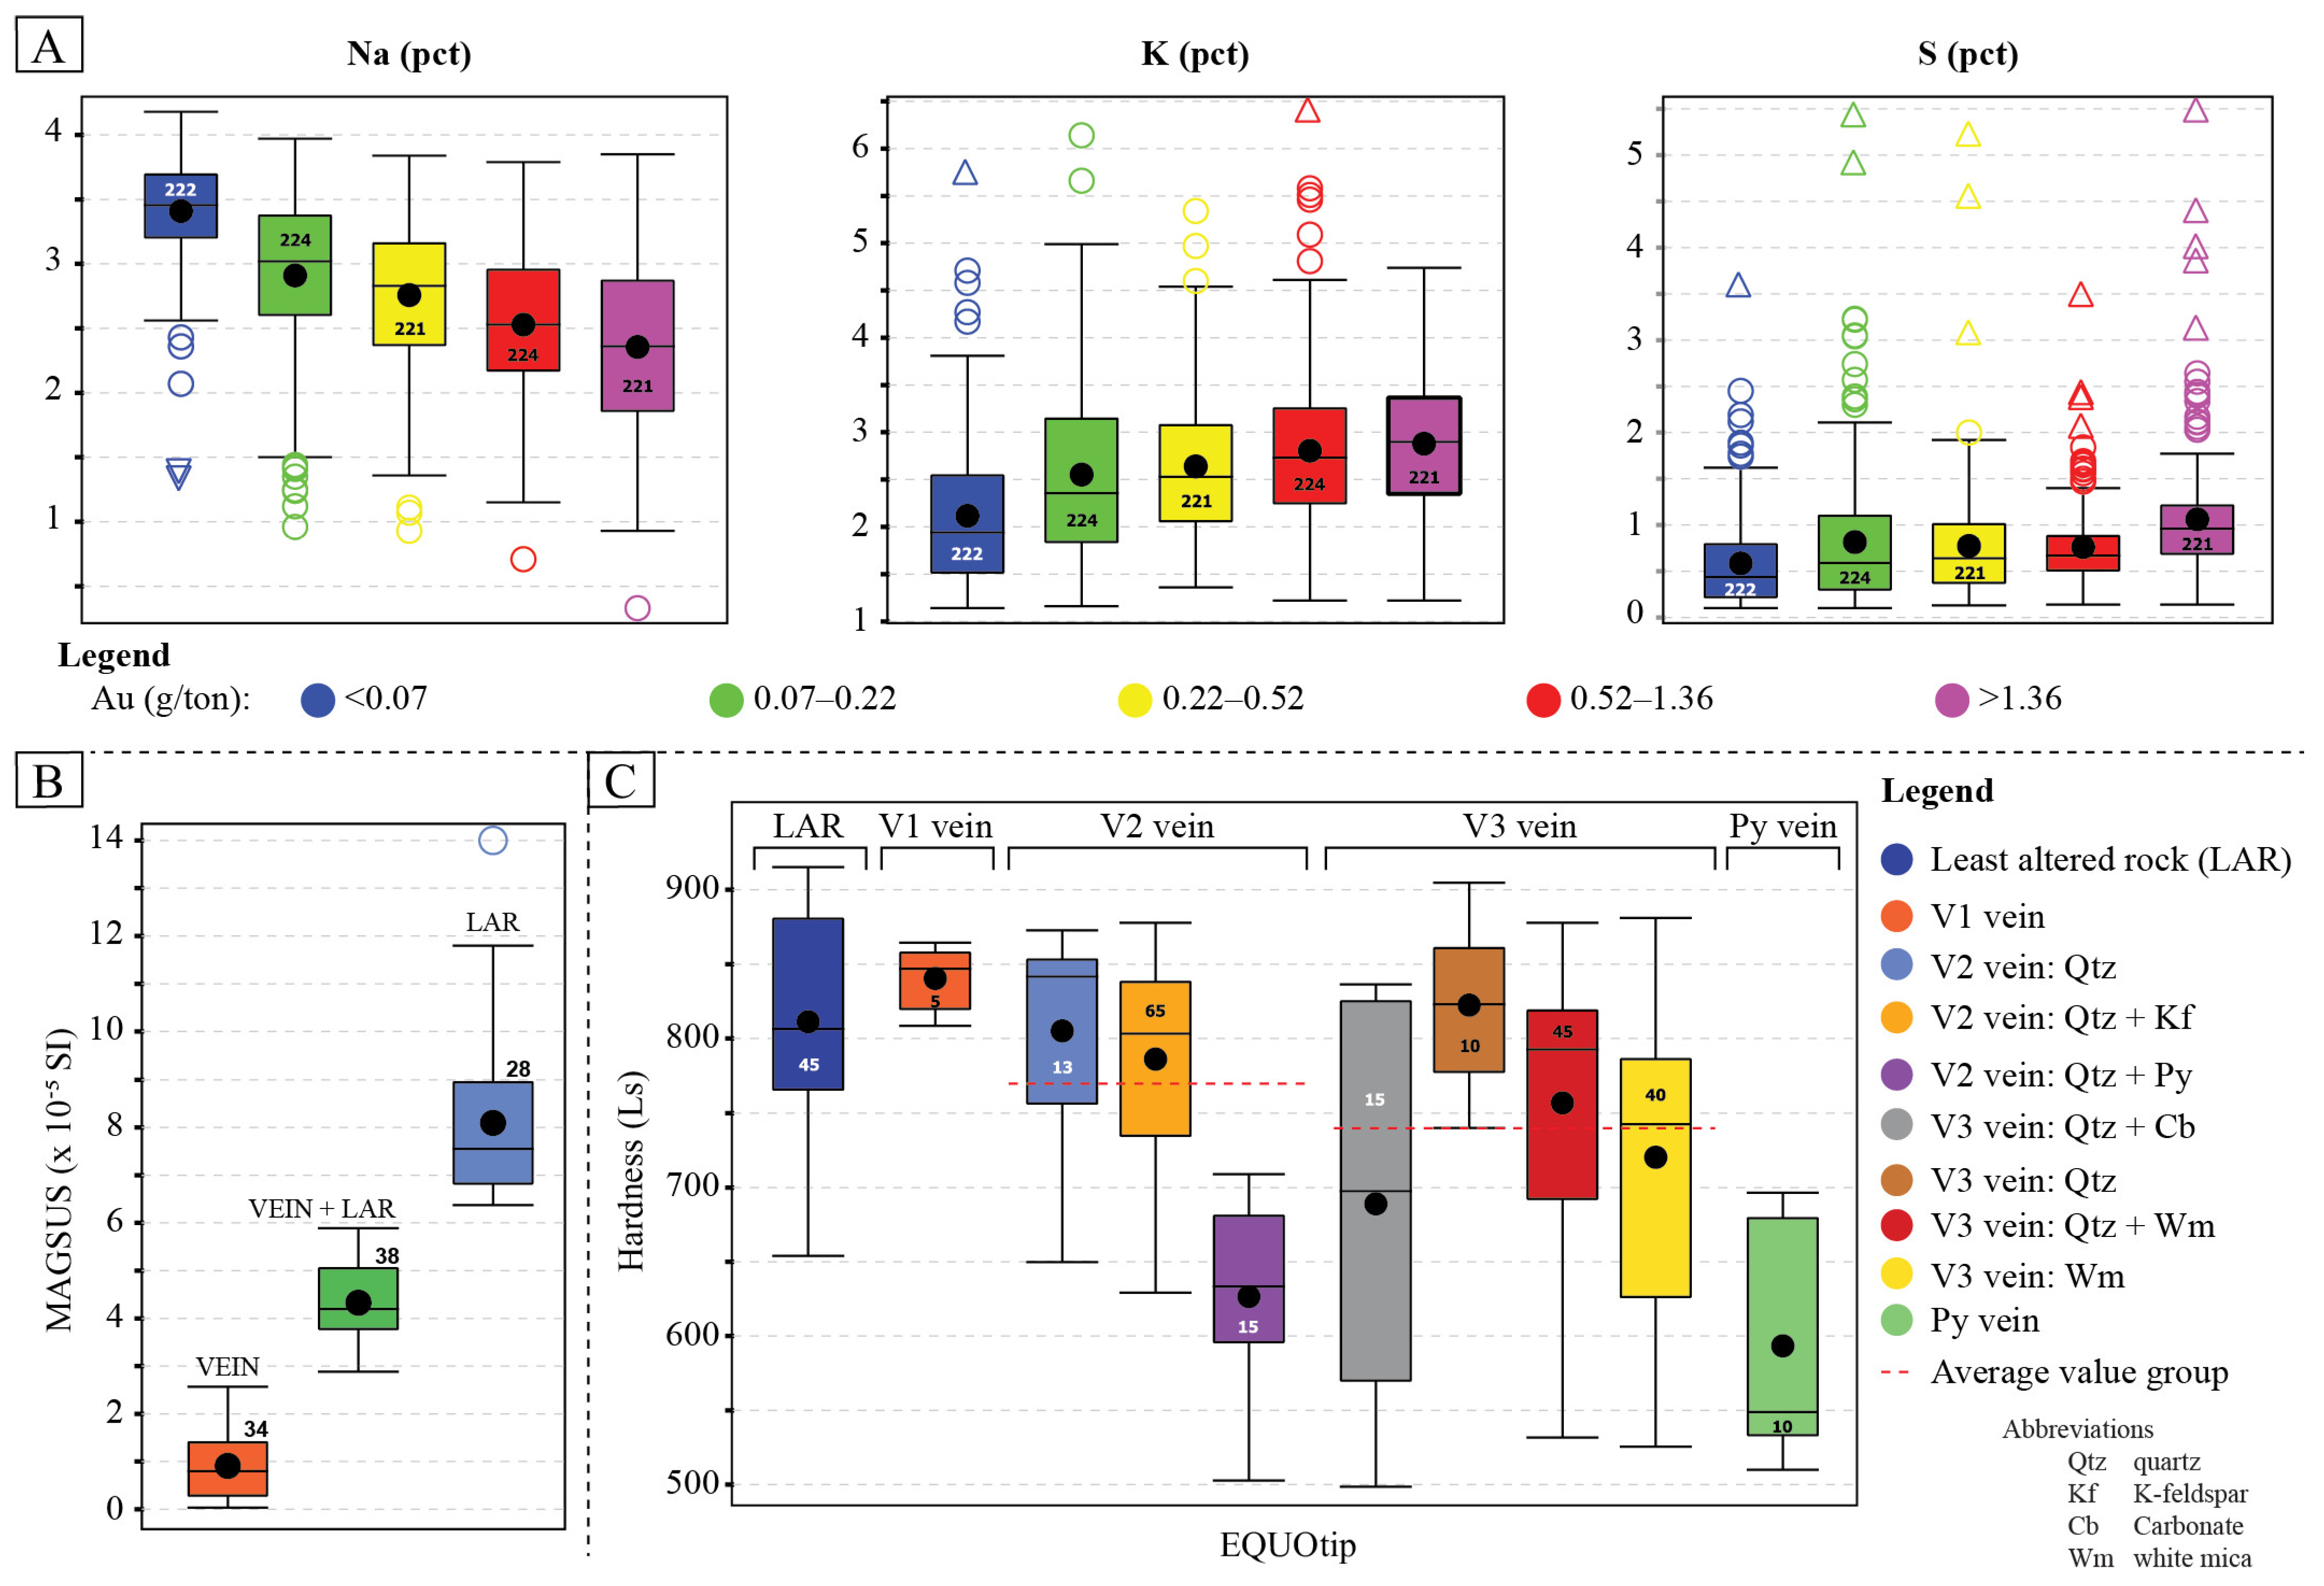
Mineralization is associated with V2 and V3 veins, according to drill core logging and geochemical analyses (Figure 3A). This interpretation is supported by the observed geochemical trends, where gold concentrations increase with potassium content, indicative of K-feldspar- and muscovite-bearing veins typical of V2 and V3. Conversely, the negative correlation between gold and sodium (related to unaltered plagioclase) suggests an association between gold and altered zones. Additionally, the positive correlation between gold and sulfur suggests a close spatial relationship with pyrite, a key sulfide mineral present in these mineralized veins.
Figure 3.
Gramalote geological properties. (A) Geochemical plots showing relationships between Au and Na, K and S. (B) Natural population breaks in magnetic susceptibility data, used to identify textures. (C) Rebound hardness data of point measurements showing differences in hardness for each texture. Note: numbers inside or outside (B) each box indicate the number of samples used to calculate the statistics. The plots are used to visualize relative differences between groups.
Magnetic susceptibility response permitted the discrimination of LAR and altered rock with veins and was used to rapidly identify textures in the drill core (Figure 3B) as described in the analytical methods. The rebound hardness (Ls) of each textural grouping overlaps to a large extent. However, Figure 3C shows that the relative average hardness values for the LAR group are 800 Ls (n = 45; highest rock competency), followed by V2 veins at 770 Ls (n = 93) and V3 veins at 740 Ls (n = 110).
3.2. Telfer West Dome Deposit
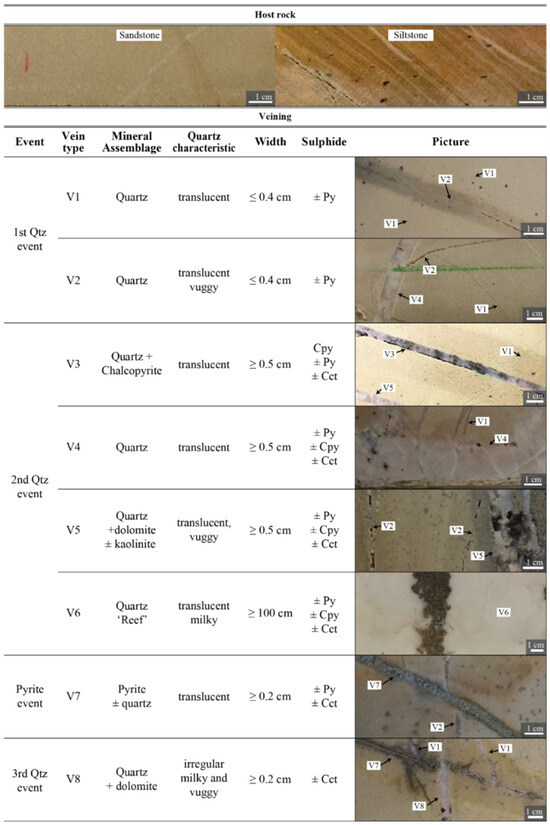
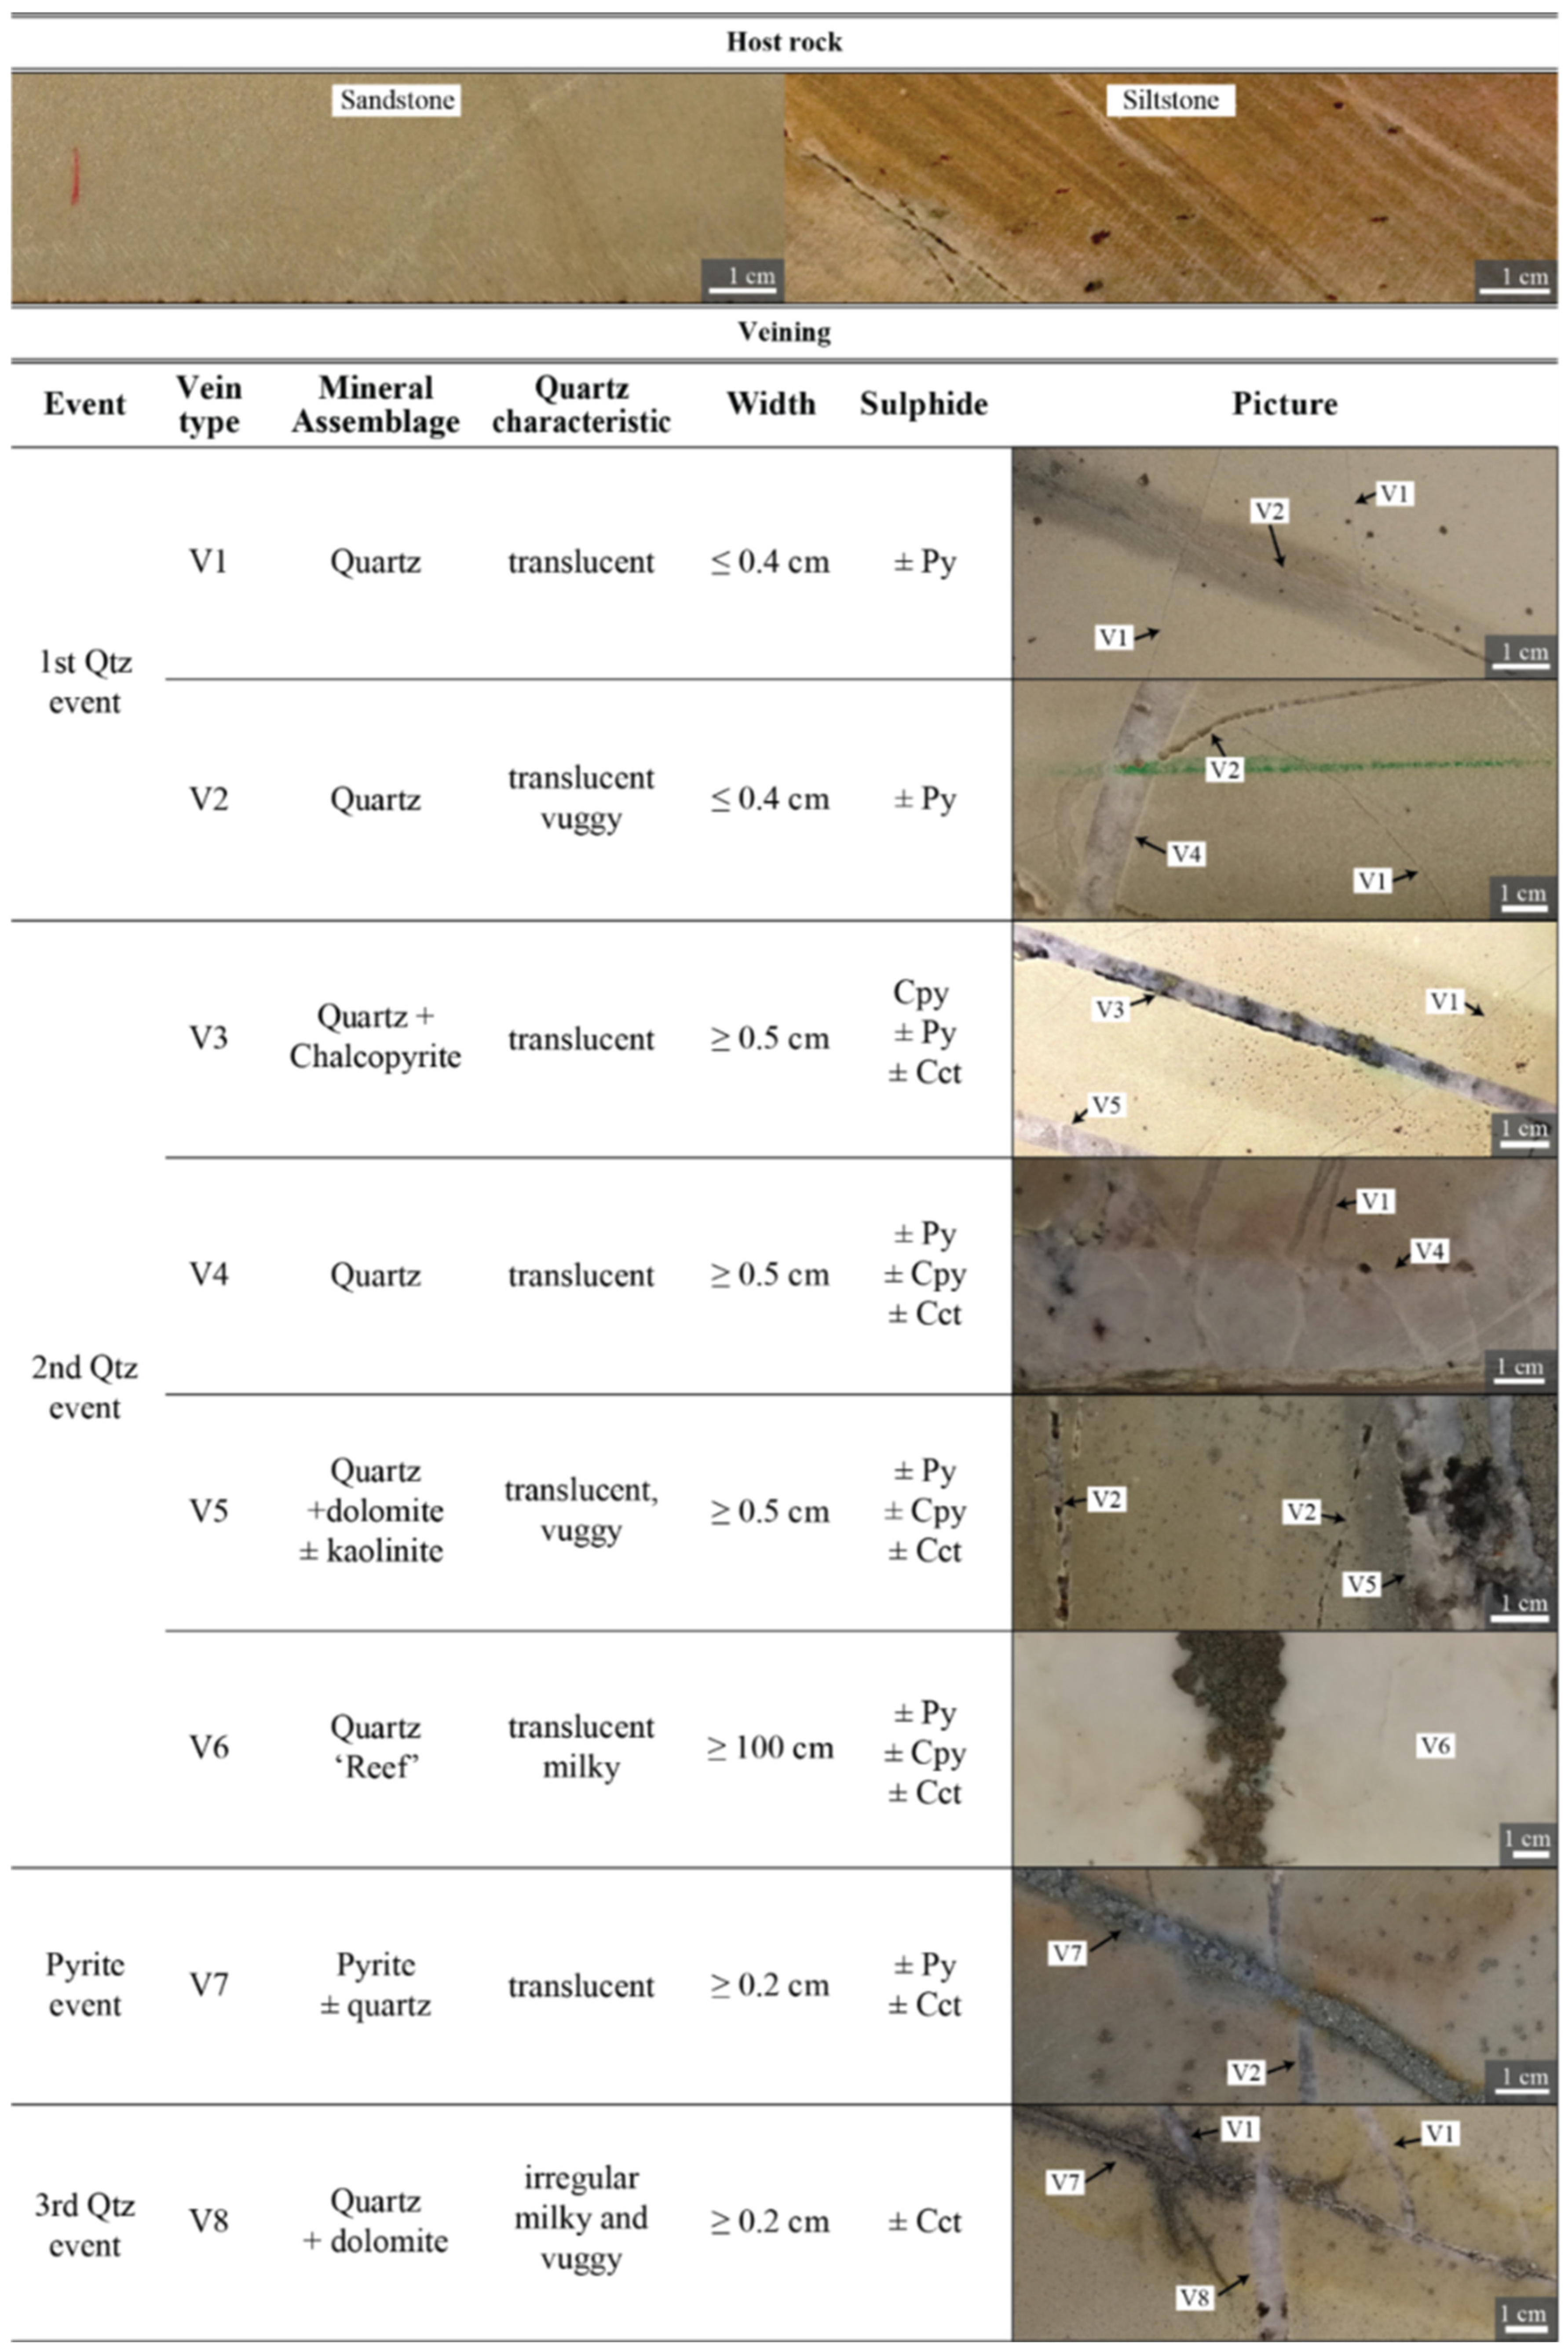
The Telfer WD deposit is also an intrusive related Au system. It is located in the Great Sandy Desert of Western Australia [33,34,35,36,37]. The host rocks comprise two main interbedded lithologies, quartz-rich sandstone and siltstone (Figure 4). The drill core intervals have been classified based on the relative proportions of each lithology in a 2 m interval: (1) sandstone (20 samples), when >75% of the total rock length in the interval is sandstone, (2) sandstone > siltstone (29 samples) when the percentage of sandstone is 50–75% of the total interval length; and (3) sandstone + siltstone (4 samples) when the portion of siltstone is 50% of the total interval length.
Figure 4.
Description of the host rock and different vein types in the Telfer WD deposit drill core samples. The veins are described in apparent time order, from oldest (V1) to youngest (V8). Abbreviations: Qtz—quartz, Py—pyrite, Cpy—chalcopyrite, Cct—chalcocite.
The Telfer WD deposit is characterized, in general, by pyrite-bearing quartz veins, which are millimeter- to meter-sized in thickness and locally present vuggy textures. Figure 4 shows the different types of veins identified in the drill core for this project, where four vein events were identified based on cross-cutting relationships.
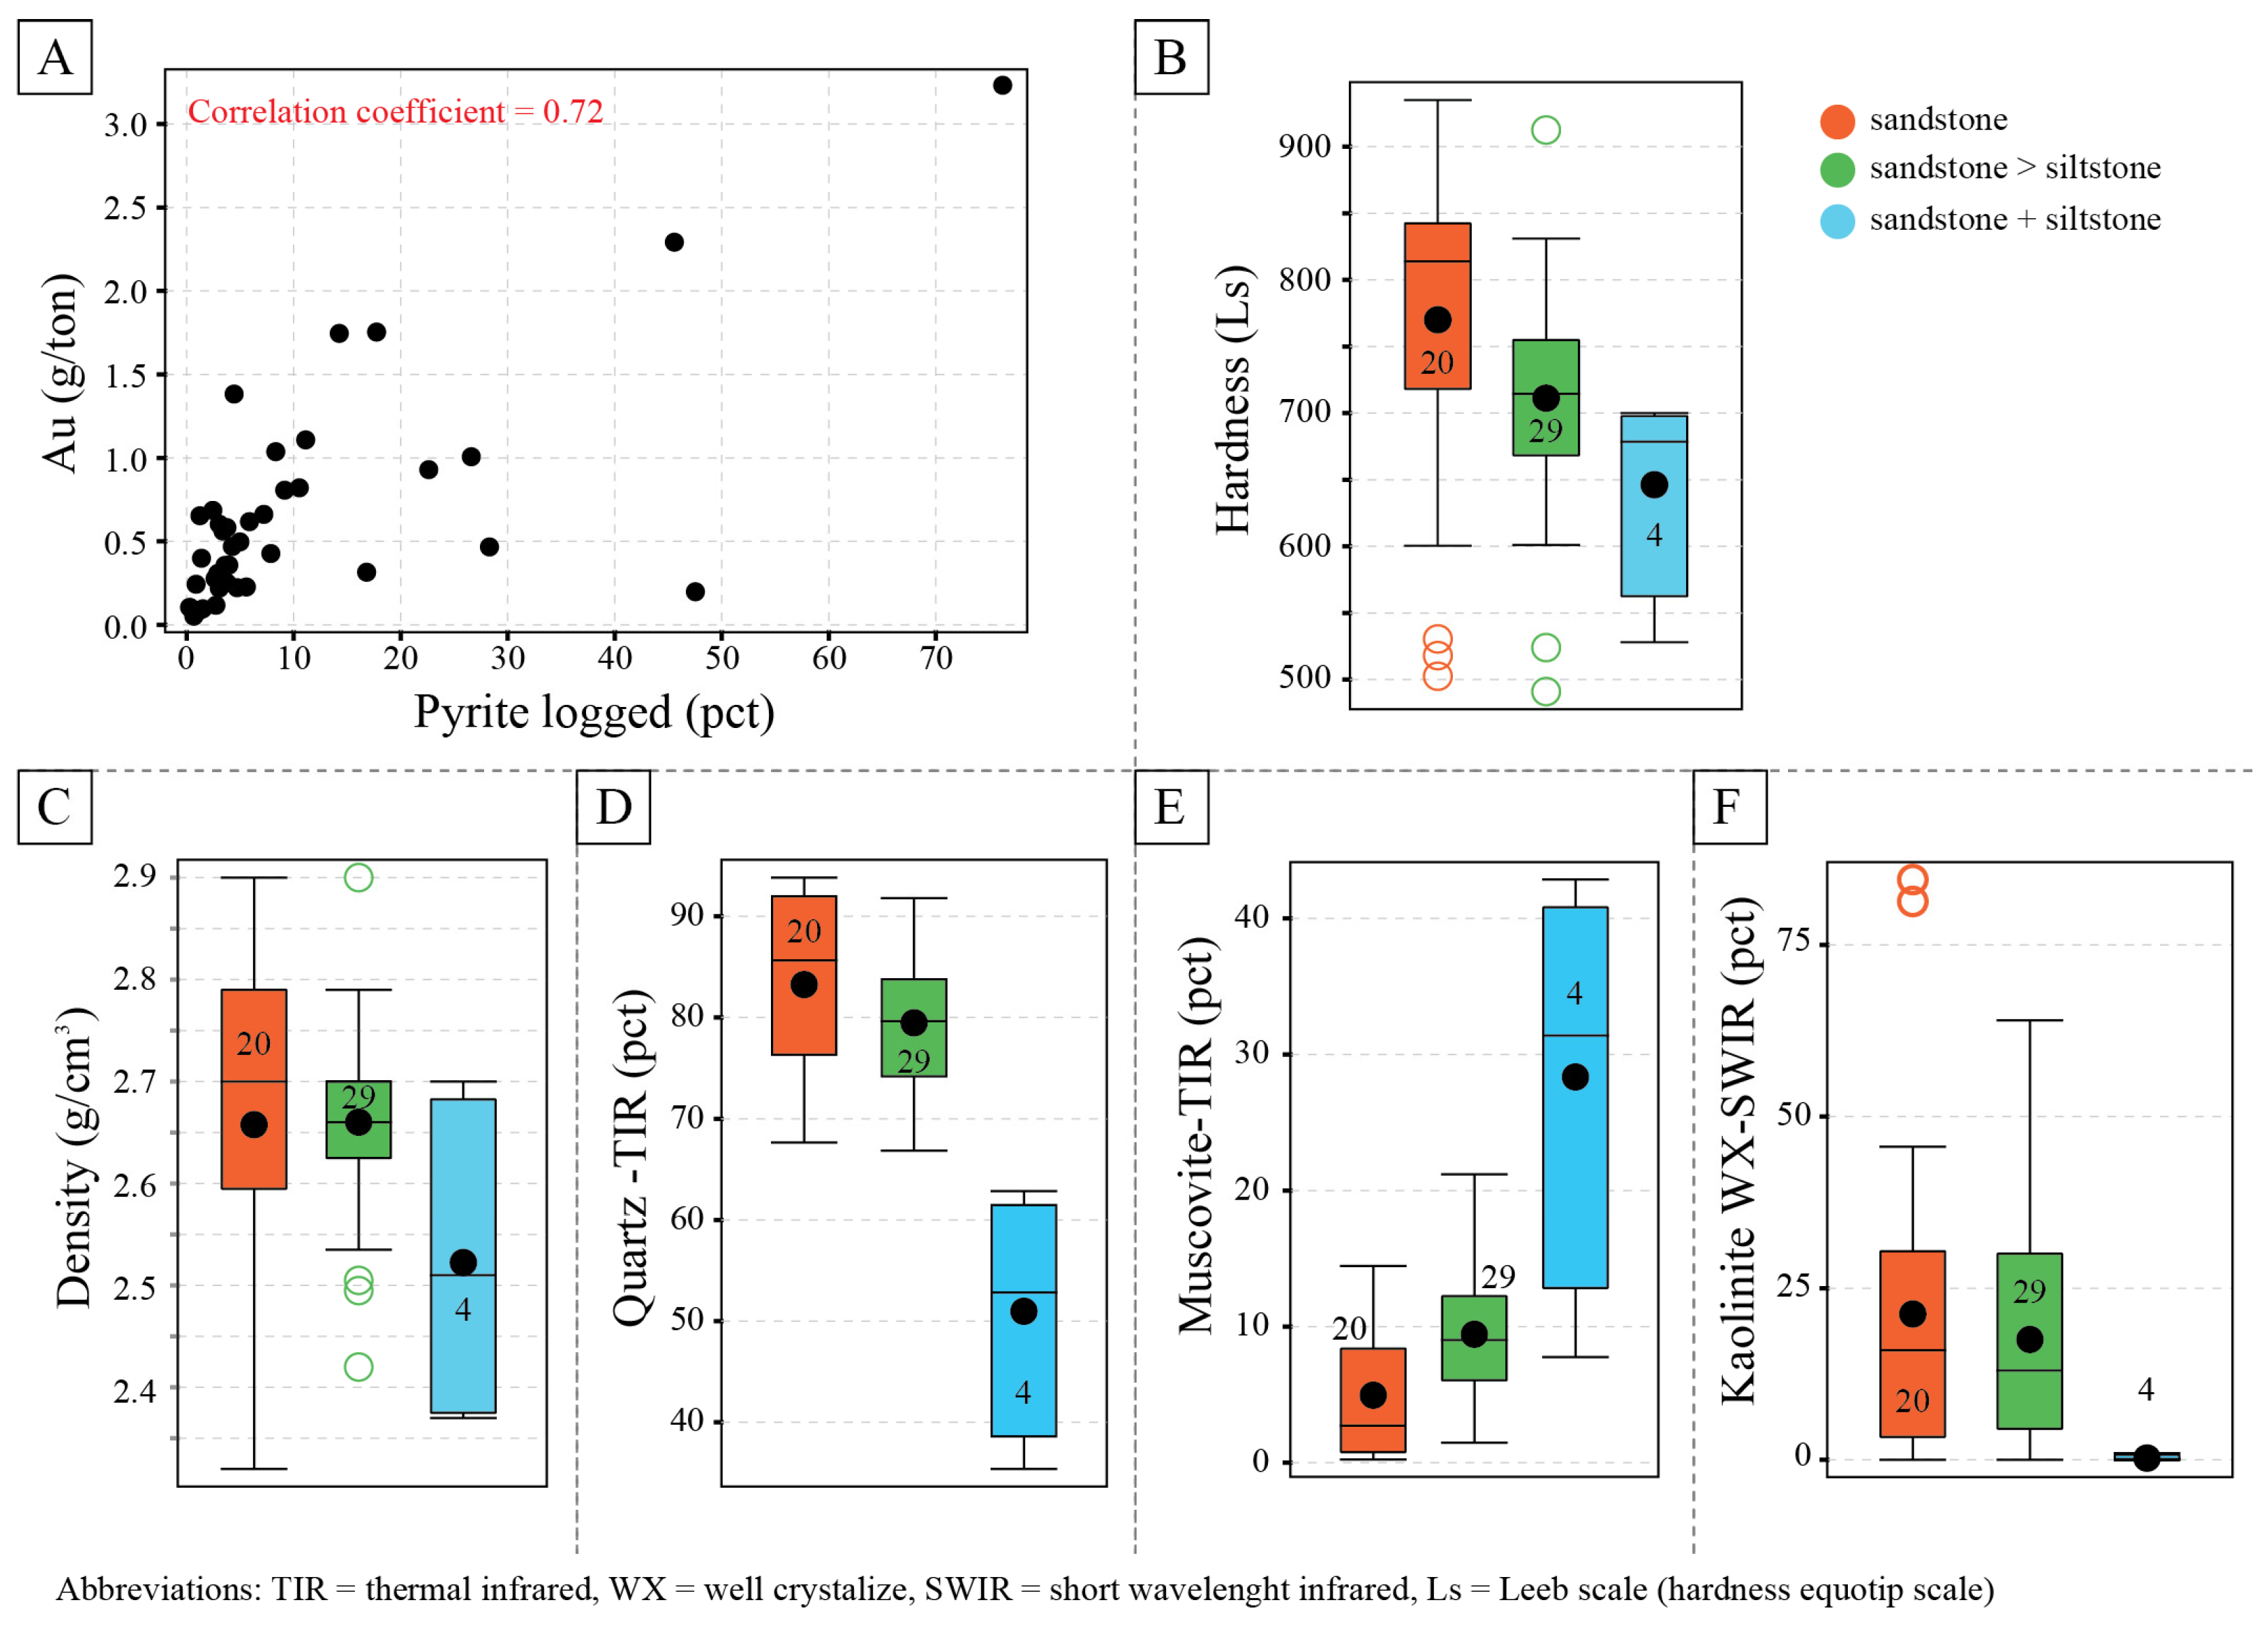
The gold mineralization is associated with pyrite, disseminated in the host rocks and quartz veins. Figure 5A shows the high correlation between gold assays and pyrite percentage estimates. The rebound hardness (Figure 5B) and rock density data (Figure 5C) show that, in general, the higher the sandstone content in the sample, the harder and denser the rock.
Figure 5.
Telfer WD geological properties. (A) Au assay for interval vs. Logged pyrite content. (B) The drill core samples’ rebound hardness. (C) The drill core samples’ density data. (D) Quartz abundance measured from hyperspectral thermal infrared data. (E) Muscovite abundance measured from hyperspectral thermal infrared data. (F) Kaolinite, well-crystallized abundance measured from hyperspectral shortwave infrared data. Note: numbers inside or outside each box indicate the number of samples used to calculate the statistics. The plots are used to visualize relative differences between groups.
The hyperspectral data indicates the host rocks have a high percentage of silica, as reflected in their high quartz content (Figure 5D), which increases with increasing sandstone-component. In addition, the host rock matrix contains phyllosilicates such as white mica (muscovite; Figure 5E) and clay (kaolinite; Figure 5F), as identified in the SWIR and TIR data. Additionally, when the rock contains more siltstone, it shows a higher muscovite content.
4. Analysis of Gold Response Ranking
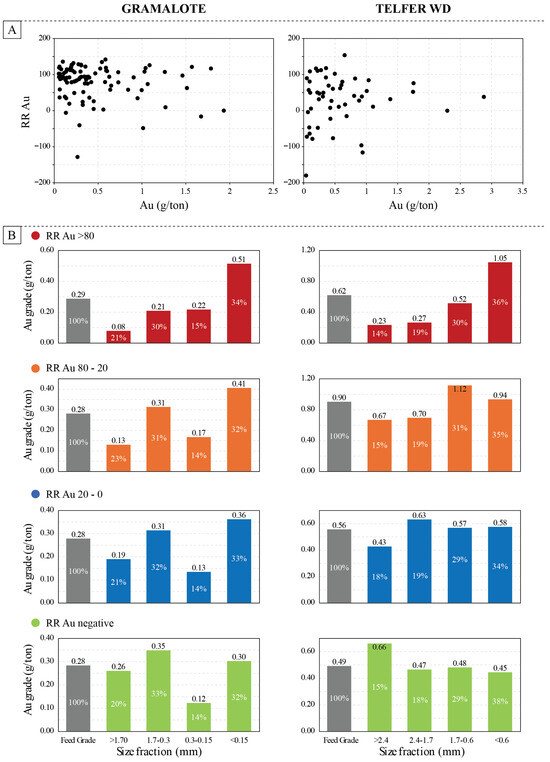
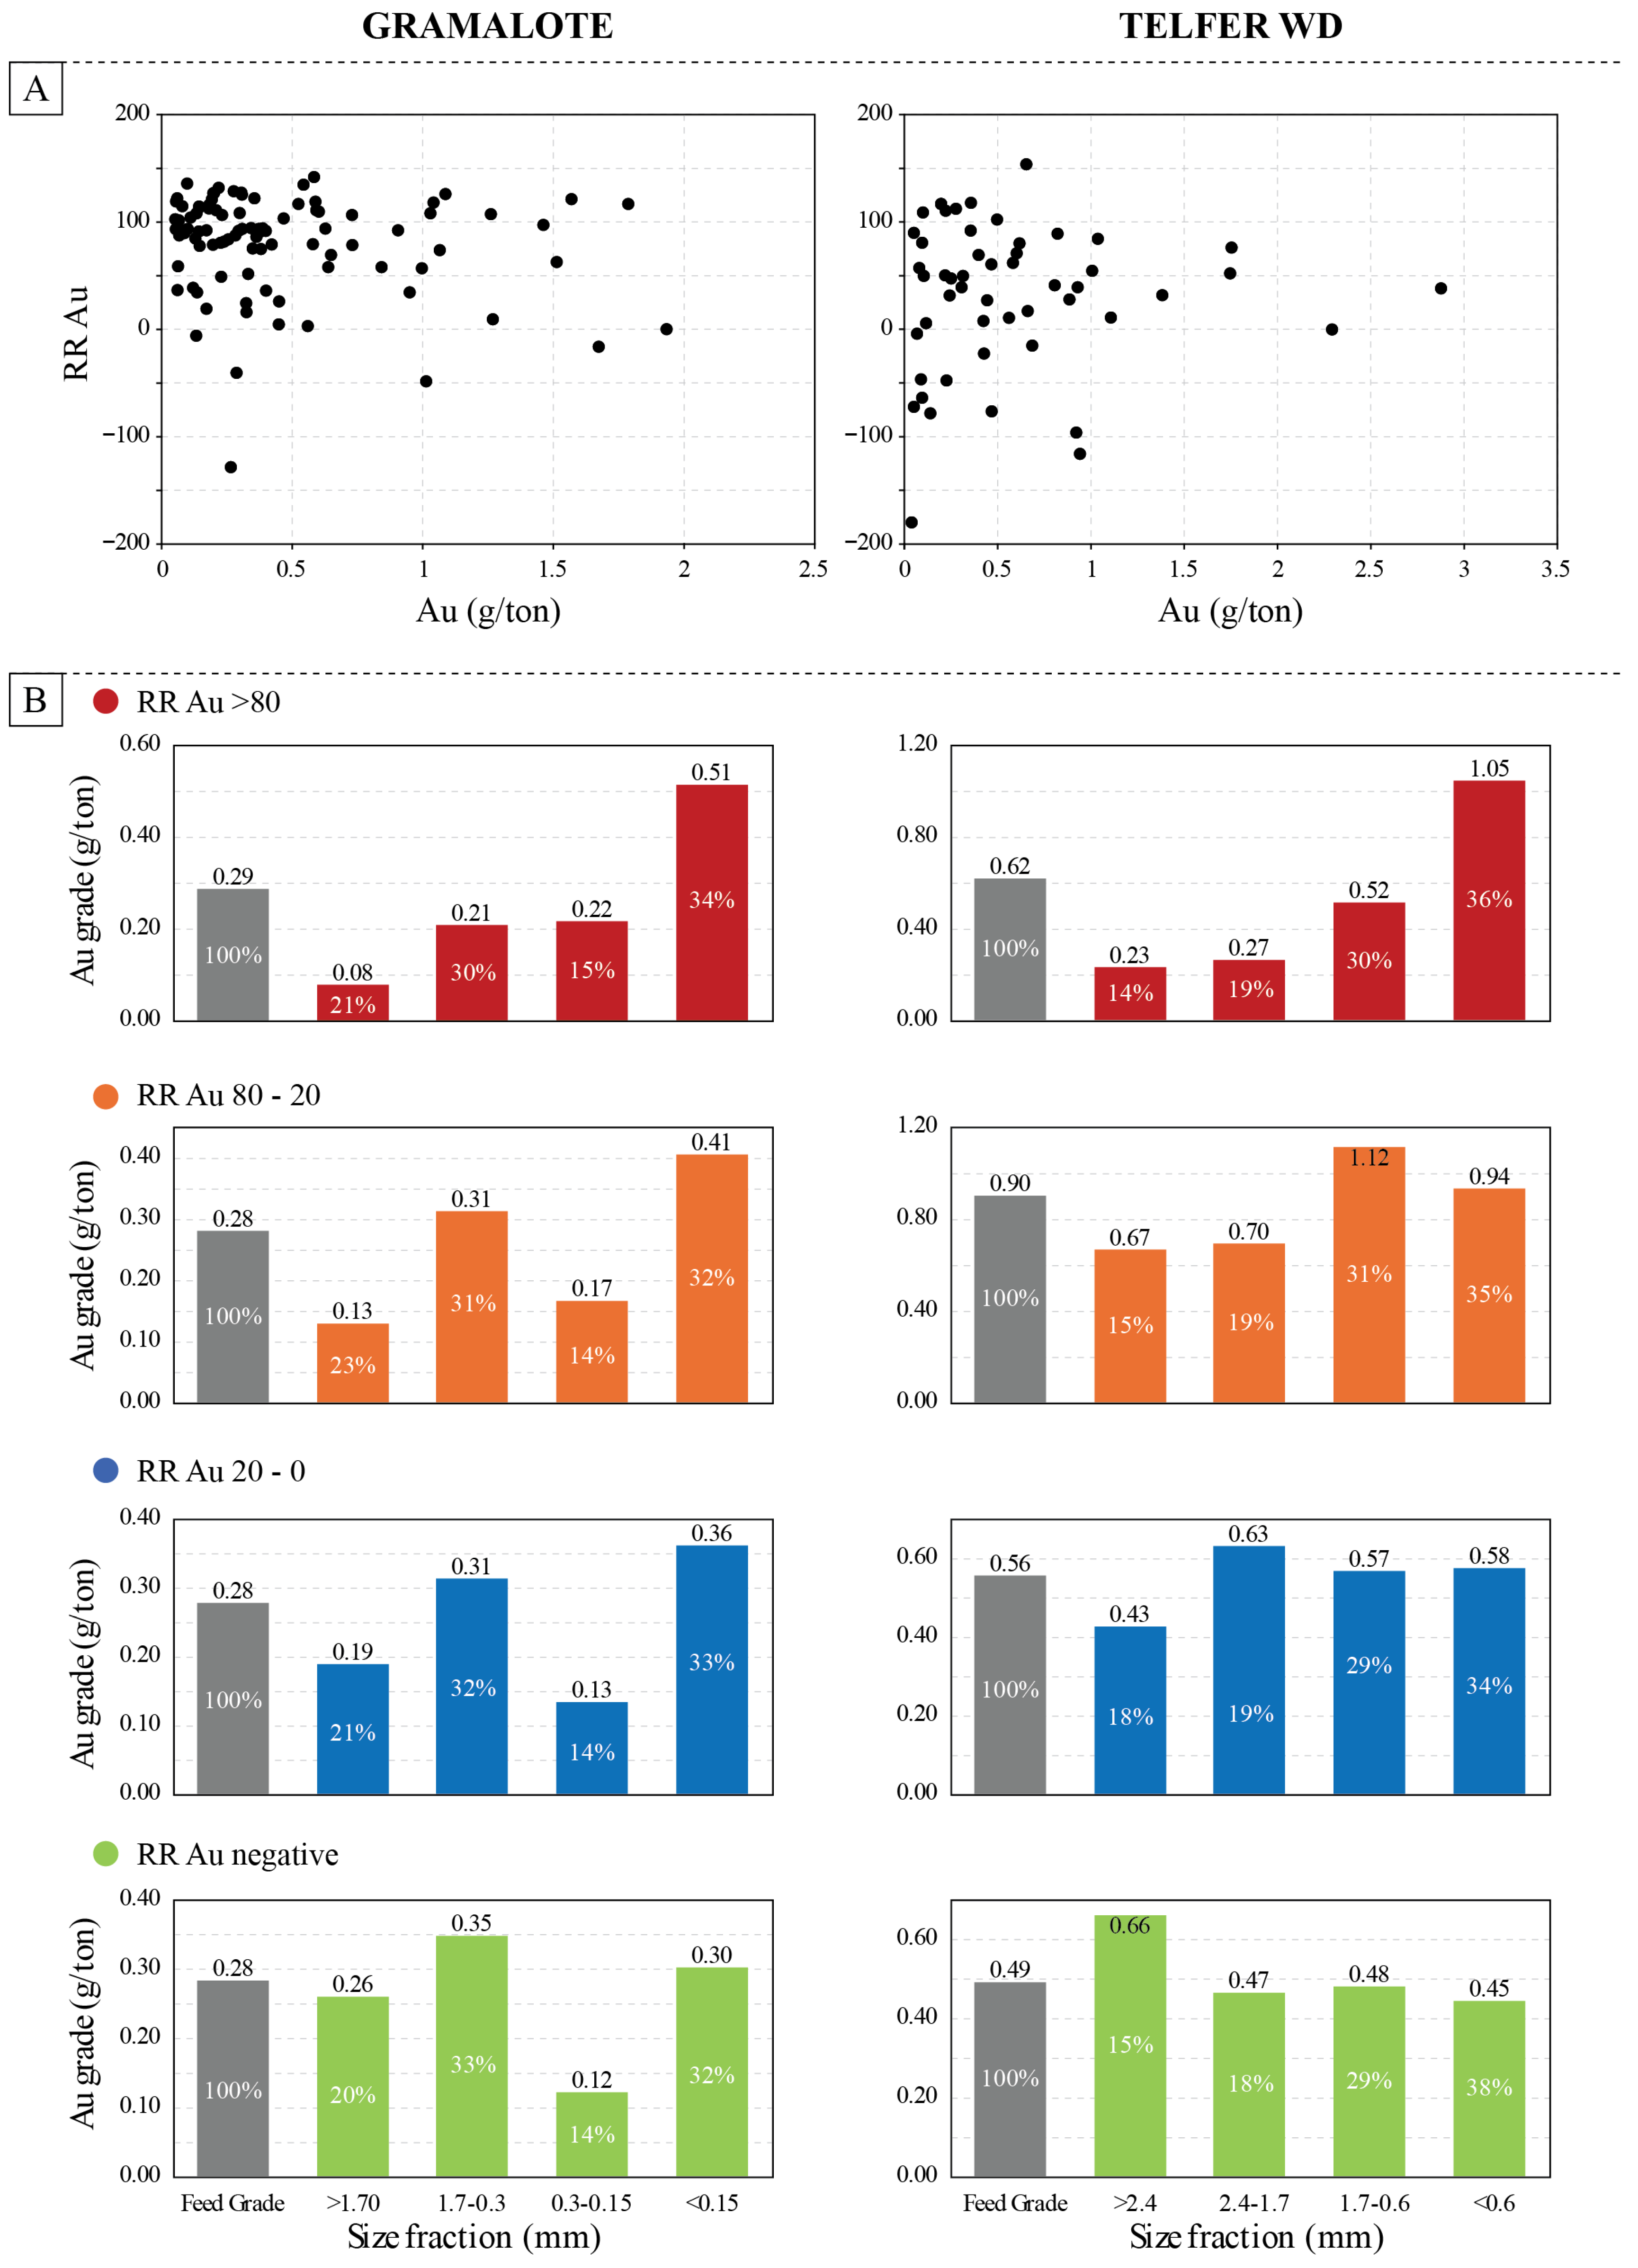
RR Au values do not directly correlate with gold assay values in either of the deposits (Figure 6A); while Figure 6B shows the characteristics of each group. The RR Au >80 group shows how Au increases as particle size decreases; gold preconcentrates towards the finest particles, where taking only 30% of the finest material would almost double the grade. The 80–20 group has intermediate particle sizes that preconcentrate gold. The 20–0 group does not show direct preconcentration, nor is the material preconcentrated. Finally, the group with negative RR values also does not show preconcentration of the material, and in some cases, gold preconcentrates toward the coarser particles. Because there is no direct correlation between RR and gold, integrating geological, geochemical, and petrophysical data is necessary to understand RR Au behavior for each deposit.
Figure 6.
Relationship between gold concentration and Response Ranking. (A) Scatter plot showing the relationship between gold concentration and Response Ranking of Au for both deposits. No correlation is observed. (B) Gold grade-by-size distribution separated into RR groups. White percentage labels inside each histogram indicate the proportion of mass contained in each particle-size fraction.
4.1. Gramalote Data vs. Gold Response Ranking
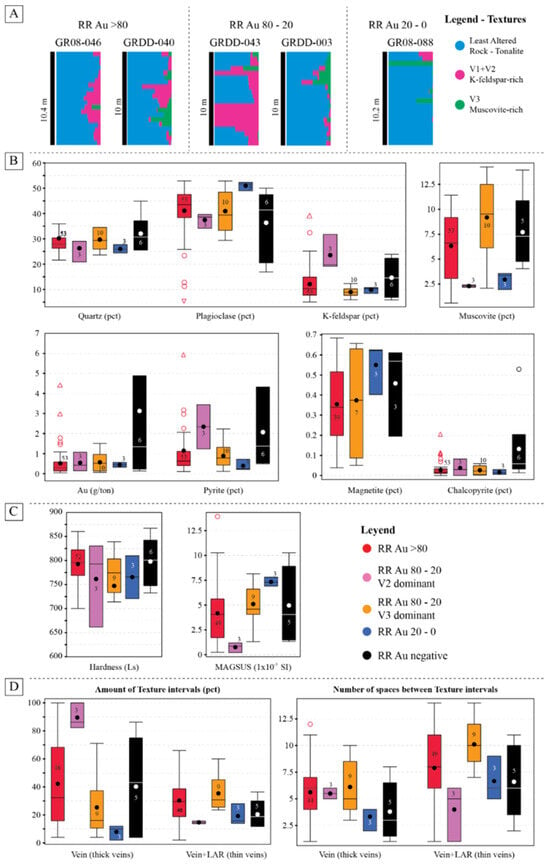
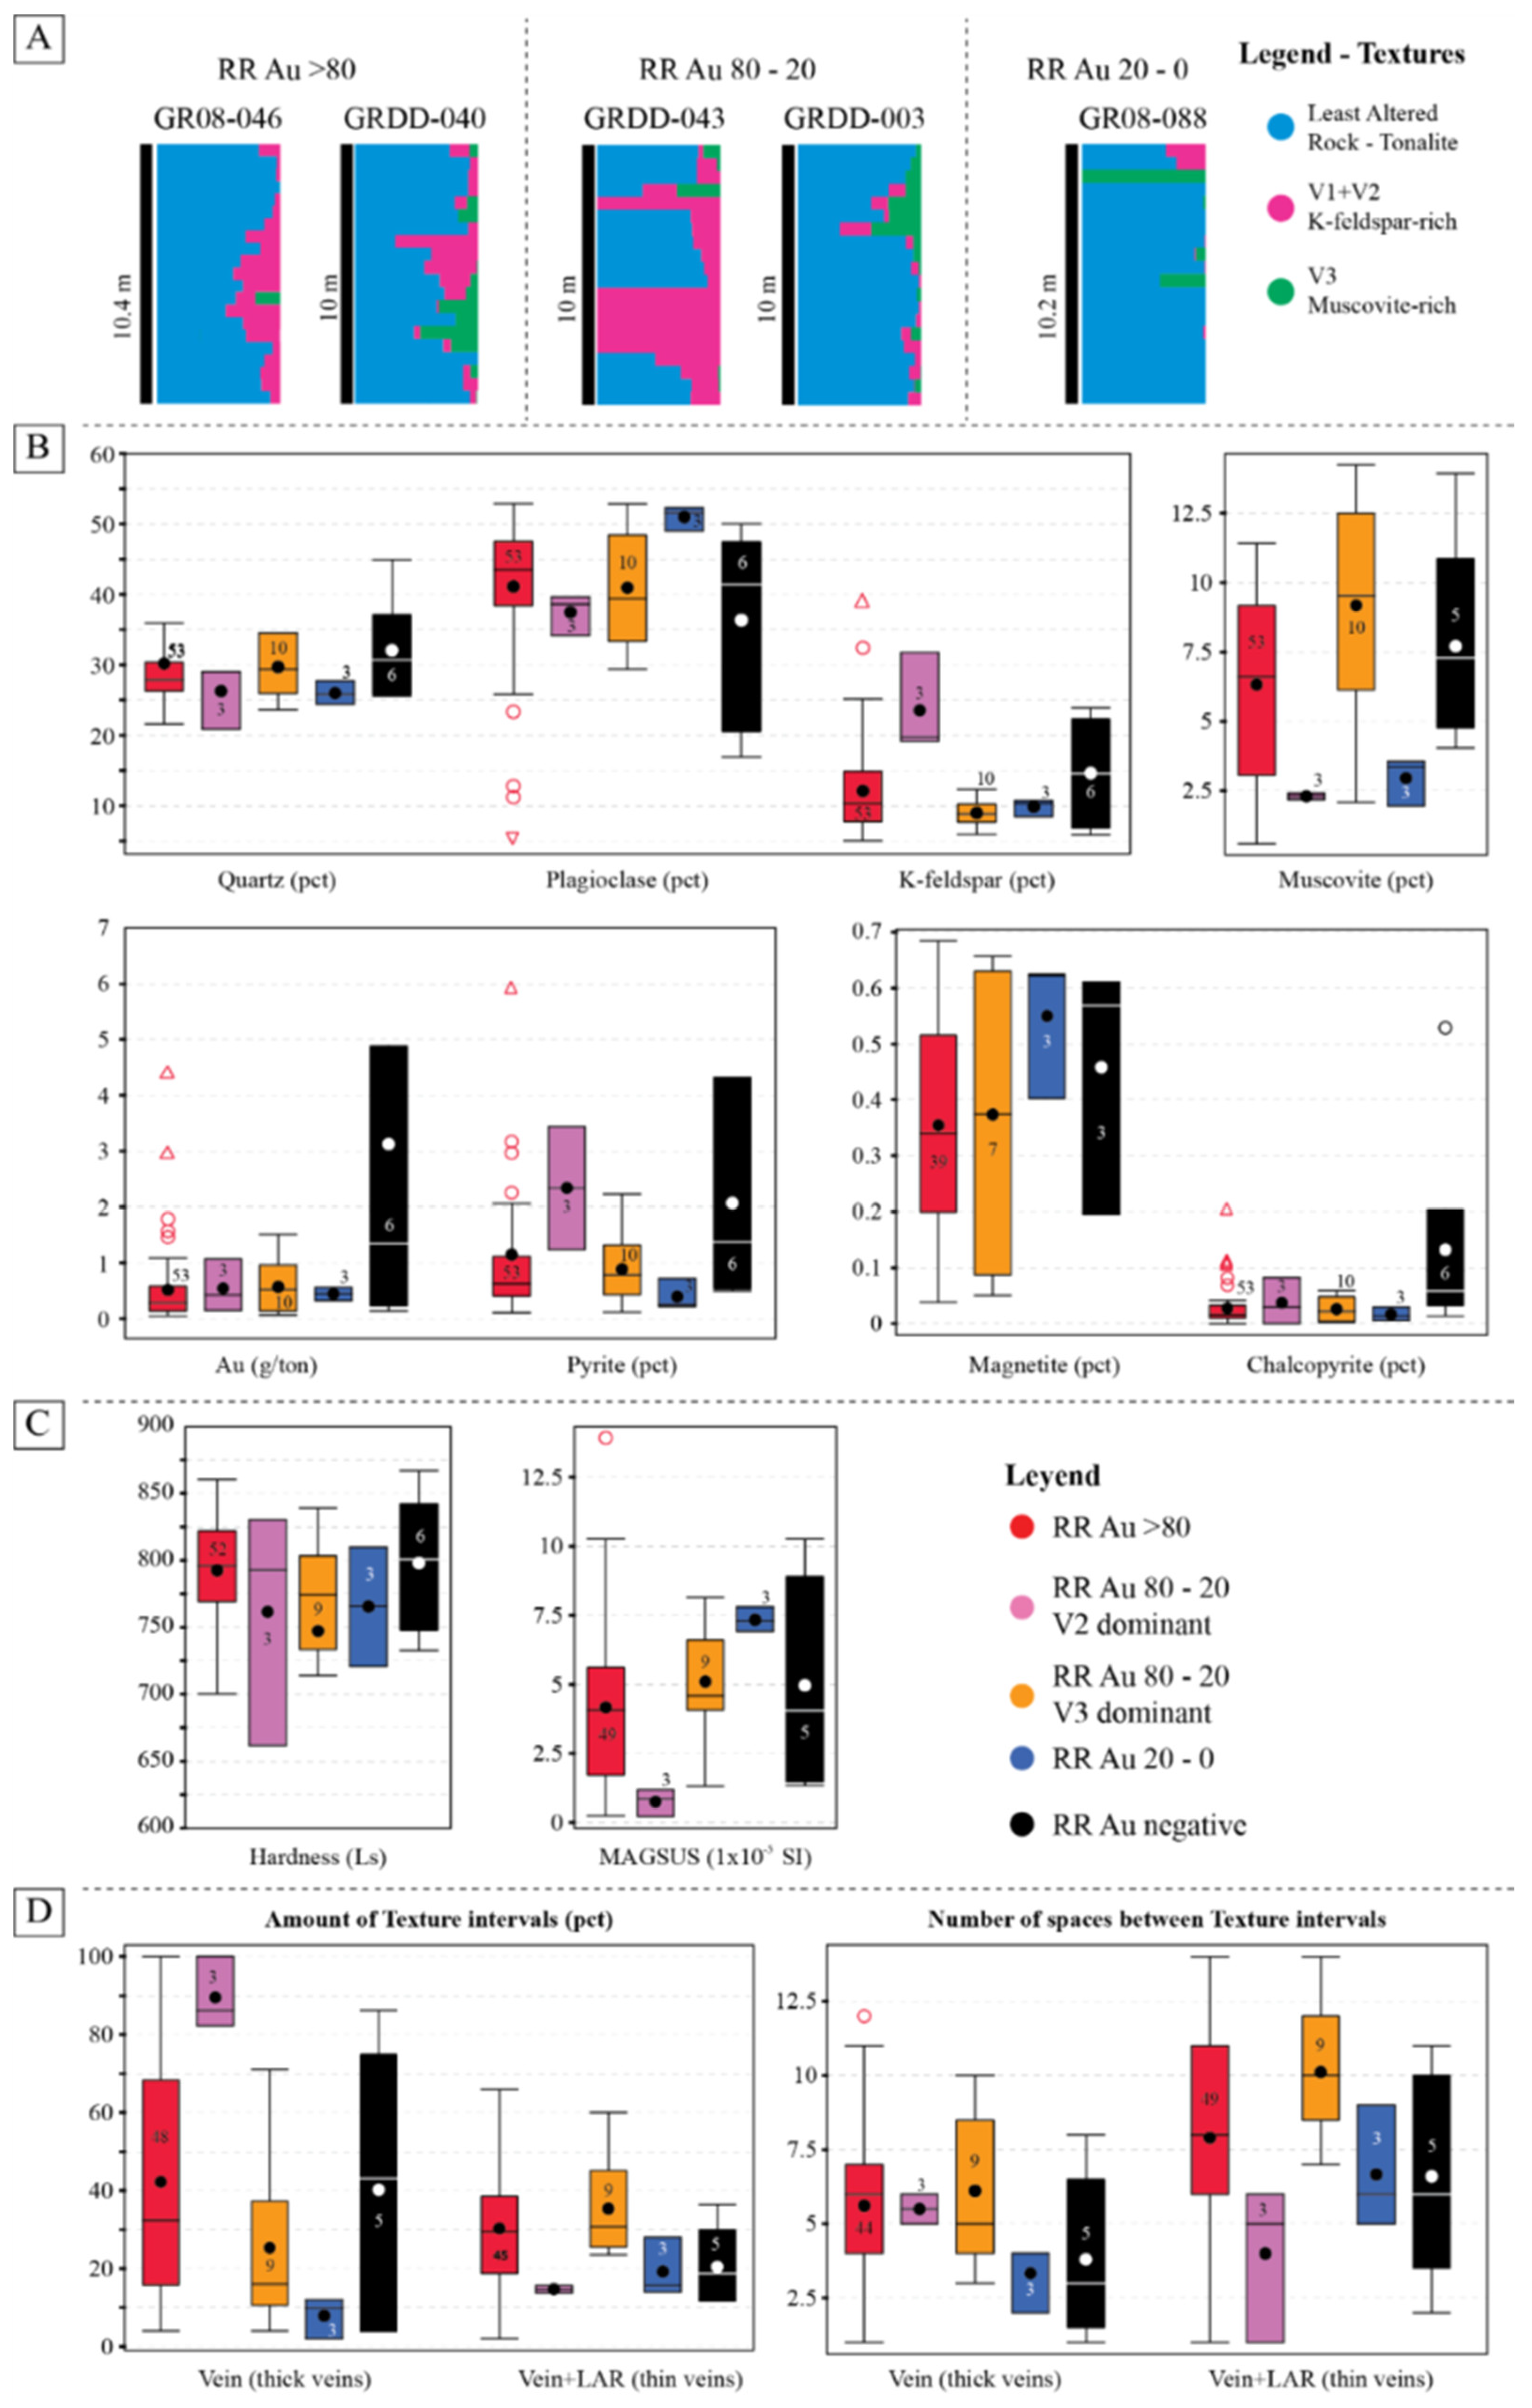
The analysis of geochemical assays, calculated mineralogy, hardness, and magnetic susceptibility data provides a good understanding of the behavior of RR Au, which was compared with the geological characteristics of the drill core samples available for Gramalote (Figure 7). The RR Au values have been divided into four classes (>80; 80–20; 20–0; negative), as described in the introduction. The characteristics of each class are described below, and Table 2 summarizes the main characteristics of each RR Au class.
Figure 7.
Geological and petrophysical data from Gramalote samples compared to Response Ranking Au classes. (A) Representative drill core intervals (n = 4) arranged by RR Au classes, based on detailed geological logging. (B) Comparison of RR Au classes with corresponding geochemical and mineralogical data. (C) Petrophysical properties (e.g., magnetic susceptibility, rebound hardness) of Gramalote samples relative to RR Au. (D) Relationship between vein distribution and textural domains defined by magnetic susceptibility (described in Section 2.2). Magnetic susceptibility values were used to classify intervals into textural domains (LAR, vein + LAR, vein), which allowed mapping how vein frequency and spacing varied among these domains. Note: numbers within boxes indicate the number of samples analyzed for each dataset. The plots are used to visualize relative differences between groups.
Table 2.
Principal features of RR Au classes for Gramalote and Telfer WD deposit samples.
4.1.1. RR Au >80
This class is characterized by hard host rocks, i.e., least altered intrusive rocks (LAR, Figure 7A). Mineralogically, the rock has high quartz (~30.20%) and plagioclase (~41.13%) contents, along with minor magnetite (~0.26%) (Figure 7B). Potassic feldspar is moderately present (~12.13%), while muscovite is relatively abundant (~5.97%), indicating the presence of both V2 (K-feldspar-rich) and V3 (muscovite-rich) veins (Figure 7B). Pyrite occurs in intermediate amounts (~1%), with low chalcopyrite content (~0.03%). As gold is primarily associated with pyrite, the overall gold grade is low (~0.5 g/ton; Figure 7B).
The rock exhibits high rebound hardness (~796 Ls) and intermediate magnetic susceptibility (~4 × 10⁻⁵ SI; Figure 7C). Vein distribution is extensive, with samples containing an average of ~5 intervals with thick veins (Figure 7D: ‘Vein’) and ~7 intervals with thin veins (Figure 7D: ‘Vein + LAR’), resulting in moderate overall vein material content (~42% from intervals with thick veins and ~30% from intervals with thin veins). Veins are well distributed along the drill core intervals (Figure 7A: veins throughout all intervals), as supported by the high number of spacing transitions between vein textures (Figure 7D).
4.1.2. RR Au 80 to 20
This class is subdivided into two subclasses:
- Subclass 1:
Characterized by an increase in V2 veins (Figure 7A: GRDD-043), reflected in elevated potassium levels (~23%). These veins are rich in pyrite (~2%) and contain intermediate levels of chalcopyrite (~0.04%; Figure 7B). Gold mineralization remains low (~0.5 g/ton) despite the presence of V2 veins and high pyrite content, which are typically associated with mineralized zones. This suggests that the V2 veins in this case contain more K-feldspar selvage than quartz mineralized vein material.
A decrease in V3 vein abundance results in lower muscovite content (~2.3%). The intense alteration is associated with a reduction in magnetite (not detected; magnetic susceptibility ~0.75 × 10⁻⁵ SI; Figure 7C) and plagioclase (~37.48%). Quartz (~26.3%) and plagioclase contents are intermediate, contributing to an overall intermediate hardness (~761 Ls; Figure 7C). The V2 veins form an extensive stockwork concentrated in specific core sections, as illustrated in the GRDD-043 schematic (Figure 7A). Vein distribution is also reflected in Figure 7D, where thick veins represent a high proportion of intervals (~90% of the ‘vein’ category), with low spacing between them (~6 intervals; Figure 7D).
- Subclass 2:
This class is characterized by an increase in V3 veins, as indicated by the elevated muscovite content (~9.18%; Figure 7B). Gold content remains low (~0.6 g/ton), likely due to the limited gold associated with V3 veins. These veins contain less pyrite (~0.8%) and contain low levels of chalcopyrite (~0.02%; Figure 7B). Rock hardness decreases (~747 Ls; Figure 7C), likely reflecting the increased presence of muscovite, a relatively soft mineral (2.5 on the Mohs scale). Magnetic susceptibility is intermediate to high (~5.1 × 10⁻⁵ SI), suggesting an increase in LAR. V3 veins are well-distributed throughout the section (Figure 7A: GRDD-003), as reflected by the high spacing (~10 intervals) between thin veins (Figure 7D). V2 veins are also present but occur as thin, evenly distributed structures (Figure 7A: GRDD-003).
4.1.3. RR Au 20 to 0
The 20 to 0 class is primarily characterized by a high proportion of unaltered rock, as indicated by elevated plagioclase (~51%) and magnetite (~0.51%) contents, along with higher magnetic susceptibility (~7.34 × 10⁻⁵ SI; Figure 7A). The rock exhibits intermediate hardness (~765 Ls), consistent with its tonalitic composition (Figure 7C). Gold, pyrite and chalcopyrite contents are low (~0.4 g/ton, ~0.4%, ~0.02%, respectively), reflecting limited mineralization (Figure 7B). The few veins observed are predominantly muscovite-rich (V3; Figure 7A: GR08-088) and are sparsely distributed. This is supported by Figure 7D, which shows a low number (<30%) of vein intervals and minimal spacing (~4) between both thick and thin veins.
4.1.4. RR Au Negative
The negative class is characterized by high-grade zones with elevated gold (~3.12 g/ton), pyrite (≥2%), and chalcopyrite (≥0.13%) content, indicating increased copper presence. The rocks contain an intermediate to high amount of V2 veins, which are high-grade, along with V3 veins that are medium to low-grade. This is supported by high potassium (~14.65%) and muscovite (~7.7%) content. The rebound hardness is relatively high (~798 Ls) due to increased quartz (~32%) veins, as depicted in Figure 7B,C. Magnetic susceptibility is intermediate (~4.96 × 10⁻⁵ SI), indicating that some unaltered zones with good magnetic properties remain. Figure 7D shows a high content of thick veins, but poor distribution with low spacing (~4) between thick veins.
4.2. Gramalote Bulk Sample Data vs. Gold Response Ranking
As described in Section 2.1, the bulk samples were examined to understand the breakage behavior of rocks from Gramalote deposit after blasting. These samples were collected from an underground gallery, where the rock was previously sampled and analyzed for its RR value. The samples from the uncrushed ROM correspond to the RR Au >80 class, allowing for detailed observation of how rock breakage varies according to vein type, thickness, and alteration intensity.
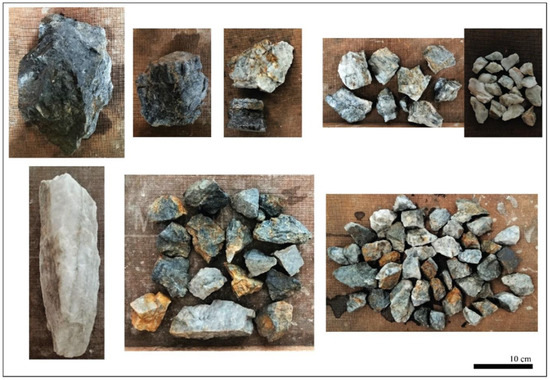
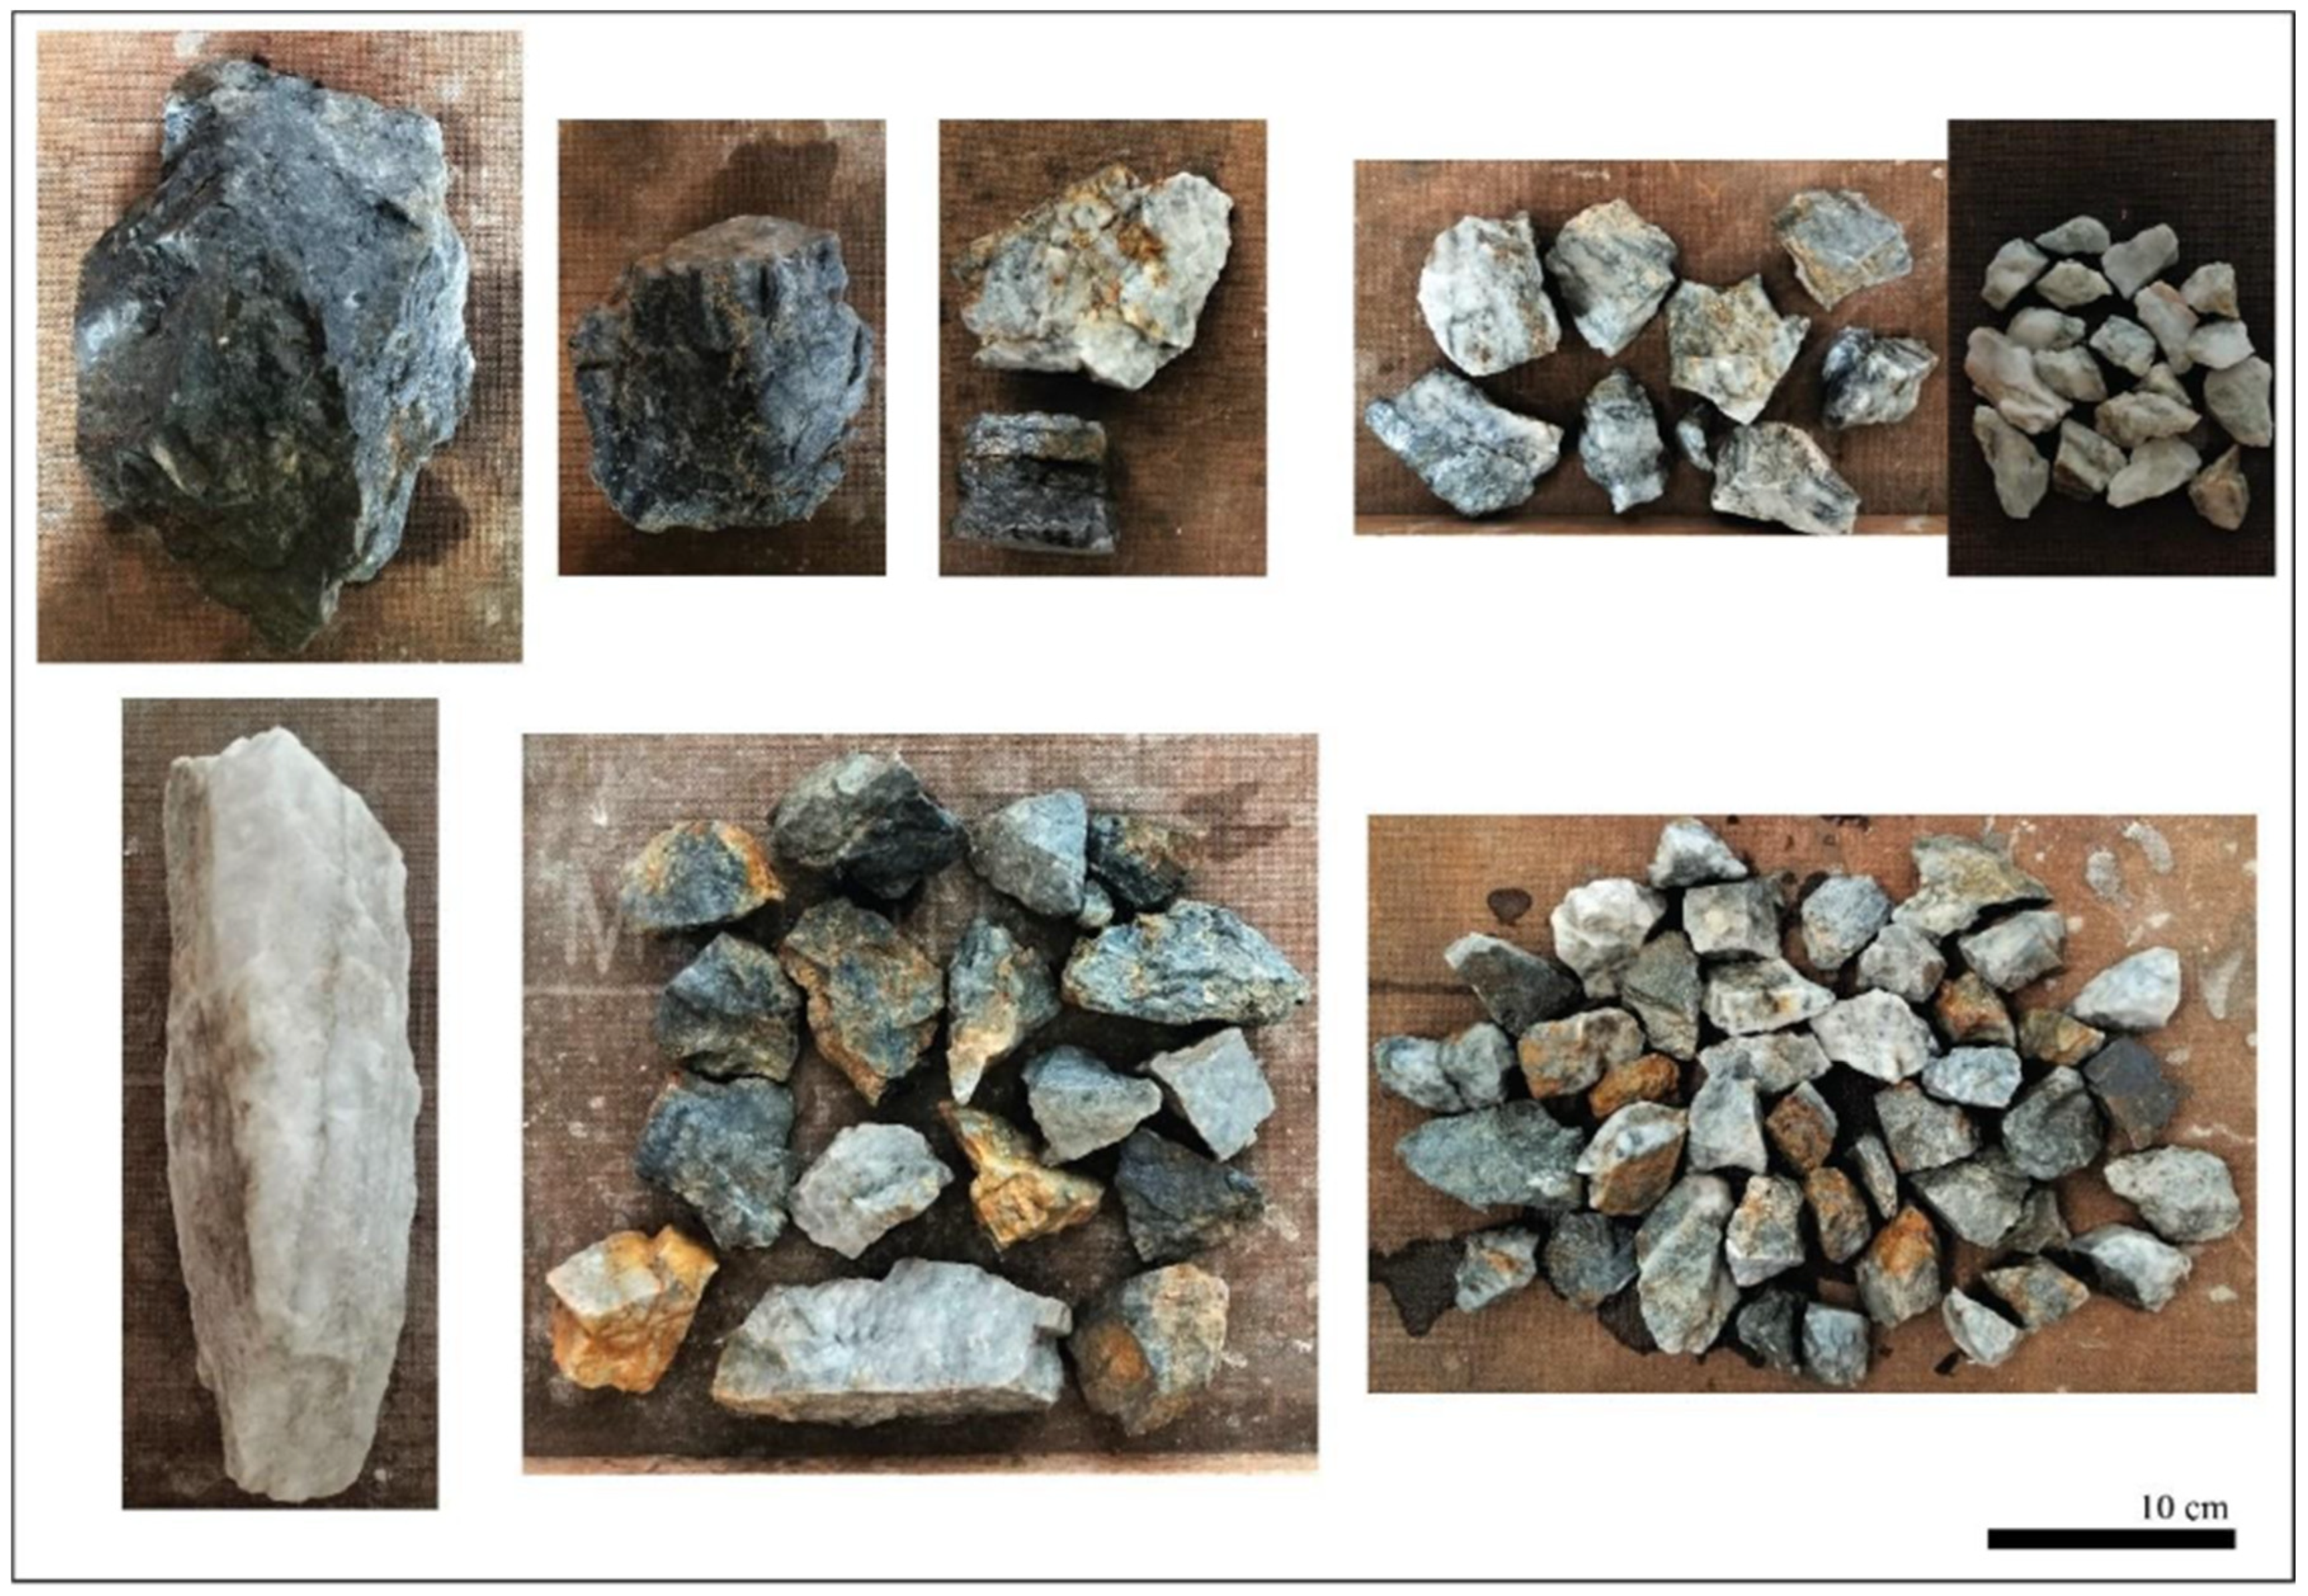
The primary veins identified are V2, composed of quartz with K-feldspar selvage, and V3, composed of quartz with white mica selvage. The way of breakage depends on the quartz vein thickness and the alteration intensity of the selvage. In high-grade zones with thick quartz veins, the rock tends to break into large fragments dominated by quartz, using the connection between microfractures that the quartz vein presents. It makes it difficult to distinguish whether the vein was V2 or V3 (Figure 8).
Figure 8.
Examples of ‘quartz’ category from Gramalote bulk sample. Although some fragments show fine sulfides or iron-oxide staining, quartz is the dominant vein mineral.
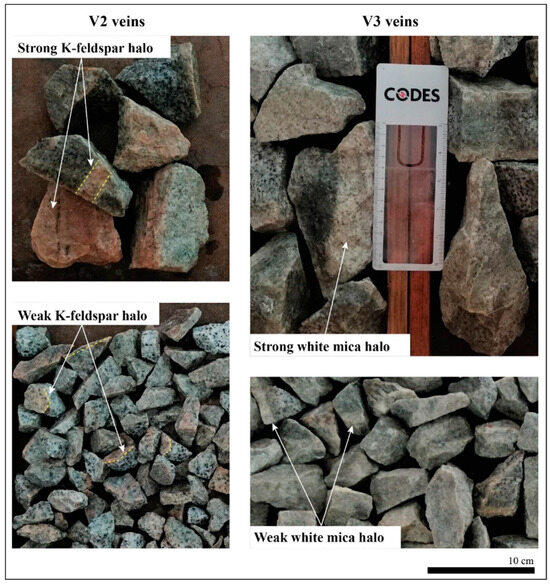
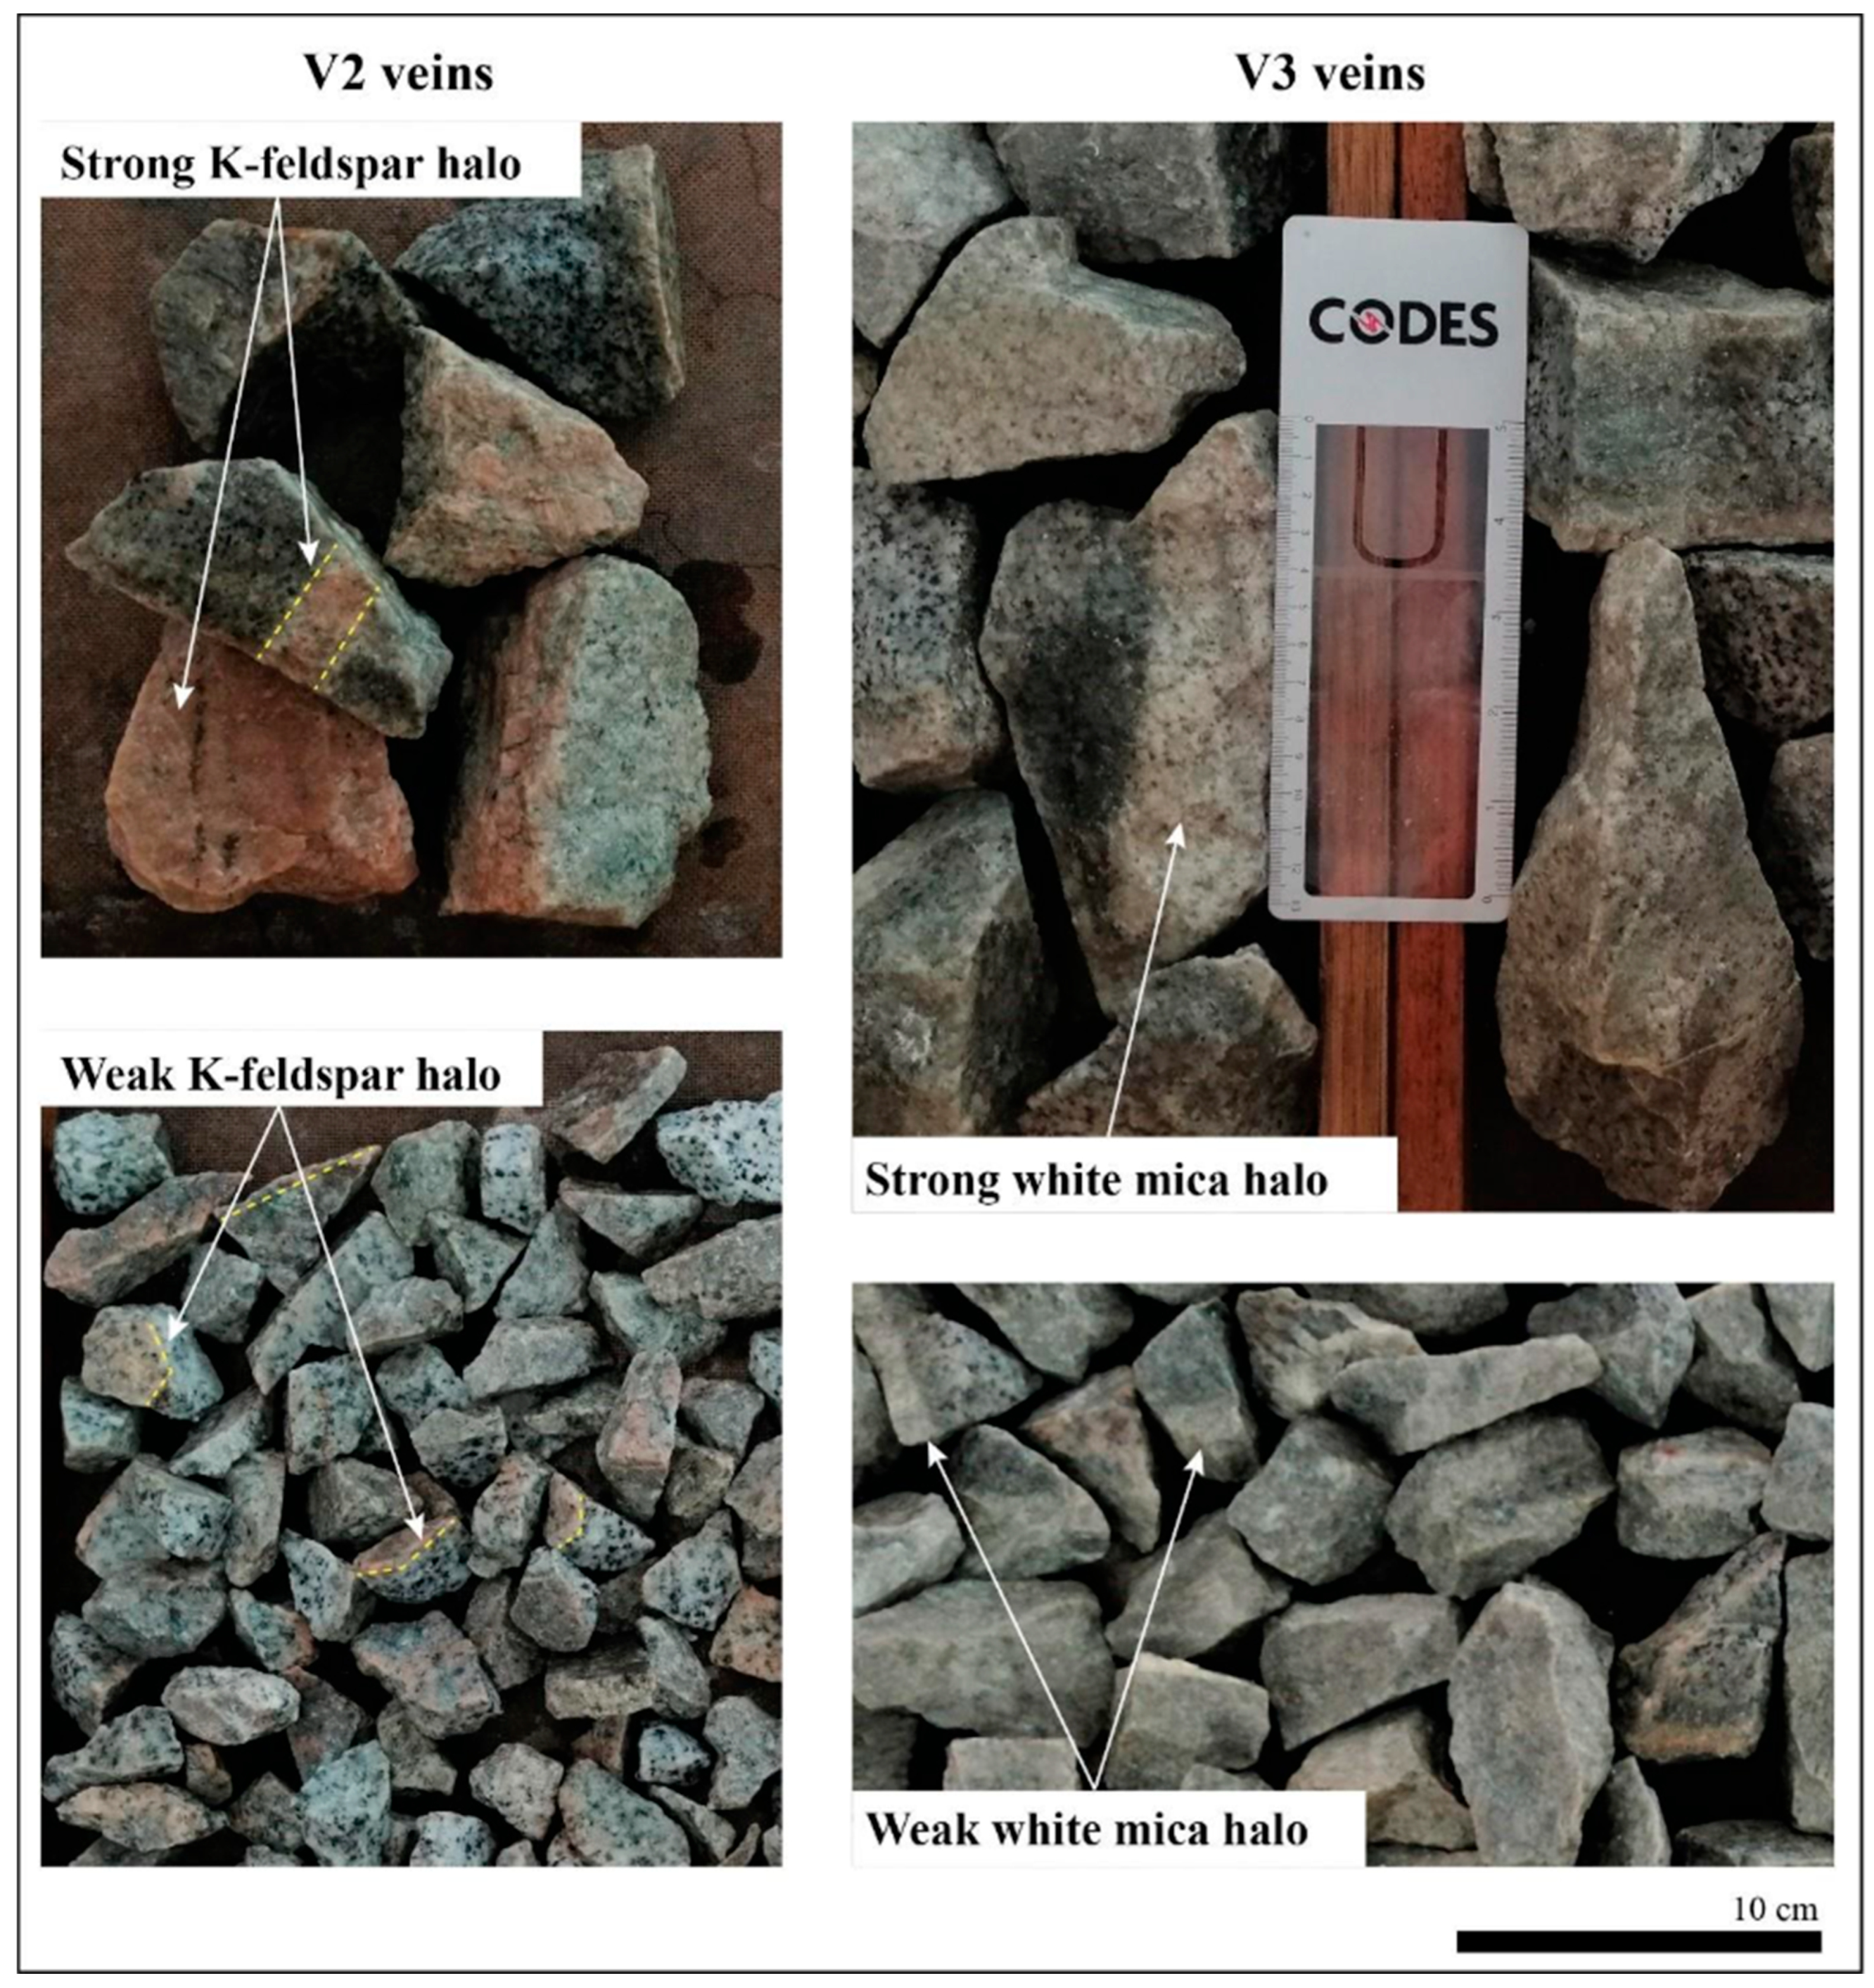
In contrast, when the quartz vein is thin, the type and degree of alteration in the selvage control the breakage behavior. In V2 veins with strong potassic alteration, K-feldspar likely becomes the dominant plane of weakness due to its cleavage, leading to a more sub-rounded fracture pattern and the entire rock fragment may display a pervasive pinkish color, or the rock may break perpendicular to the vein selvage. However, if potassic alteration is weak, the quartz vein itself acts as the main fracture plane, resulting in breakage along the vein (Figure 9), and the selvage appears only along the edges of the fragments.
Figure 9.
Examples of V2 and V3 vein categories from Gramalote bulk sample.
In the case of V3 veins, if the selvage, composed of white mica, is well-developed or pervasive, the rock breaks along the cleavage planes of the muscovite. These planes are typically parallel to the quartz vein, resulting in disk-shaped rock fragments. Conversely, when the muscovite alteration is weak, the quartz vein itself becomes the main plane of weakness, leading to breakage along the vein (Figure 9), and the weak white mica selvage appears only along the edges of the fragments.
4.3. Telfer West Dome Data vs. Gold Response Ranking
Telfer samples have been described in the same way as those for Gramalote, combining the following data: geological logging (lithology, veining, mineralization), chemistry, hyperspectral response, rebound hardness, and the density of the rocks. Despite Telfer WD deposit being an intrusive-related system, the mineralization is hosted in sedimentary host rocks. This is in contrast to the Gramalote deposit, where mineralization is hosted in the intrusive rock. Consequently, the RR classifications will incorporate this distinction regarding the host rock. The data for each RR Au class are described below and summarized in Table 2.
4.3.1. RR Au >80
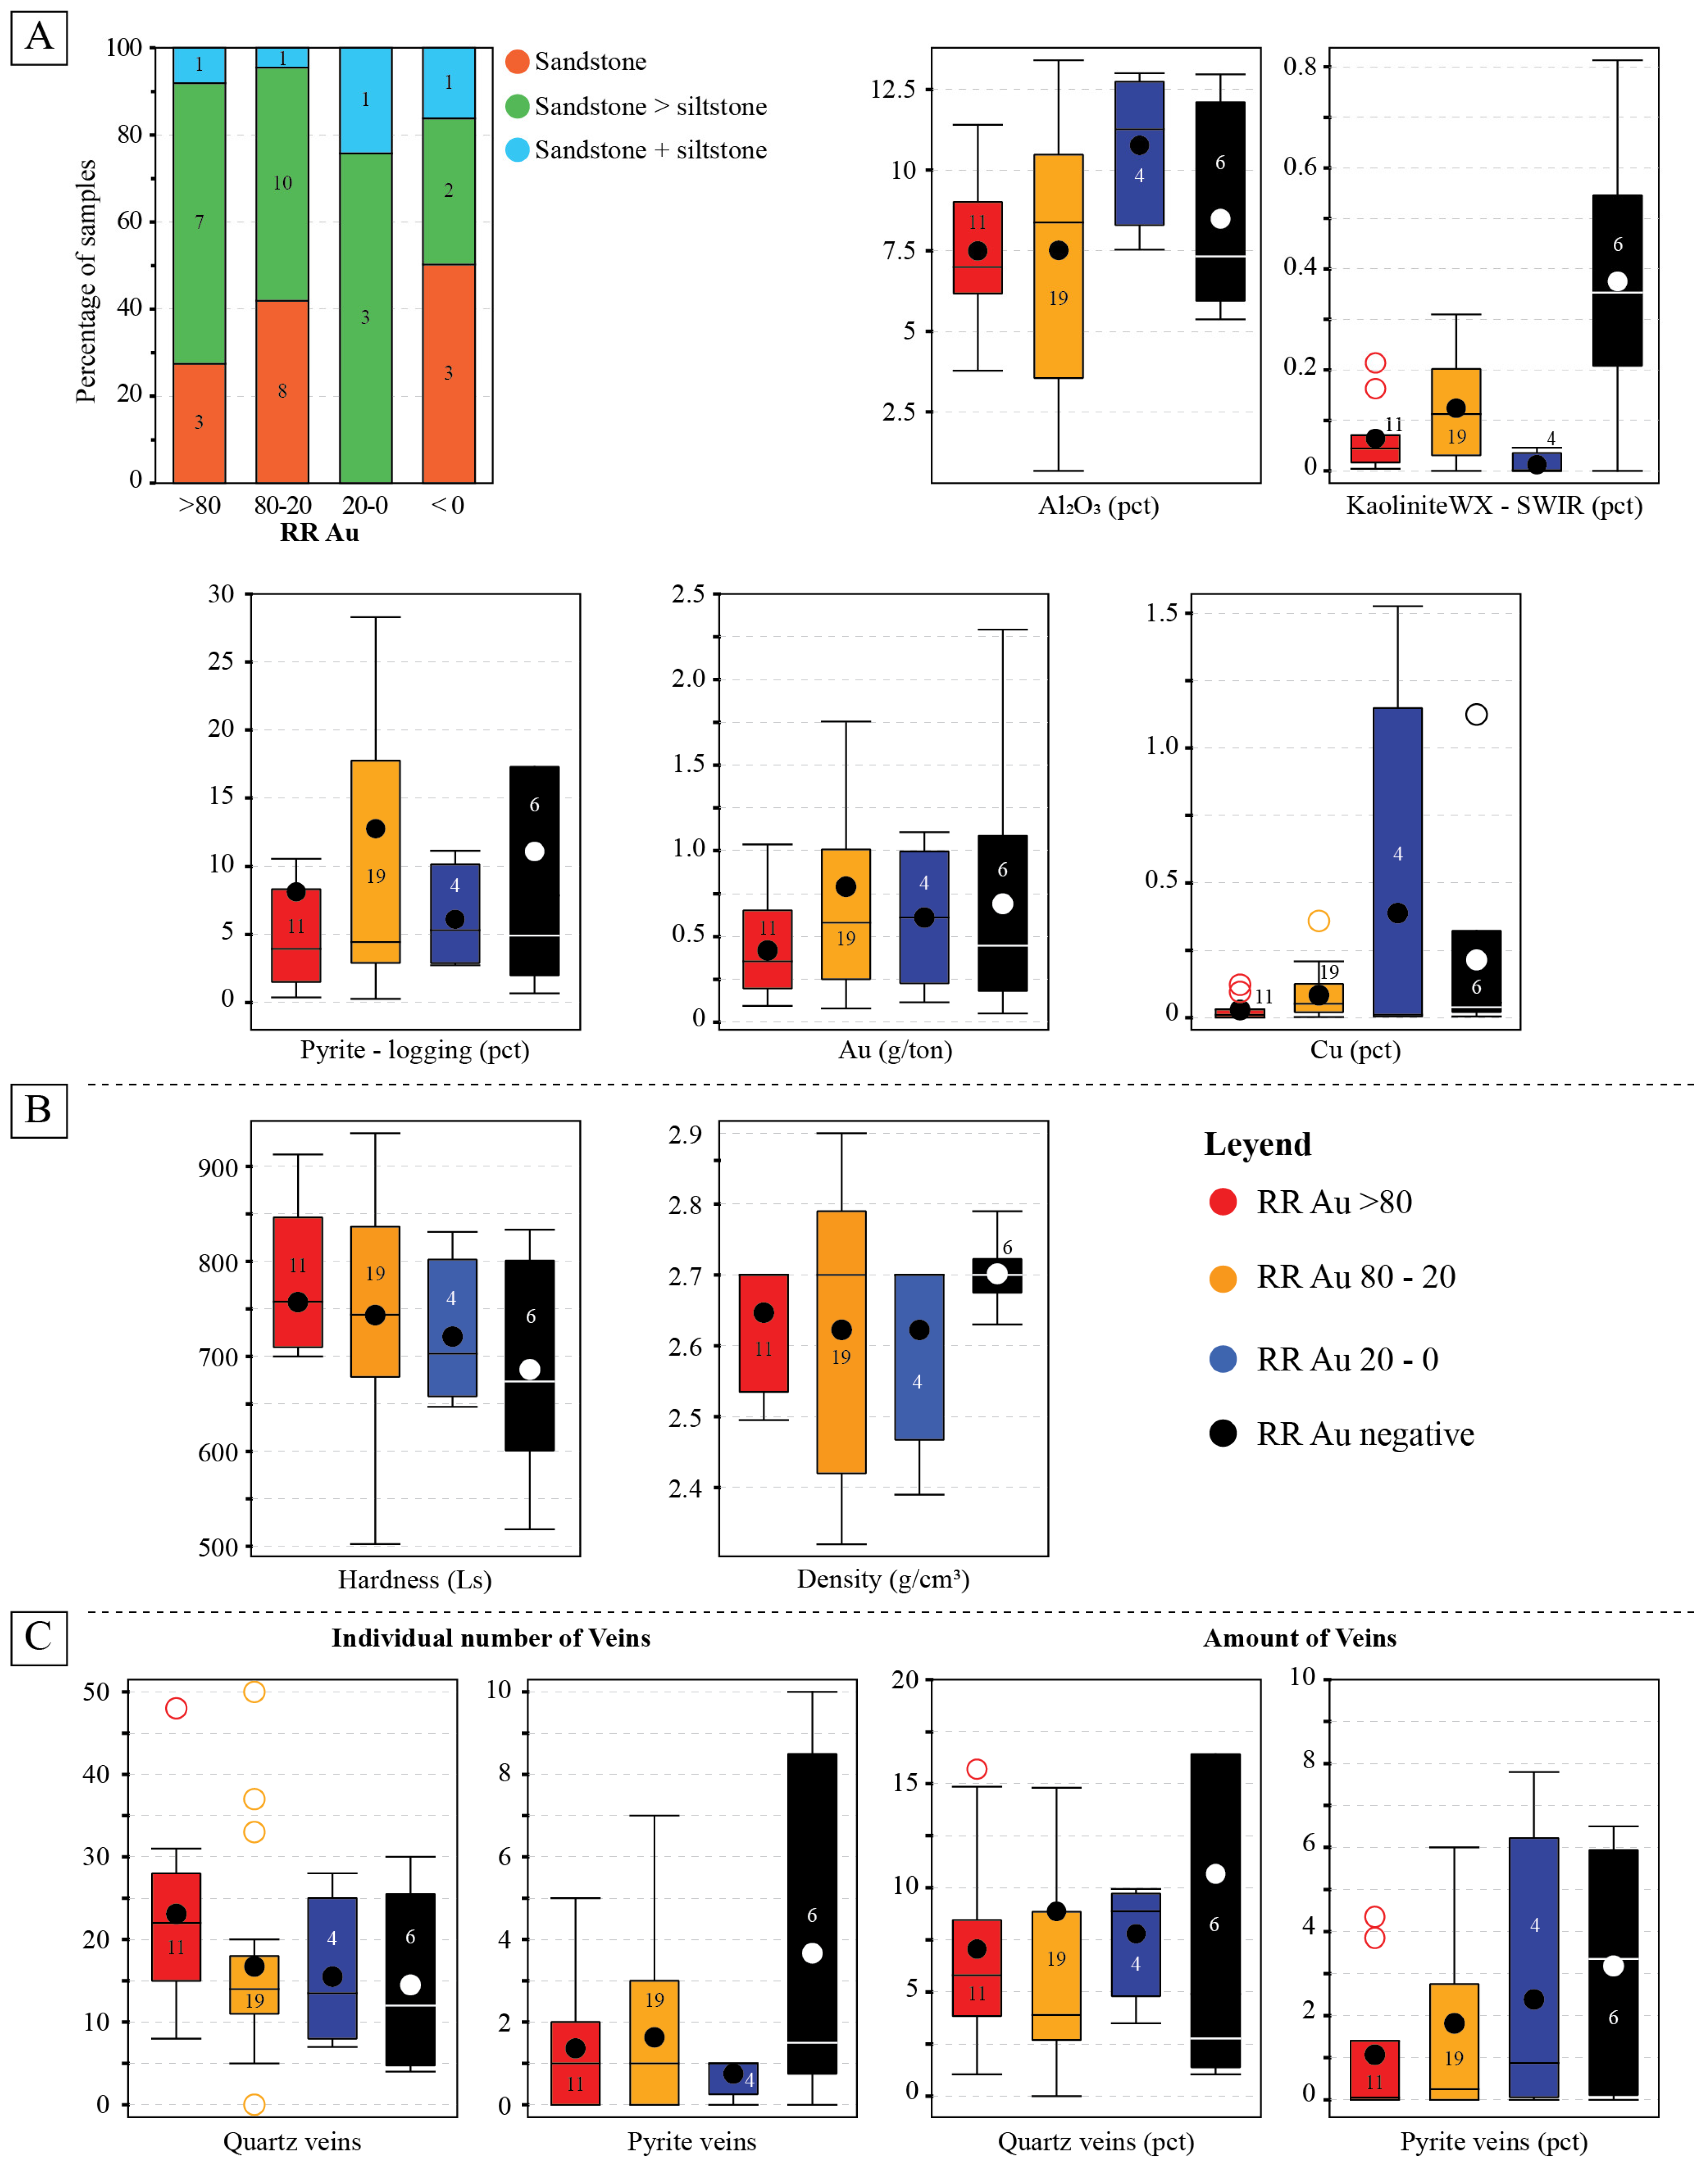
The Telfer WD samples with RR >80 are characterized by a high sandstone content (~90%), with minor interbedded siltstone (Figure 10A). The rocks are silicified and mechanically competent, displaying high rebound hardness values (~760 Ls; Figure 10B). Low aluminum oxide levels (~7.5%), and low kaolinite content (~0.06%) suggest the absence of pervasive alteration that would otherwise weaken the rock. Pyrite content is intermediate (~8%), while gold (~0.4 g/ton) and copper (~0.03%) grades are the lowest among all classes (Figure 10A). Density is also intermediate (~2.65 g/cm3; Figure 10B), consistent with the pyrite content. In terms of veining (Figure 10C), this class presents the highest number of individual quartz veins (~23), but the total vein volume is low (~7%), indicating a fine, dispersed veining style rather than thick, continuous structures. Pyrite-bearing veins are also scarce, both in number (~1) and volume (~1%).
4.3.2. RR Au 80 to 20
The RR Au 80 to 20 class shares a similar lithological composition with the previous RR Au >80 class, with sandstone still being the dominant rock type (Figure 10A). However, a rise in kaolinite content (~0.12%; Figure 10A) indicates an increased degree of alteration. This is reflected in the lower rebound hardness (~743 Ls; Figure 10B), suggesting a mechanically weaker rock compared to the >80 class. Mineralogically, pyrite content increases (~13%), which correlates with a rise in gold grade (~0.8 g/ton), although copper remains low (~0.08%) (Figure 10A). Interestingly, the overall rock density decreases (~2.62 g/cm3; Figure 10B) despite the higher pyrite content. This may be related to the increased presence of clays, particularly kaolinite. In terms of veining (Figure 10C), although the number of individual quartz veins decreases (~17), their total volume increases (~8%), suggesting that the veins become thicker in this class. This change marks the beginning of a transition toward coarser veining. Pyrite-bearing veins remain in a low range in terms of count (~2), but their overall volume also increases slightly (~2%).
4.3.3. RR Au 20 to 0
The RR Au 20 to 0 class is characterized by an increased siltstone content interbedded with sandstone (~75%; Figure 10A). This lithological shift is reflected in elevated aluminum oxide values (~10.7%; Figure 10A), indicating a higher abundance of fine-grained, aluminum-rich minerals such as clays commonly associated with siltstones. Nevertheless, overall alteration remains limited, as evidenced by the low kaolinite content (~0.01%; Figure 10A). All this reflects a medium to low rebound hardness (~721 Ls; Figure 10B). Pyrite content is in the intermediate to low range (~6%; Figure 10A), consistent with the observed intermediate to low rock density (~2.6 g/cm3; Figure 10B). In terms of mineralization (Figure 10A), gold content is moderate (~0.6 g/ton), while copper content is elevated (~0.4%), suggesting a potential gold-copper association in a copper-enriched oxidized zone, where chalcocite has been observed. With respect to veining (Figure 10C), this class exhibits a relatively low number of individual quartz veins (~16) and low total quartz vein volume (~8%), indicating sparse and thin veining. In contrast, pyrite-bearing veins are few (~1), but account for a relatively high total volume (~2%), suggesting the presence of thick pyrite veins localized in specific intervals.
4.3.4. RR Au Negative
The negative class shares a similar lithological composition with higher-ranking classes, comprising both sandstone and siltstone (Figure 10A). However, a notable increase in kaolinite content (~0.4%) indicates more intense alteration within the siltstone zones (Figure 10A). This alteration contributes to reduced rebound hardness (~686 Ls; Figure 10B), as altered zones are more prone to fracturing and mechanical weakening. Mineralogically, pyrite content increases (~11%; Figure 10A), correlating with higher rock density (~2.7 g/cm3; Figure 10B). In terms of mineralization (Figure 10A), gold grades are relatively high (~0.7 g/ton), while copper content remains low (~0.2%), suggesting that gold is primarily associated with pyrite in this class. Regarding veining (Figure 10C), the number of quartz veins is low (~15), but the total quartz volume is relatively high (~11%), indicating the presence of thick quartz veins. Pyrite-bearing veins increase in both number (~4) and volume (~3%), suggesting a mix of thin and thick pyrite-rich veins.
Figure 10.
Geological and petrophysical data from Telfer WD samples compared to Response Ranking Au classes. (A) Relationships between RR Au with lithology, geochemistry, and SWIR hyperspectral data (kaolinitewx). (B) Petrophysical data: rebound hardness and density data divided by RR Au classes. Ls = rebound hardness data. (C) Relationships of quartz and pyrite veins divided by RR Au classes. Note: numbers within boxes indicate the number of samples analyzed for each dataset. The plots are used to visualize relative differences between groups.
5. Discussion: Geological Controls on Pre-Concentration Potential in Gold Deposits
The following section is based on the role of each geological parameter related to the RR Au behavior by class. This comparison aims to highlight similarities or differences between the Gramalote and Telfer WD deposits, both of which are intrusive related gold systems, where the gold mineralization is related to veins and veinlets containing disseminated sulfides (pyrite).
The host rocks are different across the two deposits. For example, the Gramalote deposit is hosted within an intrusive host rock (tonalite), being quasi-homogeneous throughout the deposit. In contrast, Telfer WD is hosted within sedimentary rocks, i.e., a heterogeneous host rock, suggesting the rock may break differently. The intrusive host rock from Gramalote is coherent (Figure 2) and presents high hardness (~800 Ls; Figure 3C). In contrast, the sedimentary rocks from Telfer WD are less coherent (between 800 and 650 Ls) and show planes of parting due to their bedding (Figure 4), especially in the siltstone and interbedded siltstone–sandstone areas. However, the sedimentary rocks of Telfer WD also contain meter-scale intervals of sandstone that are coherent and hard compared to the interbedded siltstone–sandstone sequences.
Alteration at Gramalote is restricted to halos (selvages) surrounding the quartz veins, which leads to contrasting hardness over short distances (1 cm). Two main alteration types are identified: K-feldspar and white mica halos, which define the V2 and V3 vein types described in Section 3.1. K-feldspar alteration is not expected to significantly affect rock hardness, as K-feldspar has a similar hardness to the primary host minerals it replaces, mainly plagioclase. Minerals in the feldspar group generally range from 6 to 6.5 on the Mohs hardness scale [38], so the substitution does not markedly change rock competency. This is supported by rebound hardness test results, which show high values (~790 Ls; Figure 3C) close to LAR (~800 Ls). In contrast, white mica has a much lower hardness (<2.5 on the Mohs scale), contributing to reduced rock competency, with average rebound hardness values around ~725 Ls (Figure 3C). Quartz veins also influence hardness variation, given quartz’s high hardness (7 on Mohs scale and ~800 Ls on rebound hardness), particularly when the veins are thick.
At Telfer WD, there are two types of alteration. The first type occurs when the rock is silicified (especially in sandstones), thus increasing its hardness (hardness up to 900 Ls; Figure 5B). The second is pervasive clay alteration, primarily affecting siltstones. This occurs because muscovite and feldspar readily break down into clay minerals, while sandstone, being predominantly composed of chemically stable quartz, is more resistant to alteration. As a result, this second alteration type tends to soften the rock (~650 Ls; Figure 5B). Unlike at Gramalote, where alteration is typically restricted to vein selvages, alteration at Telfer WD often extends into the surrounding host rocks.
Samples with the best upgrade potential are those in the RR Au >80 class (as mentioned in the introduction section). RR Au >80 class presents high rock hardness in both deposits (Figure 7 and Figure 10 and Table 2). In Gramalote, this could be due to the hardness of the intrusive host rocks and a larger number of V2 (quartz vein + pyrite + K-feldspar selvage) compared to V3 (quartz ± carbonate vein + pyrite + white mica halo) veins (Table 2). At Telfer WD, higher hardness is associated with a higher sandstone content and silicification. Despite the high rock hardness indicated for this class, the high RR Au values indicate that the rock fractures in such a way as to release gold into fine fractions.
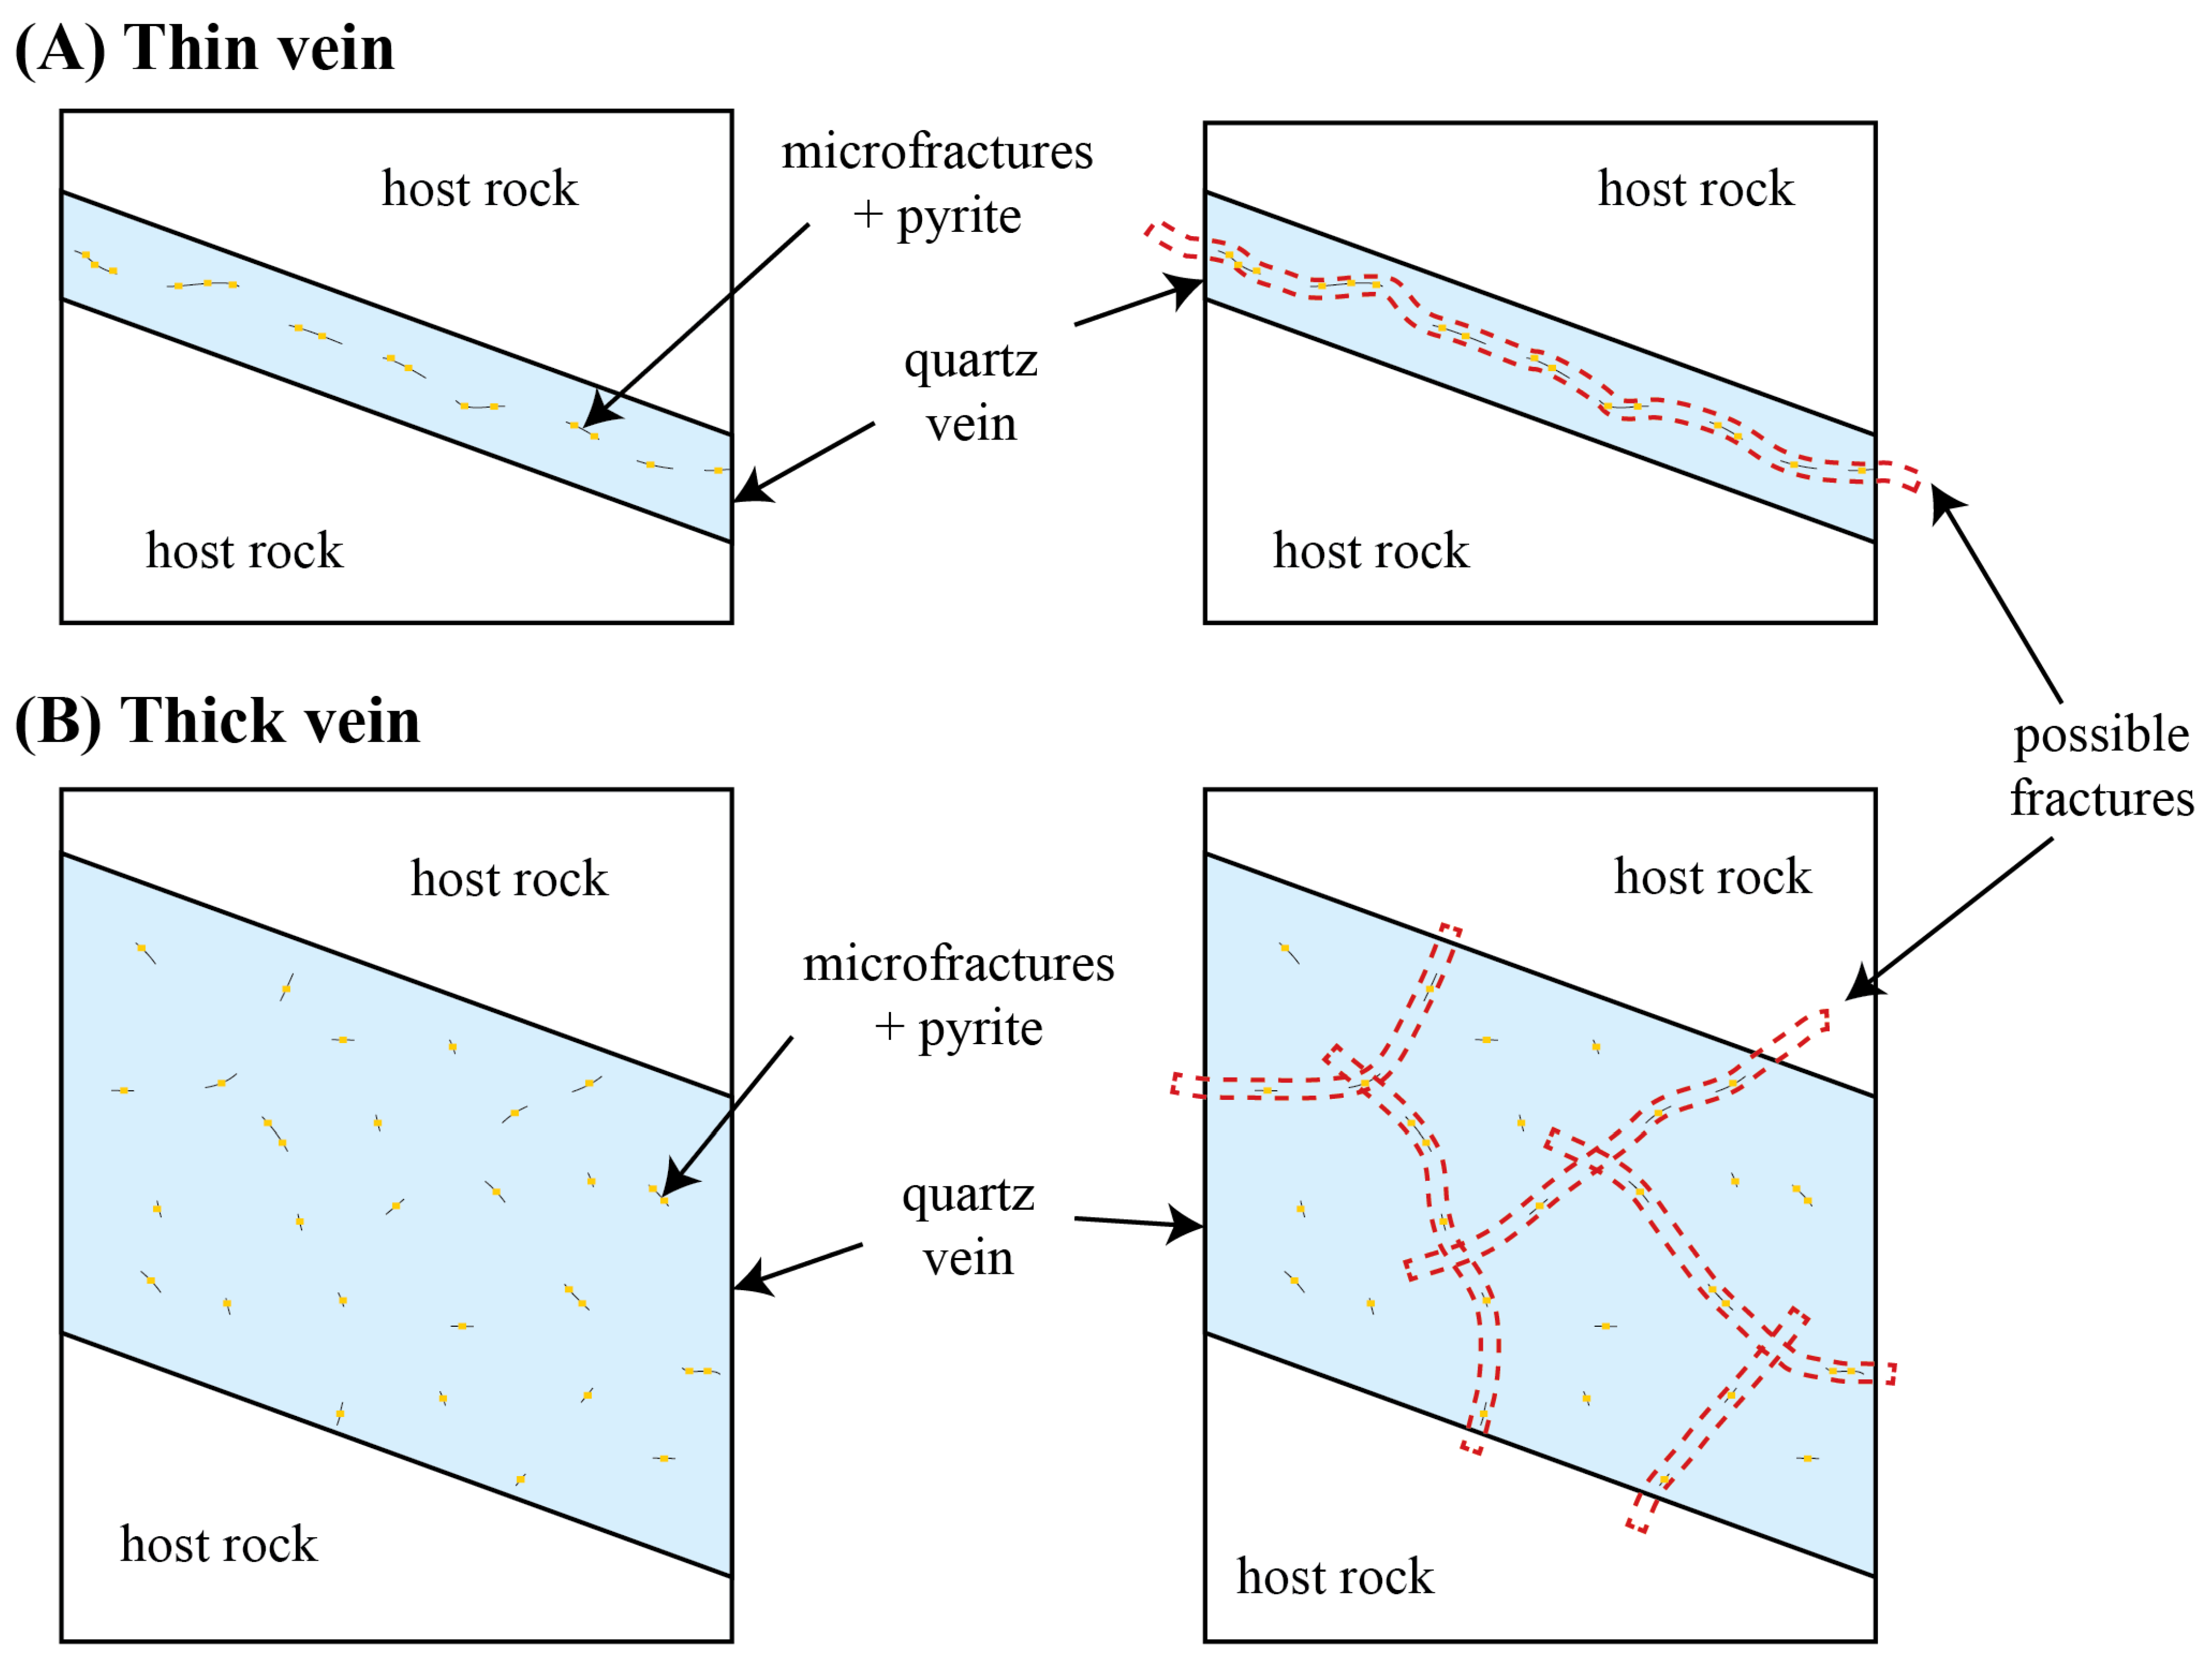
Gold is present in the rock associated with pyrite at both deposits. Pyrite at Gramalote is dominantly dispersed in quartz veins and alteration halos, while pyrite at Telfer WD is more dispersed and occurs in both the quartz veins and the host rock. Quartz veins appear to play a significant role in how the rock will break, with thin quartz veins acting as preferential planes of weakness where microfractures in the quartz veins could be controlling rock breakage. Thus, the presence of thin quartz veins appears to enhance grade-by-size fractionation.
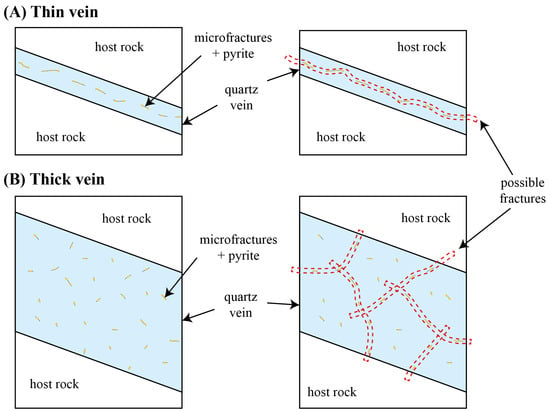
In Figure 11, we propose that rock fracturing during ore processing may be significantly influenced by the size and type of vein present in the host rocks. The presence of microfractures encourages the deposition of mineralization (sulfides + free Au) and creates zones of weakness. As a result, in thin veins, these weaknesses are constrained to narrower zones, forming pseudo-breakage planes (Figure 11A). In contrast, thicker veins contain more widely distributed sulfide-bearing microfractures, which create multiple internal weakness planes and promote localized brecciation (Figure 11B). However, despite this internal fracturing, the quartz matrix remains mechanically strong, so these veins tend to break into a few large blocks rather than many small fragments during blasting. This behavior explains why fragments of thick quartz veins are predominantly found in the coarsest fraction of the Gramalote bulk samples (>19 mm; Figure 8).
Figure 11.
Schematic of possible quartz vein breakage. (A) Scenario for thin veins. (B) Scenario for thick veins. Blue = vein; red lines = potential fracture ‘planes’.
Thin veins are hypothesized to shatter along the center line upon breakage (Figure 11A), facilitating the release of sulfides and gold as fine-grained particles. In contrast, thick veins tend to fragment into larger pieces, retaining much of the coarse-grained sulfides and thus limiting mineral liberation. This mechanism of grade-by-size fractionation may help explain the higher abundance of thin quartz veins observed in the RR Au >80 class across both deposits (Table 2).
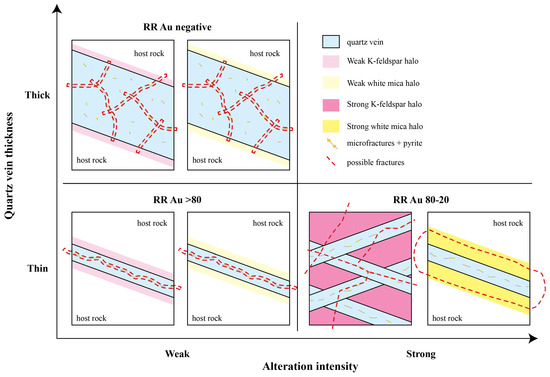
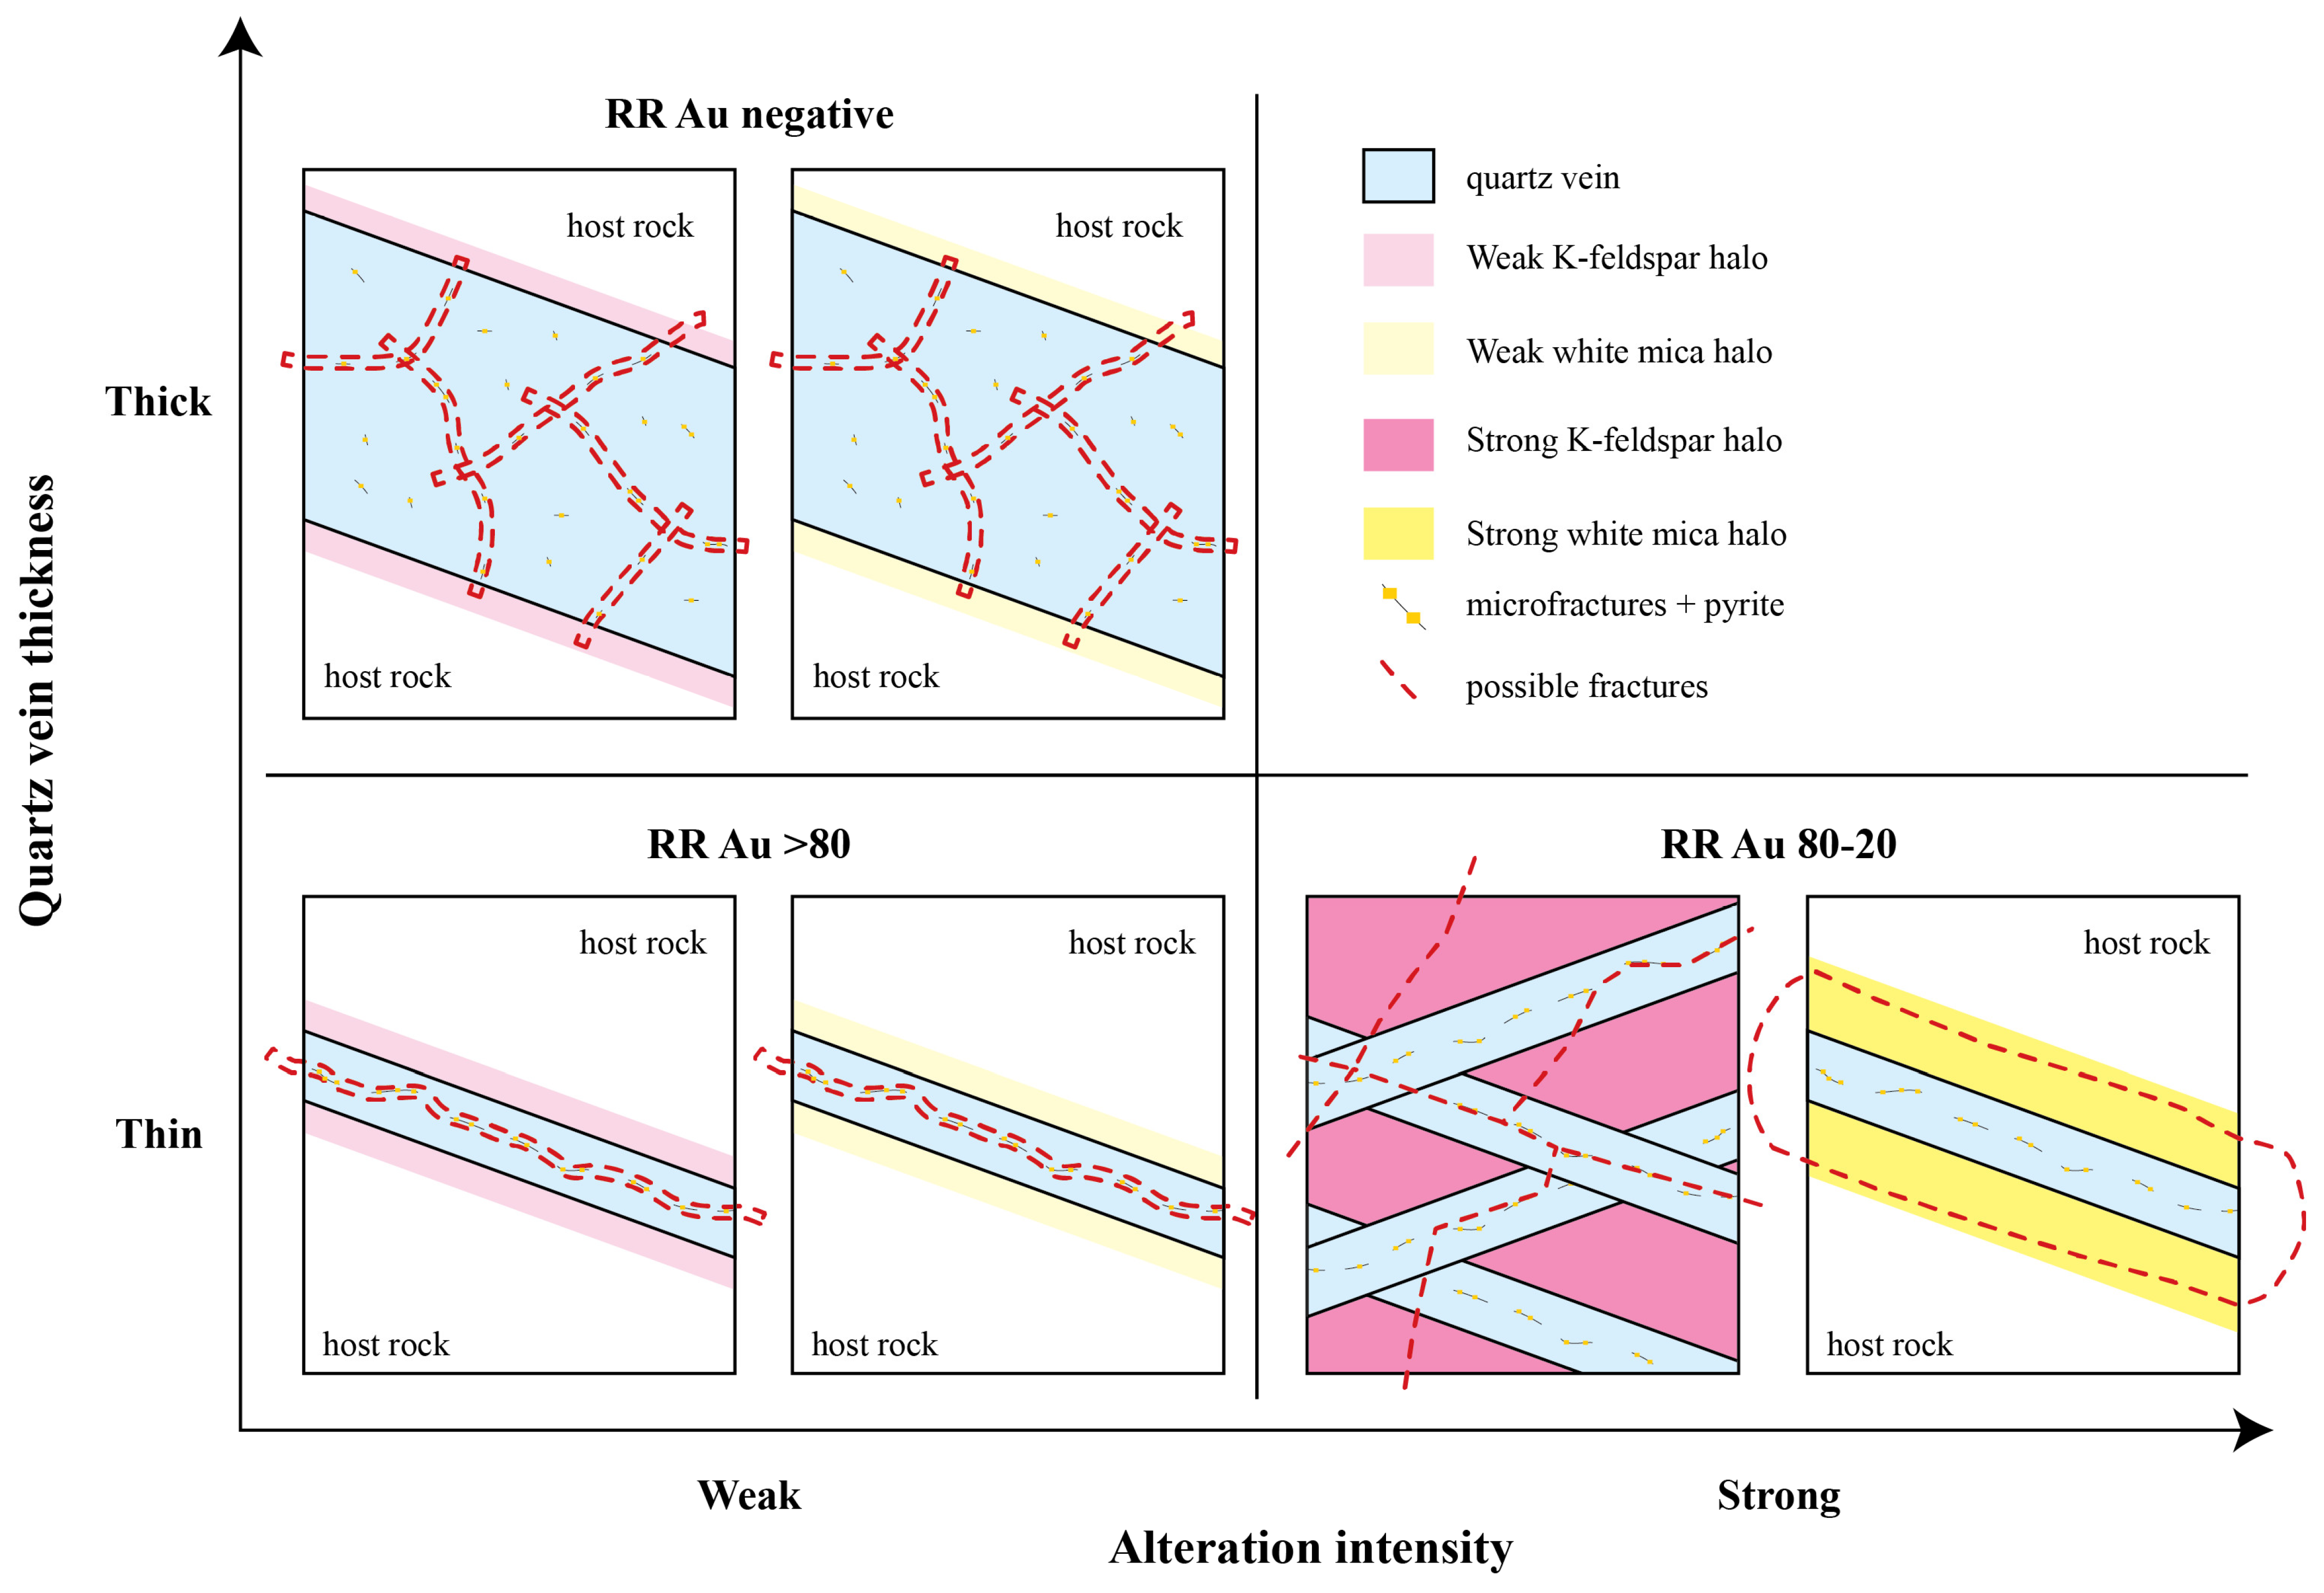
This hypothesis (Figure 11) may be a better fit at Telfer WD, because the quartz veins do not present alteration halos, which adds minerals that potentially interfere with the way the rock breaks. In contrast at Gramalote, two important vein types (V2 and V3) are recognizable by their alteration halos, which respond differently during crushing. The V2 veins have a K-feldspar halo, and when this alteration has weak intensity, it allows the quartz vein to be the dominant plane of weakness (Figure 12). However, when K-feldspar intensity is high, the selvage/vein composite is strong, resulting in the rock breaking in a breccia-like fashion (e.g., Figure 12—RR Au 80–20 class), as observed in the bulk samples (Figure 9, V2 veins with strong K-feldspar halo).
Figure 12.
Schematic of possible ways rock could break depending on quartz vein thickness and the halo alteration type and intensity for Gramalote deposit.
The Gramalote V3 veins have white mica halos. When the alteration is weak (i.e., poorly developed), quartz veins fracture into small fragments with the release of sulfides. However, when the intensity of the white mica alteration is high, the rocks break preferentially along the selvage, resulting in the veins breaking into larger flat pieces (e.g., Figure 12—RR Au 80–20 class). These observations suggest that rock breaks into sub-rounded (in K-feldspar—V2 veins) and disk shaped (in white mica—V3 veins) pieces as observed in the bulk sample (Figure 9).
These observations also suggest that thin quartz veins with weak alteration halos are more likely to release the ore minerals into the fine fraction during crushing. In Gramalote, vein thickness was estimated indirectly using the texture classification based on magnetic susceptibility (‘Vein’, ‘Vein + LAR’, LAR’; Section 2.2). The ‘Vein + LAR’ texture (indicative of thin veins) is abundant in the RR Au >80 class. In contrast, at Telfer, magnetic susceptibility was not effective due to the lack of magnetite in the samples. Instead, detailed drill core logging provided direct information on vein thickness. For example, the RR Au >80 class is characterized by a high number of veins but low total volume, indicating that the majority of veins are thin (Table 2).
The percentage of highly mineralized veins (i.e., V2 veins in Gramalote and quartz veins in Telfer WD) is an important control on the upgrade potential (RR Au). For example, the RR Au >80 class for Gramalote presents a higher content of V2 veins, but if this vein content increases and the vein distribution changes, the upgrade potential is reduced (RR Au 80 to 20 class). This behavior also occurs in Telfer WD, where the RR Au 80 to 20 class has a higher presence of quartz veins (Table 2).
The RR Au 20 to 0 class characteristics are similar for both deposits (Table 2), with few veins, and medium to low rock hardness (Gramalote: ~765 Ls, Telfer: ~721 Ls; Table 2). In contrast, the negative RR Au class shows distinct features, with both deposits exhibiting relatively high gold grades, but Telfer WD additionally presenting more intense alteration and lower rock hardness (~686 Ls; Table 2).
6. Conclusions
The analysis of detailed drill core logging is an essential first step in identifying geological textures related to grade-by-size fractionation. The geological characteristics of samples from the Gramalote and Telfer WD Au deposits that showed high importance were the lithology of the host rock and the vein types and their related alteration. Geological data from these two contrasting Au deposits show that samples with hard host rocks (e.g., tonalite) and a high number of thin, well-distributed mineralized veins (e.g., V2 veins) are more likely to exhibit a high upgrade potential (RR Au >80), meaning that ore minerals can be liberated into the fine fraction after blasting without requiring crushing.
Samples with medium to high rock hardness that contain thick to thin mineralized veins which are poorly distributed, or samples dominated by well-distributed but weakly mineralized veins (e.g., V3 veins), generally show a medium upgrade potential (RR Au 80–20). These samples require an additional crushing step to promote mineral liberation.
Samples lacking significant veining generally show no upgrade potential (RR Au 20–0). Highly mineralized zones at Gramalote are associated with negative RR Au values, suggesting that these rocks do not require upgrading and should be processed in their entirety.
Author Contributions
Conceptualization, N.G., J.H. and M.J.C.; methodology, N.G. and L.K.; validation, N.G., J.H. and M.J.C.; formal analysis, N.G.; investigation, N.G.; resources, N.G.; data curation, N.G.; writing—original draft preparation, N.G.; writing—review and editing, J.H. and M.J.C.; visualization, N.G.; supervision, J.H. and M.J.C.; project administration, J.H. and M.J.C.; funding acquisition, L.K. All authors have read and agreed to the published version of the manuscript.
Funding
This research was funded by the Cooperative Research Centre for Optimising Resource Extraction (CRC ORE), through the Australian Government Cooperative Research Centres Programme, as part of Program 1: Define (Project ID: P1-006).
Data Availability Statement
Data are available at https://figshare.utas.edu.au/articles/thesis/Geological_controls_on_grade_by_size_fractionation_in_gold_systems/23973087 (accessed on 10 December 2025).
Acknowledgments
The authors acknowledge the Cooperative Research Centre for Optimising Resource Extraction (CRC ORE) for funding this project as part of Program 1: Define (Project P1-006). We also acknowledge AngloGold Ashanti, B2Gold, and Newcrest Mining Limited for providing access to data and samples during the period when this research was conducted. Newmont Corporation has since acquired Newcrest Mining Limited. We further acknowledge the support of the CODES laboratory staff, Mineral Resources Tasmania staff, TerraCore staff, Minalyze staff, and Steve Walters for their technical assistance during data acquisition. All individuals named here have consented to be acknowledged.
Conflicts of Interest
The authors declare no conflicts of interest.
Abbreviations
The following abbreviations are used in this manuscript:
| ALS | Australian Laboratory Services |
| AAS | Atomic Absorption Spectroscopy |
| CRC ORE | Cooperative Research Centre for Optimising Resource Extraction |
| DEM | Discrete Element Modeling |
| LAR | Least Altered Rock |
| MAGSUS | Magnetic Susceptibility |
| MRT | Mineral Resources of Tasmania |
| RF | Response Factor |
| ROM | Run Of Mine |
| RR | Response Ranking |
| RS | Response Slope |
| SAG | Semi-autogenous mill |
| SWIR | Short Wavelength Infrared |
| VNIR | Visible Near-Infrared |
| WD | West Dome |
| WLSQ | Weighted Least Squares |
| wx | Well Crystallized |
| TIR | Thermal Infrared |
References
- Rutter, J. Grade Engineering and GE View. CRC ORE White Paper. 2017. Available online: https://www.crcore.org.au/images/CRC-ORE/papers/Rutter-J-2017-CRC-ORE-Grade-Engineering-Whitepaper-Full.pdf (accessed on 17 October 2025).
- Bamber, A. Integrated Mining, Pre-Concentration and Waste Disposal Systems for the Increased Sustainability of Hard Rock Metal Mining. Doctoral Dissertation, University of British Columbia, Vancouver, BC, Canada, 2008. [Google Scholar]
- McKee, D.J. Understanding Mine to Mill; The Cooperative Research Centre for Optimising Resource Extraction: Brisbane, Australia, 2013; ISBN 9781922029270. [Google Scholar]
- Pease, J.; Walters, S.; Keeney, L.; Shapland, G. A Step Change in Mining Productivity. In Sustainability in the Mineral and Energy Sectors; CRC Press: Boca Raton, FL, USA, 2016; pp. 27–34. [Google Scholar] [CrossRef] [Scilit]
- Bearman, R.A. Step Change in the Context of Comminution. Miner. Eng. 2013, 43, 2–11. [Google Scholar] [CrossRef] [Scilit]
- Bowman, D.J.; Bearman, R.A. Coarse Waste Rejection through Size Based Separation. Miner. Eng. 2014, 62, 102–110. [Google Scholar] [CrossRef] [Scilit]
- Burns, R.; Grimes, A. The Application of Pre-Concentration by Screening at Bougainville Copper Limited. In Proceedings of the AUSIMM Mineral Development Symposium, Madang, Papua New Guinea, 3–13 November 1986. [Google Scholar]
- Carrasco, C. Development of Geometallurgical Tests to Identify, Rank, and Predict Preferential Coarse Size by Size Au Deportment to Support Feed Preconcentration at Telfer Au-Cu Mine, Newcrest Western Australia. Master’s Thesis, University of Queensland, Brisbane, Australia, 2013. [Google Scholar]
- Adair, B.; Keeney, L.; King, D.; Scott, M. Gangue Rejection in Practice-the Implementation of Grade Engineering® at the Minera San Cristóbal Site; Cooperative Research Centre for Optimising Resource Extraction (CRC ORE): Brisbane, Australia, 2019; Available online: https://www.crcore.org.au/images/CRC-ORE/presentations/Physical_Separation_19_-_Adair_Ben_Keeney_Luke_King_David_-_Gangue_rejection_in_practice_-_the_implementation_of_Grade_Engineering_at_MSC_-_PAPER_-_APPROVED.pdf (accessed on 17 October 2025).
- Morales, K. Geological Predictors for Pre-Concentration. Master’s Thesis, University of Tasmania, Hobart, Australia, 2022. [Google Scholar] [CrossRef]
- Carrasco, C.; Keeney, L.; Walters, S. Development of Geometallurgical Laboratory Tests to Characterize Metal Preconcentration by Size. In Proceedings of the XXVII International Mineral Processing Congress, Santiago, Chile, 20–24 October 2014. [Google Scholar]
- Carrasco, C.; Keeney, L.; Walters, S.G. Development of a Novel Methodology to Characterise Preferential Grade by Size Deportment and Its Operational Significance. Miner. Eng. 2015, 91, 100–107. [Google Scholar] [CrossRef] [Scilit]
- Carrasco, C.; Keeney, L.; Napier-Munn, T.J. Methodology to Develop a Coarse Liberation Model Based on Preferential Grade by Size Responses. Miner. Eng. 2016, 86, 149–155. [Google Scholar] [CrossRef] [Scilit]
- Dyer, L. Grade Deportment by Size—Initial Characterisation of Deposits in the Western Australia Gold Fields at the Small Scale White Paper, Kalgoorlie, Australia, Unpublished Work. 2019.
- Baizhiyen, N.; Dowd, P.; Xu, C.; Lewis, D. Numerical Investigation of the Applicability of Preferential Grade Deportment by Size. Minerals 2024, 14, 670. [Google Scholar] [CrossRef] [Scilit]
- CRC ORE. Gramalote Project: Grade Engineering Concept Study, Technical Report #084. Unpublished Work. 2014.
- Guerrero, N.; Hunt, J.; Clarke, N.; Barros, A.; Keeney, L. Grade Engineering at Gramalote Gold Deposit, Colombia: An Example of Industry-Research Collaboration, Part 2. In Proceedings of the Preconcentration Digital Conference 2020, Online, 10–18 November 2020; pp. 409–415. Available online: https://hdl.handle.net/102.100.100/522680 (accessed on 17 October 2025).
- Clarke, N.; Barros, A.; Hunt, J.; Keeney, L. Grade Engineering at Gramalote Gold Deposit, Colombia: An Example of Industry—Research Collaboration, Part 1. In Proceedings of the Preconcentration Digital Conference 2020, Online, 10–18 November 2020; Available online: https://hdl.handle.net/102.100.100/522679 (accessed on 17 October 2025).
- Guerrero, N. Geological Controls on Grade by Size Fractionation in Gold Systems. Master’s Thesis, University of Tasmania, Hobart, Australia, 2022. [Google Scholar] [CrossRef]
- Einaudi, M.T. Mapping Altered and Mineralized Rocks an Introduction to the “Anaconda Method”; Stanford University: Stanford, CA, USA, 1997. [Google Scholar]
- Brimhall, G.H.; Dilles, J.H.; Proffett, J.M. The Role of Geologic Mapping in Mineral Exploration. In Wealth Creation in the Minerals Industry: Integrating Science, Business, and Education; Doggett, M.D., Parry, J.R., Eds.; Society of Economic Geologists: Littleton, CO, USA, 2005. [Google Scholar] [CrossRef] [Scilit]
- GEO F/X KT-9 Kappameter User’s Guide. 1997. Available online: https://clara.nz/docs/hardware/Exploranium/KT-9-manual-rev1-1997-08.pdf (accessed on 17 October 2025).
- Proceq SA Portable Hardness Tester Operating Instructions. 2007. Available online: https://media.screeningeagle.com/asset/Downloads/Equostat%203_Operating%20Instructions_English_high.pdf (accessed on 10 December 2025).
- Keeney, L. EQUOtip Hardness Testing; Indooroopilly, Australia, 2008; Available online: https://www.screeningeagle.com/en/solutions/metal-components/hardness-testing?utm_term=equotip&utm_campaign=Pure+Brands&utm_source=adwords&utm_medium=ppc&hsa_acc=6219466422&hsa_cam=21373324493&hsa_grp=165861890360&hsa_ad=702041089560&hsa_src=g&hsa_tgt=kwd-325907016692&hsa_kw=equotip&hsa_mt=p&hsa_net=adwords&hsa_ver=3&gad_source=1&gad_campaignid=21373324493&gbraid=0AAAAADiz9vy3NgUOiSklr0PAtO76720oz&gclid=EAIaIQobChMIlYLZ2PvDkQMVsw-DAx2QpRFjEAAYASAAEgJq8vD_BwE (accessed on 10 December 2025).
- Schodlok, M.C.; Whitbourn, L.; Huntington, J.; Mason, P.; Green, A.; Berman, M.; Coward, D.; Connor, P.; Wright, W.; Jolivet, M. HyLogger-3, a Visible to Shortwave and Thermal Infrared Reflectance Spectrometer System for Drill Core Logging: Functional Description. Aust. J. Earth Sci. 2016, 63, 929–940. [Google Scholar] [CrossRef] [Scilit]
- ALS Geochemistry ALS Geochemistry Fee Schedule. Available online: https://www.alsglobal.com/es/resources-and-downloads (accessed on 2 October 2025).
- Escolme, A.; Berry, R.F.; Hunt, J.; Halley, S.; Potma, W. Predictive Models of Mineralogy from Whole-Rock Assay Data: Case Study from the Productora Cu-Au-Mo Deposit, Chile. Econ. Geol. 2019, 114, 1513–1542. [Google Scholar] [CrossRef] [Scilit]
- Ordoñez-Carmona, O.; Pimentel, M.; Brito, R.; Rodrigues, J. U-Pb Ages of the Antioquian Batholith—Colombia and Preliminary Interpretation. In Proceedings of the VIII South American Symposium on Isotope Geology, Brasilia, Brasil, 25–28 July 2010. [Google Scholar] [CrossRef] [Scilit]
- Rodriguez-Novoa, F. Mineral Paragenesis of the Gramalote Gold Deposit, Colombia. Master’s Thesis, Queen’s University, Kingston, ON, Canada, 2009. [Google Scholar]
- Feininger, T.; Barrero, L.D.; Castro, Q. Geología de Parte de Los Departamentos de Antioquia y Caldas (Sub-Zona II-B). Boletín Geológico 1972, 20, 1–173. Available online: https://api.semanticscholar.org/CorpusID:204269579 (accessed on 10 December 2025). [CrossRef] [Scilit]
- Feininger, T. Publicaciones Geológicas Especiales del Ingeominas; Ministerio de Minas y Energía, Instituto Nacional de Investigaciónes Geológico-Mineras: Bogotá, Colombia, 1982. [Google Scholar]
- Valencia, M. Estilos Estructurales y Ocurrencias Minerales Gramalote Regional—Fase II: Internal Report; AngloGold Ashanti: Bogotá, Colombia, 2007. [Google Scholar]
- Steadman, J.; Sasha, S.; Large, R.; Royle, D. Final Report on the Telfer Pyrite Project—July 2015. Unpublished Work. 2015.
- Schindler, C.; Hagemann, S.G.; Banks, D.; Mernagh, T.; Harris, A.C. Magmatic Hydrothermal Fluids at the Sedimentary Rock-Hosted, Intrusion-Related Telfer Gold-Copper Deposit, Paterson Orogen, Western Australia: Pressure-Temperature-Composition Constraints on the Ore-Forming Fluids. Econ. Geol. 2016, 111, 1099–1126. [Google Scholar] [CrossRef] [Scilit]
- Couper, H.M. Geological and Geometallurgical Characterisation of the High Au, Low Cu Domain at New-Crest’s Telfer Cu-Au Mine. Bachelor’s Thesis, University of Tasmania, Hobart, Australia, 2018. [Google Scholar]
- Bagas, L.; David, D.R. Provenance of Neoproterozoic Sedimentary Rocks in the Northwest Paterson Orogen, Western Australia. In Northern Territory Geological Survey, Special Publication, Central Australian Basins Symposium; Northern Territory Geological Survey: Darwin, NT, Australia, 2007. [Google Scholar]
- Bagas, L. Geology of the Paterson 1:100,000 Sheet. In Geological Series Explanatory Notes; Northern Territory Government: Darwin, Australia, 2000; p. 20. [Google Scholar]
- Dana, J.D.; Dana, E.S.; Gaines, R.V. Dana’s New Mineralogy: The System of Mineralogy of James Dwight Dana and Edward Salisbury Dana; John Wiley & Sons: Hoboken, NJ, USA, 1997. [Google Scholar]

Disclaimer/Publisher’s Note: The statements, opinions and data contained in all publications are solely those of the individual author(s) and contributor(s) and not of MDPI and/or the editor(s). MDPI and/or the editor(s) disclaim responsibility for any injury to people or property resulting from any ideas, methods, instructions or products referred to in the content. |
© 2025 by the authors. Licensee MDPI, Basel, Switzerland. This article is an open access article distributed under the terms and conditions of the Creative Commons Attribution (CC BY) license.