

Assessing the Impact of Past Flood on Rice Production in Batticaloa District, Sri Lanka


Abstract
1. Introduction
2. Methodology
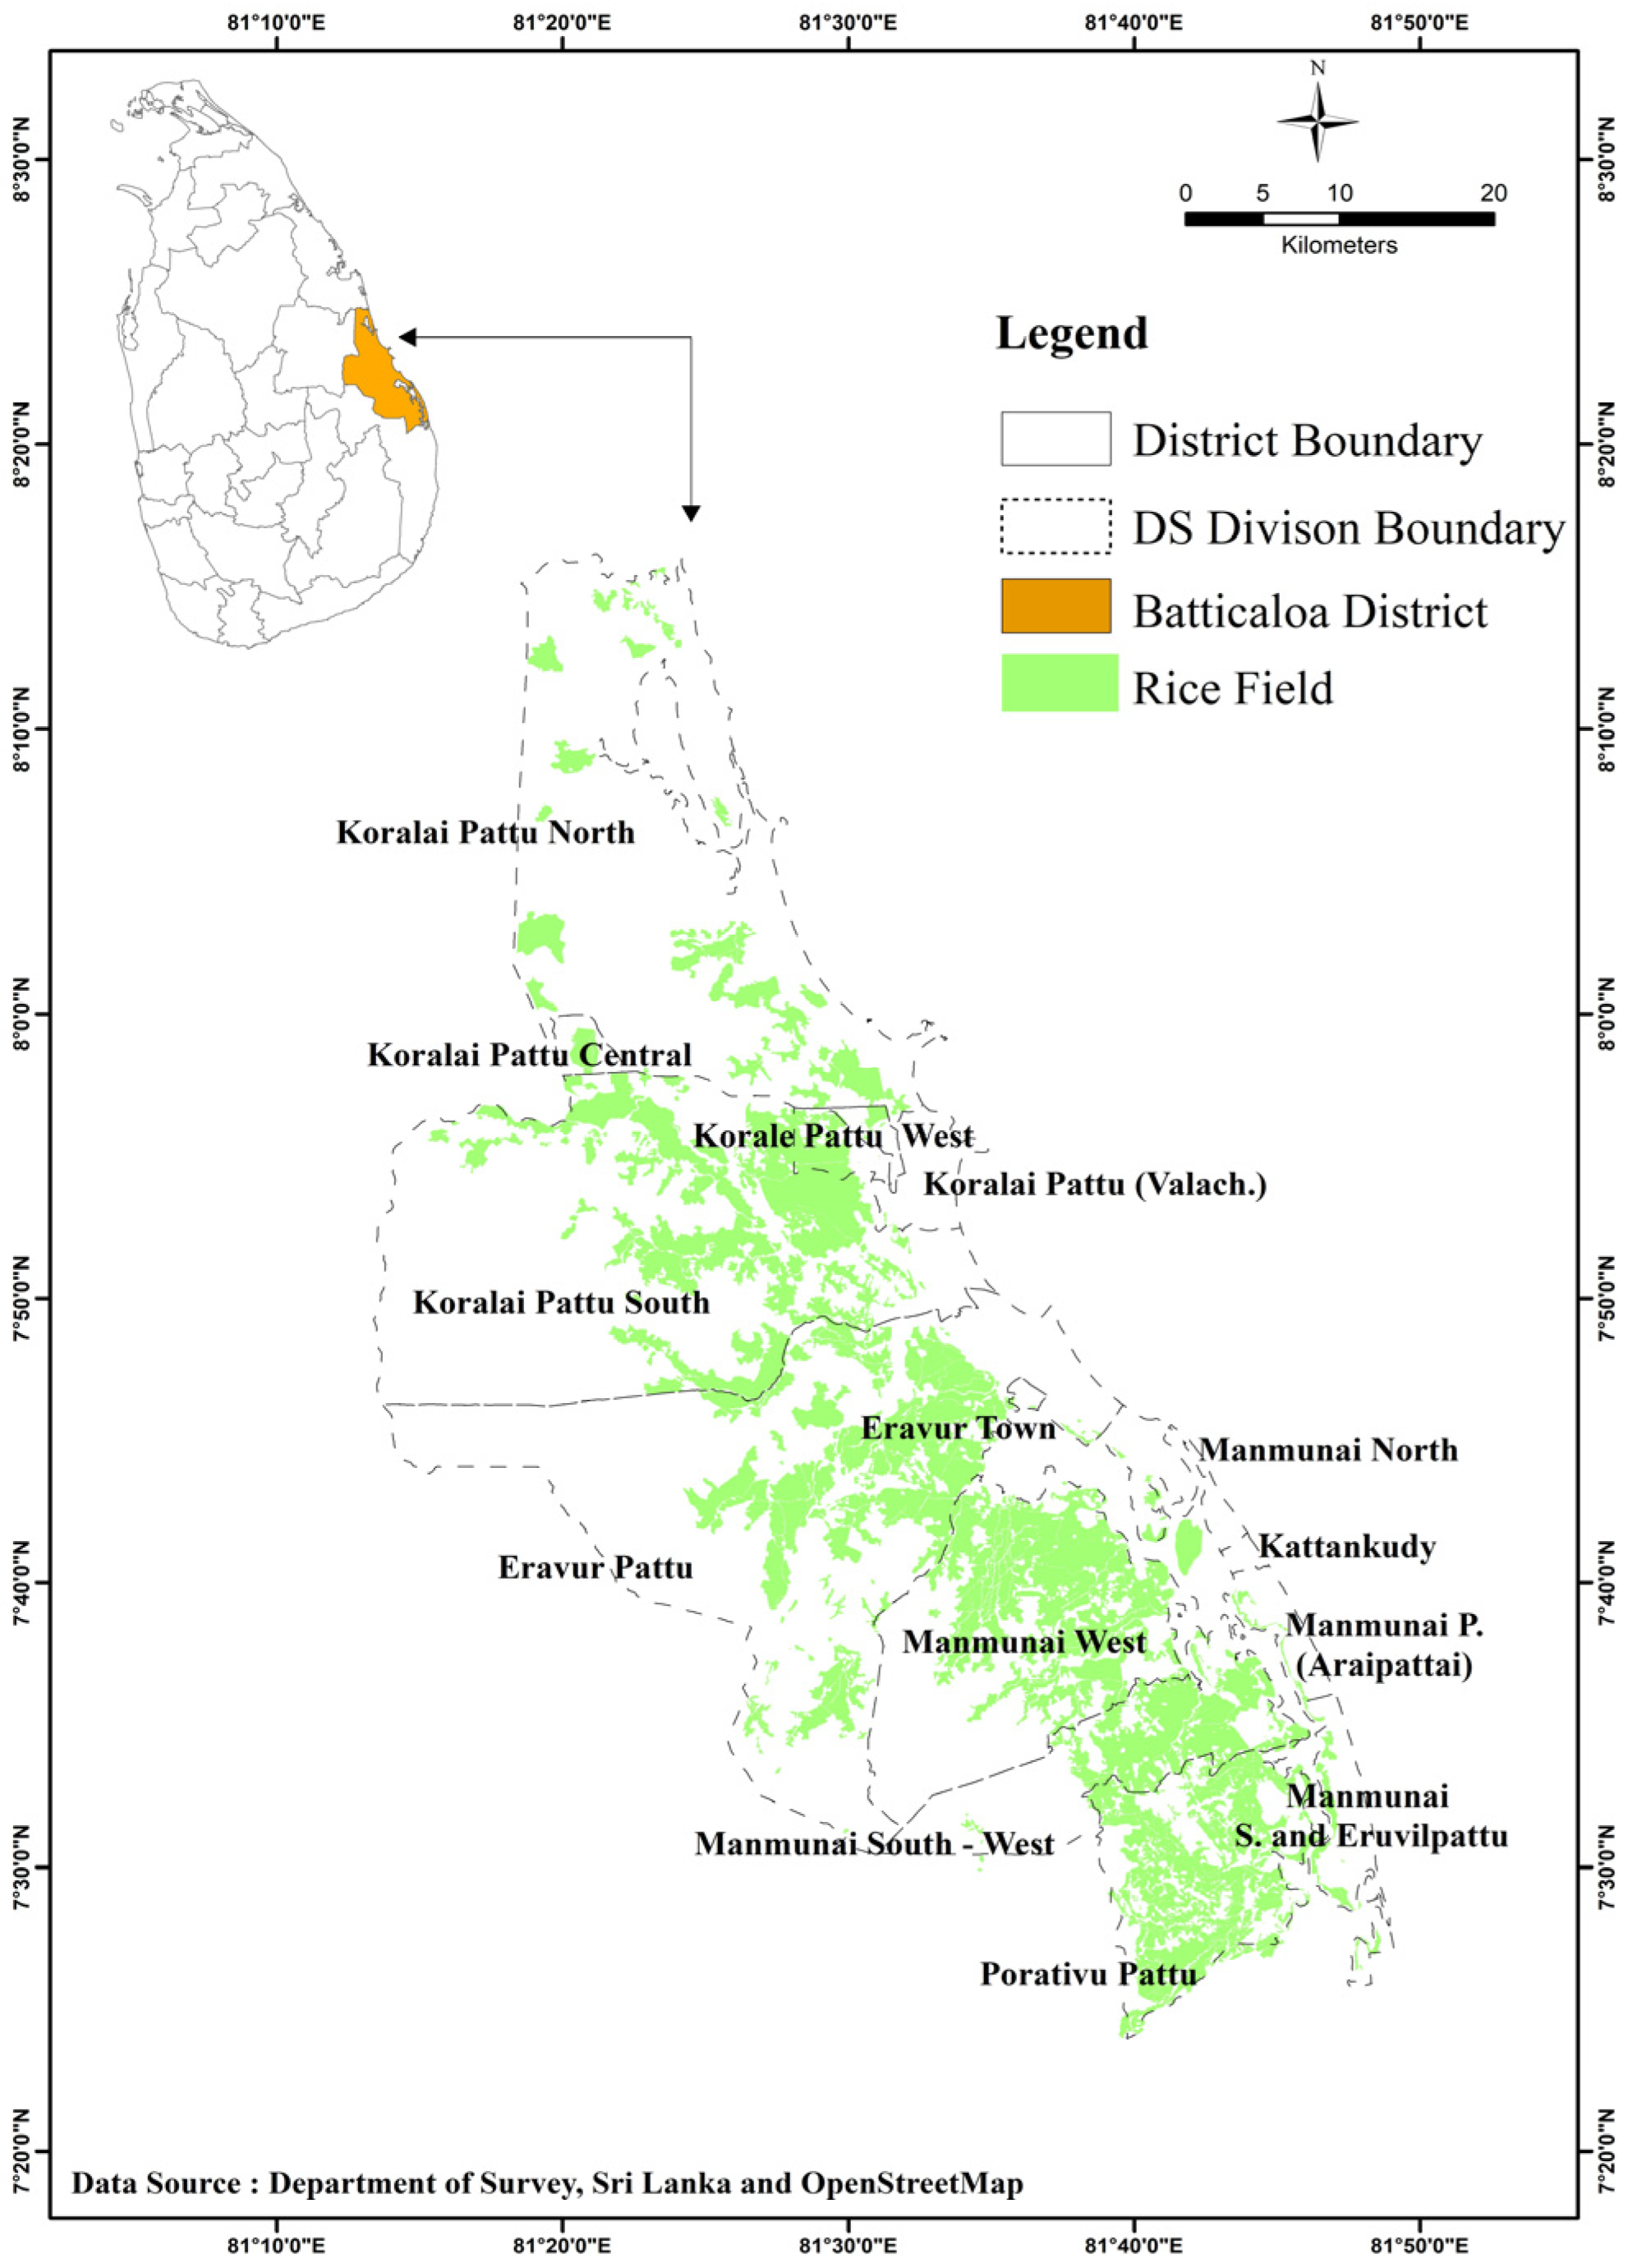
2.1. Study Location
2.2. Data Collection and Analysis
- β0 (Intercept) represents the predicted rice production in the absence of rainfall. While this value may not hold practical significance (since rice cultivation requires water), it provides a baseline for the regression model;
- β1 (Slope) indicates the effect of rainfall on rice production. For example, if β1 = 0.5, it suggests that every additional millimeter of rainfall increases rice production by 0.5 units (e.g., tons).
3. Results and Discussion
3.1. Rice Production Loss and Rice Field Damage in the Maha Season
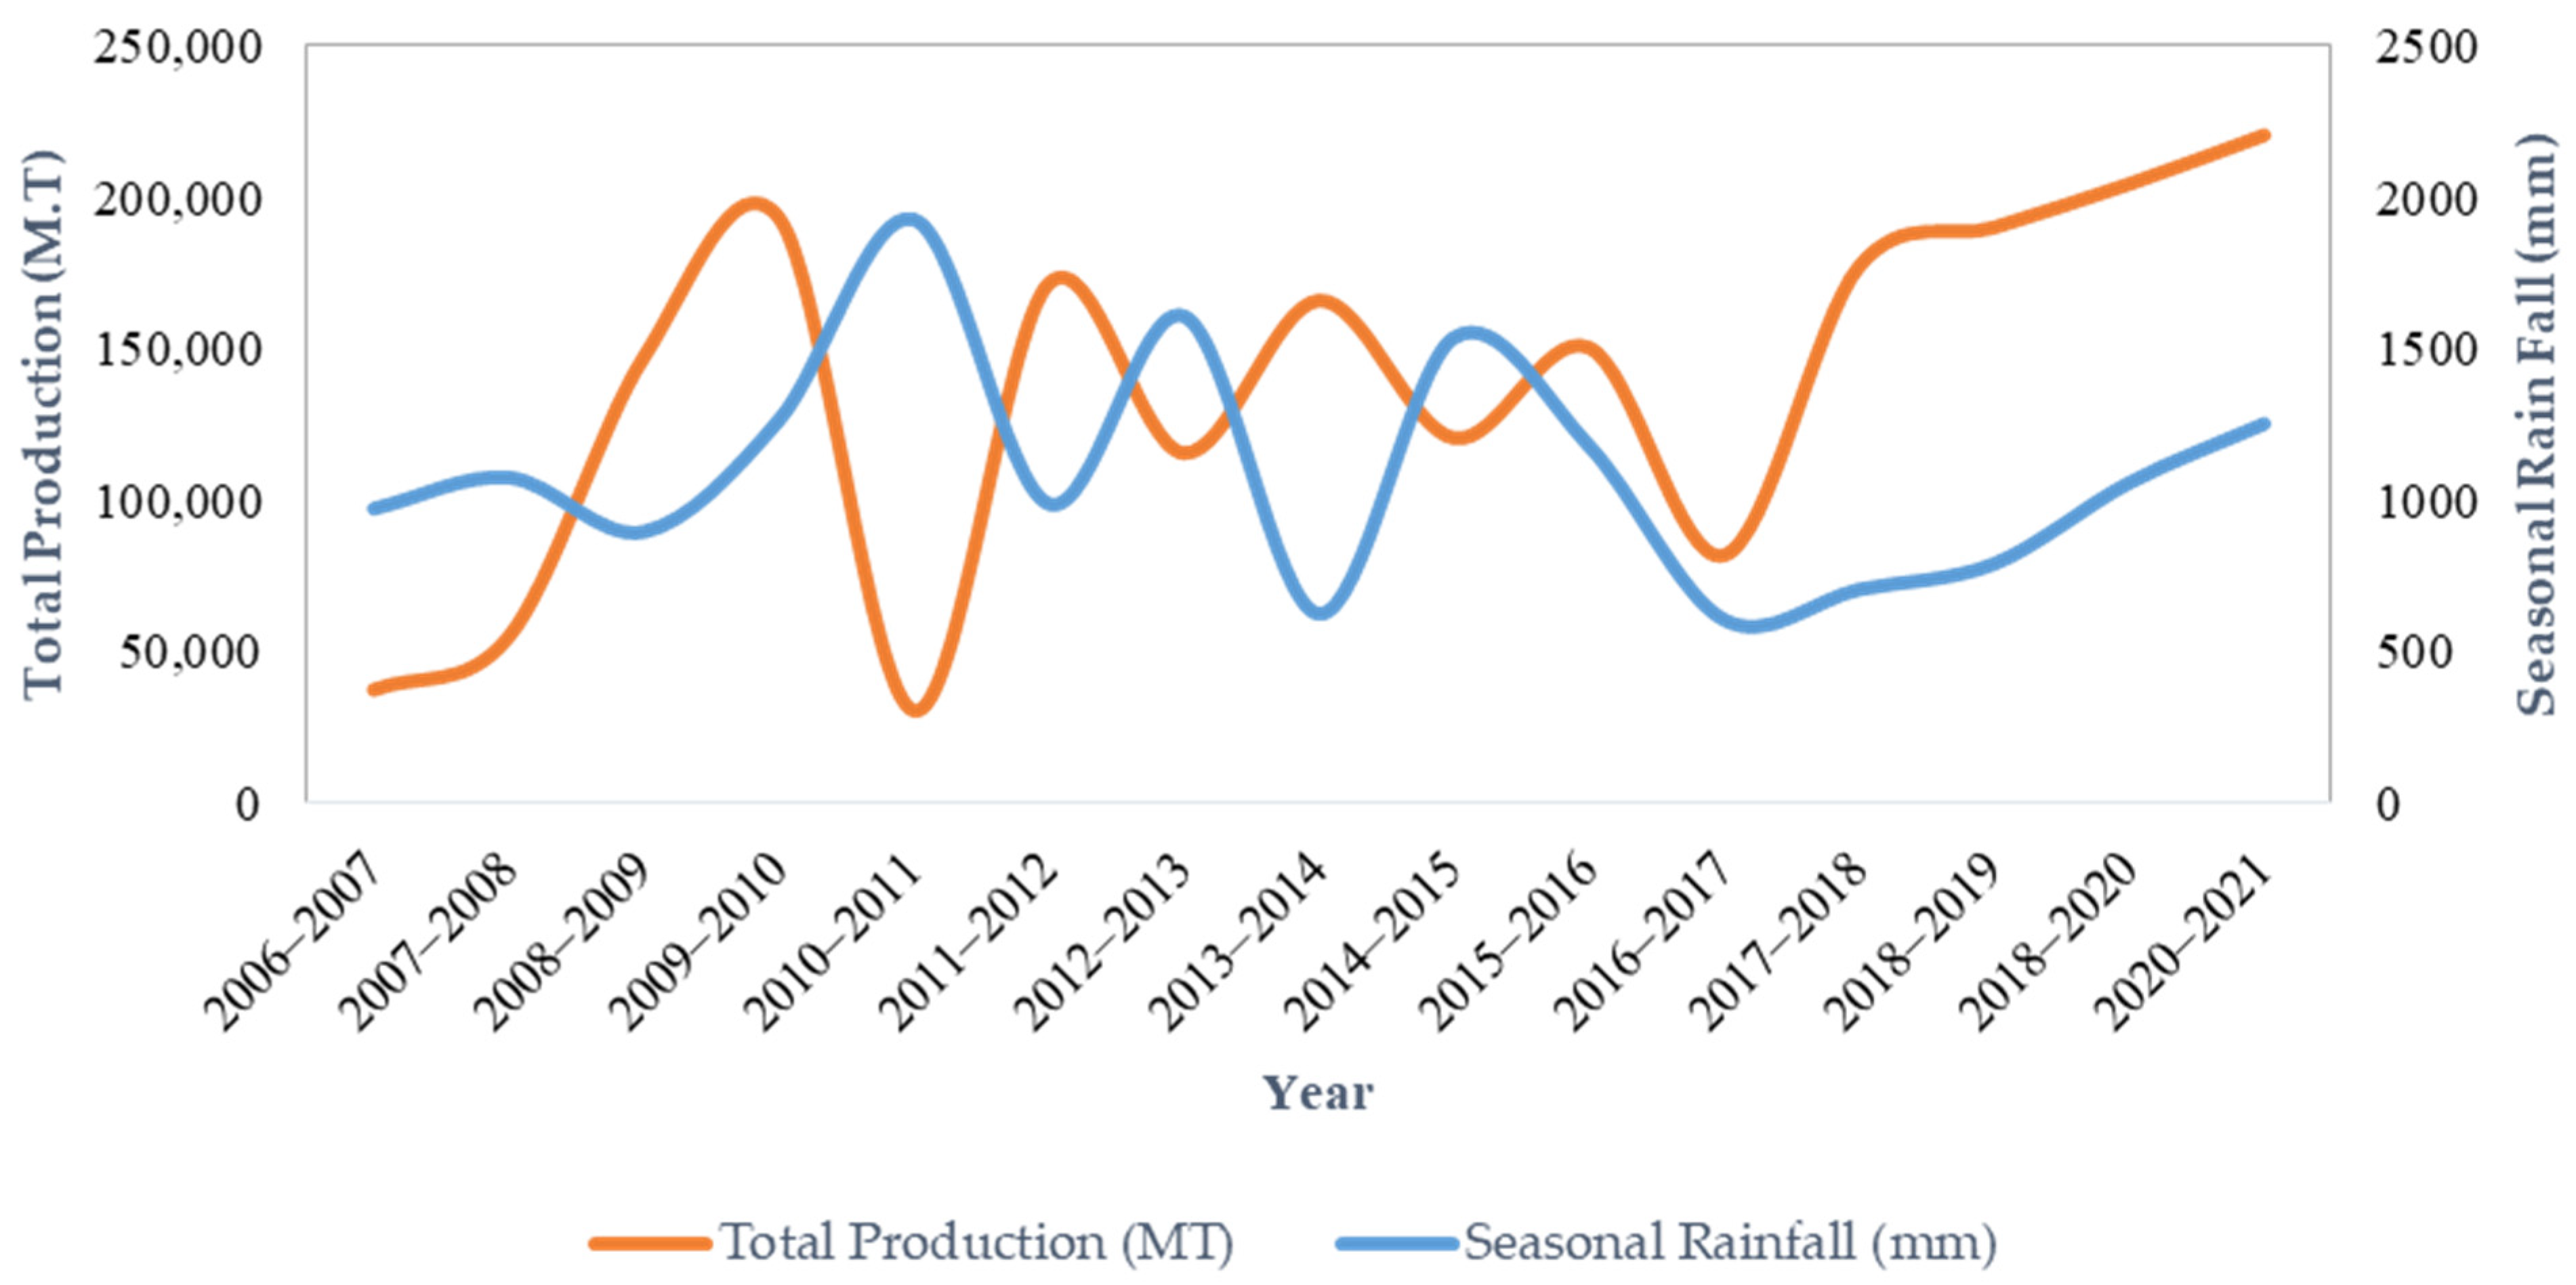
3.2. Patterns in Rainfall, Floods and Rice Production Losses


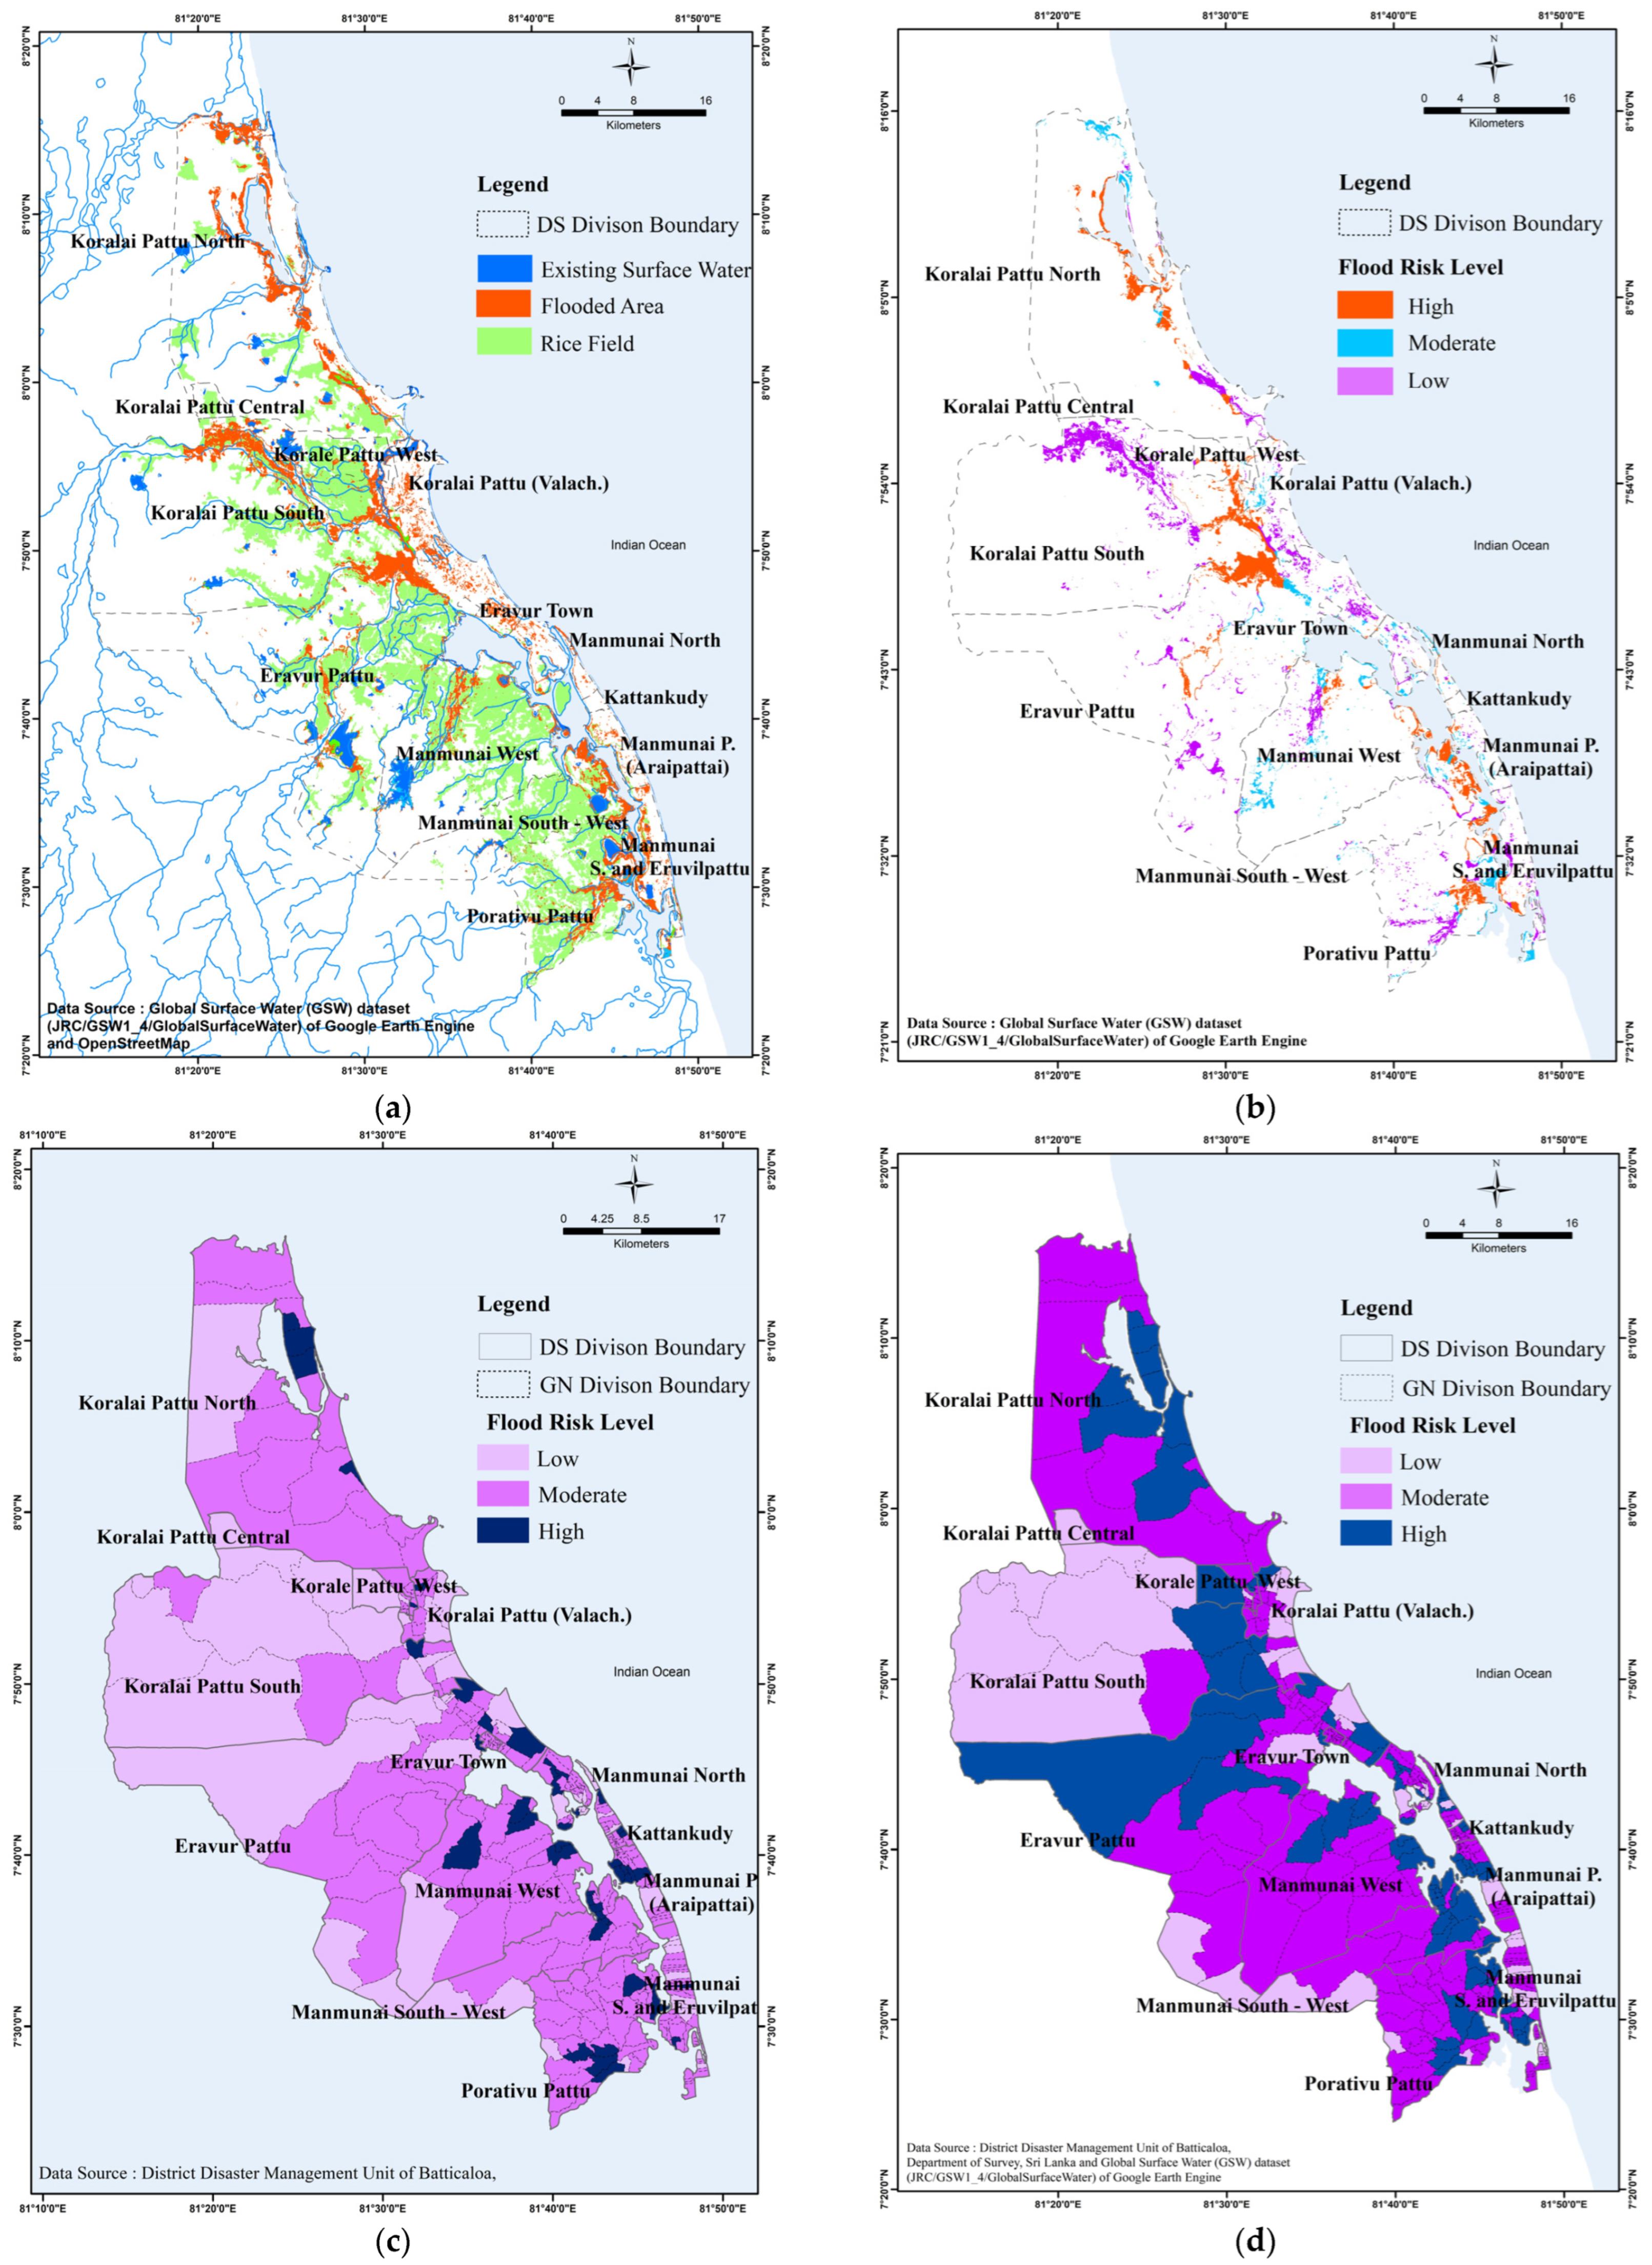
3.3. Flood Exposure
3.4. Correlation Between Total Seasonal Rainfall and Rice Production
4. Conclusions
Author Contributions
Funding
Data Availability Statement
Acknowledgments
Conflicts of Interest
Abbreviations
| DSD | Divisional Secretary Division |
| GND | Grama Niladhari Division |
| CID | Central Irrigation Department |
| GFDDRR | Global Facility for Disaster Reduction and Recovery |
Appendix A. Sample Coding for Rainfall Data Extraction for One Season
- //Define the area
- var aoi = geometry
- //Define start and end Date
- var startDate= '2006-10-01'
- var endDate= '2007-03-31'
- //Define rainfall data
- var imageCollection = 'UCSB-CHG/CHIRPS/DAILY'
- var bandName = 'precipitation'
- var resolution = 5566 //in meters
- //////////////////////////////////
- var rainfall = ee.ImageCollection (imageCollection)
- .filter(ee.Filter.date(startDate, endDate))
- .select(bandName);
- var chart = ui.Chart.image.series ({
- imageCollection: rainfall,
- region: aoi,
- reducer: ee.Reducer.mean(),
- scale: resolution,
- }).setChartType('LineChart')
- .setOptions({
- title: "Daily rainfall from 2006 to 2007",
- vAxis:{ title: "Precipitation mm"},
- hAxis:{title: "Days and Year"}
- })
Appendix B. Coding to Extract Global Surface Water
- // surface water availability
- // Create region of interest
- Map.addLayer(region,{}, "Region");
- Map.centerObject(region,10);
- // Load global surface water
- var water= ee.Image("JRC/GSW1_4/GlobalSurfaceWater");
- // Clip the water image to the region of interest
- var clippedWater = water.clip(region);
- // Water occurrence
- var waterOccurrence = clippedWater.select('occurrence');
- Map.addLayer(waterOccurrence, {palette: ['blue']}, 'Global Water Body');
- // Filter water occurrence images for the specific date range
- var startDate = '2006-10-01';
- var endDate = '2021-03-31';
- // Display the water occurrence for the specified season
- var visWater = {min: 0, max: 100, palette: ['red', 'yellow', 'green']};
- Map.addLayer(waterOccurrence.updateMask(waterOccurrence),visWater,"Water Occurrence Change (" + startDate + " to " + endDate + ")");
- // Define the export parameters
- var exportParams = {
- image: waterOccurrence.updateMask(waterOccurrence),
- description: 'Water_Occurrence_Change_Export',
- folder: 'Your_GEE_Folder_Name',
- scale: 30, // Set the scale (resolution) in meters
- region: region, // Set the region of interest
- maxPixels: 1e13 // Set the maximum number of pixels to export
- };
References
- Dar, M.H.; Chakravorty, R.; Waza, S.A.; Sharma, M.; Zaidi, N.W.; Singh, A.N.; Singh, U.S.; Ismail, A.M. Transforming rice cultivation in flood prone coastal Odisha to ensure food and economic security. Food Secur. 2017, 9, 711–722. [Google Scholar] [CrossRef]
- Panda, D.; Barik, J. Flooding Tolerance in Rice: Focus on Mechanisms and Approaches. Rice Sci. 2021, 28, 43–57. [Google Scholar] [CrossRef]
- Singh, R.; Singh, Y.; Xalaxo, S.; Verulkar, S.; Yadav, N.; Singh, S.; Singh, N.; Prasad, K.S.N.; Kondayya, K.; Rao, P.V.R.; et al. From QTL to variety-harnessing the benefits of QTLs for drought, flood and salt tolerance in mega rice varieties of India through a multi-institutional network. Plant Sci. 2015, 24, 278–287. [Google Scholar] [CrossRef]
- Shrestha, B.B.; Perera, E.D.P.; Kudo, S.; Miyamoto, M.; Yamazaki, Y.; Kuribayashi, D.; Sawano, H.; Sayama, T.; Magome, J.; Hasegawa, A.; et al. Assessing flood disaster impacts in agriculture under climate change in the river basins of Southeast Asia. Nat. Hazards 2019, 97, 157–192. [Google Scholar] [CrossRef]
- Lyly, S. The Study on Flood’s Impact on Rice Production in Sandek Commune Bathay District Kampong Cham. IJERD-Int. J. Environ. Rural Dev. 2013, 4, 142–146. [Google Scholar]
- Thanuejah, S.; Sutharsan, S. Effect of Flooding on the Socio-Economic Characters of Paddy Producing Divisional Secretariat Divisions of Batticaloa District. In Proceedings of the 2nd International Symposium, South Eastern University of Sri Lanka, Ampara, Sri Lanka, 25–27 May 2012. [Google Scholar]
- Prakashnie, M.P.; Nianthi, K.W.G.R. Impacts of Floods on the Agriculture Sector: A Case Study of Porathivu Pattu Division in The East Coastal Batticaloa District of Sri Lanka. J. Indian Soc. Coast. Agric. Res. 2020, 38, 15–22. [Google Scholar]
- Hewawasam, V.; Matsui, K. Small and Medium-Sized Entrepreneurs’ Perceptions of Flood Loss and Damage in Sri Lanka. Climate 2023, 11, 157. [Google Scholar] [CrossRef]
- Hewawasam, V.; Matsui, K. Assessing Community Perceptions on Urban Flood Resilience in Sri Lanka. Geosciences 2022, 12, 406. [Google Scholar] [CrossRef]
- District Profile. Grama Niladhari Divisions Statistics 2020; Department of Census and Statistics: Batticaloa, Sri Lanka, 2020. Available online: http://www.statistics.gov.lk/Resource/en/Population/GND_Reports/2020/Batticaloa.pdf (accessed on 10 August 2024).
- Amarasingam, N.; Sugirtharan, M. Modelling the Crop Water Requirement in Batticaloa District, Sri Lanka: FAO-Cropwat Modelling for Rice. In Proceedings of the 4th Jaffna University International Research Conference, University of Jaffna, Jaffna, Sri Lanka, 27–28 September 2018. [Google Scholar]
- Department of Meteorology. Weather Forecast 2025; Department of Meteorology: Colombo, Sri Lanka, 2025. Available online: https://weather.meteo.gov.lk/#collapseOne (accessed on 20 May 2025).
- Suppiah, R.; Yoshino, M. Some Agroclimatological Aspects of Rice Production in Sri Lanka. Geogr. Rev. Jpn. 1986, 59, 137–153. [Google Scholar] [CrossRef]
- Suresh, K.; Wilson, C.; Khanal, U.; Managi, S.; Santhirakumar, S. How productive are rice farmers in Sri Lanka? The impact of resource accessibility, seed sources and varietal diversification. Heliyon 2021, 7, e07398. [Google Scholar] [CrossRef] [PubMed]
- Marambe, B.; Punyawardena, R.; Silva, P.; Premalal, S.; Rathnabharathie, V.; Kekulandala, B.; Nidumolu, U.; Howden, M. Climate, Climate Risk, and Food Security in Sri Lanka: The Need for Strengthening Adaptation Strategies. In Handbook of Climate Change Adaptation; Filho, W.L., Ed.; Springer: Berlin/Heidelberg, Germany, 2015; pp. 1759–1789. [Google Scholar]
- Census. District Statistic Handbook 2023: Batticaloa; Department of Census and Statistics: District Secretariat: Batticaloa, Sri Lanka, 2023. [Google Scholar]
- Paddy details. Details of the Rice Production and Rice Farm; Department of Agrarian Development: Batticaloa, Sri Lanka, 2023. [Google Scholar]
- Central Bank of Sri Lanka. Annual Report 2022; Central Bank of Sri Lanka: Colombo, Sri Lanka, 2022. Available online: https://www.cbsl.gov.lk/en/publications/economic-and-financial-reports/annual-reports/annual-report-2022 (accessed on 1 December 2023).
- Ministry of Agriculture, Livestock, Land and Irrigation. Majority of Farmers in Batticaloa and Trincomalee Districts Commenced Paddy Harvesting These Days. Available online: https://www.agrimin.gov.lk/web/index.php/news-scroll/1695-2022-02-24-2 (accessed on 10 August 2024).
- Census. Paddy Statistics 2018–2019; Department of Census and Statistics: Colombo, Sri Lanka, 2019. Available online: https://www.statistics.gov.lk/Agriculture/StaticalInformation/PaddyStatistics/PaddyStatistics/2018-19MahaSeason (accessed on 10 August 2024).
- Census. Paddy Statistics 2020–2021; Department of Census and Statistics: Colombo, Sri Lanka, 2021. Available online: https://www.statistics.gov.lk/Agriculture/StaticalInformation/PaddyStatistics/PaddyStatistics/2020-21MahaSeason (accessed on 10 August 2024).
- Nilanthini, P. The Batticaloa District Under British Administration A.D.1796–1948. Ph.D. Thesis, University of Kelaniya, Kelaniya, Sri Lanka, 2016. [Google Scholar]
- Disaster Management Centre. Batticaloa District Flood Contingency Plan (2022/2023); District Secretariat: Batticaloa, Sri Lanka, 2023. [Google Scholar]
- OpenStreetMap. Hot Export Tool. Available online: https://export.hotosm.org/en/v3/exports/new/describe (accessed on 1 October 2023).
- District Planning Statistic. District Planning Statistic Book; District Planning Division: Batticaloa, Sri Lanka, 2011. [Google Scholar]
- JICA. Data Collection Survey on Disaster Risk Reduction Sector in Sri Lanka Final Report. Available online: https://openjicareport.jica.go.jp/pdf/12291944.pdf (accessed on 10 July 2024).
- Census. Paddy Statistics—2007–2021; Department of Census and Statistics: Colombo, Sri Lanka. Available online: http://www.statistics.gov.lk/Agriculture/StaticalInformation/PaddyStatistics (accessed on 10 August 2024).
- Yuen, K.W.; Switzer, A.D.; Teng, P.P.S.; Lee, J.S.H. Statistics on Typhoon Intensity and Rice Damage in Vietnam and the Philippines. GeoHazards 2024, 5, 22–37. [Google Scholar] [CrossRef]
- Riskinfo. Flood Layer. Sri Lanka Disaster Risk Information Platform. Disaster Management Centre. Sri Lanka. 2017. Available online: https://www.geoedge.lk/portfolio/disaster-risk-information-platform-riskinfo-lk/ (accessed on 1 October 2023).
- Acted. Area-Based Risk Assessment in Koralai Pattu South Divisional Secretariat Division—Batticaloa District, May 2024. Available online: https://reliefweb.int/report/sri-lanka/sri-lanka-area-based-risk-assessment-koralai-pattu-south-divisional-secretariat-division-batticaloa-district-may-2024 (accessed on 25 March 2025).
- Desalegn, H.; Mulu, A. Mapping flood inundation areas using GIS and HEC-RAS model at Fetam River, Upper Abbay Basin, Ethiopia. Sci. Afr. 2021, 12, e00834. [Google Scholar] [CrossRef]
- Bukari, S.M.; Ahmad, M.A.; Wai, T.L.; Kaamin, M.; Alimin, N. Spatial Analysis in Determination of Flood Prone Areas Using Geographic Information System and Analytical Hierarchy Process at Sungai Sembrong’s Catchment. IOP Conf. Ser. Mater. Sci. Eng. 2016, 136, 012041. [Google Scholar] [CrossRef]
- Sakagami, J.-I.; Kawano, N. Survival of submerged rice in a flood-prone region of West Africa. Tropics 2011, 20, 55–66. [Google Scholar] [CrossRef]
- Sri Lanka: Drought: 2016/10/01–2017/02/28. Available online: https://web.adrc.asia/view_disaster_en.php?NationCode=&Lang=en&Key=2166 (accessed on 10 August 2024).
- Disaster Management Centre Situation Report. 2017. Available online: https://www.adrc.asia/counterpart_report/SriLanka201702/Current-Situation20170202.pdf (accessed on 10 August 2024).
- Prasanna, R.P.I.R. Economic costs of drought and farmers’ adaptation strategies: Evidence from Sri Lanka. Sri Lanka J. Econ. Res. 2018, 5, 61–79. [Google Scholar] [CrossRef]
- Hemachandra, E.M.G.P.; Dayawansa, N.D.K.; De Silva, R.P. Application of Standard Precipitation Index (SPI) to Assess Rainfall variability in a Major Agricultural Area in Dry Zone of Sri Lanka. Trop. Agric. Res. 2021, 32, 276–286. [Google Scholar] [CrossRef]
- Google Earth Engine. JRC Global Surface Water Mapping Layer and Precipitation Data. Available online: https://code.earthengine.google.com/ (accessed on 1 June 2023).
- Dharmasena, P.B. Irrigation and Water Management: Possible Interventions for Batticaloa District Improving System Efficiencies and Water Productivity Project GCP/SRL/062/EC EU-Support to District Development Programme. 2012. Available online: https://www.researchgate.net/publication/372900745 (accessed on 8 January 2025).
- Worldpress. Irrigation Heritage in Sri Lanka. 2012. Available online: https://irrigationsrilanka.wordpress.com/2012/07/25/mundeni-aru-river-basin/ (accessed on 25 March 2025).
- Disaster Management Centre. Launching of National Disaster Risk Information Platform (RiskInfo.lk). 2017. Available online: https://www.dmc.gov.lk/index.php?Itemid=125&catid=8&id=89%3Alaunching-of-national-disaster-risk-information-platform-riskinfo&lang=en&option=com_content&view=article (accessed on 10 March 2025).
- Disaster Management Centre. Flood Risk Zone in Batticaloa District; Disaster Management Unit: Batticaloa, Sri Lanka, 2025. [Google Scholar]
- Climate Fact Checks. Natural Disasters of Sri Lanka in the Last Several Decades and the Contributions of Climate Change. 2023. Available online: https://climatefactchecks.org/natural-disasters-of-sri-lanka-in-the-last-several-decades-and-the-contributions-of-climate-change/ (accessed on 1 October 2024).
- UNOCHA. UN Assesses Flood Affected in Sri Lanka. 2017. Available online: https://www.unocha.org/publications/report/sri-lanka/un-assesses-flood-affected-sri-lanka (accessed on 1 October 2024).


| Year | Gross Extent (Ha) | Net Extent Harvested (Ha) | Net Average Yield Per Hectare (MT) | Total Production (MT) | Yield | Damage (Ha) | Production Loss (MT) | Production Loss % |
|---|---|---|---|---|---|---|---|---|
| 2006–2007 | 18,469 | 14,685 | 2.6 | 37,476 | 2.0 | 3784 | 9657 | 20.5 |
| 2007–2008 | 19,134 | 17,030 | 3.2 | 55,020 | 2.9 | 2104 | 6798 | 11.0 |
| 2008–2009 | 45,905 | 45,854 | 3.2 | 147,278 | 3.2 | 51 | 164 | 0.1 |
| 2009–2010 | 54,855 | 54,329 | 3.6 | 193,274 | 3.5 | 526 | 1871 | 1.0 |
| 2010–2011 | 59,520 | 14,424 | 2.1 | 30,539 | 0.5 | 45,096 | 95,479 | 75.8 |
| 2011–2012 | 59,470 | 52,115 | 3.3 | 171,715 | 2.9 | 7355 | 24,234 | 12.4 |
| 2012–2013 | 66,276 | 62,747 | 1.8 | 115,630 | 1.7 | 3529 | - | 5.3 |
| 2013–2014 | 62,204 | 62,204 | 2.7 | 166,010 | 2.7 | 0 | 0 | 0.0 |
| 2014–2015 | 61,014 | 50,866 | 2.4 | 120,570 | 2.0 | 10,148 | 24,054 | 16.6 |
| 2015–2016 | 61,988 | 56,401 | 2.7 | 150,434 | 2.4 | 5587 | 14,902 | 9.0 |
| 2016–2017 | 62,836 | 36,866 | 2.2 | 81,878 | 1.3 | 25,970 | 57,678 | 41.3 |
| 2017–2018 | 64,796 | 64,796 | 2.7 | 177,288 | 2.7 | 0 | 0 | 0.0 |
| 2018–2019 | 67,214 | 67,214 | 2.8 | 190,167 | 2.8 | 0 | 0 | 0.0 |
| 2019–2020 | 66,996 | 61,244 | 3.3 | 204,489 | 3.1 | 5752 | 19,205 | 8.6 |
| 2020–2021 | 67,074 | 65,630 | 3.4 | 220,640 | 3.3 | 1444 | 4855 | 2.2 |
| Source | SS | df | MS | Number of obs | =15 | |
|---|---|---|---|---|---|---|
| F (1, 13) | =1.24 | |||||
| Model | 0.881673533 | 1 | 0.881673533 | Prob > F | =0.2859 | |
| Residual | 9.25584399 | 13 | 0.71198 | R-squared | =0.0870 | |
| Total | 10.1375175 | 14 | 0.724108395 | RootMSE | =0.84379 | |
| Variables | Coef. | Std. Err. | t | p > |t| | 95% Conf. | Interval |
| tsrf | −0.0006726 | 0.0006044 | −1.11 | 0.286 | −0.0019783 | 0.0006332 |
| cons | 3.396023 | 0.9431542 | 3.60 | 0.003 | 1.358462 | 5.433583 |
Disclaimer/Publisher’s Note: The statements, opinions and data contained in all publications are solely those of the individual author(s) and contributor(s) and not of MDPI and/or the editor(s). MDPI and/or the editor(s) disclaim responsibility for any injury to people or property resulting from any ideas, methods, instructions or products referred to in the content. |
© 2025 by the authors. Licensee MDPI, Basel, Switzerland. This article is an open access article distributed under the terms and conditions of the Creative Commons Attribution (CC BY) license (https://creativecommons.org/licenses/by/4.0/).
Share and Cite
Sundaralingam, S.; Matsui, K. Assessing the Impact of Past Flood on Rice Production in Batticaloa District, Sri Lanka. Geosciences 2025, 15, 218. https://doi.org/10.3390/geosciences15060218
Sundaralingam S, Matsui K. Assessing the Impact of Past Flood on Rice Production in Batticaloa District, Sri Lanka. Geosciences. 2025; 15(6):218. https://doi.org/10.3390/geosciences15060218
Chicago/Turabian StyleSundaralingam, Suthakaran, and Kenichi Matsui. 2025. "Assessing the Impact of Past Flood on Rice Production in Batticaloa District, Sri Lanka" Geosciences 15, no. 6: 218. https://doi.org/10.3390/geosciences15060218
APA StyleSundaralingam, S., & Matsui, K. (2025). Assessing the Impact of Past Flood on Rice Production in Batticaloa District, Sri Lanka. Geosciences, 15(6), 218. https://doi.org/10.3390/geosciences15060218