Article

A Digital Analysis of the ‘Phoenix Trackway’ at the Hanxi Cretaceous Dinosaur Tracksite, China

by
Anthony Romilio
1,2,* and
Lida Xing
3,4
1
School of the Environment, The University of Queensland, St. Lucia, Queensland 4072, Australia
2
School of Veterinary Science, The University of Queensland, Gatton, Queensland 4343, Australia
3
State Key Laboratory of Biogeology and Environmental Geology, China University of Geosciences, Beijing 100083, China
4
School of the Earth Sciences and Resources, China University of Geosciences (Beijing), Beijing 100083, China
*
Author to whom correspondence should be addressed.
Geosciences 2025, 15(5), 165; https://doi.org/10.3390/geosciences15050165
Submission received: 27 February 2025 / Revised: 16 April 2025 / Accepted: 30 April 2025 / Published: 3 May 2025

Abstract

:
Long dinosaur trackways provide valuable records of trackmaker behaviour, yet their study is often hindered by logistical challenges in documentation and analysis. This study addresses these limitations by employing digital methodologies to re-analyse the Lower Cretaceous HX-T3 theropod trackway, originally mapped in 2015. At nearly 70 m in length, this is the longest documented theropod trackway in China. Using digital mapping, 81 footprints were examined, revealing a consistent southward orientation between 163° and 187° azimuth, a trackway width of 0.008 to 0.300 m, and pace and stride lengths ranging from 0.707 to 1.176 m and 1.408 to 2.043 m, respectively. A potential trackmaker, Yutyrannus, was used to estimate a hip height of 1.13 m in a bent-legged stance, with relative stride values indicating a consistent walking gait at a median speed of 5.3 km/h. A digital life reconstruction animated in a bent-legged stance allowed the translation of ichnological data into a real-time reconstruction of trackmaker locomotion, providing dynamic insight into behavioural movement and avoiding unrealistic limb dislocations associated with straight-leg models. This study highlights the efficacy of digital methods in overcoming field-based limitations, integrating trace and body fossil evidence to enhance previous research.

1. Introduction

Tracks and trackways are the result of interactions between a trackmaker’s volar surface (plantar/palmar) and a substrate [1,2]. Since footprints can only be created by living trackmakers, they can provide unique insights into the locomotor behaviour of an organism, even in the absence of direct observations during track registration [3]. When fossilised, tracks and trackways become an invaluable link to understanding the behaviour, movement, and environment of extinct trackmaker organisms [4,5,6,7,8,9]. Here, the morphology of footprints, along with the spacing between tracks, can aid in identifying the type and size of trackmakers, and provide insights into their gait and speed at the time of track registration (respectively) [10,11]. Substrate characteristics can reveal details about the palaeoenvironment where the trackmaker(s) lived and its sedimentology [12,13,14,15]. Additionally, the presence or absence of other footprints can indicate social behaviours (e.g., herding or solitary) [16,17,18,19,20], and show the temporospatial co-occurrence with other trackmaker species [21,22,23].
Long fossil trackways, spanning tens to hundreds of meters, provide a more continuous record of a trackmaker’s ‘living’ behaviour compared to short sequences [24,25,26,27,28]. Despite their potential to reveal insights into behavioural consistency or variability over time, extensive trackways are among the least studied in dinosaur track research, primarily due to the logistical challenges of analysing large surfaces with traditional methods [27,29,30,31].
Approaches to documenting tracksites with long trackways have traditionally relied on using acetate plastic sheets laid over the track-bearing surface, on which footprints are drawn [32,33,34], but then digitised to create track surface maps [35,36]. While more current photogrammetric methods provide comprehensive 3D topographical data [14,37], assessing trackway parameters in long and very long trackways still presents additional challenges when using traditional techniques.
In the current study, we address these challenges by leveraging digital analyses to conduct measurements and calculations of trackway parameters and trackmaker biometrics. By utilising a digital approach, we seek to provide a more comprehensive evaluation of the fossil trackway record, uncovering subtle variations within the trackway and revealing behavioural details of the trackmaker that are otherwise inaccessible through traditional methods.
Here, we focus on the Hanxi tracksite HX-T3 trackway, located southwest of Hanxi Village (formerly Louge Village) in Guihua Township, Gulin County, Sichuan Province, China. Known locally as ‘Shifengwo’ or ‘the stone phoenix nests’, this trackway has deep cultural significance, with tracks once imagined by villagers to have been left by a phoenix, as mentioned in a local poem from the Late Qing Dynasty (~1840–1911).
The trackway itself represents the longest theropod trackway in East Asia, comprising 81 successive footprints and spanning nearly 70 m, and was documented in 2015 from the Lower to Upper Cretaceous Jiaguan Formation (late Hauterivian to late Santonian; 128.0–83.6 Ma) [38]. While a tracksite map was produced and digitised using traditional methods ([38] Figures 3B and 4), this trackway has not previously been subjected to detailed quantitative analysis beyond general descriptive observations.

2. Materials and Methods

2.1. Digital Landmarking and Analysis

The HX-T3 trackway was sourced from the published literature ([38] Figures 3B and 4) and imported into the open-source software Blender (version 4.0). The image was scale-corrected using the 10 m scalebar and oriented with north aligned to Blender’s +Y axis.
Two sets of landmarks were placed on the HX-T3 trackway: one for the footprint length and the other to mark the spatial positions of each mapped footprint. For the footprint length, we created a line of two vertices representing the average HX-T3 footprint (0.3 m) [38]. For the footprint spatial positions, we created a line by sequentially placing vertices at the proximal-most portion of each track to represent the positions of the footprints within the trackway. The proximal-most position was selected for vertex placement because it was the most consistently preserved feature of the footprints across the trackway and thus a reliable reference point for trackway parameter measurements. Vertices were placed on tracks 1–68 and 74–81. For the eroded tracks 68–72, whose precise positions were unclear, we approximated their locations by placing five equidistant vertices along the path between track 68 and track 74. However, measurement data from these were not used in the calculation of average and median values.
A custom Python script was developed to measure inter-footprint distances and perform calculations necessary to obtain trackway parameter and trackmaker biometric data. These included, but were not limited to calculations of stride length, pace angulation, and estimated speed, following methods previously described [39,40].

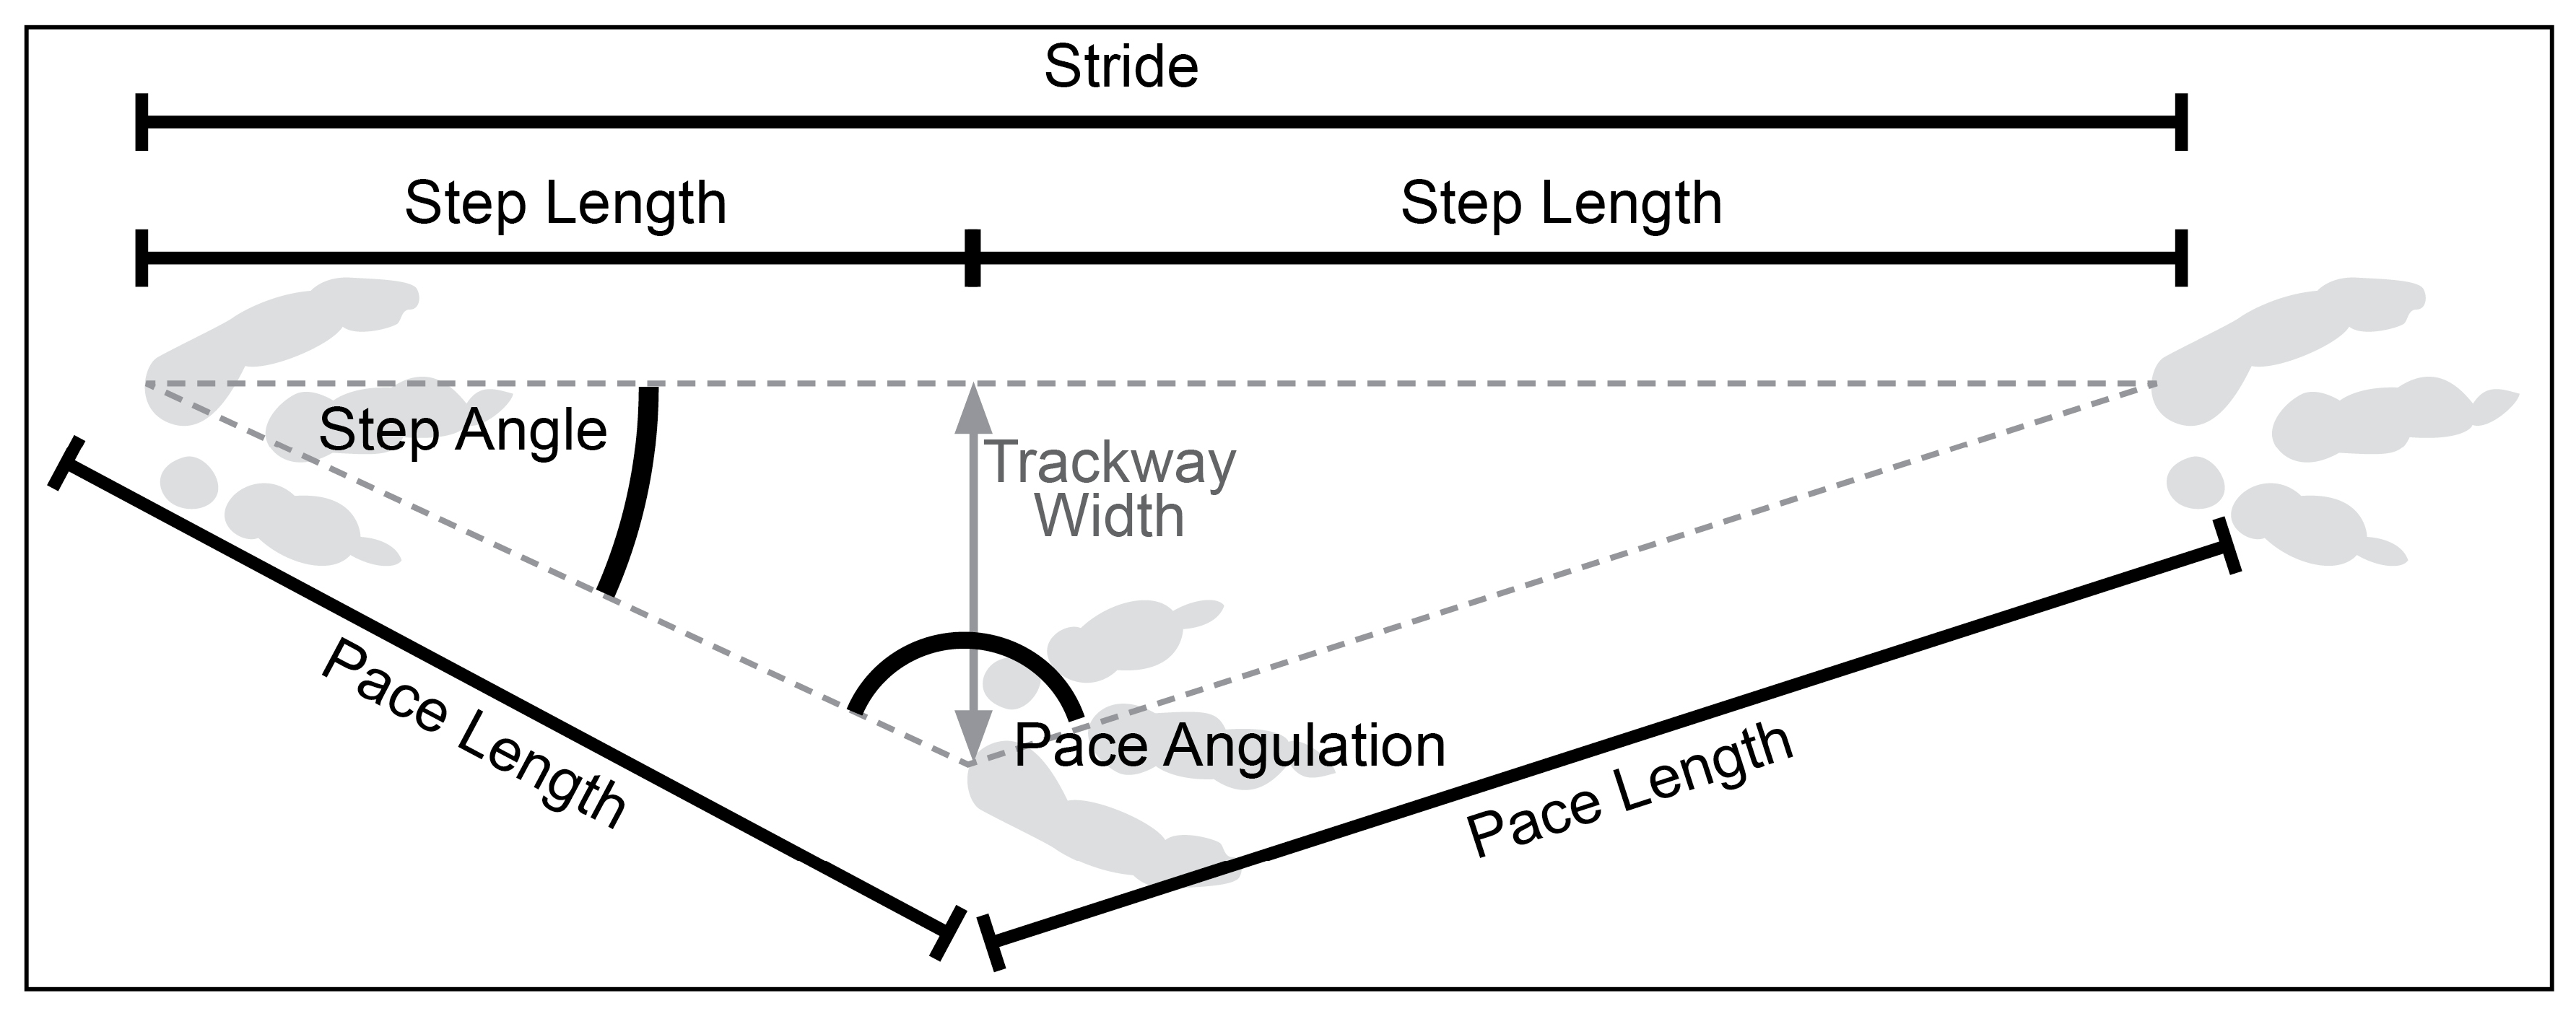
2.2. Trackway Parameter Calculations

Length measurements (i.e., pace, stride) measured the distance between the point at the start (x1, y1) and the end (x2, y2) of the respective trackway parameter using Equation (1) (Figure 1).
Length = ((x2 − x1)2 + (y2 − y1)2)0.5
Pace angulation and step angle [the latter equivalent to ‘angle of divergence’ sensu 10] were determined following Thulborn [10]. As the trackmaker narrows the width between its legs, the pace angulation approaches 180°, while the step angle approaches 0°. Pace angulation measured the angle between two successive pace lengths (Equation (2)), while step angle measured the angle between the pace and stride (Equation (3)), using the formula shown by Thulborn [10].
Cos (pace angulation) = ((pace1)2 + (pace2)2 − (stride)2)/(2 × pace1 × pace2)
Cos (step angle) = ((pace1)2 + (stride)2 − (pace2)2)/(2 × pace1 × stride)
Trackway width was considered the distance between footprints measured perpendicular to the stride orientation, using Equation (4) (Figure 1).
Trackway width = pace × sin (step angle)
Step length (not to be confused with pace length) was the distance between successive footprints when measured parallel to the stride, using Equation (5) (Figure 1).
Step length = (pace2 − trackway width2)0.5
The path length was defined as the distance covered by the trackmaker along the trackway trajectory and was calculated by summing all step lengths.
Tortuosity quantifies the degree to which a path deviates from a straight line, and has been applied in dinosaur track research [41]. It is expressed as a ratio of the direct straight-line distance (DL) between the first and last footprints, to the total length of the path (TL), as in Equation (6):
T o r t u o s i t y = D L T L
With this equation, straighter paths will have numerical values closer to ‘one’, whereas values closer to ‘zero’ represent paths that loop back on themselves.

2.3. Trackmaker Biometrics

Trackmaker biometrics encompass a range of calculations derived from an inferred hip height of an unobserved trackmaker. These included relative stride, relative step, speed, cadence (step frequency), step duration, time on tracksite, and speeds during gait transitions (from walk-to-slow run, and slow run-to-run).
A traditional hip height estimation for dinosaur trackmakers uses a uniform scaling factor in which the footprint length is multiplied by four [42]. However, dinosaur clades differ in their limb proportions and foot morphologies, prompting the development of group- and size-specific scaling equations that incorporate morphometric and allometric considerations—particularly for theropod and ornithopod trackmakers [10]. Despite this refinement, it has been demonstrated that clade-specific predictors can yield larger discrepancies when compared to hip heights derived from associated body fossils than the simpler four-multiplier method. Consequently, the traditional scaling factor continues to be supported in some contexts due to its relatively consistent alignment with known limb proportions [43].
The approach used here diverges from simplifying hip-to-foot length ratios to a single representative anatomy (i.e., footprint length multiplied by four as hip height). Instead, our study adopts a more targeted approach, using a specific dinosaur taxon—Yutyrannus huali—as the basis for hip height estimation. This species was selected, in part, as it is a Chinese theropod taxon with complete hindlimb elements [44]. While this approach entails its own assumptions, it allows for a more anatomically informed reconstruction of trackmaker biometrics.
Importantly, the authors acknowledge that an appropriate candidate should share similarities in body size, temporal occurrence, and geographic proximity [45]. The HX-T3 trackway, from Sichuan Province, occurs within the Jiaguan Formation, which spans from approximately 128.0 to 83.6 million years ago (late Hauterivian to late Santonian stages) [46]. Although this region is rich in dinosaur footprints, there is a scarcity of corresponding skeletal material that could help identify a precise trackmaker. Consequently, this study relies on body fossils from other formations and provinces to infer the trackmaker’s likely morphology.
Given this context, Yutyrannus huali, a basal tyrannosauroid from the Early Cretaceous Yixian Formation of Liaoning Province, was selected as the model organism for the HX-T3-L39 trackmaker. Although known specimens of Yutyrannus are notably larger—such as the holotype ZCDM V5000 (~1414 kg) and paratypes ZCDM V5001 (~596 kg) and ELDM V1001 (~493 kg) [44]—and originate from a different geographical region, their temporal distribution remains consistent with the age of the Jiaguan Formation. In Blender, a digital model of Yutyrannus was scaled so that the feet matched the 0.3 m footprint length of HX-T3-L39—one of the best-preserved tracks in the sequence.
Two different foot-to-hip height ratios were employed for biometric analysis. The first estimate assumed a ‘straight-leg’ stance, measured from the plantar surface to the acetabulum by summing the femur, tibia/fibula, and metatarsus lengths, with an additional 9% soft tissue allowance [10]. In this configuration, the hip height was approximately 4.5 times the footprint length. The second estimate used a more naturalistic ‘bent-leg’ stance, based on a posed life reconstruction of a hypothetical HX-T3 trackmaker, yielding a hip height of 3.7 times the footprint length. Additionally, while not discussed further here, the traditional hip height estimation using the footprint length multiplied by four is also provided in the Supplementary Material.

2.4. Trackmaker Biometric Calculation

Estimating the gait (e.g., walking and running) of a dinosaur trackmaker is a common practice in dinosaur ichnology that uses relative stride (i.e., stride divided by hip height) indicators developed by Alexander [42]: relative stride less than two equates to walking, values greater than 2.9 equate to running; and values in-between suggest trotting. Since trotting related to quadrupedal movement, for convenience, the ‘trot’ range is referred to here as a ‘slow run’, although we recognise the dynamic similarity of limb movement for bipeds and relative stride values greater than 2.9. Given these constants, when trackmaker hip height is calculated, the stride with the associated gait can be determined and, subsequently, the velocity estimated (see below).
Also, the view taken here is that in instances where the step length exceeds the hip height (and presumed leg length, i.e., relative step greater than one), then the gait transitions from a walk to a ‘slow run’.
Bipedal trackmaker velocity was estimated using the formula adapted by Ruiz and Torices [47] from Alexander’s [42] original equation (Equation (6)).
v = 0.226 × (9.80.5) × (stride1.67) × (hip height−1.17)
When step velocity was calculated, the stride value in the equation was replaced by twice the step length.
To estimate the length of time the trackmaker spent on site, the measurement for the biological trackway length was divided by the calculated average speed. Cadence (steps per unit time) was calculated by dividing the speed by the step length, while the step duration (time per step) was obtained as the reciprocal of cadence.
Two approaches were used to estimate the body mass of the theropodan trackmaker. In the first, we used Equation (7) from Weems [48]:
Body mass estimate = (hip height × 4.73)3
The second calculated the volume of the modelled Yutyrannus using Blender’s Python API (bmesh) and multiplied the value by the specific gravity of 950 kg/m3 [49] to estimate body mass.
The body mass estimates were used to calculate the trackmaker’s terrestrial theoretical maximum speed by using Equation (8) from Hirt et al. [50]:
Vmax = 25.5 × (M0.26 × (1 − e^[−22 × M−0.6])
where M represents the body mass (kg), e is the base of the natural logarithm, and the constants 25.5 and 22 are derived from empirical scaling relationships.

2.5. Digital Trackmaker Animation

We developed a purpose-built Python script within Blender to generate simulations of the HX-T3 trackmaker’s movements. This was achieved through the creation and manipulation of ‘empty’ objects—placeholder objects used for positioning and animation control—to represent the hip and left- and right-foot positions. To obtain the spatial and temporal positions, we aligned the left- and right-foot ‘empty’ objects with their respective footprints along the HX-T3 trackway line and animated them using keyframes corresponding to the calculated step durations. The hip ‘empty’ object was kept centred between the foot ‘empty’ objects throughout the animation, accurately reflecting the trackmaker’s centre of mass.
To aid in visualising the trackmaker’s movements, we constrained a digital model of Yutyrannus to the animated hip, left-foot, and right-foot ‘empty’ objects. This automatic animation is specifically designed to simulate a walking gait, ensuring that at least one foot ‘empty’ object is always in contact with the ground, thus eliminating any aerial phase typical of slow running or running. Consequently, when the constrained Yutyrannus model exceeds a walking gait (i.e., relative stride < 2 and relative step < 1) or adopts unnatural postures (e.g., straight-legged stance), the limbs may appear dislocated, highlighting potential flaws or assumptions in the model.
While we acknowledge that biomechanical studies [51,52] have established rigorous standards for reconstructing joint kinematics and musculoskeletal dynamics—often based on high-resolution 3D datasets, segmented scans, and detailed muscle modelling—our animation does not aim to replicate this level of anatomical precision. Such reconstructions require extensive and currently unavailable data for Yutyrannus, including articulated skeletal remains and digital musculoskeletal reconstructions. These constraints place high-resolution biomechanical modelling beyond the scope of the present investigation. Instead, the digital reconstruction presented here prioritises visualising the temporal sequence and spatial pattern of locomotion derived directly from the ichnological data (i.e., HX-T3 trackway). Although the resulting animation may appear simplified or ’robotic’ in movement, it serves the scientific objective of illustrating variability in footprint timing and sequence. In this way, it broadens the communicative value of trackway data and provides an accessible framework for detecting stepping irregularities, which may otherwise be overlooked in traditional average values for cyclical gait models.
To accurately represent the trackmaker’s locomotion, we adjusted animation parameters including hip height (straight-leg vs. bent-leg stances) and foot lift height during stepping (0.15 m). In the straight-leg stance, the model maintained an acetabular height of 1.35 m above the ground, whereas in the bent-leg stance, the maximum hip height was at 1.13 m. This hip height was held constant during the midstance phase, when the body is directly over the supporting leg and the other leg is swinging forward. However, to reflect natural changes observed in terrestrial vertebrate locomotion, we manually lowered the hip height during the contact phase, when one foot touches the ground as the other prepares to lift off. For the bent-leg stance, this resulted in a <5% reduction in hip height to 1.075 m during the contact phase. Ultimately, we excluded the straight-leg animation as it does not realistically reflect the natural locomotion of the trackmaker. The bent-leg stance was therefore used exclusively, providing a more accurate representation of movement dynamics (Video S1).

3. Results

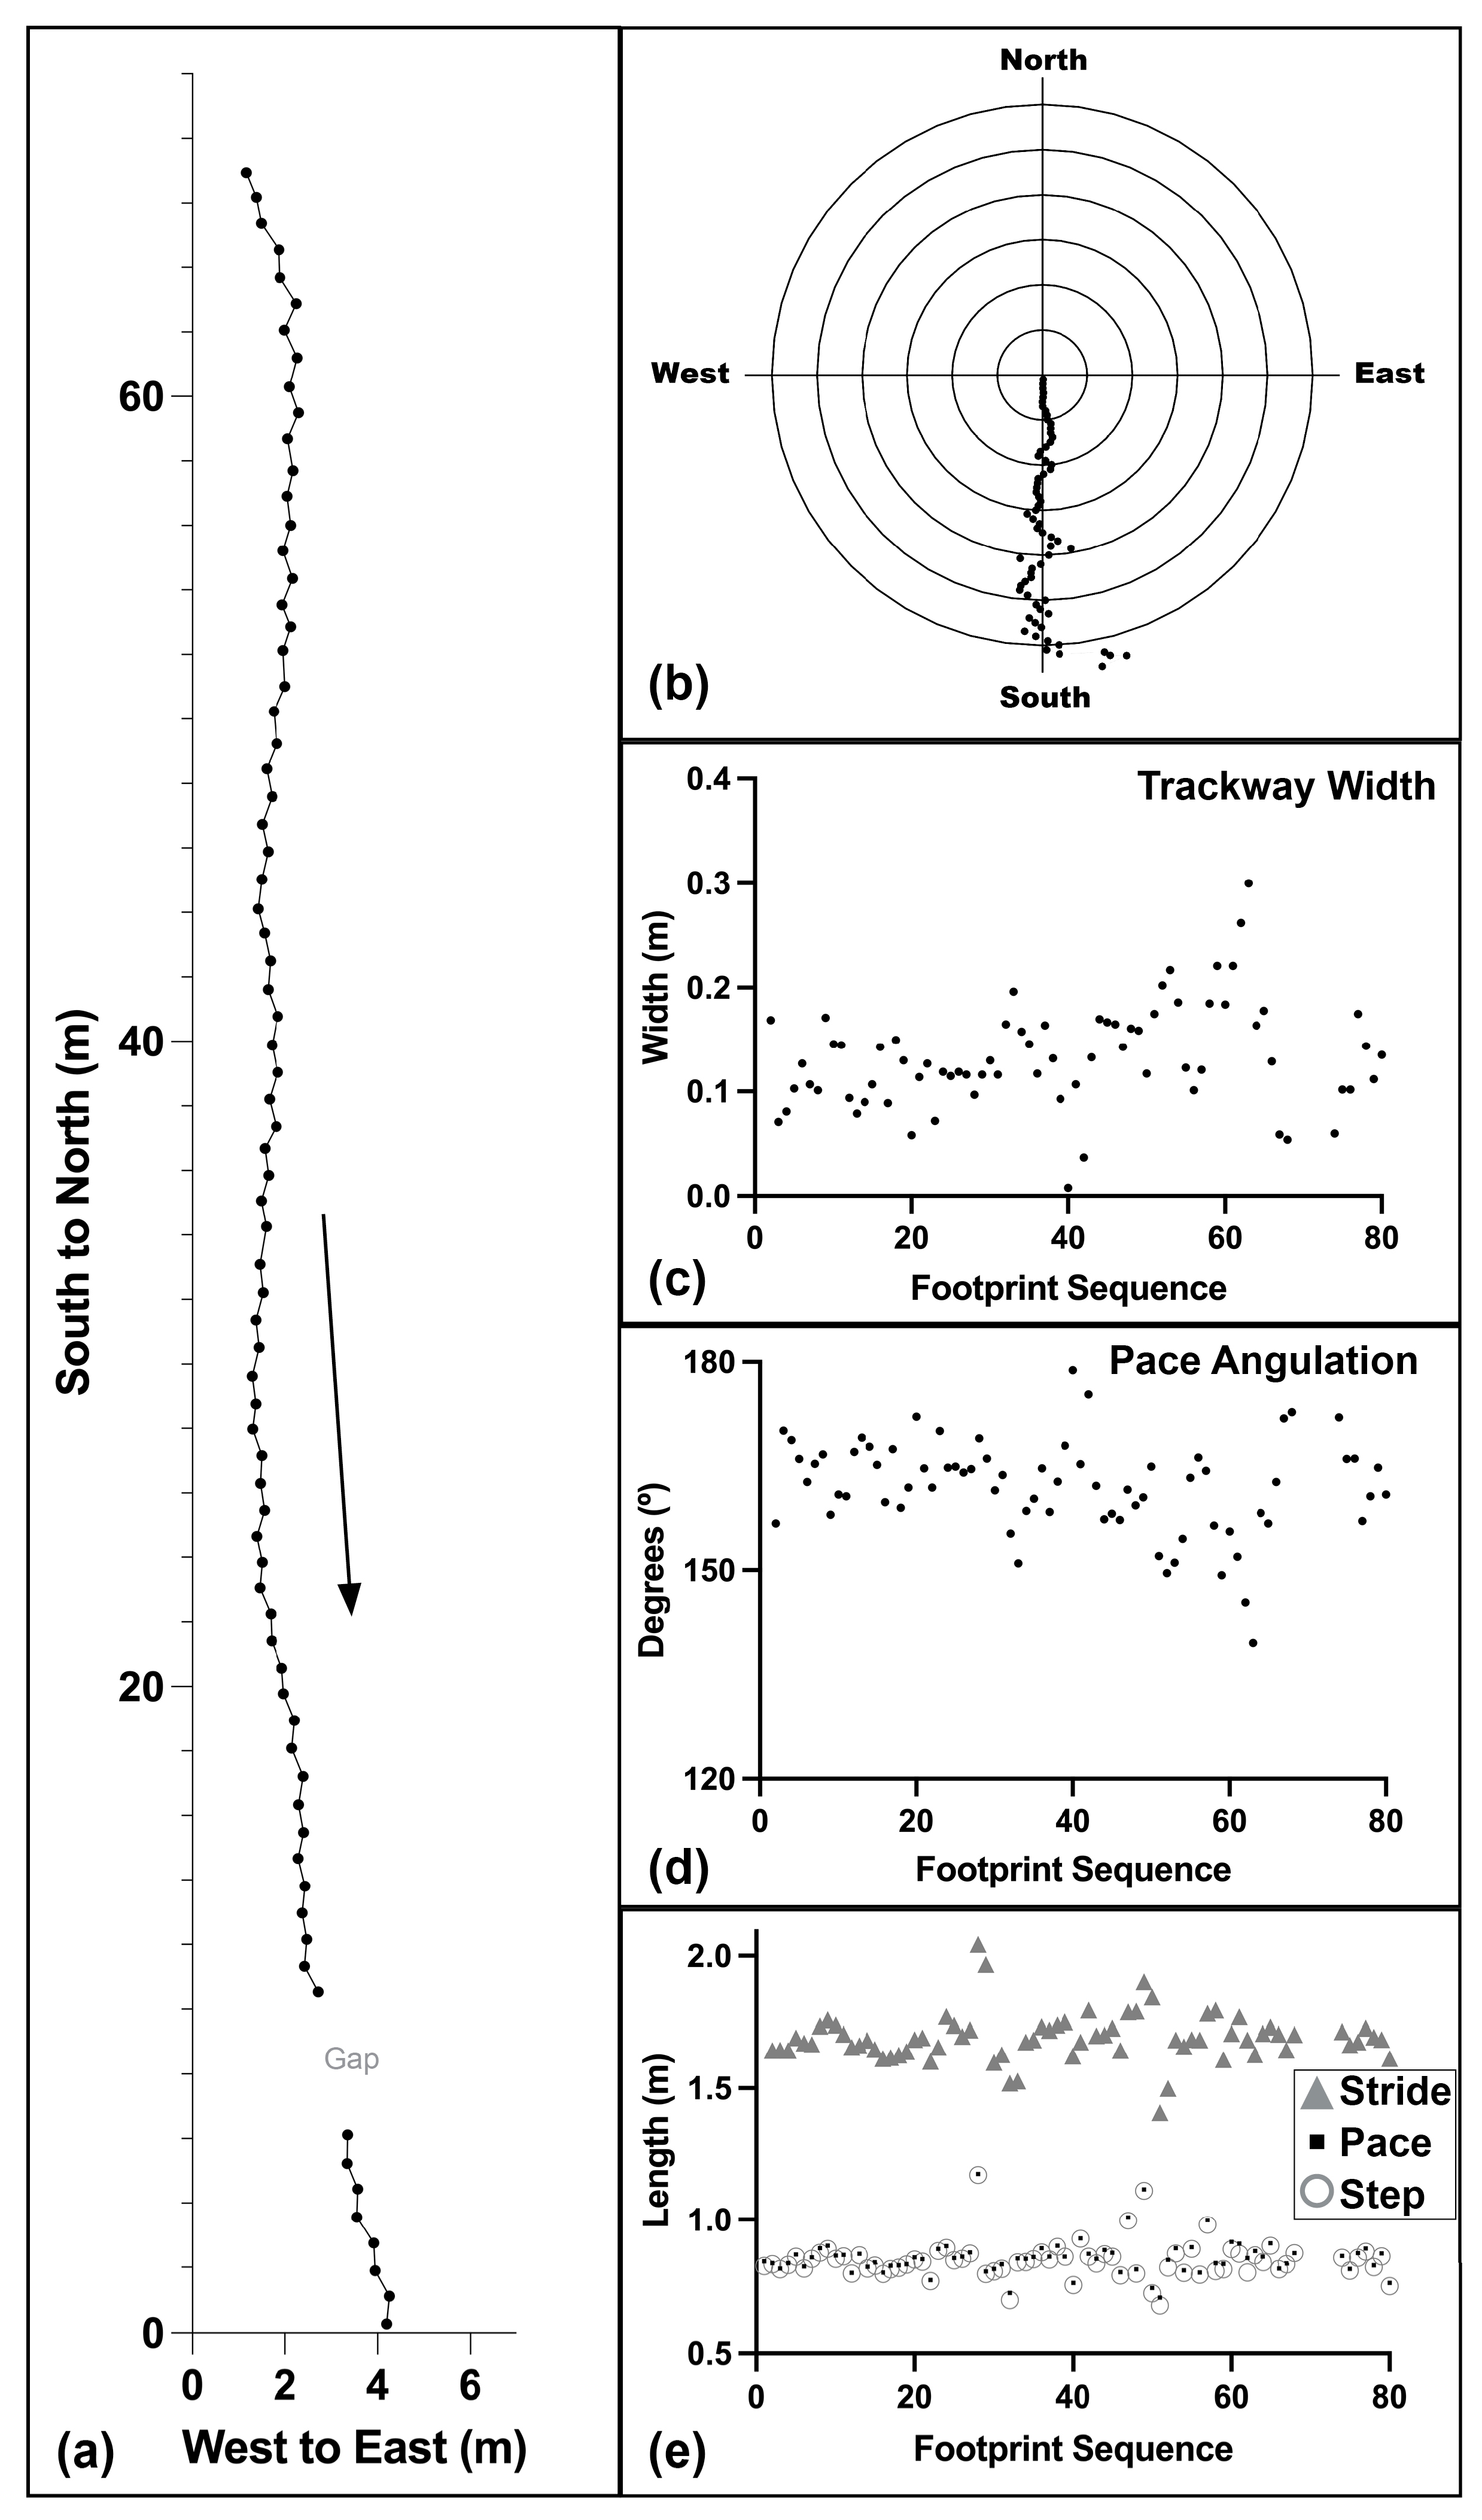
3.1. Trackway Parameters

The digital analysis of the HX-T3 trackway (Figure 2; Table 1 and Table S1) revealed a path length of 67.73 m, comprising 80 paces, 80 steps, and 79 strides. The trackway orientation was consistently to the south (average 178°, medium 179°, SD 5°) and ranged between 163° to 187° (relative to north). The trackway width varied from 0.008 m to 0.300 m, averaging 0.135 m (median 0.130 m, SD 0.049 m). Pace measurements ranged from 0.707 m to 1.176 m, with the average and median at 0.858 m and 0.854 (SD 0.07 m), respectively. Step lengths were of a similar range, spanning from 0.678 m to 1.171 m, with an average and median of 0.845 m and 0.841 (SD 0.072 m), respectively. Strides measured between 1.408 m and 2.043 m, with an average of 1.693 m and median 1.685 m (SD 0.093 m). The pace angulation varied from approximately 140° to 179°, with an average and median of 16° (SD approx. 7°), while step angles ranged from 0° to 21°, averaging 9° (median 9°, SD 3°).
The entire HX-T3 trackway, consisting of 81 footprints, was analysed using the traditional tortuosity method. The measured direct distance (DL) was 67.40 m, with a cumulative trackway length (TL) of 67.73 m. The resulting traditional tortuosity value was calculated to be 0.995.

3.2. Trackmaker Biometrics 1

The first set of biometrics for the HX-T3 trackmaker are based on the traditional approach of calculating trackmaker hip in a ‘straight-leg’ stance (Table 2 and Table S2). Here, the estimated hip height of 1.35 m is based on the HX-T3-L39 footprint length of 0.30 m with a footprint multiplier of 4.5.
The relative stride across the trackway ranged from 1.040 to 1.510, averaging 1.254 (median 1.250, SD 0.069), indicating a consistent walking gait. This was consistent with the relative step length, which averaged 0.627 (median 0.620, SD 0.053) and varied between 0.500 and 0.870. Utilising Alexander’s speed equation [42], modified with a 0.226 multiplier [47], the velocity based on stride ranged from 3.18 km/h to 5.91 km/h, averaging 4.33 km/h (median 4.30 km/h, SD 0.406 km/h), while step-based velocity showed similar averages at 4.33 km/h (median 4.30 km/h, SD 0.633 km/h), but exhibited a wider range from 2.98 to 7.42 km/h. Cadence varied from approximately 73 to 106 steps/min, with an average of 85 steps/min (median 85 steps/min, SD 4.7 steps/min). Step duration ranged from 0.57 s to 0.82 s, with an average of 0.71 s (median 0.70 s, SD 0.04 s). We estimate that for a trackmaker with a hip height of 1.35 m, the transition from walking to slow running occurs at 10.42 km/h (2.90 m/s), while the transition from slow running to running occurs at 19.38 km/h (5.38 m/s).
Weems’ [48] method to calculate body mass and the Hirt et al. [50] method to estimate maximum speed allowed us to estimate the HX-T3 trackmaker as approximately 260 kg, with a theoretical maximum speed of 58.7 km/h (16.3 m/s). The calculated average velocity was 4.33 km/h, indicating the trackmaker was moving at about 7.4% of its maximum speed when the tracks were registered.

3.3. Trackmaker Biometrics 2

The second approach used to estimate the HX-T3 trackmaker biometrics used a digital life reconstruction based on the Yutyrannus taxon in a bent-leg stance (Figure 3; Table 3 and Table S3). Here, the estimated hip height of 1.13 m was measured based on the taxon having a foot length of 0.30 m.
The relative stride across the trackway ranged from 1.25 to 1.81, averaging 1.50 (median 1.50, SD 0.08), indicating a consistent walking gait. This indication of a walking gait was mostly consistent with the relative step length, which averaged 0.75 (median 0.74, SD 0.06), and varied between 0.60 and 1.03 (i.e., the latter being the one instance of a slow running gait). Using Alexander’s speed equation [42], modified by replacing the multiplier 0.25 with 0.226 [47], we estimated the HX-T3 trackmaker took 45.8 s to register from tracks 1–81, and 38.4 s to register from tracks 1–68. Velocity based on stride ranged from 3.91 km/h to 7.27 km/h, averaging 5.32 km/h (median 5.30 km/h, SD 0.50 km/h), while step-based velocity showed similar averages at 5.33 km/h (median 5.20 km/h, SD 0.78 km/h) but exhibited a wider range from 3.67 to 9.13 km/h. Cadence varied from approximately 90 to 130 steps/min, with an average of 104 steps/min (median 104 steps/min, SD 6 steps/min). Step duration ranged from 0.46 s to 0.67 s, with an average of 0.58 s (median 058 s, SD 0.03 s). We estimate that for a trackmaker with a hip height of 1.13 m, the transition from walking to slow running occurs at 8.62 km/h (2.39 m/s), while the transition from slow running to running occurs at 16.03 km/h (4.45m/s).
The digital life reconstruction based on the Yutyrannus taxon had a volume of 0.315 m3, which translates to a body mass of this hypothetical theropod at 292 kg when multiplied by the specific gravity of 925 kg/m3. Using Hirt et al.’s [50] formula, the theoretical maximum speed was extrapolated to 57.8 km/h. Similarly, the calculated average velocity of 5.32 km/h suggests the trackmaker was moving at approximately 9.2% of this theoretical maximum speed at the time of track formation.

3.4. Trackmaker Biometrics—Traditional Estimate

Although the traditional method for estimating hip height—using a footprint length multiplied by a factor of four [42]—was not adopted in the present study, we have provided a corresponding estimate for reference. Based on a footprint length of 0.30 m, the calculated hip height would be 1.20 m. This value is included in the Supplementary Material (Table S4) but is not used in the main analysis or discussed further.

3.5. Digital Trackmaker Animation

A traditional hip height calculation, which resulted in a straight-leg model [10], was found to be unrealistic in terms of both leg posture and motion dynamics. Specifically, the pendulum-like leg action of the straight-leg model did not allow the feet to make ground contact at the furthest step positions. This limitation rendered the model unsuitable for accurately simulating the observed gait patterns.
In contrast, the bent-legged model was successfully animated to reflect a more naturalistic gait (Video S1). By parenting the rigged Yutyrannus model to the hip and foot positions (represented as empty objects) derived from the automated walk animation, the model exhibited a smooth and consistent walking motion across much of the trackway sequence. This consistency in movement was expected, as the step lengths were relatively uniform across the trackway.
However, one notable exception was observed at a track position where the step length was relatively long, corresponding to a calculated relative step length value of 1.03. This value indicates that the trackmaker was transitioning into a slow running gait (or a slow run), as it slightly exceeds the threshold value of 1.0, the boundary mark of the walk–slow run transition. The slight increase in relative step length suggests that the trackmaker’s feet should not be in ground contact simultaneously. This discrepancy created a conflict with the automated walking animation, resulting in an artefact in the model where the trackmaker’s ankle appeared to dislocate due to the model’s limb exceeding its ‘natural’ range of motion.
To address this issue, a manual adjustment was applied by lifting the left foot (rear foot) 0.01 s earlier during ground contact. This modification introduced a momentary aerial phase, simulating the expected slow running motion where both feet should not be in contact with the ground simultaneously. This refinement effectively eliminated the dislocation artefact and provided a more natural appearance of the trackmaker’s movements during the gait transition.

4. Discussion

4.1. Digital Re-Analysis of Trackway Parameters and Biomechanics

The current study differentiates between direct measurements taken from the track surface (i.e., trackway parameters) and calculations used to infer the trackmaker’s physical and behavioural characteristics (i.e., trackmaker biometrics). This distinction is crucial because direct measurements, such as stride length and trackway orientation, represent observable data, which contrast with biometric calculations—such as hip height, body mass, and speed—derived using models that incorporate various assumptions and variables. In this context, trackway parameters can be considered precise and reliable, while trackmaker biometrics should be viewed as interpretations rather than absolute values of an unobservable animal.
The nearly 70 m-long HX-T3 trackway is the longest theropod trackway currently documented in East Asia. In the study by Xing et al. [38], researchers provided essential quantitative trackway data limited to the total length, the number of footprints, and the average pace angulation (163°). The trackway was described as exhibiting ‘consistent step [pace] lengths without any significant changes’ [38] (p. 351), but more comprehensive datasets were lacking due to the logistical challenges associated with assessing this long dinosaur trackway with traditional methods. Significantly, the authors provided a detailed trackway map with clear scale and orientation references, enabling the current study’s advanced digital techniques for trackway re-analysis.
Our study supports the earlier observations: the (biological) trackway length being 67.72 m long, and the measure of pace angulation (median 162°; SD: 7°). The ‘consistency’ within the HX-T3 trackway is also demonstrated by both the average values (which can be skewed by outliers) and the median values (which more accurately reflect the central tendency when outliers are present). The average and median values are identical for step angle measurements, while they differ by only 1° for trackway orientation, and less than 0.01 m for pace, step, stride, pace angulation, and trackway width parameters (Table 2).
However, our approach also identified outliers in the spacing between tracks 28 and 29, and tracks 47 and 48, where the calculated pace and step lengths are irregularly long. This prompted further examination of potential behavioural or preservational explanations. The first instance occurs in a region where no other tracks have been recorded, while the second is situated approximately 4.5 m from a nearby sauropod trackway (HX-S5 [19]). Nevertheless, we consider it unlikely that the HX-S5 trackmaker influenced the HX-T3 trackmaker, given the differing orientations (northeast for HX-S5, south for HX-T3) and track-making sequence; the sauropod trackway overprints a theropod footprint (track 55), indicating it was made after the HX-T3 passage.
A more consistent and less dramatic explanation for both outliers is that they coincide with shallowly impressed footprints whose precise locations are less certain. These are depicted as dotted tracks on the site map ([38] Figure 4). Consequently, we propose that the apparent anomalies in step and pace lengths may reflect uncertainty in the mapped positions of these footprints, rather than actual deviations in locomotor behaviour. These outliers may therefore mark areas that warrant further in situ investigation to refine footprint placement relative to the trackway.
One of these outliers influenced the associated relative step value, indicating a change in gait in the HX-T3 trackmaker’s bent-legged biometrics. Although the associated relative stride measure was elevated (1.81), it remained within the range of a consistent walking gait (i.e., <2; Figure 3b). In contrast, between tracks 28 and 29, the relative step value deviated such that the step length exceeded the referenced hip height (i.e., relative step of 1.03). Importantly, the semi-automatic animation is constrained to simulating a walking gait; thus, if the animal had transitioned to running, the limb movements would likely ’dislocate’ under these constraints. However, this was not observed.
This lack of limb ‘dislocation’ may be attributed to one or a combination of factors that effectively increased the functional capacity of an extending limb during motion. These factors include modelling the trackmaker with bent legs, simulating hip lowering to replicate its natural response as the limb spreads further apart, and animating the elevation of the distal portion of the model’s toes during the ‘kick-off’ phase while the proximal portion of the toes remain in contact with the ground. Consequently, these allow the leg to extend sufficiently for a longer step without overextending to the point of limb dislocation.
Overall, our study demonstrates that long trackways can receive comprehensive datasets that can be used to refine our understanding of trackmaker behaviour and locomotor dynamics. In this context, we believe it is necessary to improve our understanding of how using trackmakers in a bent-legged posture affects estimates of hip height and their cascading effects on biometric calculations, such as relative stride and speed. This is particularly important given that traditional ichnological estimates of hip height, which utilise body fossil candidates, have typically been determined by ‘summing the lengths of the principal hindlimb bones [stylo-, zeugo-, and distal autopodium]’ ([10] Figure 8.4 caption). However, this method results in a straight-leg posture that did not occur in theropods and was certainly not maintained during the step cycle.

4.2. Documenting Long Theropod Trackways—Limitations and Comparisons

Making comparisons with other extensively long theropod trackways is challenging, mainly due to these tracksites often being poorly documented. For example, the longest known theropod trackway, measuring over 550 m, from the Late Cretaceous (Maastrichtian) El Molino Formation in Bolivia [53], reports only the length of the trackway but lacks the associated track details, number of footprints, or trackway map. Similarly, the Late Jurassic Hojapil-Ata tracksite (also known as Khodja-Pil-Ata) in Turkmenistan features several long trackways attributed to the ichnogenus Megalosauripus, with trackway lengths of 184, 195, 226, 266, and 311 m [29,54]. Despite providing highly stylised maps, these reports lack detailed footprint data and do not specify the number of tracks within each trackway. A subsequent reassessment of this tracksite by Fanti et al. [31] not only corrected the length of the longest trackway (HA-1), leading to its decrease from 311 m to 271 m, but also provided a count of 108 tracks. Fanti et al. [31] also tabulated 24 trackways from the Hojapil-Ata tracksite, with the inclusion of trackway identifiers, number of footprints, and overall orientation. However, their stylised, publicly available maps hinder comprehensive reassessments like those conducted in the current study.
From the Middle Jurassic (Bathonian) White Limestone Formation in Oxfordshire, two significant theropod trackways, T13 and T80, have been identified at Ardley Quarry [55,56]. These trackways, comprising discontinuous segments that collectively exceed 180 m with approximately 100 footprints each, illustrate the challenges of documenting extensive trackways. While Day et al. [56] provided a scaled map of the tracksite, the extensive area covered (over 500 × 600 m2) makes it difficult to discern details within individual trackways.
One of the primary purposes of ichnological investigations of trackways is to gain insights into the behaviour of the trackmakers. A trackway comprising many tracks offers a rich dataset, as it records the trackmaker’s movements over an extended period. However, trackmaker biometrics have not been extensively attempted for most of the very long theropod trackways described. A notable exception is the theropod trackways from Ardley Quarry. These trackways have been tentatively attributed to the taxon Megalosaurus, along with estimates of trackmaker size, speed, gait, weight (substrate deformation based), and energy expenditure [8,55,56]. While the average measured footprint lengths of 0.72 m for T13 and 0.66 m for T80 would typically suggest trackmakers with significantly different hip heights, Day et al. [56] (p. 328) noted that ‘the hip height for Megalosaurus is unlikely to have exceeded 1.90 m’. Consequently, they based their biometric calculations on hip heights of 1.93 m and 1.92 m for T13 and T80 trackmakers, respectively [55]. Day et al. [56] noted that they derived hip heights for the Ardley theropods by extrapolating the length of digit III impressions (excluding claw imprints) as a proxy for footprint length, yet the tabulated data reveal that this value was smaller for T13 (0.39 m) rather than larger than T80 (0.48 m) [55]. In any case, trackmaker speed and gait calculations were estimated as 6.85 km/h for T13 and 5.43–9.50 km/h for T80, with T13 reaching a maximum running speed of 29.2 km/h. These figures highlight not only the complexities but also the inherent subjectivity in estimating trackmaker biometrics, particularly in how the selection of certain measurement proxies can impact the outcome of such analyses. In this case, the chosen method leads to the inference of a large-bodied T13 theropod running at high speeds.
While long theropod trackways offer considerable potential for assessing trackmaker biometrics and behaviour over extended time and space, most fossil trackways are limited by sparse or inconsistent documentation. In contrast, trackways with relatively few footprints but accompanied by high-resolution spatial and morphological data can still yield meaningful insights into locomotor dynamics. For example, the La Torre 6A and 6B trackways from the Early Cretaceous of Spain [11] each exceed ten metres in length but preserve only five and seven footprints, respectively. Nonetheless, they are accompanied by detailed photogrammetric models, spatial coordinate data, and scaled track surface maps with azimuth orientation indicators. This level of documentation enabled the authors to calculate a suite of trackway parameters and derive trackmaker biometrics, leading to the identification of nuanced locomotor behaviours—such as sustained acceleration in La Torre 6A and top-speed variations between 8.8 and 12.5 m/s in La Torre 6B. Despite their brevity, these trackways—and particularly the rigour of their documentation—exemplify how modern digital ichnological methods can reveal dynamic locomotor patterns.
Overall, the current study underscores the importance of detailed and accurate documentation of long ichnological sites for trackway parameter and trackmaker behavioural analyses. Despite limitations in existing reports, our re-analysis of the HX-T3 trackway demonstrates how digital methods can be leveraged to extract additional information on trackmaker locomotion, providing insights that traditional field-based assessments might overlook. This approach not only refines our understanding of the spatial arrangement and trackmaker behaviour, but also highlights the need for further comprehensive documentation and digital re-evaluation of similar long trackways to validate and expand upon existing ichnological interpretations.

4.3. Future Directions in Trackway Research

Dinosaur ichnology has experienced several renaissances, each marked by transformative advancements that have progressively matured the discipline. The first ‘wave’ emerged with the formal recognition of ichnology as a distinct scientific field, sparking widespread interest and establishing its foundational significance [57]. This phase solidified ichnology’s relevance in palaeontological research, encouraging systematic documentation and analysis of fossilised footprints.
The second ‘wave’ was propelled by technological innovations that enabled the quantification of ichnological data and the development of three-dimensional digital models of tracks and tracksites. Such advancements, as highlighted by Falkingham et al. [58], revolutionised the field by bringing clarity, precision, and objectivity to ichnotaxonomic assessments and spatial analyses of tracksites. These tools allowed researchers to evaluate track morphology and surface degradation with a level of detail previously unattainable through traditional methods. Consequently, this wave facilitated a more comprehensive understanding of tracksite dynamics and trackmaker behaviour.
Currently, we are entering what can be considered the third ‘wave’ of palaeo-ichnology, driven by the widespread adoption of advanced digital technologies. Photogrammetry, LIDAR scanning, and other non-invasive survey techniques now provide rapid, high-resolution capture of extensive surfaces in sub-millimetre detail [59,60,61,62,63]. This new era emphasises digital documentation and analysis, replacing some traditional field methods with more objective and detailed representations of trackways. These technologies offer a solution to the logistical challenges of documenting large and complex tracksites, particularly those with long trackways that cover significant distances. By employing digital models, researchers can now conduct exhaustive analyses of both standard and novel trackway parameters, such as stride length, speed variation, and even subtle surface deformations indicative of locomotor mechanics.
As a result, this third ‘wave’ is characterised by an unprecedented level of objectivity and comprehensiveness. At an individual track-level, Deep Learning models have recently been introduced that permit automatic recognition and classification of track morphologies based on simple outlines [64] to photographic data [65] with high accuracy. The application of Deep Learning has the potential to standardise track analyses, reducing observer bias (see [64]) and enabling consistent comparisons of tracksite data worldwide.
Digital methodologies applied to trackways, as demonstrated in this study, not only streamline the documentation process but also facilitate more detailed analysis of trackmaker behaviour. By integrating high-resolution surface models with trackmaker simulations (see [66]) ichnologists are now able to infer trackmaker biometrics, reconstruct movement patterns, and explore potential interactions between trackmakers and their environments in ways previously unattainable through traditional methods.
At localities where the certainty of trackmaker attribution is high—such as the well-documented theropod trackways from the Glen Rose Formation at Dinosaur Valley State Park, Texas, which are widely regarded as attributable to Acrocanthosaurus atokensis—the integration of ichnological data with the skeletal fossil record offers a unique opportunity to refine palaeobiological interpretations [67,68,69,70,71,72]. In these cases, detailed anatomical information from body fossils, including limb proportions, estimated body masses, and joint range of motion [51,52,73,74,75,76,77,78,79,80,81], can be used to enhance digital trackway analyses by constraining plausible locomotor poses and validating simulated gait reconstructions. Differences in individual trackway parameters may further be contextualised by known ontogenetic variation in skeletal material [82,83], allowing for more nuanced interpretations of trackmaker identity, behaviour, and potential age class. This convergence of ichnological and osteological data would not only strengthen the reliability of biomechanical inferences but also exemplify the broader potential of digital methods to synthesise different palaeontological source types into a unified, dynamic framework for reconstructing extinct animal movement and ecology.

5. Conclusions

Using advanced digital techniques, we successfully extracted new and detailed information from the HX-T3 trackway that would have been difficult to achieve through field-based methodologies alone, expanding upon the findings of Xing et al. [38]. Our digital re-analysis confirmed the previously observed patterns of consistent pace lengths across the trackway, with a median value of 0.857 m and a standard deviation of 0.067 m. However, we found the pace length ranged from as low as 0.707 m to as high as 1.176 m. The pace angulation indicates a narrow trackmaker straddle (median: 163°, SD: 8°), ranging between 140° and 180°, further supported by the low trackway width (median: 0.123 m, SD: 0.057 m) varying between 0.008 m and 0.300 m. Stride orientation showed consistency in a southern direction (median: 179°, SD: 5.55°), with slight variation between south-southeast (163°) and south-southwest (187°).
Trackmaker calculations combined with digital modelling based on a specific body fossil candidate (Yutyrannus) animated with a natural bent-leg posture along the HX-T3 trackway allowed us to explore its locomotor behaviour. Relative stride values suggested the HX-T3 trackmaker employed a walking gait (relative stride < 2), with values ranging between 1.25 and 1.81 (median: 1.49) and a medium speed of 5.304 km/h (SD: 0.469 km/h), across a range of 3.906–7.274 km/h. Relative step values (median: 0.75, SD: 0.06) also supported walking (relative step between 1–1.45) throughout most of the trackway, with a range between 0.60 and 1.03.

Supplementary Materials

The following supporting information can be downloaded at: https://www.mdpi.com/article/10.3390/geosciences15050165/s1, Table S1: Detailed HX-T3 trackway parameters; Table S2: Detailed HX-T3 trackmaker biometrics based on straight-legged model; Table S3: Detailed HX-T3 trackmaker biometrics based on bent-legged model; Video S1: Life reconstruction of the temporospatial movements of the HX-T33 trackmaker based on Yutyrannus body and limb proportions.

Author Contributions

Conceptualization, A.R. and L.X.; methodology, A.R.; software, A.R.; formal analysis, A.R.; investigation, A.R. and L.X.; resources, L.X.; writing—original draft preparation, A.R.; writing—review and editing, A.R. and L.X.; visualization, A.R. All authors have read and agreed to the published version of the manuscript.

Funding

This research received no external funding.

Data Availability Statement

Data is contained within the article or supplementary material.

Acknowledgments

We are grateful to the anonymous reviewers for their comments and constructive critiques, which significantly contributed to the refinement of this manuscript. I extend my sincere appreciation to Peter Romilio for permitting his 3D virtual model to serve as a human-scale reference in comparison with the dinosaur trackmaker.

Conflicts of Interest

The authors declare no conflicts of interest.

Abbreviations

The following abbreviations are used in this manuscript:
HX-T3Hanxi Village Theropod trackway number 3

References

  1. Gatesy, S.M. Skin impressions of Triassic theropods as records of foot movement. Bull. Mus. Comp. Zool. 2001, 156, 137–149. [Google Scholar]
  2. Gatesy, S.M. Direct and indirect track features: What sediment did a dinosaur touch? Ichnos 2003, 10, 91–98. [Google Scholar] [CrossRef]
  3. Lockley, M.G. Dinosaur tracks. Ichnos 1992, 2, 79–83. [Google Scholar] [CrossRef]
  4. Thulborn, R.A.; Wade, M.J. Dinosaur trackways in the Winton Formation (mid-Cretaceous) of Queensland. Mem. Queensl. Mus. 1984, 21, 413–517. [Google Scholar]
  5. Moratalla, J.J.; Sanz, J.L.; Jimenez, S. Dinosaur tracks from the Lower Cretaceous of Regumiel de la Sierra (Province of Burgos, Spain): Inferences on a new quadrupedal ornithopod trackway. Ichnos 1994, 3, 89–97. [Google Scholar] [CrossRef]
  6. Gatesy, S.M.; Middleton, K.M.; Jenkins, F.A., Jr.; Shubin, N.H. Three-dimensional preservation of foot movements in Triassic theropod dinosaurs. Nature 1999, 399, 141–144. [Google Scholar] [CrossRef]
  7. Mazzetta, G.V.; Blanco, E.R. Speeds of dinosaurs from the Albian-Cenomonian of Patagonia and sauropod stance and gait. Acta Palaeontol. Pol. 2001, 46, 235–246. [Google Scholar]
  8. Day, J.J.; Norman, D.B.; Upchurch, P.; Powell, H.P. Dinosaur locomotion from a new trackway. Nature 2002, 415, 494–495. [Google Scholar] [CrossRef]
  9. Dalman, S. Footprint morphology and biomechanics of small ornithischian dinosaur ichnogenus Anomoepus from the Lower Jurassic of western Massachusetts. J. Verterbrate Paleontol. 2006, 26, 54A. [Google Scholar]
  10. Thulborn, T. Dinosaur Tracks; Chapman and Hill: London, UK, 1990; p. xvii + 410 pp. [Google Scholar]
  11. Navarro-Lorbes, P.; Ruiz, J.; Diaz-Martinez, I.; Isasmendi, E.; Saez-Benito, P.; Viera, L.; Pereda-Suberbiola, X.; Torices, A. Fast-running theropods tracks from the Early Cretaceous of La Rioja, Spain. Sci. Rep. 2021, 11, 23095. [Google Scholar] [CrossRef]
  12. Marty, D.; Meyer, C.A.; Billon-Bruyat, J.-P. Sauropod trackway patterns expression of special behaviour related to substrate consistency? An example from the Late Jurassic of northwestern Switzerland. Hantkeniana 2006, 5, 38–41. [Google Scholar]
  13. Sciscio, L.; Bordy, E.M.; Reid, M.; Abrahams, M. Sedimentology and ichnology of the Mafube dinosaur track site (Lower Jurassic, eastern Free State, South Africa) a report on footprint preservation and palaeoenvironment. PeerJ 2016, 2285, e2285. [Google Scholar] [CrossRef] [PubMed]
  14. Salisbury, S.W.; Romilio, A.; Herne, M.C.; Tucker, R.T.; Nair, J.P. The Dinosaurian Ichnofauna of the Lower Cretaceous (Valanginian–Barremian) Broome Sandstone of the Walmadany Area (James Price Point), Dampier Peninsula, Western Australia. J. Vertebr. Paleontol. 2016, 36, 1–152. [Google Scholar] [CrossRef]
  15. Dãaz-Martãnez, I.; Gonzãlez, S.; De Valais, S. Dinosaur footprints in the Early Jurassic of Patagonia (Marifil Volcanic Complex, Argentina): Biochronological and palaeobiogeographical inferences. Geol. Mag. 2017, 154, 914–922. [Google Scholar] [CrossRef]
  16. Lockley, M.G.; Matsukawa, M. Some observations on trackway evidence for gregarious behavior among small bipedal dinosaurs. Palaeogeogr. Palaeoclimatol. Palaeoecol. 1999, 150, 25–31. [Google Scholar] [CrossRef]
  17. Schumacher, B.A. An Addition to the Dinosaur Freeway Megatracksite, Dakota Group (Upper Cretaceous), Bent County, Colorado. Ichnos 2003, 10, 255–262. [Google Scholar] [CrossRef]
  18. Barco, J.L.; Ignacio, C.J.; Ruiz-Omeñaca, J.I. New Data on Therangospodus oncalensis from the Berriasian Fuentesalvo Tracksite (Villar del Río, Soria, Spain): An Example of Gregarious Behaviour in Theropod Dinosaurs. Ichnos 2006, 13, 237–248. [Google Scholar] [CrossRef]
  19. Lockley, M.G.; Min, H.; Se-Geon, G.; Geun, H.K.; Paik, I.S. Multiple Tracksites with Parallel Trackways from the Cretaceous of the Yeosu City Area Korea: Implications for Gregarious Behavior in Ornithopod and Sauropod Dinosaurs. Ichnos 2012, 19, 105–114. [Google Scholar] [CrossRef]
  20. Piñuela, L.; García-Ramos, J.C.; Mike, R.; Ruiz-Omeñaca, J.I. First Record of Gregarious Behavior in Robust Medium-Sized Jurassic Ornithopods: Evidence from the Kimmeridgian Trackways of Asturias (N. Spain) and Some General Considerations on Other Medium-Large Ornithopod Tracks in the Mesozoic Record. Ichnos 2016, 23, 298–311. [Google Scholar] [CrossRef]
  21. Romero-Molina, M.; William, S.; Felix, P.-L.; Antonio, L.; Requeta, E. Orientation and Characteristics of Theropod Trackways from the Las Losas Palaeoichnological Site (La Rioja, Spain). Ichnos 2003, 10, 241–254. [Google Scholar] [CrossRef]
  22. Marty, D.; Wolfgang, H.; Andreas, I.; Lionel, C.; Christian, M.; Lockley, M. Preliminary Report on the Courtedoux Dinosaur Tracksite from the Kimmeridgian of Switzerland. Ichnos 2003, 10, 209–219. [Google Scholar] [CrossRef]
  23. Matsukawa, M.; Kenichiro, S.; Reiji, K.; Kazuto, K.; Lockley, M.G. Review of Japanese Dinosaur Track Localities: Implications for Ichnotaxonomy, Paleogeography and Stratigraphic Correlation. Ichnos 2005, 12, 201–222. [Google Scholar] [CrossRef]
  24. Vila, B.; Oms, O.; Marmi, J.; Galobart Lorente, À. Tracking Fumanya footprints (Maastrichtian, Pyrenees): Historical and ichnological overview. Oryctos 2008, 8, 115–130. [Google Scholar]
  25. McCrea, R.T.; Buckley, L.G.; Farlow, J.O.; Lockley, M.G.; Currie, P.J.; Matthews, N.A.; Pemberton, S.G. A ‘Terror of Tyrannosaurs’: The First Trackways of Tyrannosaurids and Evidence of Gregariousness and Pathology in Tyrannosauridae. PLoS ONE 2014, 9, e103613. [Google Scholar] [CrossRef]
  26. Goodell, Z.; Lockley, M.G.; Lucas, S.G.; Schumacher, B.A.; Smith, J.A.; Trujillo, R.; Xing, L. A High-Altitude Sauropod Trackway Site in the Jurassic of Colorado: The Longest Known Consecutive Footprint Sequence Reveals Evidence of Sharp Turning Behavior. N. M. Mus. Nat. Hist. Sci. Bull. 2021, 82, 101–112. [Google Scholar]
  27. Meyer, C.A.; Marty, D.; Thüring, B.; Thüring, S.; Belvedere, M. The Late Cretaceous dinosaur track record of Bolivia—Review and perspective. J. S. Am. Earth Sci. 2021, 106, 102992. [Google Scholar] [CrossRef]
  28. McLarty, J.A.; Esperante, R. Stops and turns: Uncommonly preserved theropod locomotive behavior patterns in an Upper Cretaceous tracksite from Torotoro National Park, Bolivia. J. S. Am. Earth Sci. 2024, 143, 105011. [Google Scholar] [CrossRef]
  29. Lockley, M.G.; Meyer, C.A.; Schultz-Pittman, R.; Forney, G. Late Jurassic dinosaur tracksites from Central Asia: A preliminary report on the world’s longest trackways. Mus. North. Ariz. Bull. 1996, 60, 137–140. [Google Scholar]
  30. Li, D.; Azuma, Y.; Fujita, M.; Lee, Y.-N.; Yohei, A. A preliminary report on two new vertebrate tracks sites including dinosaurs from the Early Cretaceous Hekou Group, Gansu Province, China. J. Paleontol. Soc. Korea 2006, 22, 29–49. [Google Scholar]
  31. Fanti, F.; Contessi, M.; Nigarov, A.; Esenov, P. New Data on Two Large Dinosaur Tracksites from the Upper Jurassic of Eastern Turkmenistan (Central Asia). Ichnos 2013, 20, 54–71. [Google Scholar] [CrossRef]
  32. Kim, K.S.; Lim, J.D.; Lockley, M.G.; Xing, L.; Kim, D.H.; Piñuela, L.; Romilio, A.; Yoo, J.S.; Kim, J.H.; Ahn, J. Smallest known raptor tracks suggest microraptorine activity in lakeshore setting. Sci. Rep. 2018, 8, 16908. [Google Scholar] [CrossRef] [PubMed]
  33. Lockley, M.; Kim, K.S.; Lim, J.D.; Romilio, A. Bird tracks from the Green River Formation (Eocene) of Utah: Ichnotaxonomy, diversity, community structure and convergence. Hist. Biol. 2021, 33, 2085–2102. [Google Scholar] [CrossRef]
  34. Xing, L.; Lockley, M.G.; Jia, C.; Klein, H.; Niu, K.; Zhang, L.; Qi, L.; Chou, C.; Romilio, A.; Wang, D.; et al. Lower cretaceous avian-dominated, theropod, thyreophoran, pterosaur and turtle track assemblages from the Tugulu Group, Xinjiang, China: Ichnotaxonomy and palaeoecology. PeerJ 2021, 9, e11476. [Google Scholar] [CrossRef]
  35. Lockley, M.G.; Hadden, G.; Romilio, A. A Late Triassic theropod track assemblages from the basal Wingate Sandstone, western Colorado: Implications for regional correlation and the megatracksite concept. Hist. Biol. 2023, 35, 589–596. [Google Scholar] [CrossRef]
  36. Xing, L.; Klein, H.; Lockley, M.G.; Li, H.; Tong, B.; Ye, Y.; Dai, H.; Chunyong, C.; Wang, D.; Romilio, A.; et al. New records of dinosaur tracks in eastern Tibet and a review of Middle Jurassic dinosaur faunas from the eastern Tethys, southwest China. Hist. Biol. 2024, 36, 1244–1258. [Google Scholar] [CrossRef]
  37. Kim, K.S.; Lockley, M.G.; Lim, J.D.; Bae, S.M.; Romilio, A. Trackway evidence for large bipedal crocodylomorphs from the Cretaceous of Korea. Sci. Rep. 2020, 10, 8680. [Google Scholar] [CrossRef]
  38. Xing, L.; Lockley, M.G.; Zhang, J.; Klein, H.; Marty, D.; Peng, G.; Ye, Y.; McCrea, R.T.; Persons, W.S.; Xu, T. The longest theropod trackway from East Asia, and a diverse sauropod-, theropod-, and ornithopod-track assemblage from the Lower Cretaceous Jiaguan Formation, southwest China. Cretac. Res. 2015, 56, 345–362. [Google Scholar] [CrossRef]
  39. Romilio, A.; Shao, C. Analysing trackway-based speed calculations to infer dinosaur locomotive capabilities and behaviours. Hist. Biol. 2024, 36, 2244–2253. [Google Scholar] [CrossRef]
  40. Romilio, A. Blender as a tool for palaeoichnological research: Case study from Lark Quarry. Geobios 2025, 88–89, 219–226. [Google Scholar] [CrossRef]
  41. Lockley, M.G.; Xing, L.; Kim, K.S.; Meyer, C.A. Tortuous trackways: Evidence and implications of deviations, turns and changes in direction by dinosaurian trackmakers. Hist. Biol. 2021, 33, 3326–3339. [Google Scholar] [CrossRef]
  42. Alexander, R.M. Estimates of speeds of dinosaurs. Nature 1976, 261, 129–130. [Google Scholar] [CrossRef]
  43. Henderson, D.M. Footprints, trackways, and hip heights of bipedal dinosaurs—Testing hip height predictions with computer models. Ichnos 2003, 10, 99–114. [Google Scholar] [CrossRef]
  44. Xu, X.; Wang, K.; Zhang, K.; Ma, Q.; Xing, L.; Sullivan, C.; Hu, D.; Cheng, S.; Wang, S. A gigantic feathered dinosaur from the Lower Cretaceous of China. Nature 2012, 484, 92–95. [Google Scholar] [CrossRef] [PubMed]
  45. Romilio, A.; Salisbury, S.W. Large dinosaurian tracks from the Upper Cretaceous (Cenomanian–Turonian) portion of the Winton Formation, Lark Quarry, central-western Queensland, Australia: 3D photogrammetric analysis renders the ‘stampede trigger’ scenario unlikely. Cretac. Res. 2014, 51, 186–207. [Google Scholar] [CrossRef]
  46. Hou, L.; Pei, J.; Cai, Y.; Zhou, Z.; Tong, Y.; Zhao, Y. Upper Cretaceous-Paleocene magnetostratigraphy of the Longmenshan foreland basin and its implications for the tectonic deformation of the Longmenshan fault zone. Tectonics 2023, 42, e2022TC007660. [Google Scholar] [CrossRef]
  47. Ruiz, J.; Torices, A. Humans Running at Stadiums and Beaches and the Accuracy of Speed Estimations from Fossil Trackways. Ichnos 2013, 20, 31–35. [Google Scholar] [CrossRef]
  48. Weems, R.E. Locomotor speeds and patterns of running behavior in non-maniraptoriform theropod dinosaurs. N. M. Mus. Nat. Hist. Sci. Bull. 2006, 37, 379–389. [Google Scholar]
  49. Larramendi, A.; Paul, G.S.; Hsu, S.Y. A review and reappraisal of the specific gravities of present and past multicellular organisms, with an emphasis on tetrapods. Anat. Rec. 2021, 304, 1833–1888. [Google Scholar] [CrossRef]
  50. Hirt, M.R.; Jetz, W.; Rall, B.C.; Brose, U. A general scaling law reveals why the largest animals are not the fastest. Nat. Ecol. Evol. 2017, 1, 1116–1122. [Google Scholar] [CrossRef]
  51. Gatesy, S.M.; Baker, M.; Hutchinson, J.R. Constraint-based exclusion of limb poses for reconstructing theropod dinosaur locomotion. J. Vertebr. Paleontol. 2009, 29, 535–544. [Google Scholar] [CrossRef]
  52. Gatesy, S.M.; Manafzadeh, A.R.; Bishop, P.J.; Turner, M.L.; Kambic, R.E.; Cuff, A.R.; Hutchinson, J.R. A proposed standard for quantifying 3-D hindlimb joint poses in living and extinct archosaurs. J. Anat. 2022, 241, 101–118. [Google Scholar] [CrossRef]
  53. Meyer, C.A.; Thuring, B.; Graf, K.; Heim, G. A Marriage between Geotechnique and Palaeontology Three dimensional vizualization of a geological monument for scientific exploration and geotechnical conservation (Cal Orcko, Sucre Bolivia). In Proceedings of the 4th Swiss Geoscience Meeting, Bern, Switzerland, 24–25 November 2006; p. 2. [Google Scholar]
  54. Meyer, C.A.; Lockley, M.G. Jurassic and Cretaceous dinosaur tracksites from Central Asia (Usbekistan and Turkmenistan). J. Paleontol. Soc. Korea 1997, 2, 77–92. [Google Scholar]
  55. Mossman, D.J.; Bruning, R.; Powell, H.P. Anatomy of a Jurassic theropod trackway from Ardley, Oxfordshire, U.K. Ichnos 2003, 10, 195–207. [Google Scholar] [CrossRef]
  56. Day, J.J.; Norman, D.B.; Gale, A.S.; Upchurch, P.; Powell, H.P. A Middle Jurassic dinosaur trackway site from Oxfordshire, UK. Palaeontology 2004, 47, 319–348. [Google Scholar] [CrossRef]
  57. Lockley, M.G. The dinosaur footprint renaissance. Mod. Geol. 1991, 16, 139–160. [Google Scholar]
  58. Falkingham, P.L.; Bates, K.T.; Avanzini, M.; Bennett, M.; Bordy, E.; Breithaupt, B.H.; Castanera, D.; Citton, P.; Díaz-Martínez, I.; Farlow, J.O.; et al. A standard protocol for documenting modern and fossil ichnological data. Paleontology 2018, 61, 469–480. [Google Scholar] [CrossRef]
  59. Romilio, A.; Hacker, J.M.; Zlot, R.; Poropat, G.; Bosse, M.; Salisbury, S.W. A multidisciplinary approach to digital mapping of dinosaurian tracksites in the Lower Cretaceous (Valanginian-Barremian) Broome Sandstone of the Dampier Peninsula, Western Australia. PeerJ 2017, 5, e3013. [Google Scholar] [CrossRef]
  60. Abrahams, M.; Bordy, E.M.; Knoll, F.; Farlow, J.O. Theropod Tridactyl Tracks Across the Triassic–Jurassic Boundary in Southern Africa: Implications for Pedal Morphology Evolution. Front. Ecol. Evol. 2022, 10, 925313. [Google Scholar] [CrossRef]
  61. Farina, M.E.; Verónica, K.; Marsicano, C.A. A new avian footprint taxon (Gragliavipes gavenskii, Ignotornidae) from the Cenozoic of South America and a reappraisal of avian ichnofamilies from the Cretaceous and Cenozoic. Hist. Biol. 2025, 1–13. [Google Scholar] [CrossRef]
  62. De La Fuente, J.M.; Vera, R.B.; Farina, M.E.; Krapovickas, V. Small mammal trackways from the Neogene Vinchina Basin, Argentina: Insights into Xenarthra (Dasypodidae), Notoungulata (Typotheria), and Rodentia (Caviomorpha). J. S. Am. Earth Sci. 2025, 152, 105297. [Google Scholar] [CrossRef]
  63. Deiques, D.; Barcelos-Silveira, A.; Dentzien-Dias, P.; Francischini, H. Dinosaur tracks from the Guará Formation (Brazil) shed light on the biodiversity of a South American Late Jurassic humid desert. J. S. Am. Earth Sci. 2025, 153, 105364. [Google Scholar] [CrossRef]
  64. Lallensack, J.N.; Romilio, A.; Falkingham, P.L. A machine learning approach for the discrimination of theropod and ornithischian dinosaur tracks. J. R. Soc. Interface 2022, 19, 20220588. [Google Scholar] [CrossRef]
  65. Murphey, P.C.; Romilio, A.; Matthews, N.A.; Lockley, M.G.; Breithaupt, B.H.; Houck, K.J.; Chin, K.; Milner, A.; Diaz Martinez, I.; Xing, L.; et al. Track Recognition via Artificial Cognition (TRAC): Preliminary Report on the Application of Machine Learning to Identify Dinosaur Tracks. N. M. Mus. Nat. Hist. Sci. Bull. 2024, 95, 349–356. [Google Scholar]
  66. Romilio, A.; Dick, R.; Skinner, H.; Millar, J. Uncovering hidden footprints: Revision of the Lower Jurassic (Sinemurian) Razorback Beds—Home to Australia’s earliest reported dinosaur trackway. Hist. Biol. 2025, 37, 596–603. [Google Scholar] [CrossRef]
  67. Stovall, J.W.; Langston, W. Acrocanthosaurus atokensis, a new genus and species of Lower Cretaceous Theropoda from Oklahoma. Am. Midl. Nat. 1950, 43, 696–728. [Google Scholar] [CrossRef]
  68. Farlow, J.O.; Pittman, J.G.; Hawthorne, J.M. Brontopodus birdi, Lower Cretaceous sauropod footprints from the U.S. Gulf Coastal Plain. In Dinosaur Tracks and Traces; Gillette, D.D., Lockley, M.G., Eds.; Cambridge University Press: Cambridge, UK, 1989; pp. 371–394. [Google Scholar]
  69. Farlow, J.; Deschner, E.; Solis, R.; Ward, W. An unusual trackway of a medium-sized dinosaur from the Glen Rose Formation (Lower Cretaceous, Comal County, Texas). J. Verterbrate Paleontol. 2007, 27, 73A. [Google Scholar]
  70. Farlow, J.O.; O’Brien, M.; Kuban, G.J.; Bates, K.; Falkingham, P.; Pinuela, L.; Rose, A.; Freels, A.; Kumagai, C.; Libben, C.A.; et al. Dinosaur tracksites of the Paluxy River (Glen Rose Formation, Lower Cretaceous), Dinosaur Valley State Park, Somervell County, Texas. Abstr. Programs—Geol. Soc. Am. 2012, 42, 94. [Google Scholar]
  71. Farlow, J.; Bates, K.; Bonem, R.; Dattilo, B.; Falkingham, P.; Gildner, R.; Jacene, J.; Kuban, G.; Martin, A.; O’Brien, M.; et al. Dinosaur Footprints from The Glen Rose Formation (Paluxy River, Dinosaur Valley State Park, Somervell County, Texas). In Proceedings of the SVP 2015 Meeting Field Trip Guidebook, 75th Annual Meeting of the Society of Vertebrate Palaeontology, Dallas, TX, USA, 13–17 October 2015; pp. 14–37. [Google Scholar]
  72. Falkingham, P.L.; Gatesy, S.M. The birth of a dinosaur footprint: Subsurface 3D motion reconstruction and discrete element simulation reveal track ontogeny. Proc. Natl. Acad. Sci. USA 2014, 111, 18279–18284. [Google Scholar] [CrossRef]
  73. Bates, K.T.; Manning, P.L.; Hodgetts, D.; Sellers, W.I. Estimating mass properties of dinosaurs using laser imaging and 3D computer modelling. PLoS ONE 2009, 4, e4532. [Google Scholar] [CrossRef]
  74. Christiansen, P.; Fariña, R.A. Mass Prediction in Theropod Dinosaurs. Hist. Biol. 2004, 16, 85–92. [Google Scholar] [CrossRef]
  75. Atkins-Weltman, K.; Snively, E.; Connor, P. Constraining the body mass range of Anzu wyliei using volumetric and extant-scaling methods. Vertebr. Anat. Morphol. Palaeontol. 2021, 9, 95–104. [Google Scholar] [CrossRef]
  76. Romano, M.; Manucci, F.; Rubidge, B.; Van den Brandt, M.J. Volumetric Body Mass Estimate and in vivo Reconstruction of the Russian Pareiasaur Scutosaurus karpinskii. Front. Ecol. Evol. 2021, 9, 692035. [Google Scholar] [CrossRef]
  77. Romano, M.; Manucci, F. Resizing Lisowicia bojani: Volumetric body mass estimate and 3D reconstruction of the giant Late Triassic dicynodont. Hist. Biol. 2021, 33, 474–479. [Google Scholar] [CrossRef]
  78. Romano, M.; Rubidge, B. First 3D reconstruction and volumetric body mass estimate of the tapinocephalid dinocephalian Tapinocaninus pamelae (Synapsida: Therapsida). Hist. Biol. 2021, 33, 498–505. [Google Scholar] [CrossRef]
  79. Romano, M.; Fabio, M.; Bellucci, L. Body mass estimate and in-vivo reconstruction of Hippopotamus antiquus from Figline, Upper Valdarno (Tuscany). Hist. Biol. 2024, 1–12. [Google Scholar] [CrossRef]
  80. Moreno, K.; Silva-Salinas, K.; Finsterbusch, O.; Vidal-Murillo, L.; Iglesias, A.; Astorga, G.A.; Arriagada, J.I. Tetradactyl footprints and plant material from the Jurassic-Cretaceous boundary, Tarapaca Region, Northern Chile. J. S. Am. Earth Sci. 2024, 142, 104962. [Google Scholar] [CrossRef]
  81. Falkingham, P.L. Reconstructing dinosaur locomotion. Biol. Lett. 2025, 21, 20240441. [Google Scholar] [CrossRef]
  82. Currie, P.J.; Carpenter, K. A new specimen of Acrocanthosaurus atokensis (Theropoda, Dinosauria) from the Lower Cretaceous Antlers Formation (Lower Cretaceous, Aptian) of Oklahoma, USA. Geodiversitas. 2000, 22, 207–246. [Google Scholar]
  83. D’Emic, M.D.; Melstrom, K.M.; Eddy, D.R. Paleobiology and geographic range of the large-bodied Cretaceous theropod dinosaur Acrocanthosaurus atokensis. Palaeogeogr. Palaeoclimatol. Palaeoecol. 2012, 333–334, 13–23. [Google Scholar] [CrossRef]
Figure 1. Trackway parameters calculated for the HX-T3 trackway from the Lower Cretaceous (Barremian–Albian) Jiaguan Formation, Hanxi, Sichuan Province, China.
Geosciences 15 00165 g001
Figure 2. Trackway parameters for the HX-T3 trackway from the Lower Cretaceous (Barremian–Albian) Jiaguan Formation, Hanxi, Sichuan Province, China: (a) plotted along an X-Y axis (west-to-east and south-to-north direction, respectively) with arrow indicating travel direction; (b) orientation as a Polar Plot (tracks 1–68); (c) trackway width; (d) pace angulation; (e) pace, step, and stride lengths.
Geosciences 15 00165 g002
Figure 3. Trackmaker biometrics calculated for the HX-T3 trackway from the Lower Cretaceous Jiaguan Formation, Hanxi, Sichuan Province, China: (a) Life reconstruction of the HX-T3 trackmaker based on Yutyrannus and shown to scale with a 175 cm tall human model and 1 m2 floor grid; (b) relative units based on stride (triangles) and step (circles); (c) velocity calculation units based on stride (triangles) and step (circles).
Geosciences 15 00165 g003
Table 1. Trackway parameters calculated for the HX-T3, Lower Cretaceous (Barremian–Albian), Jiaguan Formation, Hanxi, Sichuan Province, China. See Table S1 for details.
Trackway Width
(=WAP) (m)
Pace
(m)
Step
(m)
Stride
(m)
Pace
Ang (°)
Step
Angle (°)
Orientation
(Cardinal)
Orientation
(°)
Average: 0.1380.8580.8461.6921619S178
Median: 0.131 0.854 0.840 1.685 162 9 S179
(SD 0.049)(SD 0.071)(SD 0.071)(SD 0.093)(SD 7)(SD 3) (SD 6)
Min–Max: 0.008–0.3000.707–1.1760.678–1.1711.408–2.043140–1791–21S–SSE163–187
Table 2. Trackmaker biometrics based on the HX-T3 with straight-legs (i.e., hip height = 4.5 × FL), Lower Cretaceous (Barremian–Albian), Jiaguan Formation, Hanxi, Sichuan Province, China. See Table S2 for details.
Relative Stride
(<2 = Walk)
Velocity-Stride
(m/s)
Velocity-Stride (km/h)Relative Step
(<1 = Walk)
Velocity-Step
(m/s)
Velocity-Step (km/h)Cadence
(Steps/
min)
Step
Duration
(s)
Average: 1.251.204.30.631.204.3850.51
Median: 1.49 (SD 0.07)1.19 (SD 0.11)4.3 (SD 0.4)0.63 (SD 0.05)1.18 (SD 0.18)4.3 (SD 0.6)85 (SD 5)0.57 (SD 0.04)
Min–Max: 1.04–1.510.88–1.643.2–5.90.50–0.870.83–2.063.0–7.473–1060.57–0.82
Table 3. Trackmaker Biometrics based on the HX-T3 with bent legs (i.e., hip height = 3.77 × FL), Lower Cretaceous (Barremian–Albian), Jiaguan Formation, Hanxi, Sichuan Province, China. See Table S3 for details.
Relative Stride
(<2 = Walk)
Velocity-Stride (m/s)Velocity-Stride (km/h)Relative Step
(<1 = Walk)
Velocity-Step (m/s)Velocity-Step (km/h)Cadence
(Steps/
min)
Step
Duration
(s)
Average: 1.501.485.320.751.485.331040.58
Median: 1.49 (SD 0.08)1.47 (SD 0.14)5.30 (SD 0.50)0.74 (SD 0.06)1.46 (SD 0.22)5.20 (SD 0.78)104 (SD 6)0.58 (SD 0.03)
Min–Max: 1.25–1.811.09–2.023.91–7.270.60–1.031.02–2.543.70–9.1090–1300.46–0.67
Disclaimer/Publisher’s Note: The statements, opinions and data contained in all publications are solely those of the individual author(s) and contributor(s) and not of MDPI and/or the editor(s). MDPI and/or the editor(s) disclaim responsibility for any injury to people or property resulting from any ideas, methods, instructions or products referred to in the content.

