Article

Quantitative Biofacies Analysis of Upper Oligocene Reef-Coral Neritic Carbonates (Southern Pakistan)

1
Dipartimento di Scienze Chimiche e Geologiche, Università di Modena e Reggio Emilia, 41125 Modena, Italy
2
Dipartimento di Scienze dell’Ambiente e della Terra, Università degli Studi di Milano-Bicocca, 20126 Milano, Italy
3
Dipartimento di Scienze Ambientali, Informatica e Statistica, Università Ca’ Foscari Venezia, 30172 Venezia, Italy
4
College of Marine Science and Engineering, Nanjing Normal University, Nanjing 210023, China
5
Department of Earth Sciences, University of Sargodha, Sargodha 40100, Pakistan
6
Department of Geology, Federal Urdu University of Arts, Science and Technology, Karachi 75300, Pakistan
7
School of Geosciences, China University of Petroleum (East China), Qingdao 266580, China
*
Author to whom correspondence should be addressed.
Geosciences 2025, 15(4), 129; https://doi.org/10.3390/geosciences15040129
Submission received: 17 February 2025 / Revised: 25 March 2025 / Accepted: 26 March 2025 / Published: 1 April 2025

Abstract

:
This study examines four shallow-water, reef-coral-bearing carbonate successions belonging to the Jhill Limestone Unit of the Gaj Formation, exposed in the area near Karachi (southern Pakistan). Sixty-two samples were collected for the quantitative analysis of the skeletal and foraminiferal assemblages. The analysis of large benthic foraminifera suggests a placement within the late Oligocene, characterized by the setup of the Late Oligocene Warming Event. Thanks to quantitative analyses and multivariate statistics, three biofacies were identified: (1) the reef coral biofacies (BFA), indicative of a sheltered, shallow-water environment above fair-weather wave base; (2) the coralline algal biofacies (BFB), deposited within a mesophotic setting and representing the deepest biofacies among the three recognized ones; and (3) the large benthic foraminiferal and coralline algal biofacies (BFC), subdivided into two sub-biofacies, namely (a) the miogypsinid, thin and flat large benthic foraminiferal and coralline algal sub-biofacies (BFC1), indicative of deeper setting, comprised between BFA and BFB, and (b) the miogypsinid and coralline algal sub-biofacies (BFC2), indicative of shallower settings than BFC1, and bearing evidence of paleo-seagrass meadows. All these biofacies were developed within the photic zone, in a relatively flat seafloor punctuated by patch reefs and seagrass meadows and characterized by a notable nutrient influx. Foraminiferal-based experimental paleobathymetric parameters, including the lepidocyclinids/miogypsinids, the flat nummulitids/lepidocyclinids, and the hyaline/porcelaneous foraminifera ratios, were tested and confirmed as reliable tools for paleodepth and paleoenvironmental reconstructions.

1. Introduction

Our knowledge of shallow-water carbonates is supported by a rich literature which, however, is relatively patchy in time and space. While many studies have investigated the dynamics and composition of modern shallow-water biogenic carbonates in iconic localities such as the Bahamas, Caribbean atolls, Florida, and the Persian Gulf, a large portion of the tropical belt and most of the mid and high latitudes are currently under-explored [1,2,3,4]. Similar to their modern counterparts, fossil shallow-water carbonates in areas such as Europe have been intensively studied [5,6,7,8], whereas those in Asia, Africa, and South America have not [9]. Shallow-water sedimentary successions are also much more variable, complex, and incomplete than their deep-water counterparts [10]. This added layer of complexity greatly hinders quantitative analysis, resulting in very few large-scale, data-driven reviews of neritic carbonate production through time (e.g., [11,12,13,14]). Increased quantitative data and comprehensive research on ancient habitats (especially, but not exclusively, in poorly studied areas) are crucial for advancing our ability to reconstruct past environments, which in turn enhances our understanding of modern ecosystems and informs future predictions [1].
To contribute to improving our understanding of the distribution of carbonate producers, and in particular reef corals and benthic foraminifera, this paper focuses on an otherwise poorly investigated area: southern Pakistan. To do this, we provide a quantitative paleontological analysis of the skeletal and foraminiferal assemblages of four marine, shallow-water carbonate successions exposed in the area near Karachi (southern Pakistan) (Figure 1). The studied sections belong to the Jhill Limestone Unit of the Gaj Formation, that has been attributed so far to the Early Miocene (Burdigalian, e.g., [15,16]) but never investigated in detail. The aim of this work is to (1) perform a detailed facies analysis of the successions, (2) provide a paleoenvironmental and stratigraphic reconstruction and a paleobathymetric model of the Jhill Limestone Unit in the studied area, (3) offer new insights for understanding the distribution and composition of shallow-water carbonate producing organisms within the Cenozoic, and enable the comparison between the coral-bearing, shallow-water, carbonates of the Gaj Formation with similar units from the European and the Indo-Pacific regions, providing a possible bridge between these two bio-provinces.
A further goal of this work is to test different foraminiferal-based experimental indices that might prove useful for better characterizing the depositional paleobathymetry of biofacies. These biotic parameters can indeed be compared with those calculated for other case studies, in order to develop models supporting more detailed paleoenvironmental reconstructions and to establish a baseline for future research.

2. Geological Setting

The studied sections are located in the southwestern Kirthar Fold Belt Basin (southern Pakistan) (Figure 1). This basin, spanning approximately 550 km2 N-S from Quetta to Karachi, records the gradual southward regression of the Tethys Sea during the late Oligocene to Early Miocene, resulting in marine, estuarine, and fluvial deposits [17]. According to Shani and Khan [18], fossil assemblages from this area indicate an active oceanic connection between the Indian and European regions during this period. The Kirthar Fold Belt Basin was formed by the oblique collision between the Indian Plate and the Eurasian Helmand Block, which closed the remnant oceanic basin between them by the late Oligocene to Early Miocene [19]. This tectonic event initiated the Chaman Transform Fault Zone and the N-S trending Kirthar Basement Fault [20], triggering significant uplift, folding, and deformation that were most pronounced during the late Oligocene–Miocene and remain ongoing today. The western boundary of the basin is marked by the Ghazaband Fault and the Bela-Waziristan ophiolite zone, while the eastern margin aligns with the Bolan and Gaj Faults. The region experienced tectonic quiescence until the Indian and Asian plates collided, causing uplift and non-deposition during the late Eocene [21]. The Karachi Trough depocenter formed at the end of the Eocene, receiving sediments from the proto-Indus River and Afghanistan plate, resulting in the clastic and shallow marine deposits of the Nari and Gaj formations. By the Late Miocene, large-scale faults developed, producing anticlinal ridges [22].
The studied sections (Figure 1), part of a major structure extending N-S from Mehar and Mol Jabals to Cape Monze, display significant folds and faults, such as the Sona Fault, a left-lateral strike-slip fault with 2200 m of offset located along Sona Pass [23,24]. The Sona Pass and Allah Bano structures are separated by a dextral strike-slip fault with a displacement of about 5 to 7 km. The sedimentary succession of the study area includes shallow marine Eocene to Holocene deposits, with the Oligocene–Miocene units dominating [17]. The Eocene Kirthar Formation, widely exposed in the southern part of the basin, mainly consists of dark grey to golden-brown bedded fossiliferous limestones [16]. The overlying Nari Formation consists of fossiliferous limestones and sandstones, divided into the lower Tobo Member and the upper Machani Member [16]. The latter includes distinct units such as (1) the Pir Mangho Limestone, (2) the Halkani Sandstone, (3) the Ghora Laki Limestone, and (4) the Orangi Sandstone, in stratigraphic order. The upper Nari Formation has been ascribed to a time interval comprised between the Oligocene and the Earlyearly Miocene [15,16]. The unconformable transition to the overlying Gaj Formation reflects a shift from shallow to slightly deeper marine conditions [15]. The Gaj Formation is divided into the lower Mol Member and the upper Sharji Member. The Mol Member is further divided into three units: (1) Metan Clay Unit, which consists of greyish- brown and brownish-khaki, thin-bedded clays, intercalated with thin beds of fossiliferous limestones; (2) Jhill Limestone Unit, which consists of light brown to cream-colored, thin-bedded, massive, and nodular limestones; (3) Talawa Limestone, which is a brown to golden/greyish-brown, thin-to-thick-bedded, foraminiferal limestone. The upper member of the Gaj Formation, the Sharji Member, is mainly composed of multicolored shales, locally interbedded with limestones and sandstones [15,16].
The depositional environment of the Gaj Formation exposed in the study area probably differs from that of its type locality (the Gaj River section), which is located northward in the proximal sectors of the basin [18]. Based on fossil assemblages, Iqbal [25] interpreted the Gaj Formation as a tropical, shallow marine environment developed at 15 to 30 m of water depth. Hasnain et al. [26] suggested that the thick Jhill Limestone Unit of the Mol Member (lower Gaj Formation), formed in a slightly restricted shallow marine environment during a phase of regression.

3. Materials and Methods

Four sections belonging to the Jhill Limestone Unit of the Gaj Formation of the Kirthar Fold Belt Basin, namely Sona Pass (SP), Allah Bano (Lal Bakkar) (SSP), Lashkari Jo Goth (LG), and Mehar Jabal (MJ), were analyzed, focusing on the most relevant fossils, such as large benthic foraminifera (LBF), small benthic foraminifera (SBF), reef colonial corals (CC), and red calcareous algae (RCA), and on sedimentary features. Samples were taken from all the sections with a similar sampling resolution, between 1 to 3 m, covering all identified changes in paleontological content and sedimentological patterns observed during the field analysis of the sections, with occasional increases in sampling resolution if needed. After the fieldwork, 62 thin sections were prepared at the University of Karachi and carefully analyzed under a transmitted light optical microscope at the University of Milano-Bicocca and at the University of Modena and Reggio-Emilia. To classify carbonate rocks, Dunham’s classification [27], further developed by Embry and Klovan [28] and refined by Lokier and Al Junaibi [29], was applied.
Large benthic foraminiferal biostratigraphy is based on several reference studies at the regional scale [30,31,32,33,34,35]. Unfortunately, no reference biometric study is available for the LBF of Pakistan, nor does the relatively well-lithified nature of the rock facilitate the preparation of oriented thin sections of LBF specimens, necessary for species-level identification. Therefore, since the main goal of this study is to provide a detailed facies description of an otherwise poorly investigated area, the age assignment of the investigated successions is largely based on the distribution and the abundance of LBF genera (e.g., [36,37]).
To quantitatively analyze the skeletal assemblage, at least 1260 points were counted in each thin section with the point-counting technique, following Flügel’s method [38] and utilizing a grid with 200-μm spacing on digital microphotographs collected randomly along the thin sections and with no overlap (e.g., [37,39,40]). A quantitative analysis of the foraminiferal associations was performed with the area-counting technique (e.g., [41,42]). For each thin section, all the recorded foraminifera were counted and categorized into different informal groups that display similar ecological significance, e.g., porcelaneous LBF (large miliolids of the genera Sorites, Archaias and other peneroplids, Austrotrillina), lepidocyclinids (Nephrolepidina, Eulepidina), miogypsinids (Miogypsina, Miogypsinoides), flat-shaped nummulitids (Operculina, Heterostegina, Spiroclypeus), amphisteginids and asterigerinids, other hyaline LBF, planorbulinids, rounded acervulinids, hyaline SBF, porcelaneous SBF, agglutinated SBF, and planktic foraminifera. To standardize the results of the area-counting, for each thin section the number of foraminifera has been divided by the area of the correspondent thin section, measured with a micro-caliper, and the average number of foraminifera per cm2 has been calculated. Raw data from the point- and area-counting techniques are available in two datasets in Supplementary Materials S1. These quantitative datasets were analyzed with multivariate statistics, that helped with the biofacies identification. Particularly, a Q-mode cluster analysis was performed on the point-counting and area-counting datasets with the software RStudio v. 2024.4.0.735 [43], applying square root transformation on the data and employing the Ward.D2 method for hierarchical clustering. For the paleoenvironmental reconstruction, different parameters displaying paleobathymetrical significance were calculated from the area-counting database, such as the hyaline/porcelaneous foraminifera ratio (H/P; [41,42]) and the ratio between hyaline and porcelaneous LBF (LH/LM). The mean H/P values for the biofacies analyzed in this study were compared with the mean H/P values calculated for the biofacies identified by [42] in the Eocene Foraminiferal Limestone of Pag (Croatia), in order to test the reliability of this parameter across different contexts. Although the two case studies (the currently investigated Oligocene successions from Pakistan and the Eocene succession from Croatia) are very different in terms of foraminiferal taxa, the H/P ratio only compares the abundances of the two types of tests. Because hyaline and porcelaneous tests have significantly different transparency to light, this ratio reflects the availability of light at the seafloor and, consequently, the water depth. As such, this parameter can and has been employed in a wide range of settings [44]. Other new experimental parameters have also been considered, including the lepidocyclinids/miogypsinids ratio (LEPI/MIO), the flat-shaped nummulitids/miogypsinids ratio (FN/MIO), the ratio between the sum of lepidocyclinids and flat-shaped nummulitids, and miogypsinids [(LEPI+FN)/MIO], testing the hypothesis that they all increase with increasing water depth.
As regards reef corals, i.e., zooxanthellate and mostly colonial tropical corals, the complexity of accessing to the outcrops allowed the local researchers to collect only a limited number of colonies for identification in the laboratory. Despite generally poor preservation due to recrystallization, their taxonomic identification has been carried out at the finest possible taxonomic level, mostly at the genus level and at the species level in one case, following recent taxonomic revisions and reports about Oligocene and Early Miocene corals from the Mediterranean region and well-explored areas of the Middle East such as Iran [45,46,47,48,49].

4. Results

4.1. Description of the Stratigraphic Sections

4.1.1. Sona Pass Section (SP)

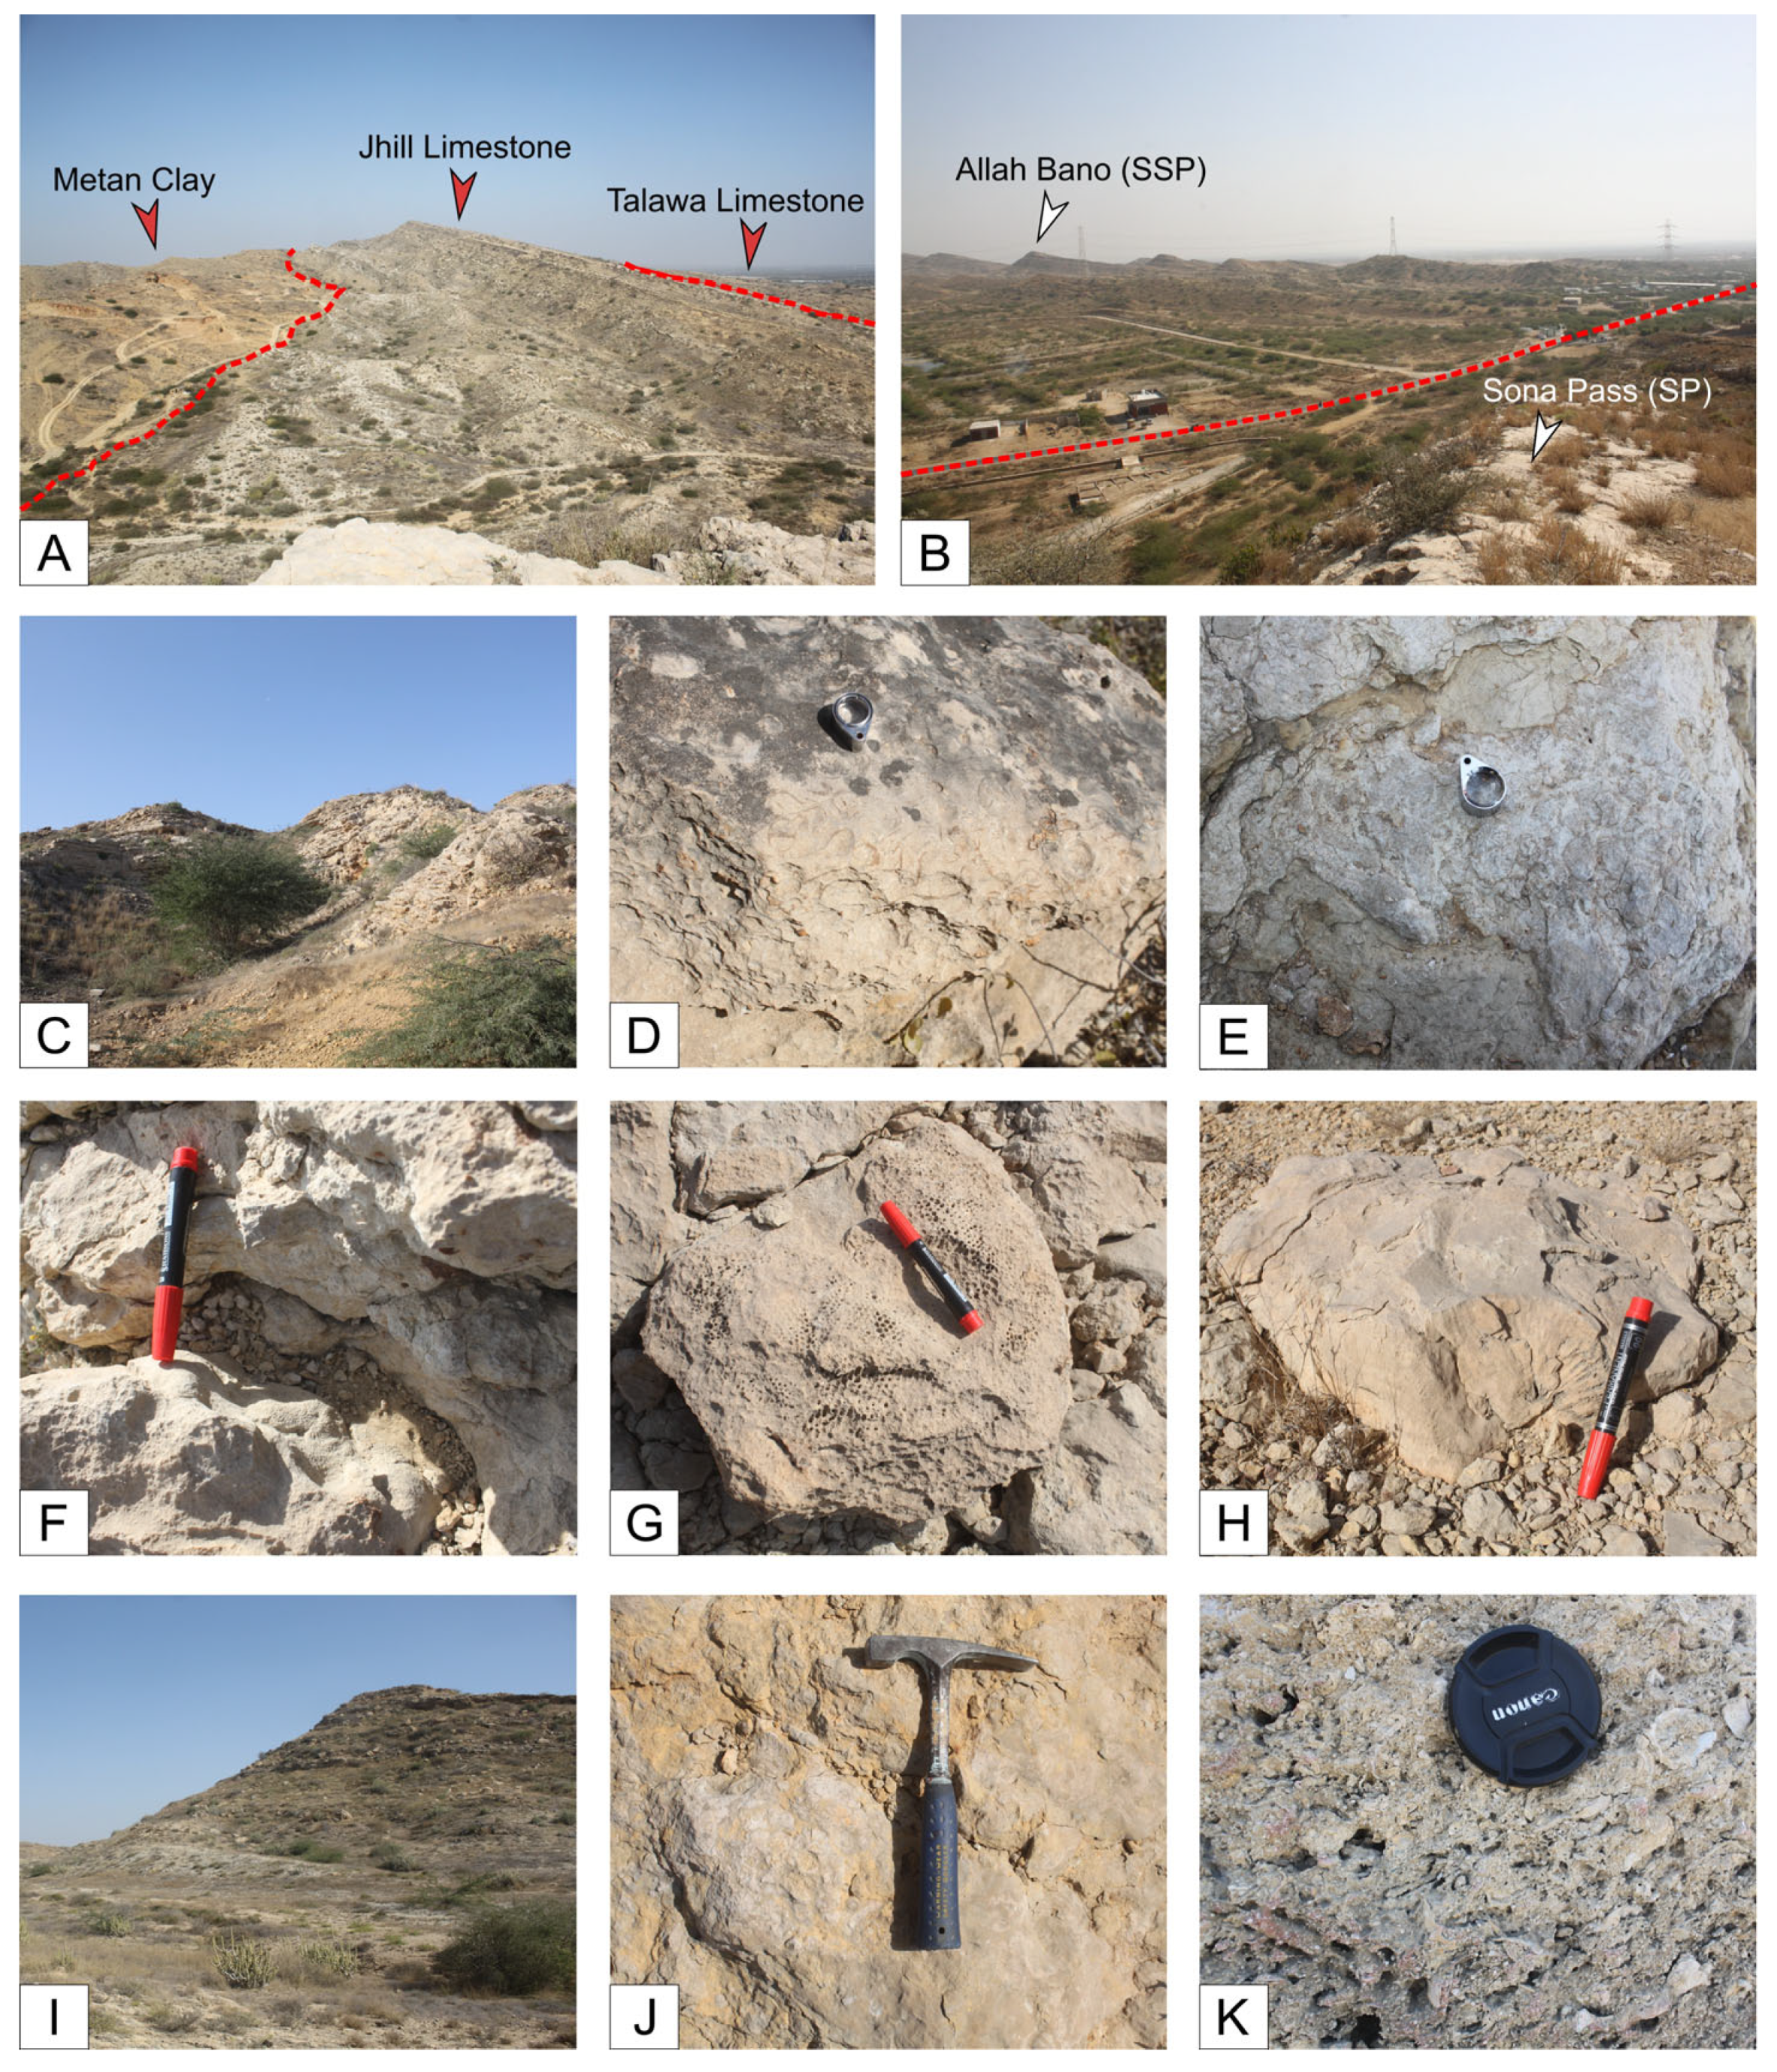
The Sona Pass section (Figure 1, Figure 2C and Figure 3) is located in the southwestern extremity of the city of Karachi (Lat 24.899540 N; Long 66.798961 E), on the southeastern limb of the Cape-Monze Anticline, and on the eastern side of the Sona Pass sinistral strike-slip fault (Figure 2C). In this section, the investigated Jhill Limestone Unit of the Gaj Formation is 48 m thick. The lower contact of the Jhill Limestone with the underlying Metan Clay Unit of the Gaj Formation is not exposed, while the top sharp contact with brownish argillaceous and large benthic foraminifera-rich Talawa Limestone is exposed on the dip slope of the Jhill Limestone Unit (Figure 2A).
Lithologically, the Jhill Limestone Unit outcropping here consists of cream-colored limestone interbedded with a very thin layer of mudstone at the base of the section. Based on macro-micro faunal assemblages, two intervals were identified in the Jhill Limestone. From 0–39 m abs (above the base of the section), the Jhill limestone consists of thin-layered, hard, compacted creamish limestone with a packstone–grainstone texture and rich in LBF, along with less abundant mollusks (Figure 2D). An RCA-dominated layer with a floatstone–rudstone texture occurs from 24–28 m abs within this initial interval. Further up the section, from 39–45 m abs, the limestone becomes marly with no layering and displays a reef-buildup morphology. This interval exhibits patches of colonial corals (Figure 2E–H), common rhodoliths (Figure 2J), and a boundstone-to-rudstone texture.

4.1.2. Allah Bano (Lal Bakkar) Section (SSP)

The Allah Bano section (Figure 1, Figure 2I and Figure 3) also lies in the southern vicinity of the city of Karachi (Lat 24.900529 N; Long 66.808208 E), and approximately at a 2 km distance from the Sona Pass section on the western side of the Sona Pass strike-slip fault (Figure 2B). In this section, the studied Jhill Limestone Unit is 33 m thick and its lower contact with the Metan Clay Unit is exposed in the valley and appears to be gradual. The top boundary with the Talawa Limestone occurs instead along the dip slope of the Jhill Limestone deposits. In the Allah Bano section, the studied interval comprised hard, compact, fossiliferous, creamish-colored, algal, and LBF-rich limestone. From 0 to 12 m abs, the macrofossil assemblage contains scattered fragments of coral colonies, and the rock displays a grainstone-to-packstone texture. From 12 to 33 m abs, the skeletal assemblage is dominated by LBF, along with common RCA, and the Jhill Limestone displays a grainstone-to-packstone texture (Figure 2K). Within this upper interval, a mollusk-dominated interval was also observed.

4.1.3. Lashkari Jo Goth (LG)

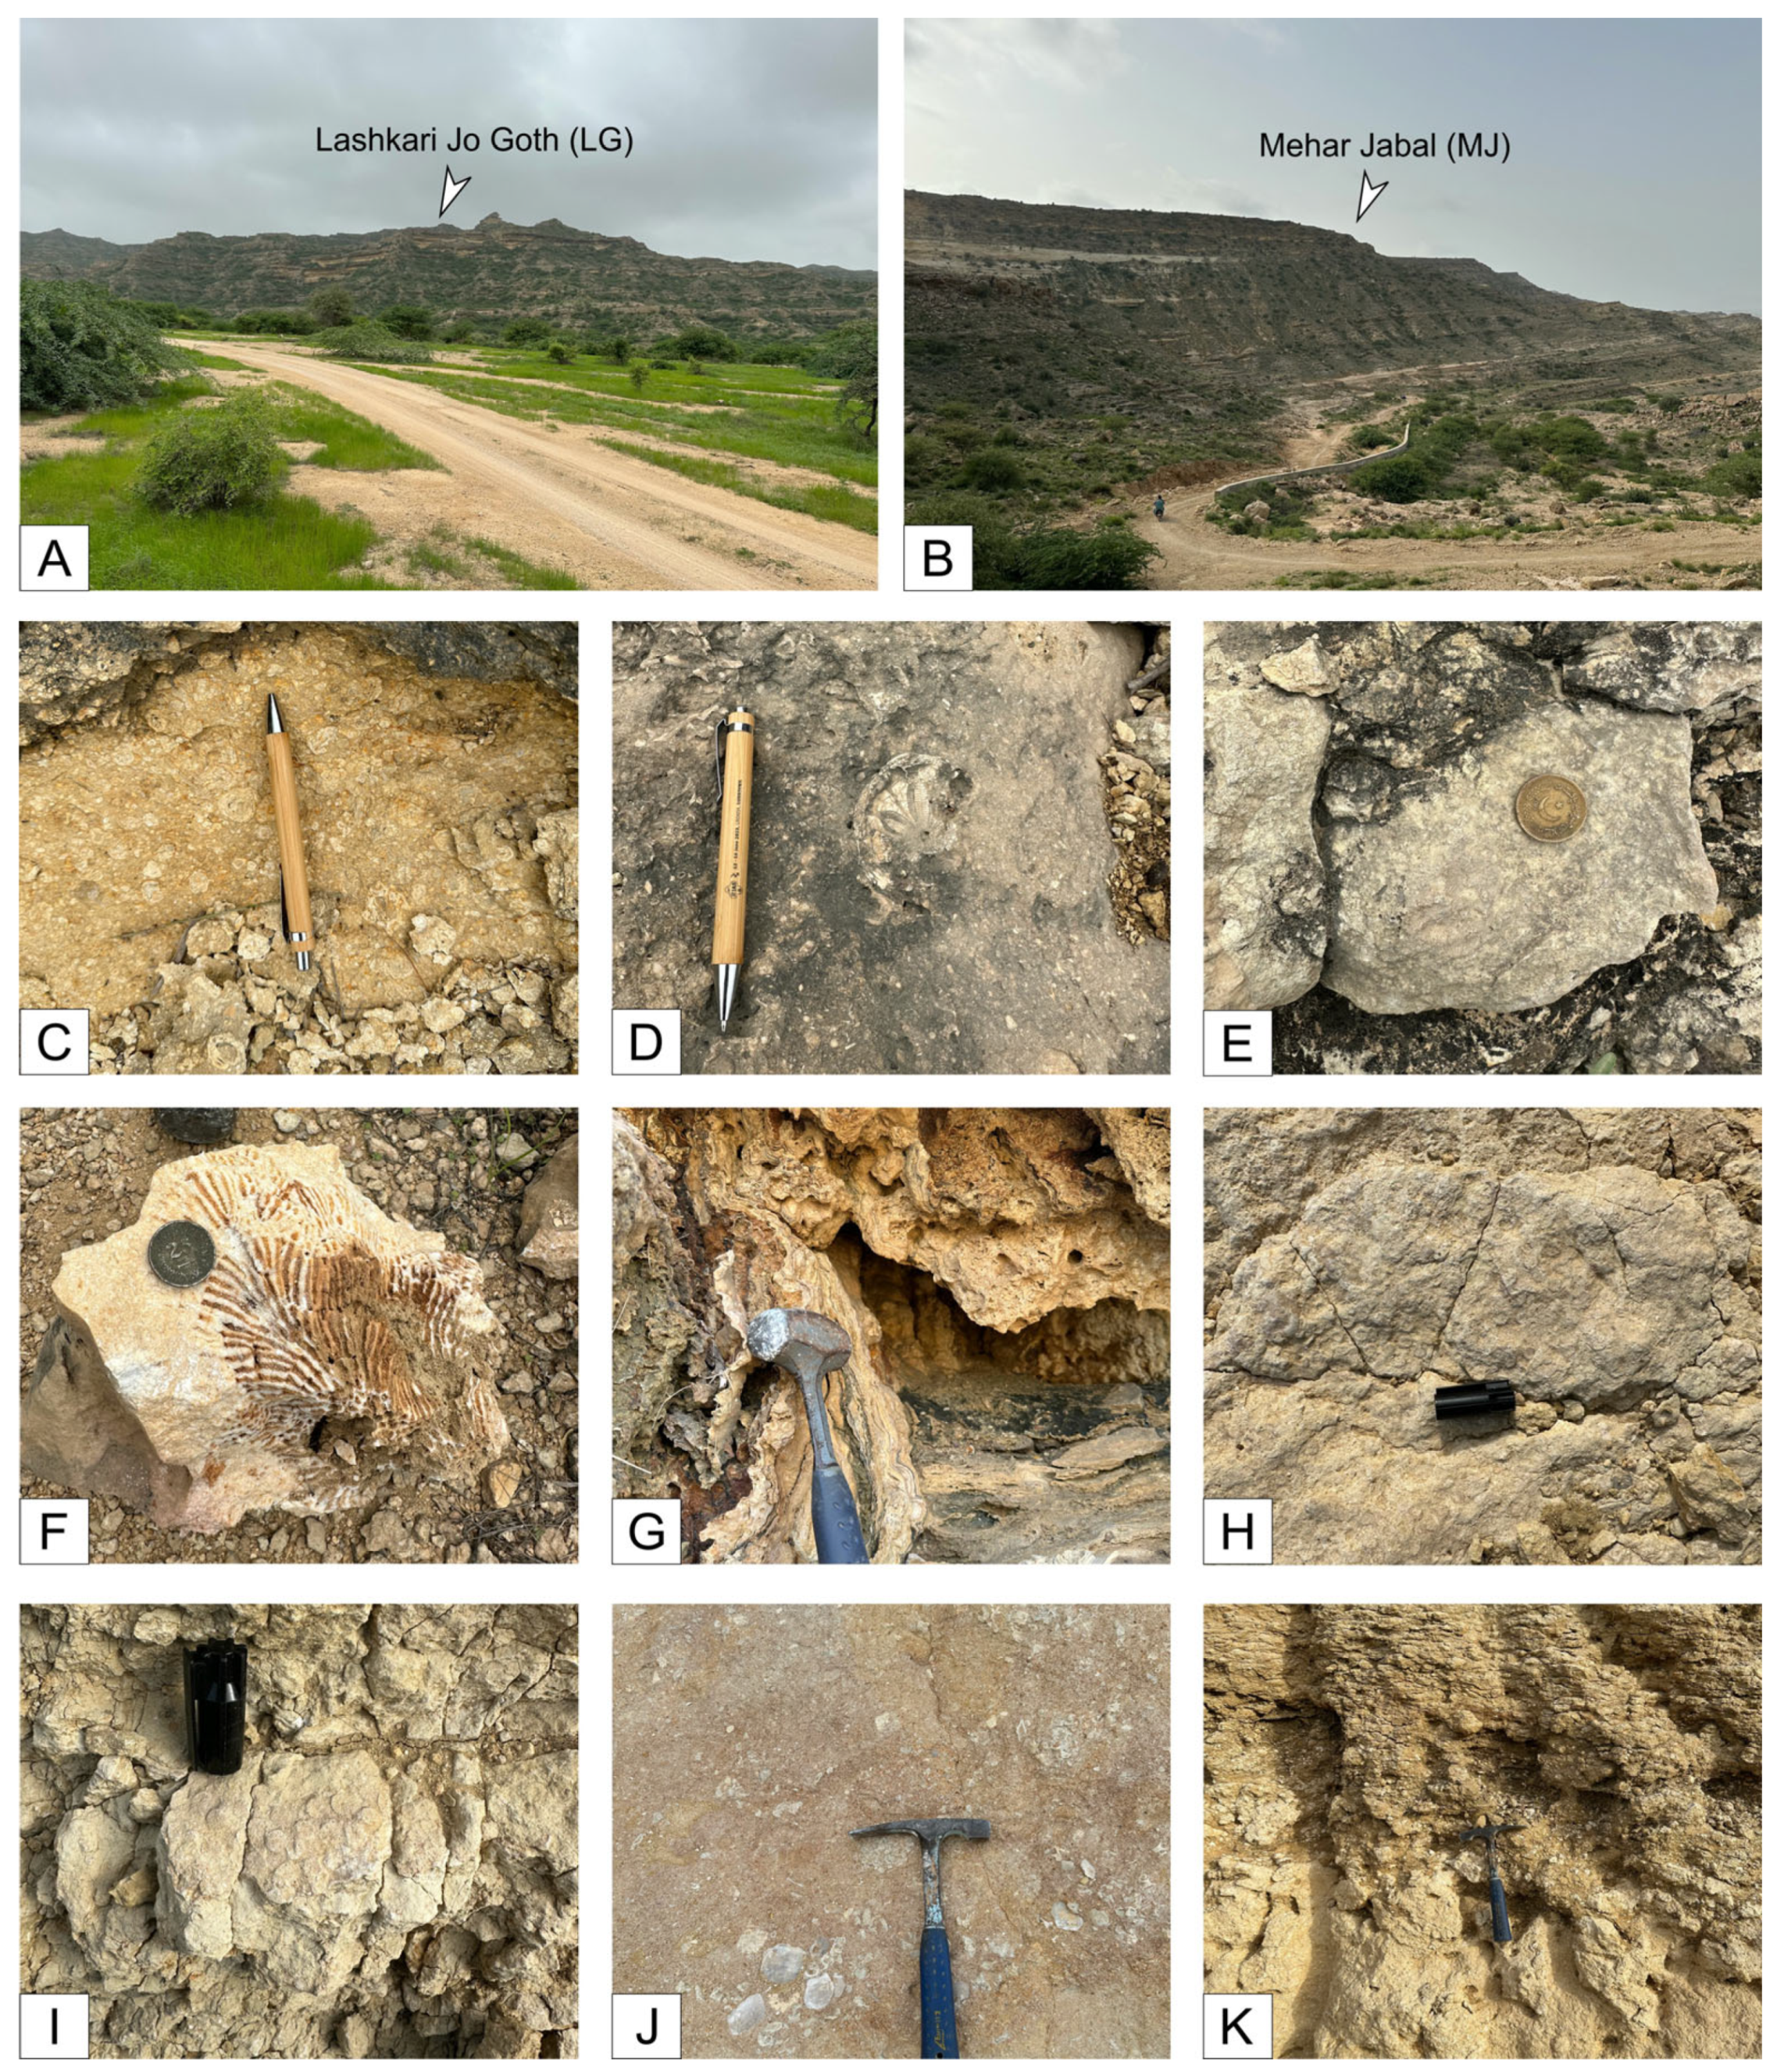
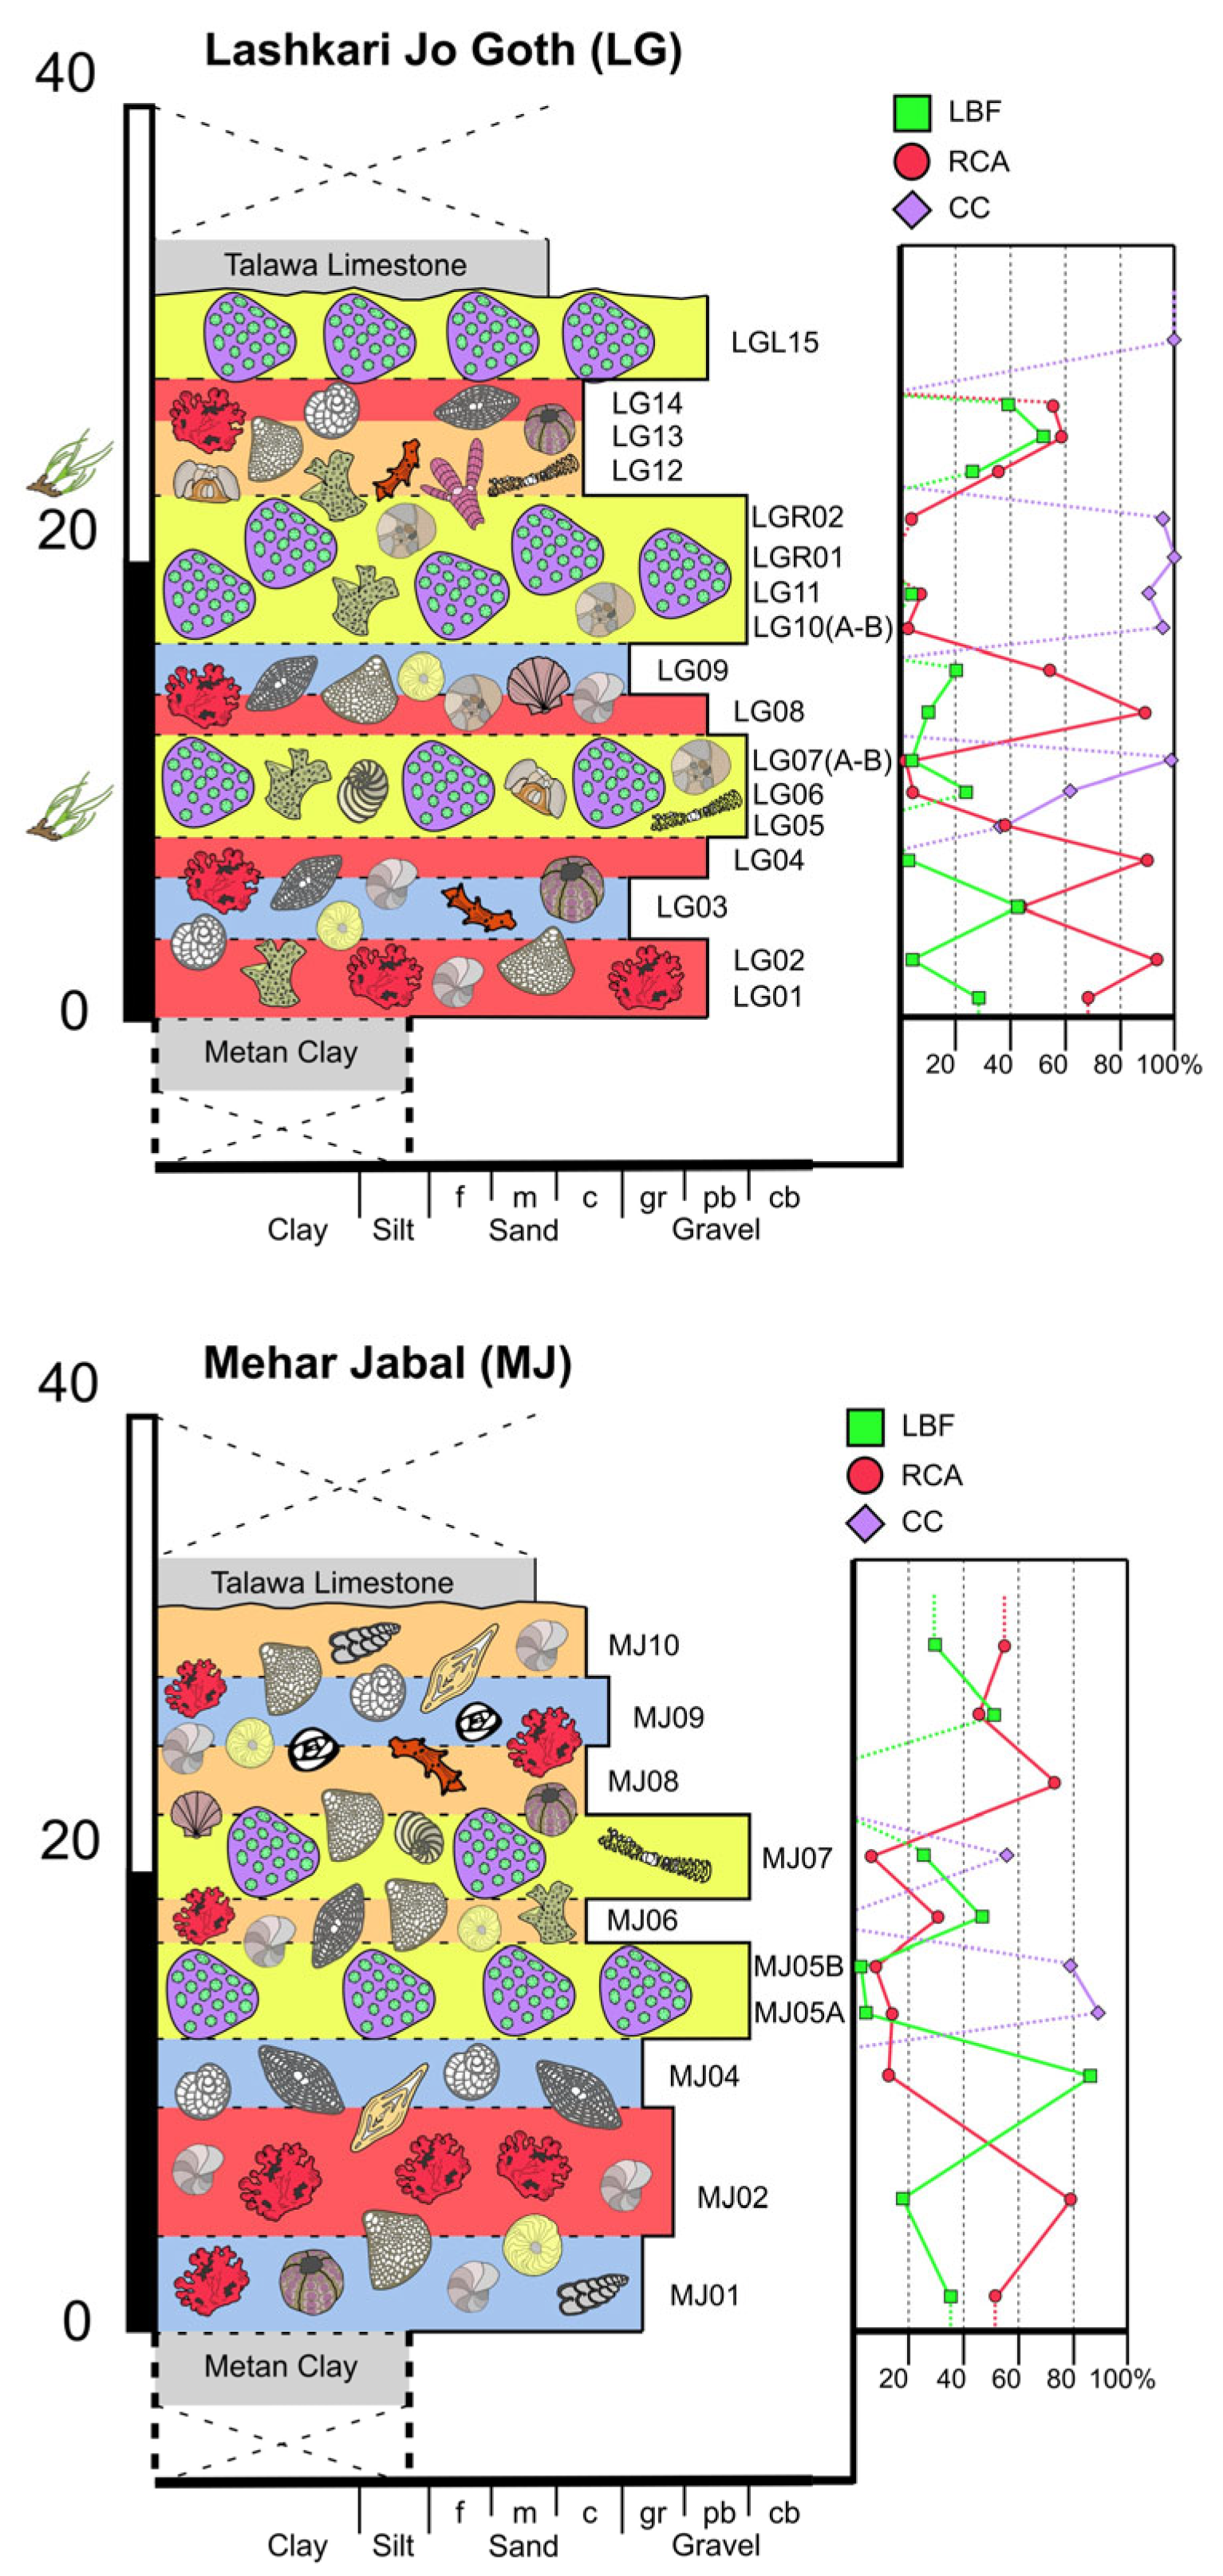
The Laskhari Jo Goth section (Figure 1, Figure 4A and Figure 5) is located in the north of Karachi (Lat 25.2791592 N; Long 67.2166881 E), at a distance of approximately 80 km from the Sona Pass and Allah Bano sections. This section lies on the eastern bank of the Khar River in the vicinity of Kirthar National Park. Here, the investigated Jhill Limestone Unit of the Gaj Formation is 32 m thick, and its lower contact with the underlying formation is covered, whereas the upper contact with the Talawa Limestone is exposed at the top of the hill. In this section, the lower 0–16 m abs consist of massive, hard, dark creamish-colored, rhodolith-rich interval displaying a packstone-to-rudstone texture (Figure 4C). Between 9 and 12 m abs, the Jhill Limestone displays a boundstone-to-rudstone texture being characterized by clusters of coral colonies embedded into a marly limestone (Figure 4E). Other associated macrofossils observed in the field are LBF, mollusks, and echinoderms (Figure 4D). This lower interval also displays karstification and dissolution features on the outcrop. Further up the section, between 16 and 22 m abs, the patches of colonial corals increase and are associated with dark-colored algal limestone with a rudstone texture. Further upward, between 22 and 32 m abs the abundance of colonial corals decreases, while the abundance of rhodoliths increases. In this uppermost portion the rock displays a packstone-to-rudstone texture, with common karstification and carbonate dissolution features. Recrystallized coral colonies are present at the top of the section, below the contact with the Talawa Limestone (Figure 4F).

4.1.4. Mehar Jabal (MJ)

The Mehar Jabal section (Figure 1, Figure 4B and Figure 5) is a further 30 km north from the Laskhari Jo Goth section (Lat 25.4792472 N; Long 67.3372389 E). This ridge is approximately 400 m high and mainly consists of the Jhill Limestone and Talawa Limestone units of the Gaj Formation. The investigated 30-m-thick portion of the Jhill Limestone is characterized by creamish-colored, well-lithified, coarse-grained, RCA-rich limestones interbedded with marly layers. Between 0 and 10 m abs, the Jhill Limestone consists of creamish-colored, RCA-rich rudstones. Rare LBF also occur. Gastropods, echinoderms, and mollusks were also observed in the lower part of the interval. Diagenetic concretions are locally present (Figure 4G). Further up the section, starting from 15 m abs, the limestone becomes more marly and compact, includes small patches of colonial corals (Figure 4H,I), and displays a variable texture, ranging from wackstone to floatstone (Figure 4J), rudstone, and boundstone. The uppermost 15 m of the section consist of RCA-dominated grainstones to rudstones. LBF, mollusks and echinoderms were also observed, whereas colonial corals are less abundant in comparison to the underlying interval (Figure 4K).

4.2. Biostratigraphy

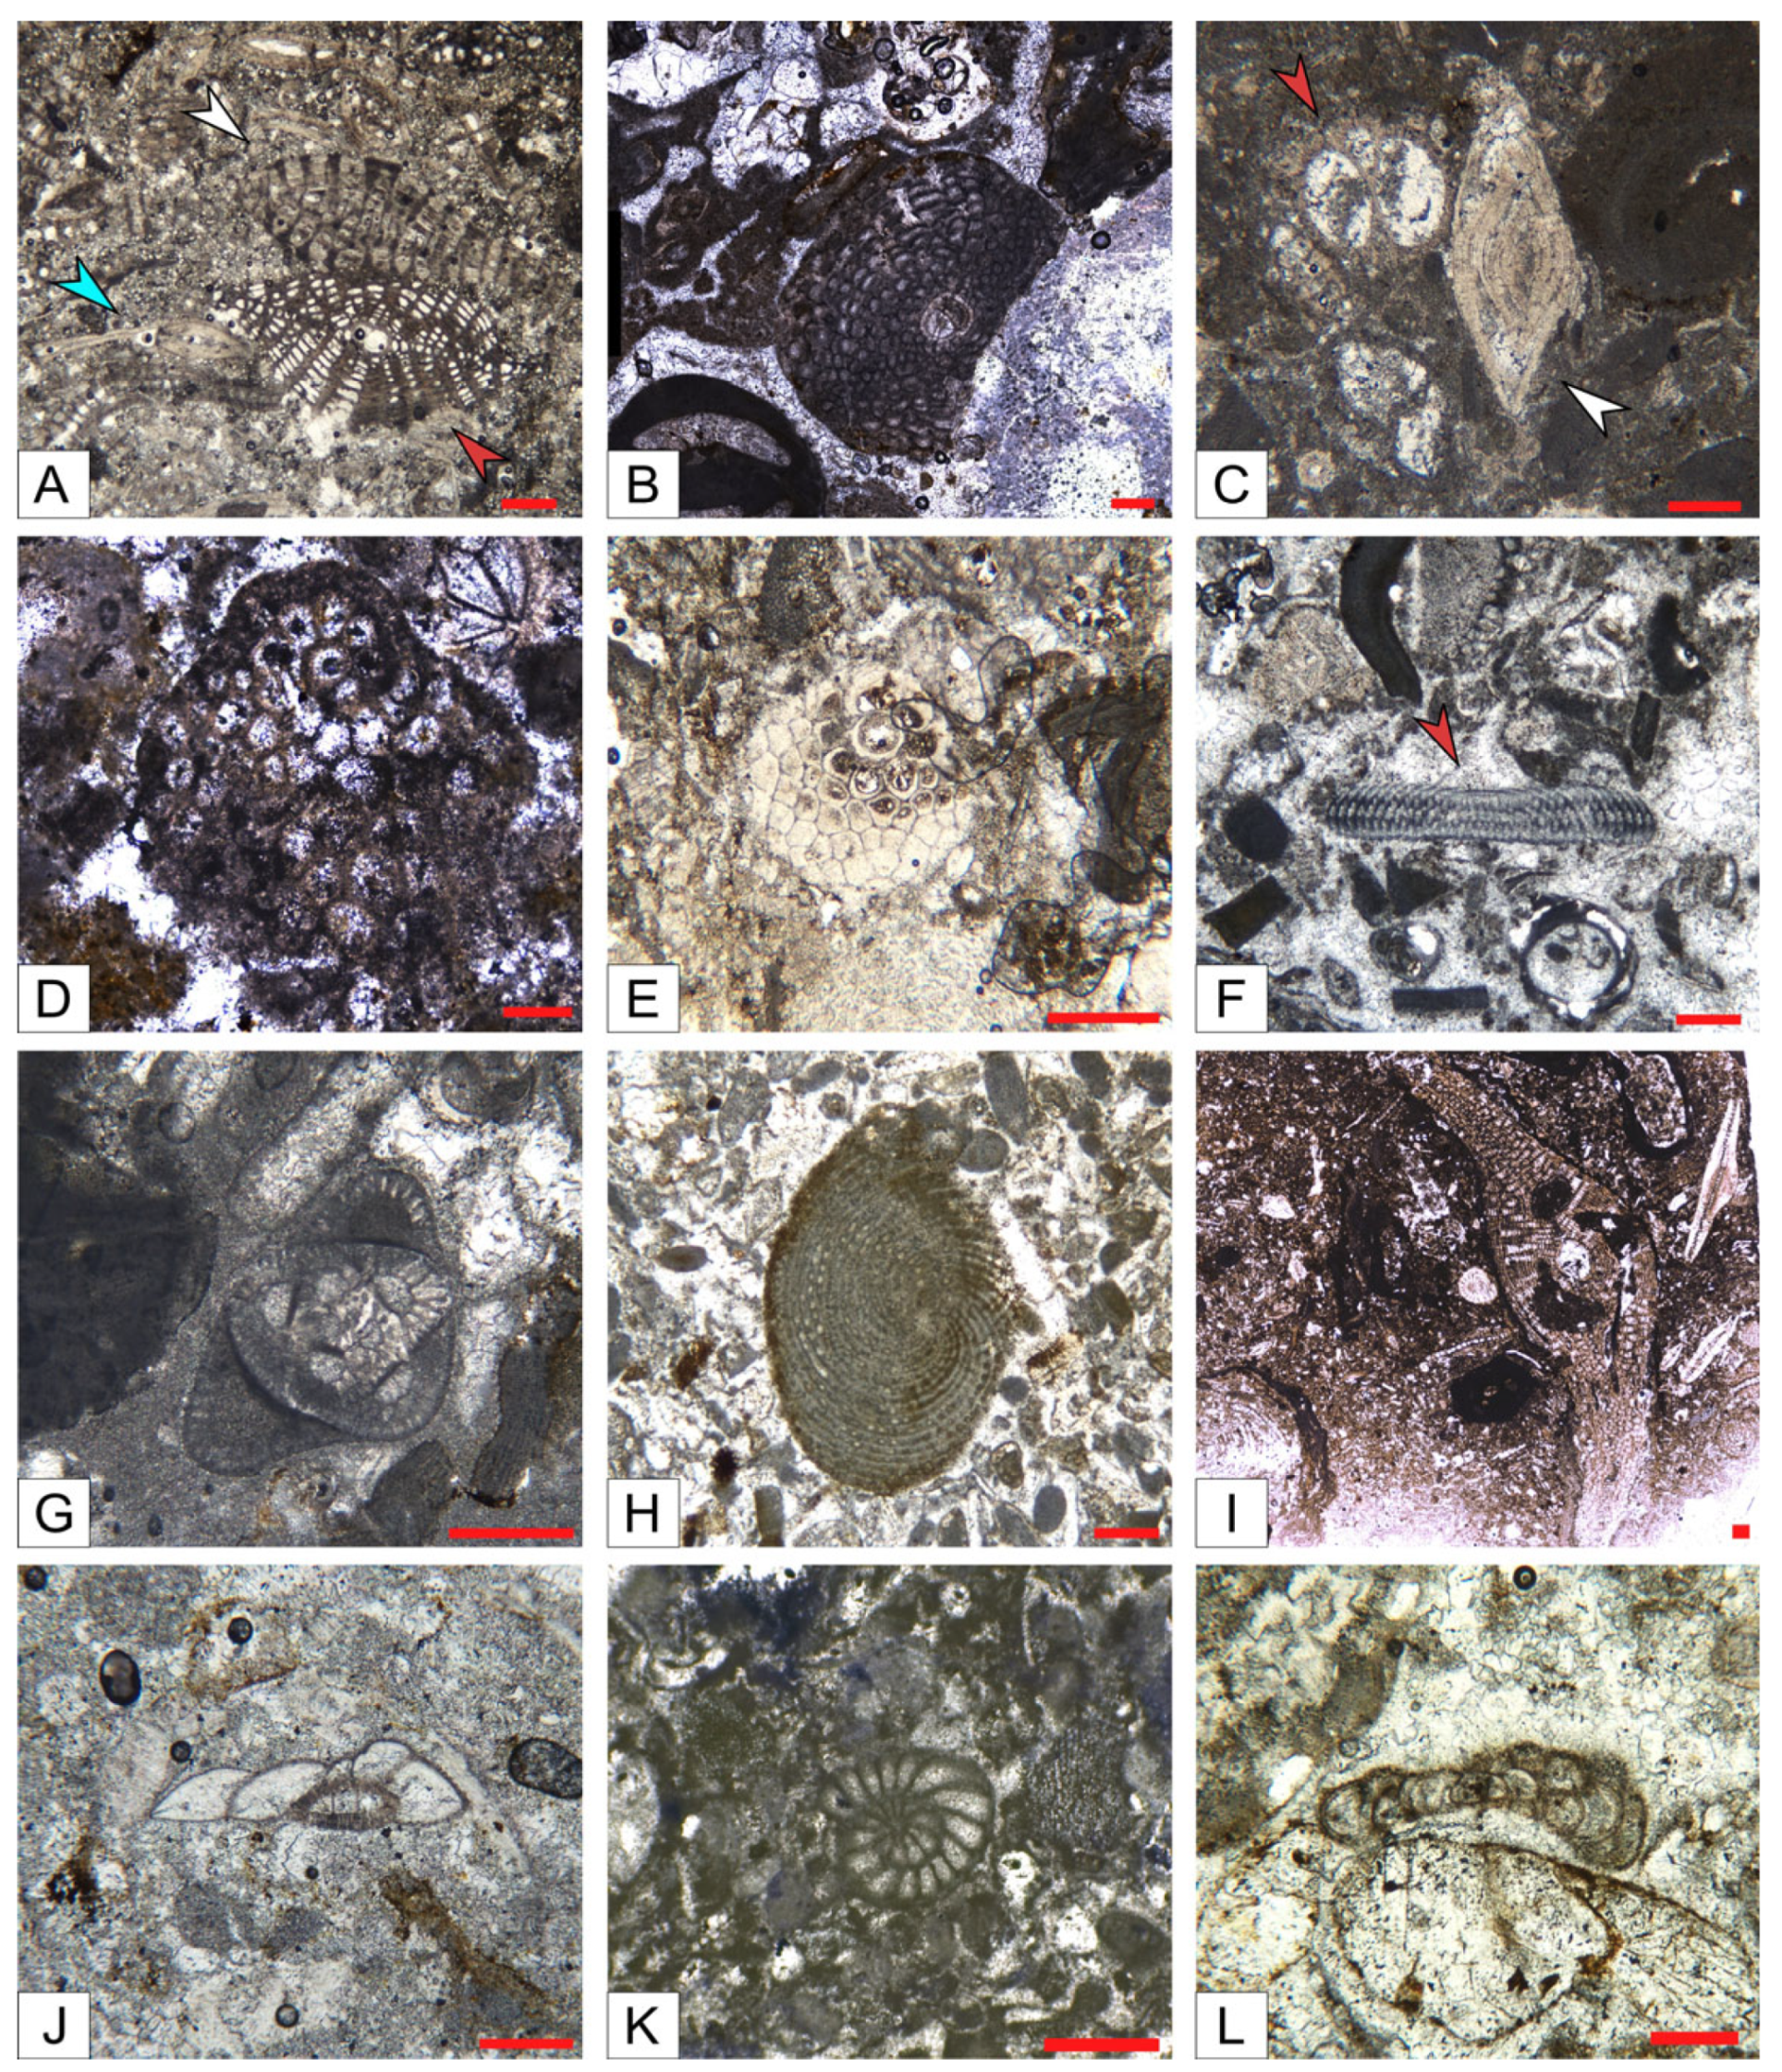
The investigated sections of the Jhill Limestone Unit of the Gaj Formation are characterized by the common occurrence of Miogypsinoides, Spiroclypeus, Miogypsina, Nephrolepidina, Austrotrillina (Figure 6A,B,D,E,G), the presence of Eulepidina (Figure 6I), Archaias (Figure 6H), and Peneroplis (Figure 6K), and the absence of Nummulites and Borelis. Given that the paper’s main goal is to provide a detailed analysis of the biofacies of the Jhill Limestone Unit, and that the well-lithified nature of the rock makes it difficult to prepare dedicated equatorial thin sections of LBF, biostratigraphic analysis has been performed primarily at the genus level. Nonetheless some almost perfect equatorial sections occur in the thin sections prepared for facies analysis, giving some elements to further constrain the LBF assemblage.
The few recognized specimens of Miogypsinoides observed in equatorial sections display a single short spire, suggesting that at least a portion of the recognized abundant population of Miogypsinoides could belong to Miogypsinoides bantamensis and to Miogypsinoides sivasensis [30,31] (Figure 6E). Very few specimens of Miogypsina were observed in the equatorial section and display a single and very long spire (at least 12 chambers), suggesting a comparison with either a primitive population of Miogypsina gunteri or a relatively evolved population of Miogypsina basraensis [30,31] (Figure 6D). The only observed Nephrolepidina equatorial section displays a short and almost straight wall separating the protoconch from the deuteroconch, and a remarkable similarity with Nephrolepidina praemarginata [30] (Figure 6B).
LBF stratigraphy is mainly based on Shallow Benthic Zones [50], which are oppelzones and thus based on the concomitant occurrence of phylogenetically unrelated taxa. Therefore, they are not linked to biohorizons or first/last occurrences of single taxa [51], nor that the boundaries of a zone are sharply defined [52]. Being LBF benthic organisms, their spreading is relatively slow and often hindered by geographical barriers, resulting in biostratigraphic differences among the different regions (e.g., the Mediterranean area and the Indo-Pacific [53,54,55]). Furthermore, LBF are facies-dependent, which means that they may disappear due to environmental changes but remain extant somewhere else. Overall, although they represent the sole stratigraphic markers in shallow marine successions, they are by no means as accurate as planktic taxa unless their bioevents are calibrated using planktic biostratigraphy, e.g., [52], and even in the latter case the calibration is still local. However, by comparing local results with well-studied areas where LBF stratigraphy has been linked to either planktic stratigraphy or absolute dating, it is possible to constrain the investigated shallow-marine facies. Since during the Oligocene, Pakistan was located at the boundary between the Mediterranean and Indo-Pacific bioprovinces, LBF stratigraphy is particularly challenging. That being stated, based on Chauzac and Poignant [56], the common occurrence of Nephrolepidina, Eulepidina, Miogypsina, Miogypsinides, and Spiroclypeus likely places the investigated interval of the Jhill Limestone Unit within the late Chattian (SBZ23). This would be consistent with the existing zonation used in Iran for the Asmari Formation, generally including assemblage characterized by Miogypsinoides and lacking Nummulites and Borelis in the Chattian [32,35]. A Chattian age would be in agreement with the placement of the Waiorian local stage of the relatively close-by Kutch Basin (western India), since the Waiorian stage is characterized by an LBF assemblage including both Spiroclypeus and Miogypsinoides [57]. The late Oligocene age of the Waiorian stage has been recently also supported by the Sr isotopes dating of the Bernoti Member of the Maniyara Fort Formation (Kutch Basin), where a Spiroclypeus and Miogypsinoides-bearing interval has been attributed to the late Chattian [58]. However, several studies indicated that taxa such as Eulepidina, at the border between the Mediterranean and the Indo-Pacific bioprovinces, can occur also during the Miocene (e.g., [53]), and that the range of certain taxa of Miogypsina can change greatly among the different bioprovinces [54], suggesting that a placement within the earliest Miocene cannot be entirely excluded. Indeed, the relatively short spire of the observed specimens of Miogypsinoides would suggest a placement within the Aquitanian, whereas the observed Miogypsina, with their long spire, would indicate either a latest Chattian or an earliest Aquitanian [30,31,59]. On the other hand, the observed Nephrolepidina clearly points toward a late Oligocene age [30]. Consistently, although we cannot entirely exclude an Aquitanian age for the investigated interval, a Chattian (most likely a late Chattian) placement appears to be the most plausible.

4.3. Quantitative Biofacies Analysis

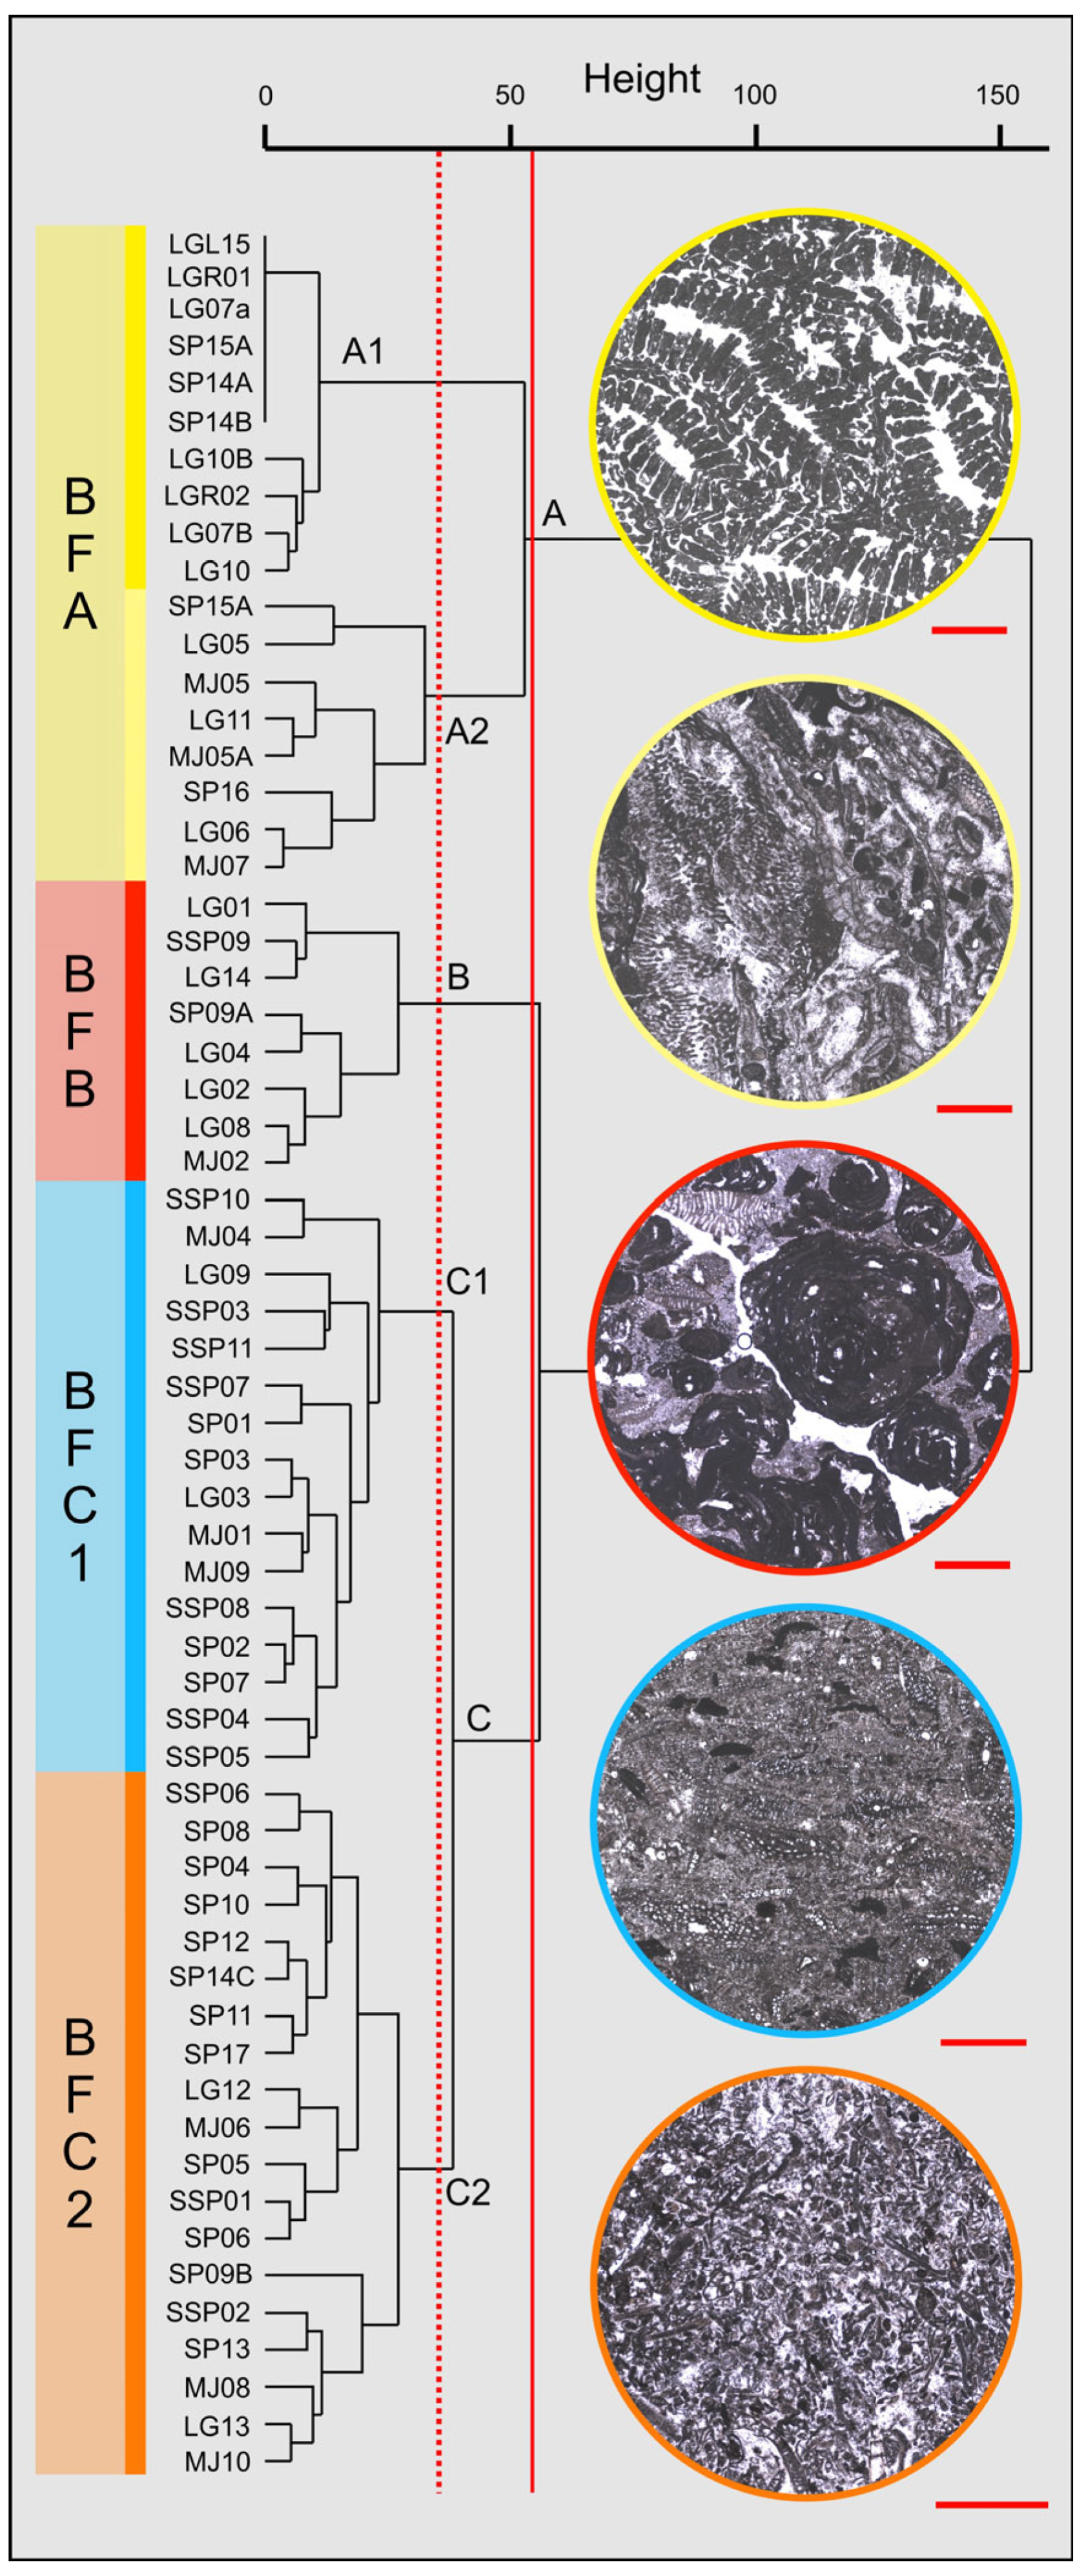
Thanks to the quantitative analysis of the skeletal and foraminiferal assemblages, it was possible to distinguish four main biofacies (Figure 3 and Figure 5) (Table 1 and Table 2), that were further defined through multivariate cluster analysis applied on the point-counting dataset (Figure 7). In particular, Q-mode cluster analysis returned to three main clusters, namely clusters A, B, and C, separated at around 65% of similarity and containing different samples from the analyzed sections. A further subdivision can be made at around 75% of similarity: in this case, cluster A can be divided into two sub-clusters (A1 and A2), cluster B remains the same, and cluster C can be divided into two sub-clusters (C1 and C2).
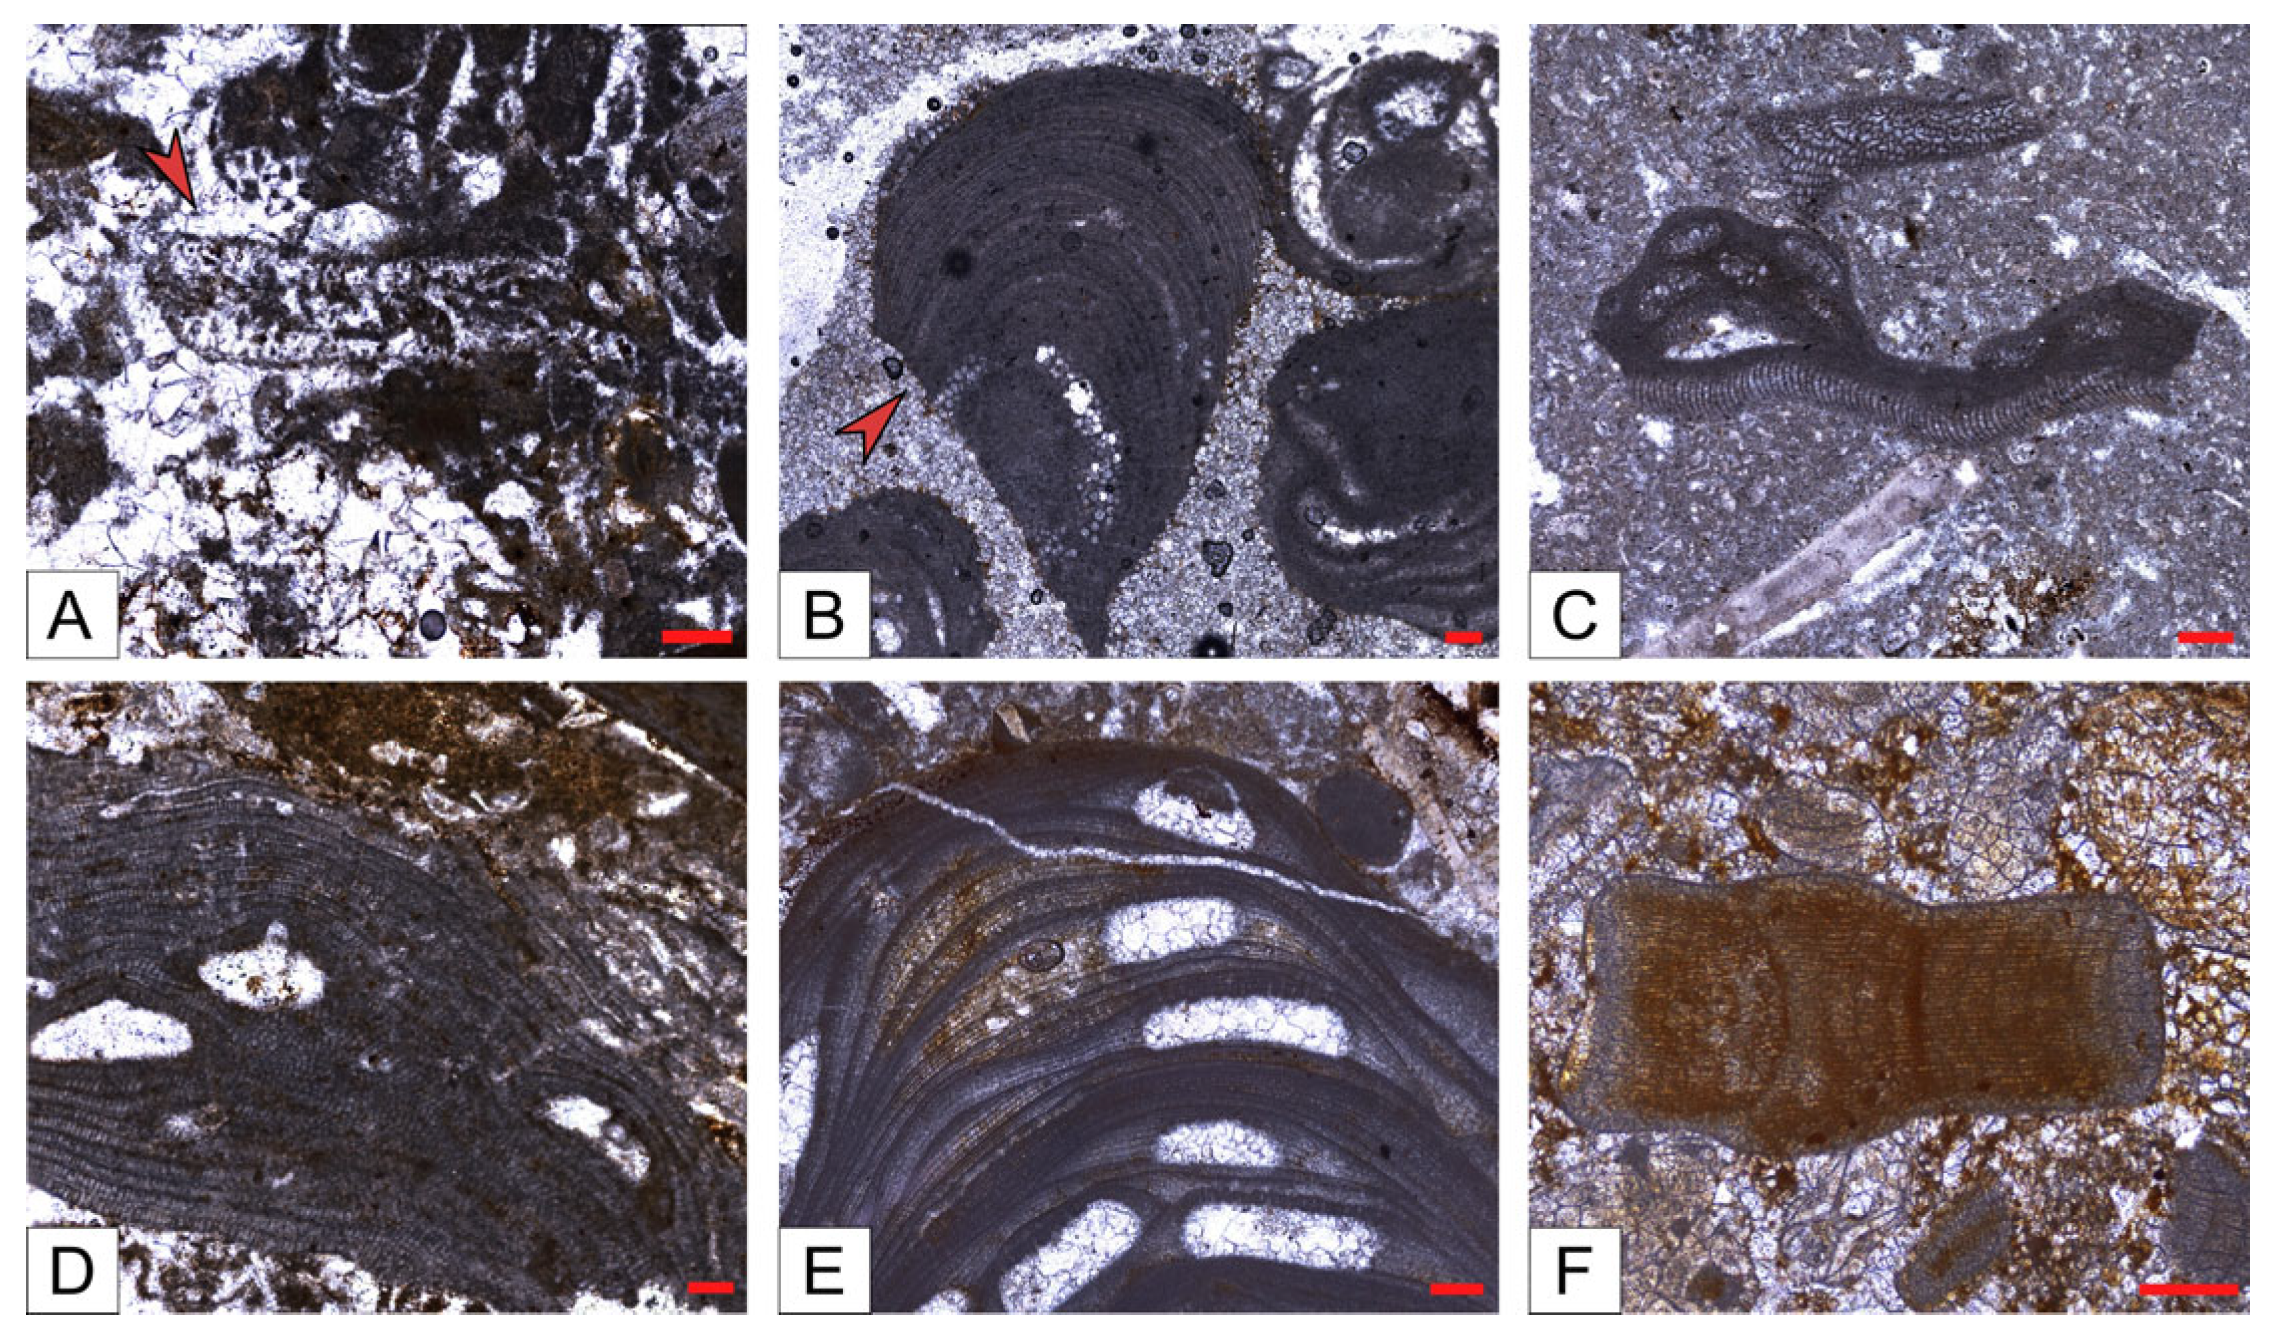
Cluster A includes only samples that contain remarkable quantities of reef corals. Sub-cluster A1 contains samples almost entirely composed of reef coral colonies, whereas sub-cluster A2 includes samples dominated by reef corals associated with other skeletal components. Cluster B is characterized by samples where RCA (mainly represented by rhodoliths) (Figure 8) are largely common. Cluster C contains samples that host a large abundance of LBF, with sub-clusters C1 and C2 displaying notable differences in the abundances of distinct foraminiferal groups and skeletal components.
These clusters are consistent with the observations made in the field, and with the collected quantitative datasets. For these reasons, they were used to define three different biofacies, that characterize the investigated interval of the Gaj Formation: BFA, BFB, and BFC. For the paleoenvironmental reconstruction, BFC, similarly to cluster C, is further subdivided into two sub-biofacies (BFC1 and BFC2). BFA, similarly to cluster A, could be also subdivided into two sub-biofacies (BFA1 and BFA2), but for the purpose of the paleoenvironmental analysis these have been considered together, as they both relate to the same paleoenvironment. All the results of the point-counting (focused on the skeletal assemblages) and the area-counting (focused on the foraminiferal assemblages) are displayed in Table 1 and in Supplementary Materials S1 and S2.
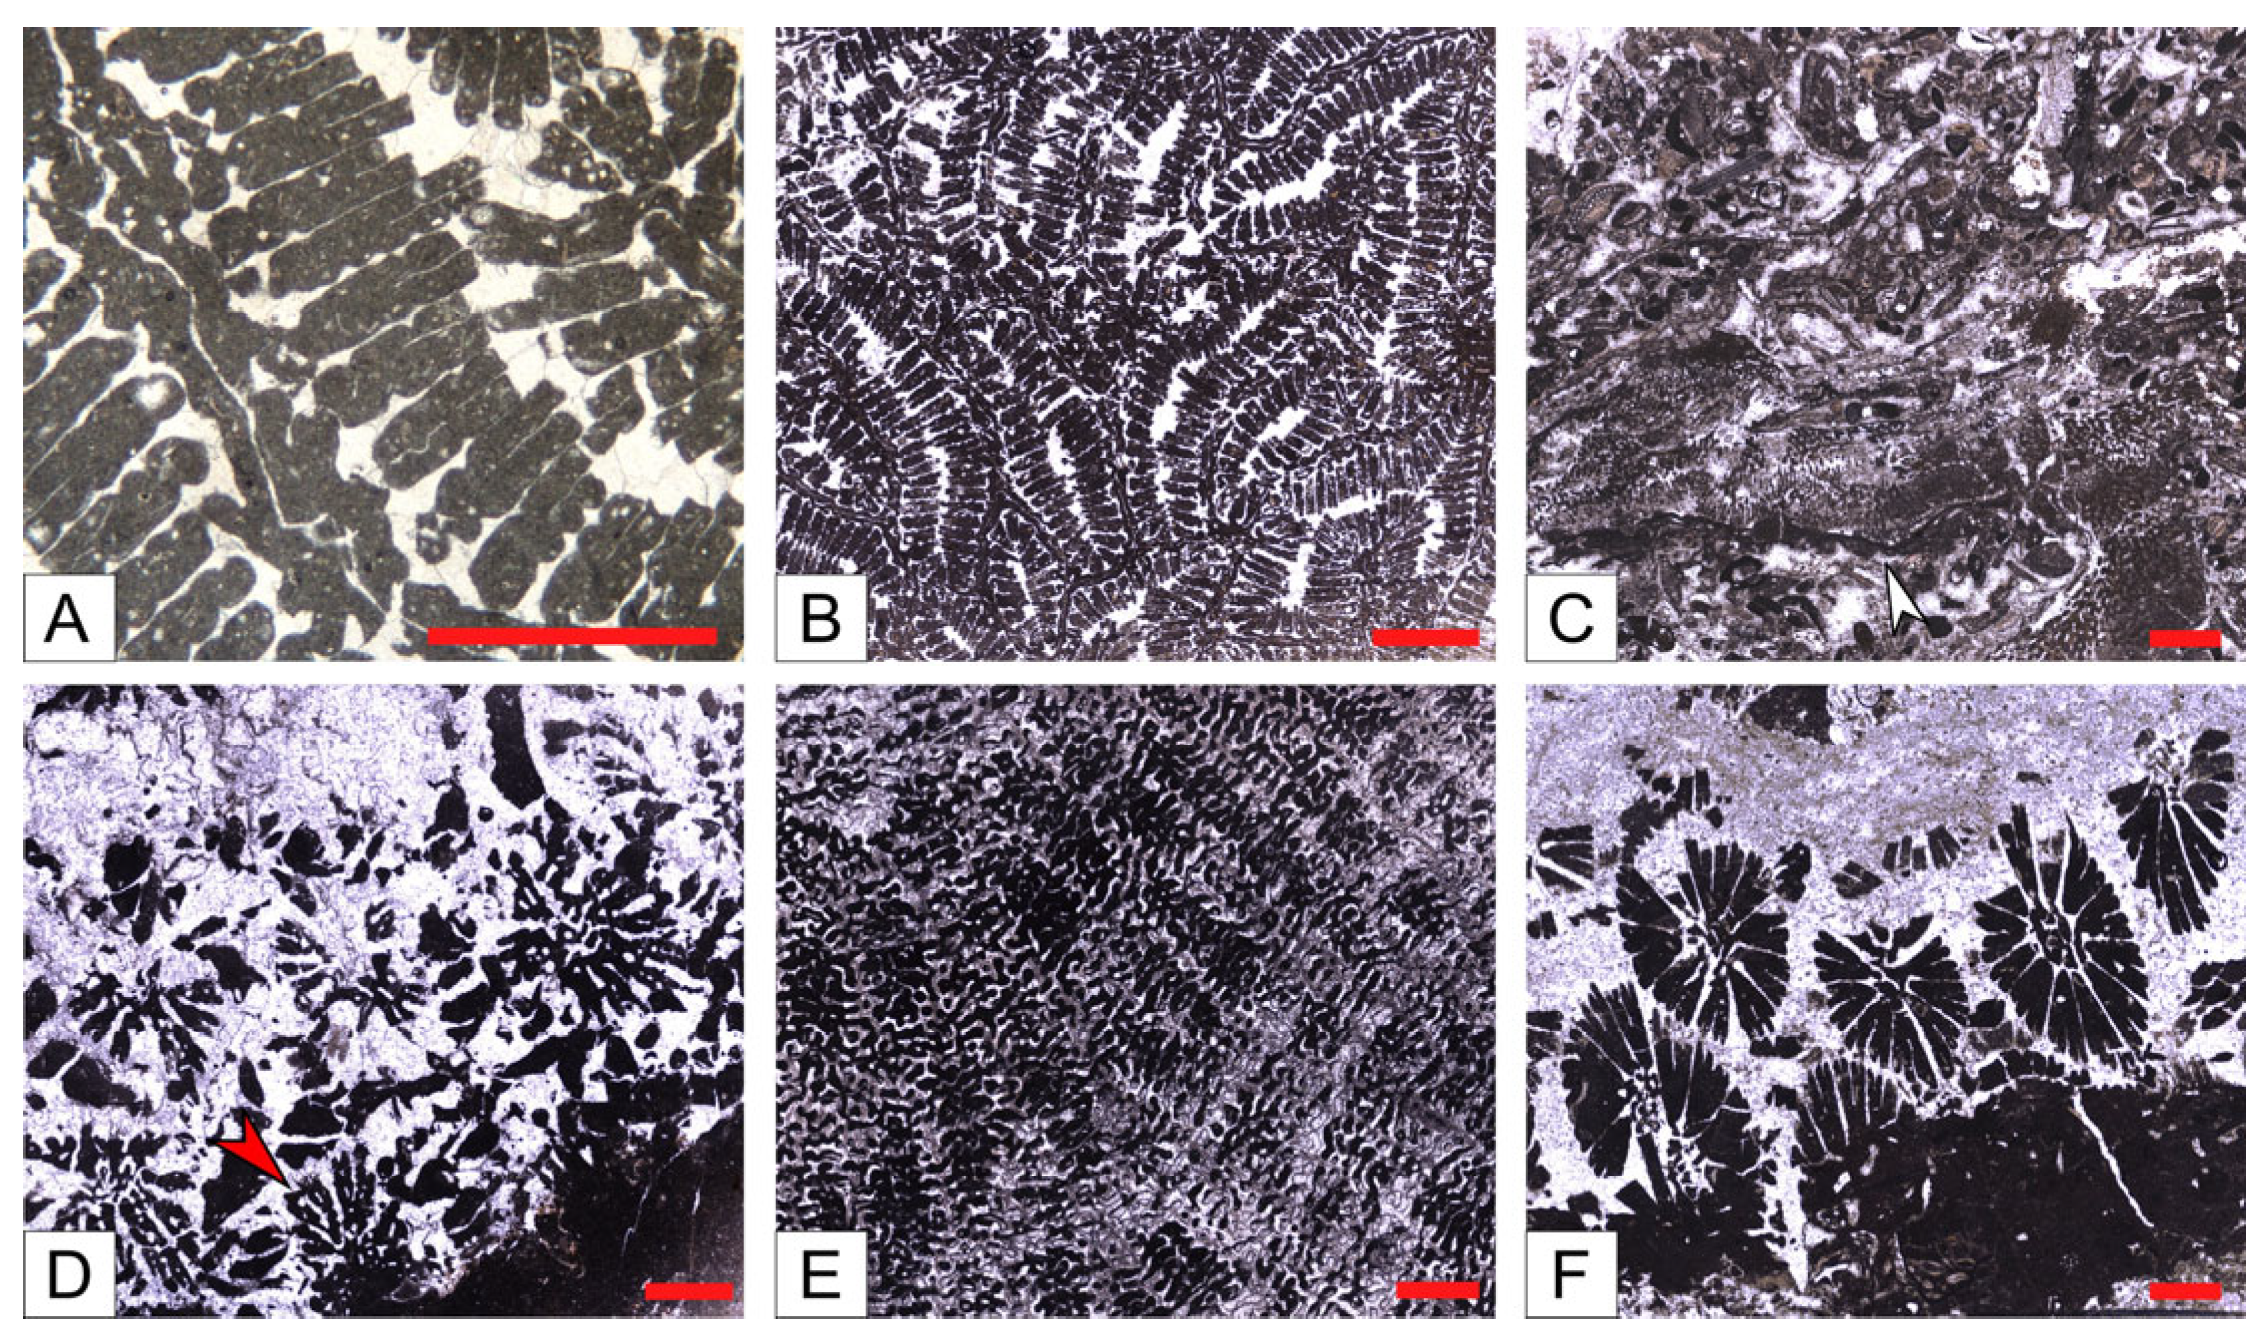
  • Reef coral biofacies (BFA): this biofacies is recorded in different intervals within the SP, LG, and MJ sections, for a total thickness of about 22 m (Figure 3 and Figure 5). In SP, it is recorded from 39 to 41 m abs (SP14A-B), and from 43 to 46 m abs (SP15A-B; SP16), for a total thickness of 5 m. In LG, it is recorded from 8 to 12 m abs (LG05; LG06; LG07A-B), from 18 to 23 m abs (LG10A-B; LG11; LGR01; LGR02), and from 29 to 32 m abs (top of the sequence; LGL15), for a total thickness of 12 m. In MJ, it is recorded from 13 to 15 abs (MJ05A-B), and from 19 to 22 m abs (MJ07), for a total thickness of 5 m. This biofacies is primarily defined by the presence of coral colonies in growth position, which form small-scale, patchy bioconstructions, while those transported are clearly subordinate. Overall, it is dominated by colonial corals (82% average abundance) (Table 1) and, based on their abundance together with the percentage of colonies in growth position, two types of coral fabrics, corresponding to two sub-biofacies, can be recognized (Figure 7) (Table 1): coral boundstones (BFA1) and coral floatstones (BFA2). The coral boundstones are constituted almost entirely (99% average abundance) of colonies in growth position. Among the latter, the genera Hydnophora, Porites, Agathiphyllia, Montastrea, and Favites have been recognized (Figure 9). The only attempt at identification at the species level was carried out on sample LGR01, from the LG section, that has been assigned to Hydnophora cf. provincialis on the basis of clear morphometric diagnostic characters [45] (Figure 9A,B). The floatstones display a skeletal assemblage dominated by fragments of branching corals (62% on average; among the recognized genera there are Acropora and Stylophora), together with less abundant coral colonies in growth position, and also includes other carbonate producers, particularly encrusting RCA (15%), miogypsinids (6%), large miliolids (3.5%), and encrusting benthic foraminifera and victoriellids (4%). Regarding the area-counting analysis of the foraminiferal assemblage (Table 2), BFA is characterized predominantly by hyaline SBF (62%) (particularly of the morphotype B e.g., Cibicides, Lobatula, see [60,61,62]), porcelaneous SBF (12.5%) (e.g., Quinqueloculina, Triloculina, Spiroloculina), miogypsinids (11%) (Miogypsina, Miogypsinoides), and porcelaneous LBF (8.5%) (Sorites, Archaias, and other peneroplids). With regards to the calcareous algal assemblage, crustose RCA largely dominate and are mainly represented by Corallinales and Hapalidiales (in similar amounts). Sporolithales and articulated RCA are present. Rare fragments of Halimeda also occur (Figure 8A).
  • Coralline algal biofacies (BFB): this biofacies is logged at distinct intervals within SP, SSP, LG, and MJ, for a total thickness of about 20 m (Figure 3 and Figure 5). Within SP, it is recorded from 27 to 30 m abs (SP09A-B), for a total thickness of 3 m. In SSP, it is recorded from 25 to 29 m abs (SSP09), for a thickness of 4 m. In LG, it is recorded from 0 to 2 m abs (LG01; LG02), from 6 to 8 m abs (LG04), from 13 to 15 m abs (LG08), and from 28 to 30 m abs (LG14), for a total thickness of 8 m. In MJ, it is recorded from 5 to 10 m abs (MJ02). This biofacies is characterized by rudstones and floatstones and its skeletal assemblage is largely dominated by encrusting RCA (77%), followed by lepidocyclinids (6%), flat and thin hyaline LBF (6%), miogypsinids (4%), and encrusting benthic foraminifera (2%) (Table 1). Based on area-counting, the foraminiferal assemblage is dominated by hyaline SBF (31%) and miogypsinids (26.5%) (Miogypsina, Miogypsinoides), Spiroclypeus and other flat-shaped nummulitids, e.g., Operculina and Heterostegina (14.5%; Spiroclypeus alone represent 12% of the assemblage), amphisteginids (Figure 6C) and other hyaline LBF (13.5%), and lepidocyclinids (6%) (Nephrolepidina, Eulepidina) (Table 2). BFB displays also the highest abundance of rounded acervulinids (although they only represent nearly 1% of the foraminiferal assemblage). Crustose RCA dominate the algal assemblage and are mainly represented by Hapalidiales (Figure 8E). However, Corallinales and Sporolithales are also present, albeit in smaller quantities.
  • Large benthic foraminiferal and coralline algal biofacies (BFC): this biofacies is primarily characterized by the dominance of LBF and can be further subdivided based on the type of LBF.
    a.
    Miogypsinid, thin and flat large benthic foraminiferal and coralline algal sub-biofacies (BFC1): this biofacies is recorded in distinct intervals within SP, SSP, LG, and MJ, for a total thickness of about 44 m (Figure 3 and Figure 5). In SP, it is logged from 0 to 11 m abs (SP01; SP02; SP03). In SSP, it is logged from 9 to 17 m abs (SSP03; SSP04; SSP05), from 19 to 26 m abs (SSP07; SSP08), and from 30 to 33 m abs (SSP09; SSP10), for a total thickness of 18 m. In LG, it is logged from 3 to 5 m abs (LG03), and from 15 to 17 m abs (LG09), for a total thickness of 4 m. In MJ, it is recorded from 0 to 4 m abs (MJ01), from 9 to 13 m abs (MJ04), and from 27 to 30 m abs (MJ09), for a total thickness of 11 m. This biofacies is mainly composed of grainstones (particularly at the base of the SP section) and rudstones. The skeletal assemblage (Table 1) is dominated by encrusting RCA (29.8%), miogypsinids (25.40%), low T/D (test’s thickness/diameter ratio) hyaline LBF (14.3%), mollusks (7.45%), lepidocyclinids (5.40%), bryozoans (4%), and echinoderms (3.2%). An increase in the abundance of articulated RCA (2.40%) is reported. The foraminiferal association is dominated by miogypsinids (45.29%) (Miogypsina, Miogypsinoides), followed by hyaline SBF (18.2%), Spiroclypeus and other flat-shaped nummulitids, e.g., Heterostegina, Operculina (11.3%), small miliolids (7.36%) (Quinqueloculina, Triloculina), and lepidocyclinids (4.67%) (Nephrolepidina) (Table 2). The calcareous algal assemblage includes crustose and articulated RCA associated with rare green calcareous algae. Among crustose RCA, Hapalidiales (Figure 8C) and Corallinales (Figure 8D) occur in similar amounts.
    b.
    Miogypsinid and coralline algal sub-biofacies (BFC2): this biofacies is logged in different intervals along SP, SSP, LG, and MJ and is overall the most represented in the study area, for a total thickness of about 57 m (Figure 3 and Figure 5). In SP, it is recorded from 11 to 27 m abs (from SP04 to SP08), from 30 to 39 m abs (from SP10 to SP13), from 41 to 43 m abs (SP14C), and from 46 to 48 m abs (SP17), for a total thickness of 29 m. In SSP, it is logged from 0 to 9 m abs (SSP01; SSP02), and from 17 to 19 m abs (SSP06), for a thickness of 11 m. In LG, it is recorded from 23 to 28 m abs (LG12; LG13), for a thickness of 5 m. In MJ, it is logged from 15 to 19 m abs (MJ06), from 22 to 27 m abs (MJ08), and from 30 to 33 m abs (MJ10), for a total thickness of 12 m. This biofacies consists primarily of packstones and rudstones. Its skeletal assemblage is characterized by crustose RCA (24%), miogypsinids (20%), echinoderms (11%), bryozoans (9%), hyaline SBF (7%), and lepidocyclinids (4%) (Table 1). Among all the recognized biofacies, BFC2 hosts the highest abundance of articulated RCA (4%), of porcelaneous foraminifera (6%), and of green calcareous algae (although they only represent less than 1% of the assemblage of the biofacies) (Table 1). The foraminiferal assemblage comprises primarily hyaline SBF (38%) (mostly Cibicides, Lobatula, Rosalina, Neoconorbina, keeled Elphidium, and infaunal taxa, such as bolivinids) (Figure 6J), miogypsinids (31%) (Miogypsinoides, Miogypsina), small miliolids (10.5%) (Quinqueloculina, Spiroloculina, Triloculina), agglutinated SBF (8.5%) (Textularia, Bigenerina), and porcelaneous LBF (4.1%) (Sorites, Archaias, other peneroplids, Austrotrillina) (Figure 6F,G,H,K) (Table 2). Similarly to BFC1, the algal assemblage of BFC2 includes crustose RCA (Hapalidiales, Corallinales, and, in this case, Sporolithales) (Figure 8B), articulated RCA (Figure 8F) and rare green calcareous algae. Locally, crustose RCA are represented by thin crusts with a hooked morphology.
Using the foraminiferal area-counting dataset, it is possible also to calculate different indexes that display paleobathymetric significance (Table 2), namely LEPI/MIO, FN/MIO, (LEPI + FN)/MIO, LH/LP, HP. Based on the existing literature (see Section 5.4), all these indexes should increase with increasing water depth. The lepidocyclinids/miogypsinids ratio (LEPI/MIO) shows the highest value in BFB (0.23), followed by BFC1 (0.10), BFC2 (0.03), and BFA (0.02). The same trend is followed by the ratio between flat-shaped nummulitids and miogypsinids (FN/MIO), which ranges from 0.55 in BFB to 0.04 in BFA. The ratio between the sum of lepidocyclinids and flat-shaped nummulitids and miogypsinids (LEPI+FN)/MIO, which consists of the sum of the two previous ratios, ranges from 0.78 in BFB to 0.06 in BFA. The same trend is displayed also by the ratio between hyaline and porcelaneous LBF (LM/LH), which shows the lowest value for BFA, and by the ratio between hyaline and porcelaneous foraminifera (H/P) that displays the highest value in BFB (51.5), and the lowest value in BFA (3.58) (Table 2).
From the area-counting datasets, we calculated the average number of foraminifera in 1 cm2 (of thin section) per biofacies (Table 3) (Supplementary Materials S1). BFC2 displays the highest value, with an average of 18 forams/cm2, followed by BFC1 (17 forams/cm2), BFA (6 forams/cm2), and BFB (6 forams/cm2). It should be noted that hyaline SBF display the highest numbers respectively in BFC2 and BFA, and miogypsinids in BFC1 and BFC2; large miliolids are expected to be found in BFA and BFC2, whereas lepidocyclinids and Operculina and Heterostegina in BFC1 and Spiroclypeus in BFC1 and BFB.

5. Discussion

5.1. Biostratigraphic and Paleoclimatic Considerations
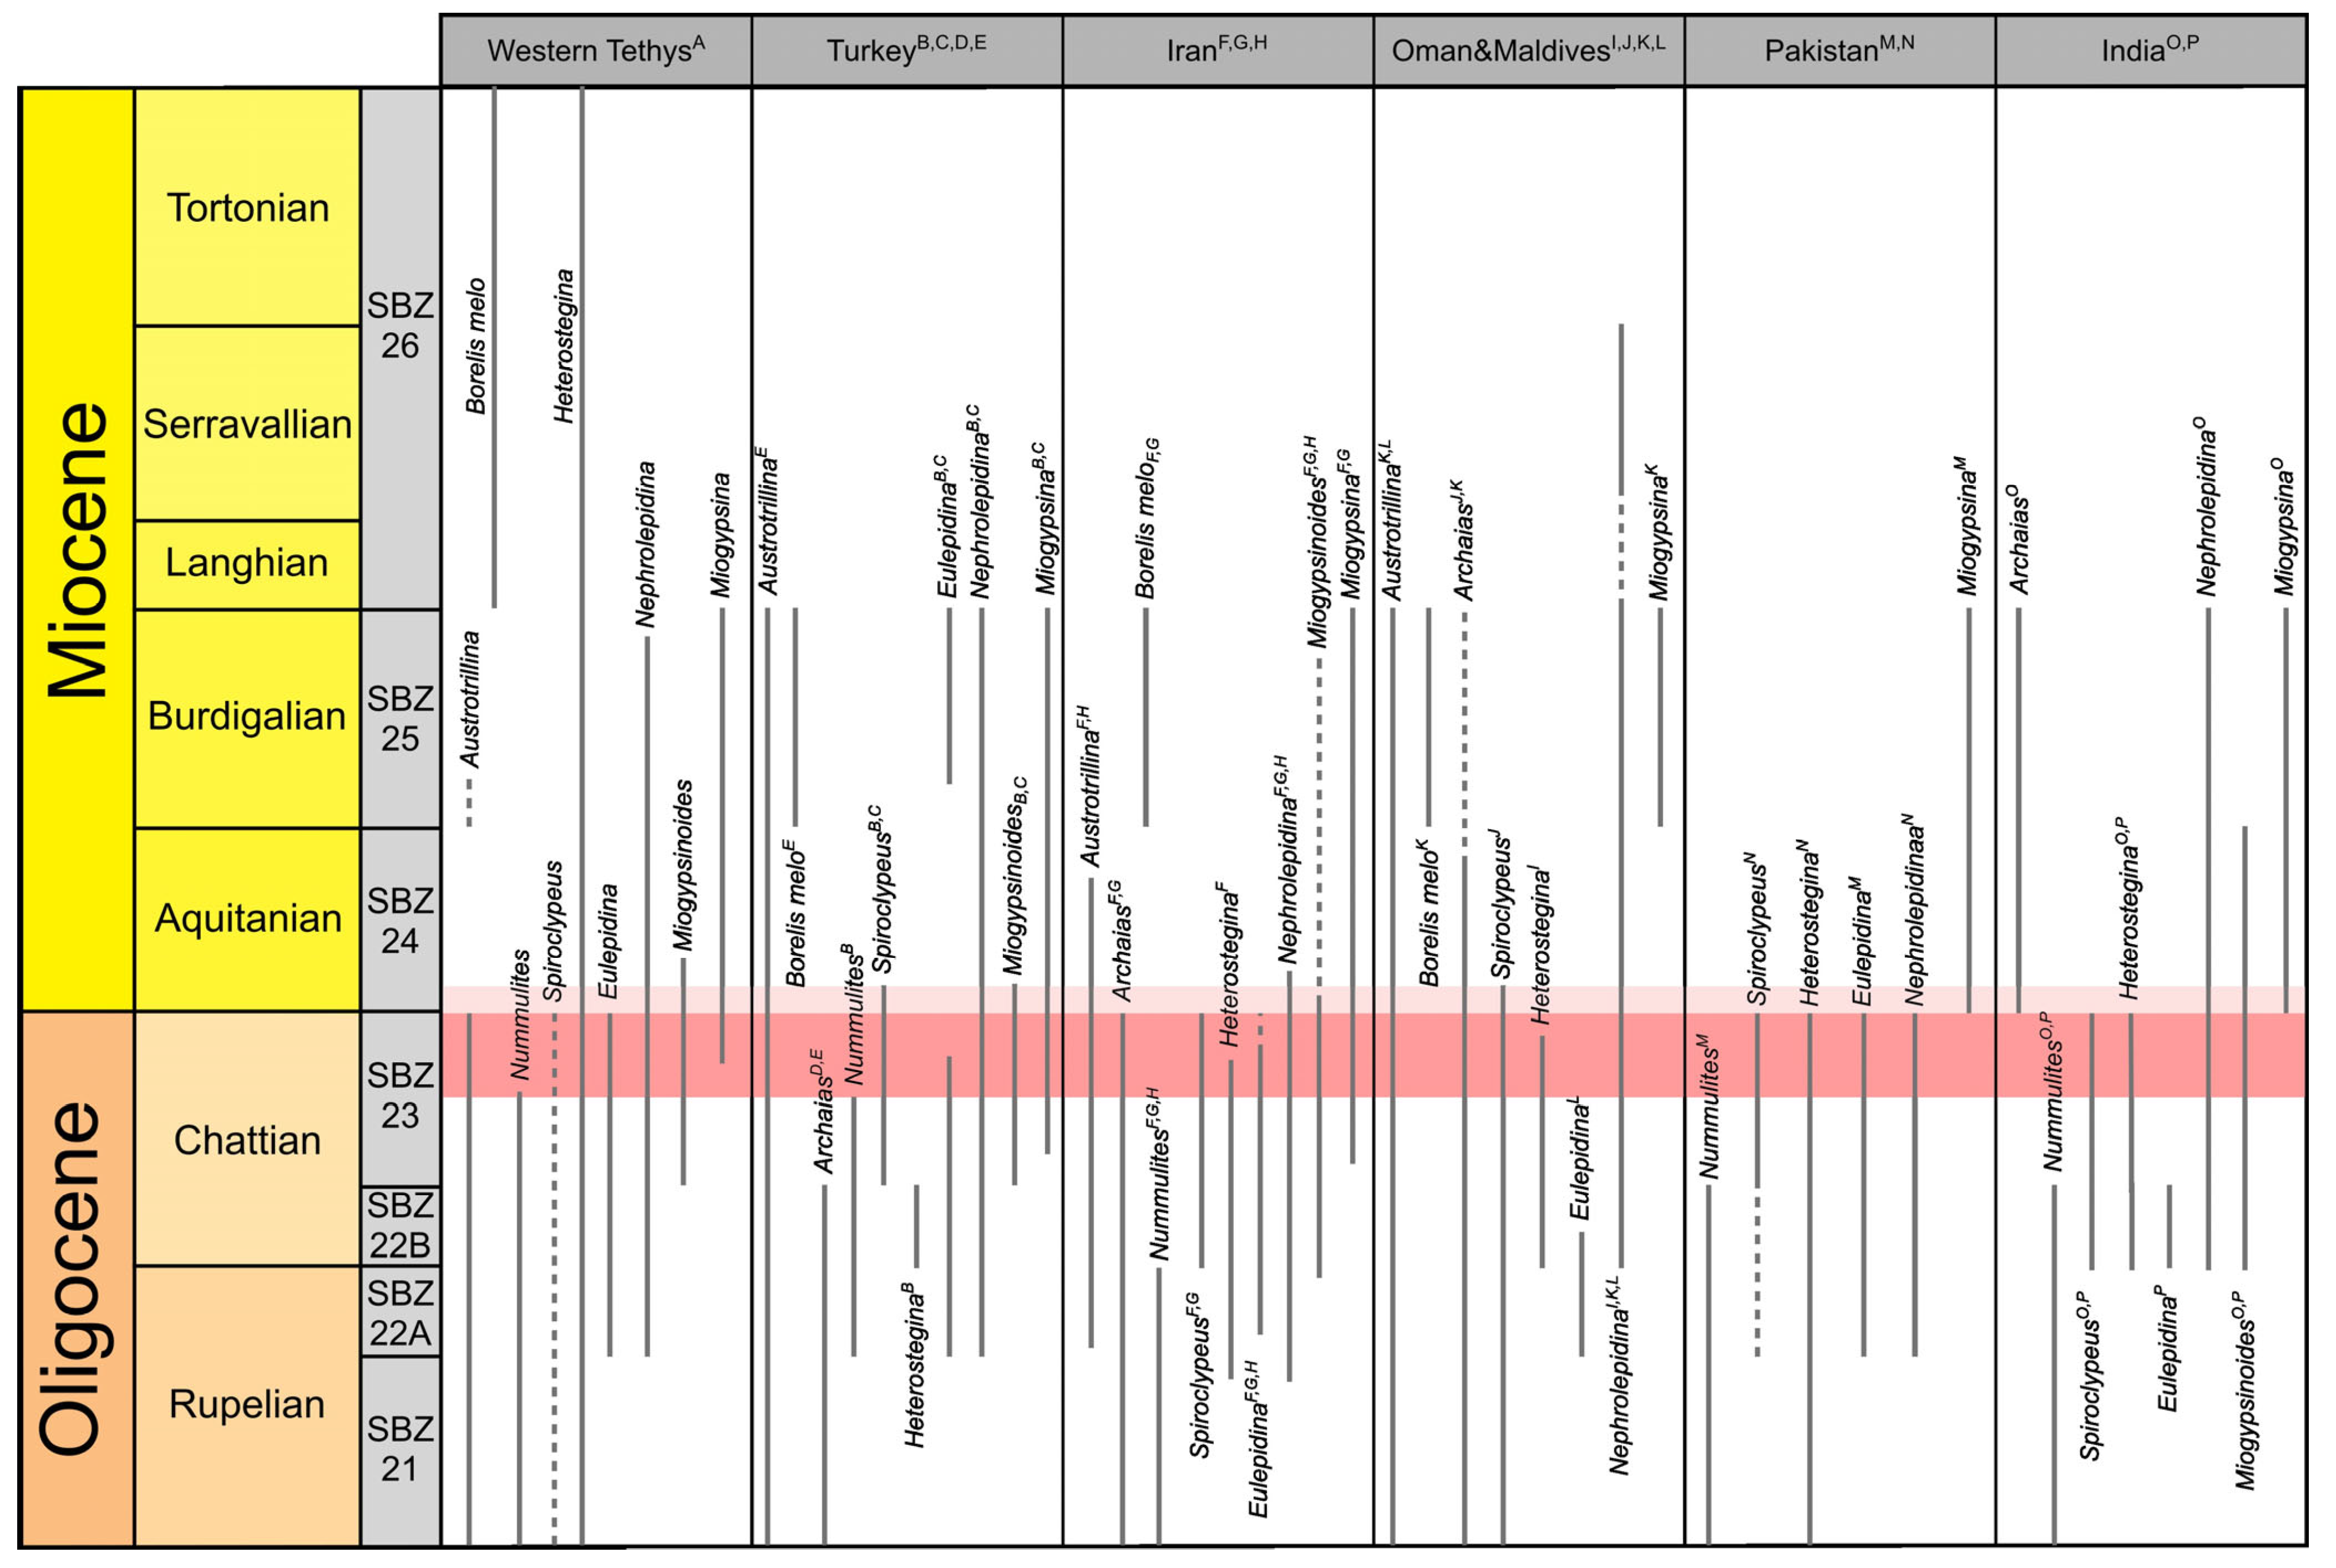
Although the studied sections belong to the Jhill Limestone Unit of the Gaj Formation, that has been previously attributed to the Early Miocene (Burdigalian, e.g., [15,16]), our new biostratigraphic data suggest that the Jhill Limestone, at least in the study area, should most likely date back to the late Oligocene (Chattian; see Section 4.2 Biostratigraphy). This age assignment appears to be more reliable than that of the Early Miocene, as highlighted by the synthetic biostratigraphic scheme based on the ranges of the most common larger foraminifera (Figure 10).
Considering our biostratigraphic dating to the late Chattian stage as more probable, we can also suppose that the studied reef coral carbonates deposited within or close to the Late Oligocene Warming Event (LOWE), which took place between ~26.5 to 24 Ma [63,64].
The LOWE has been identified in the fossil record of both terrestrial (e.g., [65]) and marine ecosystems (e.g., [49,66,67,68,69,70]). During this period, luxuriant coral reefs developed worldwide, featuring moderate-to-high-diverse scleractinian corals [71,72,73]. The decline in atmospheric pCO2, which could have reduced ocean acidity, has been proposed as a factor contributing to this abrupt increase in reef-building capacity [49,74]. Additionally, the rise in the Mg/Ca ratio may have favored hypercalcification of aragonite over calcite organisms, enhancing coral growth [75].
At the regional scale of the study area, it is not possible to assess the impact of this event on the observed reef coral fauna, and even the consequences in case the age was Early Miocene. Unlike the Mediterranean and Caribbean regions, where large datasets provide the possibility of identifying diversity patterns during the late Oligocene and/or at the Oligocene–Miocene transition e.g., [72], the Middle East area, and Asia in general, still lack a comprehensive synthesis of data that can be used to compare the single case-studies.
Figure 10. Synthetic biostratigraphic scheme based on the range of distribution of the most common large benthic foraminifera, in different paleogeographic provinces. Full lines represent a well-established presence; dashed lines indicate rare occurrences; the red band indicates the most likely stratigraphic placement of the investigated interval; the faint red band indicates a less likely, but still possible, placement. A: Cahuzac and Poignant, 1997 [56]; B: Özcan et al., 2010 [31]; C: Özcan et al., 2009 [59]; D: Sirel et al., 2013 [76]; E: Gedik, 2014 [77]; F: Van Buchem et al., 2010 [32]; G: Dill et al., 2020 [35]; H: Amirshahkarami, 2014 [78]; I: Coletti et al., 2018 [55]; J: Mattern et al., 2020 [79]; K: Afzal and Racey, 2024 [80]; L: Reuter et al., 2008 [81]; M: Kureshy, 1982 [82]; N: Kureshy, 1984 [83]; O: Kumar and Saraswati, 1997 [57]; P: Less et al., 2018 [58].
Geosciences 15 00129 g010

5.2. Facies Interpretation

Water depth can be reconstructed in detail using LBF distribution (e.g., [84,85]) and foraminiferal-based paleobathymetric parameters [41,42,86]. Furthermore, a clear, water depth-related zonation of LBF has been recognized by various authors in the modern western Pacific [87,88,89,90,91,92,93,94,95]: (I) between 0 and 20 m of water depth, LBF assemblages are usually dominated by calcarinids together with amphisteginids and porcelaneous LBF; furthermore, between 0 and 10 m, SBF are generally overwhelmingly dominant and porcelaneous SBF are particularly common; (II) between 20 and 40 m of water depth, calcarinids and amphisteginids dominate, often associated with robust nummulitids and porcelaneous LBF; (III) between 40 and 60 m of water depth, nummulitids (including both robust and thinner taxa) dominate together with amphisteginids and calcarinids, and porcelaneous LBF can still occur; (IV) between 60 and 80 m of water depth, nummulitid (commonly represented by taxa with a thin test and chambers divided into chamberlets) dominate together with amphisteginids; (V) between 80 and 100 m of water depth, nummulitids (mainly represented by taxa with a thin test and chambers divided into chamberlets) dominate together with amphisteginids; (VI) below 100 m, nummulitids characterized by a thin test and chambers subdivided into chamberlets dominate the assemblage and are often associated with abundant amphisteginids. By using an actualistic approach and taking into account the analogies and differences between modern and fossil LBF assemblages, this model can be used to further refine the water depth of the biofacies identified in the studied succession. Considering these elements, the paleoenvironmental reconstruction of the identified biofacies is herein provided.
BFA is characterized by the dominance of reef coral colonies, commonly in growth position and less frequently transported. The preservation of most of the colonies is poor, but in some cases good enough to identify different genera. Particularly, we recognized massive, dome-shaped colonies of Hydnophora (Hydnophora cf. provincialis) (Figure 9A,B), Agathiphyllia (Figure 9D), Favites, Montastrea (Figure 9F) and Porites (Figure 9E), followed by fragments of branching colonies of Acropora (Figure 9C), and Stylophora. Hydnophora provincialis has been reported in the late Oligocene of Provence (France), and in the Early Miocene of Cyprus, although the Cenozoic stratigraphic distribution of the genus Hydnophora started in the late Paleocene of Pakistan, with only one species recorded, Hydnophora gregoryi [45]. During the Oligocene this genus underwent a consistent radiation, spanning from the Caribbean to the eastern Tethys, and in particular within the Mediterranean region, one of the most active centers of coral high diversity during this period [49]. All the other identified coral genera (Agathiphyllia, Favites, Montastrea, Porites, Acropora, and Stylophora) are very common genera of Cenozoic reefs and, except Agathiphyllia, are still extant. They have been reported from very different upper Oligocene and Lower Miocene depositional settings (oligotrophic carbonate platforms, mixed carbonate–siliciclastic systems, lagoonal patch-reefs protected environments, etc.) from both western [49,70,96,97,98] and eastern Tethys, including the most explored and closest region to Pakistan which is Iran [46,47,81,99,100,101,102].
Floatstones and rudstones composed of fragments of branching corals such as Acropora and Stylophora have been documented in upper Oligocene deposits associated with fan-delta systems [70]. It is also important to emphasize that Acropora, a genus currently associated with shallow, well-lit, and turbulent waters in modern oceans [103], exhibited different ecological preferences in the geological past. These corals in fact were frequently found also in deeper, low-energy environments, possibly with turbid waters [104,105], and showed considerable resilience to significant changes in ocean chemistry [106]. Further analysis on the coral fauna of the Khirtar Fold Belt Basin must be carried out to obtain more reliable taxonomical and, possibly, stratigraphical indications.
Coral growth pattern and distribution in the studied Jhill Limestone deposits do not indicate a shelf margin barrier reef or a fringing reef, usually characterized by a wave-resistant, laterally continuous coral framework that rises significantly above the seafloor. On the contrary, BFA appears to be represented by small and scattered coral patch reefs, that colonized a sheltered shallow setting, likely a lagoon. A lagoonal environment is suggested by the presence of porcelaneous LBF (Archaias, Sorites, Peneroplis) and SBF (Quinqueloculina, Triloculina, Spiroloculina), that usually occur in well-illuminated, oligotrophic-to-mesotrophic environments [44], as well as by the overall dominance of SBF [84]. These observations suggest that the patch reefs developed above the mean fair-weather wave base, likely between 10 and 20 m of water depth. This biofacies shows similarities with the Chattian Coral Limestone Member of the Maniyara Fort Formation, exposed in the Kutch Rift Basin of western India, which is located close to the study area [58]. The Coral Limestone Member hosts a coral-rich carbonate facies characterized by reef corals (including the same genera identified in our study, e.g., Hydnophora, Stylophora, Favites, poritids) displaying various growth forms and developing biostromes and, most likely, small patch reefs [107].
BFB is largely dominated by encrusting RCA and frequently hosts thin and flat hyaline LBF, such as lepidocyclinids and Spiroclypeus. Thin and flat hyaline LBF are typically reported to thrive in the deep part of the photic zone (e.g., [85]). Thin and flat hyaline LBF, by increasing the surface of their test, are able to collect more light than their robust counterparts, a likely adaptation to environments where hydrodynamic energy is low and light is a scarce resource (e.g., [108,109,110]). While the presence of these flat and thin taxa would suggest a relatively deep setting, the lack of planktic foraminifera and the abundance of miogypsinids, which share relevant similarities with present-day calcarinids [34], suggest that the deposition of this facies occurred below wave base, in mesophotic conditions, most likely between 40 and 60 m. This water-depth estimate is also consistent with the calcareous algal assemblage that, unlike the other biofacies, is dominated by crustose Hapalidiales, only displays minor quantities of crustose Corallinales, and lacks relevant amounts of articulated RCA [111]. The considered paleobathymetric indexes also suggest that this facies represents the deepest depositional setting within the investigated interval of the Jhill Limestone of the Gaj Formation. Similar facies, characterized by sandy coralline algal rudstones and floatstones, particularly rich in Spiroclypeus, have been described in the upper Oligocene of western India [107].
BFC is dominated by hyaline LBF and RCA and has been further subdivided based on the type of LBF. The skeletal assemblage of BFC1 is characterized by the abundance of encrusting RCA, miogypsinids, flat and thin hyaline LBF, and lepidocyclinids, with common occurrences of mollusks, bryozoans, and echinoderms, with the most abundant group of LBF being represented by miogypsinids. The latter, similar to present-day calcarinids, are commonly reported to live preferentially in shallow-water marine environments (e.g., [34]). Lepidocyclinids, on the other hand, were more widespread in middle-to-outer ramp settings, usually below 40 m water depth (e.g., [32,85,112,113]). Flat and thin hyaline LBF can occur in a wide variety of settings but usually dominate in the lower part of the photic zone. Given the relative dominance of miogypsinids, together with the rare presence of GCA, geniculate RCA, porcelaneous LBF, and SBF, BFC1 most likely deposited between 30 and 50 m of water depth. BFC2, differently from BFC1, is characterized by a higher abundance of porcelaneous foraminifera, articulated RCA, and GCA, pointing toward shallower settings. Furthermore, BFC2 displays several IPSIs (Indirect Palaeo-Seagrass Indicators; [114]). These include encrusting RCA and encrusting benthic foraminifera showing hooked morphology; the presence of curve-shaped planorbulinids (Planorbulina sp., Planorbulinella sp.) (Figure 6L) and other morphotype A* foraminifera (sensu [61]); the presence of several hyaline SBF genera typically associated with seagrass meadows, like Cibicididae (Lobatula sp., Cibicides sp.), keeled Elphidium, and rosalinids [62]; the presence of soritids and peneroplids, which are typically epiphytic taxa [44,60]. The presence of other sessile taxa such as victoriellids is also considered another possible proxy for paleo-seagrass-related environment [110], together with some sedimentological observations, such as the poor selection and the packstone/rudstone texture of the deposits. Therefore, this biofacies is likely slightly shallower than BFC1 and probably comprised between 20 and 40 m of water depth.

5.3. Depositional Model

The analyzed sections exhibit mainly rudstones and floatstones dominated by coralline algae and LBF, intercalated with boundstones dominated by colonial corals, suggesting a deposition into shallow-water conditions. The presence of abundant autotrophs (RCA and subordinately green calcareous algae) together with organisms that rely on symbiosis (symbiont-bearing LBF and CC) indicates that these successions developed within the photic zone where available light was the main source of energy [1]. However, all the biofacies display a sizeable amount of heterotroph carbonate producers, ranging from around 1% up to 20% (Table 1). This indicates that while light was the dominant form of energy, a considerable amount of nutrients was also present. This is consistent with the relevant detrital input which characterizes the Kirthar Fold Belt Basin during the late Paleogene and the Neogene. Indeed, both the Gaj Formation and the underlying Nari Formation include a relevant amount of terrigenous clastic material [16,115,116]. Clastic supply was likely more relevant toward the north, close to the shoreline of the basin [18]. The rivers in the north were probably supplying the shelf with sufficient nutrients to foster a robust heterozoan production even in a light-dominated setting. However, during the investigated time interval the supply of clastic material from the rivers probably decreased sufficiently to allow for the deposition of the predominantly bioclastic Jhill Limestone.
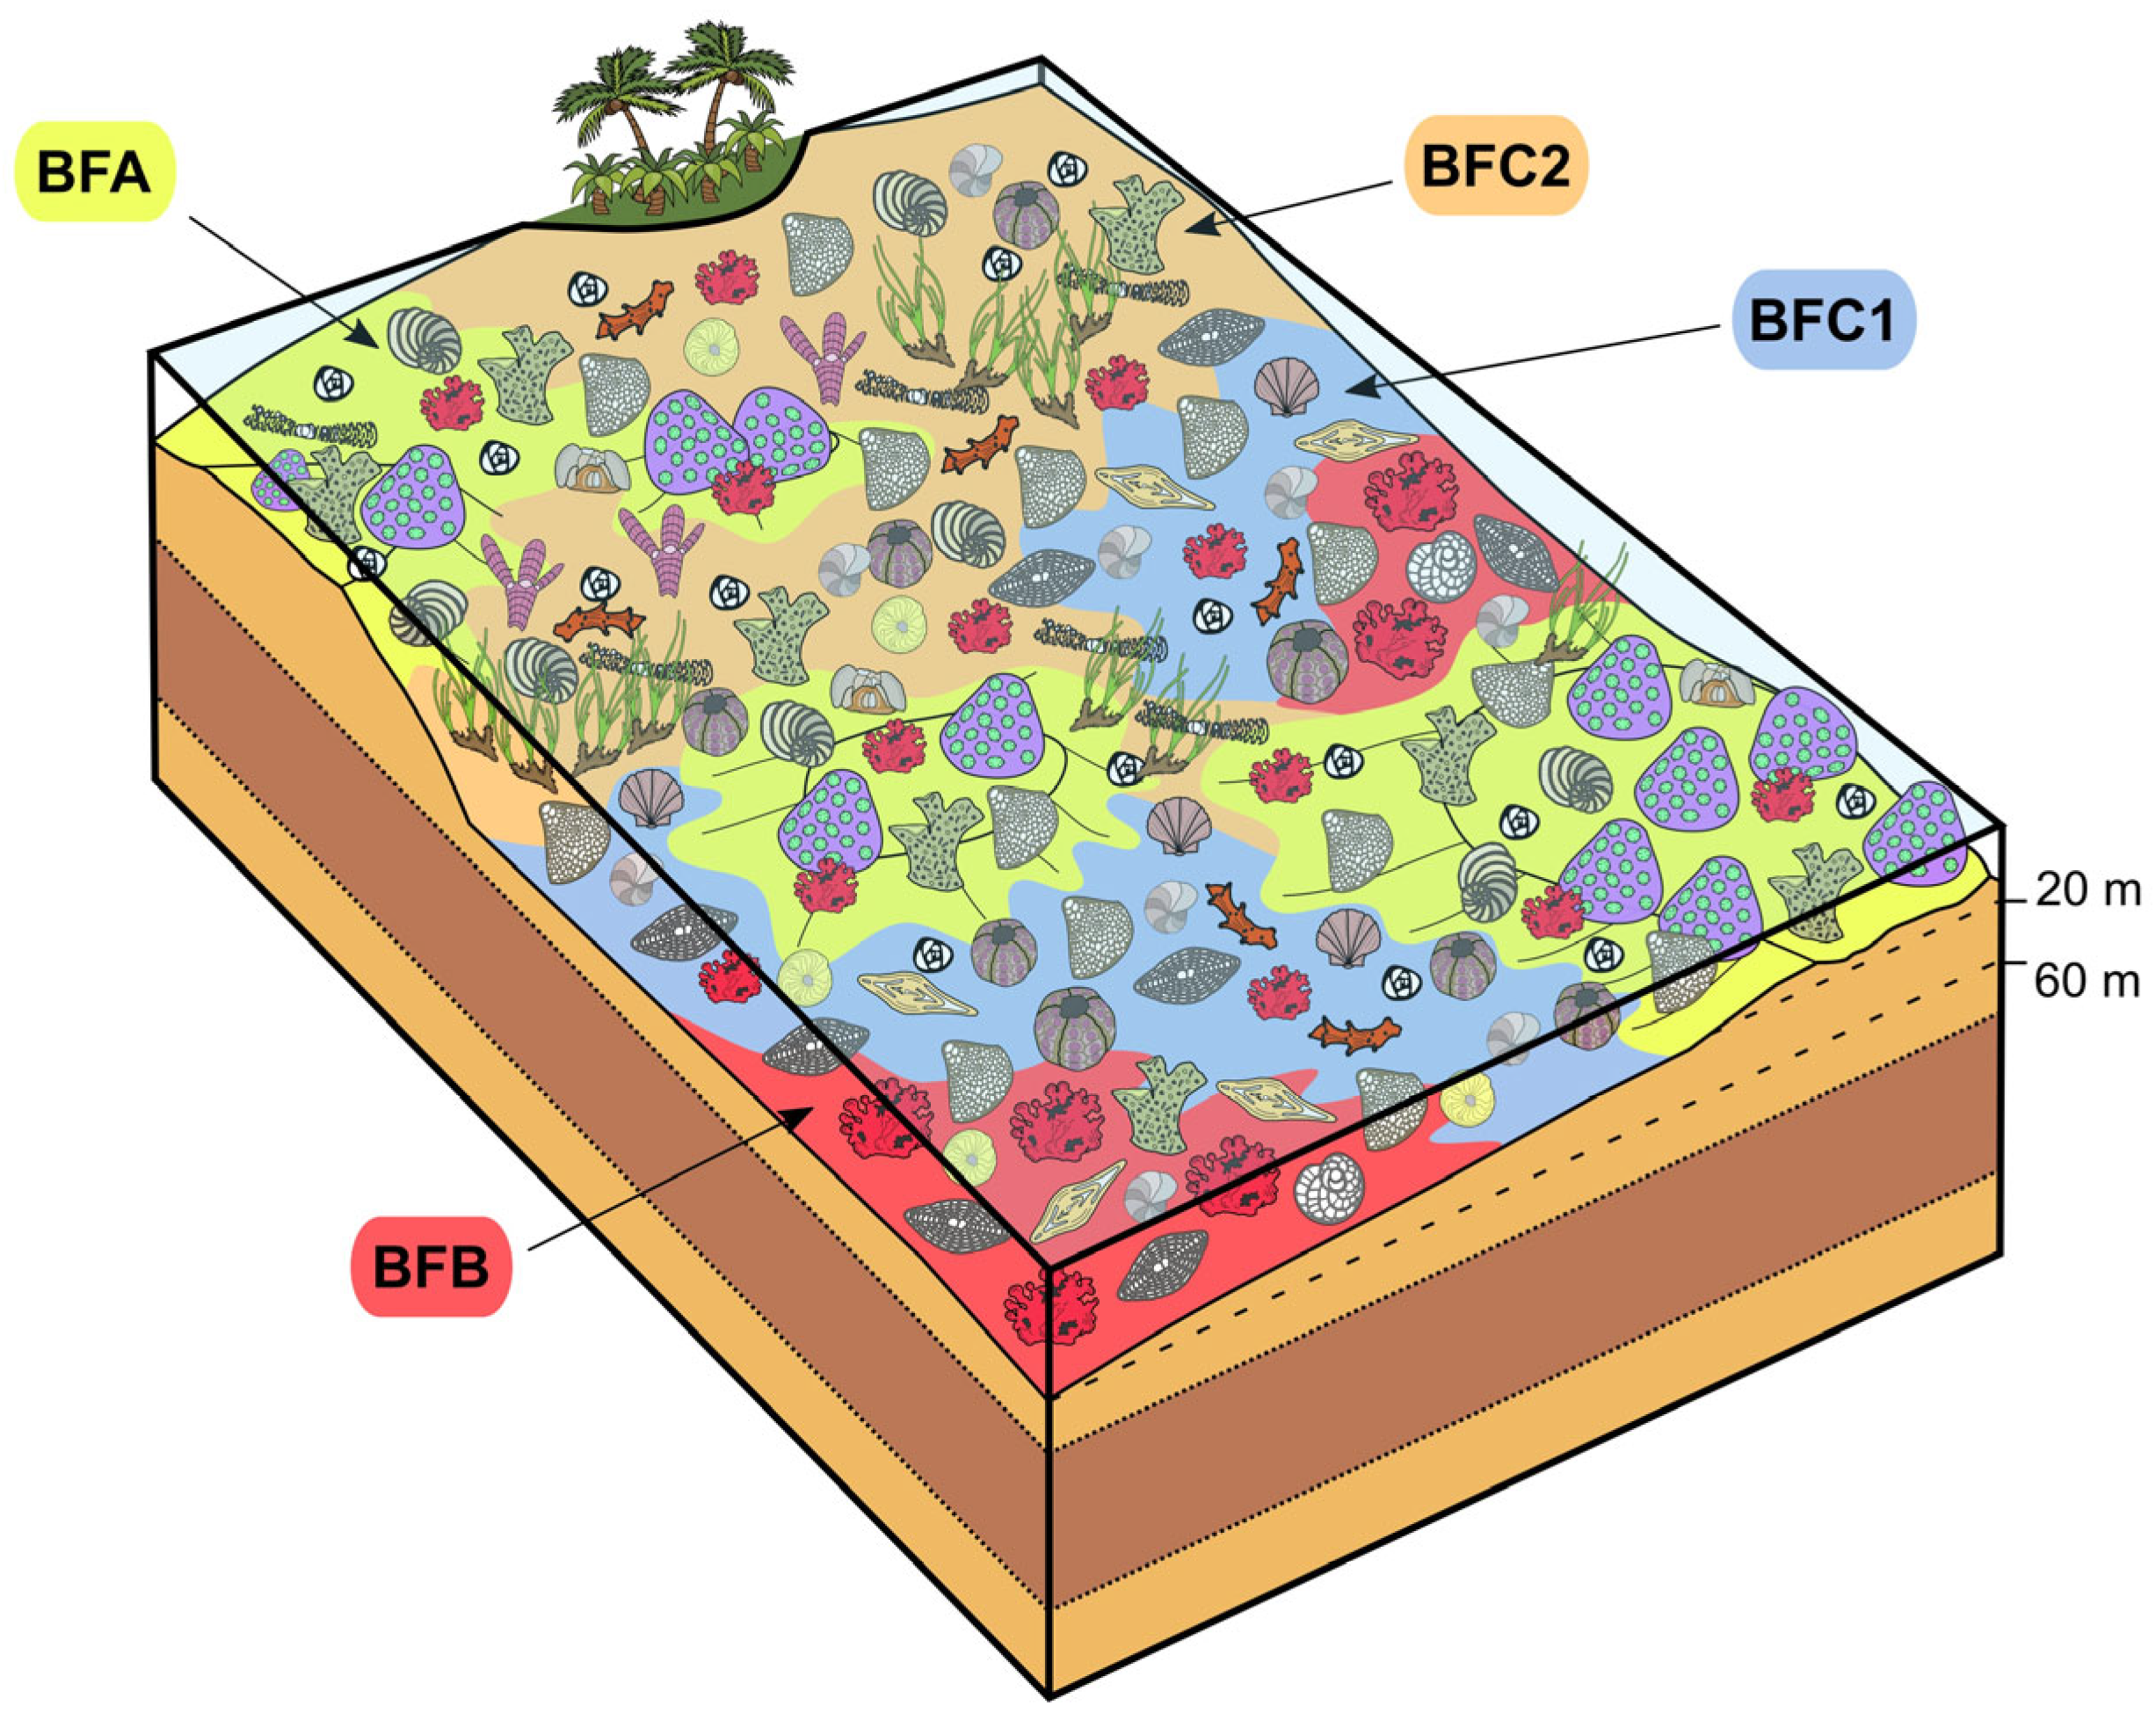
Based on the biofacies interpretations, the depositional model of the succession is related to a relatively shallow water setting, comprised between 0 and 60 m (Figure 11). Taking into account the distribution of the various facies throughout the investigated sections and their geographic distribution, no clear paleobathymetric trend can be recognized, either in time (i.e., along the sections) or in space (i.e., between the sections). We thus suggest that, during the late Oligocene, the study area consisted of a relatively flat seafloor without a major slope and punctuated by small patch reefs (BFA) and seagrass meadows (BFC2). The slightly deeper areas bordering the shallower shoals colonized by reef-corals and seagrass were probably characterized by BFB, whereas BFC1 was probably located in an intermediate position between the seagrass shoals represented by BFC2 and the relatively deeper settings of BFB (Figure 11). This environmental setting is similar to the one proposed for the reef-bearing Lower Miocene limestones of the Terra Member located in Cape Greco in Cyprus [39]. However, unlike the Terra Member at Cape Greco, the Jhill Limestone lacks large-scale buildups. This, combined with the lateral facies variability, suggests unstable paleoenvironmental conditions, most probably controlled by changes in clastic supply from the rivers in the north of the basin, that prevented long-lasting coral growth and the development of large structures.
Although these patch reefs were probably not the dominant feature of the Kirthar Fold Belt Basin during the Oligocene, their presence is nonetheless very relevant. Indeed, within the whole Middle East, it is possible to observe an Oligocene peak in the abundance of reef-coral dominated facies [13]. This suggests that the Jhill Limestone corals were probably part of broad community that, at the scale of the bioprovince, was thriving. The presence of corals in this interval in southern Pakistan, along with their similarities to the nearby Maniyara Fort Formation of Kutch in western India, supports that, in addition to the Caribbean and Mediterranean provinces, the late Oligocene was an overall favorable period for reef corals also in the eastern Tethys. Moreover, zooxanthellate reef corals are reported as one of the most abundant macrofossils in the Oligocene-Early Miocene Qom Formation deposits (Iran), and the studied Jhill Limestone intervals are largely similar to several sections of the Qom Formation, such as (a) the late Rupelian–Chattian deposits of the Qom Formation in the localities of Bozdan, Tavakolabad, and Gonarestan described by Mohammadi and Ghaedi [102], where a similar reef coral assemblage, characterized by massive colonies of Hydnophora, Favites, Porites, and subordinated branching colonies of Acropora, among others, has been interpreted as deposited in euphotic-to-slightly-mesophotic, oligotrophic-to-slightly-mesotrophic conditions; (b) the Qom Formation deposits exposed near Dalijan, that are characterized by the presence of reef coral assemblages associated with large benthic foraminifera and coralline red algae deposited in middle-ramp to inner-ramp settings [117]; (c) the Oligocene-Early Miocene deposits of the Qom Formation in the area of Dizlu (central Iran), described by Yazdi et al. [100], who, based on the massive, dome-shaped poritids and faviids, suggested a deposition in the upper photic zone. Further studies in the Kirthar Fold Belt Basin will be necessary to assess the presence and the abundance of reef corals in the remainder of the Cenozoic succession and thus better constrain if and how the effects of the LOWE are connected to this late Oligocene bloom of reef corals. However, the presence of similar deposits also in Pakistan further testifies to the importance of the late Oligocene evolution of reef-corals.

5.4. Effectiveness of Foraminiferal-Based Paleobathymetric Parameters

The calculated experimental paleobathymetric parameters (Table 2) display clear differences between the identified biofacies. The LEPI/MIO, FN/MIO, and the combination of the two previous ratios (LEPI+FN)/MIO, calculate the ratio between lepidocyclinids and flat nummulitids (Operculina, Heterostegina, Spiroclypeus), and miogypsinids. Hypothetically, these parameters should be lower in shallower contexts, because miogypsindis are typically reported to inhabits shallower settings compared to lepidocyclinds or flat nummulitids. Our results agree with this hypothesis, displaying the lowest values for the very shallow, lagoonal, patch reef environment represented by BFA, and the highest values for the below-wave base, mesophotic environment represented by BFB. Regarding to BFC, the ratios are higher in BFC1 and lower in BFC2, in accordance with the paleoenvironmental reconstruction. Since these three parameters have a similar significance, the combined one, (LEPI+FN)/MIO ratio, is probably the most useful as it takes into account a broader group of taxa and can be applied to a much wider variety of contexts.
The LH/LP ratio shows lower values in shallower, well-illuminated environments, considering the proportion of large miliolids, which are typically associated with oligotrophic, high-light conditions, and hyaline LBF, that span a wider range of depths. Indeed, this parameter displays the lower value for BFA, followed by BFC2 and BFC1, although it has been impossible to calculate it in BFB due to the lack of large porcelaneous taxa in this biofacies.
The H/P ratio [41,42] should follow the same trend, with higher values in deeper environments, where porcelaneous taxa are generally less common than hyaline ones [44]. Indeed, H/P shows the highest value in BFB and the lowest for BFA. The values of H/P can be compared to the values of the same parameters calculated by Mariani et al. [42] for the Eocene Foraminiferal Limestone of Pag Island (Croatia). Considering the different geological settings and the different geological intervals of these two case studies, it is possible to find some similarities. The H/P value obtained for BFA (3.6) and BFC2 (5.2) are compatible with the values obtained for the: (i) “Hyaline SBF and encrusting benthic foraminifera” (2.2), (ii) “Nummulitid” (2.6), and (iii) “Comminuted bioclasts and nummulitid” (5.3) biofacies of [42]. These three biofacies refer to shallow, inner-to-middle ramp environments, between 10 and 40 m water depth, and thus deposited most likely at a similar depth of BFA and BFC2. For BFC1, H/P displays a value of 7.6, and can be framed at a depth of 30 to 50 m. If we consider that the “Nummulitid and serpulid” biofacies of [42] displays an H/P value of 12.9 and has been interpreted as a middle ramp setting, with a depth around 40 to 80 m, our results for BFC1 can be considered trustworthy. Finally, the “Orthophragminid and nummulitid” biofacies of [42] displays an H/P value of 73.3 and has been interpreted to be deposited within a water depth comprised between 60 m and the lowest limit of the photic zone. Based on the skeletal components and the foraminiferal assemblage (e.g., orthophragminids, flat nummulitids, planktic foraminifera, Lenticulina, bryozoans), this Eocene biofacies is certainly deeper than BFB (for example, we have no planktic foraminifera in BFB and their abundance usually increases with depth, e.g., [86]). Indeed, the H/P value calculated for BFB is 51.5, thus showing the reliability and the potential usefulness of this parameter in reconstructing paleo-water depth.
All these parameters display a high potential for paleoenvironmental reconstructions, being reliably correlated with palaeobathymetry. For the time being, they can just be used to calculate a relative paleobathymetry between different biofacies. However, when a larger database containing the values of these parameters for different contexts will be developed, it will be possible to create a system of thresholds, to pass from relative to more absolute values of paleodepth.

6. Conclusions

Through quantitative analysis of the skeletal and foraminiferal assemblages, combined with multivariate statistics, three distinct biofacies have been identified within the studied deposits of the Jhill Limestone Unit of the Gaj Formation: (1) the reef coral biofacies (BFA), characterized by small, scattered coral patch reefs that colonized a sheltered shallow-water environment above the mean fair-weather wave base (10–20 m); (2) the coralline algal biofacies (BFB), indicative of a shallow-water, below-wave-base mesophotic environment (40–60 m), representing the deepest depositional setting within the studied intervals; and (3) the large benthic foraminiferal and coralline algal biofacies, further subdivided into two sub-biofacies, namely (a) the miogypsinid, thin and flat large benthic foraminiferal and coralline algal sub-biofacies (BFC1), corresponding to depths of 30–50 m, and (b) the miogypsinid and coralline algal sub-biofacies, which indicates a shallower setting (20–40 m) and suggests the presence of paleo-seagrass meadows.
These biofacies were distributed across a relatively flat seafloor with minimal slope, punctuated locally by small patch reefs and seagrass meadows. They developed within the photic zone, where light was the dominant energy source. However, the presence of a significant proportion of heterotrophic organisms suggests a notable nutrient influx, likely related to detrital input from nearby rivers.
Based on the analysis of large benthic foraminifera, the investigated sections of the Jhill Limestone Unit, previously attributed entirely to the Early Miocene, have been reassigned to the late Oligocene (Chattian). This revised chronology likely places their deposition within the frame of the Late Oligocene Warming Event (LOWE), thus providing additional data for better understanding the response of reef corals and foraminifera (among the other carbonate producers) to past warming events.
Finally, the tested experimental paleobathymetric parameters based on the foraminiferal counting demonstrated reliability and consistency with the proposed depositional model, showing increasing values with increasing water depth. Furthermore, a comparison of the hyaline/porcelaneous foraminifera ratio values from this study with those reported by Mariani et al. [42], while accounting for differences between the two settings, supports the utility of this parameter in paleobathymetric reconstructions. This suggests that their application across a broader range of settings, alongside with the development of a comprehensive reference database, could serve as a crucial tool for refining absolute paleodepth reconstructions.

Supplementary Materials

The following supporting information can be downloaded at https://figshare.com/s/ae0a327e7f8f372f3bb8, accessed on 24 March 2025 (Supplementary Materials S1; Supplementary Materials S2). These documents are available at https://doi.org/10.6084/m9.figshare.28425533 (accessed on 24 March 2025).

Author Contributions

Conceptualization, L.M., G.C. and M.A.; methodology, L.M., G.C., M.A., and F.R.B.; software, L.M. and G.C.; validation, L.M., G.C., M.A., H.A.R.H. and F.R.B.; formal analysis, L.M. and G.C.; investigation, L.M., G.C., M.A., M.I., M.S., H.A.R.H. and F.R.B.; resources, M.A., M.I. and M.S.; data curation, L.M. and G.C.; writing—original draft preparation, L.M., G.C., M.A. and H.A.R.H.; writing—review and editing, L.M., G.C., H.A.R.H. and F.R.B.; visualization, L.M. and M.A.; supervision, L.M., G.C. and F.R.B.; project administration, L.M., G.C. and M.A.; funding acquisition, M.A., M.I., M.S. and F.R.B. All authors have read and agreed to the published version of the manuscript.

Funding

This research was funded by European Union—Next Generation EU PRIN MUR 2022WEZR44 to C. Bottini.

Data Availability Statement

The original contributions presented in this study are included in the article/Supplementary Material. Further inquiries can be directed to the corresponding author(s).

Acknowledgments

The authors are grateful to Hildegard Westphal, Elisa Malinverno, and Guillem Mateu Vicens for the fruitful discussion on the topic. The authors thank three anonymous reviewers for their constructive comments and the editor Andjela Jovanovic.

Conflicts of Interest

The authors declare no conflicts of interest.

Abbreviations

The following abbreviations are used in this manuscript:
LBFLarge benthic foraminifera
RCARed calcareous algae
CCReef corals
LOWELate Oligocene Warming Event
SBFSmall benthic foraminifera
SPSona Pass
SSPAllah Bano
LGLashkari Jo Goth
MJMehar Jabal

References

  1. Bialik, O.M.; Coletti, G.; Mariani, L.; Commissario, L.; Desbiolles, F.; Meroni, A.N. Availability and type of energy regulate the global distribution of neritic carbonates. Sci. Rep. 2023, 13, 19687. [Google Scholar]
  2. Andruleit, H.; Freiwald, A.; Schäfer, P. Bioclastic carbonate sediments on the southwestern Svalbard shelf. Mar. Geol. 1996, 134, 163–182. [Google Scholar]
  3. Henrich, R.; Freiwald, A.; Betzler, C.; Bader, B.; Schäfer, P.; Samtleben, C.; Brachert, T.C.; Wehrmann, A.; Zankl, H.; Kühlmann, D.H.H. Controls on modern carbonate sedimentation on warm-temperate to arctic coasts, shelves and seamounts in the northern hemisphere: Implications for fossil counterparts. Facies 1995, 32, 71–108. [Google Scholar]
  4. Frank, T.D.; James, N.P.; Bone, Y.; Malcolm, I.; Bobak, L.E. Late Quaternary carbonate deposition at the bottom of the world. Sediment. Geol. 2014, 305, 1–16. [Google Scholar]
  5. Civitelli, G.; Brandano, M. Atlante delle litofacies e modello deposizionale dei Calcari a Briozoi e Litotamni nella Piattaforma carbonatica laziale-abruzzese. Boll. Soc. Geol. Ital. 2005, 124, 611. [Google Scholar]
  6. Benisek, M.F.; Betzler, C.; Marcano, G.; Mutti, M. Coralline-algal assemblages of a Burdigalian platform slope: Implications for carbonate platform reconstruction (northern Sardinia, western Mediterranean Sea). Facies 2009, 55, 375–386. [Google Scholar]
  7. Pomar, L. Types of carbonate platforms: A genetic approach. Basin Res. 2001, 13, 313–334. [Google Scholar]
  8. Reolid, J.; Betzler, C.; Braga, J.C.; Martín, J.M.; Lindhorst, S.; Reijmer, J.J. Reef slope geometries and facies distribution: Controlling factors (Messinian, SE Spain). Facies 2014, 60, 737–753. [Google Scholar]
  9. Chesnel, V.; Rodríguez, E. Facies analysis of a Bartonian–Aquitanian siliciclastic-carbonate system, Costa Rica. Sed. Geol. 2021, 417, 105884. [Google Scholar]
  10. Ager, D.V. The Nature of the Stratigraphical Record; Wiley & Sons: Hoboken, NJ, USA, 1973; p. 151. [Google Scholar]
  11. Kiessling, W.; Flügel, E.; Golonka, J. Paleoreef maps: Evaluation of a comprehensive database on Phanerozoic reefs. AAPG Bull. 1999, 83, 1552–1587. [Google Scholar]
  12. Johnson, K.G.; Jackson, J.B.; Budd, A.F. Caribbean reef development was independent of coral diversity over 28 million years. Science 2008, 319, 1521–1523. [Google Scholar] [PubMed]
  13. Coletti, G.; Commissario, L.; Mariani, L.; Bosio, G.; Desbiolles, F.; Soldi, M.; Bialik, O.M. Palaeocene to Miocene southern Tethyan carbonate factories: A meta-analysis of the successions of South-western and Western Central Asia. Dep. Rec. 2022, 8, 1031–1054. [Google Scholar]
  14. Benedetti, A.; Papazzoni, C.A.; Bosellini, F.R. Unparallel resilience of shallow-water tropical calcifiers (foraminifera and scleractinian reef corals) during the early Paleogene global warming intervals. Palaeogeogr. Palaeoclimat. Palaeoecol. 2024, 651, 112393. [Google Scholar]
  15. Ahmed, W.; Subhani, A.M.; Abidi, S.S.H. Geological map of Karachi; Geological Survey of Pakistan: Quetta, Pakistan, 1983. [Google Scholar]
  16. Naseem, S.; Sheikh, S.A.; Qadeeruddin, M. Geochemistry and sedimentology of Jhill limestone of Gaj formation, in Cape Monze and adjoining area, Karachi. Chin. J. Geochem. 1996, 15, 213–227. [Google Scholar]
  17. Shah, S.K. Indus ophiolite belt and the tectonic setting of the Malia Johar-Kiogad exotics in the Himalaya. Himalaya Sci. Terre Coil. Int. C.N.R.S., Paris 1977, 268, 361–368. [Google Scholar]
  18. Sahni, M.R.; Khan, E.J. Stratigraphy, structure and correlation of the Upper Shiwaliks, East of Chandigarh. J. Palaeontol. Soc. India 1968, 5–9, 61–74. [Google Scholar]
  19. Lawrence, R.D.; Yeats, R.S.; Khan, S.H.; Subhani, A.M.; Bonelli, D. Crystalline rocks of the Spinatizha area, Pakistan. J. Struct. Geol. 1981, 3, 449–457. [Google Scholar]
  20. Bannert, D.; Cheema, A.; Ahmed, A.; Schaffer, U. The structural development of the Western Fold Belt Pakistan. Geol. Jahrbuch 1992, B80, 3–60. [Google Scholar]
  21. Hu, X.; Garzanti, E.; Wang, J.; Huang, W.; An, W.; Webb, A. The timing of India-Asia collision onset–Facts, theories, controversies. Earth Sci. Rev. 2016, 160, 264–299. [Google Scholar]
  22. Abdel-Gawad, M. Wrench movements in Baluchistan arc and relation to Himalayan and Indian Ocean tectonics. Bull. Geol. Soc. Am. 1971, 82, 1235. [Google Scholar]
  23. HSC. Reconnaissance Geology of Part West Pakistan: Colombo Plan Cooperative Project for Government of Pak; Government of Canada: Ottawa, ON, Canada, 1960; p. 550. [Google Scholar]
  24. Kazmi, A.H.; Rana, R.A. Tectonic Map of Pakistan; Geological Survey of Pakistan: Quetta, Pakistan, 1982. [Google Scholar]
  25. Iqbal, M.W.A. Oligo-Miocene bivalves and gastropods from Kirthar Province, Lower Indus Basin, Pakistan. Rec. Geol. Sur. Pak. 1980, 51, 59. [Google Scholar]
  26. Hasnain, S.M.; Farooqi, M.A.; Muhammad, M.J. Lithostratigraphy and microfauna of Cape Monze area. Karachi Kar. Uni. Jour. Sci. 1987, 15, 13–22. [Google Scholar]
  27. Dunham, R.J. Classification of carbonate rocks according to depositional texture. In Classification of Carbonate Rocks; Ham, W.E., Ed.; American Association of Petroleum Geologists: Tulsa, OK, USA, 1962; Volume 1, pp. 108–121. [Google Scholar]
  28. Embry, A.F.; Klovan, J.E. A Late Devonian reef tract on Northeastern Banks Island, NWT. Bull. Canad. Petrol. Geol. 1971, 19, 730–781. [Google Scholar]
  29. Lokier, S.W.; Al Junaibi, M. The petrographic description of carbonate facies: Are we all speaking the same language? Sedimentology 2016, 63, 1843–1885. [Google Scholar] [CrossRef]
  30. Özcan, E.; Less, G.; Báldi-Beke, M.; Kollányi, K.; Acar, F. Oligo-Miocene foraminiferal record (Miogypsinidae, Lepidocyclinidae and Nummulitidae) from the Western Taurides (SW Turkey): Biometry and implications for the regional geology. J. Asian Earth Sci. 2009, 34, 740–760. [Google Scholar] [CrossRef]
  31. Özcan, E.; Less, G.; Báldi-Beke, M.; Kollányi, K. Oligocene hyaline larger foraminifera from Kelereêdere Section (Muê, Eastern Turkey). Micropal. 2010, 56, 465–493. [Google Scholar] [CrossRef]
  32. van Buchem, F.S.P.; Allan, T.L.; Laursen, G.V.; Lotfpour, M.; Moallemi, A.; Monibi, S.; Motiei, H.; Pickard, N.A.H.; Tahmasbi, A.R.; Vedrenne, V.; et al. Regional stratigraphic architecture and reservoir types of the Oligo-Miocene deposits in the Dezful Embayment (Asmari and Pabdeh Formations) SW Iran. Geol. Soc. Lond. Spec. Pubs. 2010, 329, 219–263. [Google Scholar] [CrossRef]
  33. Ferràndez Cañadell, C.; Bover-Arnal, T. Late Chattian larger foraminifera from the prebetic domain (SE Spain): New data on Shallow Benthic Zone 23. Palaios 2017, 32, 83–109. [Google Scholar] [CrossRef]
  34. BouDagher-Fadel, M.K. Evolution and Geological Significance of Larger Benthic Foraminifera; University College London Press: London, UK, 2018; p. 693. [Google Scholar]
  35. Dill, M.A.; Vaziri-Moghaddam, H.; Seyrafian, A.; Behdad, A.; Shabafrooz, R. A review of the Oligo–Miocene larger benthic foraminifera in the Zagros basin, Iran; New insights into biozonation and palaeogeographical maps. Rev. Micropal. 2020, 66, 100408. [Google Scholar] [CrossRef]
  36. Benedetti, A.; Marino, M.; Pichezzi, R.M. Paleocene to lower Eocene larger foraminiferal assemblages from Central Italy: New remarks on biostratigraphy. Riv. Ital. Paleontol. Stratigr. 2018, 124, 73–90. [Google Scholar]
  37. Ali, M.; Coletti, G.; Mariani, L.; Benedetti, A.; Munawar, M.J.; Rehman, S.U.; Sternai, P.; Basso, D.; Malinverno, E.; Shahzad, K.; et al. Shallow-water carbonate facies herald the onset of the palaeocene-eocene thermal maximum (Hazara Basin, northern Pakistan). J. Asian Earth Sci. X 2024, 11, 100169. [Google Scholar] [CrossRef]
  38. Flügel, E. Microfacies of Carbonate Rocks, 2nd ed.; Springer: Berlin/Heidelberg, Germany, 2010; p. 976. [Google Scholar]
  39. Coletti, G.; Balmer, E.M.; Bialik, O.M.; Cannings, T.; Kroon, D.; Robertson, A.H.; Basso, D. Microfacies evidence for the evolution of Miocene coral-reef environments in Cyprus. Palaeogeogr. Palaeoclim. Palaeoecol. 2021, 584, 110670. [Google Scholar] [CrossRef]
  40. Ali, M.; Coletti, G.; Garzanti, E.; Adatte, T.; Castelltort, S.; Sternai, P.; Benedetti, A.; Malinverno, E.; Mariani, L.; Spangenberg, J.; et al. The Baroch Nala section (NE Pakistan): A new PETM standard for the eastern Tethys. Mar. Petrol. Geol. 2025, 171, 107183. [Google Scholar] [CrossRef]
  41. Coletti, G.; Mariani, L.; Garzanti, E.; Consani, S.; Bosio, G.; Vezzoli, G.; Hu, X.; Basso, D. Skeletal assemblages and terrigenous input in the Eocene carbonate systems of the Nummulitic Limestone (NW Europe). Sed. Geol. 2021, 425, 106005. [Google Scholar] [CrossRef]
  42. Mariani, L.; Coletti, G.; Bosio, G.; Mateu Vicens, G.; Ali, M.; Cavallo, A.; Mittempergher, S.; Malinverno, E. Tectonically-controlled biofacies distribution in the Eocene Foraminiferal Limestone (Pag, Croatia): A quantitative-based palaeontological analysis. Sed. Geol. 2024, 472, 106743. [Google Scholar] [CrossRef]
  43. Posit team. RStudio: Integrated Development Environment for R. Posit Software; PBC: Boston, MA, USA, 2024; Available online: http://www.posit.co/ (accessed on 1 April 2024).
  44. Murray, J.W. Ecology and Applications of Benthic Foraminifera; Cambridge University Press: Cambridge, UK, 2006; p. 426. [Google Scholar]
  45. Bosellini, F.R. The scleractinian genus Hydnophora (revision of Tertiary species). Paläontol. Zeit. 1999, 73, 217–240. [Google Scholar] [CrossRef]
  46. Schuster, F. Scleractinian corals from the Oligocene of the Qom Formation (Esfahan-Sirjan fore-arc basin, Iran), Cour. Forsch.-Inst. Senckenberg 2002, 239, 5–55. [Google Scholar]
  47. Schuster, F. Early Miocene scleractinian corals from the Qom and Asmari formations (central and southwest Iran). Cour. Forsch.-Inst. Senckenberg 2002, 239, 129–161. [Google Scholar]
  48. Budd, A.F.; Bosellini, F.R. Revision of Oligocene Mediterranean meandroid corals in the scleractinian families Mussidae, Merulinidae, and Lobophylliidae. J. System. Palaeont. 2016, 14, 771–798. [Google Scholar] [CrossRef]
  49. Bosellini, F.R.; Vescogni, A.; Budd, A.F.; Papazzoni, C.A. High coral diversity is coupled with reef-building capacity during the Late Oligocene Warming (Castro Limestone, Salento Peninsula, S. Italy). Riv. Ital. Paleontol. Stratigr. 2021, 127, 515–538. [Google Scholar]
  50. Serra-Kiel, J.; Hottinger, L.; Caus, E.; Drobne, K.; Ferrandez, C.; Jauhri, A.K.; Less, G.; Pavlovec, R.; Pignatti, J.; Samso, J.M.; et al. Larger forminiferal biostratigraphy on the Tethyan Paleocene and Eocene. Bulletin Societé Géologique France 1998, 2, 281–299. [Google Scholar]
  51. Pignatti, J.; Papazzoni, C.A. Oppelzones and their heritage in current larger foraminiferal biostratigraphy. Lethaia 2017, 50, 369–380. [Google Scholar]
  52. Papazzoni, C.A.; Fornaciari, B.; Giusberti, L.; Simonato, M.; Fornaciari, E. A new definition of the Paleocene Shallow Benthic Zones (SBP) by means of larger foraminiferal biohorizons, and their calibration with calcareous nannofossil biostratigraphy. Micropaleontology 2023, 69, 369–405. [Google Scholar]
  53. Özcan, E.; Less, G. First record of the co-occurrence of western Tethyan and Indo-Pacific larger foraminifera in the Burdigalian of the Mediterranean province. J. Foram. Res. 2009, 39, 23–39. [Google Scholar]
  54. BouDagher-Fadel, M.K.; David Price, G. The phylogenetic and palaeogeographic evolution of the miogypsinid larger benthic foraminifera. J. Geol. Soc. 2013, 170, 185–208. [Google Scholar]
  55. Coletti, G.; Stainbank, S.; Fabbrini, A.; Spezzaferri, S.; Foubert, A.; Kroon, D.; Betzler, C. Biostratigraphy of large benthic foraminifera from Hole U1468A (Maldives): A CT-scan taxonomic approach. Swiss J. Geosci. 2018, 111, 523–536. [Google Scholar]
  56. Cahuzac, B.; Poignant, A. Essai de biozonation de l’Oligo-Miocène dans les bassins européens à l’aide des grands foraminifères néritiques. Bull. Soc. Géol. France 1997, 168, 155–169. [Google Scholar]
  57. Kumar, A.; Saraswati, P.K. Response of larger foraminifera to mixed carbonate-siliciclastic environments: An example from the Oligocene-Miocene sequence of Kutch, India. Palaeogeogr. Palaeoclimatol. Palaeoecol. 1997, 136, 53–65. [Google Scholar]
  58. Less, G.; Frijia, G.; Özcan, E.; Saraswati, P.K.; Parente, M.; Kumar, P. Nummulitids, lepidocyclinids and Sr-isotope data from the Oligocene of Kutch (western India) with chronostratigraphic and paleobiogeographic evaluations. Geodinamica Acta 2018, 30, 183–211. [Google Scholar]
  59. Özcan, E.; Less, G.; Baydogan, E. Regional implications of biometric analysis of Lower Miocene larger foraminifera from Central Turkey. Micropaleontology 2009, 55, 559–588. [Google Scholar]
  60. Langer, M.R. Epiphytic foraminifera. Mar. Micropal. 1993, 20, 235–265. [Google Scholar]
  61. Mateu-Vicens, G.; Khokhlova, A.; Sebastián-Pastor, T. Epiphytic foraminiferal índices as bioindicators in Mediterranean seagrass meadows. J. Foram. Res. 2014, 44, 325–339. [Google Scholar] [CrossRef]
  62. Mariani, L.; Coletti, G.; Bosio, G.; Tentorio, C.; Mateu Vicens, G.; Bracchi, V.A.; Basso, D.; Malinverno, E. Benthic foraminifera as proxy for fossil seagrass from the Lower Pleistocene deposits of the Stirone River (Emilia-Romagna, Italy). Quat. Int. 2022, 640, 73–87. [Google Scholar] [CrossRef]
  63. Zachos, J.; Pagani, M.; Sloan, L.; Thomas, E.; Billups, K. Trends, Rhythms, and Aberrations in Global Climate 65 Ma to Present. Science 2011, 292, 686. [Google Scholar] [CrossRef]
  64. Zhang, Y.G.; Pagani, M.; Liu, Z.; Bohaty, S.M.; DeConto, R. A 40-million-year history of atmospheric CO2. Phil. Trans. Royal Soc. A 2013, 371, 20130096. [Google Scholar] [CrossRef]
  65. Wu, F.; Miao, Y.; Meng, Q.; Fang, X.; Sun, J. Late Oligocene Tibetan Plateau Warming and Humidity: Evidence from a Sporopollen Record. Geochem. Geophys. Geosyst. 2018, 20, 434–441. [Google Scholar] [CrossRef]
  66. Villa, G.; Persico, D. Late Oligocene climatic changes: Evidence from calcareous nannofossils at Kerguelen Plateau Site 784 (Southern Ocean). Paleogeogr. Paleoclimat. Paleoecol. 2006, 231, 110–119. [Google Scholar] [CrossRef]
  67. Alegret, L.; Cruz, L.E.; Fenero, R.; Molina, E.; Ortiz, S.; Thomas, E. Effects of the Oligocene climatic events on the foraminiferal record from Fuente Caldera section (Spain, western Tethys). Palaeog. Palaeoclim. Palaeoecol. 2008, 269, 94–102. [Google Scholar] [CrossRef]
  68. Bover-Arnal, T.; Ferràndez-Cañadell, C.; Aguirre, J.; Esteban, M.; Fernández-Carmona, J.; Albert-Villanueva, E.; Salas, R. Late Chattian platform carbonates from the SE Iberian Plate: An interglacial record from the western Tethys. Palaios 2017, 32, 61–82. [Google Scholar]
  69. Villa, G.; Florindo, F.; Persico, D.; Lurcock, P.; de Martini, A.P.; Jovane, L.; Fioroni, C. Integrated calcareous nannofossil and magnetostratigraphic record of ODP Site 709: Middle Eocene to late Oligocene paleoclimate and paleoceanography of the Equatorial Indian Ocean. Mar. Micropal. 2021, 169, 102051. [Google Scholar] [CrossRef]
  70. Bosellini, F.R.; Vescogni, A.; Briguglio, A.; Piazza, M.; Papazzoni, C.A.; Silvestri, G.; Morsilli, M. Resilient coral reef ecosystems: The case study of turbid-mesophotic coral buildups during the Late Oligocene Warming Event (Tertiary Piedmont Basin, NW Italy). Palaeogeogr. Palaeoclimatol. Palaeoecol. 2024, 649, 112330. [Google Scholar] [CrossRef]
  71. Frost, S.H. Oligocene Reef Coral Biofacies of the Vicentin, Northeast Italy. Eur. Foss. Reef Models 1981. [Google Scholar] [CrossRef]
  72. Budd, A.F. Diversity and extinction in the Cenozoic history of Caribbean reefs. Coral Reefs 2000, 19, 25–35. [Google Scholar] [CrossRef]
  73. Perrin, C. Tertiary: The emergence of modern reef ecosystems. In Phanerozoic Reef Patterns; Kiessling, W., Flügel, E., Golonka, J., Eds.; SEPM: Tulsa, OK, USA, 2002. [Google Scholar] [CrossRef]
  74. Hallock, P. Reefs and reef limestones in Earth history. In Life and Death of Coral Reefs; Birkeland, C., Ed.; Chapman and Hall: New York, NY, USA, 1997; pp. 13–42. [Google Scholar]
  75. Stanley, S.M. Influence of seawater chemistry on biomineralization throughout Phanerozoic time: Paleontological and experimental evidence. Palaeogeogr. Palaeoclim. Palaeoecol. 2006, 232, 214–236. [Google Scholar] [CrossRef]
  76. Sirel, E.; Özgen-Erdem, N.; Kangal, Ö. Systematics and biostratigraphy of Oligocene (Rupelian-Early Chattian) foraminifera from lagoonal-very shallow water limestone in the eastern Sivas Basin (central Turkey). Geol. Croat. 2013, 66, 83–109. [Google Scholar] [CrossRef]
  77. Gedik, F. Benthic foraminiferal fauna of Malatya Oligo-Miocene basin, (eastern Taurids, eastern Turkey). Bull. Min. Res. Expl. 2014, 149, 93–136. [Google Scholar] [CrossRef]
  78. Amirshahkarami, M. Microfacies correlation analysis of the Oligocene-Miocene Asmari Formation, in the central part of the Rag-e-Safid anticlinal oil field, Zagros Basin, south-west Iran. Turk. J. Earth Sci. 2013, 22, 204–219. [Google Scholar] [CrossRef]
  79. Mattern, F.; Al-Sayigh, A.R.; Farfour, M.; Scharf, A.; Al-Amri, S.; Al-Omairi, J. Microfacies, Biostratigraphy, Depositional Environment, Seismic Refraction and Correlation of Coralline Limestones of the Barzaman Formation (Oligocene-Pliocene? Al-Khod, Muscat Area, Sultanate of Oman). SQU J. Sci. 2020, 25, 85–99. [Google Scholar]
  80. Afzal, J.; Racey, A. Early Miocene larger foraminifera from Suwadi Island, northern Oman. In Geology, Tectonics and Natural Resources of Arabia and its Surroundings; Geological Society: London, UK, 2025; p. 550. [Google Scholar] [CrossRef]
  81. Reuter, M.; Piller, W.E.; Harzhauser, M.; Mandic, O.; Berning, B.; Rögl, F.; Kroh, A.; Aubry, M.P.; Wielandt-Schuster, U.; Hamedani, A. The Oligo-/Miocene Qom Formation (Iran): Evidence for an early Burdigalian restriction of the Tethyan Seaway and closure of its Iranian gateways. Int. J. Earth Sci. 2009, 98, 627–650. [Google Scholar] [CrossRef]
  82. Kureshy, A.A. Large Tertiary Foraminiferal Biostratigraphy, Khirtar Province, Sind, Pakistan: ABSTRACT. AAPG Bull. 1982, 66, 591–592. [Google Scholar] [CrossRef]
  83. Kureshy, A.A. The Oligocene Foraminiferal Biostratigraphy of Pakistan. Riv. It. Paleont. Strat. 1984, 89, 395–406. [Google Scholar]
  84. Hallock, P.; Glenn, E.C. Larger foraminifera: A tool for paleoenvironmental analysis of Cenozoic carbonate depositional facies. Palaios 1986, 1, 55–64. [Google Scholar] [CrossRef]
  85. Beavington-Penny, S.J.; Racey, A. Ecology of extant nummulitids and other LBF: Application in palaeoenvironmental analysis. Earth Sci. Rev. 2004, 67, 219–265. [Google Scholar] [CrossRef]
  86. van der Zwaan, G.J.; Jorissen, F.J.; de Stigter, H.C. The depth dependency of planktonic/benthic foraminiferal ratios: Constraints and applications. Mar. Geol. 1990, 95, 1–16. [Google Scholar]
  87. Hohenegger, J. Depth estimation by proportions of living larger foraminifera. Mar. Micropal. 1995, 26, 31–47. [Google Scholar]
  88. Hohenegger, J. Coenoclines of larger foraminifera. Micropaleontology 2000, 46, 127–151. [Google Scholar]
  89. Hohenegger, J.; Yordanova, E.; Hatta, A. Remarks on west Pacific Nummulitidae (foraminifera). J. Foram. Res. 2000, 30, 3–28. [Google Scholar]
  90. Yamano, H.; Kayanne, H.; Matsuda, F.; Tsuji, Y. Lagoonal facies, ages, and sedimentation in three atolls in the Pacific. Mar. Geol. 2002, 185, 233–247. [Google Scholar]
  91. Renema, W. Larger foraminifera on reefs around Bali (Indonesia). Zool. Verh. 2003, 345, 337–366. [Google Scholar]
  92. Renema, W. Large benthic foraminifera from the deep photic zone of a mixed siliciclastic-carbonate shelf off East Kalimantan, Indonesia. Mar. Micropal. 2006, 58, 73–82. [Google Scholar]
  93. Ernst, S.; Janse, M.; Renema, W.; Kouwenhoven, T.; Goudeau, M.L.; Reichart, G.J. Benthic foraminifera in a large Indo-Pacific coral reef aquarium. J. Foram. Res. 2011, 41, 101–113. [Google Scholar]
  94. Goeting, S.; Briguglio, A.; Eder, W.; Hohenegger, J.; Roslim, A.; Kocsis, L. Depth distribution of modern larger benthic foraminifera offshore Brunei Darussalam. Micropaleontology 2018, 64, 299–316. [Google Scholar]
  95. Oron, S.; Friedlander, A.M.; Sala, E.; Goodman-Tchernov, B.N. Shallow water foraminifera from Niue and Beveridge Reef (South Pacific): Insights into ecological significance and ecosystem integrity. R. Soc. Open Sci. 2024, 11, 230997. [Google Scholar] [PubMed]
  96. Tomassetti, L.; Bosellini, F.R.; Brandano, M. Growth and demise of a Burdigalian coral bioconstruction on a granite rocky substrate (Bonifacio Basin, South Corsica). Facies 2013, 59, 703–716. [Google Scholar]
  97. Briguglio, A.; Vannucci, G.; Bruzzone, C.; Piazza, M. Stratigraphic development of a Late Oligocene Reef Complex under strong fluviatile influence in the Tertiary Piedmont Basin (Liguria, NW Italy). Micropaleontology 2021, 67, 315–339. [Google Scholar]
  98. Saint Martin, J.P.; Chaix, C.; Cahuzac, B.; Moissette, P.; André, J.P. Les faunes coralliennes de l’Oligocène de Malte: Biodiversité et paléoenvironnement. Ann. Paléontol. 2021, 107, 102508. [Google Scholar]
  99. McCall, J.; Rosen, B.; Darrell, J. Carbonate deposition in accretionary prism settings: Early Miocene coral limestones and corals of the Makran Mountain Range in southern Iran. Facies 1994, 31, 141–178. [Google Scholar]
  100. Yazdi, M.; Shirazi, M.P.; Rahiminejad, A.H.; Motavalipoor, R. Paleobathymetry and paleoecology of colonial corals from the Oligocene-early Miocene (?) Qom Formation (Dizlu area, central Iran). Carbonates Evaporites 2021, 27, 395–405. [Google Scholar]
  101. Rahiminejad, A.H.; Yazdi, M.; Ashouri, A.R. Miocene scleractinian corals from a mixed siliciclastic-carbonate system: Bakhtiari succession, Zagros Basin (central-western Iran). Alcheringa 2011, 35, 571–592. [Google Scholar]
  102. Mohammadi, E.; Ghaedi, M. Diversity and paleoecological significance of zooxanthellate corals of Oligocene Qom Formation, SE Iran. Earth Sci. Res. J. 2024, 28, 127–137. [Google Scholar] [CrossRef]
  103. Wallace, C.C. Staghorn Corals of the World; a Revision of the Genus Acropora; CSIRO Press: Melbourne, Australia, 1999; p. 422. [Google Scholar]
  104. Schuster, F. Oligocene and Miocene examples of Acropora-dominated palaeoenvironments: Mesohellenic Basin (NW Greece) and northern Gulf of Suez (Egypt). In Proceedings of the 9th International Coral Reef Symposium, Bali, Indonesia, 23–27 October 2000; pp. 199–204. [Google Scholar]
  105. El-Azabi, M.H. Sedimentary facies and stratal architecture of the Middle Eocene Acropora-dominated succession in a storm-influenced ramp system, El-Ramliya area, north Eastern Desert, Egypt. Sed. Geol. 2023, 447, 106368. [Google Scholar] [CrossRef]
  106. Stolarski, J.; Bosellini, F.R.; Wallace, C.C.; Gothmann, A.; Mazur, M.; Domart-Coulon, I.; Gutner-Hoch, E.; Neuser, R.D.; Levy, O.; Shemesh, A.; et al. A unique coral biomineralization pattern has resisted 40 million years of major ocean chemistry change. Sci. Rep. 2016, 6, 27579. [Google Scholar] [CrossRef]
  107. Mohanti, M.; Srivastava, S.C. Oligocene reefal environment of Kutch Basin (Western India) with implications of the Mediterranean connection. Géologie Méditerranéenne 1994, 21, 3–4. [Google Scholar] [CrossRef]
  108. Hallock, P.; Hansen, H.J. Depth adaptation in Amphistegina: Change in· lamellar thickness. Bull. Geol. Soc. Den. 1978, 27, 99–104. [Google Scholar]
  109. Ćosović, V.; Drobne, K.; Moro, A. Paleoenvironmental model for Eocene foraminiferal limestones of the Adriatic Carbonate Platform (Istrian Peninsula). Facies 2004, 50, 61–75. [Google Scholar] [CrossRef]
  110. Baceta, J.I.; Mateu-Vicens, G. Seagrass development in terrigenous-influenced inner ramp settings during the middle Eocene (Urbasa-Andia Plateau, Western Pyrenees, North Spain). Sedimentology 2021, 69, 301–344. [Google Scholar] [CrossRef]
  111. Coletti, G.; Basso, D. Coralline algae as depth indicators in the Miocene carbonates of the Eratosthenes Seamount (ODP Leg 160, Hole 966F). Geobios 2020, 60, 29–46. [Google Scholar] [CrossRef]
  112. Hottinger, L. Shallow benthic foraminiferal assemblages as signals for depth of their deposition and their limitations. Bull. Société Géologique Fr. 1997, 168, 491–505. [Google Scholar]
  113. Brandano, M.; Cornacchia, I.; Raffi, I.; Tomassetti, L. The Oligocene-Miocene stratigraphic evolution of the Majella carbonate platform (Central Apennines, Italy). Sed. Geol. 2016, 333, 1–14. [Google Scholar] [CrossRef]
  114. Reich, S.; Di Martino, E.; Todd, J.A.; Wesselingh, F.P.; Renema, W. Indirect paleo-seagrass indicators (IPSIs): A review. Earth Sci. Rev. 2015, 143, 161–186. [Google Scholar] [CrossRef]
  115. Bilal, M.; Khan, A. Geotechnical Evaluation of Limestones from Cape Monze and Adjoining Areas, Karachi, Pakistan for Their Utilization as Road Aggregate. Int. J. Econ. Envir. Geol. 2019, 10, 1–8. [Google Scholar]
  116. Hakro, A.A.; Samtio, M.S.; Rajper, R.H.; Mastoi, A.S. Major Elements of Nari Formation Sandstone from Jungshahi Area of Southern Indus Basin, Pakistan. Pak. J. Sci. Ind. Res. Ser. A Phys. Sci. 2022, 65, 248–259. [Google Scholar]
  117. Karevan, M.; Vaziri-Moghaddam, H.; Mahboubi, A.; Moussavi-Harami, R. Biostratigraphy and paleo-ecological reconstruction on Scleractinian reef corals of Rupelian-Chattian succession (Qom Formation) in northeast of Delijan area. JGeope 2014, 4, 11–24. [Google Scholar]
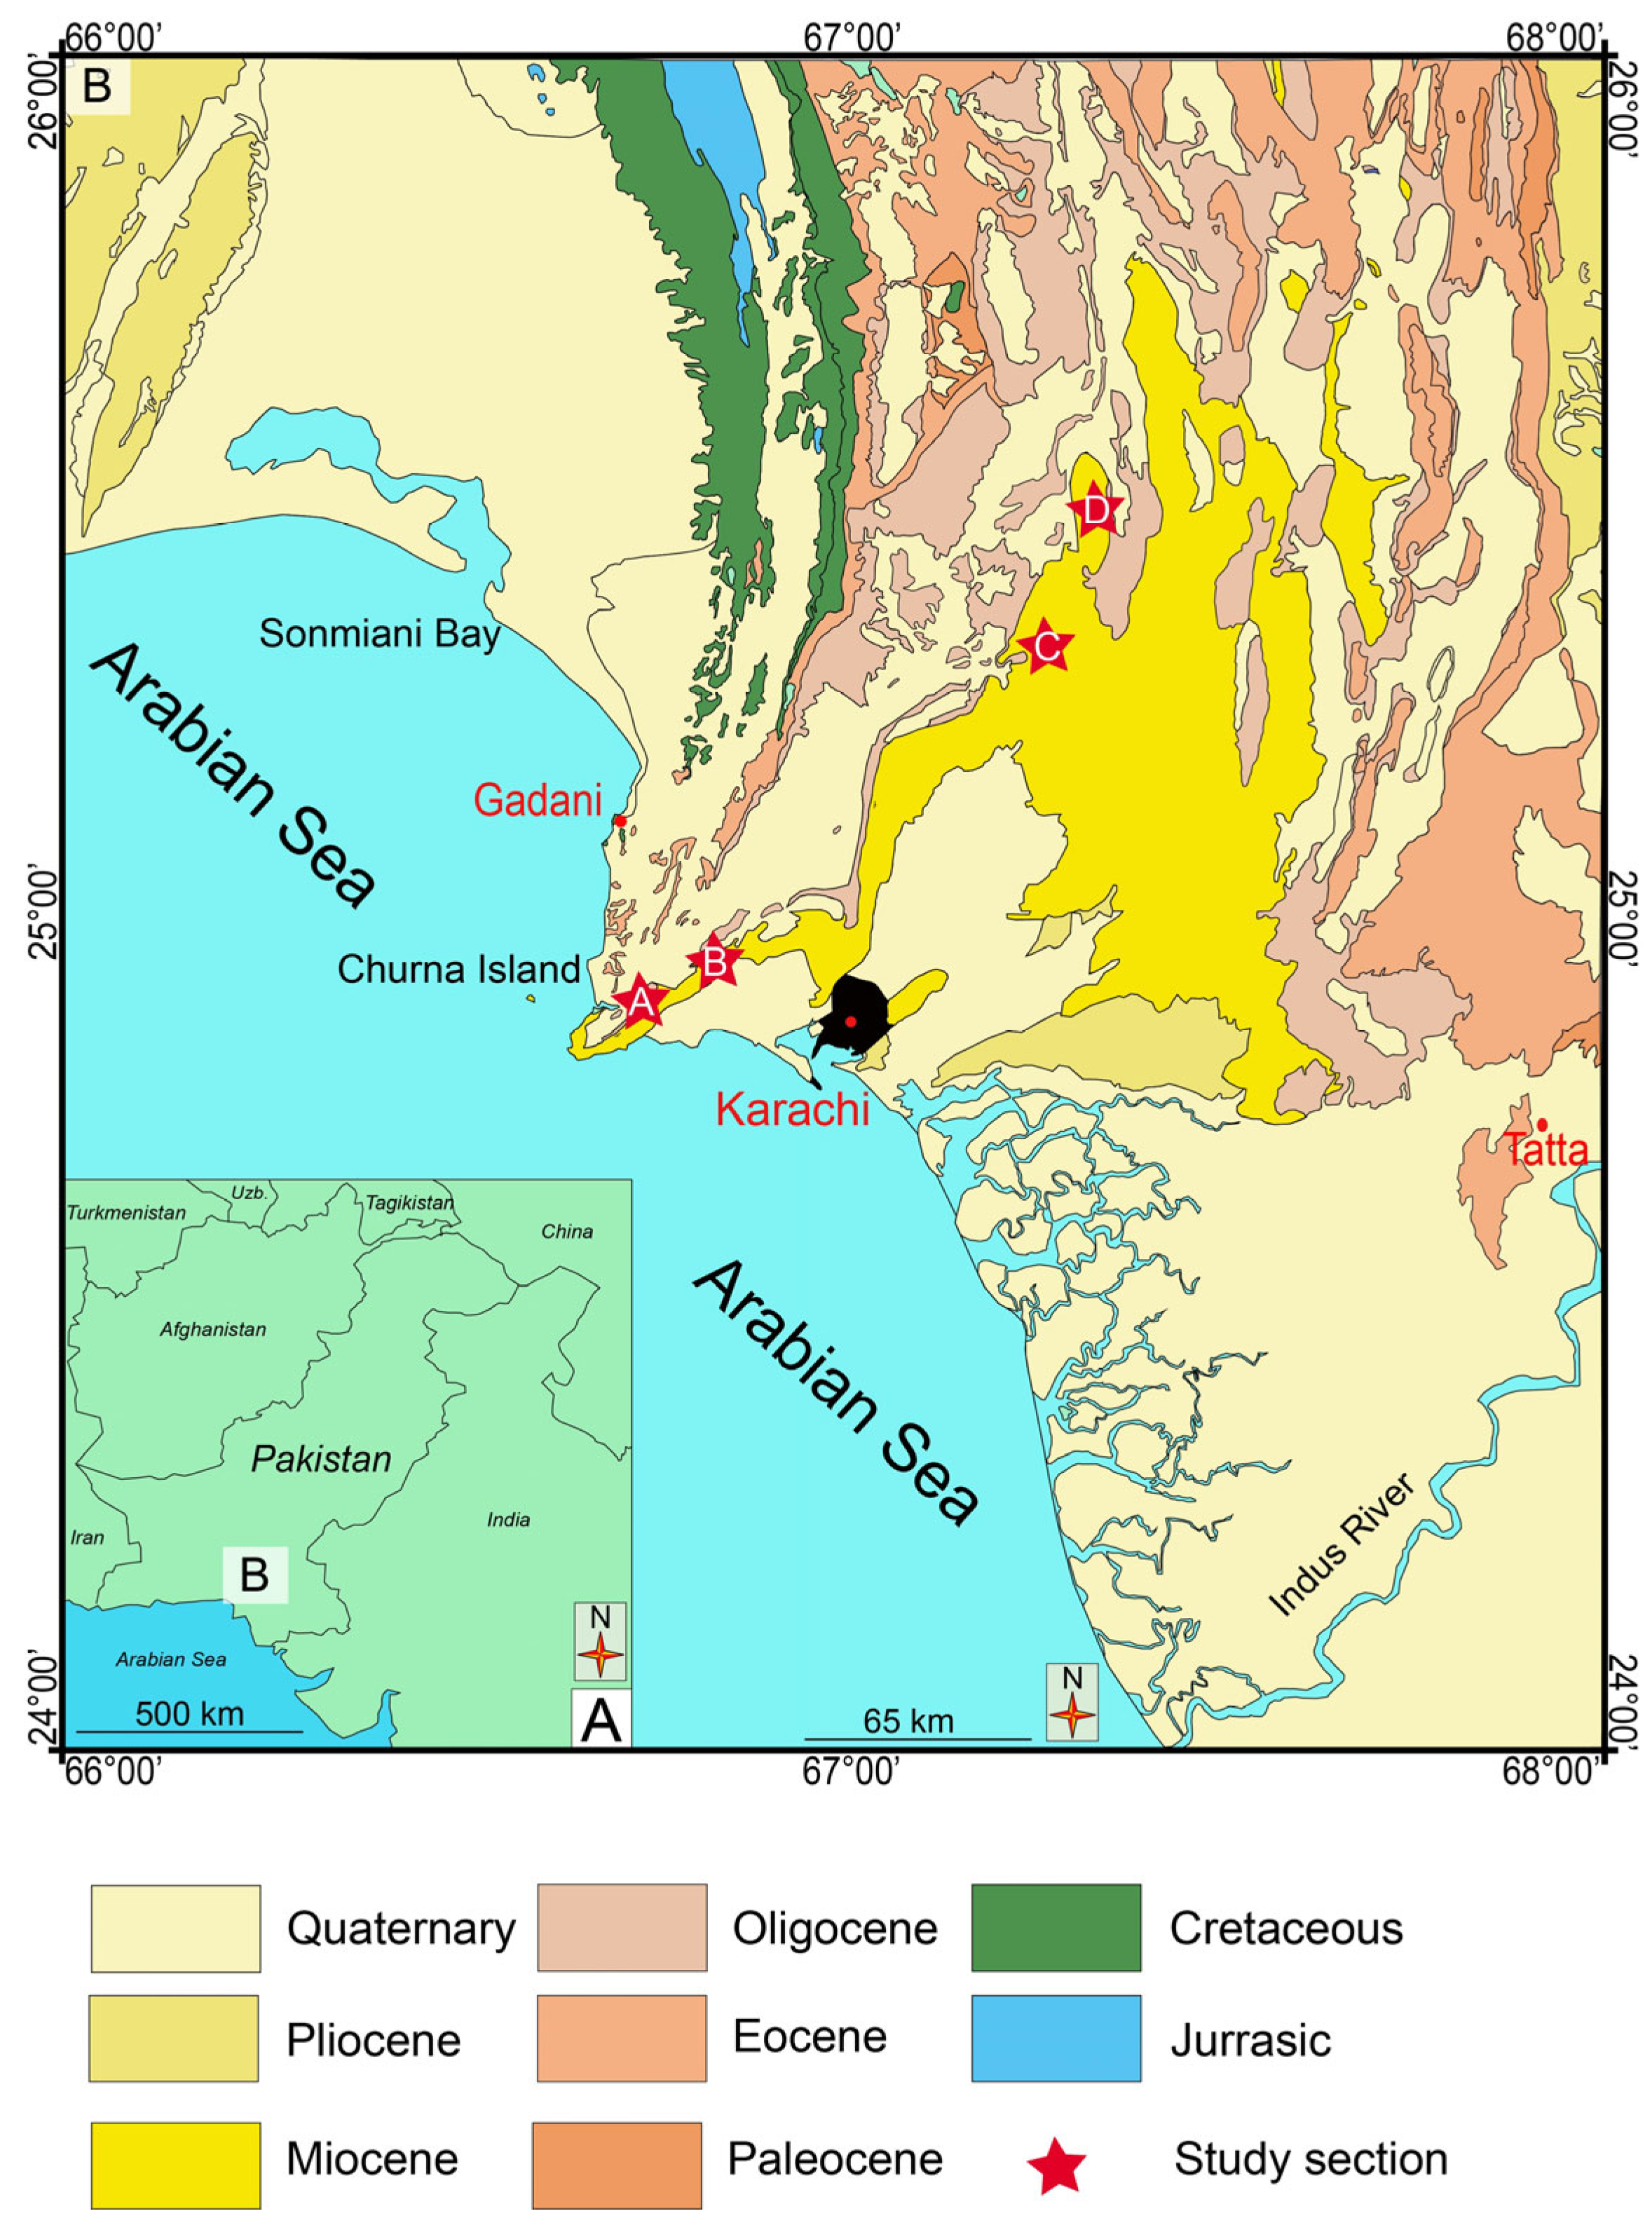
Figure 1. Geological setting. (A) Location of the study area within the Asian region. (B) Simplified geological map of the region (southern Pakistan). The red stars indicate the location of the studied sections: A. Sona Pass (SP); B. Allah Bano (SSP); C. Lashkari Jo Goth (LG); D. Mehar Jabal (MJ). The studied sections are located within Miocene deposits on the geological map; however, in the present study, their age has been recalibrated to the late Oligocene (late Chattian). Modified from the geological map sheets no. 6 (Thano Bula Khan) and 1 (Karachi), compiled in 1953–1956 by the “Photo-graphic survey corporation limited, Toronto, Canada”, in cooperation with the Geological survey of Pakistan, using aerial photographs taken between 1952 and 1954, and published for the government of Pakistan by the government of Canada.
Geosciences 15 00129 g001
Figure 2. Field pictures of Sona Pass (SP) and Allah Bano (SSP) outcrops. (A) SSP outcrop, the red lines indicate the contact between the Metan Clay Unit, the Jhill Limestone Unit, and the Talawa Limestone of the Gaj Formation. (B) Panoramic view at the top of the SP section. It is possible to appreciate the SSP section in the background. The red line indicates the dextral strike-slip fault that separates the two sections. (C) View at the base of the SP section. (D) Mollusks in the SP deposits, ~ 35 m from the base of the section (between SP11 and SP12, see Figure 3; BFC2). (E) Massive coral colony of Agathiphyllia in the SP section, ~48 m from the base (SP16, see Figure 3; BFA). (F) Poritid coral colony in the SP deposits, ~46 m from the base of the section (SP15b, see Figure 3; BFA). (G) Massive coral colony of Favites in the SP deposits, ~48 m from the base of the section (between SP16 and SP17, see Figure 3; BFA). (H) Dome-shaped, massive coral colony of Favites in the SP deposits, ~46 m from the base of the section (between SP15 and SP16, see Figure 3; BFA). (I) SSP section. (J) Coralline algae in the SP deposits, ~48 m from the base of the section (between SP16 and SP17; see Figure 3; transition from BFA to BFC2). (K) Coralline algae and benthic foraminifera dominated floatstones/rudstones in the SSP section, ~24 m from the base of the section (between SSP08 and SSP09, see Figure 3; BFB).
Geosciences 15 00129 g002
Figure 3. Stratigraphic logs of SP (left) and SSP (right) sections, showing the biofacies and the skeletal components recognized in the field and laboratory analyses. The abundances of large benthic foraminifera (LBF; green squares), red calcareous algae (RCA; red circles), and reef corals (CC; violet rhombus) in each sample, derived from the point-counting, are reported on the right side of the logs. Seagrass-related intervals are marked by a large seagrass symbol on the side of the log. SBF: small benthic foraminifera.
Geosciences 15 00129 g003
Figure 4. Field pictures of Lashkari Jo Goth (LG) and Mehar Jabal (MJ) outcrops. (A) LG outcrop. (B) MJ outcrop. (C) Rhodoliths-dominated floatstones/rudstones in the LG section, ~8 m from the base (between LG04 and LG05, see Figure 5; BFA). (D) Irregular echinoderm in the LG deposits, ~10 m from the base of the section (between LG05 and LG06, see Figure 5; BFA). (E) Massive coral colony of Hydnophora in the LG deposits, ~12 m from the base of the section (LG07, see Figure 5; BFA). (F) Recrystallized massive coral colony in the LG deposits, at the top of the section (LG15, see Figure 5; BFA). (G) Diagenetic concretions in the MJ section, ~6 m from the base. (H) Massive coral colony of Montastraea in the MJ deposits, ~16 m from the base of the section (MJ05B, see Figure 5; BFA). (I) Plocoid massive coral colony in the MJ deposits, ~15 m from the base of the section (MJ05A, see Figure 5; BFA). (J) Wackestones/floatstones in the MJ deposits, ~18 m from the base of the section (between MJ06 and MJ07, see Figure 5; BFC2). (K) Deposits at the top of MJ section; it is possible to see the contact between the Jhill Limestone Unit (below) and the Talawa Limestone (below).
Geosciences 15 00129 g004
Figure 5. Stratigraphic logs of LG (top) and MJ (bottom) sections, showing the biofacies and the skeletal components recognized in the field and laboratory analyses. The abundances of large benthic foraminifera (LBF; green squares), red calcareous algae (RCA; red circles), and reef corals (CC; violet rhombus) in each sample, derived from the point-counting, are reported on the right side of the logs. Seagrass-related facies are marked by a large seagrass symbol on the side of the log. The key to the symbols is the same as for Figure 3.
Geosciences 15 00129 g005
Figure 6. Benthic foraminifera of the Jhill Limestone Unit. (A) Spiroclypeus (white arrow), Nephrolepidina (red arrow), and Operculina (blue arrow). (B) Nephrolepidina cf. praemarginata equatorial section. (C) Amphistegina (white arrow), bryozoan (red arrow). (D) Miogypsina equatorial section, single long spire. (E) Miogypsinoides cf. bantamensis, equatorial section, single short spire. (F) Sorites (red arrow). (G) Austrotrillina. (H) Archaias. (I) Eulepidina. (J) Lobatula. (K) Peneroplis. (L) Planorbulina, curved morphology. Scale bar 100 µm.
Geosciences 15 00129 g006
Figure 7. Dendrogram resulting from the Q-mode cluster analysis on the point-counting dataset, and interpretation of the different biofacies related to the different clusters. The straight red line separates 3 clusters (A, B, C) at around 65% of similarity (height value = 55); the dotted red line separates 5 clusters (A1, A2, B, C1, C2) at around 75% of similarity (height value = 35). Cluster A1 and A2 constitute the biofacies BFA; cluster B the biofacies BFB; cluster C the biofacies BFC, where the sub-cluster C1 is interpreted as the sub-biofacies BFC1 and the cluster BFC2 as the sub-biofacies BFC2. On the right: microscope images related to the different biofacies (and clusters); the colors of the circular borders follow the colors of the bar on the left. Scale bar 2 mm.
Geosciences 15 00129 g007
Figure 8. Calcareous algae. (A) Halimeda (red arrow). (B) Sporolithales (red arrow). (C) Mesophyllum, Hapalidiales. (D) Corallinales. (E) Hapalidiales. (F) Articulated coralline alga. Scale bar 100 µm.
Geosciences 15 00129 g008
Figure 9. Some of the reef corals of the Jhill Limestone Unit of the Gaj Formaton (southern Pakistan), in thin sections. Scale bar 1 mm. (A) Hydnophora cf. provincialis, detail of the T-shaped septa. (B) Hydnophora cf. provincialis. (C) Acropora, fragment of a branching colony (white arrow). (D) Agatiphyllia, plocoid colony with perforated septa (red arrow); (E) Porites (F) Montastrea.
Geosciences 15 00129 g009
Figure 11. Paleoenvironmental reconstruction and paleobathymetric model of the analyzed successions, showing the distribution of the biofacies and the main groups of carbonate-producing organisms; the key to the symbols is the same as Figure 3.
Geosciences 15 00129 g011
Table 1. Results of the point-counting analysis showing the average abundances of different skeletal components in all the biofacies. The abundances of each sample within the four analyzed sections are shown in Supplementary Materials S2. Raw data of the point-counting analysis are shown in Supplementary Material S1. CC: colonial corals; RCA: red calcareous algae; LBF: large benthic foraminifera; SBF: small benthic foraminifera; T/D: thickness/diameter ratio. For the paleoenvironmental reconstruction, BFA1 and BFA2 have been considered together, belonging to the same biofacies (BFA), whereas BFC1 and BFC2 have been analyzed separately.
BFA
BiofaciesBFA1BFA2BFBBFC1BFC2
CC99%62%0.0%1.1%0.23%
Green calcareous algae0.1%0.1%0.0%0.02%0.8%
RCA encrusting0.3%15.1%77.1%29.8%24.1%
RCA articulated0.0%0.8%0.0%2.4%4.3%
LBF miliolids0.0%3.5%0.0%2.2%3.4%
SBF miliolids0.02%0.5%0.1%0.9%2.8%
Miogypsinids0.1%6.3%4.2%25.4%20.6%
Lepidocyclinids0.0%0.0%6.1%5.4%4.3%
Amphisteginids0.0%0.7%0.4%0.6%1%
LBF hyaline low T/D0.0%0.3%5.8%14.3%0.9%
LBF hyaline others0.0%0.2%1.2%0.8%2.8%
SBF hyaline0.2%1.3%0.9%1.5%6.8%
Encrusting benthic foraminifera0.1%3.9%2.3%1%1.7%
SBF agglutinated0.0%0.1%0.04%0.1%1.2%
Planktic foraminifera0.0%0.0%0.0%0.0%0.1%
Mollusks0.3%1.6%0.2%7.5%3.7%
Bryozoans0.02%1.6%0.3%4.0%9.3%
Echinoderms0.0%1.9%1.4%3.2%11.2%
Arthropods0.0%0.1%0.0%0.0%0.4%
Serpulids0.0%0.0%0.0%0.02%0.04%
Ostracods0.01%0.1%0.02%0.0%0.5%
Table 2. Results of the area-counting analysis showing the average abundances of different foraminiferal informal categories in all the biofacies, and the calculated experimental parameters displaying paleobathymetrical significance. The abundances of each sample within the four analyzed sections are shown in Supplementary Material S2. Raw data of the point-counting analysis are shown in Supplementary Material S1. Abbreviations follow those in Table 1. NR: not recognized; LEPI/MIO: lepidocyclinids/miogypsinids; FN/MIO: flat-shaped nummulitids (Operculina, Heterostegina, Spiroclypeus)/miogypsinids; (LEPI + FN)/MIO: (lepidocyclinids + flat-shaped nummulitids)/miogypsinids; LH/LP: porcelaneous LBF/hyaline LBF; H/P: hyaline/porcelaneous foraminifera. In green: porcelaneous LBF (large miliolids). In grey: flat-shaped nummulitids.
BiofaciesBFABFBBFC1BFC2
Soritids and peneroplids7.38%0%2.59%2.85%
Austrotrillina1.24%0%1.37%1.29%
SBF porcelaneous (small miliolids)12.57%1.81%7.36%10.41%
Miogypsinids11.31%26.38%45.29%30.65%
Lepidocyclinids0.18%5.94%4.80%0.87%
Spiroclypeus0%12.27%4.61%0%
Operculina and Heterostegina0.43%2.31%6.71%2.18%
Hyaline LBF (others)0.97%7.15%2.69%2.89%
Amphisteginids0.72%6.22%3.02%1.85%
Planorbulinids0.14%1.35%0.16%0.55%
Rounded acervulinids0%0.77%0.32%0.03%
SBF hyaline62.39%30.73%18.18%37.71%
SBF agglutinated 2.13%5.07%2.76%8.35%
Planktic foraminifera0.44%0%0.10%0.21%
Calculated parameters
LEPI/MIO0.020.230.10.03
FN/MIO0.040.550.250.07
(LEPI+FN)/MIO0.060.780.350.1
LH/LP1.6/16.79.1
H/P3.651.57.65.2
Table 3. Average number of individuals expected per cm2 of thin section per biofacies. In grey: flat-shaped nummulitids.
BiofaciesBFABFBBFC1BFC2
Soritids and peneroplids1001
SBF porcelaneous (small miliolids)1012
SBF agglutinated0001
Miogypsinids1285
Lepidocyclinids0010
Spiroclypeus0110
Operculina and Heterostegina0010
Hyaline LBF (others)0001
Amphisteginids0010
SBF hyaline5237
TOT individuals expected761718
Disclaimer/Publisher’s Note: The statements, opinions and data contained in all publications are solely those of the individual author(s) and contributor(s) and not of MDPI and/or the editor(s). MDPI and/or the editor(s) disclaim responsibility for any injury to people or property resulting from any ideas, methods, instructions or products referred to in the content.