
High-Resolution Coastal Vulnerability Assessment for the Istrian Peninsula: Developing a Physical Coastal Vulnerability Index (PCVI)


Abstract
:1. Introduction
2. Theoretical Framework and Methodology
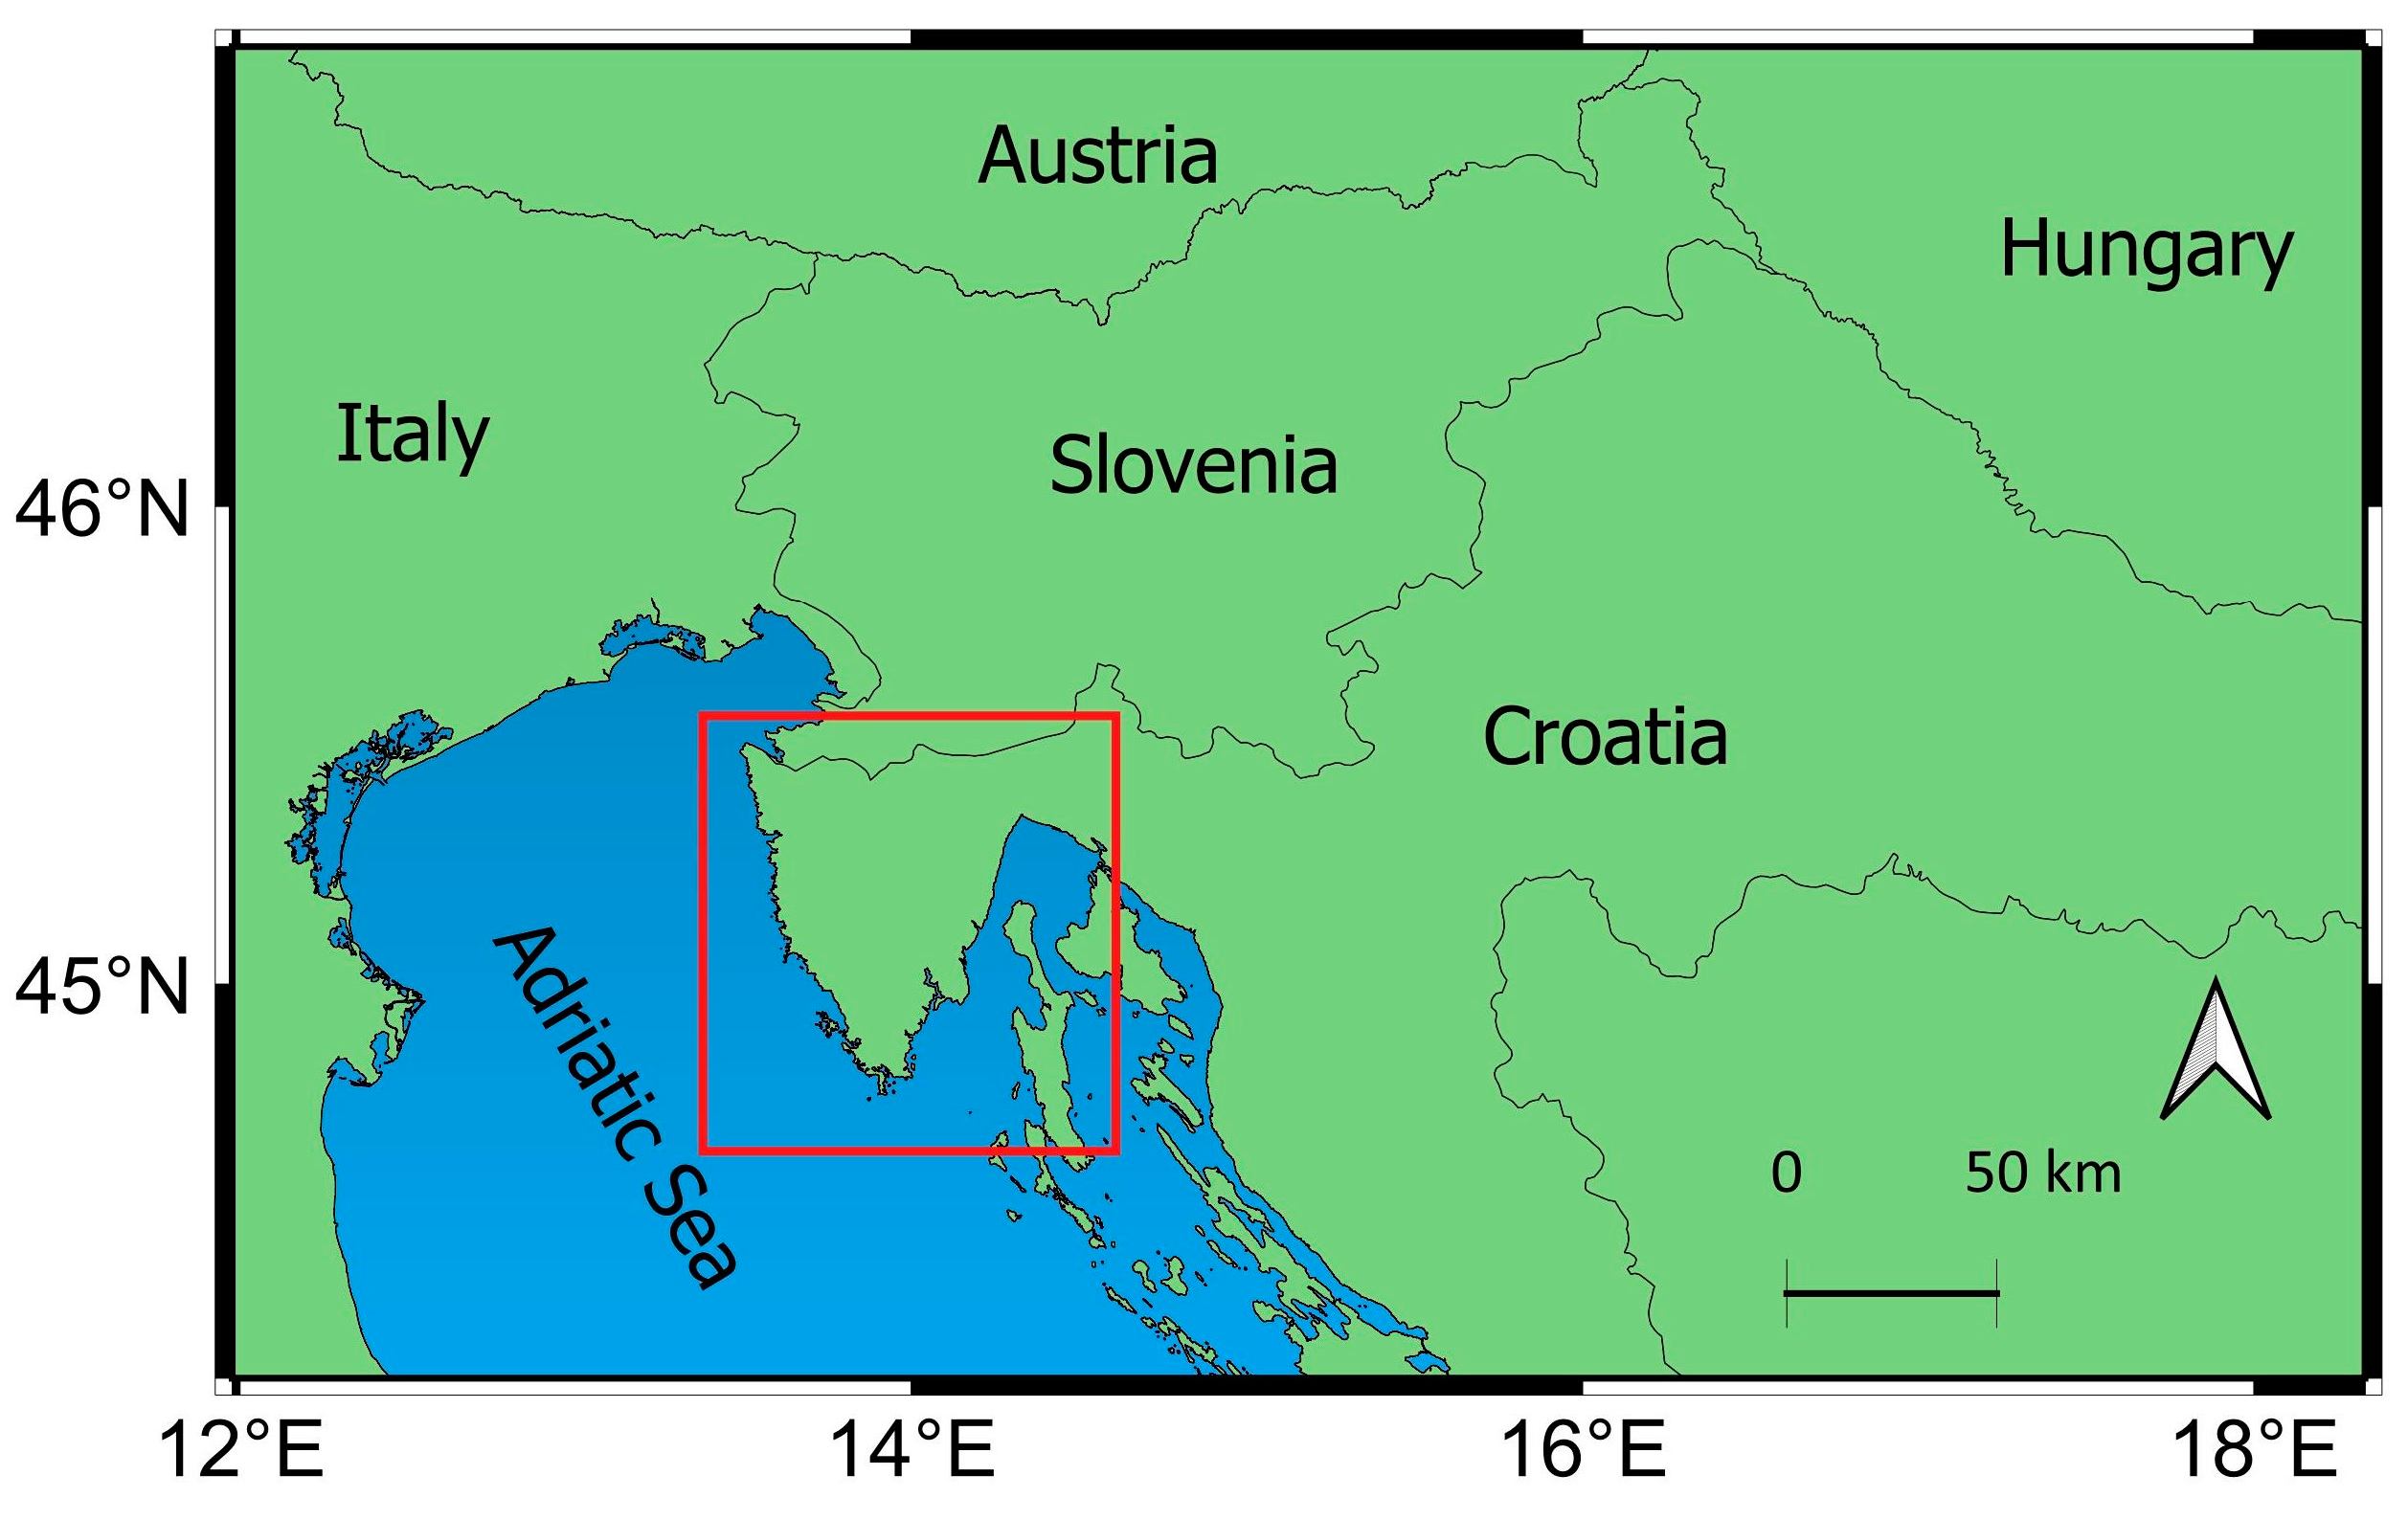
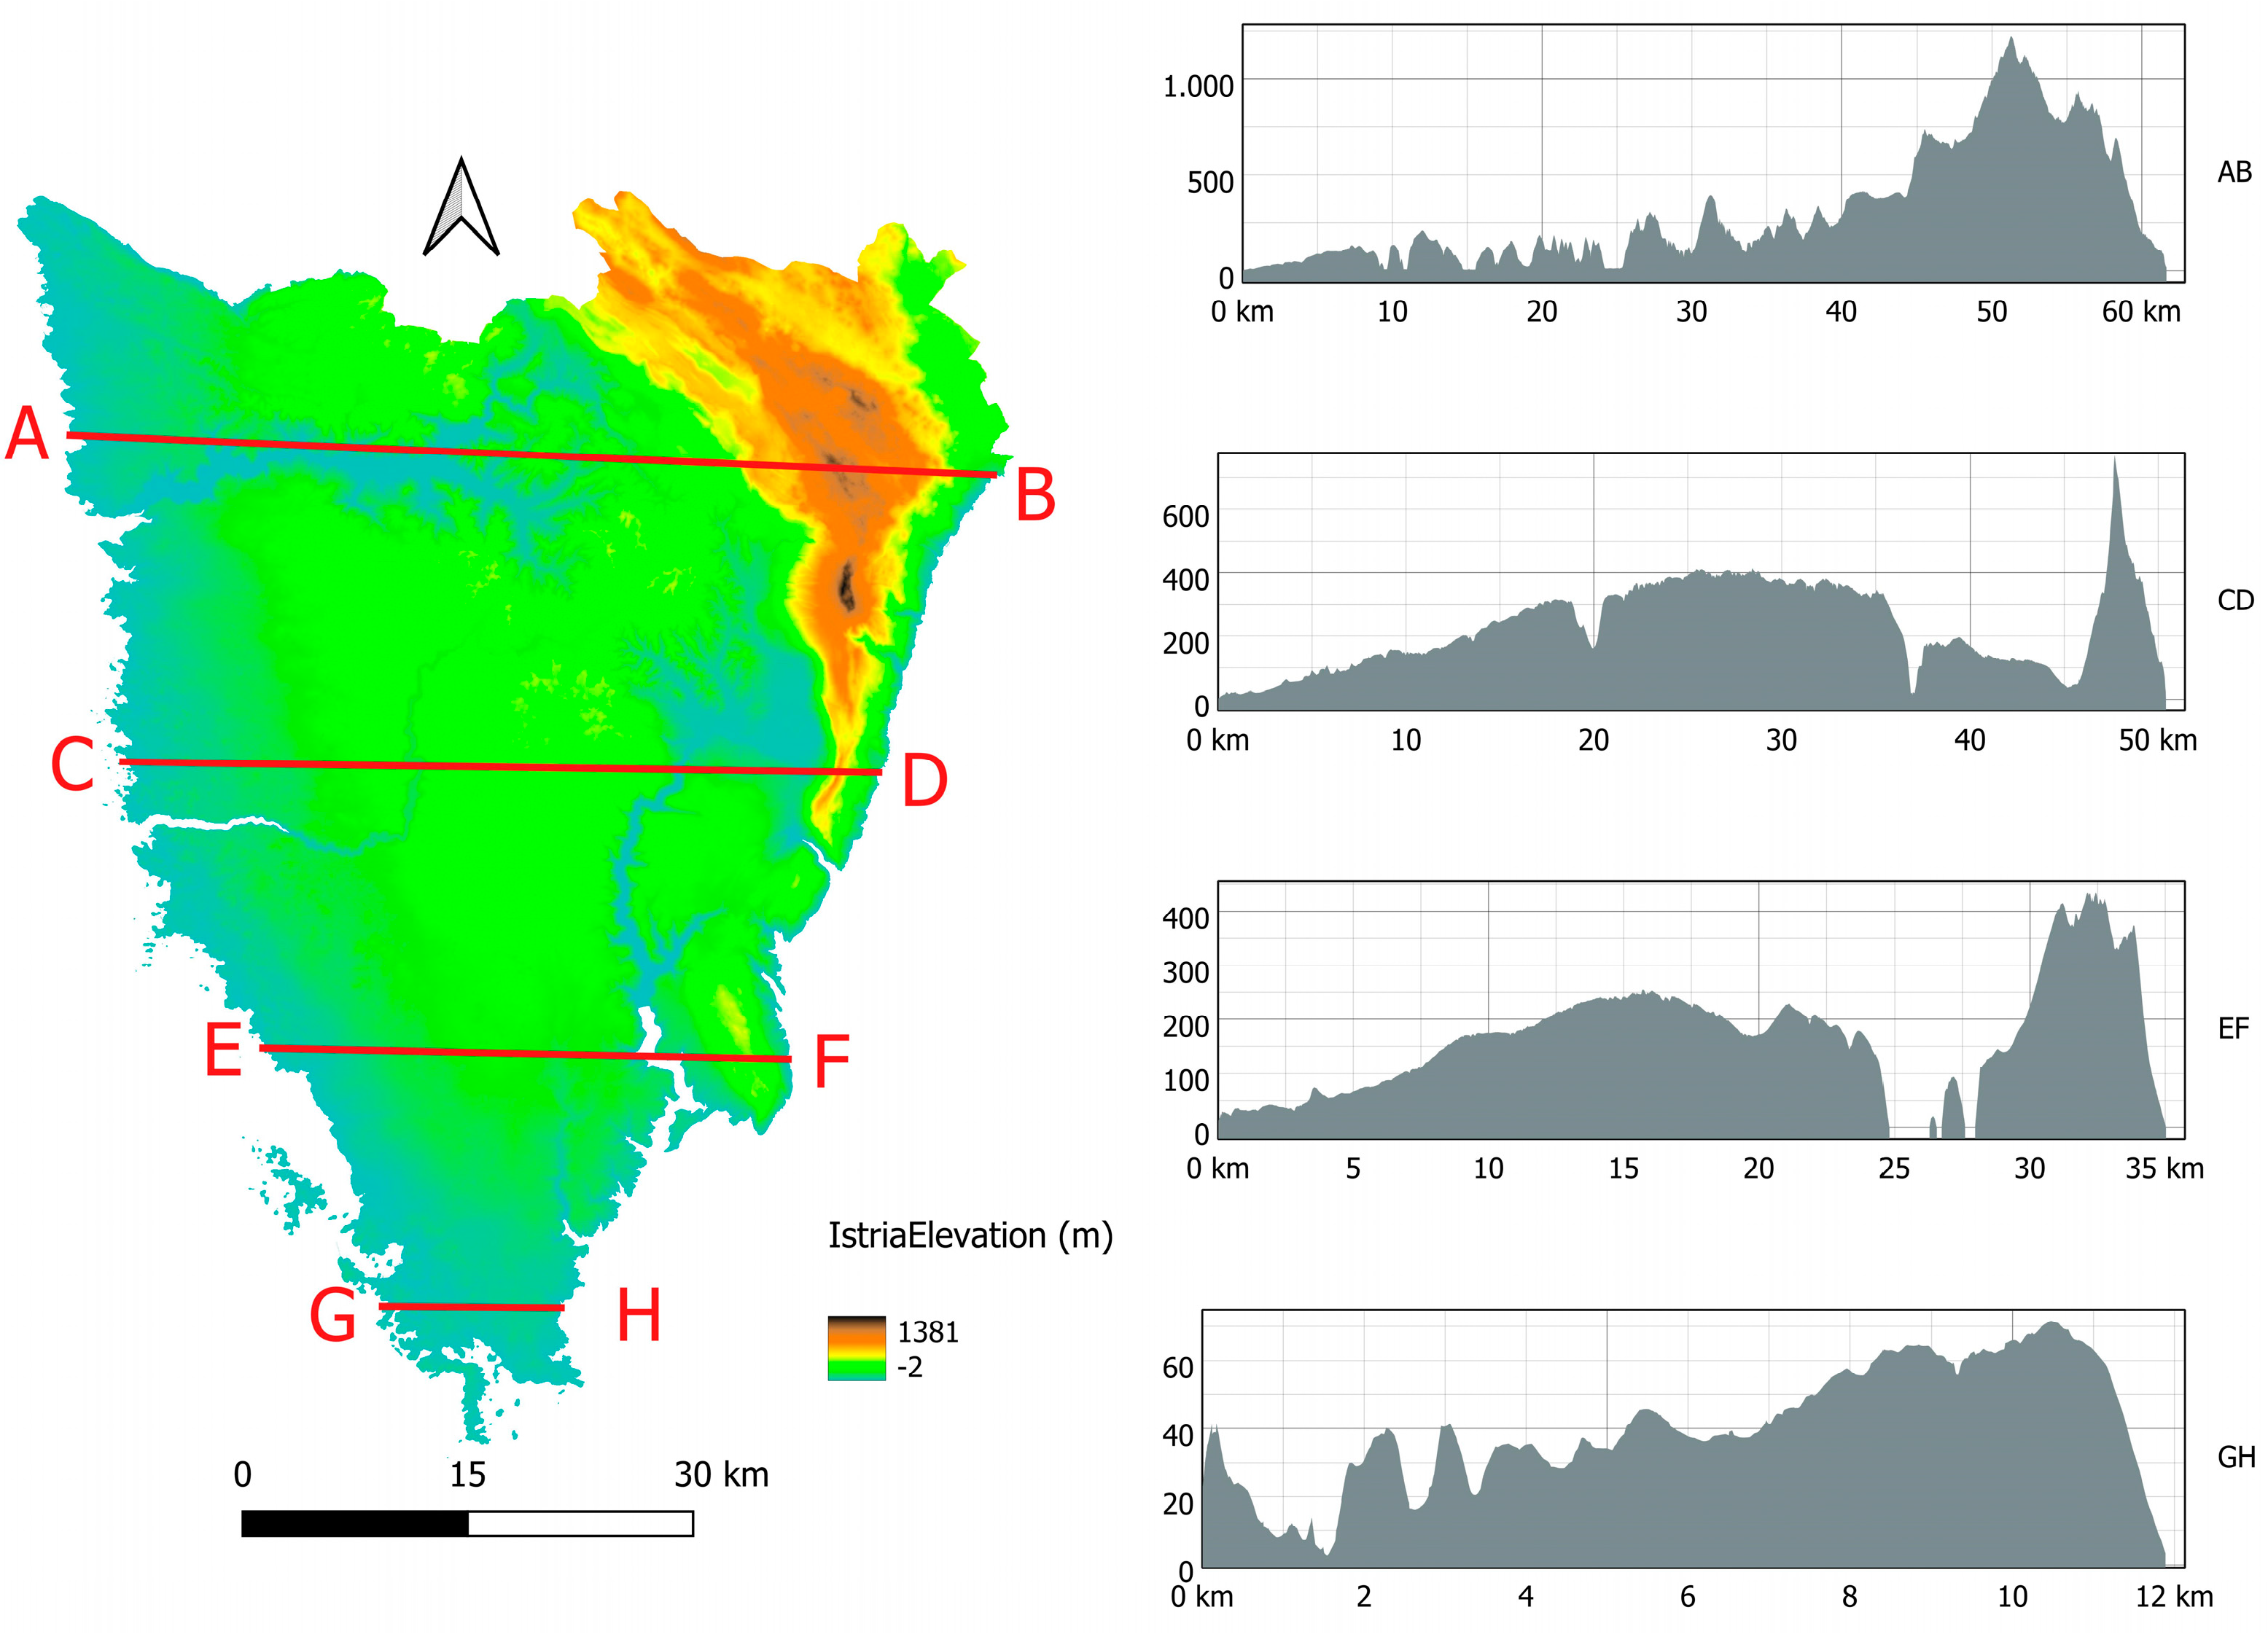
2.1. Study Area
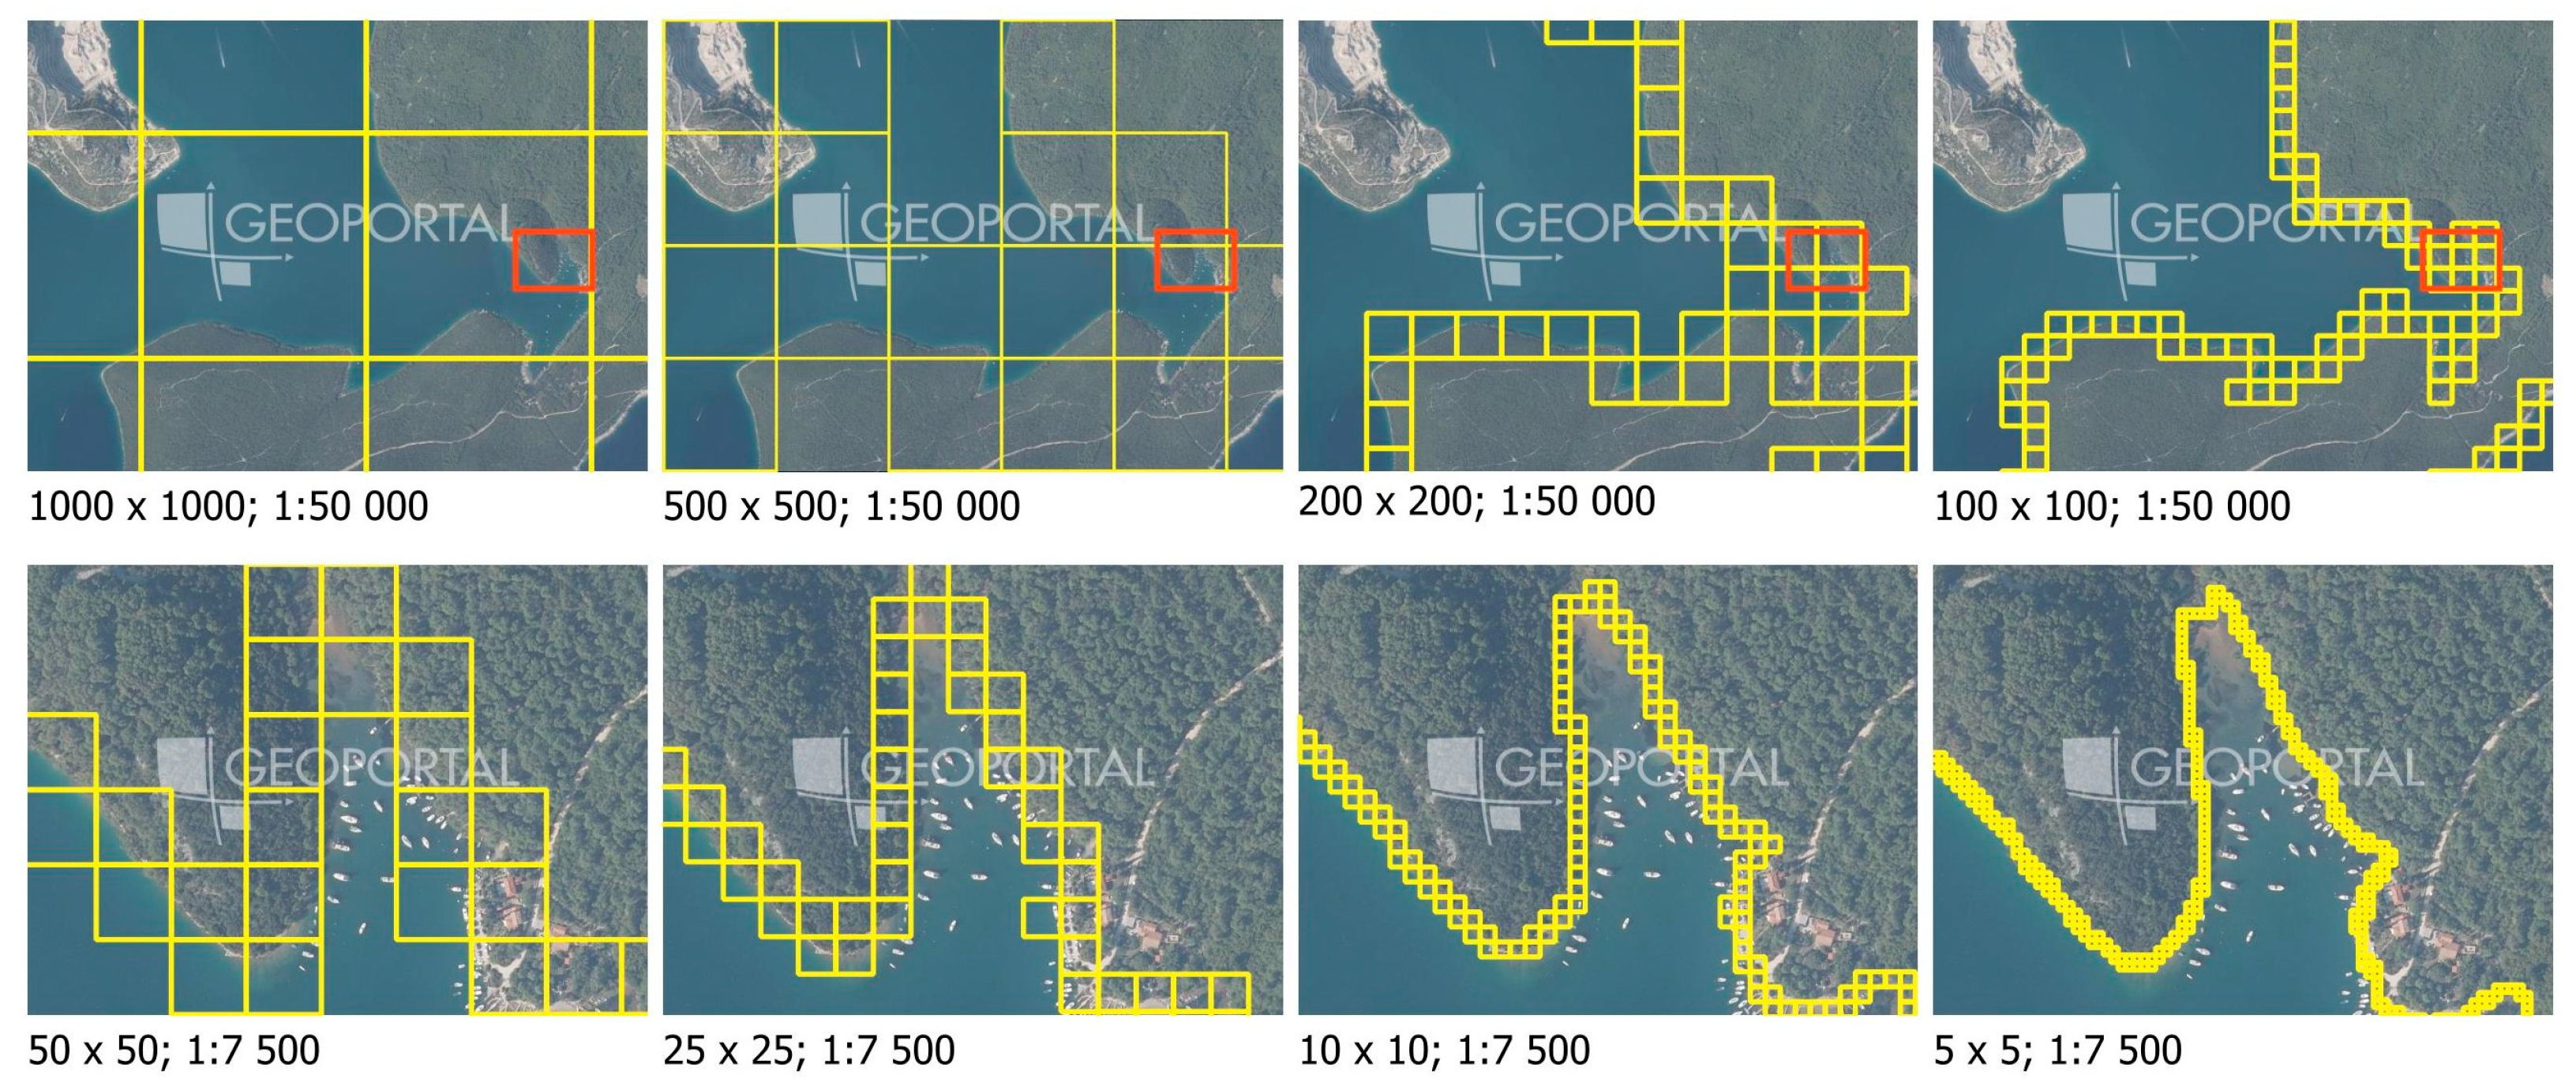
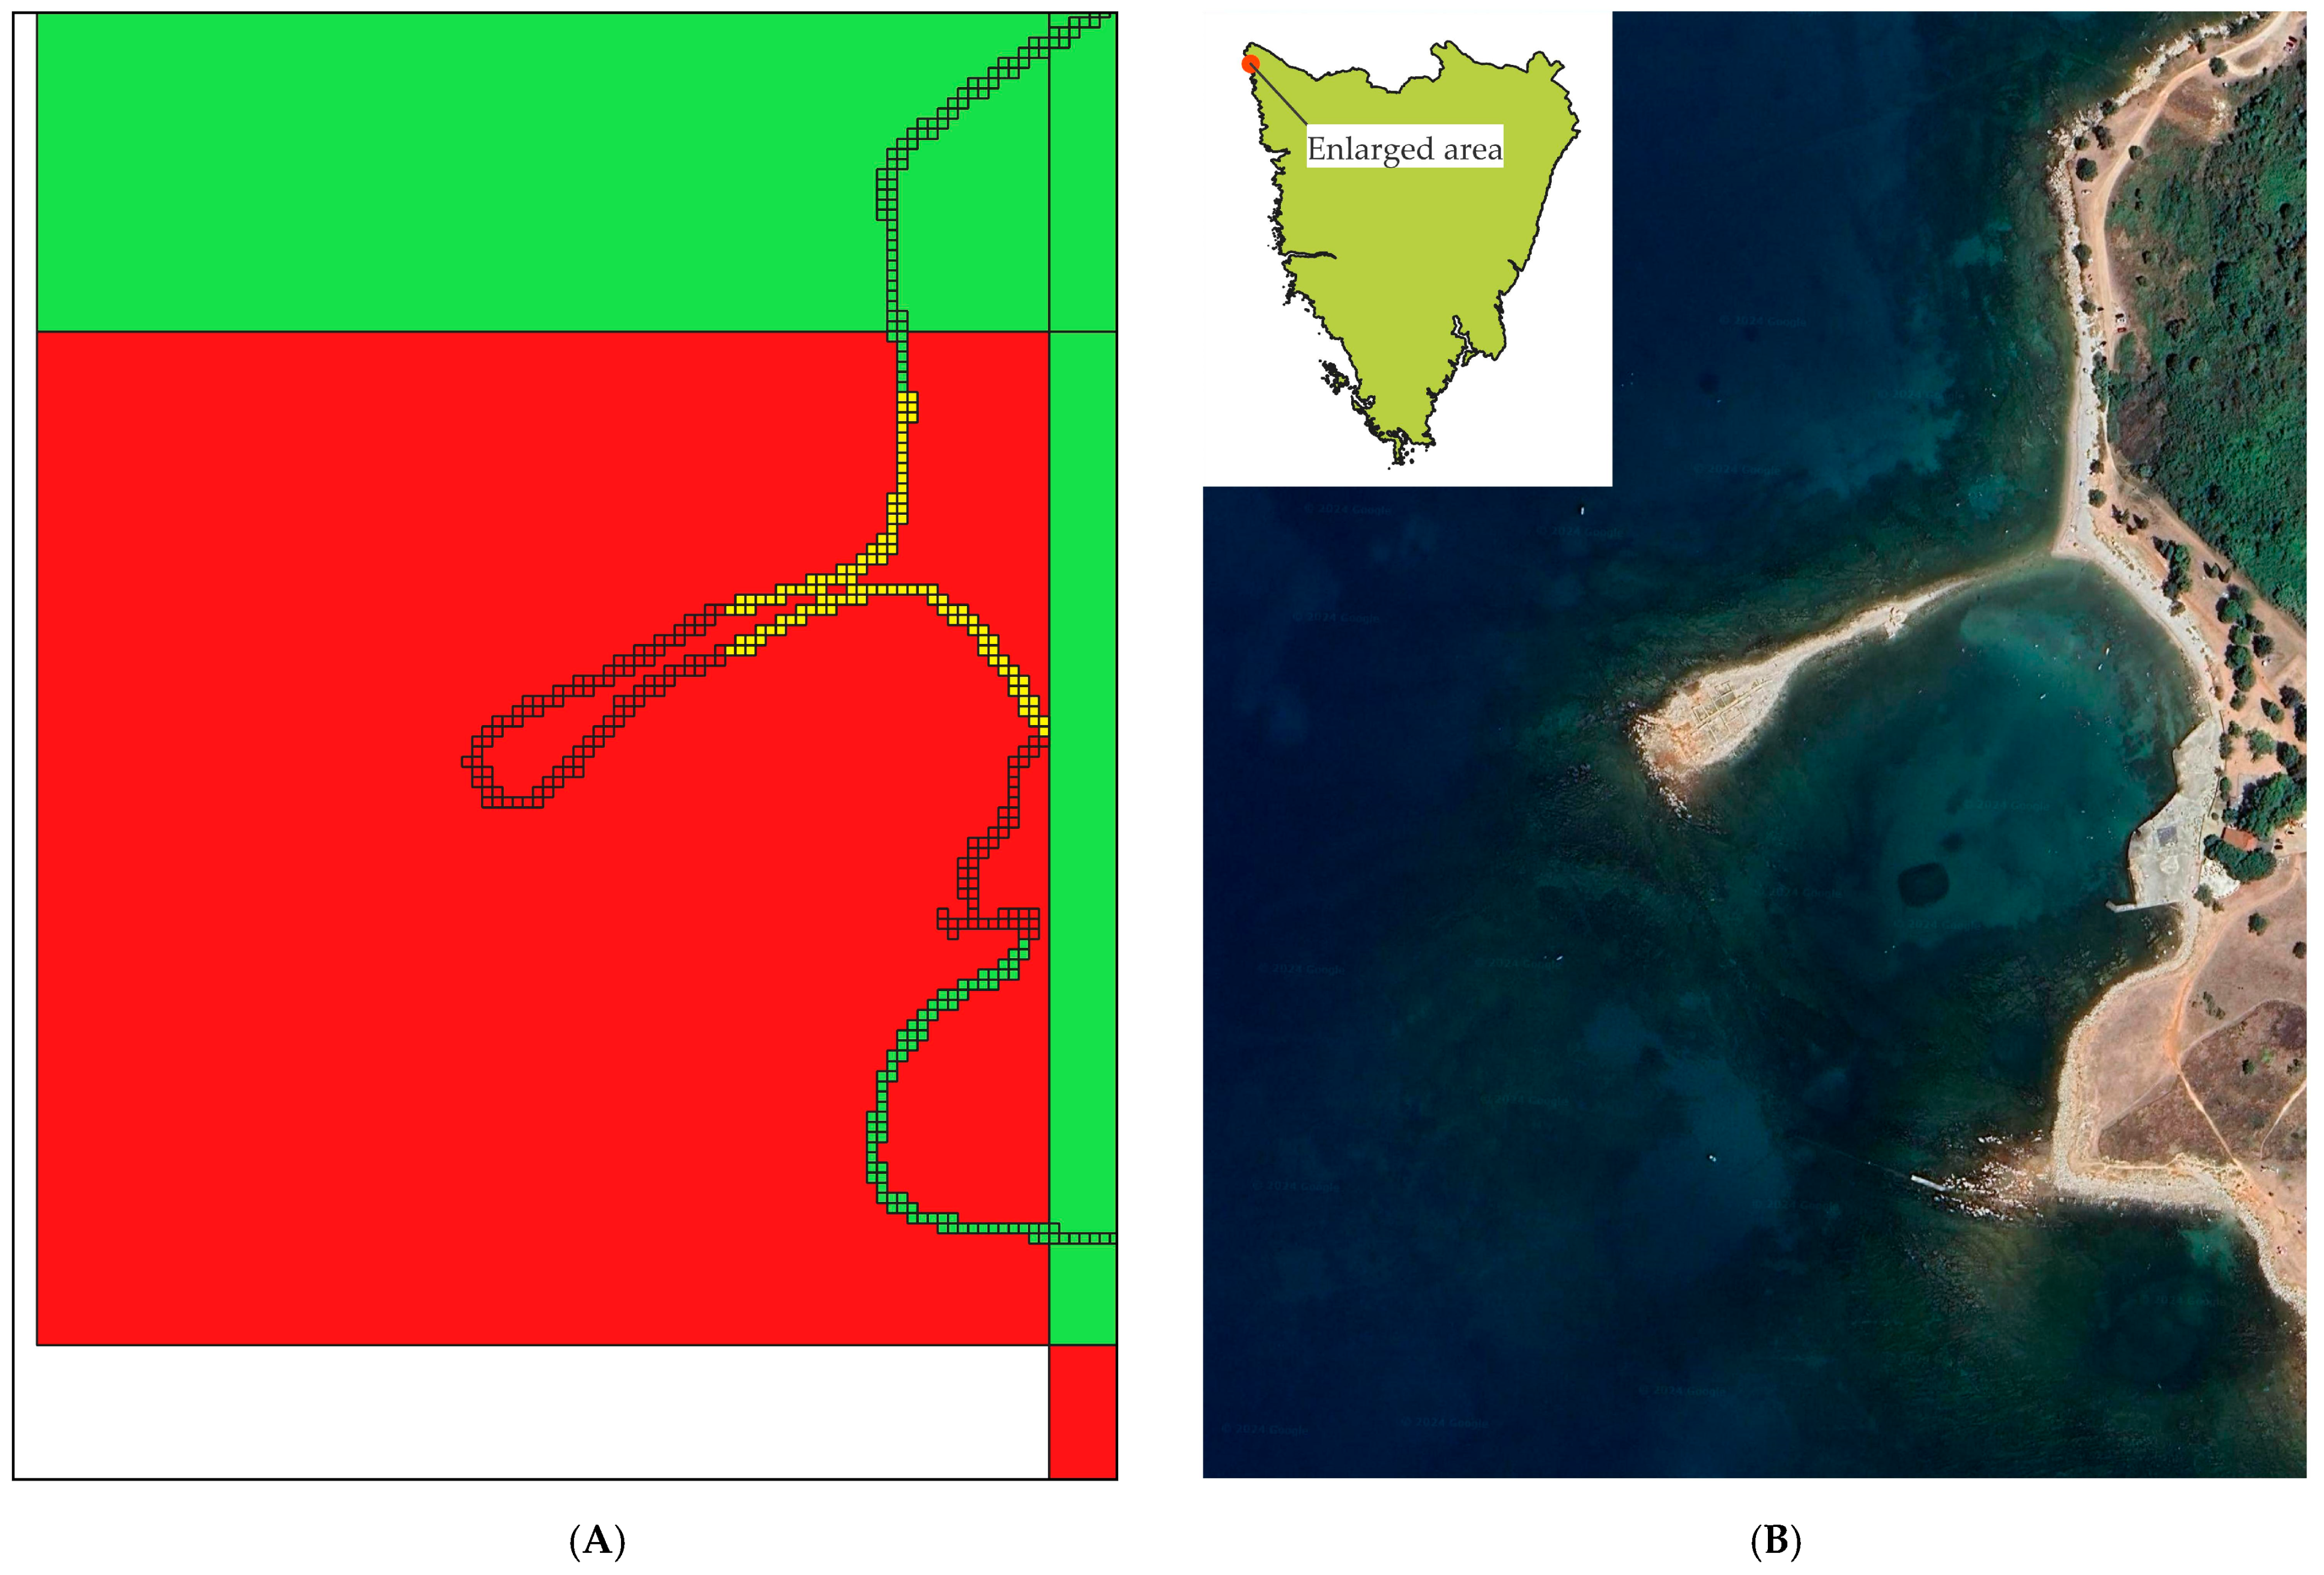
2.2. Grid Cell Creation
2.3. Optimising PCVI Calculation: Methodological Analysis and Justification
- PCVI—Physical Coastal Vulnerability Index
- A—Coastal Aspect
- S—Coastal Slope
- H—Coastal Height
- T—Coastal Type
- aa—Mean Coastal Aspect Rank Level
- as—Mean Coastal Slope Rank Level
- ah—Mean Coastal Height Rank Level
- at—Mean Coastal Type Rank Level
- ta—Mean Rank Level of all Coastal Physical Variables
2.4. Morphometry and Morphology Analysis
2.4.1. Coastal Slope
2.4.2. Coastal Aspect
2.4.3. Coastal Height
2.4.4. Coastal Type
2.4.5. Physical Coastal Vulnerability Index (PCVI) Calculation
3. Results and Discussion
3.1. PCVI Calculation Method
3.2. Cell Dimensions
3.2.1. Coastal Aspect Example
3.2.2. Coastal Slope Example
3.2.3. Coastal Height Example
3.2.4. Coastal Type Example
3.2.5. PCVI Example
3.3. Physical Coastal Vulnerability Index
3.4. Assessment of Results and Implications
4. Conclusions
Author Contributions
Funding
Data Availability Statement
Conflicts of Interest
References
- Kaniewski, D.; Marriner, N.; Morhange, C.; Faivre, S.; Otto, T.; Van Campo, E. Solar pacing of storm surges, coastal flooding and agricultural losses in the Central Mediterranean. Sci. Rep. 2016, 6, 25197. [Google Scholar] [CrossRef]
- Faivre, S.; Bakran-Petricioli, T.; Kaniewski, D.; Marriner, N.; Tomljenović, B.; Sečanj, M.; Horvatić, D.; Barešić, J.; Morhange, C.; Drysdale, R.N. Driving processes of relative sea-level change in the Adriatic during the past two millennia: From local tectonic movements in the Dubrovnik archipelago (Jakljan and Šipan islands) to global mean sea level contributions (Central Mediterranean). Glob. Planet. Change 2023, 227, 104158. [Google Scholar] [CrossRef]
- Parete, G.; Bruno, M.F.; Calabrese, P.; Carlucci, R.; Chiarulli, M.; D’Onghia, G.; Fiore, A.; Fratino, U.; Longo, C.; Longo, F.; et al. Climate impacts and adaptation strategies for coastal erosion, aquaculture, and tourism along the Adriatic side of Apulia region. Front. Clim. 2024, 6, 1378253. [Google Scholar] [CrossRef]
- Bevacqua, A.; Yu, D.; Zhang, Y. Coastal vulnerability: Evolving concepts in understanding vulnerable people and places. Environ. Sci. Policy 2018, 82, 19–29. [Google Scholar] [CrossRef]
- Furlan, E.; Pozza, P.D.; Michetti, M.; Torresan, S.; Critto, A.; Marcomini, A. Development of a Multi-Dimensional Coastal Vulnerability Index: Assessing vulnerability to inundation scenarios in the Italian coast. Sci. Total Environ. 2021, 772, 144650. [Google Scholar] [CrossRef]
- Mani Murali, R.; Ankita, M.; Amrita, S.; Vethamony, P. Coastal vulnerability assessment of Puducherry coast, India, using the analytical hierarchical process. Nat. Hazards Earth Syst. Sci. 2013, 13, 3291–3311. [Google Scholar] [CrossRef]
- McLaughlin, S.; Cooper, J.A.G. A multi-scale coastal vulnerability index: A tool for coastal managers? Environ. Hazards 2010, 9, 233–248. [Google Scholar] [CrossRef]
- Palmer, B.J.; Van der Elst, R.; Mackay, F.; Mather, A.; Smith, A.; Bundy, S.; Thackeray, Z.; Leuci, R.; Parak, O. Preliminary coastal vulnerability assessment for KwaZulu-Natal, South Africa. J. Coast. Res. 2011, 7, 1390–1395. [Google Scholar]
- Ramnalis, P.; Batzakis, D.V.; Karymbalis, E. Applying two methodologies of an Integrated Coastal Vulnerability Index (ICVI) to future sea-level rise. Case study: Southern coast of the Gulf of Corinth, Greece. Geoadria 2023, 28, 7–24. [Google Scholar] [CrossRef]
- Ružić, I.; Benac, Č. Ranjivost obala otoka Raba zbog rasta razine mora. Hrvat. Vode 2016, 24, 203–214. [Google Scholar]
- Szlafsztein, C.; Sterr, H. A GIS-based vulnerability assessment of coastal natural hazards, state of Pará, Brazil. J. Coast. Conserv. 2007, 11, 53–66. [Google Scholar] [CrossRef]
- Tragaki, A.; Gallousi, C.; Karymbalis, E. Coastal Hazard Vulnerability Assessment Based on Geomorphic, Oceanographic and Demographic Parameters: The Case of the Peloponnese (Southern Greece). Land 2018, 7, 56. [Google Scholar] [CrossRef]
- Lončar, N. Geomorfologija. In Istarska enciklopedija; Bertoša, M., Matijašić, R., Eds.; Leksikografski zavod Miroslav Krleža: Zagreb, Croatia, 2005; pp. 249–252. ISBN 953-6036-83-5. [Google Scholar]
- Šimac, Z.; Lončar, N.; Faivre, S. Overview of Coastal Vulnerability Indices with Reference to Physical Characteristics of the Croatian Coast of Istria. Hydrology 2023, 10, 14. [Google Scholar] [CrossRef]
- Laino, E.; Iglesias, G. Extreme climate change hazards and impacts on European coastal cities: A review. Renew. Sustain. Energy Rev. 2023, 184, 113587. [Google Scholar] [CrossRef]
- Šepić, J.; Pasarić, M.; Međugorac, I.; Vilibić, I.; Karlović, M.; Mlinar, M. Climatology and process-oriented analysis of the Adriatic sea level extremes. Prog. Oceanogr. 2022, 209, 102908. [Google Scholar] [CrossRef]
- Međugorac, I.; Orlić, M.; Janeković, I.; Pasarić, Z.; Pasarić, M. Adriatic storm surges and related cross-basin sea-level slope. J. Mar. Syst. 2018, 181, 79–90. [Google Scholar] [CrossRef]
- DZS. Bruto Domaći Proizvod za Republiku Hrvatsku, hr_Nuts 2021.–hr Nuts 2 i Županije u 2021. 2024. Available online: https://podaci.dzs.hr/2024/hr/77029 (accessed on 26 October 2024).
- MRRFEU Indeks Razvijenosti. Available online: https://razvoj.gov.hr/o-ministarstvu/regionalni-razvoj/indeks-razvijenosti/112 (accessed on 10 August 2024).
- DZS. Turizam u 2023. 2024. Available online: https://podaci.dzs.hr/media/pt0dpwn5/si-1731_turizam-u-2023.pdf (accessed on 24 October 2024).
- Kranjčević, J.; Hajdinjak, S. Tourism Urbanization in Croatia. The Cases of Poreč in Istria and Makarska in Dalmatia. Südosteuropa 2019, 67, 393–420. [Google Scholar] [CrossRef]
- Gornitz, V. Global coastal hazards from future sea level rise. Palaeogeogr Palaeoclim. Palaeoecol Glob. Planet Change Sect 1991, 89, 379–398. [Google Scholar] [CrossRef]
- Nicholls, R.J. Impacts of and Responses to Sea-Level Rise. In Understanding Sea-Level Rise and Variability; Church, J.A., Woodworth, P.L., Aarup, T., Wilson, W.S., Eds.; Wiley-Blackwell: Oxford, UK, 2010; pp. 17–51. ISBN 978-1-4443-2327-6. [Google Scholar]
- QGIS.org. QGIS Geographic Information System. 2025. Available online: http://www.qgis.org (accessed on 28 February 2025).
- Uhač, I.K. Klasifikacija lučkog sustava rimske Histrije the classification of the system of ports of Roman Histria. Histria Archaeol. 2022, 53, 165–213. [Google Scholar]
- Baric, A.; Grbec, B.; Bogner, D. Potential Implications of Sea-Level Rise for Croatia. J. Coast. Res. 2008, 242, 299–305. [Google Scholar] [CrossRef]
- DZS. 2021 Census, Croat. Bur. Stat. (n.d.). Available online: https://dzs.gov.hr/naslovna-blokovi/u-fokusu/popis-2021/88 (accessed on 16 December 2022).
- DGU. Podaci i Servisi Državne Geodetske Uprave, Podaci Servisi Državne Geod. Uprave. 2024. Available online: https://geoportal.dgu.hr/#/menu/podaci-i-servisi (accessed on 10 August 2024).
- Koroglu, A.; Ranasinghe, R.; Jiménez, J.A.; Dastgheib, A. Comparison of Coastal Vulnerability Index applications for Barcelona Province. Ocean Coast. Manag. 2019, 178, 104799. [Google Scholar] [CrossRef]
- Ursu, A.; Chelaru, D.-A.; Mihai, F.-C.; Iordache, I. Anthropogenic landform modeling using gis techniques case study: Vrancea region. Geogr. Tech. 2011, 13, 91–100. [Google Scholar]
- Capolupo, A.; Boccia, L. Innovative method for linking anthropisation process to vulnerability. World Rev. Sci. Technol. Sustain. Dev. 2021, 17, 4–22. [Google Scholar] [CrossRef]
- Hammar-Klose, E.S.; Thieler, R.E. Coastal vulnerability to sea-level rise: A preliminary database for the US Atlantic coast. US Geological Survey, Coastal and Marine Geology Program. US Geol. Surv. 1999, 1. Available online: https://pubs.usgs.gov/dds/dds68/ (accessed on 28 February 2025).
- Pantusa, D.; D’Alessandro, F.; Riefolo, L.; Principato, F.; Tomasicchio, G. Application of a Coastal Vulnerability Index. A Case Study along the Apulian Coastline, Italy. Water 2018, 10, 1218. [Google Scholar] [CrossRef]
- Pendleton, E.A. Coastal Vulnerability Assessment of the Northern Gulf of Mexico to Sea-Level Rise and Coastal Change; US Geological Survey: Reston, VA, USA, 2010.
- GDAL/OGR Contributors GDAL/OGR Geospatial Data Abstraction Software Library; Open Source Geospatial Foundation: Beaverton, OR, USA, 2025. [CrossRef]
- I.G.U. IGU Commission on Applied Geomorphology, Subcommission on Geomorphological Mapping, The unified key to the detailed geomorphological map of the World 1: 25,000–1: 50,000. Folia Geogr. Ser. Geogr. Phys. 1968, 2. [Google Scholar]
- Zaninović, K. Klimatski Atlas Hrvatske Climate Atlas of Croatia: 1961–1990: 1971–2000; Državni hidrometeorološki zavod: Zagreb, Croatia, 2008; ISBN 978-953-7526-01-6. [Google Scholar]
- Summary for Policymakers. In Climate Change 2007: The Physical Science Basis. Contribution of Working Group I to the Fourth Assessment Report of the Intergovernmental Panel on Climate Change; Qin, S., Manning, M., Chen, Z., Marquis, M., Averyt, K.B., Tignor, M., Mill, H.L., Eds.; Cambridge University Press: Cambridge, UK; New York, NY, USA, 2018. [Google Scholar]
- Slangen, A.B.A.; Katsman, C.A.; Van De Wal, R.S.W.; Vermeersen, L.L.A.; Riva, R.E.M. Towards regional projections of twenty-first century sea-level change based on IPCC SRES scenarios. Clim. Dyn. 2012, 38, 1191–1209. [Google Scholar] [CrossRef]
- Orlić, M.; Pasarić, Z. Semi-empirical versus process-based sea-level projections for the twenty-first century. Nat. Clim. Change 2013, 3, 735–738. [Google Scholar] [CrossRef]
- Faivre, S. Geomorfološka obilježja hrvatske jadranske obale. In Velika Geografija Hrvatske—Knjiga 2.—Fizička Geografija Hrvatske—Prirodno-Geografska Osnova Razvoja; Školska knjiga: Zagreb, Croatia, 2023; Volume 2, p. 728. [Google Scholar]
- Benac, Č.; Tadić, A.; Petrović, V.; Jakupović, D.; Ljubičić, G.; Krvavica, N.; Ružić, I. Vulnerability of Krk Island Coasts. Hrvat. Vode 2021, 29, 187–200. [Google Scholar]
- Purnawan, S.; Setiawan, I.; Haridhi, H.A.; Irham, M. Granulometric analysis at Lampulo Fishing Port (LFP) substrate, Banda Aceh, Indonesia. IOP Conf. Ser. Earth Environ. Sci. 2018, 106, 012070. [Google Scholar] [CrossRef]
- Googlemap, Zambratija—Kaštel Sipar. 2025. Available online: https://www.google.com/maps/@45.4680288,13.5080899,462m/data=!3m1!1e3?entry=ttu&g_ep=EgoyMDI1MDIxOS4xIKXMDSoJLDEwMjExNDUzSAFQAw%3D%3D (accessed on 25 February 2025).
- Ružić, I.; Dugonjić Jovančević, S.; Benac, Č.; Krvavica, N. Assessment of the Coastal Vulnerability Index in an Area of Complex Geological Conditions on the Krk Island, Northeast Adriatic Sea. Geosciences 2019, 9, 219. [Google Scholar] [CrossRef]
- Theocharidis, C.; Doukanari, M.; Kalogirou, E.; Christofi, D.; Mettas, C.; Kontoes, C.; Hadjimitsis, D.; Argyriou, A.V.; Eliades, M. Coastal Vulnerability Index (CVI) Assessment: Evaluating Risks Associated with Human-Made Activities along the Limassol Coastline, Cyprus. Remote Sens. 2024, 16, 3688. [Google Scholar] [CrossRef]
- Kantamaneni, K. Coastal infrastructure vulnerability: An integrated assessment model. Nat. Hazards 2016, 84, 139–154. [Google Scholar] [CrossRef]
- Vujčić, J. Analiza Plavljenja Hrvatskih Obalnih Naselja (Analysis of Flooding in Croatian Coastal Settlements). Ph.D. Thesis, University of Zadar, Zadar, Croatia, 2024. [Google Scholar]
- Mohamad, M.F.; Lee, L.H.; Samion, M.K.H. Coastal Vulnerability Assessment towards Sustainable Management of Peninsular Malaysia Coastline. Int. J. Environ. Sci. Dev. 2014, 5, 533–538. [Google Scholar] [CrossRef]
- Özyurt, G.; Ergin, A. Application of Sea Level Rise Vulnerability Assessment Model to Selected Coastal Areas of Turkey. In Proceedings of the 10th International Coastal Symposium ICS 2009, Lisboa, Portugal, 13–18 April 2009; pp. 248–251. [Google Scholar]
- Marić, I.; Peer, M.; Čipak, A.; Kobaš, K.; Šiljeg, A.; Krvavica, N. Integrated coastal vulnerability index for coastal flooding: A case study of the Croatian coast. Environ. Sustain. Indic. 2024, 24, 100514. [Google Scholar] [CrossRef]
- Croatian Waters, The Register of Flood Events, VGO for Northern Adriatic Basins and VGO for Southern Adriatic Basins Registar Poplavnih Događaja, Regist. Poplavnih Događ. 2021. Available online: https://www.voda.hr/hr/registar-poplavnih-dogadaja (accessed on 26 April 2021).
- Laino, E.; Toledo, I.; Aragonés, L.; Iglesias, G. A novel multi-hazard risk assessment framework for coastal cities under climate change. Sci. Total Environ. 2024, 954, 176638. [Google Scholar] [CrossRef]


| Rank | Coastal Slope (°) | Coastal Aspect (°) | Coastal Height (m) | Type |
|---|---|---|---|---|
| 1 | >32 | 180–225 | >0.60 | High rocky coast (>40°) |
| 2 | 12–32 | 135–180 and 225–270 | 0.45–0.60 | Low rocky coast (<40°) |
| 3 | 5–12 | 90–135 and 270–315 | 0.30–0.45 | Low coast in clastic sediment (coarse-grained sediment) |
| 4 | 2–5 | 45–90 and 315–360 | 0.15–0.30 | Low coast in clastic sediment (fine-grained sediment) |
| 5 | 0–2 | 0–45 | 0.0–0.15 | Anthropogenically modified coast |
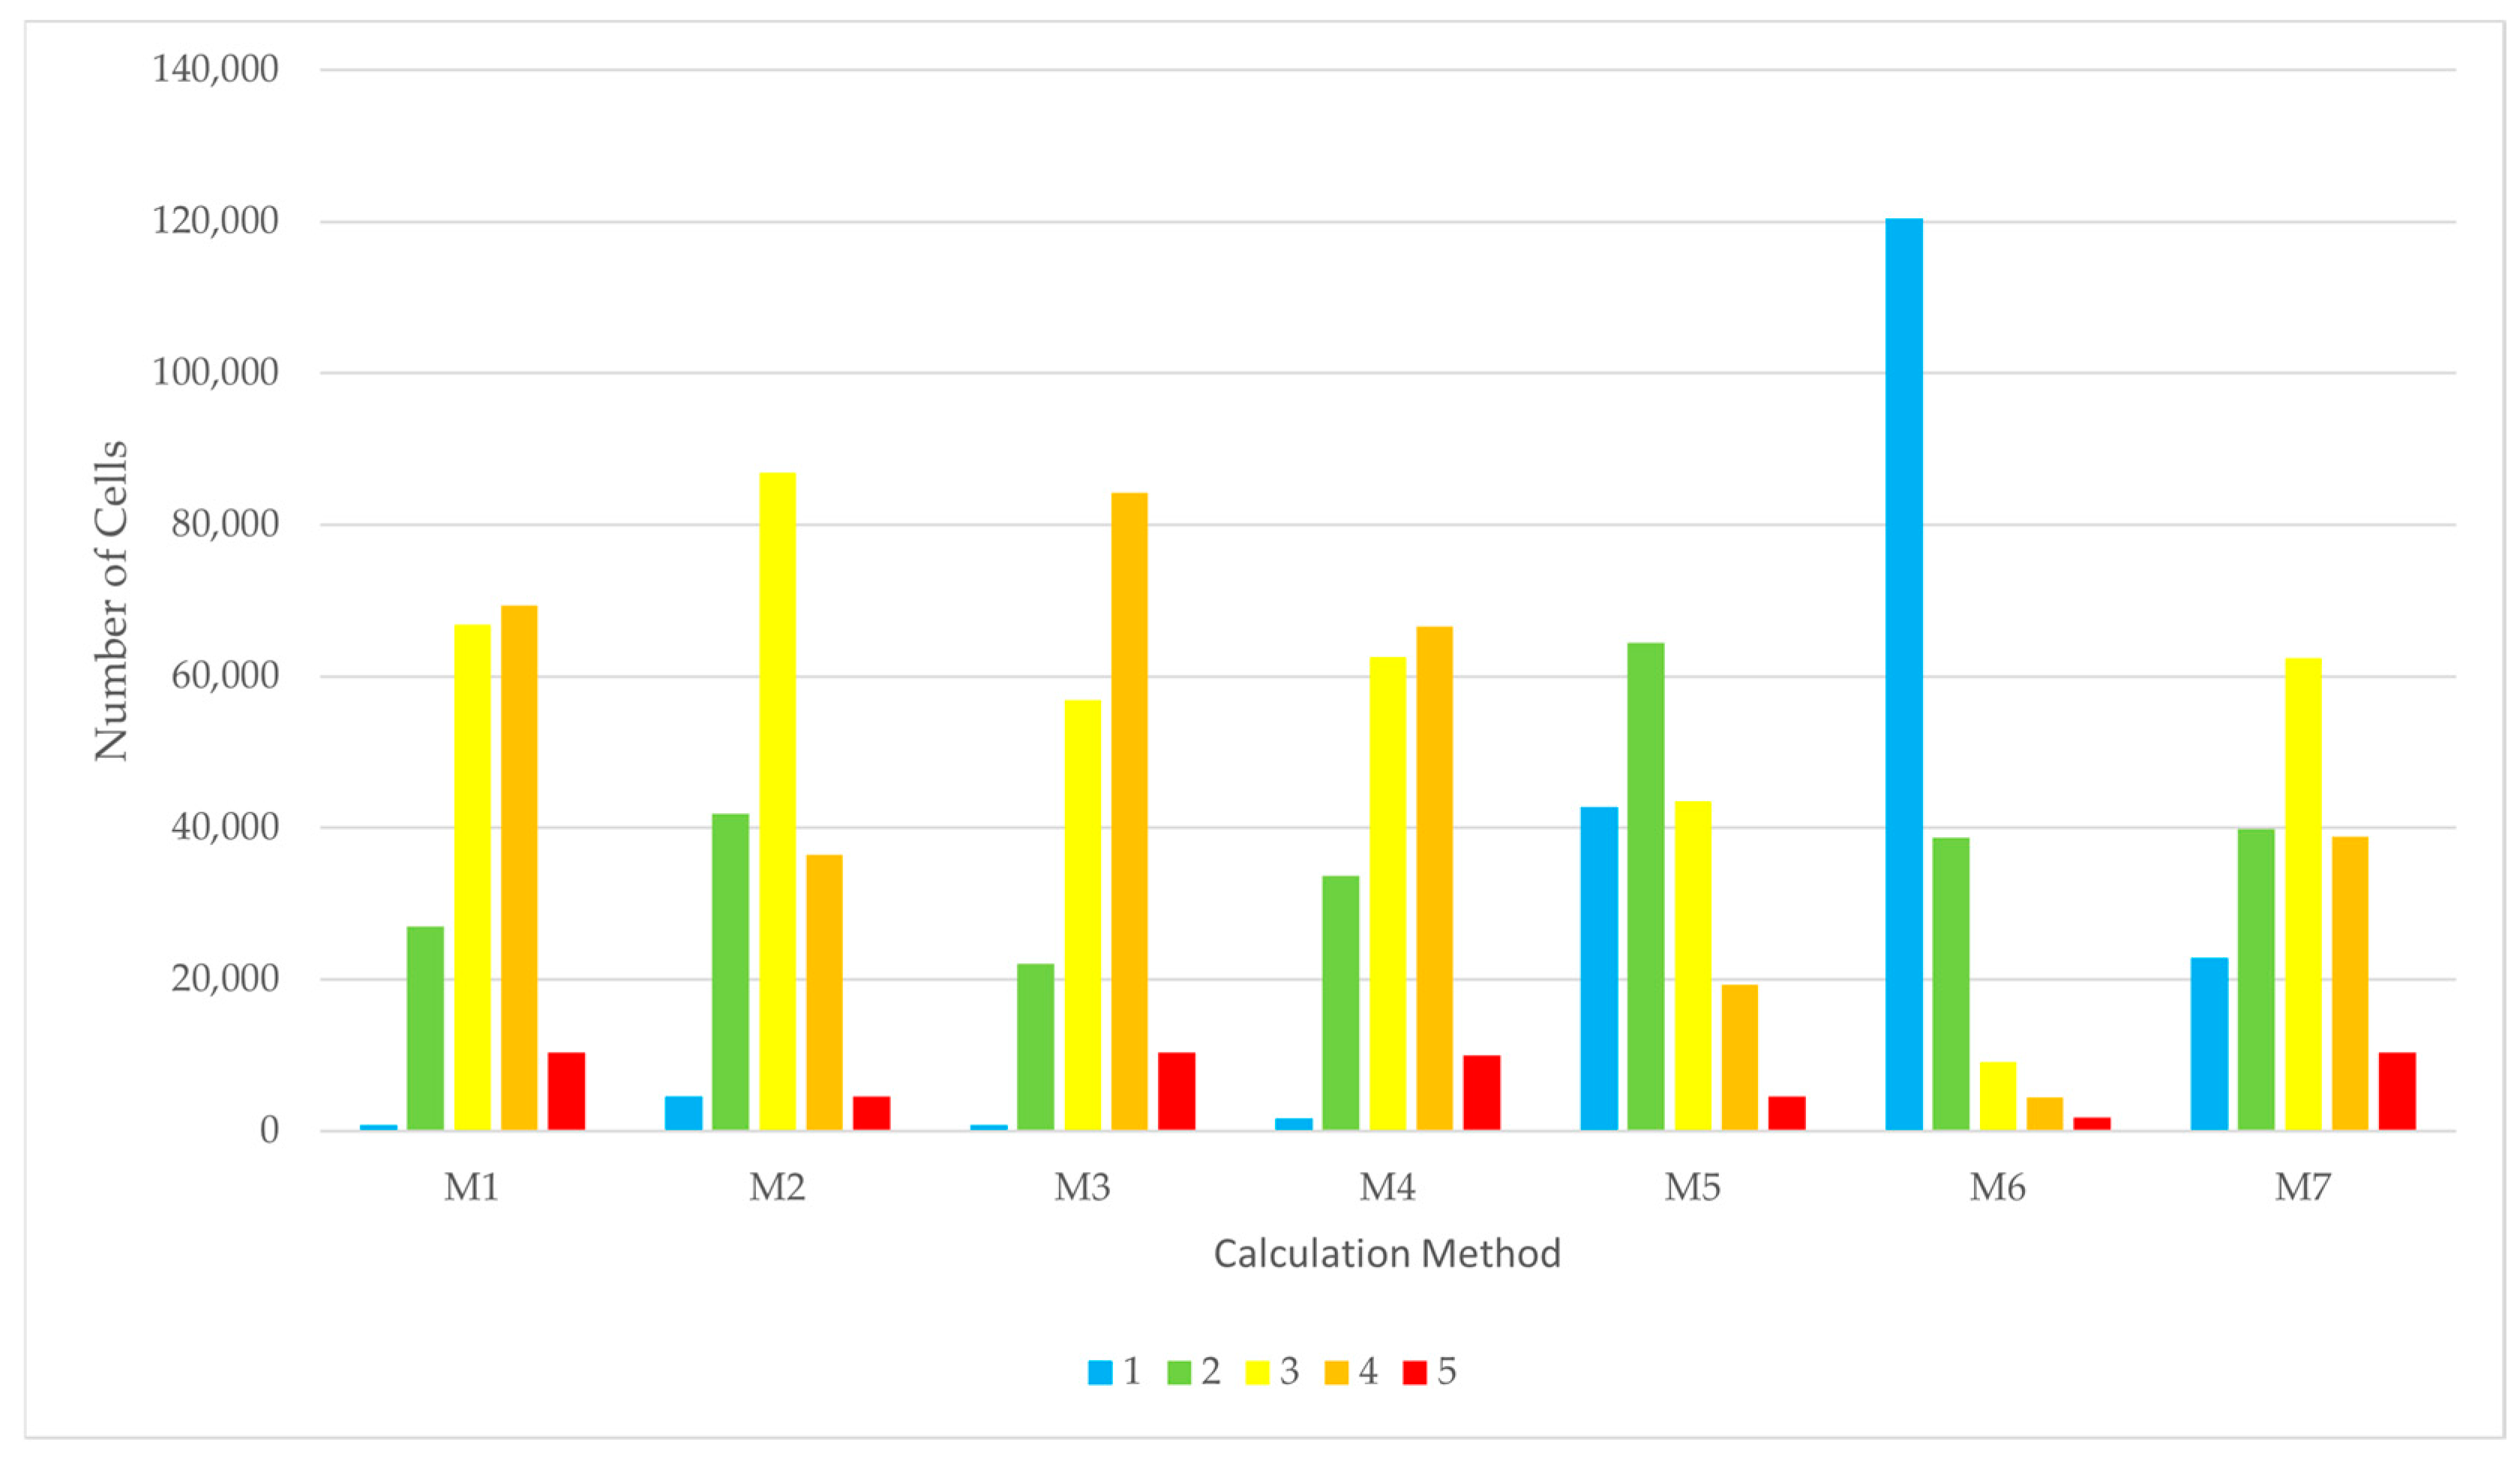
| M1 | M2 | M3 | M4 | M5 | M6 | M7 | |
|---|---|---|---|---|---|---|---|
| 1 | 0.44% | 2.65% | 0.44% | 0.95% | 24.48% | 69.04% | 13.12% |
| 2 | 15.49% | 24.03% | 12.68% | 19.28% | 36.91% | 22.20% | 22.82% |
| 3 | 38.34% | 49.80% | 32.62% | 35.89% | 24.97% | 5.22% | 35.79% |
| 4 | 39.77% | 20.93% | 48.30% | 38.14% | 11.04% | 2.53% | 22.30% |
| 5 | 5.97% | 2.59% | 5.97% | 5.75% | 2.59% | 1.02% | 5.97% |
| Total | 100.00% | 100.00% | 100.00% | 100.00% | 100.00% | 100.00% | 100.00% |
| Coastal Type | Coastal Aspect | Coastal Slope | Coastal Height | Vulnerability Rank | |
|---|---|---|---|---|---|
| M1 | 2.93 | 2.68 | 3.58 | 3.73 | 3.35 |
| M2 | 2.97 | ||||
| M3 | 3.47 | ||||
| M4 | 3.28 | ||||
| M5 | 2.30 | ||||
| M6 | 1.44 | ||||
| M7 | 2.85 |
| Input Variable Vulnerability Rank | Calculation Method | |||||||||
|---|---|---|---|---|---|---|---|---|---|---|
| V1 | V2 | V3 | V4 | M1 | M2 | M3 | M4 | M5 | M6 | M7 |
| 1 | 1 | 1 | 5 | 2 | 1 | 3 | 2 | 1 | 1 | 2 |
| 1 | 5 | 5 | 5 | 4 | 3 | 4 | 4 | 3 | 1 | 4 |
| 2 | 2 | 4 | 4 | 3 | 3 | 3 | 3 | 2 | 1 | 2 |
| 1 | 2 | 3 | 4 | 3 | 2 | 3 | 3 | 1 | 1 | 2 |
| 2 | 3 | 4 | 5 | 4 | 3 | 4 | 4 | 3 | 1 | 3 |
| 1 | 1 | 1 | 1 | 1 | 1 | 1 | 1 | 1 | 1 | 1 |
| 2 | 2 | 2 | 2 | 2 | 2 | 2 | 2 | 1 | 1 | 1 |
| 3 | 3 | 3 | 3 | 3 | 3 | 3 | 3 | 2 | 1 | 2 |
| 4 | 4 | 4 | 4 | 4 | 4 | 4 | 4 | 4 | 3 | 4 |
| 5 | 5 | 5 | 5 | 5 | 5 | 5 | 5 | 5 | 5 | 5 |
| Cell Description | Aspect (°) | Slope (°) | Height (m) | Type | ||||||||||
|---|---|---|---|---|---|---|---|---|---|---|---|---|---|---|
| Cell Size (m) | Number of Cells | Total Area (km2) | Min Value | Max Value | Mean Value | Min Value | Max Value | Mean Value | Min Value | Max Value | Mean Value | Min Value | Max Value | Mean Value |
| 5 × 5 | 174,410 | 4.36 | 0 | 360 | 178.22 | 0 | 78.21 | 7.37 | −0.7 | 44.38 | 0.39 | 1 | 5 | 2.93 |
| 10 × 10 | 74,521 | 7.45 | 0 | 259.99 | 181.532 | 0 | 78.25 | 6.94 | −0.601 | 36.76 | 0.52 | 1 | 5 | 2.92 |
| 25 × 25 | 28,875 | 18.05 | 0 | 359.38 | 180.63 | 0 | 70.31 | 6.73 | −0.9 | 55.03 | 1.27 | 1 | 5 | 2.89 |
| 50 × 50 | 13,940 | 34.85 | 0 | 253.19 | 180.05 | 0 | 26.35 | 4.37 | −0.92 | 66.67 | 2.29 | 1 | 5 | 2.86 |
| 100 × 100 | 6659 | 66.59 | 0 | 351.36 | 179 | 0 | 44.9 | 5.65 | −1.28 | 98.02 | 4.14 | 1 | 5 | 2.83 |
| 200 × 200 | 3115 | 124.6 | 0 | 347.14 | 178.2 | 0 | 34.27 | 5.09 | −0.93 | 114.71 | 6.95 | 1 | 5 | 2.81 |
| 500 × 500 | 1079 | 269.75 | 0 | 333.61 | 178.61 | 0 | 26.35 | 4.37 | −1.18 | 145 | 13.15 | 1 | 5 | 2.77 |
| 1000 × 1000 | 445 | 445 | 0 | 277.778 | 176.653 | 0 | 23.2 | 4.17 | −0.00023 | 227.476 | 21.51 | 2 | 5 | 2.77 |
| PCVI | |||||||
|---|---|---|---|---|---|---|---|
| Cell Size (m) | 1 | 2 | 3 | 4 | 5 | Total Share | Mean (Vulnerability Rank) |
| Share | Share | Share | Share | Share | |||
| 5 × 5 | 0.44% | 12.68% | 32.62% | 48.30% | 5.97% | 100.00% | 3.47 |
| 10 × 10 | 0.40% | 6.75% | 12.01% | 76.12% | 4.73% | 100.00% | 3.78 |
| 25 × 25 | 0.37% | 25.46% | 28.79% | 40.51% | 4.88% | 100.00% | 3.24 |
| 50 × 50 | 0.18% | 26.18% | 34.10% | 36.50% | 3.04% | 100.00% | 3.16 |
| 100 × 100 | 0.11% | 26.70% | 38.74% | 32.62% | 1.83% | 100.00% | 3.09 |
| 200 × 200 | 0.03% | 26.10% | 42.86% | 29.92% | 1.09% | 100.00% | 3.06 |
| 500 × 500 | 0.00% | 26.32% | 48.56% | 24.37% | 0.74% | 100.00% | 3.00 |
| 1000 × 1000 | 0.00% | 26.97% | 50.79% | 22.25% | 0.00% | 100.00% | 2.95 |
| Cell Size (m) | 1 | 2 | 3 | 4 | 5 | Total | Total Share |
|---|---|---|---|---|---|---|---|
| 5 × 5 | 761 | 22,120 | 56,888 | 84,232 | 10,409 | 174,410 | |
| 0.44% | 12.68% | 32.62% | 48.30% | 5.97% | 100.00% |
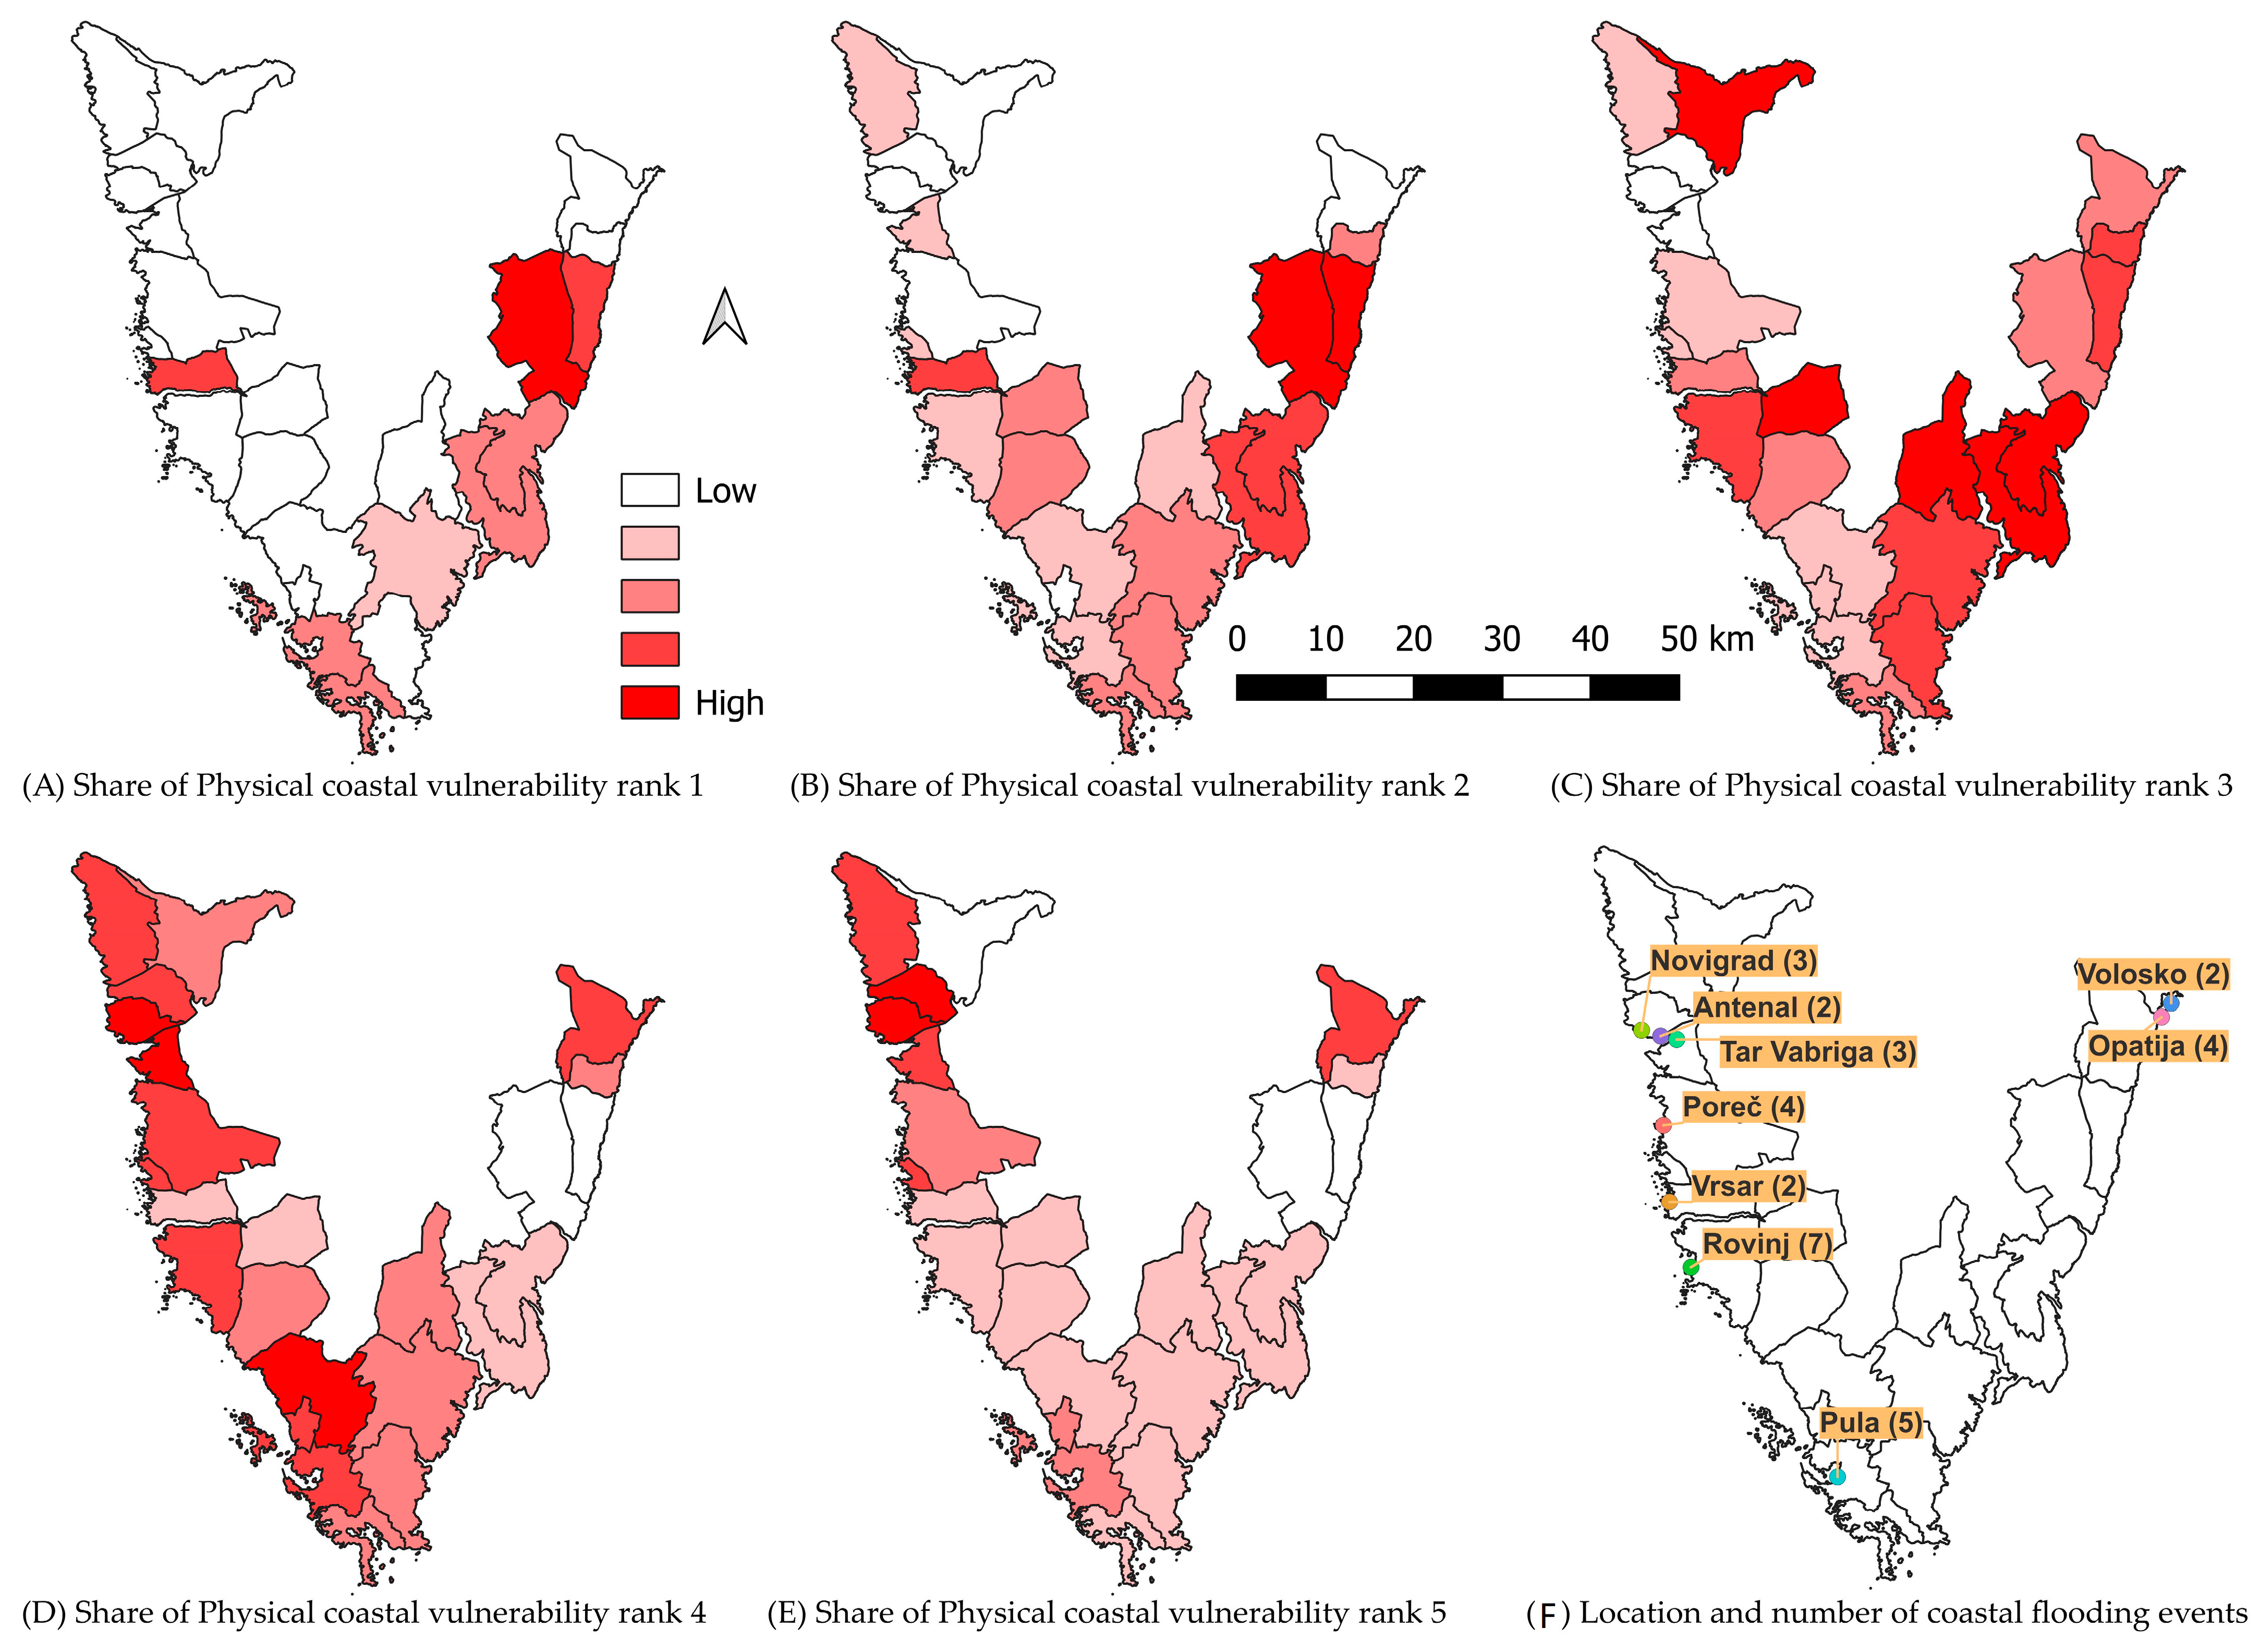
| Municipality | Coast (East—E, West—W) | 1 | 2 | 3 | 4 | 5 |
|---|---|---|---|---|---|---|
| Bale–Valle | W | 0.00% | 13.70% | 35.27% | 49.58% | 1.45% |
| Barban | E | 0.00% | 5.96% | 50.10% | 42.40% | 1.54% |
| Brtonigla–Verteneglio | W | 0.00% | 1.17% | 9.14% | 61.96% | 27.74% |
| Buje–Buie | W | 0.00% | 1.78% | 57.67% | 39.89% | 0.67% |
| Fažana–Fasana | W | 0.00% | 3.95% | 25.31% | 61.57% | 9.17% |
| Funtana–Fontane | W | 0.00% | 6.02% | 26.62% | 52.24% | 15.12% |
| Kanfanar | W | 0.00% | 13.91% | 54.44% | 30.77% | 0.89% |
| Kršan | E | 4.34% | 42.08% | 34.27% | 18.57% | 0.73% |
| Labin | E | 0.24% | 22.26% | 45.94% | 30.59% | 0.96% |
| Ližnjan–Lisignano | E | 0.02% | 11.62% | 37.64% | 49.62% | 1.10% |
| Lovran | E | 0.00% | 14.66% | 40.60% | 42.92% | 1.83% |
| Marčana | E | 0.14% | 17.86% | 39.28% | 41.50% | 1.23% |
| Medulin | W | 0.50% | 14.42% | 33.72% | 47.89% | 3.47% |
| Mošćenička Draga | E | 3.73% | 35.66% | 40.75% | 19.58% | 0.28% |
| Novigrad–Cittanova | W | 0.00% | 1.17% | 9.11% | 62.08% | 27.65% |
| Opatija | E | 0.00% | 1.77% | 29.01% | 57.25% | 11.97% |
| Poreč–Parenzo | W | 0.00% | 3.80% | 25.60% | 60.45% | 10.15% |
| Pula–Pola | W | 0.21% | 8.52% | 27.81% | 55.72% | 7.75% |
| Raša | E | 0.37% | 21.81% | 44.24% | 32.67% | 0.91% |
| Rovinj–Rovigno | W | 0.03% | 7.22% | 36.53% | 51.46% | 4.75% |
| Tar-Vabriga–Torre-Abrega | W | 0.00% | 5.18% | 15.71% | 62.63% | 16.48% |
| Umag–Umago | W | 0.00% | 7.62% | 27.11% | 52.15% | 13.11% |
| Vodnjan–Dignano | W | 0.00% | 4.53% | 23.03% | 71.56% | 0.88% |
| Vrsar–Orsera | W | 2.21% | 25.39% | 31.61% | 38.51% | 2.27% |
Disclaimer/Publisher’s Note: The statements, opinions and data contained in all publications are solely those of the individual author(s) and contributor(s) and not of MDPI and/or the editor(s). MDPI and/or the editor(s) disclaim responsibility for any injury to people or property resulting from any ideas, methods, instructions or products referred to in the content. |
© 2025 by the authors. Licensee MDPI, Basel, Switzerland. This article is an open access article distributed under the terms and conditions of the Creative Commons Attribution (CC BY) license (https://creativecommons.org/licenses/by/4.0/).
Share and Cite
Šimac, Z.; Lončar, N.; Faivre, S. High-Resolution Coastal Vulnerability Assessment for the Istrian Peninsula: Developing a Physical Coastal Vulnerability Index (PCVI). Geosciences 2025, 15, 85. https://doi.org/10.3390/geosciences15030085
Šimac Z, Lončar N, Faivre S. High-Resolution Coastal Vulnerability Assessment for the Istrian Peninsula: Developing a Physical Coastal Vulnerability Index (PCVI). Geosciences. 2025; 15(3):85. https://doi.org/10.3390/geosciences15030085
Chicago/Turabian StyleŠimac, Zaviša, Nina Lončar, and Sanja Faivre. 2025. "High-Resolution Coastal Vulnerability Assessment for the Istrian Peninsula: Developing a Physical Coastal Vulnerability Index (PCVI)" Geosciences 15, no. 3: 85. https://doi.org/10.3390/geosciences15030085
APA StyleŠimac, Z., Lončar, N., & Faivre, S. (2025). High-Resolution Coastal Vulnerability Assessment for the Istrian Peninsula: Developing a Physical Coastal Vulnerability Index (PCVI). Geosciences, 15(3), 85. https://doi.org/10.3390/geosciences15030085