Article

The Investigation of Trends and Wet and Dry Rainfall Cycles in North Africa (In Morocco, Algeria, and Tunisia) (1970–2023)

by
Zeineddine Nouaceur
1,
Ovidiu Murarescu
2,* and
George Muratoreanu
2,*
1
UMR IDÉES CNRS 6266, Rouen University, 76821 Mont Saint Aignan Cedex, France
2
Department of Geography, Valahia University, 130001 Târgovişte, Romania
*
Authors to whom correspondence should be addressed.
Geosciences 2025, 15(3), 80; https://doi.org/10.3390/geosciences15030080
Submission received: 25 January 2025 / Revised: 19 February 2025 / Accepted: 20 February 2025 / Published: 22 February 2025

Abstract

:
IPCC climate forecast models, applicable to the Maghreb countries (Morocco, Algeria, and Tunisia), predict a decrease in atmospheric precipitation, greater variability, and an increase in aridity. In recent years, the entire region has been experiencing unprecedented climate upheavals. Climatic droughts have become increasingly severe and recurrent (drastically reducing water stocks). We are also witnessing a remarkable increase in temperatures and a greater frequency of heat waves. Faced with these new provisions, this territory (long considered an area of water stress) is now subject to very strong tensions, which have led to a greater demand for water and a decrease in supply. To understand the intensity of this “climate–water” crisis, we propose an analysis of this priority issue based on the evolution of precipitation over more than half a century of records. To determine precipitation trends and define rainfall cycles in these three countries, the graphical chronological method of information processing (MGCTI) of the “BERTIN Matrix” type is used. Annual precipitation totals from 29 stations were used for the MGCTI (chronological graphic method of information processing) for the period 1970–2023. These data come from the national meteorological networks of the National Meteorological Office (ONM) for Algeria, National Institute of Meteorology (NIM) for Tunisia, and National Directorate of Meteorology (DMN) for Morocco, and the from the websites of the National Climatic Data Center (NCDC) and “TuTiempo Network”. Monthly pluviometric totals from three stations, Dar El Beida (Algeria), Casablanca (Morocco), and Tunis (Tunisia), as well as the monthly NAO (North Atlantic Oscillation) and MOI (Mediterranean Oscillation Index) were used for the wavelet coherence method for the period 1970–2022. Data analysis shows that the entire region is subject to four extreme precipitation cycles (dry and wet). The last dry period was remarkably intense and led to a sharp increase in water stress throughout the region. An analysis of monthly precipitation from three stations (Casablanca, Dar El Beida, and Tunis) using the wavelet coherence method also highlighted a close relationship with the “NAO” and “MOI” circulation.

1. Introduction

According to the WMO, 2023 was the warmest year on record in meteorological history, with a positive temperature anomaly of +1.45 °C (calculated relative to the 1850–1900 average). This organization also confirms that global warming continues and that there has been a clear increase in decadal values since 1980. This clear trend favors an increase in extreme phenomena, such as heatwaves, intense precipitation, storms caused by active depressions, and drought episodes. While global warming affects a very large part of the planet in a more or less homogeneous manner, the evolution of precipitation is still marked by significant regional disparities (WMO, https://erecruit.wmo.int/public/, accessed on 18 November 2024).
In North Africa, the entire region has also suffered unprecedented climate upheavals in recent years. This large territory has been strongly affected by heatwaves never seen before and a sharp increase in climatic droughts. These new climatic conditions have weakened natural ecosystems and increased the risks associated with forest fires (UN, https://www.un.org/en/, accessed on 18 November 2024).
However, given the rising temperatures and the air’s evaporative power, an increase in precipitation in certain regions of the globe is likely. Boé [1], in 2007, argued that an increase in the amount of water vapor in the lower layers of the atmosphere could also cause an increase in precipitation and its intensity. Tramblay (2012, 2013) [2,3] showed through the use of climate simulation models that an increase in air humidity by 22% might be directed toward continents by maritime flows. Blöschl et al. (2017) [4] showed that climate change is expected to impact the timing and intensity of floods in European rivers. Studies on longer periods also attest to the impact of global warming on the European atmosphere, which has become significantly drier in recent decades than in the pre-industrial period [5].While floods caused by intense rains are increasingly affecting many regions of the world, global warming (high temperatures and high evaporation) is increasingly blamed for the occurrence of severe climatic droughts. This is the case in the Horn of Africa, where Sudan, Kenya, Ethiopia, Eritrea, Somalia, and Djibouti have experienced severe droughts since 2020 (which had not occurred in about 40 years). This exceptional episode threatens nearly 22 million people. While many African regions have regularly experienced drastic declines in precipitation in the past, the current climate warming, through its intensity, increases the severity and duration of these climatic episodes. Africa is the most exposed and vulnerable continent to the effects of drought [6]. In the central Maghreb, the entire region has been experiencing unprecedented climatic changes for several years (WMO, https://erecruit.wmo.int/public/, accessed on 18 November 2024). Thus, temperature records have been broken in Tunis—49.0 °C (Tunisia), Agadir—50.4 °C (Morocco), and Algiers—49.2 °C (Algeria). These high temperatures have caused major forest fires during the hot season. In addition to these risk phenomena, these countries have also observed a significant decrease in cumulative precipitation in recent years after a resumption of rains in the early 2000s [7,8,9,10,11]. Thus, in Morocco, precipitation was 70% below average for six years. In Tunisia, drought has been present since 2012, and in Algeria, since 2017. According to the latest United Nations report (UN, 2022 https://www.timeanddate.com/year/2022, accessed on 18 November 2024), this extreme phenomenon has increased by 29% globally since 2000 and exposes over 2.3 billion people to water stress (including nearly 160 million children). This region has long been considered a water stress zone and is now facing strong warming associated with a change in precipitation regimes and an increase in aridity. This situation significantly affects terrestrial ecosystems, species distribution, the terrestrial carbon cycle, and food production systems [6]. According to the results of various forecast models, the Mediterranean area should experience an average temperature increase in the range of 3.0 to 4.0 °C by 2100, a decrease in precipitation, and an increase in extreme events [6]. The combined effect of climate change and anthropogenic impact would lead to a water deficit for approximately 290 million people. According to METAP [12], Gael G. (2007) [13], and Gregoire G. (2007) [14], the Middle East and North Africa (MENA) regions will be heavily affected, as most countries in this area (except Iran and Iraq) have reached the water stress threshold (1700 m3 of renewable water per capita/year). At the same time, Algeria and Tunisia, which are part of the MENA countries, have come to face an acute shortage of water resources. The latest IPCC report also reveals a low agreement between models regarding the direction of precipitation trends in the Mediterranean basin from the present until the end of the century [6].

2. Material and Methods

2.1. Material

Statistical–mathematical data on precipitation quantities cover a period of more than 50 years of measurements (1970–2023) from 29 stations (Figure 1). These 29 stations were chosen according to the availability of annual precipitation data in our climate database and also according to the access to more recent data for free download on climate data sites. This choice was not determined by the representativeness of specific climatic zones. The spatial distribution of these stations nevertheless allowed us to cover the entire study region well. All these data came from reliable sources and did not require corrections; only the missing data were replaced by the average of the series studied or the average calculated by the values of the previous year and the following year of the missing value. The choice to use monthly precipitation data for the stations of Csablanca, Dar El Beida, and Tunis was directly linked to the availability of monthly rainfall data for free download on the site (https://climexp.knmi.nl/start.cgi, accessed on 18 November 2024). These monthly data were used only for the study of wavelet coherence.
Annual precipitation totals from all stations were used as part of the “MGTCI matrix method”. Monthly pluviometric totals from three stations, Dar El Beida (Algeria), Casablanca (Morocco), and Tunis (Tunisia), as well as the monthly NAO (North Atlantic Oscillation) (https://climexp.knmi.nl/data/inao.dat, accessed on 18 November 2024) and MOI (Mediterranean Oscillation Index) (https://crudata.uea.ac.uk/cru/data/moi/, accessed on 18 November 2024) were used for the wavelet coherence method for the period 1970–2022. These data came from the national meteorological networks the National Meteorological Office (ONM) for Algeria [15], National Institute of Meteorology (NIM) for Tunisia [16], and National Directorate of Meteorology (DMN) for Morocco [17]. To complete the data series, we also used information on the precipitation quantities in the analyzed area, using the website of the National Climatic Data Centre (NCDC) [18]. Where there were gaps in the quantitative precipitation values, these were identified on “TuTiempo.net”, accessed on 18 November 2024 [19]. This site uses the global database of the National Climatic Data Centre (NCDC) [18]. All these data are freely accessible and come from the various weather stations of the meteorological observation networks. When data were missing for at least two successive years or two months, they were replaced by the corresponding annual or monthly average values for the period 1970–2023.

2.2. Methods

The analysis of rainfall variability employed two working methods:
-
The MGCTI (Méthode Graphique Chronologique de Traitement de l’Information/chronological graphic method of information processing)
The MGCTI is an analytical method based on a statistical analysis and on a graphical representation of the results. This method was used for the first time in 2013 [9]. The MGCTI has been developed to facilitate the interpretation of the statistical results for the Mediterranean rainfall analysis, due to the high variability affecting this parameter. The MGCTI was introduced to harmonize and consolidate information after the statistical treatment. The MGCTI is a manual and visual method of classification of information based on data. This matrix is used to group the data that are similar according to all the criteria studied. It provides a simple and effective way to establish a multivariate typology based on the user’s observations. This supplies concordant results (even rainfall character for all the stations studied in the same year), but also identifies conflicting information (different characters among stations for the same year). The MGCTI and its graphic representation allow a chronological reading and a spatial analysis of the phenomenon. This method has been successfully tested in many North African regions [11] and in the Sahel [20,21]. A comparative study with the Standard Precipitation Index (SPI) method for detecting climate drought was conducted in 2015 [22]. This study showed the simplicity and clarity of the results obtained with the MGCTI method. One of the aims of this article is to show the trend of rainfall over half a century and to detect the dates when changes in the cycles were detected.
The First Stage. An annual data precipitation (cumulative rainfall over a calendar year) hierarchy in terms of limit values (Q1, Q2, Median, Q3, and Q4) was performed for all stations and for the entire series (Table 1). Depending on the data position in relation to the limit values, the years were considered as very dry, dry, normal, rainy, and very rainy (Table 2):
(i)
Very dry, below the first quintile;
(ii)
Dry, between the first and the second quintiles;
(iii)
Normal with a trend toward drought, between the second quintile and the third quintile;
(iv)
Rainy, between the third and the fourth quintiles;
(v)
Very rainy, above the fourth quintile.
The Second Stage. The values were recorded by means of a range of colors (the color varying in terms of the annual cumulative rainfall position in relation to the limit values) (Table 3). This first processing stage was followed by a reordering procedure (permutations of columns) in order to obtain a ranking that allowed the visualization of a homogenous colored structure as in the Bertin Matrix [23,24,25] (Figure 2). This procedure allowed for the visualization of the climate parameter evolution in terms of two dimensions (time and space).
The Third Stage. To determine the typical breaks and periods, a second procedure was conducted. It consisted of assigning a number ranging from one (very dry year) to five (very wet year) according to the already determined features assigned to each year (Table 3). The sum of the values of all the stations for each year was centered and reduced, thus obtaining a regional index (RI) varying from +∞ for a very wet year to −∞ for a very dry year (Table 4). The projection of the result on a graph allowed for the visualization of the evolution of the phenomenon on a regional scale in the first stage, and for the determination of the data on breaks and trend change in the second stage.
Table 1, Table 2, Table 3 and Table 4. 1—Distribution and qualification of annual precipitation amounts according to quintiles and the Graphic Matrix (MGCTI) key (Q = quintile, Me = median, Min = Minimum, Max = Maximum, Avg = Average, and Standard Deviation). 2—Trend of annual rainfall according to the quintiles. 3—Assigning a number range. 4—Regional index “RI” (RI = (Xi − X)/S), where Xi is the yearly value, X is the series average, and S is the standard.
-
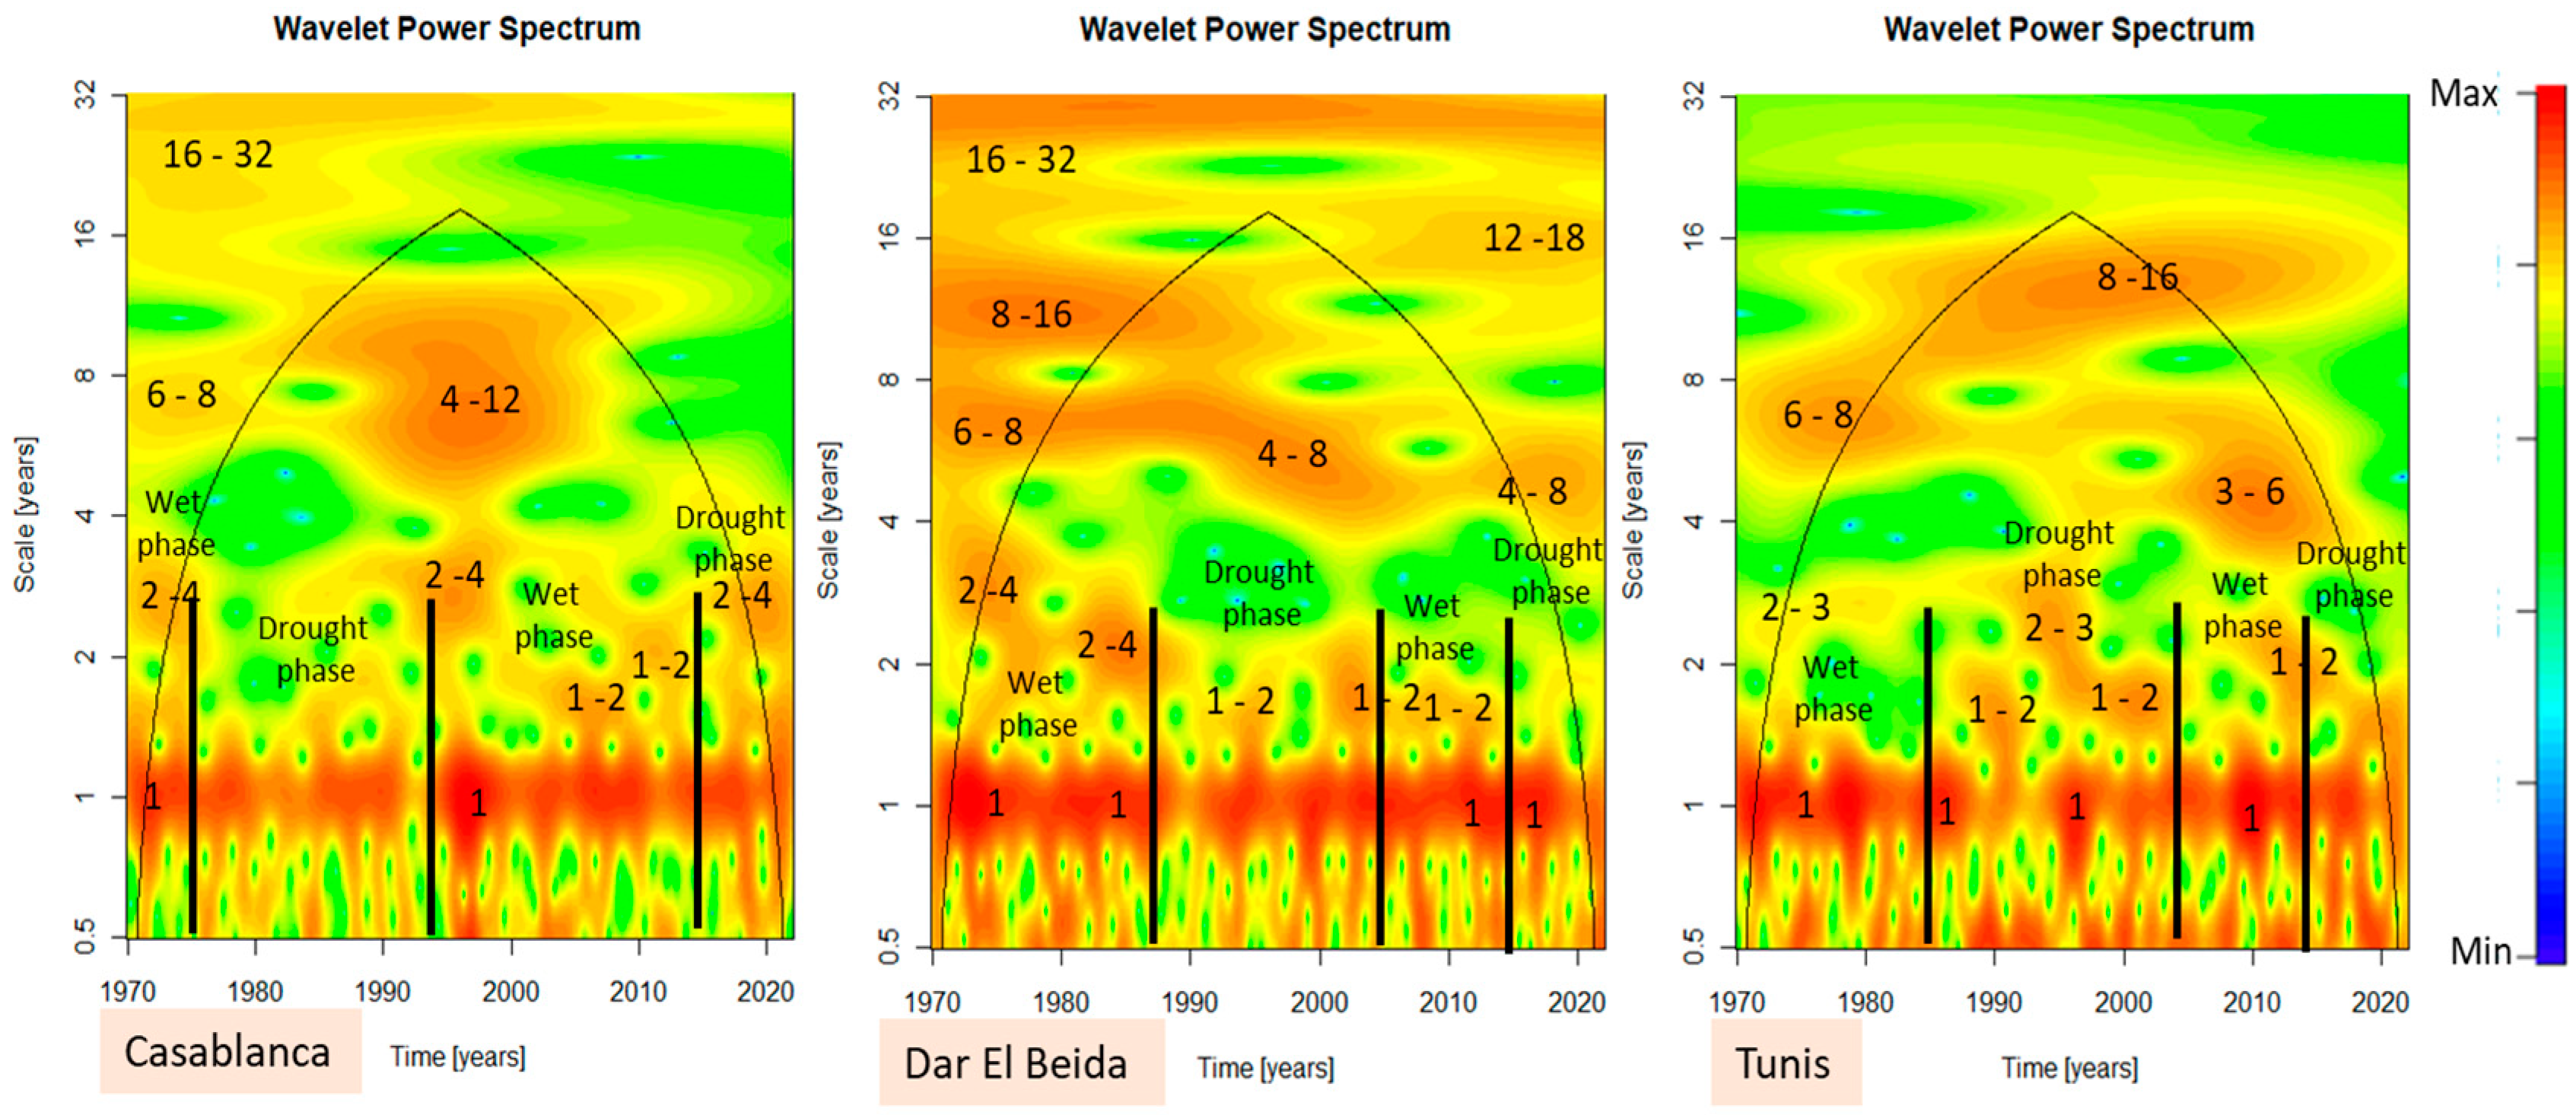
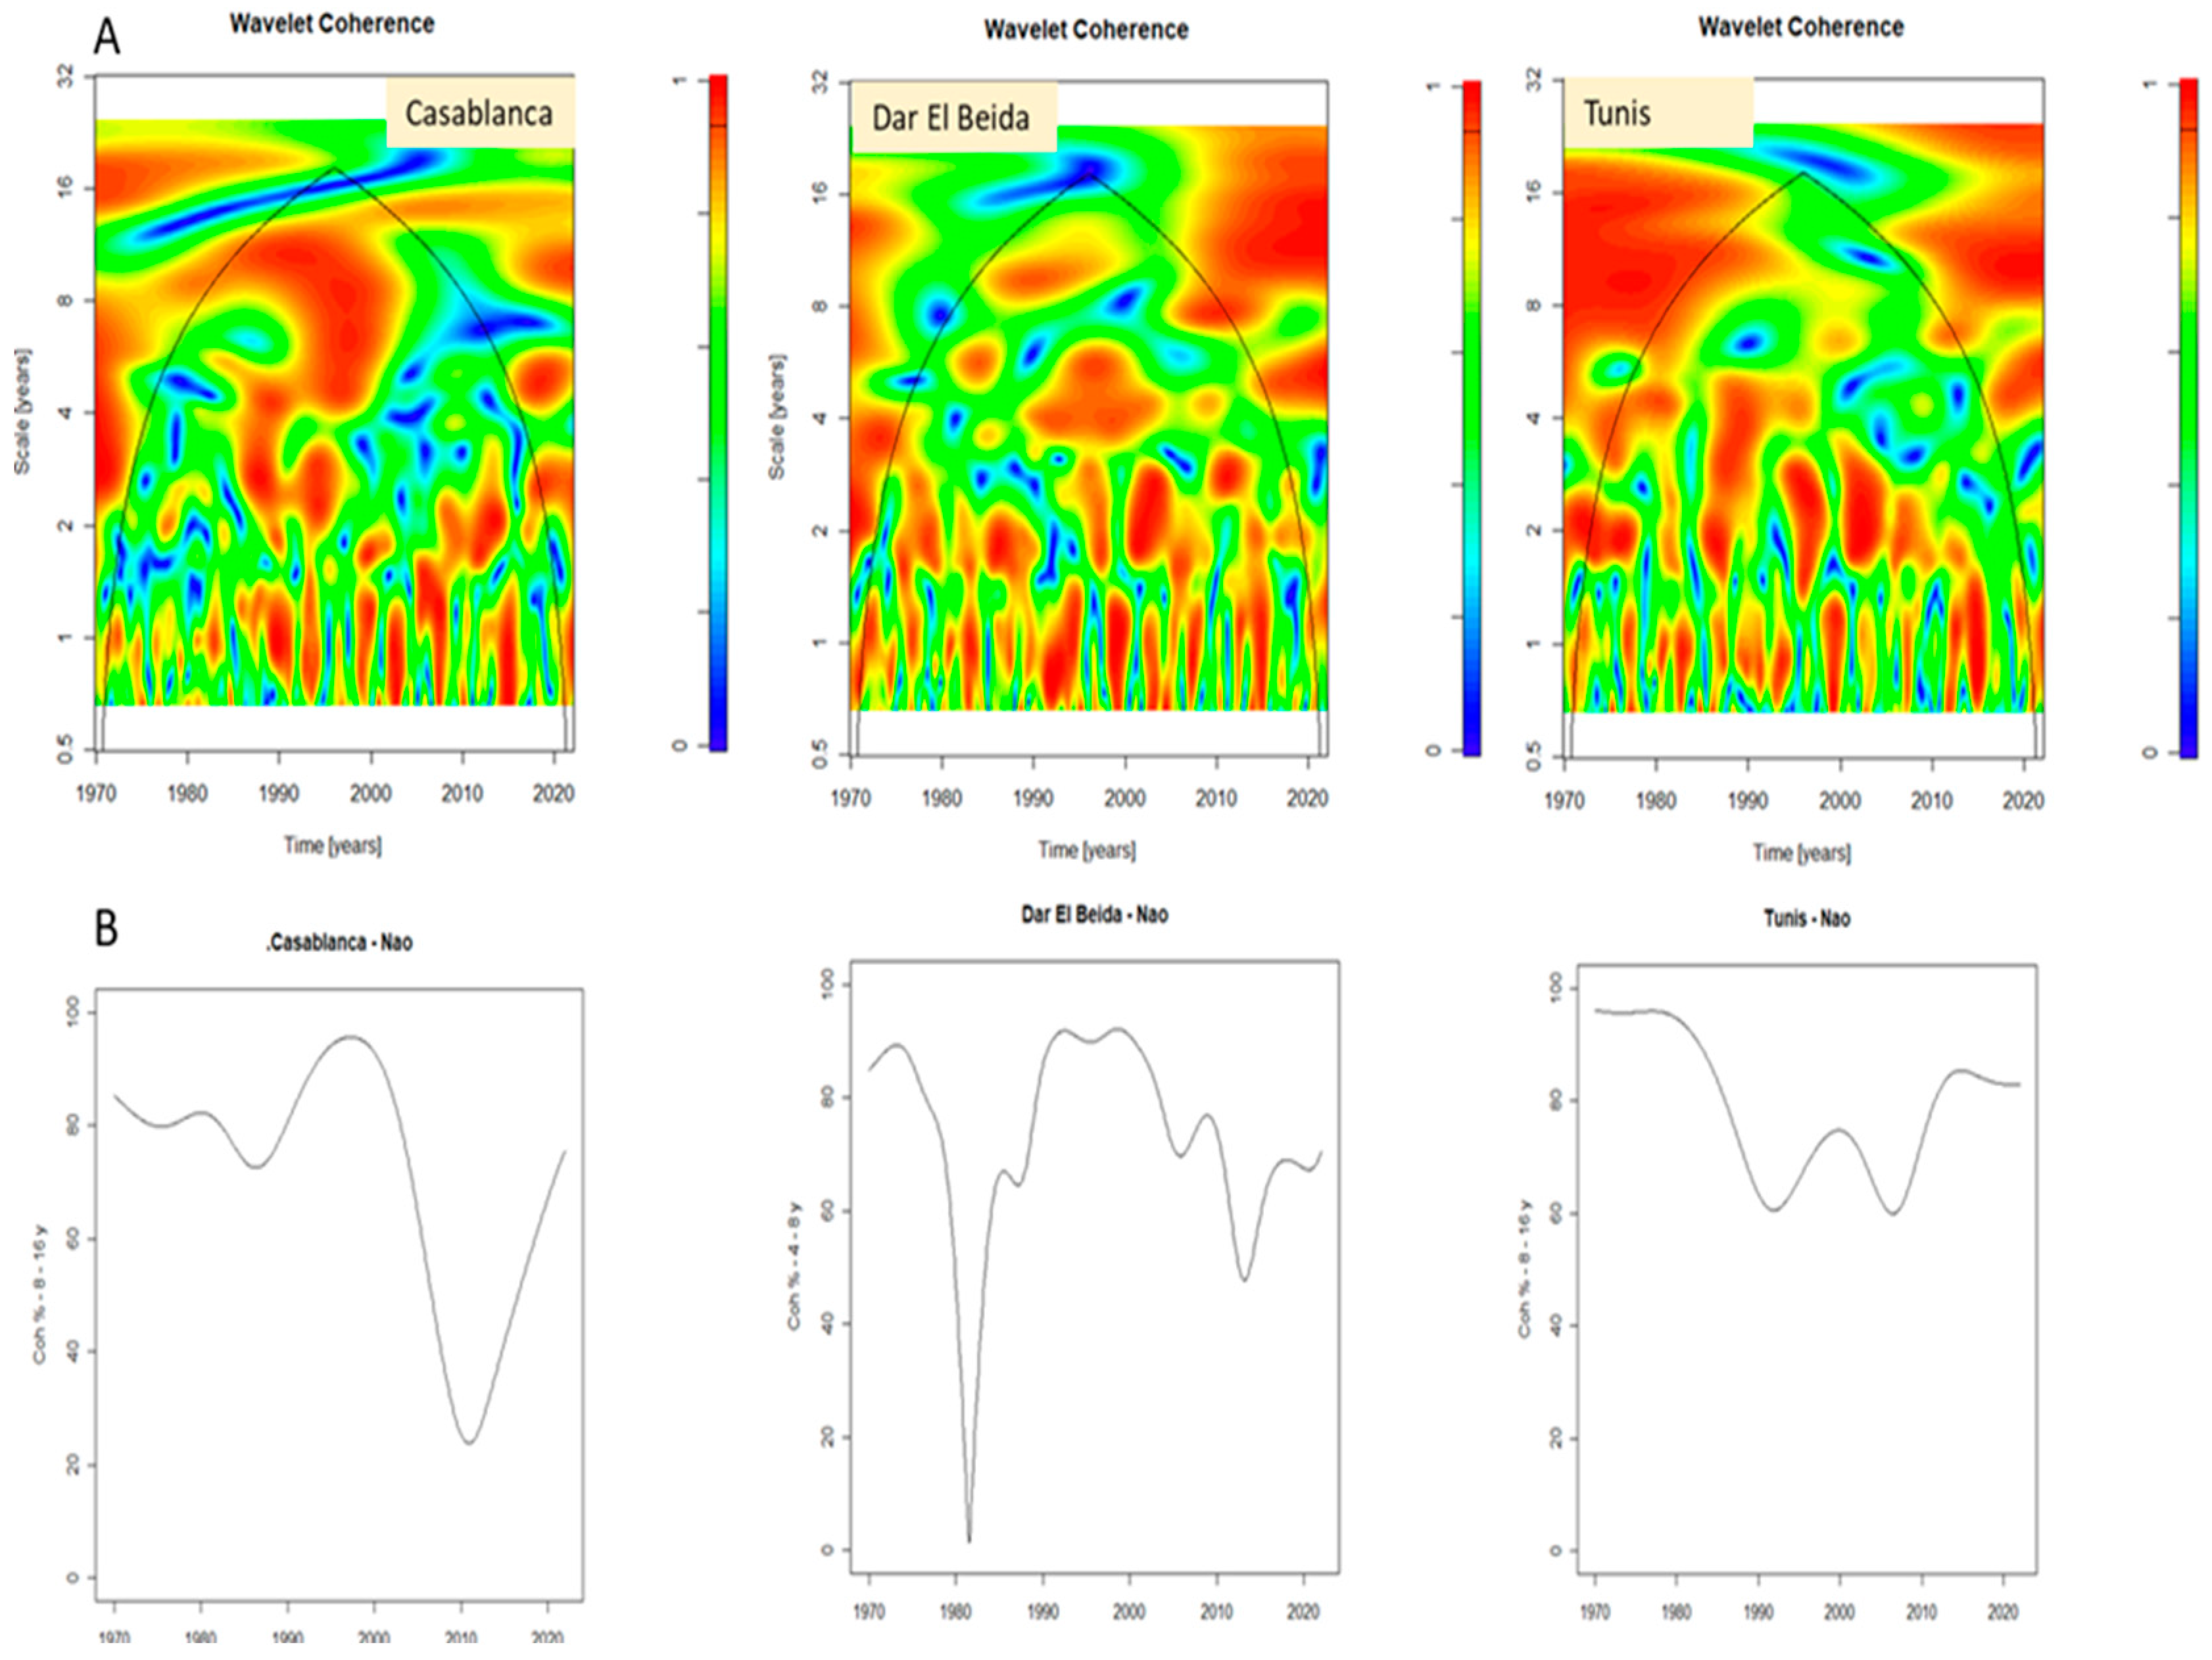
The Spectral method: Continuous wavelet analysis and wavelet coherence analysis
Wavelet analysis provides a temporal representation of the variance of the time series studied, such that any discontinuities in the variability can be identified. This analysis has often been employed in hydrology and climatology [26,27,28,29]. For this study, only one wavelet was used: the continuous wavelet (CWT: continuous wavelet transform), which decomposes the signal into daughter wavelets based on the translation and expansion of a reference wavelet (mother wavelet). The mother wavelet comprises two parameters (a scale parameter, “a”, and a temporal location parameter, “b”), which are varied in order to obtain a frequency analysis over time (t) of the signals as indicated in Equation (1):
ψ a , b ( t ) = 1 a ψ t b a
a, b (t): Daughter wavelets;
a: Scale parameter;
b: Temporal location parameter.
The continuous wavelet transform of the signal S(t) produces a local wavelet spectrum, as defined by Equation (2):
S ( a ,   b ) = s t 1 a ψ t b a d t
The scale parameterization and the translation of the daughter wavelets make it possible to detect the different frequencies composing the signal [30]. The linearities between the two input signals are managed by wavelet coherence, which returns a value between 0 and 1 depending on the degree of linear correlation of the compared variables [31]. This is defined in Equation (3) below.
CO x (yf) = Sxy (f)/Sx (f) Sy (f)
The spectrum by crossed wavelets WXY (a.τ) between two signals, x(t) and y(t), is calculated according to Equation (4) below, where CX (a.τ) and C* Y (a.τ) are the wavelet coefficients of the continuous signal, x(t), and the conjugate of the wavelet coefficient of y(t), respectively [32].
Wxy (a, τ) = cx (a, τ) × C*y (a, τ)

3. Results

The MGCTI (Figure 2) presents an organization of cumulative precipitation displayed according to four characteristic periods.

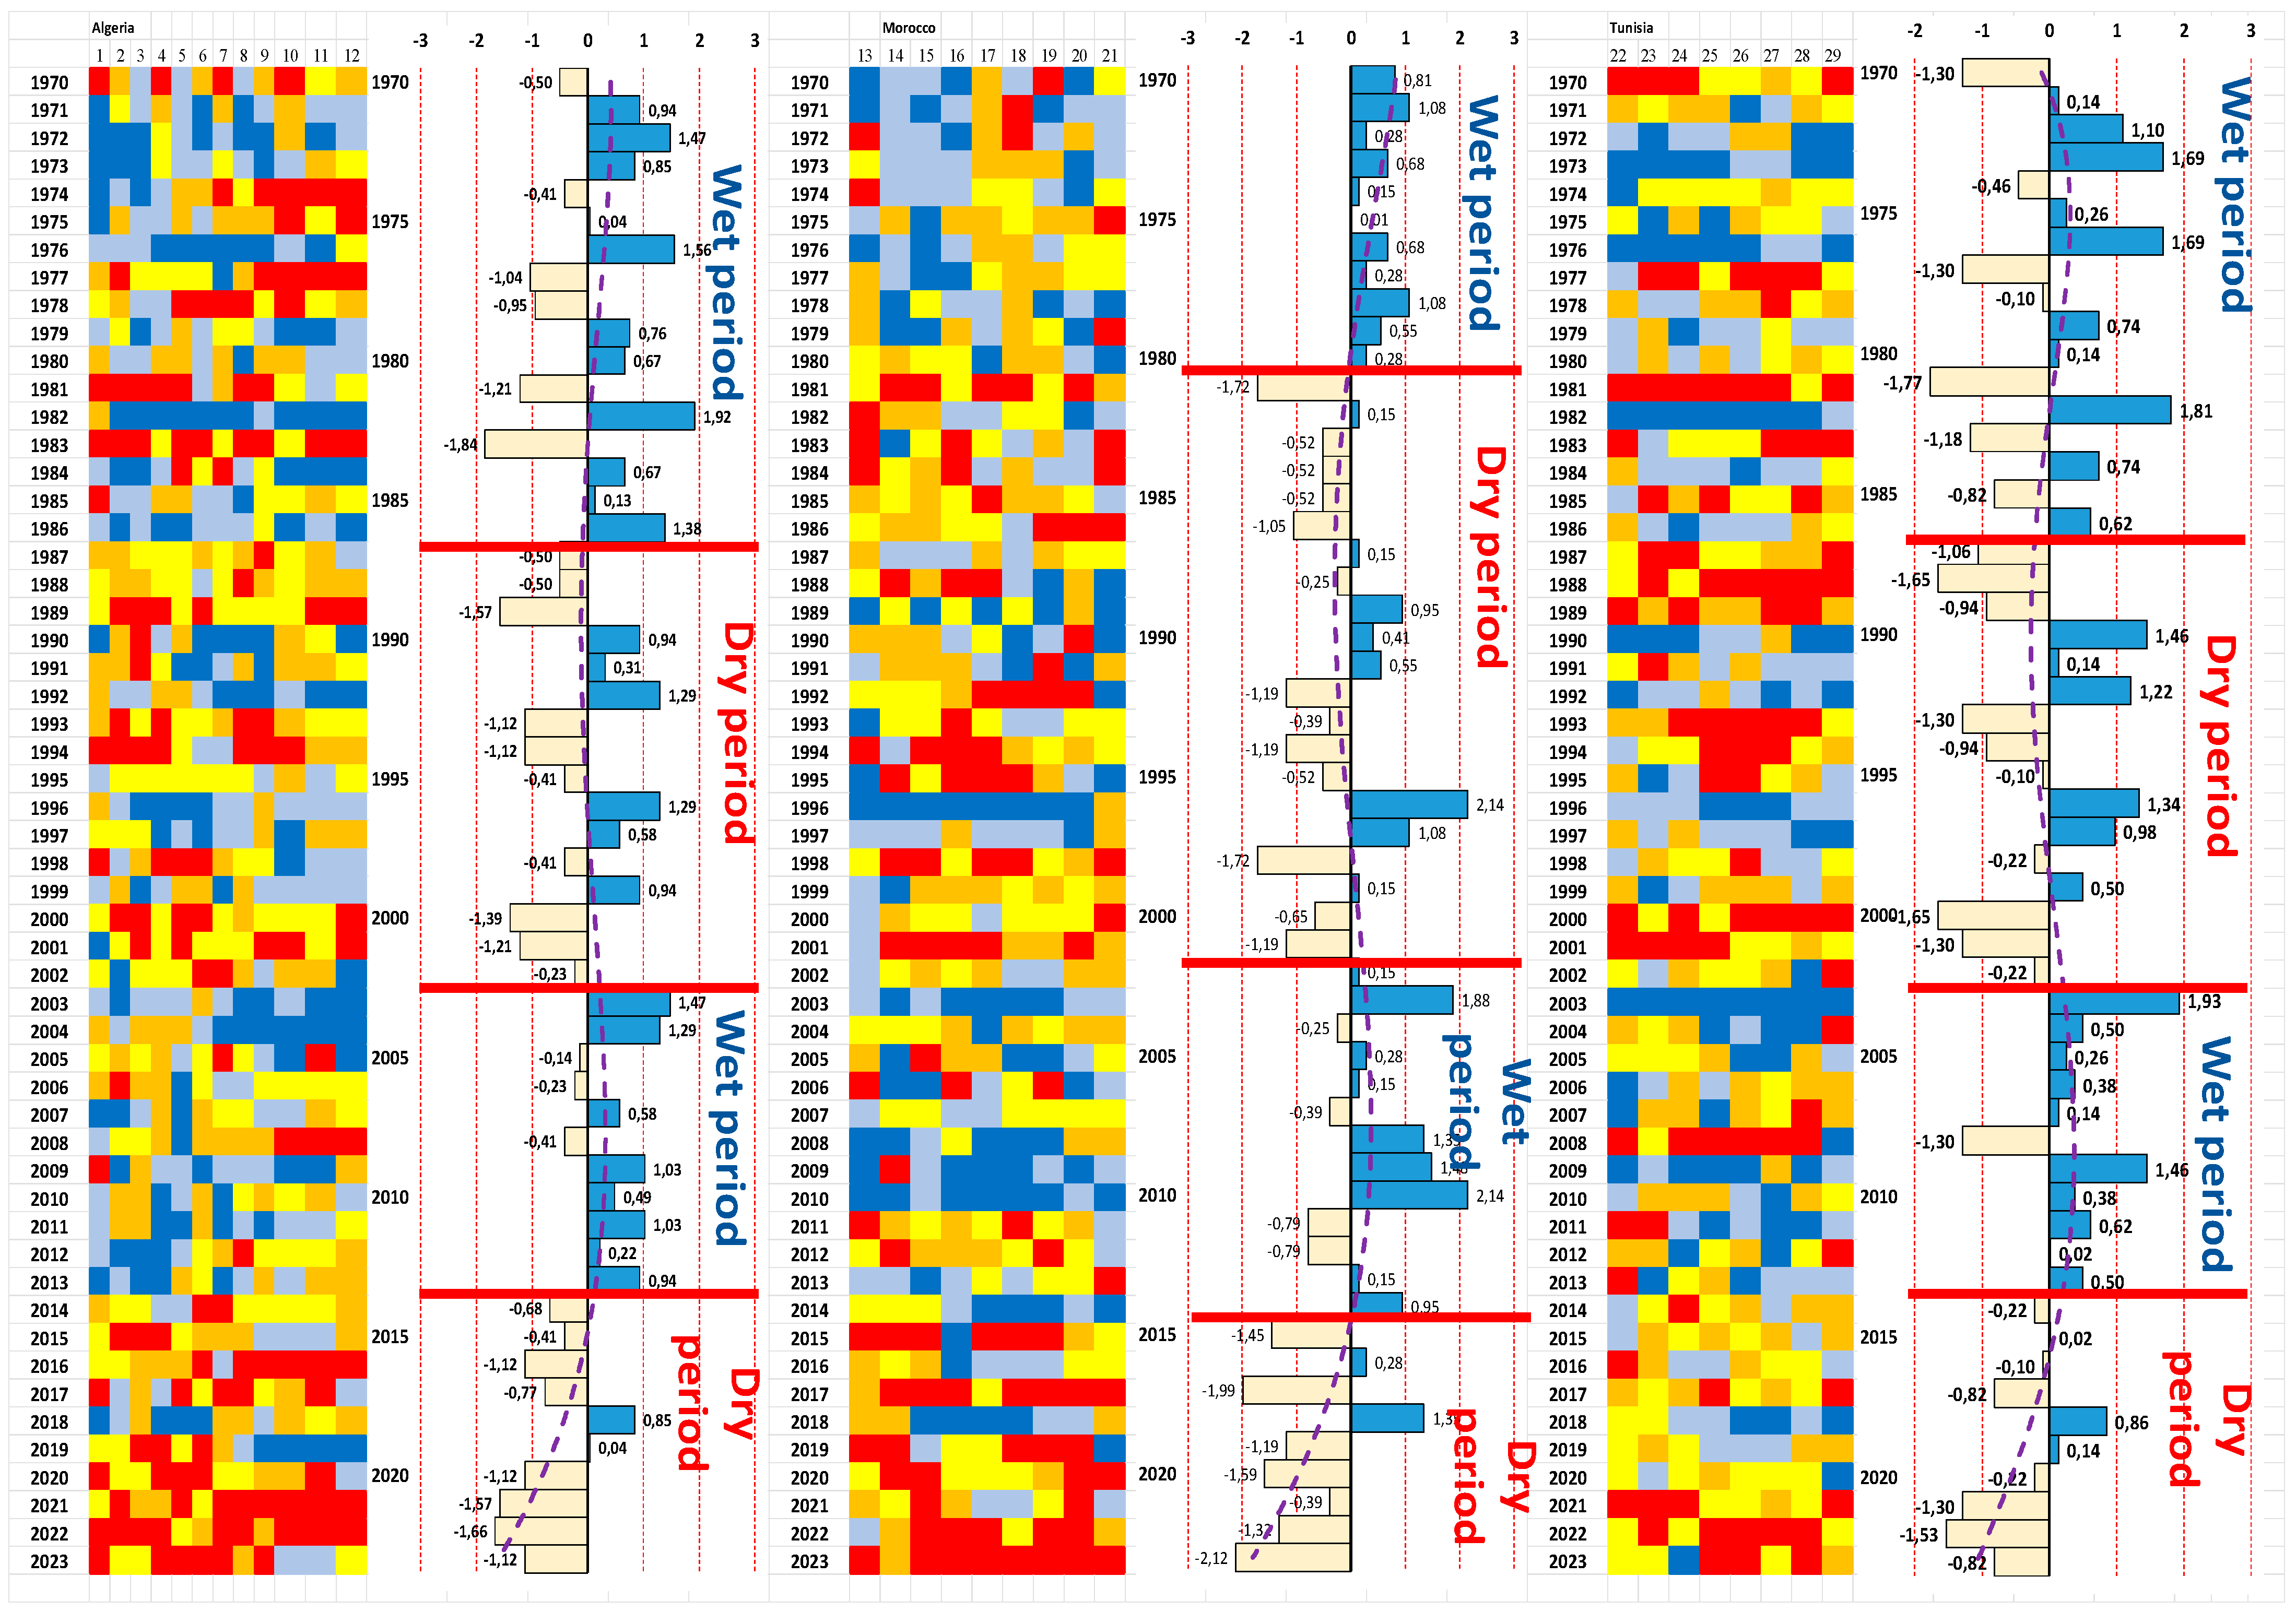
3.1. The Situation in Algeria

A first wet phase was recorded between 1970 and 1986. This period is marked by a clear predominance of years with positive indices—eleven years are listed in this first period with indices ranging from +0.04 to +1.92, the maximum being recorded in 1982. Despite this trend, there were four dry years between 1970 and 1983, three of which exceeded the negative index of −1 (1977, 1981, and 1983), as the regional index reached −1.84. We can also note the excess precipitation during this period, a variability specific to the Mediterranean area, marked by the years 1982 and 1983, as we move from the maximum index of the period to the minimum index (+1.92 and −1.84).
The second period begins in 1987 and ends in 2002. It is marked by a drier trend, highlighted by a significant number of years with negative regional indices (ten years: from 1987 to 1989, then from 1993 to 1994, the year 1988, and finally, from 2000 to 2002). Almost 50% of these years exhibit an index greater than −1. Wetter conditions include almost 40% of the years (1990–1991, 1996 and 1997, and finally, 1999). The years 1992 (+1.29) and 1996 (+1.29) were marked by a strong predominance of wet and very wet conditions recorded at weather stations.
The third period notes a change from the previous pluviometric conditions. We observe a clear change in the trend, as the return of wetter conditions is well marked by the results displayed on the matrix (almost 73% of the years show a positive index, especially for the last five years of the period—ranging from 2009 to 2013).
The last period of the precipitation series marks a pause between all previously observed conditions. A new cycle of drought, more intense and durable, is noted. The negative index concerns 80% of the years of this decade and only one year records a positive index (2018, +0.85), while 2019 can be considered normal since its index is almost 0 with +0.04. Remarkable for this period are the two cycles of dry years at the beginning and end of the period (four successive years between 2014 and 2017 and between 2020 and 2023). The regional index exceeds −1 for all the years of this last period and is greater than −1.5 in 2021 and 2023. These represent the years with the most drastic conditions in the studied pluviometric series.

3.2. The Situation in Morocco

The regional indices calculated for the Moroccan precipitation series show a more homogeneous cycle of data organization (less marked by interannual variability).
Just over a decade with a wet trend is observed between 1970 and 1980. The regional indices are all positive and exceed +1 in 1971 and 1978.
Starting from 1981 up to the present, we observed a first long cycle of drought (just over two decades). This period is truly interrupted only between 1989 and 1991 (these three years show indices ranging from +0.41 to +0.95) and in the interval of 1996–1997 (+2.14 and +1.08). We also note that in the first six years, only the year 1982 is positive, but with a very low index of +0.15. We may deduce that drought conditions are recurrent and reach the highest intensities in 1981 (−1.72), in 1986 (−1.05), between 1992 and 1994 (−1.94), in 1998 (−1.94 to −1.72), and 2001 with −1.29.
As can be seen in the matrix, the new pluviometric conditions are more favorable to a wetter cycle starting from 2002 to 2014. This 13-year cycle is marked by the intensity of regional indices that exceed +1 (2003, 2008, 2009, and 2010). Thus, these last three years represent a succession of particularly wet years, with the 2010 index even reaching +2.14.
Starting from 2015, a new dry phase is observed. This cycle of almost a decade shows deficient precipitation conditions for just over 80% of the interval. Only the year 2018 (+1.35) is truly wet. The other remarkable fact is undoubtedly the succession of negative indices (between 2019 and 2023), which marks an exacerbation of drought conditions since the regional index exceeds −1 up to four times in the years 2019, 2020, 2022, and 2023. During this last year, the value reaches −2.12 (a value never recorded for the entire series). We also note the last five-year period with a negative index, which appears only once in the studied series.

3.3. The Situation in Tunisia

The amounts of precipitation recorded in Tunisia from 1970 to 2023 (Figure 2) are marked by significant interannual variability. The MGTCI graphic matrix once again reveals the four major characteristic periods already studied for Moroccan and Tunisian precipitation.
The first phase begins in 1970 and ends in 1986. At first glance, it is marked by an alternation of dry and wet years and does not seem to present a trend. However, a more detailed analysis reveals that this period is a wet phase. The regional index is positive for almost 58% of the years and negative for the remaining 42%. This first period, like the one analyzed for Algeria, is characterized by a significant variation in extreme years (1976 with −1.69 and 1977 with +1.30, then 1981 with −1.77 and 1982 with +1.88), exhibiting this particularity. At the beginning of the period, a succession of three wet years was noted between 1971 and 1973.
The second period is marked by a dry trend lasting 16 years. The regional index reveals that almost 63% of the years display a negative value. The successive phases of the same trends do not exceed a maximum of three years (1987–1989, 1993–1995, and 2000–2002 for negative indices, and 1995–1997 for positive indices). Five years stand out with negative indices exceeding −1: 1987 (−1.06), 1988 (−1.65), 1993 (−1.30), 2000 (−1.65), and 2001 (−1.30).
The period from 2003 to 2013 is described as wet. The regional index is positive for nine years. The return of drier conditions was observed in 2008 (−1.30). In 2012, the index equal to +0.02 describes a normal year. The percentage of years considered wet reaches 90%.
The last period is consistent with the trend observed in the other two countries. This dry decade is thus marked by seven years with negative indices. Only two years show positive indices (2018 with +0.86 and 2019 with +0.14). We also note a succession of four dry years (2020 to 2023) at the end of the series.
Continuous wavelet analysis and wavelet coherence analysis:
Rainfall variability and atmospheric circulation model
Significant scientific progress has been made in recent years in understanding the climatic mechanisms over much of the continents and oceans of our planet. This knowledge now allows us to assert that the climate is subject to natural fluctuations, upon which other anthropogenic signals, such as the proven action we are currently experiencing in the context of climate change, are superimposed. The role of oceans in regulating convective flows has been widely studied [33,34,35,36,37,38,39,40,41]. Climate fluctuations at mid- and high latitudes are characterized by well-defined structures, or modes of variability, which exhibit strong spatial coherence on a large scale. Thus, through the study of pressure fields and ocean temperatures throughout the 20th century, two natural signals have been identified, known as multidecadal signals (recurrent signals with a period greater than 40 years; high-frequency variability) and quasi-decadal signals (signals with a shorter periodicity of about 8 to 14 years; low-frequency variability) [36]. Over the Atlantic basin, the North Atlantic Oscillation (NAO) is the dominant atmospheric mode. Its influence extends to both shores of the North Atlantic, affecting the climates of North Africa and the Middle East [42,43]. The NAO represents a redistribution of the atmospheric mass between the Arctic or subarctic regions and the subtropical regions of the Atlantic. The sea-level pressure field is used to characterize this oscillation. The positive phase corresponds to a strengthening of the two centers of action (the Icelandic depression is deepening and the Azores anticyclone is intensifying). In this phase, we observe a strengthening of the pressure gradient over the Atlantic (the dominant westerly winds strengthen in winter beyond 45° N, and the trajectory of atmospheric depressions shifts toward the north). Under these conditions, the Mediterranean basin and central Maghreb are subject to periods of drought.
The negative phase is observed when these pressure centers simultaneously weaken in intensity. The trajectory of atmospheric depressions is shifted toward the south. The Mediterranean basin and the Maghreb regions find themselves under the influence of atmospheric disturbances that create more precipitation in these regions. In Figure 3, we note a close link between the variability of the regional precipitation index and the variability of the NAO index, observed over the periods 1972–1978 A–1979–2002 B, 2003–2012 C, and 2013–2022 D, the drought period, precipitation recovery period, and a new drought phase.
Just like the NAO, the Mediterranean Oscillation Index (MOI) represents a mode of atmospheric circulation that can explain rainfall variability [44,45]. The MOI is described as a dipolar behavior of the atmosphere between the Western and Eastern Mediterranean (level 500 hPa). The first index, as defined by Palutikof et al. (1996) [46] and Conte et al. (1989) [47], is described as the normalized pressure difference between Algiers and Cairo. Several other versions of this index have been proposed [48]. We thus note a calculated version from Gibraltar’s Northern Frontier and Lod Airport in Israel (Tel Aviv) [49] as well as a third version proposed by Brunetti et al. in 2002 [50] describing the pressure differences between the cities of Marseille and Jerusalem, and the pressure differences between Cadix (Spain) and Paluel (Italia) (WeMOi). Overall, this index, just like the NAO, describes the seasonal swing of major centers of action and the winds associated with them (the central European anticyclone and the Azores anticyclone). The MOI influences precipitation in the Mediterranean basin [43,51,52,53] and is related to the activity of cyclogenesis in the Mediterranean. The cyclogenesis is anomalously intense in the positive phase and it is it is anomalously weak in the negative phase [54].
The search for a link between atmospheric circulation patterns and precipitation variability in the region was carried out using the wavelet correlation method. This method makes it possible to evaluate and describe both the relationships at different scales (frequencies) and the evolution in time of these relationships between the variability of precipitation (monthly accumulations recorded at the stations of Casablanca, Dar El Beida, and Tunis in the period 1970–2022) and the atmospheric circulation modes expressed by the monthly NAO and MOI. These stations have different geographical locations. Casablanca is located on the Atlantic coast, while Dar El Beida and Tunis are located respectively on the central and eastern Mediterranean coast (Figure 1). Thus, the first station is more exposed to Atlantic maritime influences, whereas the other two stations are more sensitive to the meridian and northwest trajectories of active atmospheric disturbances. This particularity is clearly visible on the graph where we see well-synchronized cycles for the two stations located on the Mediterranean coast (Algeria and Tunis) (Figure 4). At the same time, we note that the first drought cycle is longer and begins earlier in Casablanca (1973–1993). This is also the case for the second wet cycle recorded between 1994 and 2012 in the same station. The last dry period, on the other hand, seems less delayed in time for the three stations; it begins in 2012 in Casablanca and in 2014 in Algiers and Tunis.
The observation of wavelet spectra (Figure 5) highlights several scales of variability for the different stations: seasonal (6 months–1 year), interannual (2–3, 2–4, 4–8, and 6–8 years), quasi-decadal (4–12, 8–16, and 12–18 years), and multidecadal (16–32 years). Seasonal rainfall variability in central Maghreb is closely linked to the general atmospheric circulation and to the movements of active atmospheric depressions as well as their trajectories in the different regions.
In Casablanca, seasonal modes weaken during drought cycles at the same time there is a strong variance in interannual variability modes (1–2, 2–4, and 6–8 years) during wet cycles. The dry period is marked by the strengthening of a decadal mode (8–14 years) that begins in 1985 and ends in 2005. The multidecadal mode (16–32) is more pronounced at the beginning of the studied period. In Dar El Beida, the seasonal mode weakens during the dry period (1987–2002). It is reinforced by an interannual mode (4–8 years), including the last dry years of the series (for this period, we also note the strengthening of the decadal mode of 12–18 years). During wetter periods, the interannual (1–2, 2–4, and 6–8 years), decadal (8–16 years), and multidecadal (16–32 years) variability modes are more reinforced. In Tunis, rainfall variability is close to that of Dar El Beida. The seasonal mode weakens during the dry cycle (1985–2002); it is reinforced by the 8–16-year decadal mode. The interannual variability modes (2–3, 3–6, and 6–8 years) are more present during wet periods.
The contribution of the NAO to rainfall shows moderate coherence if we consider the different modes of variability studied (Figure 6 and Table 5). The highest percentages are observed for the decadal modes of variability (8–16 years).
The coherence of the NAO on an interannual scale (1 year) is very variable, and we also note a loss of power for the three stations. However, it is well distributed for the other categories of this mode during the dry period for the three stations (Figure 6A). In Casablanca, this reinforcement is visible from the mid-1980s according to the 4–8-year mode. This reinforcement is also visible on the coherence curve established for this mode during the first drought cycle (Figure 6B). It is also found on the wavelet coherence spectrum at Dar El Beida during the dry period between 1985 and 2002 for the 3–6-year interannual mode, but according to a fairly low coherence percentage of 59.46%. The annual coherence curve established for this station and for the 4–8-year mode allows us to appreciate the increase in coherence during this period beyond the 70% threshold (Figure 6B). It is also present in Tunis according to the 2–4-year mode with a high percentage of coherence of nearly 77% (Table 5).
On a quasi-decadal scale (8–16 years), a strong overall coherence is noted in Casablanca and Tunis (nearly 72% for the first station and 79.40% for the second) (Table 5). This strong coherence is particularly reinforced on the last drought cycle for the three stations, but also on the first rainfall cycle in Tunis.
The contribution of the MOI to rainfall shows moderate coherence in the 4–8, 8–16-year variability modes and strong coherence for the 1–2-year interannual and 16–32-year multidecadal modes (Figure 7A). On an interannual scale (1 year), the coherence is strong in the three stations, exceeding 90% (Table 6). For the 2–4-year mode, only the Casablanca station has strong coherence with more than 70% (78.46%), as shown in Table 6. This reinforcement is visible from the beginning of the 1980s, thus coinciding with the drought period observed in this station (Figure 7A). For the 8–16-year decadal mode, the coherence curve shows the reinforcement during the first period of the series studied (1970–2000), including the drought cycle. From 2000, the loss of coherence is clearly visible on the graph (Figure 7B).
In Dar El Beida, the graph in Figure 7A shows the strengthening of the interannual mode—4–8 years during the first period of the series studied. For the quasi-decadal mode, the coherence curve shows a convincing link with the last period of drought (mid-2000s) (Figure 7B).
In Tunis, the second Mediterranean station, the results of the research on the coherence of rainfall and the MOI are consistent with what has already been expressed for the other stations in this study. There is strong coherence for the interannual mode (1–2 years) and multidecadal mode (16–32 years) and weak coherence for the other modes (Table 6). Figure 7A shows the strengthening of the 2–4-year interannual mode between 1985 and 2005. Another mode of variability is noted between 1990 and 2012. The 8–16-year decadal mode seems most in line with the rainy period noted in the mid-2000s and 2012.
Wavelet coherence analyses allow the identification of significant common oscillations between two signals (precipitation/NAO or MOI) at certain scales and for certain time intervals, without this implying a correlation between the two signals in the strict sense [55]. The research conducted in this study shows heterogeneous results given the regional specificities of each station studied. The 1–2-year interannual mode shows a strong coherence for the NAO (greater than 70% and less than 80%) and more than 90% for the MOIs in all stations (Table 5 and Table 6). For the 2–4- and 4–8-year interannual modes, the Mediterranean stations show a convincing coherence exceeding 70% (Table 6). The coherence with the MOI is more certain for the multidecadal mode (16–32 years) in the three stations.

4. Discussion

4.1. Synthesis of Rainfall Cycles

The analysis of annual precipitation evolution in the central Maghreb (Morocco, Algeria, and Tunisia) (Figure 2) revealed significant variability in the Mediterranean climate (more pronounced for the latter two countries). The summary in Table 7 shows:
-
A first wet period, more homogeneous for the precipitation series in Morocco (1970–1980), while in the other two countries, it appears longer and is noted between 1970 and 1986 in Algeria and between 1970 and 1987 in Tunisia.
-
The second period is drier, more pronounced in Morocco, and manifests from 1981 to 2001. It was interrupted by a short wet period (three years in the ranges of 1989–1991 and 1996–1997). The climatic drought recorded in Algeria and Tunisia is shorter (1987–2002) and the cycles of deficit years are not only synchronized between the two countries, but also less widespread over time and never exceed three successive dry years (1987–1989, 1993–1994, and 2000–2002).
-
The period of precipitation return is widespread in the studied Maghreb region. It began in the early 2000s (2002 in Morocco and 2003 in Algeria and Tunisia). The regional indices show a cycle confirming the return of rains and marking a break from previous periods of climatic drought. In Morocco, this period extends from 2002 to 2010. In Algeria and Tunisia, it extends until 2013.
-
The last precipitation cycle begins in 2014 in Algeria and Tunisia and in 2015 in Morocco. This time interval is characterized by a pronounced homogeneous drought, except for the year 2018, which was wet in all three countries. We also note that, during this period, there is a succession of dry years for five years in Morocco (2019–2023) and four years in Algeria and Tunisia (2020–2023).
We note that precipitation cycles appear synchronous in this large region of North Africa. Precipitation in Algeria and Morocco is subject to the same large fluctuations. Morocco stands out slightly, especially due to the duration of cycle 2 (the drought observed between 1981 and 2001). The short wet periods of cycle 2 (dry) seem to have marked all three countries (1989, 1990–1992, 1996, 1997, and 1999), as well as the wet year of the last cycle (2018), and, finally, the last dry period. It seems that they affected the same region with the same frequency.

4.2. Precipitation Variability and Water Sector Strategies

The analysis of precipitation series has shown, starting from 2003, two contrasting cycles. The wet cycle that began last year was perceived by the entire region as a hope for the return of more favorable conditions (2003–2013 and 2014). These generous precipitations ensured, for example, a record cereal production of 80 million quintals in Morocco (for the agricultural year 2009/2010). This trend was further confirmed for the year 2012/2013, as average precipitation amounts of 450 mm, the excess precipitation on the Moroccan territory, is equivalent to +20% compared to a normal year (Ministry of Energy, Mines, Water and Environment, 2009, 2010, 2011, 2012, and 2013) [56]. In Algeria, the same signs of change were also observed, with record precipitation values and a record agricultural cereal production of 61.2 million quintals in 2008/2009. The Algerian Minister of Agriculture and Regional Planning [57] even stated that: “Since 1876, the year agricultural statistics began to be established, such production has never been achieved”. Described as exceptional and historic, these rains restored surface hydrostructures, ensuring water resources for the population and agricultural activities for a two-year interval. In the same context, water volumes in Lake Hydrotechnical facilities were restored to approximately 72% of the retention capacity in 2010. This return of rains in the central Maghreb (after the second cycle described as dry) sometimes occurred in the form of extreme episodes, as was the case during the floods (November 2014) that affected central and southwestern Morocco (regions of Agadir, Guelmin, and Marrakech). In the first region, the rains were recorded at very high intensities (250 mm in 3 days between 28 and 30 November 2014), representing almost 90% of the annual average total (280 mm) observed. After this favorable period, the region returned to climatic drought. The deficient precipitation situation reduced the water resources needed for agricultural activities and the population’s water supply. This phenomenon is also observed in the decreasing water volumes in Morocco’s reservoirs (Figure 8).
In January 2024, the Moroccan Minister of Equipment and Water announced a precipitation deficit of over 70% for the September–January period. In Algeria, the situation is similar, as in April 2023, Algerian dams also showed a very low filling rate (30% of the capacity). Tunisia also suffers from this extreme climatic situation, with the National Agricultural Observatory (Onagri) announcing on 6 September 2024, a critical dam filling level of 23.3% (this is similar to the level of the last three years, well below average). This area has also been subjected in recent years to a very high water demand and competition between different uses related to economic development and population growth [58]. Faced with this “permanent water crisis”, competent actors in water policies struggle to implement effective water development management and progressive hydraulic policies, driven by increasing demographic pressure and continuous economic growth. Thus, currently, in Morocco, the most advanced country in constructing water storage works, there are 145 large dams with a storage capacity of 18.67 billion cubic meters. Morocco is also building another 15 structures to increase the water stock to 22 billion cubic meters. In Tunisia, there are 38 dams, the last of which, “Mellegue”, was inaugurated in 2023. With a maximum capacity of 305 million cubic meters, it should allow the development of agriculture by increasing irrigated areas, producing electricity, and regulating liquid runoff to prevent repeated floods in the Jendouba plain.
In Algeria, there are nearly 85 dams currently storing 9 billion cubic meters of water. However, the pressure on water resources has never ceased, and today, the option of desalination seems to be a costly but essential solution for all countries in the central Maghreb. This new water strategy is thus termed a “water mix” [58]. In 2019, Jones et al. [59] estimated that the 15,906 operational desalination plants produce approximately 95 million m3/day of desalinated water for human consumption, with almost 50% of these plants located in the Middle East and North Africa.
This situation of recurrent water stress requires the rigorous management of stocks and demand, and primarily involves a study of the evolution of precipitation and its cycles, which will allow us to better understand the variability of this parameter. It could also facilitate the implementation of methods of investigation and adaptation to new climatic conditions [60,61]. Numerous studies published in recent years have focused on the spatio-temporal variability of precipitation and climatic drought phenomena in the Maghreb regions [62,63,64,65].

5. Conclusions

The analysis of precipitation evolution in the central Maghreb (Morocco, Algeria, and Tunisia) demonstrated significant variability characteristics of the Mediterranean climate (more pronounced for the latter two countries). An initial wet period marks the precipitation series in Morocco (1970–1980), while in the other two countries, it is present between 1970 and 1986.
This study also allowed for the consideration of the peculiarities of climatic drought phenomena that affected the first country over a period of more than two decades (1981–2001). The precipitation deficit affecting this country is strong and persists for long periods (1981–1988, 1989–1991, and 1998–2001).
The climatic drought recorded in Algeria and Tunisia is shorter (1987–2002) and the deficit years are not only synchronized between the two countries, but also less widespread over time, never exceeding three consecutive dry years (1987–1989, 1993–1994, and 2000–2002).
The period of rainfall recovery is widespread in the studied region of the Maghreb. It began in the early 2000s (2002 in Morocco and 2003 in Algeria and Tunisia). This marks an interruption due to the return of periods of climatic drought (e.g., in 2005 and 2006 for Algeria; 2008 for Tunisia; and 2007, 2011, and 2012 for Morocco). Since 2013–2014, a new cycle of quantitatively reduced precipitation has been observed, which can be considered a signal preceding a wet period.
Given the magnitude of the changes currently affecting the Maghreb region and considering the complexity of the spatial and temporal dimensions of the climatic signal, a more in-depth search for causes and feedback could enable a better understanding of the mechanisms underlying this new trend. These investigations should integrate and quantify the role of terrigenous aerosols in the dynamics of the local climate and highlight the importance of sea surface temperatures in regulating precipitation.

Author Contributions

Conceptualization, Z.N. and O.M.; methodology, Z.N.; software, G.M.; validation, Z.N., O.M. and G.M.; formal analysis, Z.N.; investigation, Z.N.; resources, O.M. and G.M.; data curation, Z.N.; writing—original draft preparation, Z.N.; writing—review and editing, G.M.; visualization, O.M.; supervision, O.M.; project administration, Z.N.; funding acquisition, Z.N. and O.M. All authors have read and agreed to the published version of the manuscript.

Funding

This research received no external funding.

Data Availability Statement

The raw data supporting the conclusions of this article will be made available by the authors on request.

Conflicts of Interest

The authors declare no conflicts of interest.

References

  1. Boé, J.; Terray, L.; Habeta, F.; Martin, E. Statistical and dynamical downscaling of the Seine basin climate for hydro-meteorological studies. Int. J. Climatol. 2007, 27, 1643–1655. [Google Scholar] [CrossRef]
  2. Tramblay, Y.; Neppel, L.; Carreau, J.; Sanchez-Gomez, E. Extreme value modelling of daily areal rainfall over Mediterranean catchments in a changing climate. Hydrol. Process. 2012, 26, 3934–3944. [Google Scholar] [CrossRef]
  3. Tramblay, Y.; El Adlouni, S.; Servat, E. Trends and variability in extreme precipitation indices over Maghreb countries. Nat. Hazards Earth Syst. Sci. 2013, 13, 3235–3248. [Google Scholar] [CrossRef]
  4. Blöschl, G.; Hall, J.; Parajka, J.; Perdigão, R.; Merz, B.; Arheimer, B.; Aronica, G. Changing climate shifts timing of European floods. Science 2017, 357, 588–590. [Google Scholar] [CrossRef]
  5. Treydte, K.; Liu, L.; Padrón, R.S.; Martínez-Sancho, E.; Babst, F.; Frank, D.C.; Gessler, A.; Kahmen, A.; Poulter, B.; Seneviratne, S.I.; et al. Recent human-induced atmospheric drying across Europe unprecedented in the last 400 years. Nat. Geosci. 2024, 17, 58–65. [Google Scholar] [CrossRef]
  6. IPCC (Intergovernmental Panel on Climate Change). Full Report 2021–2024. Available online: https://www.ipcc.ch/report/emissions-scenarios/full-report/ (accessed on 25 September 2024).
  7. Amyay, M.; Nouaceur, Z.; Tribak, A.; Okba Kh Taous, A. Caractérisation des évènements pluviométriques extrêmes dans le Moyen Atlas marocain et ses marges. In Proceedings of the Actes du XXV ème Colloque International de Climatologie 2012, Grenoble, France, 5–8 September 2012; pp. 75–80. [Google Scholar]
  8. Laignel, B.; Nouaceur, Z.; Jemai, H.; Abida, H.; Ellouze, M.; Turki, I. Vers un retour des pluies dans le Nord-est tunisien? In Proceedings of the Actes du XXVIIe Colloque de l’Association Internationale de Climatologie, Dijon, France, 2–5 July 2014; pp. 727–732. [Google Scholar]
  9. Nouaceur, Z.; Laignel, B.; Turki, I. Changements climatiques au Maghreb: Vers des conditions plus humides et plus chaudes sur le littoral algérien? Physio-Géo 2013, 7, 307–323. [Google Scholar] [CrossRef]
  10. Nouaceur, Z.; Murărescu, O.; Murătoreanu, G. Climatic change in the Maghreb region: The evolution of the pluviometric parameters in the middle atlas and its margins (Morocco) and its relation to the North Atlantic Oscillation (NAO). Air Water Compon. Environ. 2013, 2013, 285–292. [Google Scholar]
  11. Nouaceur, Z.; Murărescu, O. Rainfall Variability and Trend Analysis of Annual Rainfall in North Africa. Int. J. Atmos. Sci. 2016, 2016, 7230450. [Google Scholar] [CrossRef]
  12. METAP. Available online: https://www.iemed.org/publication/environmental-and-sustainable-development-in-the-mediterranean (accessed on 25 September 2024).
  13. Climate Change Adaptation in the Water Sector in the Middle East and North Africa, Technical Note Prepared by METAP (Mediterranean Environmental Technical Assistance Program) Under the EC Funded SMAP III Project “Promoting Awareness and Enabling a Policy Framework for Environment and Development Integration in the Mediterranean with a Focus on Integrated Coastal Zone Management”. 2007; 25p. Available online: https://www.fao.org/fileadmin/user_upload/rome2007/docs/Climate_Change_Adaptation_Water_Sector_NENA.pdf (accessed on 18 November 2024).
  14. Gregoire, G. Climate Change Adaptation in the Water Sector in the Middle East end North Africa: A Review of Main Issues, Technical Note, METAP (Mediterranean Environmental Technical Assistance Program). 2007; 25p. Available online: https://www.scirp.org/reference/referencespapers?referenceid=2000777 (accessed on 18 November 2024).
  15. Office National de la Météorologie (Algeria). Available online: http://www.meteo.dz/ (accessed on 20 September 2024).
  16. Institut de la Météorologie Nationale (Tunisia). Available online: http://www.meteo.tn/ (accessed on 23 September 2024).
  17. Direction de la Météorologie Nationale (Maroc). Available online: http://www.marocmeteo.ma/ (accessed on 24 September 2024).
  18. Available online: https://www.ncei.noaa.gov/cdo-web/ (accessed on 26 September 2024).
  19. Available online: https://fr.tutiempo.net/climat/afrique.html (accessed on 21 October 2024).
  20. Nouaceur, Z.; Laignel, B.; Turki, I. Changement climatique au Sahel: Des conditions plus chaudes et plus humides en Mauritanie? Secheresse 2013, 24, 85–95. [Google Scholar]
  21. Nouaceur, Z.; Murărescu, O. Rainfall Variability and Trend Analysis of Rainfall in West Africa (Senegal, Mauritania, Burkina Faso). Water 2020, 12, 1754. [Google Scholar] [CrossRef]
  22. Nouaceur, Z.; Laignel, B. Caracterisation des evenements pluviometriques extremes sur la rive Sud du bassin mediterraneen: Etude du cas du quart nord-est algerien. In Proceedings of the Actes du XXVIII Colloque International de Climatologie, Liege, Belgium, 1–4 July 2015; pp. 573–578. [Google Scholar]
  23. Bertin, J. Graphique et mathématique: Généralisation du traitement graphique de l’information. Annales. Hist. Sci. Soc. 1969, 24, 70–101. [Google Scholar] [CrossRef]
  24. Bertin, J. La graphique et le traitement graphique de l’information. In Nouvelle Bibliothèque Scientifique; Flammarion: Paris, France, 1977; p. 277. ISSN 0768-1011. [Google Scholar]
  25. Bertin, J. Graphics and Graphic Information Processing; De Gruyter: Berlin, Germany; Boston, MA, USA, 1981. [Google Scholar] [CrossRef]
  26. Labat, D. Oscillations in land surface hydrological cycle. Earth Planet. Sci. Lett. 2006, 242, 143–154. [Google Scholar] [CrossRef]
  27. Zamrane, Z. Recherche d’indices de variabilité climatique dans des séries hydroclmatiques au Maroc: Identification, positionnement temporel, tendances et liens avec les fluctuations climatiques: Cas des grands bassins de la Moulouya, du Sebou et du Tensift. In Sciences de la Terre; Université Montpellier: Montpellier, France, 2016. [Google Scholar]
  28. Zamrane, Z.; Mahé, G.; Laftouhi, N.-E. Wavelet Analysis of Rainfall and Runoff Multidecadal Time Series on Large River Basins in Western North Africa. Water 2021, 13, 3243. [Google Scholar] [CrossRef]
  29. Murillo, J.C.R.; Filella, M. Significance and Causality in Continuous Wavelet and Wavelet Coherence Spectra Applied to Hydrological Time Series. Hydrology 2020, 7, 82. [Google Scholar] [CrossRef]
  30. Rossi, A. Analyse spatio-temporelle de la variabilité hydrologique du bassin versant du Mississippi: Rôles des fluctuations climatiques et déduction de l’impact des modifications du milieu physique. In Thèse de Géologie—Hydrologie; Université de Rouen: Rouen, France, 2010. [Google Scholar]
  31. De Mesquita, B.B. The Predictioneer’s Game: Using the Logic of Brazen Self-Interest to See and Shape the Future; Random House: New York, NY, USA, 2009; ISBN 9781400067879. [Google Scholar]
  32. Labat, D.; Ababou, R.; Mangin, A. Rainfall–runoff relations for karstic springs. Part II: Continuous wavelet and discrete orthogonal multiresolution analyses. J. Hydrol. 2000, 238, 149–178. [Google Scholar] [CrossRef]
  33. Folland, C.K.; Palmer, T.N.; Parker, D.E. Sahel Rainfall and Worldwide Sea Temperatures. Nature 1986, 320, 602–606. [Google Scholar] [CrossRef]
  34. Giannini, A.; Saravanan, R.; Chang, P. Oceanic forcing of Sahel rainfall on interannual to interdecadal time scales. Science 2003, 302, 1027–1030. [Google Scholar] [CrossRef]
  35. Giannini, A.; Biasutti, M.; Verstraete, M. A climate model-based review of drought in the Sahel: Desertification, the re-greening and climate change. Glob. Planet. Change 2008, 64, 119–128. [Google Scholar] [CrossRef]
  36. Giannini, A.; Salack, S.; Lodunt, T.; Ali, A.; Gaye, A.; Ndiaye, O. A unifying view of climate change in the Sahel linking intra-seasonal, interannual and longer time scales. Environ. Res. Lett. 2013, 8, 024010. [Google Scholar] [CrossRef]
  37. Held, I.; Delworth, T.; Lu, J.; Findell, K.; Knutson, T. Simulation of Sahel drought in the 20th and 21st centuries. Proc. Natl. Acad. Sci. USA 2005, 102, 17891–17896. [Google Scholar] [CrossRef]
  38. Biasutti, M.; Giannini, A. Robust Sahel drying in response to late 20th century forcings. Geophys. Res. Lett. 2006, 33, L11706. [Google Scholar] [CrossRef]
  39. Caminade, C.; Terray, L. Twentieth century Sahel rainfall variability as simulated by the ARPEGE AGCM, and future changes. Clim. Dyn. 2010, 35, 75–94. [Google Scholar] [CrossRef]
  40. Biasutti, M. Forced Sahel rainfall trends in the CMIP5 archive. J. Geophys. Res. Atmos. 2013, 118, 1613–1623. [Google Scholar] [CrossRef]
  41. Biasutti, M. Rainfall trends in the African Sahel: Characteristics, processes, and causes. Wiley Interdiscip. Rev. Clim. Change 2019, 10, e591. [Google Scholar] [CrossRef] [PubMed]
  42. Boughdadi, S.; Ait Brahim, Y.; El Alaoui El Fels, A.; Saidi, M.E. Rainfall Variability and Teleconnections with Large-Scale Atmospheric Circulation Patterns in West-Central Morocco. Atmosphere 2023, 14, 1293. [Google Scholar] [CrossRef]
  43. Hakam, O.; Baali, A.; Ait Brahim, Y.; El Kamel, T.; Azennoud, K. Regional and Global Teleconnections Patterns Governing Rainfall in the Western Mediterranean: Case of the Lower Sebou Basin, North-West Morocco. Model. Earth Syst. Environ. 2022, 8, 5107–5128. [Google Scholar] [CrossRef]
  44. Climate Explorer. Available online: https://climexp.knmi.nl/start.cgi (accessed on 23 October 2024).
  45. Unibversity of East Anglia. Available online: https://crudata.uea.ac.uk/cru/data/moi/ (accessed on 25 October 2024).
  46. Palutikof, J.P.; Conte, M.; Casimiro Mendes, J.; Goodess, C.M.; Espirito Santo, F. Climate and climate change. In Mediterranean Desertification and Land Use; Brandt, C.J., Thornes, J.B., Eds.; John Wiley and Sons: London, UK, 1996. [Google Scholar]
  47. Conte, M.; Giuffrida, A.; Tedesco, S. The Mediterranean Oscillation. In Impact on Precipitation and Hydrology in Italy; Publications of the Academy of Finland: Helsinki, Finland, 1989. [Google Scholar]
  48. Criado-Aldeanueva, F.; Soto-Navarro, J. Climatic Indices over the Mediterranean Sea: A Review. Appl. Sci. 2020, 10, 5790. [Google Scholar] [CrossRef]
  49. Palutikof, J.P. Analysis of Mediterranean climate data: Measured and modelled. In Mediterranean Climate: Variability and Trends; Bolle, H.J., Ed.; Springer: Berlin, Germany, 2003. [Google Scholar]
  50. Brunetti, M.; Maugeri, M.; Nanni, T. Atmospheric circulation and precipitation in Italy for the last 50 years. Int. J. Climatol. 2002, 22, 1455–1471. [Google Scholar] [CrossRef]
  51. Maheras, P.; Xoplaki, E.; Kutiel, H. Wet and dry monthly anomalies across the Mediterranean basin and their relationship with circulation, 1860–1990. Theor. Appl. Climatol. 1999, 64, 189–199. [Google Scholar] [CrossRef]
  52. Dünkeloh, A.; Jacobeit, J. Circulation dynamics of Mediterranean precipitation variability 1948–1998. Int. J. Climatol. 2003, 23, 1843–1866. [Google Scholar] [CrossRef]
  53. Lopez-Bustins, J.A.; Lemus-Canovas, M. The influence of the Western Mediterranean Oscillation upon the spatio-temporal variability of precipitation over Catalonia (northeastern of the Iberian Peninsula). Atmos. Res. 2020, 236, 104819. [Google Scholar] [CrossRef]
  54. Sušelj, K.; Bergant, K. Mediterranean Oscillation Index. Geophys. Res. Abstr. 2006, 8, 02145. [Google Scholar]
  55. Maraun, D. What Can We Learn from Climate Data? Methods for Fluctuation Time/Scale and Phase Analysis. Ph.D. Thesis, Universitât Postdam, Potsdam, Germany, 2006; p. 127. [Google Scholar]
  56. Royaume du Maroc, Ministere de la Transition Energetique et du Developpment Durable—Departement du Developpement Durable. Available online: https://www.environnement.gov.ma/fr/ (accessed on 10 October 2024).
  57. Ministère de L’agriculture et du Développement Rural, Algerie. Available online: https://fr.madr.gov.dz (accessed on 10 October 2024).
  58. El Jihad, M.D.; Taabni, M. L’eau au Maghreb: Quel “mix” hydrique face aux effets du changement climatique? Zeineddine Nouaceur. In Eau et Climat en Afrique du Nord et au Moyen Orient; Nouaceur, Z., Ed.; Ed. Transversal: Targoviste, Romania, 2017; pp. 11–25. ISBN 978-606-605-166-8. [Google Scholar]
  59. Jones, E.; Qadir, M.; van Vliet, M.T.H.; Smakhtin, V.; Kang, S.M. The state of desalinisation and brine production: A global outlook. Sci. Total Environ. 2019, 657, 1343–1356. [Google Scholar] [CrossRef]
  60. Dioha, E.C.; Chung, E.S.; Ayugi, B.O.; Babaousmail, H.; Sian, K.T.C.L.K. Quantifying the Added Value in the NEX-GDDP-CMIP6 Models as Compared to Native CMIP6 in Simulating Africa’s Diverse Precipitation Climatology. Earth Syst. Environ. 2024, 8, 417–436. [Google Scholar] [CrossRef]
  61. Ayugi, B.O.; Chung, E.-S.; Babaousmail, H.; Sian, K.T.C.L.K. Characterizing the performances of different observational precipitation products and their uncertainties over Africa. Environ. Res. Lett. 2024, 19, 064009. [Google Scholar] [CrossRef]
  62. Jemai, H.; Ellouze, M.; Abida, H.; Laignel, B. Spatial and temporal variability of rainfall: Case of Bizerte-Ichkeul Basin (Northern Tunisia). Arab. J. Geosci. 2018, 11, 177. [Google Scholar] [CrossRef]
  63. Achite, M.; Wałęga, A.; Toubal, A.K.; Mansour, H.; Krakauer, N. Spatiotemporal Characteristics and Trends of Meteorological Droughts in the Wadi Mina Basin, Northwest Algeria. Water 2021, 13, 3103. [Google Scholar] [CrossRef]
  64. Bouras, E.H.; Jarlan, L.; Er-Raki, S.; Balaghi, R.; Amazirh, A.; Richard, B.; Khabba, S. Cereal Yield Forecasting with Satellite Drought-Based Indices, Weather Data and Regional Climate Indices Using Machine Learning in Morocco. Remote Sens. 2021, 13, 3101. [Google Scholar] [CrossRef]
  65. Djebbar, A.; Goosse, H.; Klein, F. Robustesse du lien entre les précipitations en Afrique du Nord et les modes standards de variabilité atmosphérique au cours du dernier millénaire. Climate 2020, 8, 62. [Google Scholar] [CrossRef]
Figure 1. Location of weather stations (x, longitude; y, latitude; z, altitude).
Geosciences 15 00080 g001aGeosciences 15 00080 g001b
Figure 2. The MGCTI–Chronological graphic matrix of data processing applied to precipitation (1970–2023).
Geosciences 15 00080 g002
Figure 3. Evolution of the regional index calculated for all stations (from the MGCTI method) and NAO index (December, January, and February) (five-year moving average for the period 1970–2023).
Geosciences 15 00080 g003
Figure 4. Annual rainfall in Casablanca, Dar El Beida, and Tunis (5-year moving averages, 1970–2022).
Geosciences 15 00080 g004
Figure 5. Wavelet spectra of monthly precipitation accumulations.
Geosciences 15 00080 g005
Figure 6. Wavelet coherence analysis between average monthly rain in Casablanca, Dar El Beida, and Tunis, and Northern Atlantic Oscillation (NAO) values: (A)—Wavelet Coherence; (B)—NAO values.
Geosciences 15 00080 g006
Figure 7. Wavelet coherence analysis between average monthly rain in Casablanca, Dar El Beida, and Tunis, and MOIs (Mediterranean Oscillation Indices). (A)—Wavelet Coherence; (B)—MOI values.
Geosciences 15 00080 g007
Figure 8. Monthly water volumes in Morocco’s reservoirs between January 2015 and December 2023 (centerd reduced difference) (source: General Directorate of Hydraulics), http://maghreb-assoudoud.water.gov.ma/fr/site/today, accessed on 20 September 2024.
Geosciences 15 00080 g008
Table 1. Distribution and qualification of annual precipitation amounts according to quintiles and the Graphic Matrix (MGCTI) key (Q = quintile, Me = median, Min = Minimum, Max = Maximum, Avg = Average, Standard Deviation).
StationQ1Q2Q3Q4MeMin
1ORAN256.5299.5379.9429.5338.3171.7
2BEJAIA615737.3792948767.5320
3DAR EL BEIDA456.8551704.7761.9612.1280
4ECHLEF274.3334404.9474.1373.5188.7
5El Bayed206.1256.2277.4327.9270.1106.7
6Djelfa236291328.9387.1318.9142.2
7Biskra63.892.4128185.4103.327.7
8Batna219.6283.6327.7393.7299159.2
9Tébessa278.3346.7380.9444.8370.4192
10ANNABA530.1584.4655.8749.5621349.5
11Constantine371.3463.5514641.2481.6247.6
12SKIKDA606666.3750.6844.1729.8330.5
13TETOUAN427.7496.1640.2756.6574.5304.8
14TAZA386.4451.7555689.4535.3114.1
15MEKNES354.4409.2503.6629.2467.6181.5
16FES342.7416.4507596.2457.3210.1
17RABAT349439.7502.5565.4502.5208.8
18CASABLANCA259.7340.1413.8505.1368.1107.7
19SAFI216.1272.8330.2441318.5104.4
20MARRAKECH131.9196.8244.3309.922567.3
21OUARZAZET70.393.7115154.3107.225.1
22TOUZEUR5074.786.7106.484.122.7
23SFAX142.9182.2227.5290.3202.369.1
24GAFSA108132.7165.8216.4143.336.6
25TUNIS320.5419.6498.5585.2460.1252.1
26BIZERTE467.4549.2689.3768.4655.2351
27TABARKA807.5944.81023.61161.9989.8574.5
28JENDOUBA336.5410.5484.4566.3460.3244.9
29KAIRAOUANE221.5280.4323.4367.4299.7128.8
Table 2. Trend of annual rainfall according to the quintiles.
ThresholdsQ1Q2MedianQ3Q4
Distribution of values<Q1Q1–Q2Q2–MedianQ3–Q4>Q4
(%)(0–20%)(20–40%)(40–50%)’
Median–Q3
(50–60%)
(60–80%)(80–100%)
Annual rainfallVery dryDryMedianWetVery wet
Trend at station
Table 3. Assigning a number ranging.
Annual rainfallVery dryDryMedianWetVery wet
Trend at station12345
Table 4. Regional index “RI”.
Annual rainfallVery dryDryMedianWetVery wet
Regional trendNegatif index (−)
Drought conditions
Not expressedPositif index (+)
Wet conditions
Table 5. Consistency between monthly mean precipitation at three stations in the study region and the NAO index (%).
Variability Mode1–22–44–88–1616–32
Dar El Beida (Algeria)73.9375.0572.8862.3559
Casablanca (Morocco)72.1164,6461.3871.5861.64
Tunis (Tunisia)72.5576.4970.6179.4074.43
Table 6. Consistency between monthly mean precipitation at three stations in the study region and the MOI (%).
Variability Mode1–22–44–88–1616–32
Dar El Beida (Algeria)93.2864.0469.3859.7381.08
Casablanca (Morocco)96.2278.4666.2869.1876.4
Tunis (Tunisia)92.5767.4668.0761.5370.36
Table 7. Main climatic cycles in the central Maghreb.
CountryCycle 1Cycle 2Cycle 3Cycle 4
AlgeriaWet phase
(1970–1986)
Regional index + 0.26
Drought phase
(1987–2002)
Intercalary wet phases in
1990–1992, 1996, 1997, and 1999
Regional index
- 0.20
Wet phase (2003–2013)
Succession of surplus years,
except for the year 2008 (index—0.40)
Regional index + 0.57
Drought phase (2014–2023), only the year 2018 is humid (+0.85)
Regional index–0.76
MarocWet phase (1970–1980)
Shorter, but the trend is more homogeneous
Regional index + 0.53
Drought phase
(1981–2001)
Intercalary wet phases in 1989–1991 and
1996–1997
The years 1998, 2000, and 2001 are drier
Regional index
–0.28
Wet phase (2002–2014)
marked by a variability in annual accumulations
Between 2008 and 2010, a succession of wet years (with a negative index of +2.14 in 2010)
Regional index
+ 0.48
Drought phase (2015–2023) that starts one year later than in other countries—only one truly wet year (2018 with +1.35)
Regional index–0.94
TunisiaWet phase (1970–1987)
Longer, and marked by strong variability
+ 0.07
Drought phase (1988–2002)
Intercalary wet phases in
1990–1992, 1996, 1997, and 1999
Regional index
- 0.16
Wet phase (2003–2013)
Succession of surplus years,
except for the year 2008 (index—1.30)
Regional index
+ 0.46
Drought phase (2014–2023)—only the year 2018 is humid (+0.86)
Regional index–0.38
Disclaimer/Publisher’s Note: The statements, opinions and data contained in all publications are solely those of the individual author(s) and contributor(s) and not of MDPI and/or the editor(s). MDPI and/or the editor(s) disclaim responsibility for any injury to people or property resulting from any ideas, methods, instructions or products referred to in the content.

