1. Introduction
There is an increasing demand for sustainable and eco-friendly energy sources, with natural hydrogen emerging as an alternative among various clean options. Natural or geologic hydrogen, which forms and accumulates in the subsurface through natural processes, offers a promising potential source. While biotic hydrogen sources are known, hydrogen has also been found in recent hot igneous rocks, where no microbes can survive, suggesting possible abiotic origins [
1,
2]. The discovery of relatively pure hydrogen in groundwater reservoirs in Mali [
3] and the detection of molecular hydrogen (H
2) in various deep and shallow boreholes without a clear origin have led to the concept of natural hydrogen. Additionally, several studies from different countries have reported natural hydrogen degassing from the Earth’s surface [
3,
4,
5,
6,
7,
8,
9,
10,
11].
Quantifying the amount of hydrogen generation from ultramafic rocks during serpentinization is essential for understanding the potential of this process for natural hydrogen generation. Laboratory experiments, geochemical modeling, and field observations provide a range of potential production rates, reflecting the variability in environmental conditions.
The amount of hydrogen generation from ultramafic rocks depends on several factors, including temperature, pressure, rock composition, water availability, and other specific geological conditions under which serpentinization occurs. The serpentinization process is highly temperature-dependent, with higher temperatures generally accelerating the reactions involved. In low-temperature environments, typically ranging from 25 °C to 200 °C, the amount of hydrogen generation is relatively slow, often falling within the range of 0.01 to 12 mmol/kg based on experimental studies [
12,
13,
14,
15,
16,
17]. However, as temperatures increase to between 200 °C and 400 °C, the rate of hydrogen production can rise significantly, reaching values up to 244 mmol/kg [
18,
19,
20,
21,
22,
23,
24]. This increase is due to the enhanced reactivity of ultramafic minerals, such as olivine and pyroxene, at higher temperatures. Another factor that influences hydrogen production during serpentinization is pressure. At elevated pressures, the interaction between water and ultramafic rocks becomes more intense, leading to more efficient serpentinization and greater hydrogen output. Pressure can enhance serpentinization reactions by accelerating mineral–fluid interactions and facilitating deeper water penetration into ultramafic rocks, leading to increased hydrogen production. This influence extends beyond simple reaction rates, as pressure can also promote phase transitions in olivine and modulate porosity and permeability, ultimately controlling fluid migration and hydrogen release in subsurface reservoirs [
25,
26,
27,
28,
29].
This study provides a comprehensive analysis of available experimental data on hydrogen generation from serpentinization and introduces a novel multi-regression approach to model the process. Through this approach, a set of equations is developed that can estimate the hydrogen generation rate in ultramafic rock bodies based on key factors such as temperature and pressure conditions at the subsurface. These equations serve as a valuable tool for assessing hydrogen production in natural geological environments where serpentinization occurs.
In addition to the regression-based equations, the study introduces a five-step method for the quantitative volumetric calculation of hydrogen possibly produced by ultramafic rock bodies. This method involves determining the volume of ultramafic rock within a given area, calculating the potential hydrogen production from the protolith (the original rock before alteration), and incorporating factors such as the rock’s mineral composition and the extent of serpentinization. By applying this methodology, the study enables a more detailed understanding of how much hydrogen has been generated by serpentinization over geological time scales.
The findings from this study offer insight into the potential hydrogen volumes present in regions where ultramafic rocks are present and have undergone serpentinization. The approach helps estimate the quantity of hydrogen that could have been generated in these areas, allowing researchers and energy explorers to assess the likelihood of discovering economically viable hydrogen reservoirs. Furthermore, this model can guide future exploration efforts by identifying regions with favorable conditions for hydrogen generation, thereby improving the understanding of natural hydrogen systems and contributing to the development of sustainable energy sources.
2. Serpentinization
Since serpentinization occurs in ultramafic rocks, a brief description of these rocks and their key rock-forming minerals is provided for context. Ultramafic rocks are igneous rocks with a silica content of less than 45%, and they are rich in iron (Fe) and magnesium (Mg). The primary minerals found in ultramafic rocks are listed in
Table 1 [
30,
31].
The chemical stability of ultramafic minerals can be understood through Bowen’s Reaction Series (BRS), which describes the order of mineral crystallization as magma cools. Developed by Norman L. Bowen in the early 20th century, this model explains how different minerals solidify at specific temperatures, offering insight into the formation and stability of igneous rocks. One key aspect of BRS is that minerals crystallizing at higher temperatures—such as olivine—are less stable at the Earth’s surface, whereas minerals that form at lower temperatures tend to be more resistant to weathering and alteration. This is because high-temperature minerals are far from their equilibrium state under surface conditions, making them highly reactive. For instance, olivine, which crystallizes early in the series, is particularly prone to alteration, including transformation through serpentinization when exposed to water.
When ultramafic rocks interact with water at temperatures less than about 400 °C, the stability limit of olivine, they undergo serpentinization reactions, producing serpentine and various associated minerals. This process frequently results in the serpentinization fluids containing high concentrations of molecular hydrogen [
20,
32,
33,
34,
35,
36]. Abundant in dunite and peridotite, olivine is a dominant mineral within the Earth’s mantle, oceanic crust, and ophiolitic terrains [
37,
38,
39]. The alteration of olivine has been attributed by researchers to generate molecular hydrogen:
The above general equation shows how olivine transforms into serpentine and magnetite during serpentinization, and hydrogen is released by this reaction [
40]. While other ultramafic minerals, such as orthopyroxenes and clinopyroxenes, can undergo serpentinization and generate hydrogen, they typically produce lower amounts at slower rates due to their lower reactivity and more complex structures [
33].
Hydrogen production during this process is coupled to the oxidation of ferrous iron (Fe
II) to ferric iron (Fe
III) through a reaction with water. This process creates reducing conditions that facilitate water splitting and hydrogen generation in the following general form:
The amount of H
2 generated during serpentinization is complex to predict and depends on how iron (Fe) is partitioned among the reaction products. Ferric iron (Fe
3+) incorporated into serpentine and magnetite contributes to hydrogen production, while ferrous iron (Fe
2+) in brucite or serpentine does not. Therefore, the distribution of Fe from olivine—whether into magnetite, serpentine, or brucite—directly affects the amount of hydrogen generated as the reaction proceeds [
32,
36].
2.1. Quantification of Chemical Stability of Olivine, Orthopyroxene, and Clinopyroxene
In this section, the quantification of the chemical stability of olivine, orthopyroxene, and clinopyroxene is discussed, with a focus on their structural and compositional characteristics. This analysis serves as a foundation for later sections of the paper, where these stability metrics will be utilized in volumetric calculations of hydrogen generation from ultramafic rocks through serpentinization. By understanding the relative reactivity and Fe-driven alteration potential of these minerals, a more accurate estimation of hydrogen production during the serpentinization process can be achieved.
The chemical stability and Fe content of olivine, orthopyroxene, and clinopyroxene are critical factors in their behavior during serpentinization. These minerals differ significantly in their structural and compositional characteristics, which govern their reactivity and alteration resistance. Iron content significantly affects the chemical behavior of these minerals, particularly regarding their susceptibility to oxidation, as well as their hydrogen generation potential. Typically, olivine, due to its chemical structure (nesosilicate), can accommodate more divalent cations (iron or magnesium) compared to pyroxene, which has a single-chain structure that allows for less cation substitution. Additionally, as magma cools, Mg and Fe will be depleted as other minerals form at lower temperatures. Therefore, in the same magma composition, olivine generally tends to have higher Fe content compared to orthopyroxene and clinopyroxene.
Table 2 presents the Fe content range for some key ultramafic minerals formed from the same magma composition.
Olivine exhibits the lowest chemical stability among the three minerals, largely due to its simple isolated tetrahedral structure, which lacks strong chain or sheet bonding, making it more prone to chemical weathering. The high reactivity of olivine corresponds to lower thermodynamic stability under surface conditions. Its Fe content, typically ranging from 10% to 35% FeO [
41,
42], is the highest, making it highly susceptible to oxidation. The oxidation of Fe
2+ to Fe
3+ in olivine promotes rapid alteration, forming secondary minerals like serpentine and magnetite. Given its high Fe content and structural simplicity, olivine is assigned a combined stability rank of 1.0 (
Table 2).
Orthopyroxene is more stable than olivine due to its single-chain silicate structure, which offers greater resistance to weathering. Orthopyroxene has lower Gibbs free energy under weathering conditions compared to olivine, reflecting its greater resistance to alteration. Its Fe content, typically 5% to 25% FeO [
41,
42], is moderate, making it less prone to oxidation-driven alteration than olivine. The presence of Fe
2+ is less influential on its overall stability because the chain structure shields it from direct exposure to reactive environments. Orthopyroxene is tentatively assigned a combined stability rank of 0.7.
Clinopyroxene is the most stable of the three minerals. Its more complex chain structure and incorporation of calcium reduce the reactivity of the mineral by lowering its Gibbs free energy and enhancing its stability. Additionally, relatively low Fe content (2% to 15% FeO) [
41,
42] significantly enhances its resistance to chemical weathering and oxidation. Clinopyroxene is assigned a combined stability rank of 0.5, reflecting its superior resilience.
Therefore, assuming olivine has a value of 1.0 (or 100%) in terms of its susceptibility to chemical alteration, other minerals can be ranked relative to olivine based on their stability under surface conditions (e.g., temperature of 23 °C and pressure of 1 bar) (
Table 2). Generally, a lower number indicates that a mineral is more stable and less prone to alteration in surface environments. In
Table 2, olivine is assigned a stability value of 1, serving as the reference point. Other minerals are ranked relative to olivine, with smaller values representing more chemical stability. These values are provisional and provide a preliminary estimation based on the general thermodynamic principles of mineral stability. Future experimental research may refine these ranking values better to capture the complexities of mineral stability in natural systems.
2.2. Hydrogen Generation Rates in Serpentinization
Assessing the volumes of hydrogen generated during the serpentinization is crucial to evaluating its potential as a hydrogen source. The primary factors controlling in situ serpentinization and the corresponding rates and volumes of hydrogen production include mineral composition, temperature, pressure, and the water-to-rock ratio (w/r). The composition of minerals plays a significant role, particularly with Fe-rich olivine producing more hydrogen than Fe-poor olivine [
32]. Hydrogen production is most efficient within the temperature range of 200–315 °C, although serpentinization can occur over a broader range [
36,
43]. The water-to-rock ratio (w/r) is crucial as it influences the redox conditions. As the w/r increases, more hydrogen is generated per unit of rock [
32]. This balance between generation, concentration, and environmental conditions governs the efficiency of natural hydrogen production during serpentinization.
The process of serpentinization of olivine and other ultramafic minerals under varying conditions of temperature and pressure has been experimentally studied to understand the production of gases such as carbon monoxide (CO), methane, and hydrogen. Huang et al. [
44] provided a dataset of serpentinization experiments, noting the multifaceted controls on hydrogen and hydrocarbon production and the need for computational analysis. The following review summarizes key studies that have investigated the gas generation potential during the alteration of olivine, dunite, and peridotite under different conditions, highlighting the impacts of variables such as temperature, pressure, mineral grain size, pH, and the presence of other minerals or solutions.
Berndt et al. [
20] conducted experiments on the serpentinization of powdered olivine (30–80 µm) at 300 °C and 500 bars, reporting hydrogen generation up to 158 mmol/kg after 69 days. Similarly, Allen and Seyfried Jr. [
24] studied the reaction of olivine and pyroxene minerals (average size of 60 µm) with brine at 400 °C and 500 bars, which produced dissolved hydrogen concentrations exceeding 25 mmol/kg. Grozeva et al. [
21] explored the serpentinization and carbonation of harzburgite in seawater at 300 °C and 350 bars, yielding approximately 65 mmol/kg of hydrogen. Additionally, Miller et al. [
15] reported a maximum hydrogen generation of 0.47 mmol/kg from partially serpentinized Oman dunite (53–212 µm) at a lower temperature of 100 °C after three months of experimentation. McCollom and Seewald [
19] investigated hydrogen production from fine olivine powder under conditions of 300 °C and 350 bars, with rates reaching up to 74 mmol/kg. Jones et al. [
17] found that serpentinization of olivine sieved to 100 µm at 200 °C and 300 bars resulted in hydrogen concentrations exceeding 12 mmol/kg. Marcaillou et al. [
23] quantified hydrogen production during the alteration of peridotite particles (~1 µm) at 300 °C and 300 bars over 70 days, with a total hydrogen yield of 14 mmol/kg. McCollom et al. [
18] demonstrated that increasing pH levels accelerated olivine alteration and enhanced hydrogen production, reaching 105 mmol/kg under conditions of 230 °C and 350 bars with olivine grains sized 34–212 µm. Neubeck et al. [
13] and Mayhew et al. [
14] studied hydrogen production at lower temperatures. Neubeck et al. [
13] reported hydrogen production rates of 0.5 to 1.5 mmol/kg during low-temperature (30–70 °C) serpentinization, while Mayhew et al. [
14] observed hydrogen yields ranging from 0.04 to 0.3 mmol/kg during low-temperature serpentinization of peridotite (53–212 µm) at 55–100 °C. Mayhew et al. further found that the presence of magnetite enhanced hydrogen production to 0.5 mmol/kg at 55 °C. Okland et al. [
12] investigated hydrogen production from unaltered, moderately altered, and highly altered dunite powders (<63 µm) reacted with deionized water at 25 °C for 99 days, observing a maximum hydrogen yield of approximately 0.012 mmol/kg from highly altered dunite. McCollom and Donaldson [
16] also conducted laboratory experiments on olivine and harzburgite grains (53–212 µm) under near-surface conditions (90 °C) over six to nine months, reporting hydrogen yields of approximately 0.2 mmol/kg, indicating that low-temperature serpentinization may produce significantly less hydrogen than previously suggested. Huang et al. [
22] explored the effects of acidic and alkaline solutions on hydrogen production during the serpentinization of peridotite at 300 °C and 3000 bars. They found that olivine grains (>250 µm) reacted with alkaline solutions (pH = 13.5) and produced 244 mmol/kg of hydrogen after eight days, a substantially higher amount compared to serpentinization in saline solutions (0.5 M NaCl).
Several researchers have conducted a direct gas analysis of vents from mid-ocean ridges that are related to serpentinization. Donval et al. [
45] reported that hydrothermal fluids at the Rainbow vent, at approximately 360 °C, have a hydrogen concentration of 13 mmol/kg. Charlou et al. [
46] studied the geochemistry of vent fluids issuing from ultramafic rocks at the Rainbow hydrothermal field at the Mid-Atlantic ridge and reported the emission of 16 mmol/kg of hydrogen, more than 40% of the total gas volume extracted from the fluids. In another study by Kelley et al. [
47] in the Lost City hydrothermal Field at the Mid-Atlantic Ridge, hydrogen concentrations were recorded to be up to 15 mmol/kg.
Several geochemical models have provided some insight from ultramafic minerals serpentinization and hydrogen generation. A modeling study by McCollom and Bach [
36] reported that the concentration of hydrogen is highly sensitive to temperature changes, peaking at approximately 360 mmol/kg at 315 °C. The concentration decreases significantly at temperatures outside this range, dropping to less than 70 mmol/kg at 400 °C and around 7 mmol/kg at 50 °C. Based on the modeling study by Klein et al. [
32], the predicted concentrations of hydrogen depend on many factors, whereas rock composition and temperature have a major impact. Generally, hydrogen generation in olivine-dominated lithologies such as peridotite is greater than during serpentinization of pyroxene-dominated lithologies. Based on their modeling, the serpentinization process can generate around 200 to 340 mmol/kg hydrogen at a temperature range of between 250 and 340 °C. At lower temperatures (<200 °C), hydrogen yields typically range from 50 to 150 mmol/kg of rock. Based on thermodynamic modeling for serpentinized mantle rocks, Albers et al. [
33] reported that serpentinization at slow-spreading mid-ocean ridges can produce 200–350 mmol H
2 per kg of rock, while magma-poor rifted margins and ultraslow-spreading ridges yield 120–300 mmol and 50–150 mmol hydrogen per kg, respectively, at temperatures below 200 °C. In general, serpentinization processes at slow-spreading mid-ocean ridges and related settings produce approximately 150–350 mmol of hydrogen per kg of rock, varying with temperature and geological conditions [
33].
Based on Liu et al. [
48], hydrogen production from serpentinization-involved chemical processes requires the consumption of 15 moles of olivine per mole of hydrogen, yielding a theoretical maximum of 454 mmol hydrogen per kilogram of rock. However, the partitioning of ferrous iron into serpentine or brucite reduces this potential yield. Considering that approximately half of the iron in serpentine is trivalent and contributes to hydrogen production, the actual hydrogen yield from one kilogram of mantle rock is estimated at 227 mmol per kg of the rock. This value is very close to the experimental study by Huang et al. [
22] and falls within the reported values of geochemical studies [
32,
33,
36].
Direct extraction of hydrogen from serpentinized rocks was conducted by Etiope [
49]. He presented a dataset of hydrogen extracted from 58 rock samples collected from various ophiolites in Greece, peridotites in Turkey, and chromitites and adjacent talc schists from an Archean-Paleoproterozoic greenstone belt in Brazil. The highest hydrogen concentration of 16.2 mL/kg (0.72 mmol/kg) was reported from serpentinized dunite. In the case of ophiolitic settings, it is generally supposed to happen at low temperatures.
According to McCollom et al. [
43], hydrogen production typically increases up to 300 °C before declining. The reaction rates observed in their study indicate that it would take approximately 400 years for 1 mm grain-size olivine to fully serpentinize at 230 °C and over 60,000 years at 25 °C.
These studies demonstrate the significant variability in gas production rates during the serpentinization of ultramafic minerals. In general, the findings suggest that higher temperatures and pressures generally increase gas yields, while factors like pH and the presence of certain minerals can further enhance or inhibit these processes.
Table 3 provides a summarized comparison of the key studies reviewed.
2.3. Hydrogen Generation Rate Calculation
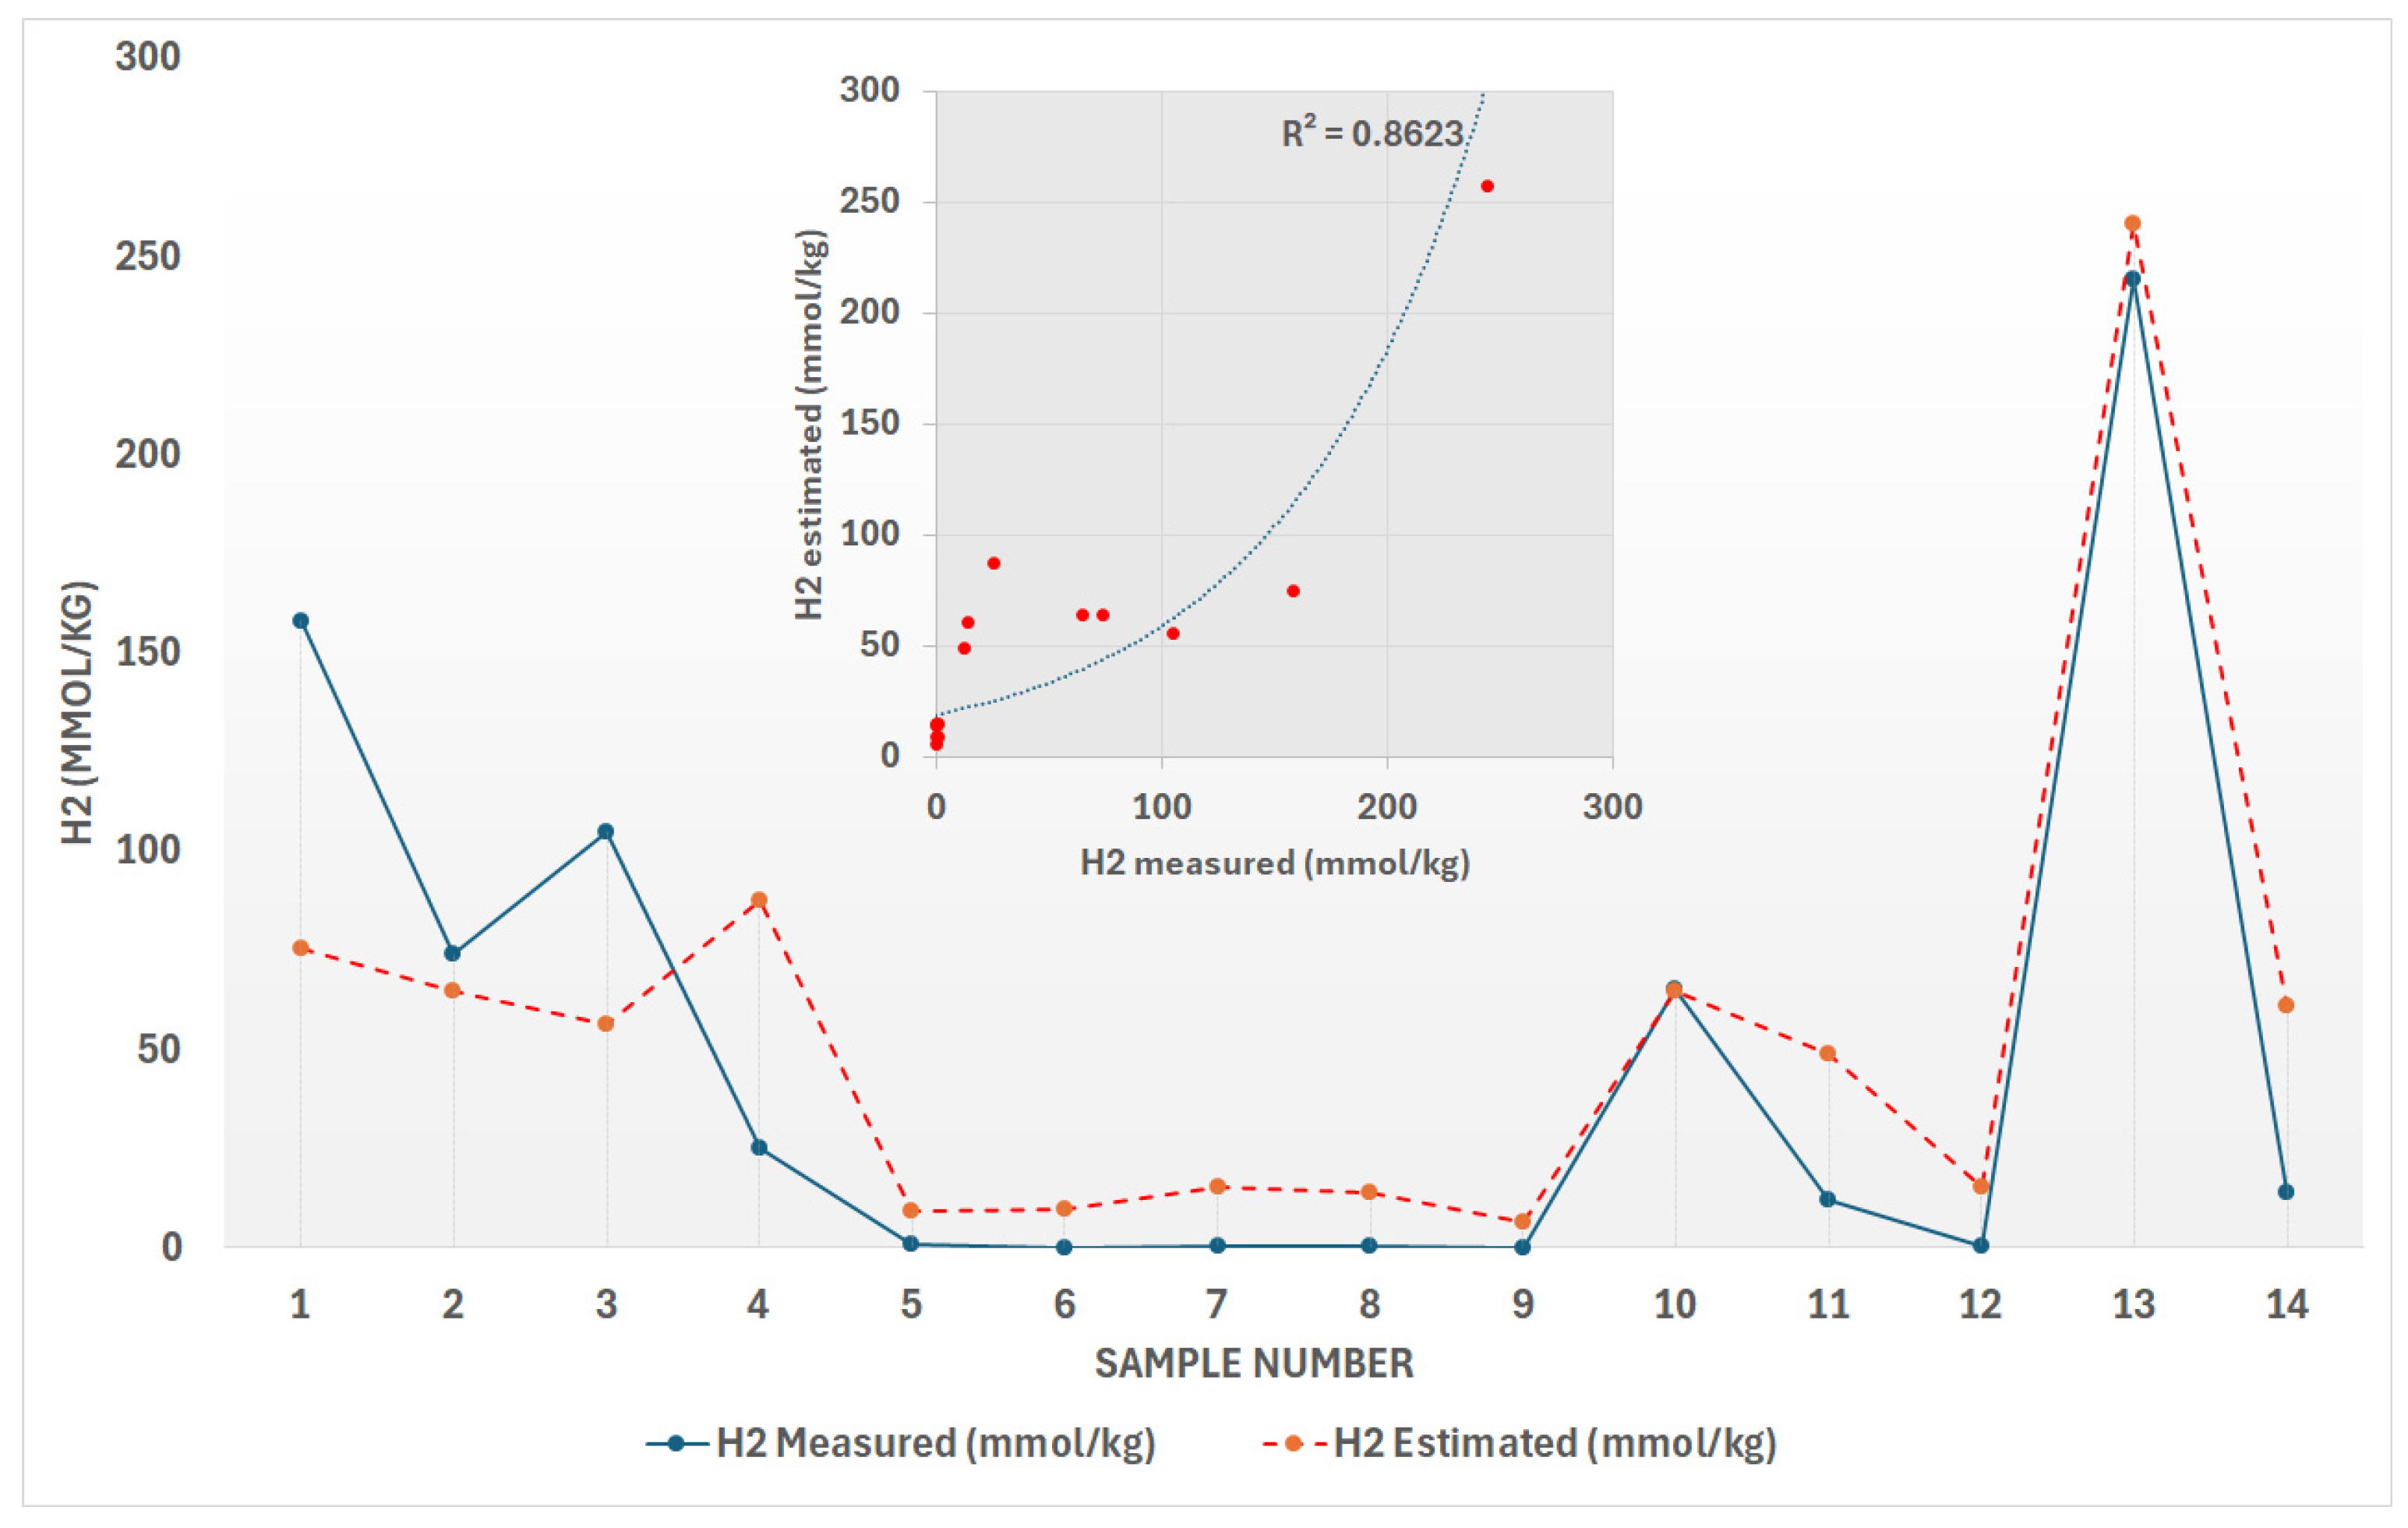
A multiple regression analysis was conducted on the experimental laboratory data (see
Table 3) to develop an empirical equation (Equation (3)) that estimates the hydrogen generation rate as a function of temperature and pressure. Although the sample size was small, the analysis revealed a strong correlation between these variables and hydrogen rate of generation (R
H2), with the model achieving a coefficient of determination (R
2) of approximately 0.86 (
Figure 1). This high R
2 value indicates that the model effectively captures the relationship between temperature, pressure, and hydrogen production:
where T represents the temperature (°C) and P denotes the pressure in bars. This empirical linear equation is valid up to a temperature of around 315 °C, where hydrogen generation reaches its peak, as observed by McCollom and Bach [
36]. Beyond this range, the reaction diminishes significantly, with hydrogen concentrations decreasing to 25 mmol/kg at 400 °C [
24].
Given these constraints, it may be more accurate to model the process using two separate equations: one for temperatures below 315 °C and another for the range between 315 °C and 400 °C.
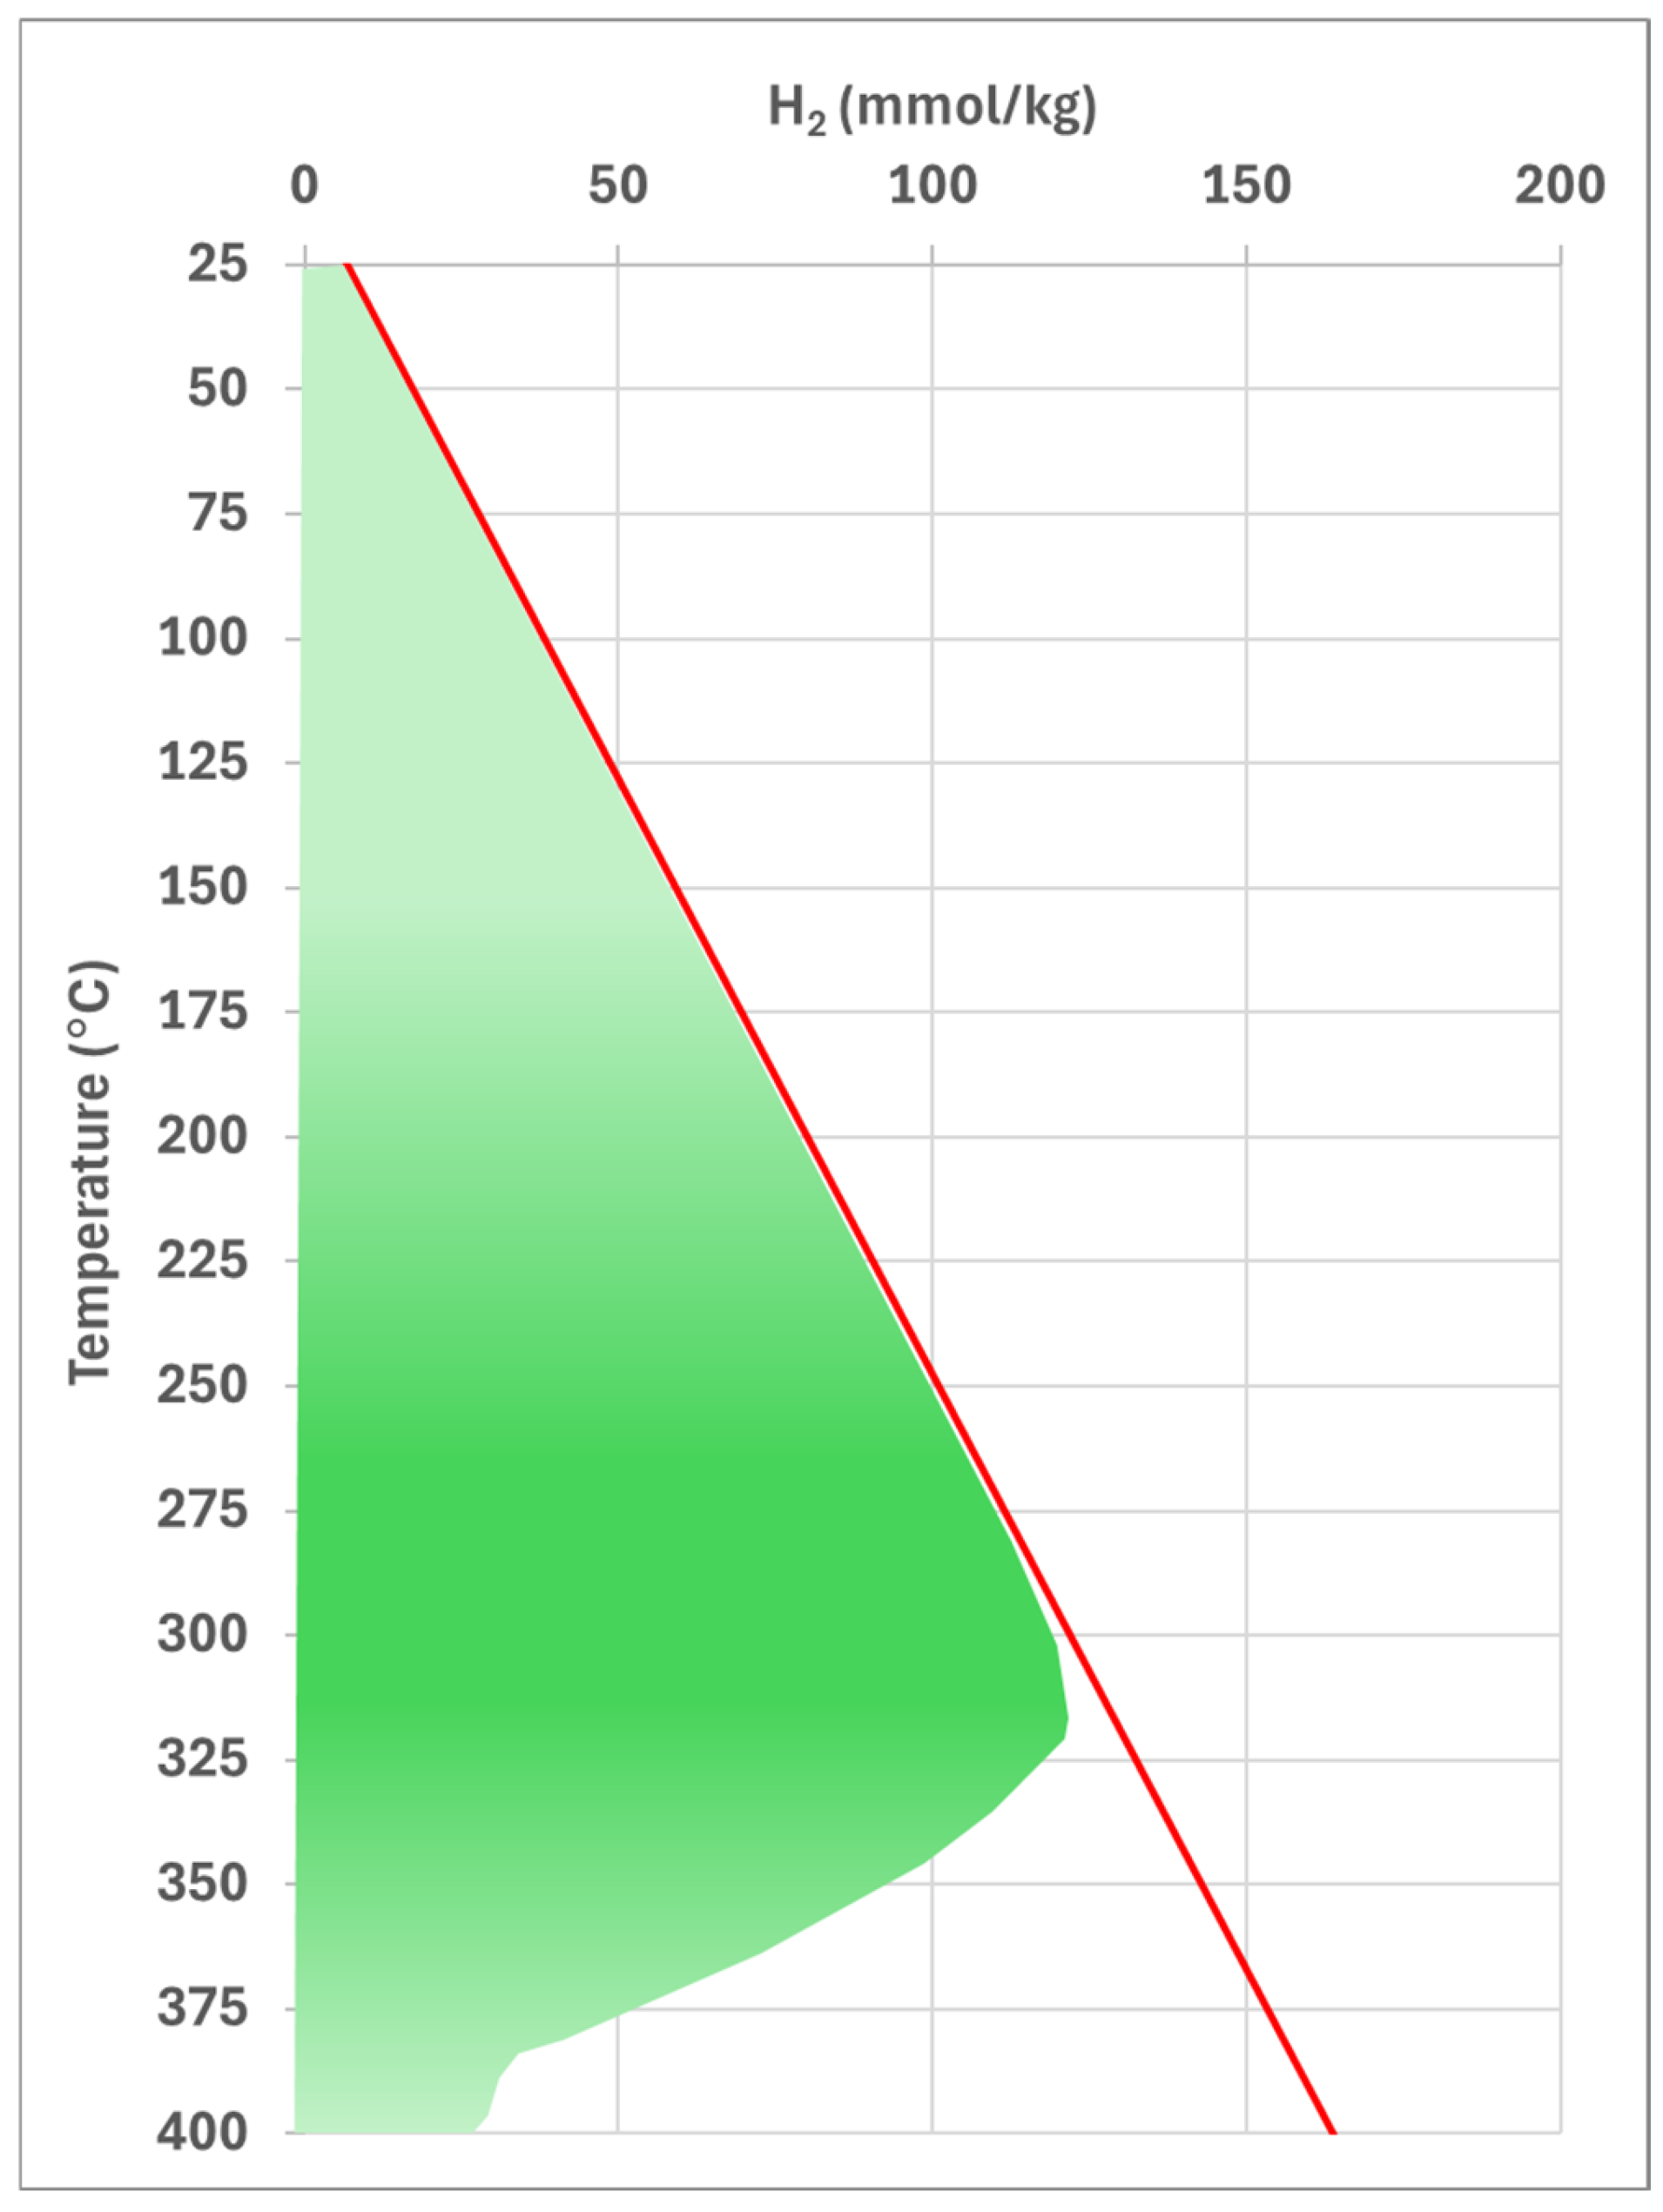
Figure 2 compares hydrogen generation rates during the serpentinization process, using the hydrogen generation rate (R
H2) equation introduced in this study (red solid line) as the upper band and a tentative refined curve (green shaded area) representing the potential close to the real-world response of ultramafic rocks gradually emplaced at shallower depths where ultramafic minerals destabilize, initiating serpentinization and subsequent hydrogen generation. The pattern in
Figure 2 is analogous to the thermal maturation curves of hydrocarbon source rocks, which depict the transformation of organic material into oil and gas. For petroleum systems, such curves are well-refined and validated through extensive research into source rock geochemistry. Similarly, the development of a reliable and refined curve for natural hydrogen systems will require further studies to ensure accurate interpretation, validation, and full refinement.
The tentative refined green-shaded curve, which closely follows data obtained from Equation (3) but deviates at temperatures above 315 °C, potentially approximates real-world conditions. This curve can be divided into two temperature ranges: below 315 °C and between 315 °C and 400 °C. Consequently, two distinct equations can be developed for each range to further estimate hydrogen production from ultramafic rocks under different depth-temperature conditions.
Regression analysis for these two trends yields two empirical equations (Equations (4) and (5)): one for temperatures below 315 °C and another for the range between 315 °C and 400 °C, with the data for the latter range interpolated from a limited number of data points. Since these equations are derived mostly from the original Equation (3), which incorporates pressure, the green-shaded curve reflects this dependency, and a separate pressure component is not required for these equations. However, additional laboratory experiments under varying temperature and pressure conditions will be necessary in the future to refine these models further.
where T represents the temperature (°C). It should be noted that for temperatures less than 315 °C, both Equations (3) and (4) are valid and provide nearly the same results. However, for temperatures exceeding 315 °C, Equation (3) overestimates hydrogen generation, and therefore, Equation (5) must be used.
In
Figure 2, it can be speculated that the total green-shaded area represents the entire hydrogen generation potential, estimated at approximately 227 mmol per kg of ultramafic rock. Hydrogen generation begins at the depth where olivine becomes unstable (~400 °C) and continues up to surface conditions over geological timescales. The cumulative total hydrogen generated can then be calculated based on the size of the original ultramafic rock. It is clear that at each stage of the depth of the emplacement, depending on the temperature and pressure conditions, the hydrogen generation rate from the ultramafic rock varies, with the maximum generation window occurring at around 315 °C.
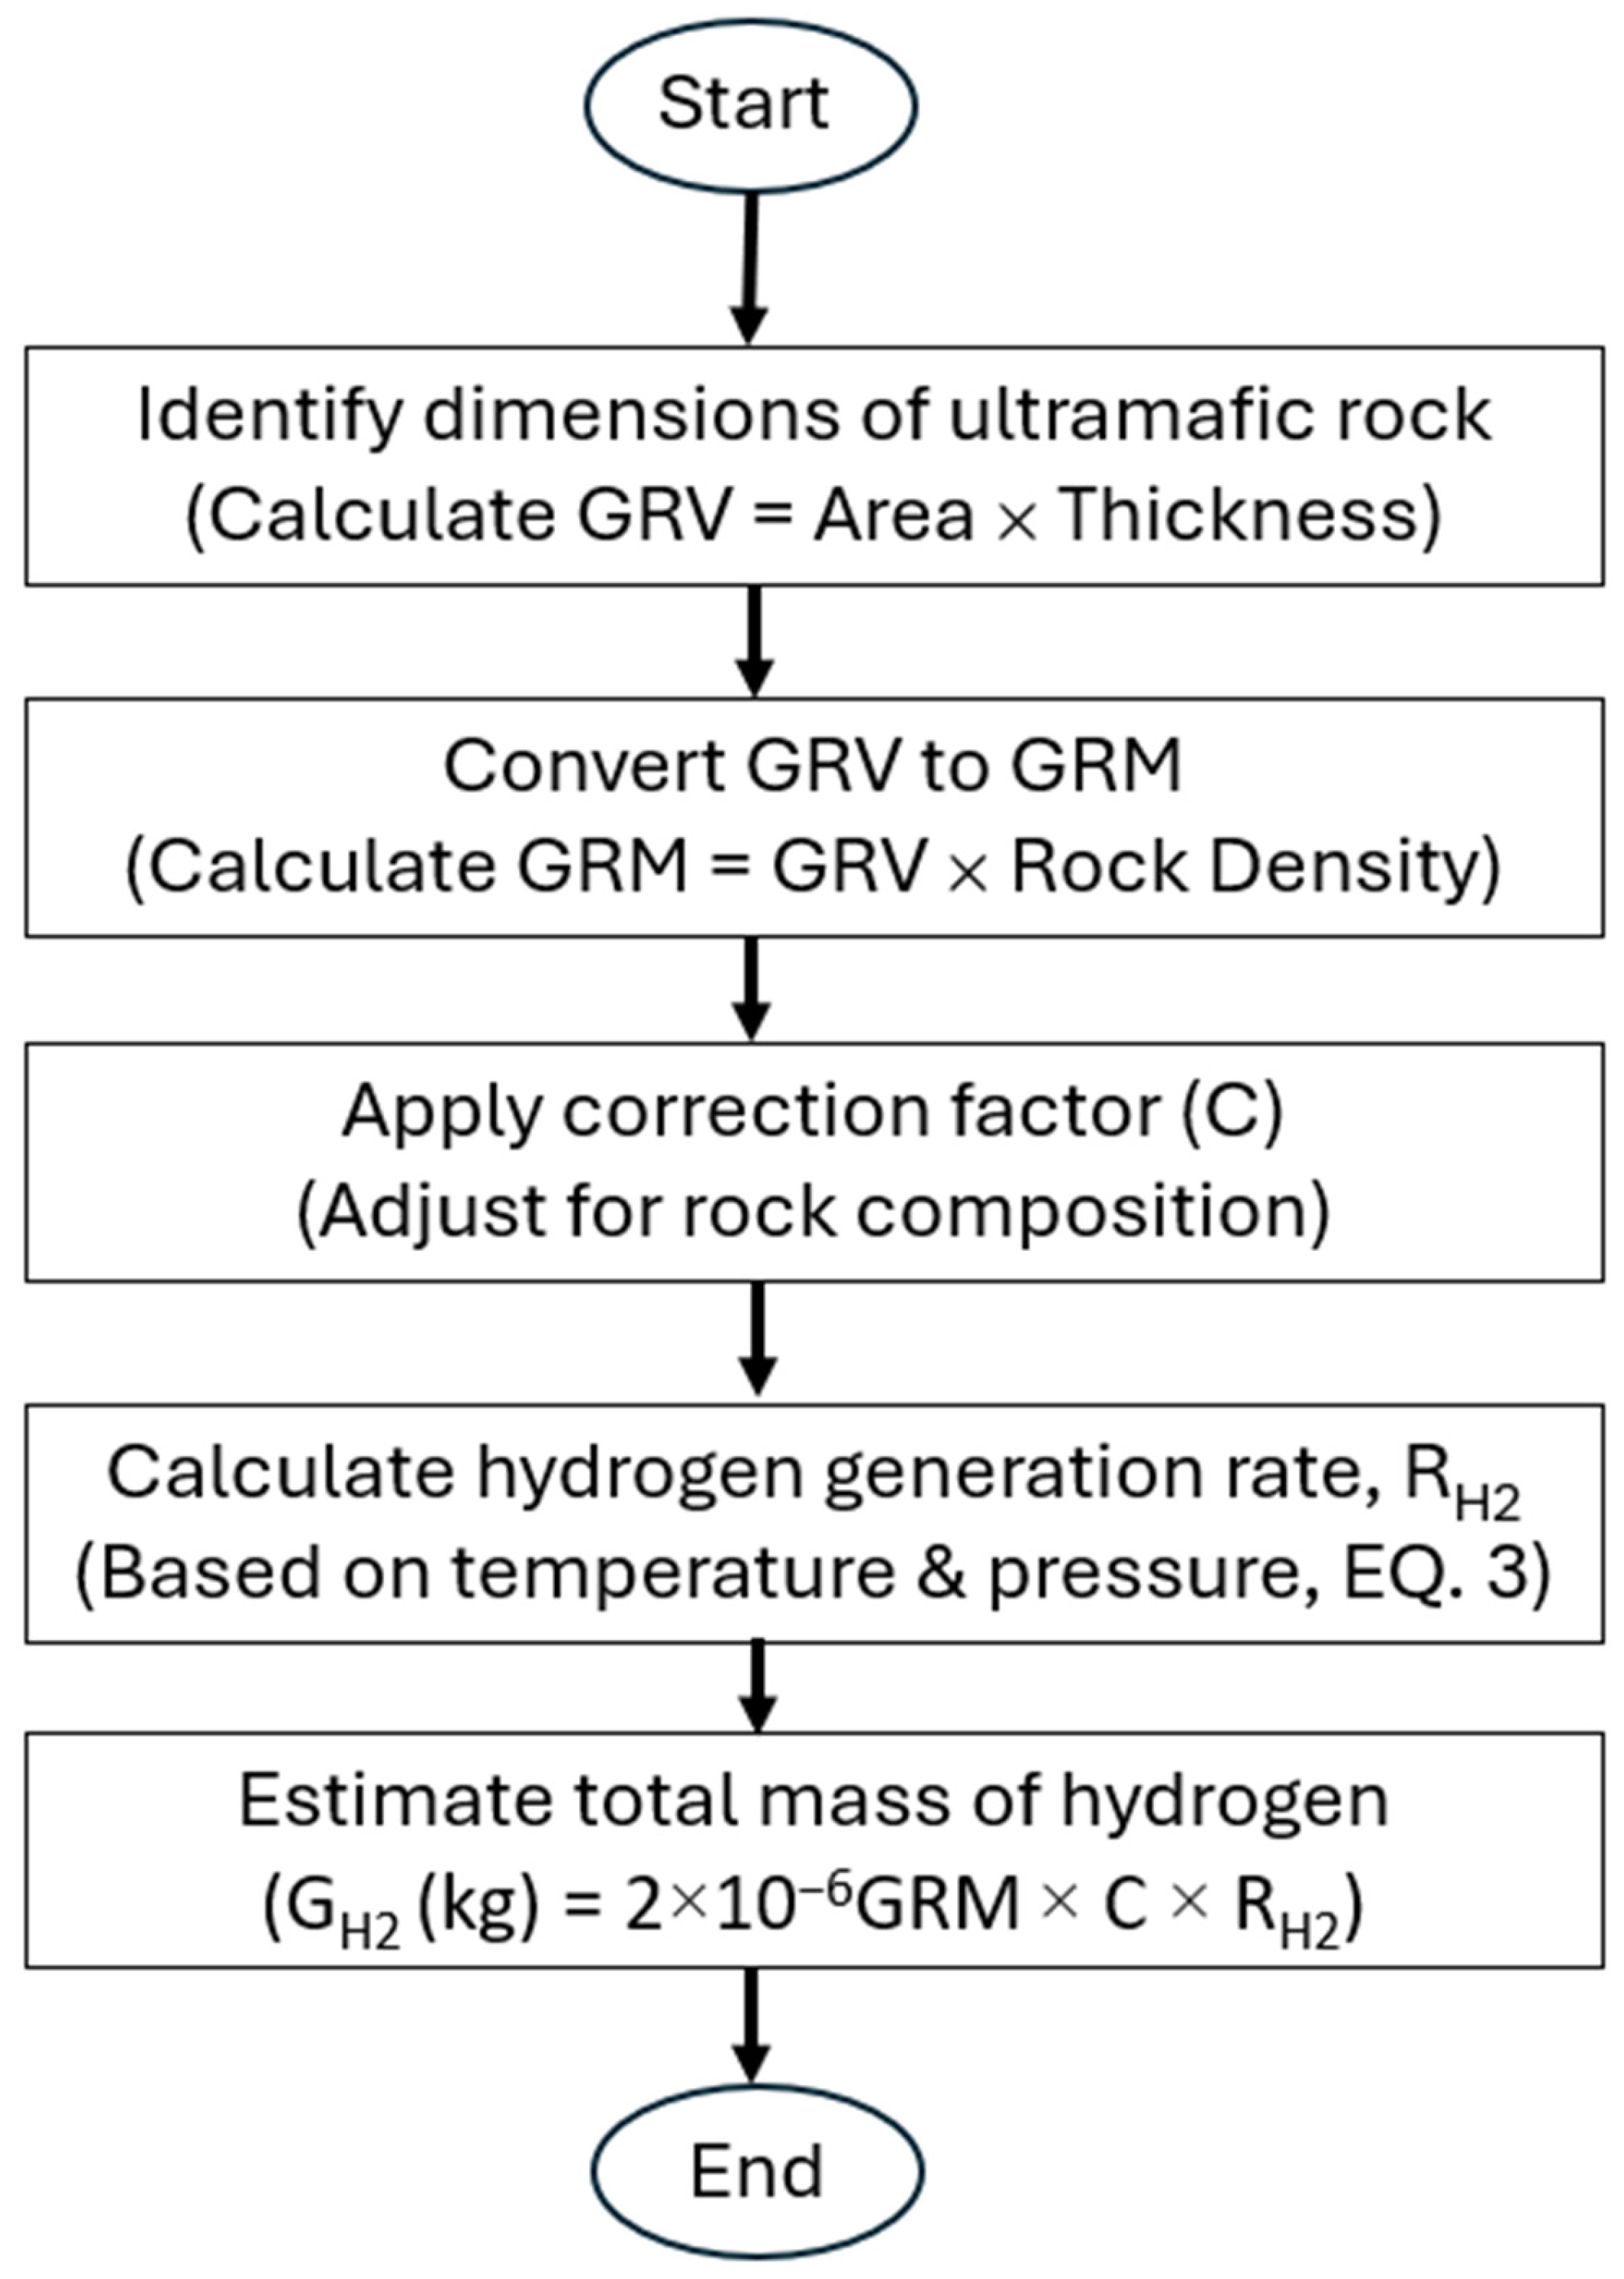
2.4. Volumetric Calculation of Hydrogen Generated (GH2) Through the Serpentinization
A fundamental aspect of a hydrogen system study is estimating the maximum amount of hydrogen possibly generated (G
H2) through the serpentinization of the ultramafic rock mass. This estimation is crucial for quantifying hydrogen that may be trapped in overlying reservoirs with effective caprocks. The volumetric calculation introduced in this study involves five stages, as detailed in the following section and illustrated in
Figure 3:
Figure 3.
Flowchart displaying the steps for the volumetric calculation of generated hydrogen.
Figure 3.
Flowchart displaying the steps for the volumetric calculation of generated hydrogen.
† To accurately identify the dimensions and geometry of emplaced ultramafic rock bodies in the subsurface, a multidisciplinary approach involving geological, geophysical, and petrophysical methods is essential. Geophysical techniques play an important role in mapping the subsurface structure due to the unique physical properties of ultramafic rocks, such as their high density, magnetic susceptibility, and seismic velocities. Magnetic and gravity surveys are among the most effective tools for delineating ultramafic bodies. Magnetic surveys exploit the typically high magnetite content of the serpentinized ultramafic rocks, which produces measurable anomalies against the background magnetic field [
50,
51]. Similarly, gravity surveys leverage the increased density of ultramafic rocks, often ranging between 2.9 and 3.3 g/cm
3, to detect gravity anomalies relative to the surrounding lithologies [
52]. These methods are particularly effective for identifying large-scale subsurface structures and regional trends (see
Figure 4). Seismic reflection methods provide critical insights into the subsurface geometry by identifying the interfaces between rock units based on acoustic impedance contrasts. Ultramafic rocks exhibit distinctly high P-wave velocities, often exceeding 7.5 km/s due to their dense and compact mineral composition [
53]. This property allows seismic reflection data to accurately delineate the thickness and depth of ultramafic bodies, especially when combined with velocity modeling techniques. In addition to potential field and seismic methods, electromagnetic (EM) and resistivity surveys offer complementary insights into the alteration and mineralogical composition of ultramafic rocks. Altered ultramafic rocks, such as those undergoing serpentinization, may exhibit significant changes in electrical conductivity due to the presence of hydrous minerals (e.g., serpentine) and associated fluids [
54,
55]. Time-domain electromagnetic (TDEM) and magnetotelluric (MT) surveys are particularly effective for identifying conductive zones, while resistivity surveys help differentiate between fresh and altered ultramafic units in the subsurface [
56]. Drilling and borehole logging serve as critical ground-truthing methods to validate geophysical interpretations. Borehole techniques such as density and lithodensity logging, resistivity logging, magnetic susceptibility logging, and sonic logs provide in situ confirmation of the rock’s physical properties, ensuring consistency with geophysical anomalies. In addition, core sampling allows for the direct examination of mineralogy, texture, and alteration products, providing valuable geological context. Finally, integrating all these datasets into a comprehensive 3D geophysical model enhances the accuracy of continental ultramafic rock body delineation. Modern software tools enable joint inversion of gravity, magnetic, and seismic data, facilitating a robust interpretation of the subsurface geometry. This integrated approach ensures that the spatial dimensions, thickness, and alteration zones of ultramafic bodies are effectively characterized, which is critical for resource exploration and quantification.
*
Table 2, which provides the chemical stability and Fe content of ultramafic minerals, assigns a correction factor (C) as stability rank with olivine set as 1.0 and smaller values for the other two minerals. This correction factor indicates the potential influence of each mineral on hydrogen generation during serpentinization, using olivine as the baseline for comparison. It is important to note that Fe content in olivine varies as its composition is not fixed and changes depending on magma composition, the geological context, pressure, temperature, and the surrounding chemical environment. However, the empirical equation (Equation (3)) for hydrogen generation rate (R
H2) in this study is derived primarily from experiments conducted on olivine and olivine-rich rocks, where serpentinization of olivine is the dominant hydrogen-generating process. Therefore, the correction factor (C) in Equation (8) is set to 1.0 for olivine, as experimental conditions mimic natural reactions. However, when applying this equation to other rock types with lower olivine content or those rich in orthopyroxene or clinopyroxene, a correction would be necessary. Such rocks may not undergo serpentinization as efficiently, potentially leading to lower hydrogen yields. In these cases, the correction factor accounts for differing mineral compositions and variable hydrogen-producing capacities. Thus, for olivine and olivine-rich rocks, the hydrogen yield predicted by the equation should be accurate without adjustments. For other lithologies, however, careful consideration of mineralogy and reaction rates is required to properly adjust the hydrogen yield.
If a rock contains multiple minerals, the correction factor varies depending on the proportion of each mineral. For instance, if a rock contains 60% olivine and 40% orthopyroxene, the correction factor can be calculated using correction factors of 1.0 for olivine and 0.7 for orthopyroxene; the overall correction factor would be C = (0.6 × 1.0) + (0.4 × 0.7) = 0.88.
In the case of the presence of any non-reactive components in the ultramafic rock, the correction factor for that component should be considered zero. Non-reactive minerals, such as feldspar, do not participate in the serpentinization process and, therefore, do not contribute to hydrogen generation. As a result, their inclusion in the rock’s composition has no direct effect on the amount of hydrogen produced during serpentinization. This ensures that only minerals contributing to serpentinization, such as olivine and pyroxenes, are factored into the hydrogen generation potential. The correction factors can indeed vary based on empirical data and specific conditions, but this framework should provide a logical basis rooted in the iron content and role of each mineral in serpentinization.
This correction factor approach is based on my personal judgment and can be refined in the future with experimental data to enhance its accuracy and applicability. Nonetheless, Klein’s thermodynamic modeling [
32] suggests that serpentinization should produce roughly equivalent amounts of H
2 from a given mass of rock across protolith compositions—ranging from dunite to harzburgite and lherzolite—when reacted at the same temperature.
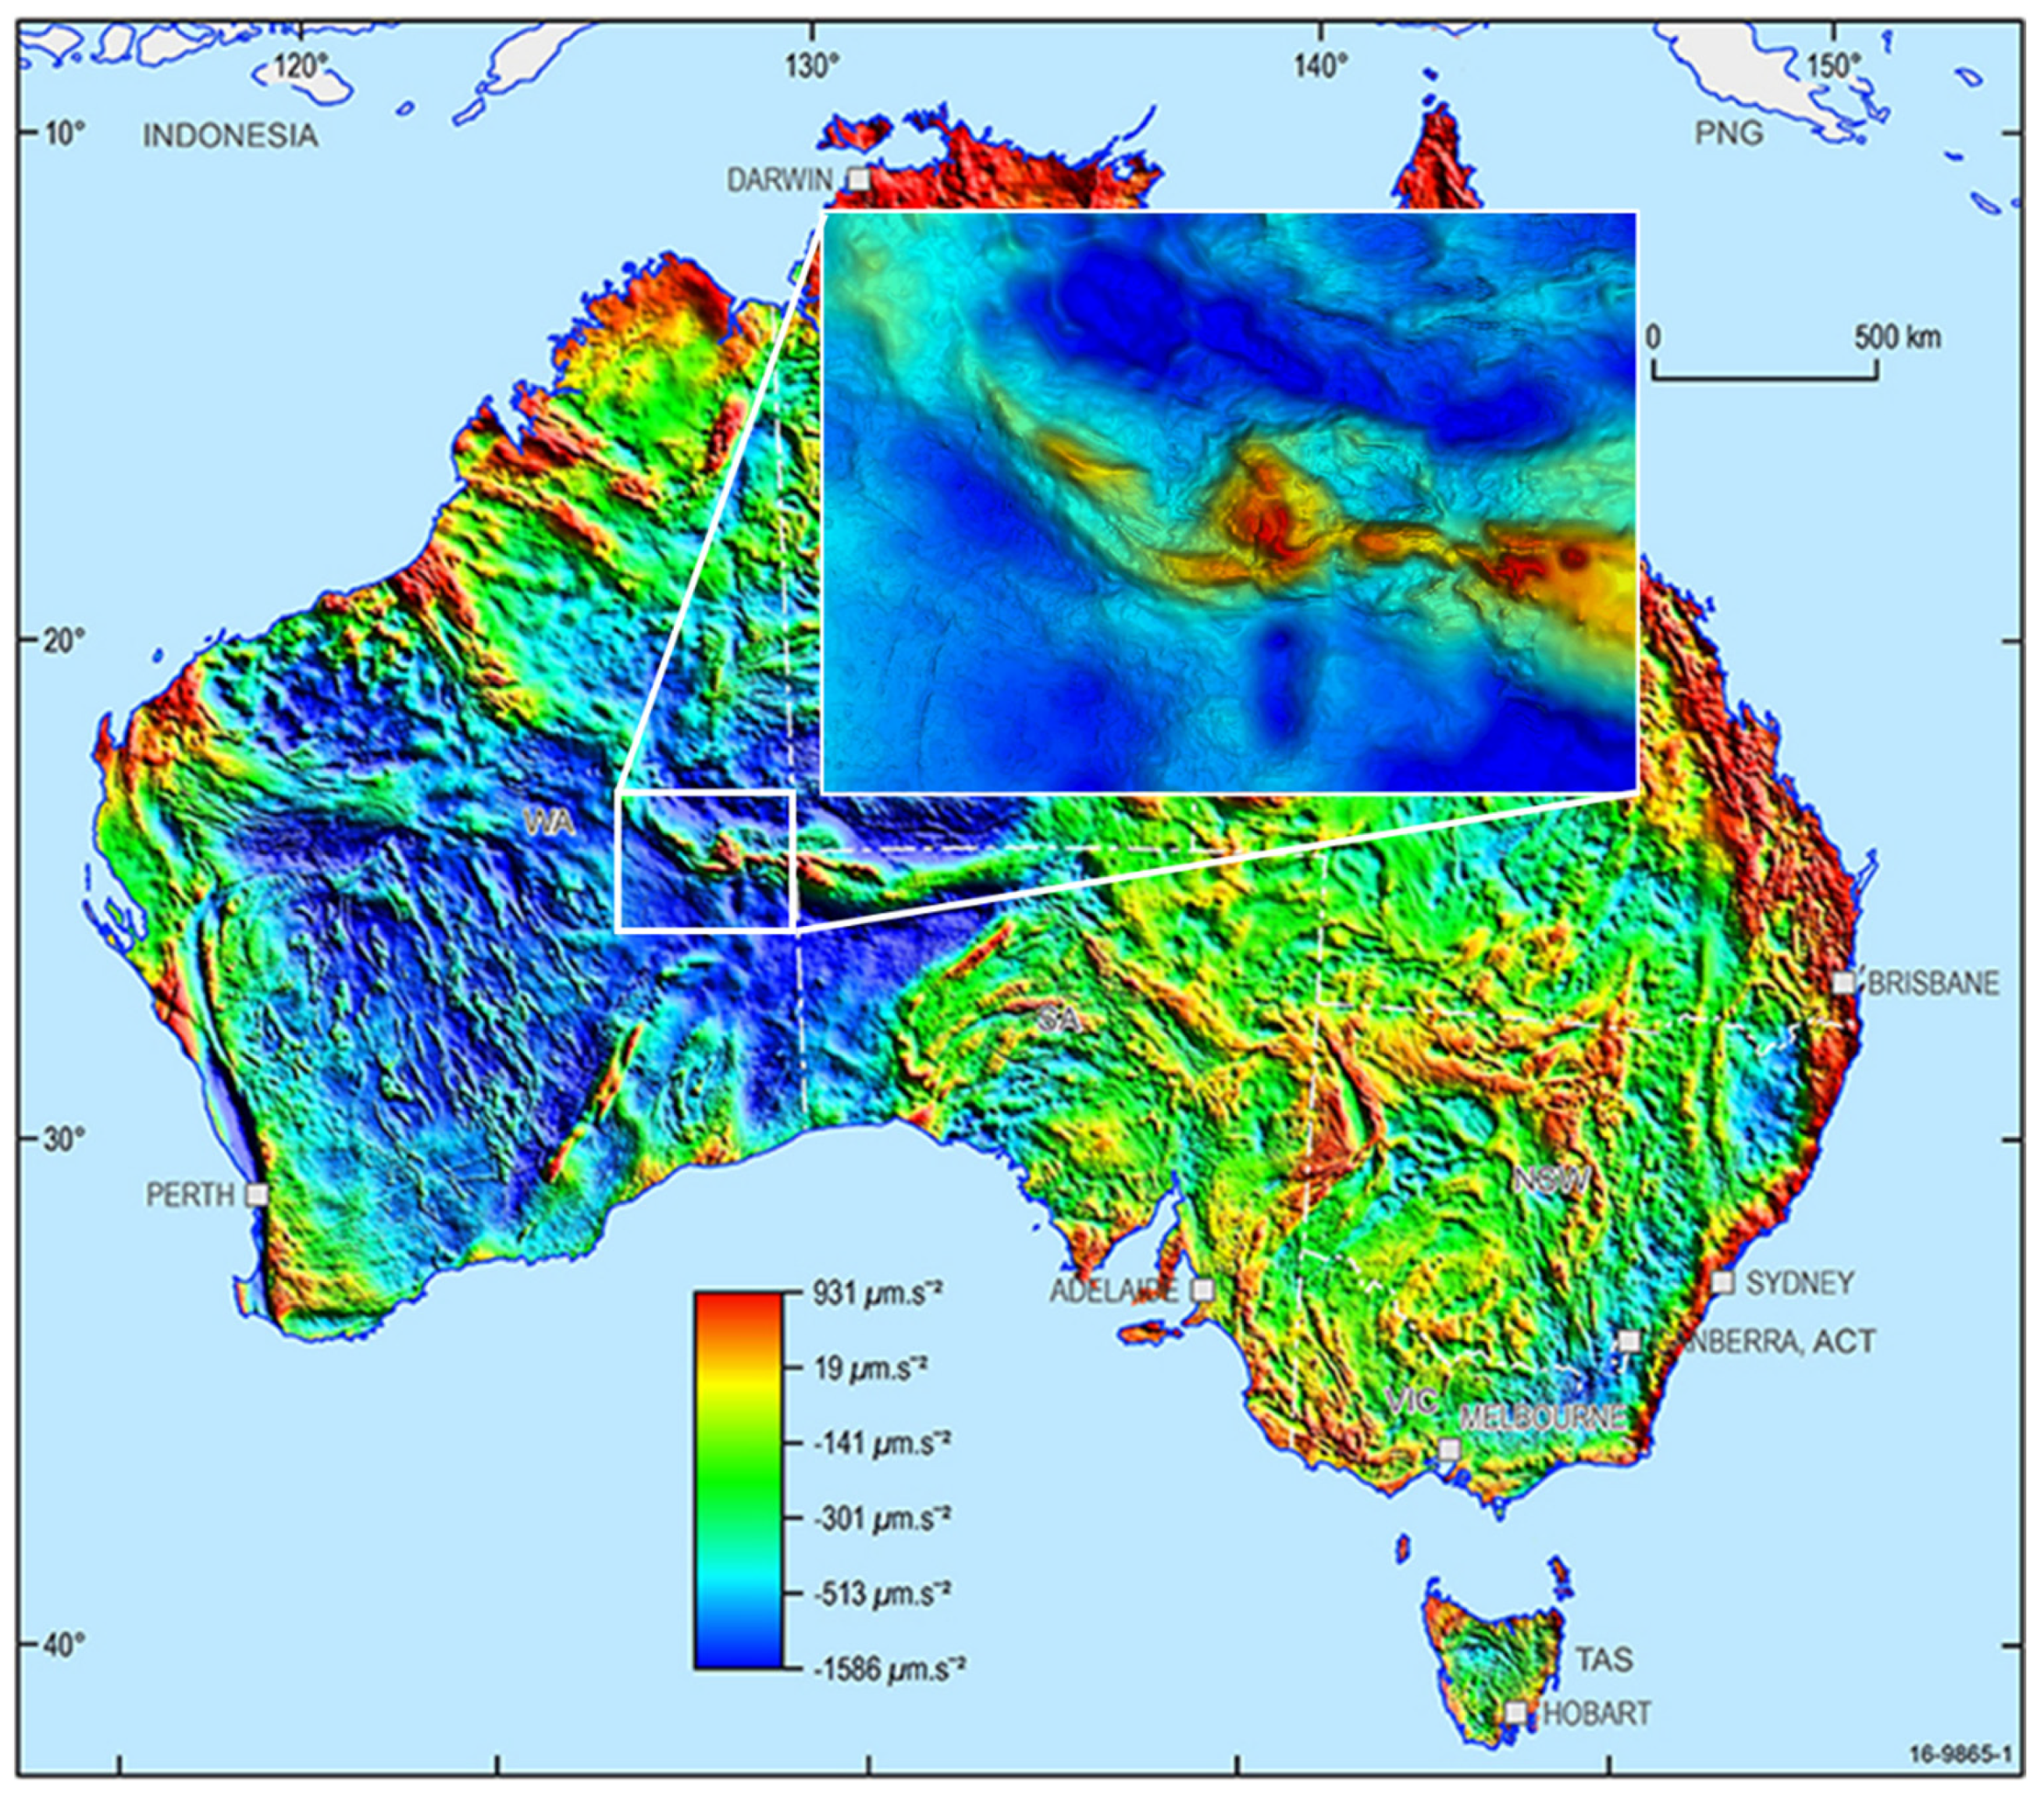
2.5. Volumetric Calculation of Hydrogen Generation in the Giles Complex, Australia
As an example, the volumetric calculation of hydrogen generated (G
H2) through serpentinization has been applied to the Giles Complex, a significant ultramafic-mafic intrusion in Australia (See
Figure 4 for the gravity map representation of this intrusive rock). The Giles Complex, located at the intersection of South Australia, Western Australia, and the Northern Territory, was formed about 1070 Ma. It comprises approximately 20 layered mafic-ultramafic intrusions, exhibiting significant variation in composition and emplacement depth. The ultramafic rocks primarily consist of wehrlite, harzburgite, websterite, and olivine-rich orthopyroxenite, with minor amounts of dunite [
58,
59]. The intrusions vary greatly in size, with some exceeding several thousand square kilometers. For example, the Mantamaru intrusion extends over 170 km in strike length, more than 20 km in width, and covers approximately 3400 km
2 [
60]. Stratigraphic thicknesses range from 1 km to over 6 km [
58,
59,
60].
Although the total volume of the Giles Complex is not explicitly stated in published literature, volume estimates for major intrusions allow for a reasonable approximation. The Mantamaru–Cavenagh portion alone, assuming an average thickness of 5 km, contributes nearly 20,000 km
3. Based on geological, geochemical, and geophysical data from Aitken et al. [
60], the major Giles Complex (G1) intrusions in the Mamutjarra Zone—including the Jameson, Cavenagh, Blackstone, and Bell Rock intrusions—are interconnected at depth and are believed to have been emplaced as a single massive intrusion. Their study suggests that this mega-intrusion is 8–14 km thick, 150 km long, and was originally at least 50 km wide, indicating a total volume of approximately 82,000 km
3. Magnetotelluric, gravity, and magnetic data used by Aitken et al. [
61] to construct an interpretative 3D model of the Musgrave Province suggests that the volume of the Giles Complex is approximately 32,000 km
3. However, when considering the deeper interconnected intrusions and eroded material, the total volume is likely more than 100,000 km
3. Aitken et al. [
60] (Figure 5, p. 892) show dense and highly magnetized rocks in the area where the G1 intrusion occurred. Their model suggests that the depth of the G1 intrusion ranges from 20 km to surface exposure.
For the calculation of the natural hydrogen generation potential of the Giles Complex, the data from Aitken et al. [
60] are used as an example to demonstrate the volumetric calculation procedure introduced in this study. It is important to emphasize that the primary objective of this paper is to present the methodology, with the Giles Complex serving solely as an illustrative case to show how the approach can be applied to a natural hydrogen source rock. Consequently, the calculated values should not be considered definitive, as they may vary significantly if future detailed studies reveal substantial differences in the geometry and composition of the Giles Complex. Any such refinements in geological understanding would necessitate adjustments to the volumetric calculations based on newly acquired data.
A volume of 32,000 km3 is considered for the Giles Complex, and since its composition ranges from wehrlite to websterite, indicating significant variation in olivine content, an average composition of 50% olivine and 25% orthopyroxene and clinopyroxene is assumed. This suggests that a C value of 0.8 should be used.
Regarding temperature, since the depth of emplacement ranges from 20 km to the surface, this corresponds to a temperature range of approximately 623 °C to 23 °C, considering a geothermal gradient of 30 °C/km and a surface temperature of 23 °C.
For simplicity in the calculation, the intrusion size is assumed to remain constant from top to base. While this assumption is not geologically accurate, it provides a quick and practical approach, given the lack of detailed studies on the geometry of the Giles Complex. However, this simplification introduces a degree of uncertainty in the estimated hydrogen generation, which could be refined with more comprehensive geological data in future studies. To enhance accuracy in volume estimation, the total rock volume is computed by dividing the intrusion into discrete depth intervals of 100 m. For rock at temperatures above 400 °C, hydrogen generation from serpentinization is considered negligible. For rock at temperatures between 400 °C and 315 °C, Equation (5) is applied, while for rock at temperatures below 315 °C, Equation (3) is used. It should be noted that the term “pressure” here refers to pore pressure in an open system. This is the pressure exerted by fluid networks within open faults and fractures where water interacts with ultramafic minerals.
Based on the provided information, the amount of hydrogen generated through the serpentinization process of this intrusion, using the procedure depicted in
Figure 3, is calculated to be 2.24 × 10
15 kg.
If we consider that even a small fraction of this ultramafic mass (e.g., 0.01) has undergone serpentinization due to its complex composition, serpentinization heterogeneity, and account for the possibility that part of the generated hydrogen may have been consumed in processes such as the reduction of carbon dioxide to methane, it is estimated that approximately 2.24 × 10¹³ kg of hydrogen would have been generated. Considering the molar mass of hydrogen (H2) at 2.016 g/mol and standard temperature and pressure (STP), this amount of hydrogen corresponds to approximately 8.88 × 10¹⁵ standard cubic feet (scf), or 8.88 Pscf (Peta standard cubic feet), of hydrogen gas.
This hydrogen generation process is dynamic and progressive, likely to continue over geological time until most of the iron-rich minerals within the complex are altered. The ongoing alteration of these minerals underscores the importance of understanding the long-term potential for natural hydrogen production in ultramafic-mafic complexes like Giles presenting an intriguing opportunity for future energy resource development.
It should be noted that this calculation is intended to approximate the amount of hydrogen released from the ultramafic intrusion, while the assessment of trapping and accumulation mechanisms remains a separate subject requiring independent evaluation. Similar to a petroleum system, where the generated and migrated hydrocarbons are estimated based on the size, organic richness, and thermal maturity of the source rock to evaluate the potential for oil and gas discoveries in basin traps, this approximation provides an indication of the exploration area’s potential and the likelihood of discovering hydrogen.
3. Discussion and Conclusions
The generation of natural hydrogen can be linked to the geochemical process of serpentinization, which produces hydrogen gas. This process is influenced by factors such as mineral composition, temperature, pressure, water-to-rock ratio, and reactive surface area. Optimal hydrogen generation occurs at temperatures between 200 °C and 400 °C, peaking around 315 °C and is further enhanced under high-pressure conditions (e.g., [
36]). Olivine, with its high reactivity and iron content, is a major contributor, while pyroxenes generate hydrogen at lower rates. Studies on the alteration of ultramafic rocks like olivine, dunite, and peridotite under various conditions reveal that higher temperatures and pressures increase hydrogen yields, while factors like pH and the presence of certain minerals can either enhance or inhibit the process. Barbier et al. [
62] conducted a comprehensive statistical and network analysis of existing serpentinization experiments, revealing a significant variability in hydrogen and CH
4 production that extends beyond simple pressure and temperature trends, suggesting the likely influence of accessory mineral phases and unquantified contamination from various sources.
In this study, a multiple regression analysis was performed on the experimental laboratory data to create an empirical equation that estimates the hydrogen generation rate (RH2) as a function of temperature and pressure. Temperature plays a critical role in controlling the efficiency of hydrogen formation through serpentinization; as previously discussed, pressure also exerts a multifaceted and complex influence. Pressure enhances serpentinization, boosting hydrogen production through accelerated mineral–fluid interactions and deeper water penetration. It also influences phase transitions, porosity, and permeability, controlling hydrogen release.
Despite the small sample size, the analysis demonstrated a robust correlation between these variables and the hydrogen generation rate (RH2). The resulting model achieved an acceptable coefficient of determination (R2) that suggests temperature and pressure are significant predictors of hydrogen generation rates, reinforcing the importance of these parameters in understanding the serpentinization process. Future studies could benefit from expanding the sample size and incorporating additional variables to enhance the model’s accuracy and applicability further.
The rate of hydrogen generation with temperature in the serpentinization process has some similarities with hydrocarbon generation from the source rocks. Similarly, though in reverse order of depth-temperature conditions, serpentinization begins when ultramafic rocks are exposed to shallower depths, where the temperature drops below approximately 400 °C. However, unlike a straightforward, linear relationship suggested by the empirical equation introduced in this study (Equation (3)), real-world hydrogen generation is governed by thermodynamic constraints on mineral stability and many other parameters such as water availability, fluid flow, Si concentration in fluid, pH, etc. Based on McCollom and Bach [
36], at higher temperatures (above ~315 °C), serpentinization reactions occur rapidly, but hydrogen concentrations may be limited by the attainment of stable thermodynamic equilibrium between olivine and the aqueous fluid. Conversely, below ~150 °C, hydrogen generation is limited by slow reaction kinetics and by Fe(II) being incorporated into brucite rather than producing hydrogen. Peak hydrogen production is generally observed between 200 and 315 °C, suggesting that this temperature range promotes the most reducing conditions for hydrogen generation during serpentinization.
A key aspect of studying a hydrogen system is accurately estimating the amount of hydrogen generated (GH2) during the serpentinization process of an ultramafic intrusive. This estimation is crucial for understanding the potential quantity of hydrogen that could be trapped in overlying reservoirs, particularly those with effective caprocks that can prevent leakage. To facilitate this analysis, this study introduces a five-stage volumetric calculation method designed to assess hydrogen generation from an ultramafic rock with known dimensions, depth, and composition. By systematically evaluating each calculation stage, this method accounts for various geological factors and conditions that influence hydrogen production. The five stages encompass the initial mineral composition in the form of a correction factor (C) and the influence of temperature and pressure on reaction rates.
The procedure introduced (
Figure 3) has been applied to the Giles Complex, a major ultramafic-mafic intrusion in Australia, to calculate the potential hydrogen generated through serpentinization. Assuming that even a small fraction (e.g., 0.01) of this ultramafic mass has undergone serpentinization, it is estimated that around 2.24 × 10
13 kg of hydrogen could be generated. This tentative estimation can be compared with other quantitative models for hydrogen generation from the serpentinization of exhumed mantle rocks. Liu et al. [
48] estimated 4.3 × 10
18 mol (8.6 × 10
12 metric tons) in the North Atlantic margins, while Cannat et al. [
63] calculated a global flux of 1.67 × 10
11 mol/yr (3.34 × 10
5 tons/year).
These volumetric calculations just estimate the hydrogen released from the ultramafic intrusion, though trapping and accumulation mechanisms require separate evaluation. Like in petroleum systems, this approach offers insights into hydrogen exploration potential, aiding in strategy refinement and identification of promising development sites.
Although this study aimed to utilize available experimental data to introduce a simple and applicable approach for calculating hydrogen generation rates through serpentinization, the limitations and shortcomings of such an approach must also be discussed. As mentioned, beyond temperature and pressure, serpentinization is influenced by factors such as the composition of ultramafic rocks, water-to-rock ratio, reactive surface area, pH, and the presence of other minerals or solutions. Notably, finely ground ultramafic rocks exhibit significantly higher hydrogen generation rates than coarser samples, underscoring the importance of surface area in this process. Laboratory experiments investigating hydrogen generation during serpentinization often use rock powders with high surface area to accelerate reaction kinetics and enhance mineral-fluid interactions. However, these studies have limitations in extrapolating results to natural systems, as they do not accurately replicate the physical and geochemical constraints of intact ultramafic rock bodies. One key factor influencing serpentinization in nature is the water-to-rock (W/R) ratio, which governs reaction progress, hydrogen yield, and mineral transformations. In laboratory settings, powdered samples allow for near-complete hydration due to high surface reactivity, whereas in geological formations, water access is restricted by rock porosity, permeability, and fracture networks [
64]. The study by Ely et al. [
64] highlights the substantial variation in hydrogen generation during seawater alteration of ultramafic rocks, emphasizing that laboratory experiments often produce higher hydrogen yields due to enhanced mineral reactivity and increased exposure to reactive surfaces. In contrast, in intact rock bodies, serpentinization is diffusion-limited, and reaction fronts develop heterogeneously, reducing overall hydrogen output. Additionally, in natural settings, the presence of sealing phases such as serpentine and brucite can inhibit continued fluid infiltration, further limiting reaction progress over time.
Furthermore, serpentinization is a highly heterogeneous process influenced by variations in mineral composition, fluid availability, reaction kinetics, and tectonic settings, all of which significantly impact hydrogen generation [
32,
65]. This heterogeneity arises due to spatial variations in permeability, temperature, and pressure, leading to uneven reaction progress and localized zones of enhanced hydrogen production. For example, areas with high fracture density facilitate deeper water infiltration, accelerating mineral-fluid interactions and increasing hydrogen yields. Conversely, zones with low permeability may restrict fluid flow, limiting reaction extent and hydrogen release. Additionally, variations in mineralogy, such as differing olivine-to-pyroxene ratios, influence the efficiency of Fe
2+ oxidation to Fe
3+, a key driver of hydrogen formation [
35]. These factors collectively contribute to the complex and spatially variable nature of serpentinization-driven hydrogen production, affecting both the distribution and accessibility of geological hydrogen reservoirs. Loiseau et al. [
65] utilized a kilometer-scale mantle body to map serpentinization heterogeneity and its influence on hydrogen generation using field observations and multi-faceted analyses, including magnetic properties, gas analysis, petrography, and X-ray microtomography. Their study demonstrated that serpentinization heterogeneity may range from 3% to 62% at scales from kilometers to micrometers.
Given these limitations, it is also important to acknowledge that the empirical equation proposed in this study for calculating hydrogen generation rates must be considered in the context of geological timescales. The process of serpentinization occurs over millions of years, ultimately leading to the full alteration of an ultramafic rock body. This aspect must be taken into account when evaluating natural hydrogen systems and making comparisons with petroleum systems, where the generation of oil and gas through the thermal cracking of organic material during the burial history of source rocks similarly takes millions of years.
Although this study does not explicitly address the impact of water availability, permeability, and fracture density on serpentinization, these factors play a crucial role in controlling hydrogen generation and should be considered in future analyses.
Water availability is another important requirement for serpentinization, yet at greater depths, its presence becomes increasingly limited, potentially restricting the extent of the process. Serpentinization can only occur where ultramafic rocks interact with water, either through deep fluid infiltration along fractures and fault zones or via uplift and subsequent exposure to circulating water. On the seafloor and at mid-ocean ridges (MORs), ultramafic rocks are in direct contact with seawater, while the subduction of the oceanic crust facilitates the transport of water to deeper regions of the Earth. However, additional mechanisms must be considered for deep water circulation within continental settings. Fault zones serve as critical conduits for fluid migration through the lithosphere, where brittle fracturing enhances permeability [
66], and ductile shear zones can establish a dynamic granular fluid pump [
67]. Studies by McIntosh and Ferguson [
68] indicate that meteoric water circulation in North America can reach depths of up to 5 km. Prigent et al. [
69] propose that seawater percolation can extend as deep as 20–25 km, with serpentinization occurring at depths of approximately 11–13 km. Additionally, recent evidence from the French Pyrenees suggests that surface-derived fluids can penetrate retrogressive ductile shear zones at temperatures of 400–450 °C and depths of around 10 km [
70]. Another significant source of water for serpentinization is the metamorphism of pelitic rocks. Pelitic sediments contain water amounting to roughly 10% of the total mass of Earth’s oceanic water [
71]. During metamorphic transformations, these chemically bound fluids are progressively released and migrate toward the Earth’s surface [
66], contributing to deep-seated serpentinization processes.
Fluid flow in deep crustal and mantle environments is often restricted due to low permeability, making fracture density a key control of water infiltration and reaction extent. High fracture density enhances permeability, facilitating sustained water-rock interactions [
72], whereas lower fracture densities may limit serpentinization and hydrogen production. It is worth mentioning that serpentinization textures in peridotites reveal the generation of veins/fractures [
25] that act as fluid pathways, with serpentine and magnetite-rich microfractures indicating preferential fluid flow [
73].
Additionally, the pH and chemistry of water significantly influence reaction pathways, with alkaline conditions typically promoting Fe
2+ oxidation and hydrogen release [
18]. However, variations in fluid composition, including dissolved CO
2, sulfate, or organic compounds, may alter reaction kinetics and affect hydrogen yields [
19,
74,
75]. A more detailed discussion of these factors would provide a deeper understanding of the constraints on hydrogen production through serpentinization in deep geological settings.


