Article

Researching Holocene Sediments at Bac Lieu Offshore, Vietnam with Insights from Near-Surface 2D Reflection Seismic Data

1
University of Science, Vietnam National University, Ho Chi Minh City 700000, Vietnam
2
HCMC Institute of Resources Geography, Ho Chi Minh City 700000, Vietnam
*
Author to whom correspondence should be addressed.
Geosciences 2025, 15(3), 107; https://doi.org/10.3390/geosciences15030107
Submission received: 13 January 2025 / Revised: 8 March 2025 / Accepted: 11 March 2025 / Published: 17 March 2025
(This article belongs to the Section Sedimentology, Stratigraphy and Palaeontology)

Abstract

:
The high-resolution seismic method can provide acoustic reflectivity images of shallow marine geology structures. In South Vietnam, the demand for construction materials like sand is high; therefore, the exploration of its deposits is considered in this study. This study investigated an around 200-square-kilometer area offshore Bac Lieu using 2D seismic sub-bottom lines. We employed the processed seismic amplitude and its seismic attributes as mean and variance textures to interpret the data. The processed seismic amplitude and its attributes can represent the young Holocene sediments (i.e., sand, silt, clay, and their mixtures) thanks to their different seismic patterns. Our interpretation result consists of 3D horizons of the seabed, Holocene silt, and sand sediments, which are compatible with the prior geological information, including three nearby drill holes. The seabed gradually descends from 10.0 m to 19.0 m over a horizontal distance of around 11 km. Moreover, the interpreted results show that the sand sediments reside in the center of survey area, with a maximum thickness of around 12.0 m. Interestingly, a fill sediment channel effectively separates two different zones of young Holocene sand and silt sediments. The findings provide valuable information for Vietnamese government officers to develop sustainable policies and regulations for marine mineral exploitation and exploration.

1. Introduction

The near-surface reflection seismic method is a common and effective approach to map shallow marine and river sediment distribution thanks to its sensitivity to variations in acoustic impedance [1,2,3]. In this method, high-frequency seismic pulses were emitted from a source travel downwards, interacting with the seabed and subsurface strata before returning to a receiver [1,2,3]. For this research, the source and receiver were fixed in an equipment box, defining a constant offset measurement style.
These seismic images can reveal the boundaries and geometries of various sediment types, such as sand, clay, mud, and mixtures of clay and sand images [1,2,4,5,6]. Contrasts in acoustic impedance between these materials result in visible seismic reflection amplitudes and patterns, which are important for interpreting the boundaries of sediment layers [2,4,7]. Additional data, such as drill hole logs and prior geological information from the surveys, are also critical for correct sediment classification.
For capturing high-resolution images of shallow sediment environments, sonar systems are widely used [2,7]. This consists of two types of frequency technology, such as (i) wideband frequency modulation, referred to as CHIRP (Compressed High-Intensity Radar Pulse), and (ii) single-frequency sonars [8,9]. CHIRP sonars, which emit a sweeping range of frequencies, enable a deeper penetration into marine sediments. In contrast, single-frequency sonars, while limited in depth, provide very-high-resolution images for the upper sediment layers [8,9].
In southern Vietnam, the need for the detection of sand deposits for the construction of highways is high [10]. Finding a more suitable source of sand is so necessary in this situation that the Vietnamese government allows the use of both marine and river sands [10]. Research works using the high-resolution seismic method were conducted in Can Gio District offshore, Ho Chi Minh City, Vietnam [4,7,11,12]. According to the research works, the existence of sand dunes is recognized in southern Vietnam provinces’ offshores [2,4,7,13,14] by applying geophysical methods such as the high-resolution reflection seismic method and drill holes.
The Mekong Delta in the southern Vietnam, the third largest delta in the world, has been affected by long-term large sediment accumulation in its vast storage and the rainy Asian monsoon weather [13,15]. Recognized as a mixed-energy delta, it has formed over more than 8000 years to the present, which is related to the reduction in the post-glacial sea-level rise [13,15,16,17]. Pleistocene uplands, swamps, and the Sai Gon river system set its boundary on the northeast [17]. Our area of interest is on the Bac Lieu offshore (Figure 1). Bac Lieu Province, in the low delta plain, is characterized by rows of beach ridges with the trend direction from northeast to southwest [17]. The seashores of the Mekong Delta mainly consist of mangroves, beach ridges (including the foreshore), and tidal flats [13,15,16,17].
While previous studies have investigated the distribution of sand sediment on horizontal surfaces in the Bac Lieu Province offshore, Vietnam, our understanding of sand dune locations, particularly their depth and thickness, remains limited because of the coarse resolution of past seismic data acquisition and analysis methods [2,15,16,17,18,19]. To fill this gap and contribute to the understanding of the shallow marine geology in Vietnamese offshore areas, we collected and analyzed 18 2D high-resolution seismic profiles covering approximately 200 square kilometers in the Bac Lieu Province offshore (see Figure 1). We employed an analytical approach adapted from [4,7], which combines processed seismic data with its mean and variance textures to effectively illuminate the seismic boundaries and correlate distinct seismic patterns with young Holocene sediments. Note that suitable seismic attributes were chosen depending on all of the measured locations of seismic data.
Our prior information consisted of a geological map for shallow depths in the study area, the Bac Lieu offshore, Vietnam, and three published drill holes [16,17,19]. In Figure 1, sand sediments, shown as yellow and tan patches, and silt sediments, shown as light-brown and brown patches, were extracted from the work of Unverricht, Szczuciński [16]. Three drill holes, VC1, BL01, and SC02, which were investigated in the papers of Nguyen, Do [19] and Ta, Nguyen [17] (see Figure 1), indicated that a boundary exists at around 20 m between two Holocene and Pleistocene layers.
Our seismic survey profiles were conducted within an area previously recognized as having sand sediment types (see the yellow and tan color areas in Figure 1) and silt types (silt and sandy silt) [13,16,17,19]. The survey consists of 18 2D seismic profiles, including 17 parallel lines with lengths ranging from around 6 km to 10 km, and one cross-profile with a length of 28 km. The investigation depth was calculated to be approximately 40.0 m by the multiplication of the record time of 51 ms and the average seismic velocity of 1550 m/s over 2 [2,7].
Figure 1. Representations of the study area, including a lithology map, high-resolution seismic profiles, and three drill holes, for researching the shallow Holocene sediment environment in the Bac Lieu offshore, Vietnam [13,16,19,20]. On the Vietnam map, the yellow star pinpoints Ha Noi, Vietnam’s capital.
Geosciences 15 00107 g001

2. Materials and Methods

SyQwest Stratabox sonar equipment attached in a boat can deliver seismic pulses and receive their echoes from surroundings by using its fixed-distance source–receiver system (see Figure 2) [9]. Raw seismic data can still contain ambiguous geological information because of noises and weak signals. The transmit rate of the frequency could be up to 10 Hz and the frequency output was 10 kHz [9].

2.1. Processing Data

To improve the data quality, a running average filter for all the 2D seismic profiles was applied [21]. The filter can mitigate noises by smoothing the signal input. It calculates the average value of a specific number of consecutive traces within a defined measured time. The processed data can emphasize horizontally coherent energy within a defined time frame [21]. For example, on Line A15 (see Figure 3), the filter evaluates 51 consecutive traces at each time position. The average value of the traces is then assigned to their middle trace. The time window ranged from 0 to 51 milliseconds (ms), equivalent to an investigated depth of 0 to 40.0 m, assuming the average seismic velocity of 1550 m/s in the marine medium [2,7]. In Figure 3, the processed data (right image) more clearly shows the seismic boundaries and patterns than the raw data (left image). The mitigation of random noises and the visible recognition of multiple noises from the background increase the effectiveness of the interpretation task (right image in Figure 3).
Figure 3. Processing the seismic data: the raw data (a) and the processed data (b) after using a running average filter [21]. The filtered data can show clear images of the seismic boundaries as the seabed and sediments. Visible multiple noises from the seabed are also distinguished from the true seismic boundary of the sediments.
Geosciences 15 00107 g003
Static shift: Before the interpretation of the seismic data, a data quality check is crucial [4,7]. A key thing is that consistent seabed depths at the intersection points of the 2D seismic profiles are guaranteed. Despite the high data quality, inconsistency in the seabed depth can arise from survey operations and variations in the tide levels throughout the day [16]. Unluckily, our survey data lacked tide level measurements in the ship locations, which is an important parameter, as demonstrated by Unverricht, Szczuciński [16]. Their study in the Mekong Delta, Vietnam, showed that a depth variation of up to 1.8 m at seismic profile intersections can remain without accurate tide information, thus preventing correct data interpretation [16].
For solving the mismatch problem in the seabed depth, we integrated the predicted tide level information into our seismic data analysis. The tide data were collected for four measurement days, on May 7th, 8th, 12th, and 13th, 2024, at Ganh Hao station, Bac Lieu Province, Vietnam (see Figure 4), which is close to the data measurement area. This information was sourced from the official website of the Institute of Coastal and Offshore Engineering, Ho Chi Minh City, Vietnam, and used for the static-shift step [22].
To define a time-shift for a 2D seismic profile, the average shift is calculated based on the relationship between the tide level and time. We suggested the surface level at zero milliseconds (ms), corresponding to a zero-meter tide level. The static-shift time is dependent on the sub-bottom profiler’s depth below the water surface and the current tide level. Note that the zero time after the static-shift stage is compatible with the elevation position of the single-frequency sonar machine, defined at the zero-meter tide level. The static shift is calculated using the following equation (Equation (1)):
The time shift = 2 × ( machine depth + tide level ) / ( water velocity )
For Line A15, the 2D survey, conducted on 13 May 2024, started at 6:41 a.m. and stopped at 7:37 a.m., covering a distance of 7.5 km. The average tide level during the survey Line A15 was 1.53 m (Figure 4). Using a seismic velocity of 1550 m/s in the shallow water survey area [2,7] and a machine depth of 0.8 m below the water surface (i.e., machine depth = 0.8 m ), Equation (1) results in a static shift of 0.94 milliseconds. This indicates that the zero-time level of the processed static-shift seismic data is shifted 0.94 milliseconds earlier than the original data.
An example of the effectiveness of static shifts is shown in Figure 5. The top image (Figure 5) shows the mismatch at the meeting points of the three 2D profiles, Lines A32, A15, and A16. After using the static shift, the time gaps for the same depths across the three lines were mitigated, which is visible in the bottom image of Figure 5.

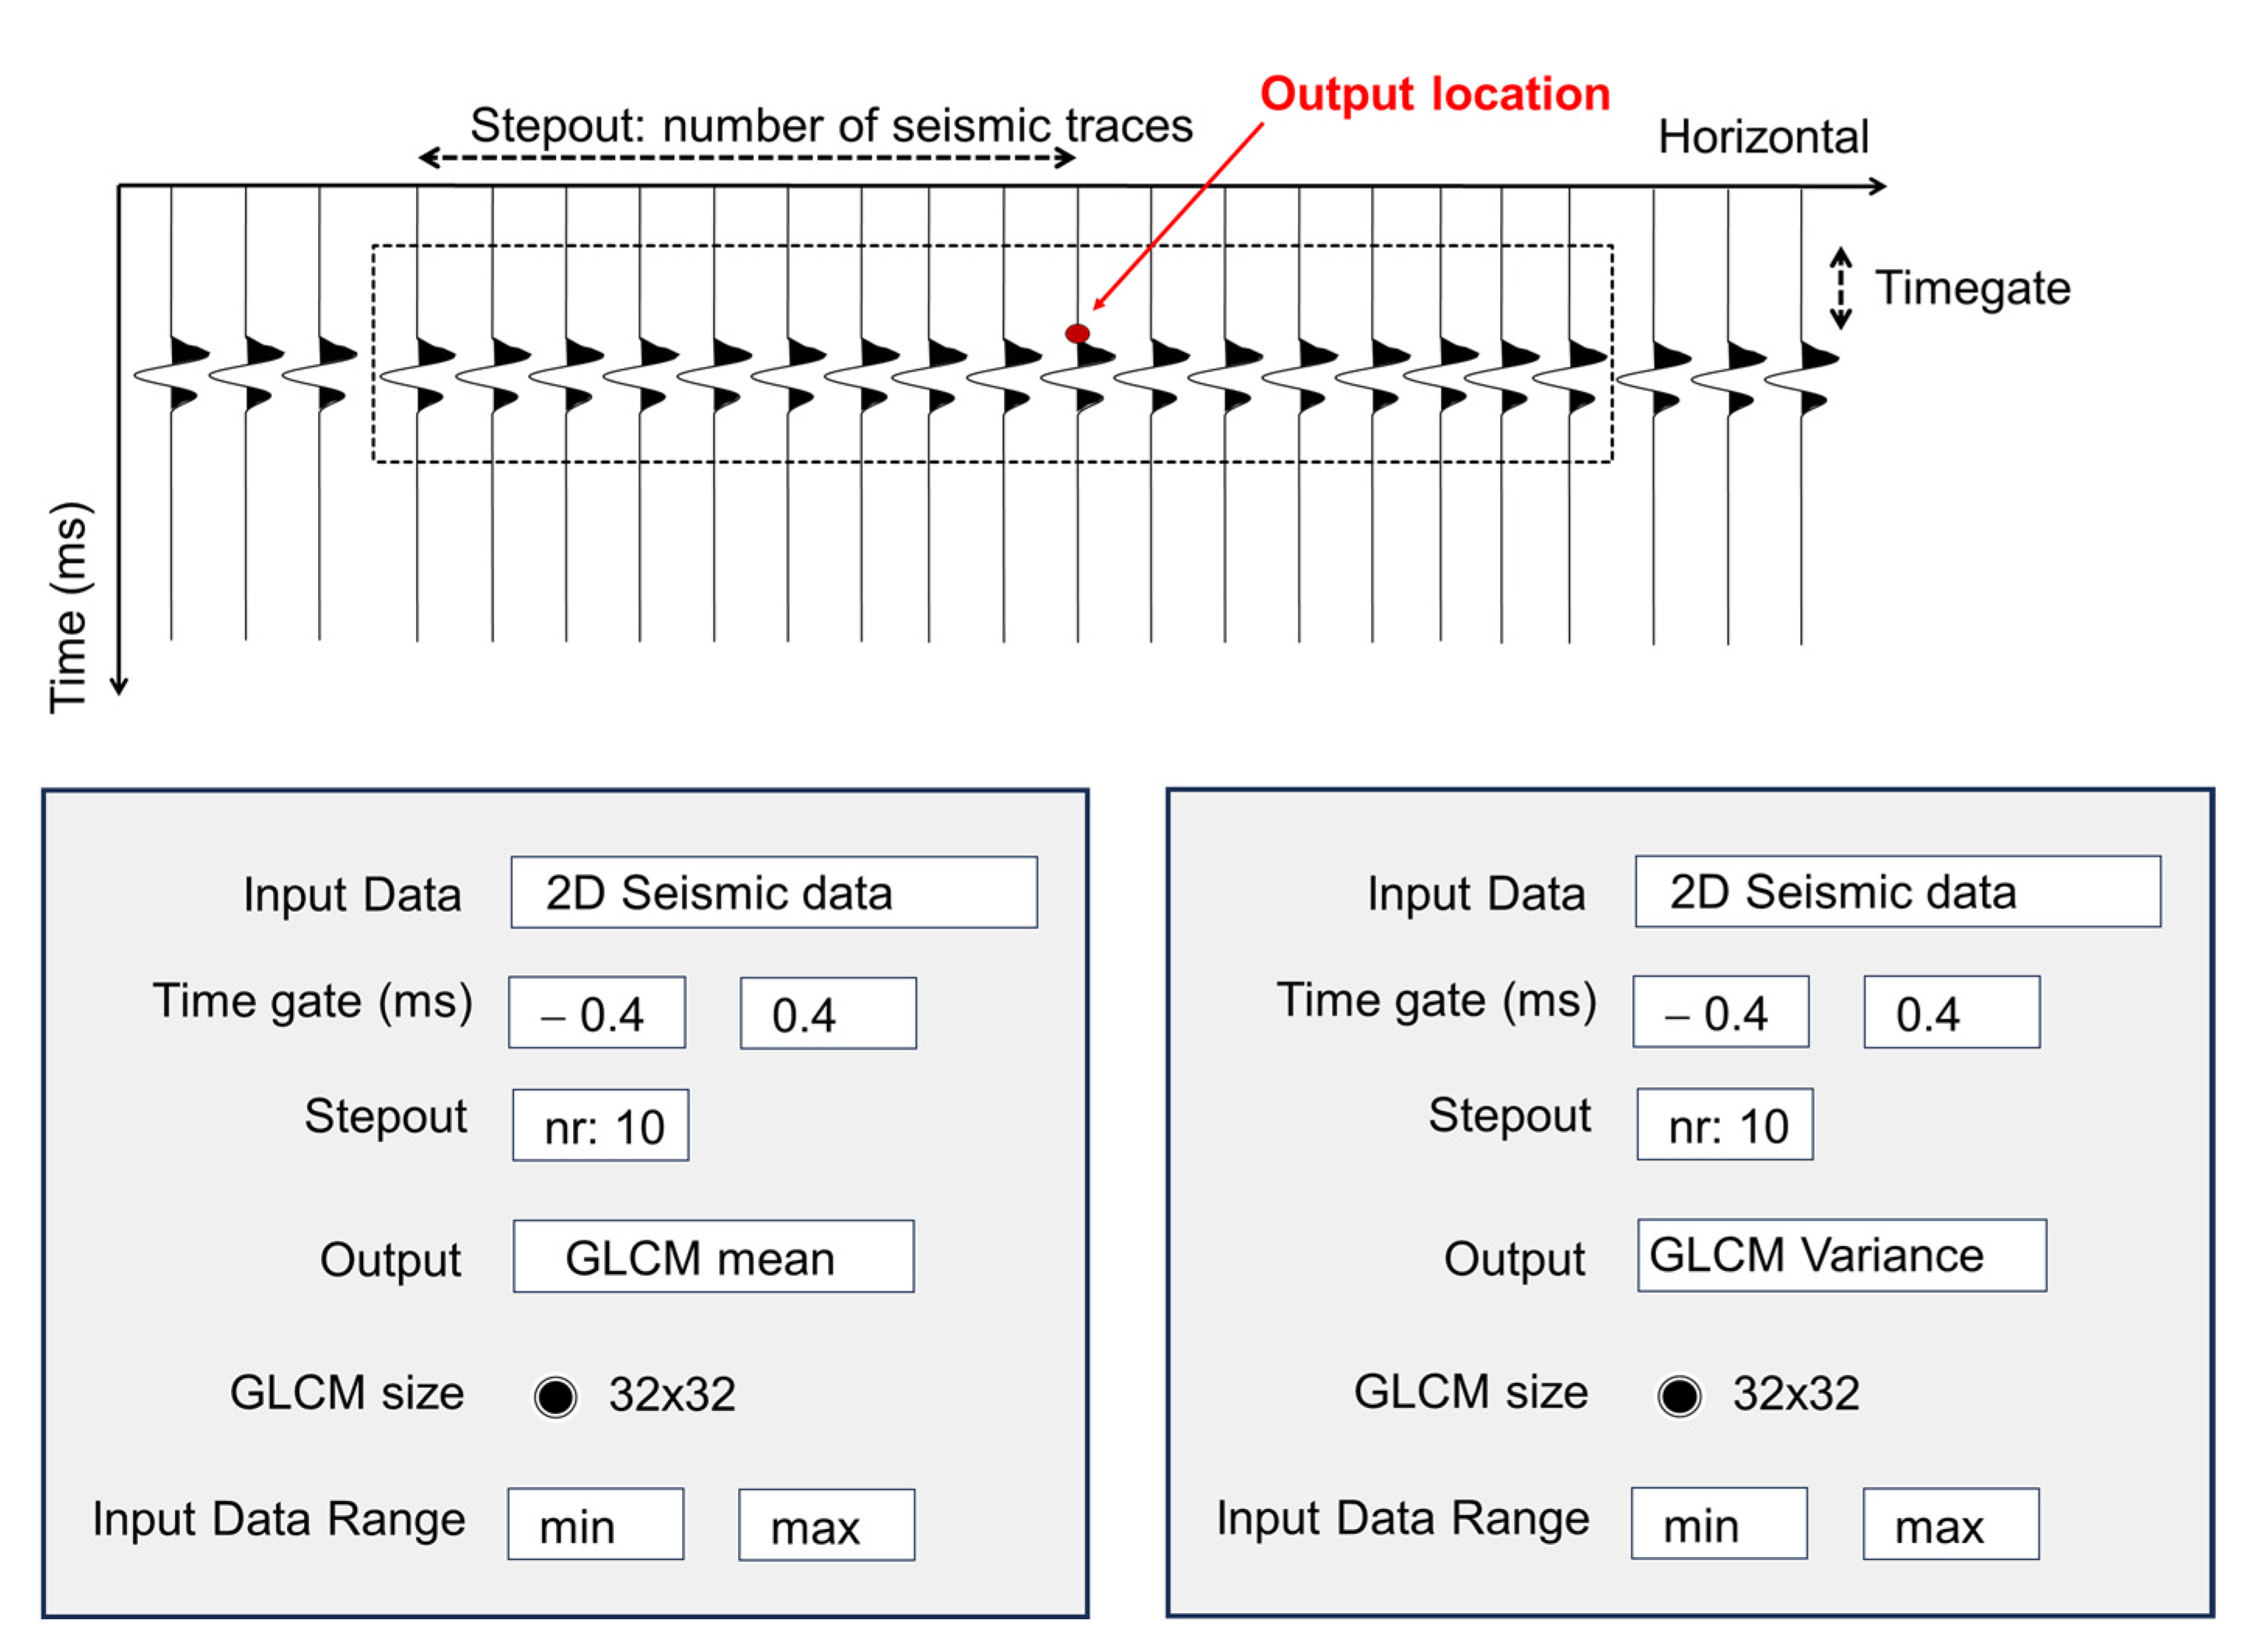
2.2. Calculating Seismic Attributes

The seismic attributes extracted from the processed abundant information of the seismic amplitude could assist in the seismic interpretation for geophysicists or geologists [23,24]. However, hidden geophysical characters can be illuminated by applying the so-called seismic attributes [4,24,25,26,27,28,29].
We applied the application of texture attribute analysis to support the seismic interpretation because of its robust and easy implementation [4,24,25,26,27,28,29]. Defining a seismic texture at a particular position in the time–distance domain requires a sequential process, the calculation of the gray-level-occurrence matrix (GLCM), followed by the computation of textural attributes [28,30,31].
The GLCM evaluates the spatial relationship between pixel intensities within a defined window, which covers the calculated position [28,30,31]. Prior to computing a GLCM, two parameters are needed, the conversion of the data values into a new integer range and a sliding window size, as follows:
(i).
Firstly, the high-resolution seismic dataset experiences important preprocessing steps. The amplitude values within the dataset, initially defined by a limited range, are rescaled to a new range spanning from 0 to (232 − 1). This rescaling leads to a new 32-bit integer output, supporting its dynamic range for the following analysis [7,28,29,30,31].
(ii).
Secondly, an important parameter in calculating the textural seismic attributes is the user-specified sliding window. The rectangular window, which isolates a specific region of interest, can be freely positioned within the seismic data space. Its sizes are defined by the numbers of seismic traces and time samples (see Figure 6) [7,29].
For a position within the seismic data, a GLCM is created, originating from the 32-bit integer image defined by the sliding window. In the position of the matrix, the element P [ i , j ] , corresponding to the total spatial connection between the different pixels of the integer image, is calculated by Equation (2) [7,28,29,30,31] as follows:
P [ i , j ] = x = 1 M y = 1 N 1   ,   G x , y = i   and   G x + x , y + y = j , 0 ,   otherwise
where (x, y) relates to the spatial location in the matrix M × N; ( x , y ) refers to the spatial connection between a pixel with an integer value i and a pixel with an integer value j; G is the integer value of the image pixel. Integer values i and j can range from 0 to (232 − 1). When the values ( x , y ) are prior user-defined, all P [ i , j ] will form the GLCM matrix.
Mathematical functions, like the mean and variance, are applied to the gray-level-occurrence matrix (GLCM) to calculate the textural attributes [7,28,29,30,31]. Two of these attributes are defined by Equations (3) and (4) [7,28,29,30,31], as follows:
Mean μ i = i = 0 N 1 j = 0 N 1 i P [ i , j ]
Variance = i = 0 N 1 j = 0 N 1 ( i μ i ) 2 P [ i , j ]
This process of computing the GLCM (see Equation (2)), and subsequently applying Equations (3) and (4) to derive the textural values, is repeated for every position within the seismic data space, thereby building a comprehensive set of textural seismic attributes.
Seismic attribute analysis is crucial for interpreting seismic data, thus enabling accurate 2D horizon picking and 3D horizon modeling. By extracting distinctive seismic patterns, including reflections, diffractions, and amplitude variations, from both processed amplitudes and especially textural attributes, we can effectively recognize young Holocene sediments. Acknowledging prior research and borehole data, we have established a relationship between different seismic layers within the study area and specific sediment types, including seawater, silt, sand, clay, and their mixtures [13,16,17,19].
We implemented a workflow that combined processed seismic data and their mean and variance textures to delineate the seismic boundaries and correlate them with different seismic patterns of young Holocene sediments (see the workflow in Figure 7) [4,7,26]. Raw seismic data were processed into interpretable data. After converting the raw seismic data into an interpretable format, we calculated the textural attributes as the mean and variance. The combination of the processed data, seismic attributes, and prior geological information provided a high-quality seismic interpretation of the interest area.

3. Results and Discussions

This study focuses on constructing the 3D horizons of these distinct sediment types. To achieve this, we acquired, analyzed, and interpreted 18 2D high-resolution seismic profiles covering approximately 200 square kilometers off the coast of Bac Lieu Province, Vietnam (see Figure 1 and Figure 8). For prior geological information extracted from the works of [13,16,17,19], closed yellow and brown dot curves show the existences of sand and silty sand sediments, respectively, but the outside area refers to the recognition of sandy silt sediment. Three 2D seismic profiles traveling across two sediment zones as silt and sand sediments are, namely, A15, A16, and A32. (see Figure 8).

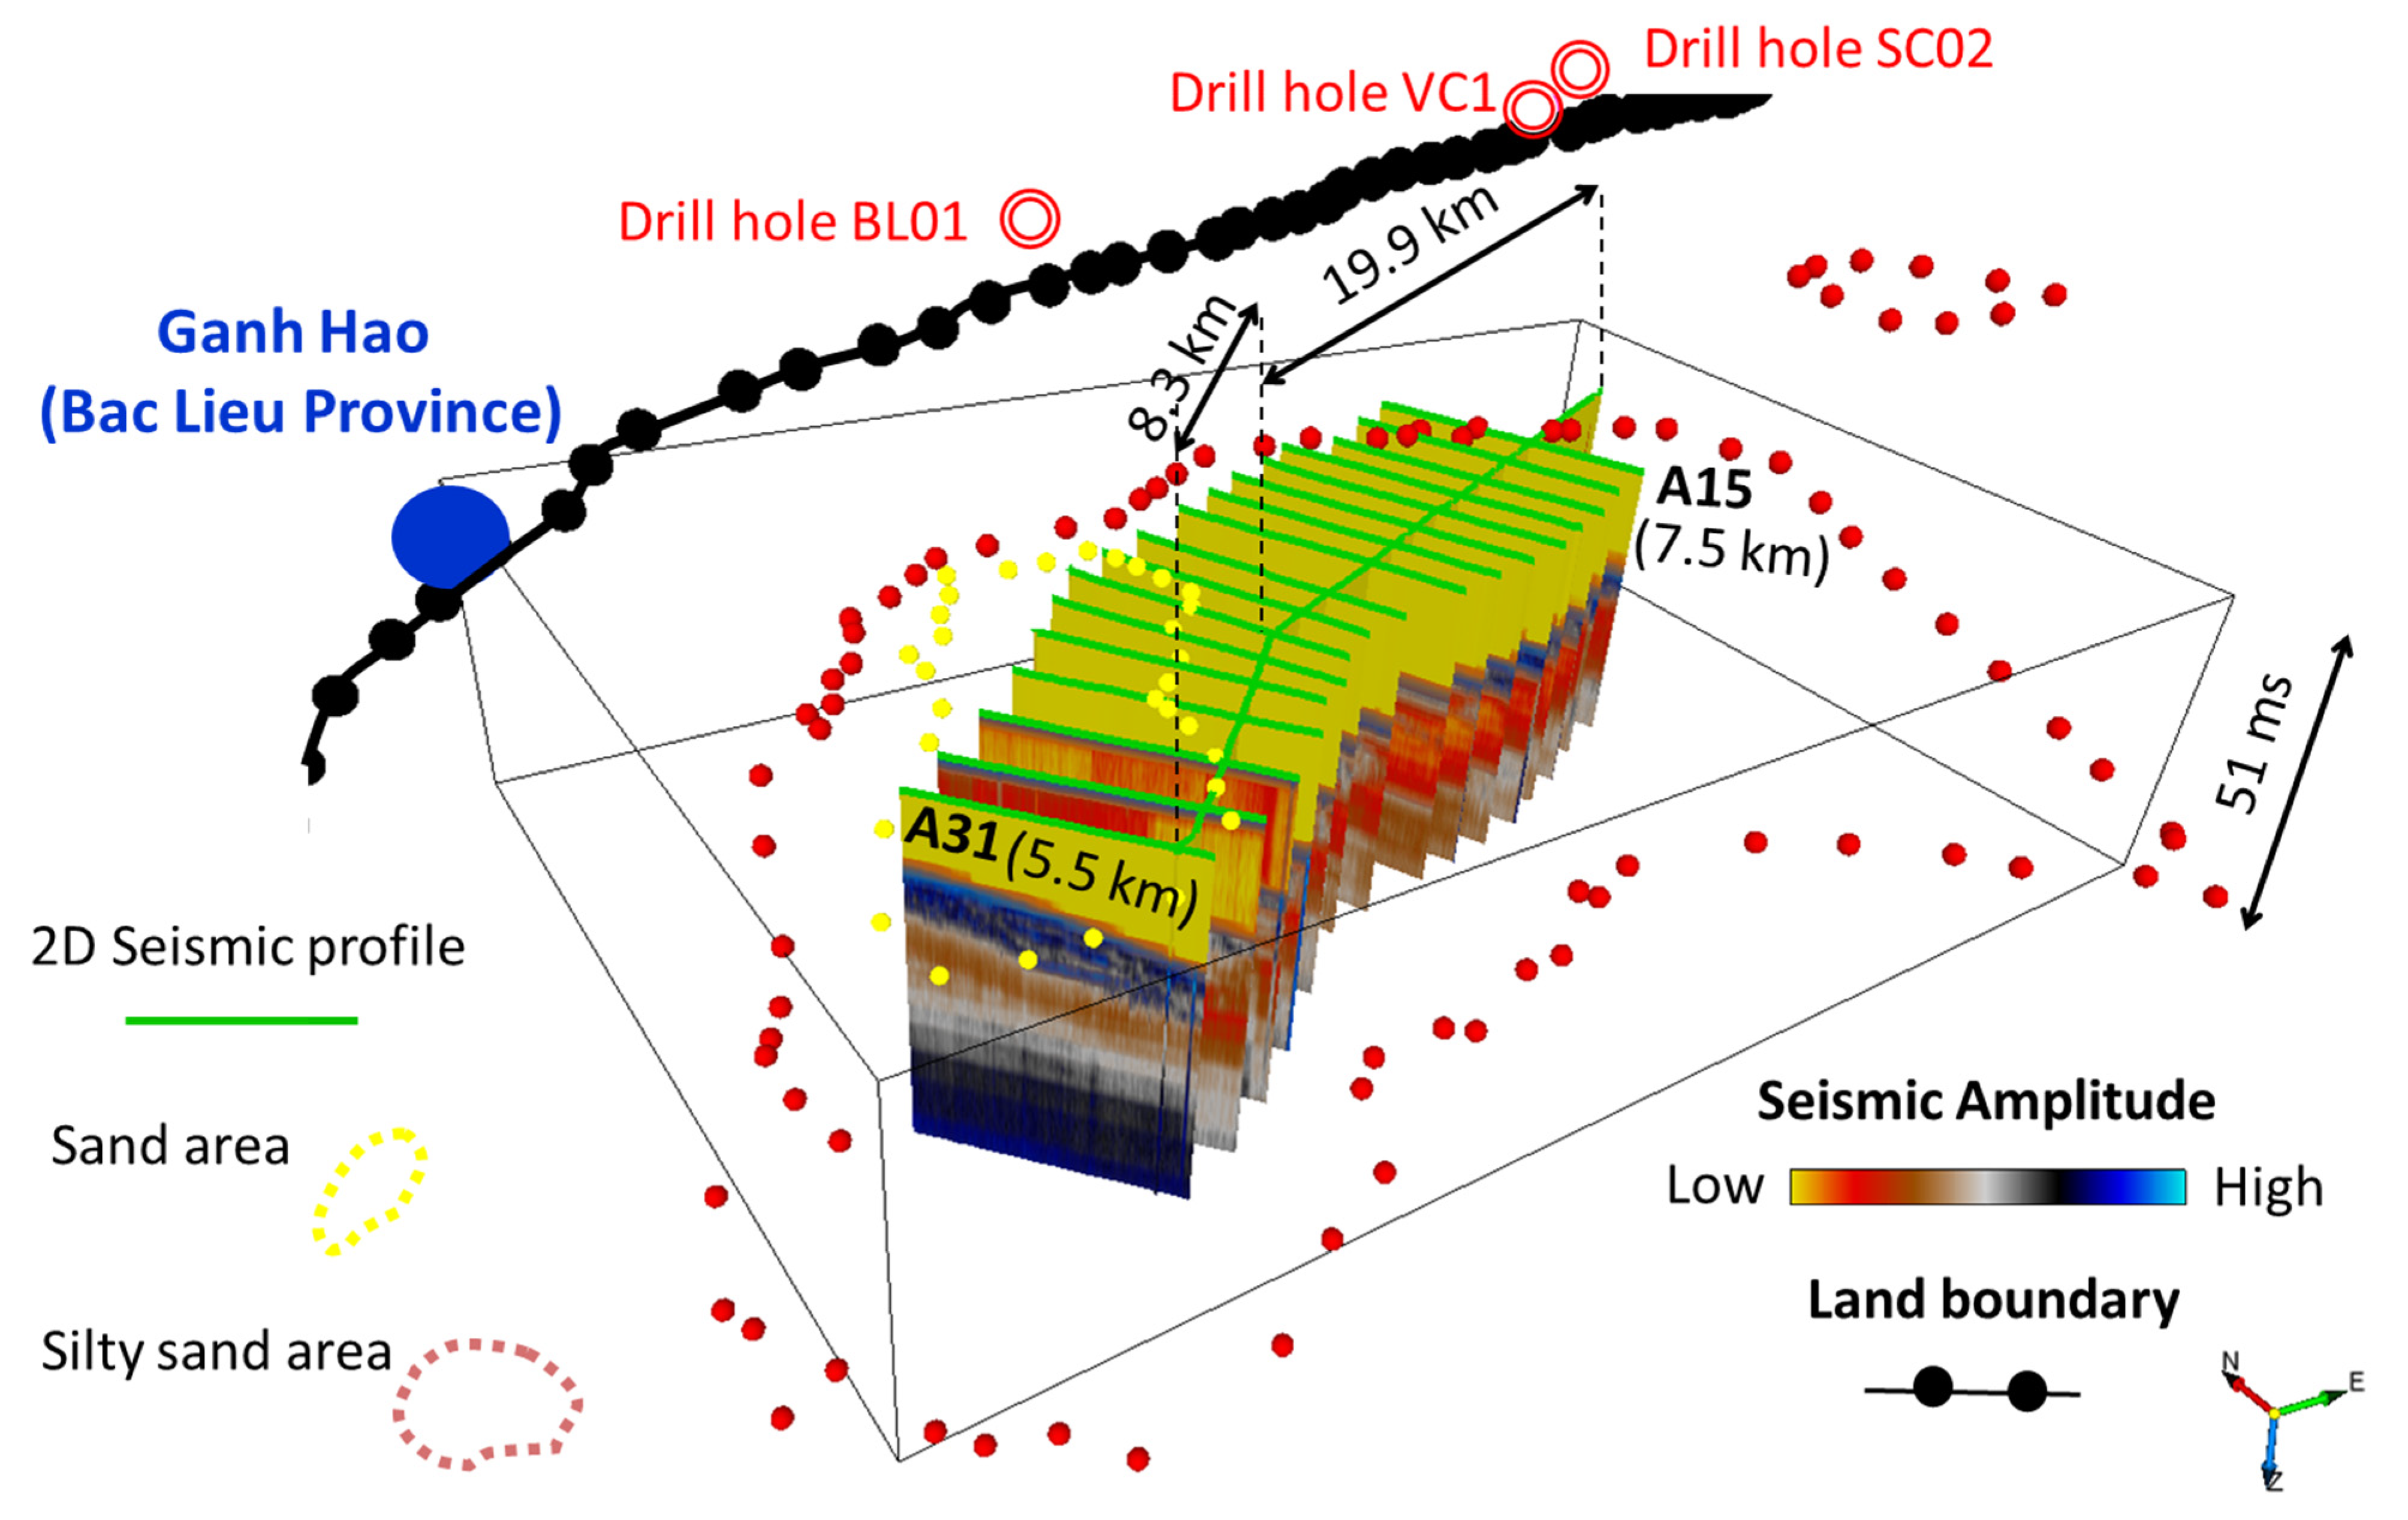
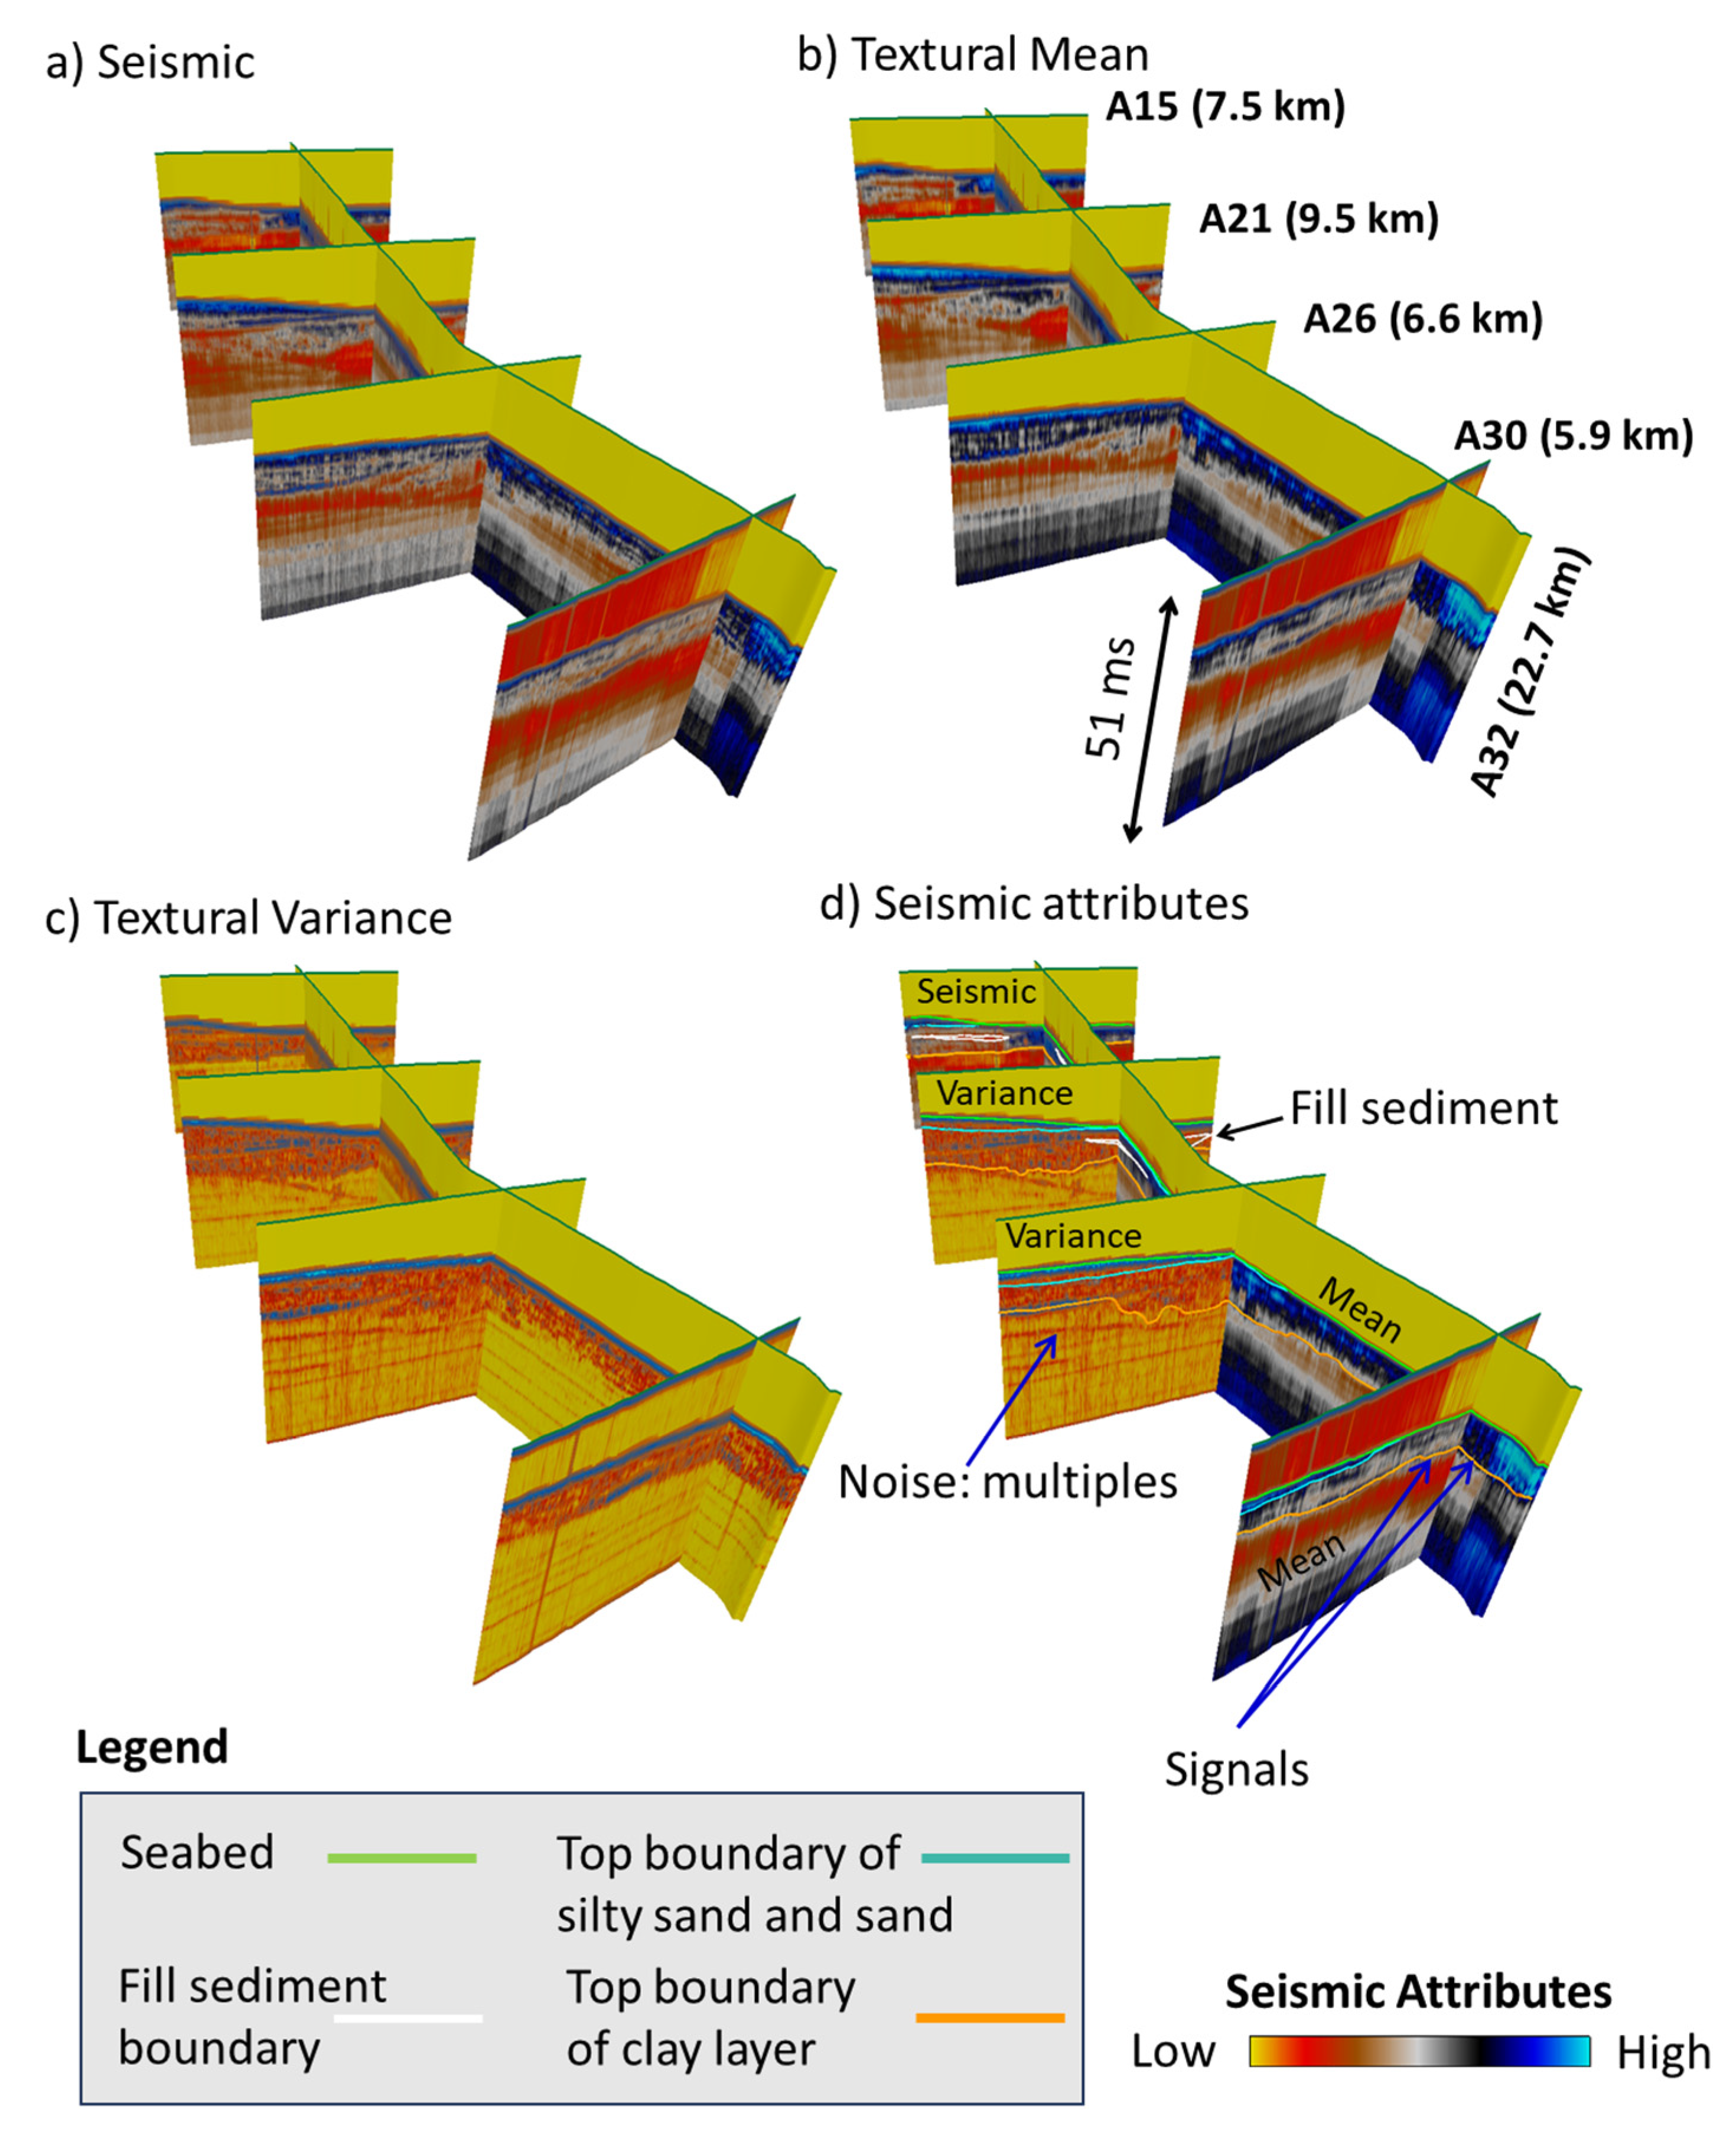
3.1. Seismic Analysis
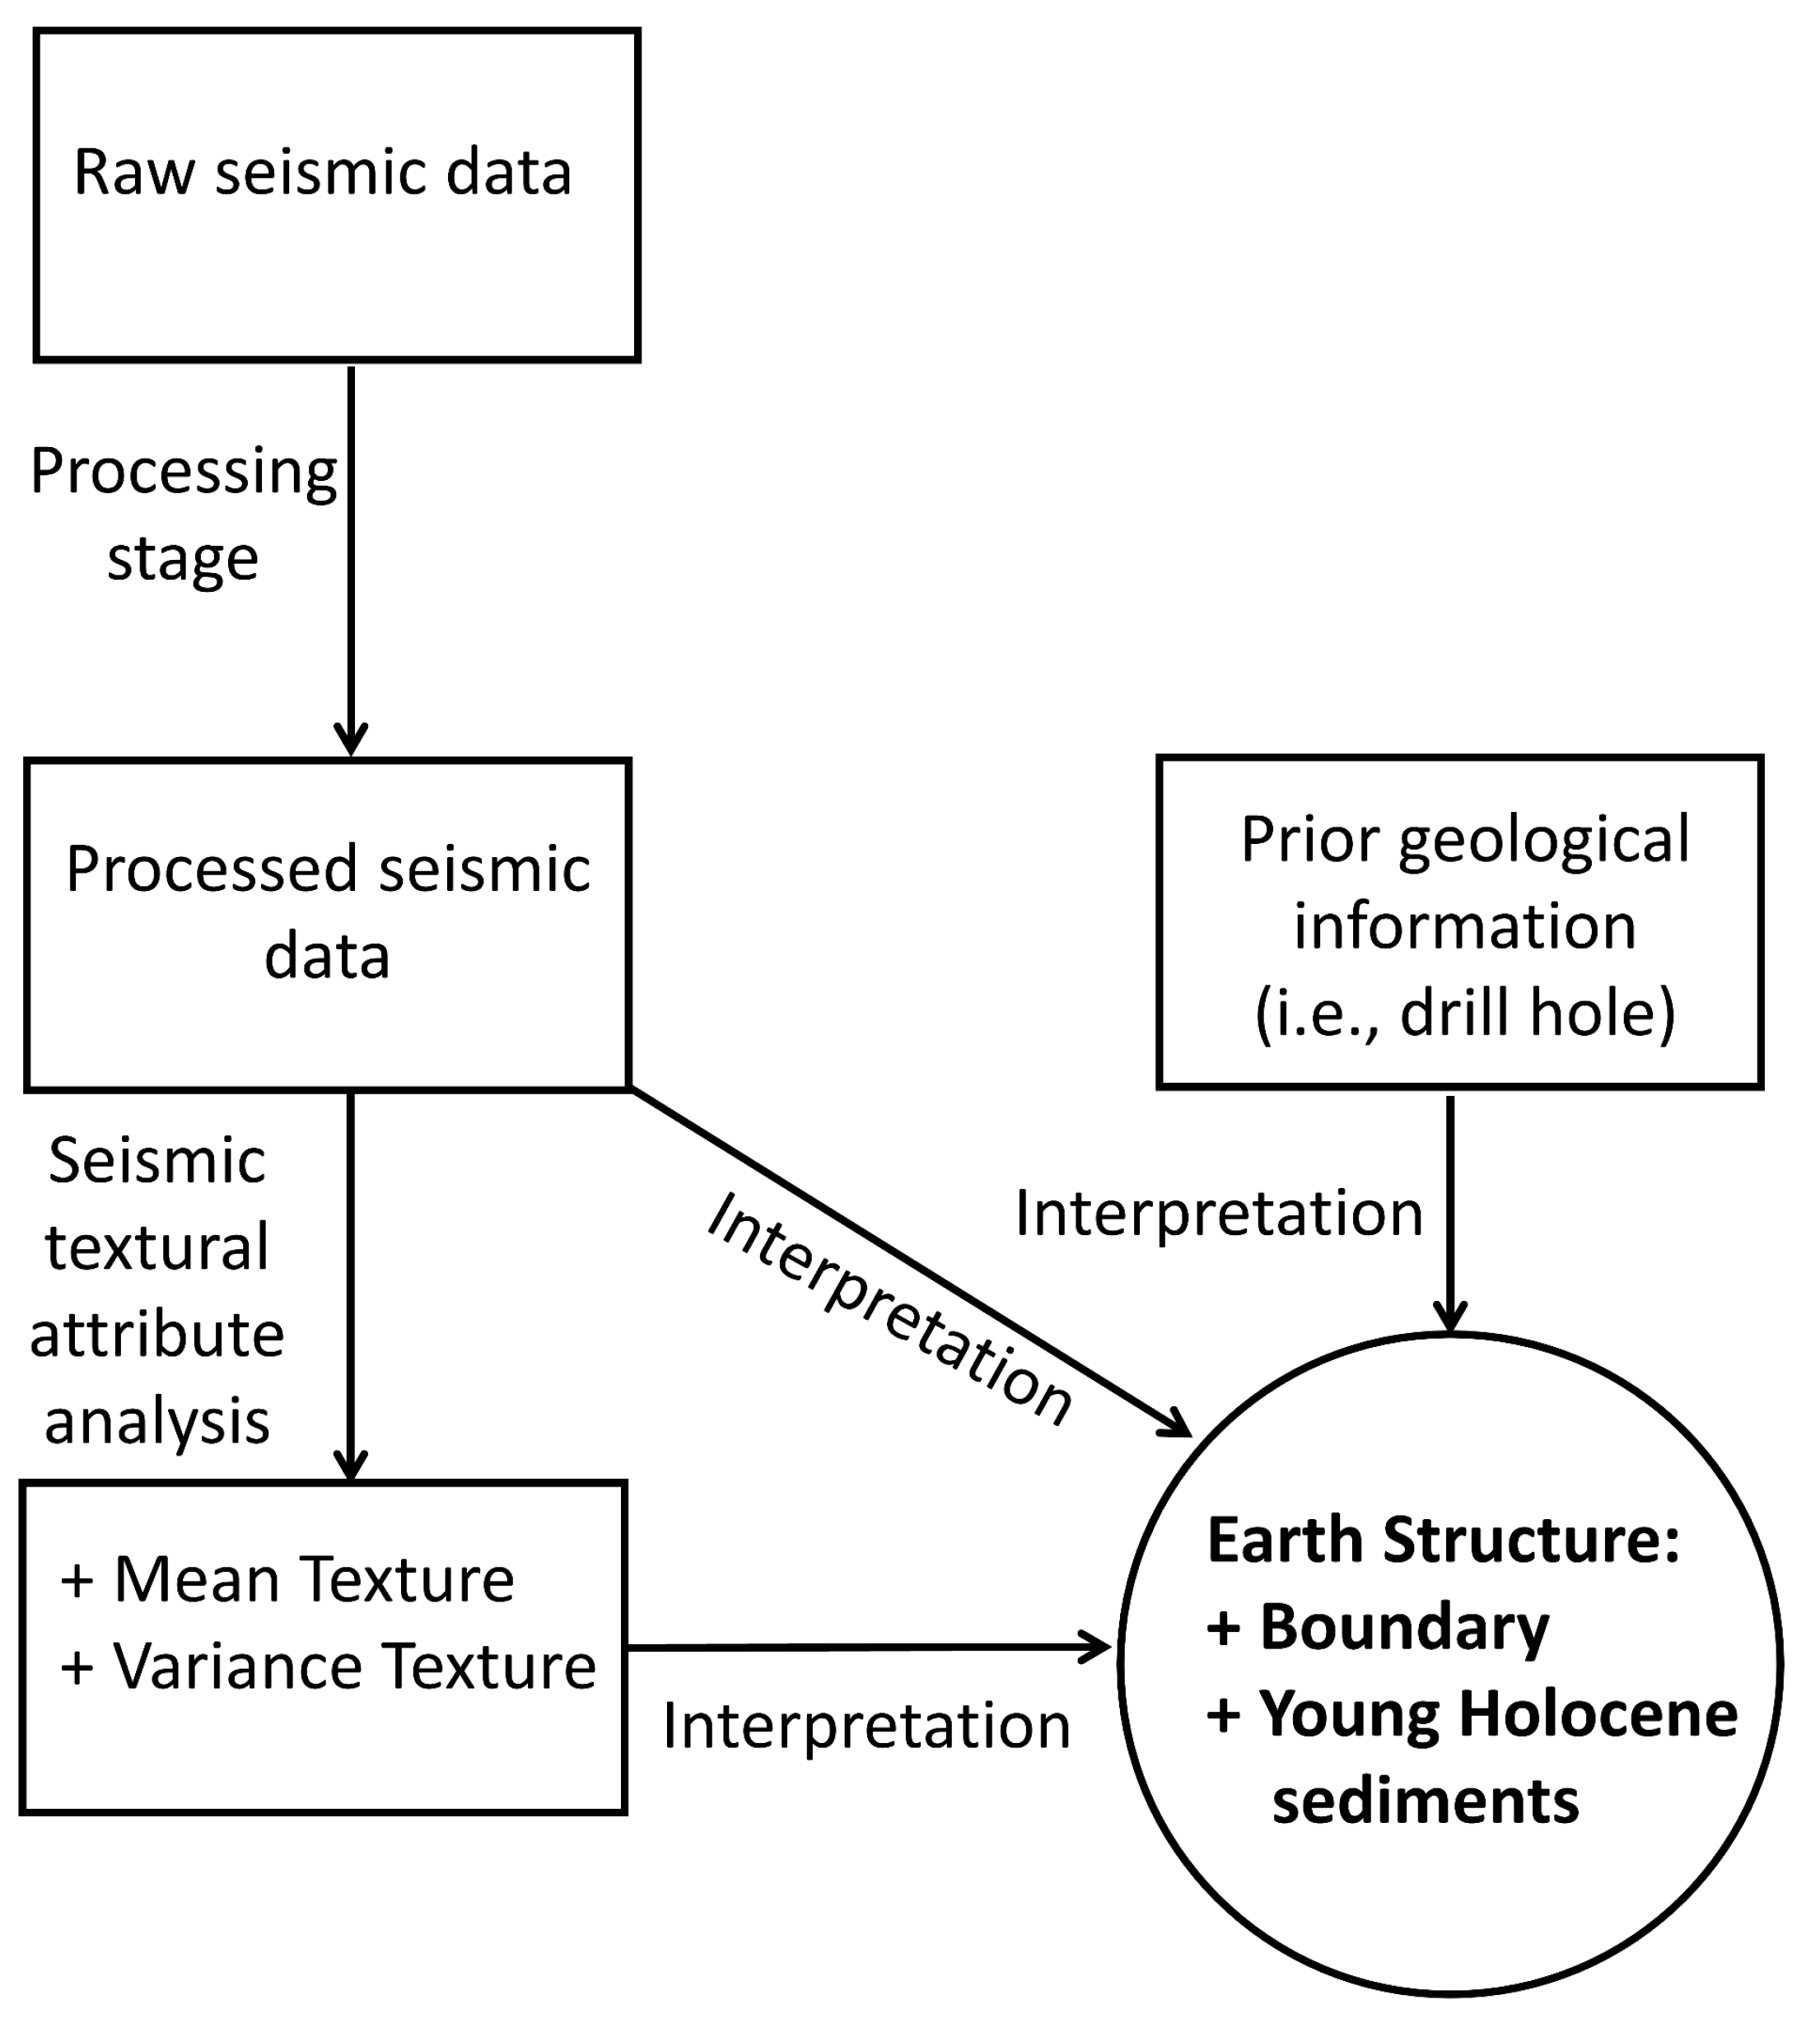
Seismic interpretation was improved by combining the following three data types: the processed amplitude, variance, and mean textures (see Figure 9). The mean texture attribute (Figure 9b) often exhibited seismic patterns similar to the original processed amplitude data (Figure 9a) but with a smoother appearance. Conversely, the variance attribute effectively highlighted the edges and delineated the boundaries within the seismic data (Figure 9c). By analyzing these seismic attributes, we could effectively visualize the meaningful seismic signal patterns while simultaneously identifying the influence of noisy multiples, ultimately improving the accuracy and reliability of our interpretations (Figure 9d).
For each 2D seismic profile, we interpreted the 2D horizons and delineated the sediment zones bounded by these horizons. Seismic boundaries were identified based on consistent reflection amplitude signals, distinct variance texture values, and visible mean texture patterns. Then, we consulted the relevant literature on the Mekong Delta to assign sediment types to the interpreted zones, including the water volume, silt, sand-typed (including silty sand and sand) sediment, and clay [2,4,7,13,15,16,17,18,19,32].
The seismic patterns observed in the 2D seismic slices are influenced by seismic wave interactions with sediment boundaries. These interactions, caused by acoustic impedance contrasts between the different sediment layers (e.g., silt and sand layers), result in variations in the seismic wave propagation characteristics. For example, the strong-valued seismic zone of the silt layer (below the water) has different amplitudes in and within the boundaries, with the weaker-valued ones of the sand sediment types (see Figure 9 and Figure 10).
Building a 3D horizon from 2D interpreted horizons can be performed by using the Matlab built-in linear interpolation function scatteredInterpolant.m [33]. For the convenient conversion of the two-way travel time (TWT) to the depth in the whole survey area, we chose the average seismic propagation velocity of 1550 m/s within the Mekong Delta region [2,4,7].

3.2. Interpretation

The 3D seabed surface was most effectively mapped by using all of the available 2D seismic boundaries, thanks to their distinct reflection seismic amplitudes (see Figure 10 and Figure 11). The water medium, characterized by the lowest seismic attribute amplitudes, is represented as the top yellow zone (i.e., see Figure 9 and Figure 10). The seabed exhibits a gentle slope, gradually deepening from 10.0 m to 19.0 m over an approximately 11-km distance from the shoreline.
The existence of sand layers is proved by incorporating drill hole data with the geological information extracted from the published literature [13,16,17,19]. Our research reveals a distinct seismic signature differentiating sand sediments from silt and sandy silt sediments (i.e., see Lines A17 and A32 in Figure 12). Silt and sandy silt layers are related to the strongest mean values, appearing as blue/cyan high-valued zones. In contrast, sand sediments exhibit a unique pattern of alternating high, medium, and small mean values, seen as mixture of blue, black, white, and brown stripes (see Figure 12).
Figure 13 illustrates an example of the interpretation of the clay layer top. A visible seismic reflection horizon, observed at around a 20 m depth along Line A23, was interpreted as the boundary between Pleistocene and Holocene materials (see the yellow curves in Figure 12 and Figure 13). This seismic horizon reaches a maximum depth of around 20 m (see Figure 11d and Figure 13). The sediment layer interpretations derived from the seismic data are supported by prior knowledge from published works [13,16,17]. The drill holes BL01, SC02, and VC1 (see Figure 13 and Figure 14), located close to the seismic survey area, indicate that the top of the Pleistocene clay layer extends to a depth of around 20 m [13,16,17,19]. This depth, extracted from the drill holes, aligns well with the seismic horizon representing the clay layer top (see the yellow curves in Figure 13).
The sand sediment thickness at a specific location was calculated by subtracting the depth of its bottom from the depth of its top (see Figure 11c). Its bottom depth was defined either at the top of the clay layer or the top of the sandy silt layer (see Figure 12). The maximum thickness along Line 32 was around 10 m.
Moreover, the presence of 3D fill sediments within the sand sediment layer was detected through the analysis of the mean textural attribute (see Figure 13). That is, sandy silt layers, as mentioned in Figure 12, show strong mean values, displaying blue/cyan high-valued zones. Inversely, the 3D fill sediment layer, as defined by a lens-shaped geometry, exhibits weak seismic mean texture values (see Line A17 in Figure 13). This might be interpreted as a sand sediment type.
Combining the information from the published works with the seismic data attribute analysis indicates that the distinct seismic patterns correlate strongly with the distribution of sand and silt sediments [13,16,17,19]. Note that the map delineating the surface distribution of silt and sand sediments in the surface is based on the analysis of the seabed samples [13,16,17,19].
Alternating silt and sand sediment layers seen in the drill holes, BL01, SC02, and VC1, suggest different types of depositional facies [13,16,17,19]. In view of the seismic data, distinct patterns of seismic attributes can be linked to specific sediment types. Moreover, a gentle slope from the mainland towards the sea is evident. Although these seismic patterns exhibit variations in sediment types, their depth resolution is lower compared to that of the drill hole data.
The geological history of the Bac Lieu area is closely connected to the evolution of the Mekong Delta. The delta’s formation occurred in the following two major phases: (i) a period of marine transgression from 8000 to 6000 years ago, and (ii) a later period of regression from 6000 years ago to the present. The Mekong Delta’s sedimentary strata have been accumulating for over 8000 years. Sediment deposition within the delta has been importantly influenced by tidal processes, with a transition from tide-dominated sedimentation, between 6000 and 3000 years ago, to a mixed tide–wave regime during the last 3000 years [17]. Moreover, sediments deposited in the delta front under the influence of both tides and waves tend to be coarser-grained compared to those deposited in a purely tide-dominated delta front [17,34].
According to the three drill holes, VC01, BL01, and SC02 [17,19], the boundary between the two Holocene and Pleistocene layers are imaged at around 20 m. This depth shows a great reference for determining their boundaries in the seismic data profiles.
The seismic data analysis revealed distinct layering patterns associated with different sediment types in depth. Sand-rich layers exhibited variable seismic amplitudes due to their heterogeneous composition (see Figure 12). In contrast, silt layers, with their relatively homogeneous composition, tended to exhibit more uniform and stronger values in seismic amplitudes and mean texture. These seismic characteristics provide valuable insights into the seismic interpretation, aiding in the differentiation between the sand-rich and silt-rich layers, which is crucial for the recognition of marine sand resources. According to the lithology analysis of the work [17], the drill holes show different layers of sand with different percentages of sand, which could lead to different density values or different acoustic impedances. Therefore, within the areas that have boundaries of sand layers, they can be expressed by different seismic horizons.
Our high-resolution seismic interpretation offers valuable new insights into the spatial distribution of young Holocene sediments, including silt, sand, and clay layers, both horizontally and vertically, within the Bac Lieu offshore area of Vietnam. The detailed mapping of the sand layer thickness derived from this analysis is particularly important for Vietnamese government officials. This information is crucial for developing informed policies related to the exploration and exploitation of marine mineral resources, which are essential for critical infrastructure development projects, such as highway construction.

4. Conclusions

The interpretation of the 2D seismic survey profiles in the Bac Lieu offshore, Vietnam, could be used to construct 3D images of the seabed and underlying sediment layers, including sand, silt and clay horizons. Beyond the traditionally processed seismic amplitude, we utilized a collection of seismic attributes, the variance and mean, in conjunction with prior information (i.e., geology maps and borehole data) to effectively detect the sediments. These attributes, characterized by distinct value ranges or spatial patterns, enabled the detection of seismic boundaries between the different sediment layers. The boundaries between the Holocene and Pleistocene layers were both detected by seismic attributes and drill hole information. Holocene sediments, as silt and sand types, can be distinguished by their seismic signatures: the silt layers typically exhibit strong seismic processed or mean attribute values, while the sand layers are characterized by smaller-to-medium-valued mean attribute zones. The resulting 3D visualizations of the sand sediment horizons can provide valuable information for Vietnamese government officials in delivering regulations for the exploration and exploitation of marine mineral resources.

Author Contributions

Conceptualization, C.V.A.L. and D.Q.N.; methodology, D.Q.N. and C.V.A.L.; software, C.V.A.L. and D.Q.N.; validation, C.V.A.L.; formal analysis, C.V.A.L., D.Q.N., T.V.N. and T.V.H.; investigation, C.V.A.L. and D.Q.N.; resources, D.Q.N. and C.V.A.L.; data curation, D.Q.N. and C.V.A.L.; writing—original draft preparation, C.V.A.L.; writing—review and editing, C.V.A.L.; visualization, C.V.A.L. and T.V.N.; supervision, C.V.A.L.; project administration, C.V.A.L.; funding acquisition, C.V.A.L. All authors have read and agreed to the published version of the manuscript.

Funding

This research is funded by Vietnam National University, Ho Chi Minh City (VNU-HCM), grant number B2024-18-02.

Data Availability Statement

The data used in this research can be made available by the corresponding author upon reasonable request.

Acknowledgments

This research is funded by Vietnam National University, Ho Chi Minh City (VNU-HCM) under grant number B2024-18-02. We thank dGB Earth Sciences and Curtin University for providing access to software tools. We would like to thank Hao Van Lam for providing useful information. The authors would thank the anonymous reviewers for their helpful feedback, which improved this article. Cuong Van Anh Le would thank Can Van Le and Loan Thi Bui for inspiring, nurturing, teaching, and supporting him.

Conflicts of Interest

The authors declare no conflicts of interest.

References

  1. Ianniruberto, M.; Campos, J.E.; Araújo, V. Application of shallow seismic profiling to study riverbed architectural facies: A case study of the Tocantins river (Pará-Brazil). An. Acad. Bras. Ciências 2012, 84, 645–654. [Google Scholar] [CrossRef]
  2. Bui Viet, D.; Stattegger, K.; Unverricht, D.; Phung Van, P.; Nguyen Trung, T. Late Pleistocene–Holocene seismic stratigraphy of the Southeast Vietnam Shelf. Glob. Planet. Change 2013, 110, 156–169. [Google Scholar]
  3. Novak, B.; Björck, S. Late Pleistocene–early Holocene fluvial facies and depositional processes in the Fehmarn Belt, between Germany and Denmark, revealed by high-resolution seismic and lithofacies analysis. Sedimentology 2002, 49, 451–465. [Google Scholar] [CrossRef]
  4. Le, C.V.A.; Duong, M.B.; Kieu, T.D. High–Resolution Seismic Reflection Survey of Holocene Sediment Distribution at Thi Vai River, Ho Chi Minh City, Vietnam. In Lecture Notes in Civil Engineering, Proceedings of the International Conference on Innovations for Sustainable and Responsible Mining; Springer: Berlin/Heidelberg, Germany, 2020; Volume 2, pp. 290–304. [Google Scholar]
  5. Laws, A.W.; Maloney, J.M.; Klotsko, S.; Gusick, A.E.; Braje, T.J.; Ball, D. Submerged paleoshoreline mapping using high-resolution Chirp sub-bottom data, Northern Channel Islands platform, California, USA. Quat. Res. 2019, 93, 1–22. [Google Scholar] [CrossRef]
  6. Monnier, B.; Pergent, G.; Mateo, M.Á.; Carbonell, R.; Clabaut, P.; Pergent-Martini, C. Sizing the carbon sink associated with Posidonia oceanica seagrass meadows using very high-resolution seismic reflection imaging. Mar. Environ. Res. 2021, 170, 105415. [Google Scholar] [CrossRef] [PubMed]
  7. Le, C.V.A.; Duong, M.; Nguyen, T.; Nguyen, T. Application of High–resolution Reflection Seismic Attributes for Researching 3D Shallow Marine Geology Structures. Inżynieria Miner. J. Pol. Miner. Eng. Soc. 2023, 1, 175–184. [Google Scholar] [CrossRef]
  8. EdgeTech. Edgetect Introduces New Portable Sub-Bottom Profiling System. Available online: https://www.edgetech.com/edgetech-introduces-new-portable-sub-bottom-profiling-system/ (accessed on 15 April 2020).
  9. SyQwest Inc. The StrataBox HD TM, a Portable High-Resolution Marine Sediment Imaging Instrument. Available online: https://geo-matching.com/products/stratabox (accessed on 15 July 2024).
  10. Bao, K. To Build a Highway, the Deputy Prime Minister said “Lack of River Sand to Use Sea Sand Instead”. Available online: https://dantri.com.vn/xa-hoi/lam-cao-toc-pho-thu-tuong-chi-dao-thieu-cat-song-dung-cat-bien-thay-the-20240511183852798.htm (accessed on 15 July 2024).
  11. Kitazawa, T.; Nakagawa, T.; Hashimoto, T.; Tateishi, M. Stratigraphy and optically stimulated luminescence (OSL) dating of a Quaternary sequence along the Dong Nai River, southern Vietnam. J. Asian Earth Sci. 2006, 27, 788–804. [Google Scholar] [CrossRef]
  12. Nguyễn, T.H.T.; Trần, N.; Đinh, X.T.; Nguyễn, Đ.T.; Trần, T.T.N. Tiến hóa trầm tích Pleistocen muộn-Holocen đới bờ đồng bằng Nam Bộ và sự ghép nối đồng bằng triều bán đảo Cà Mau với đồng bằng châu thổ sông Mê Kông trong Holocen giữa-muộn. Tạp Chí Khoa Học Đhqghn: Các Khoa Học Trái Đất Và Môi Trường 2019, 35, 97–120. [Google Scholar]
  13. Tamura, T.; Nguyen, V.L.; Ta, T.K.O.; Bateman, M.D.; Gugliotta, M.; Anthony, E.J.; Nakashima, R.; Saito, Y. Long-term sediment decline causes ongoing shrinkage of the Mekong megadelta, Vietnam. Sci. Rep. 2020, 10, 8085. [Google Scholar] [CrossRef] [PubMed]
  14. Le, N.T.; Nguyen, S.N.; Nguyen, T.A.M.; Nguyen, Q.D.; Duong, B.M.; Vo, T.H.Q. Research and Assessment of the Potential Natural Resources at Can Gio Offshore, Ho Chi Minh City and Proposed Solutions for Suitable Protection; Ho Chi Minh City Institute of Resources Geography, VAST: Ho Chi Minh City, Vietnam, 2018.
  15. Xue, Z.; He, R.; Liu, J.P.; Warner, J.C. Modeling transport and deposition of the Mekong River sediment. Cont. Shelf Res. 2012, 37, 66–78. [Google Scholar] [CrossRef]
  16. Unverricht, D.; Szczuciński, W.; Stattegger, K.; Jagodziński, R.; Le, X.T.; Kwong, L.L.W. Modern sedimentation and morphology of the subaqueous Mekong Delta, Southern Vietnam. Glob. Planet. Chang. 2013, 110, 223–235. [Google Scholar] [CrossRef]
  17. Ta, T.K.O.; Nguyen, V.L.; Tateishi, M.; Kobayashi, I.; Saito, Y. Holocene delta evolution and depositional models of the Mekong River Delta, southern Vietnam. In River Deltas–Concepts, Models, and Examples; SEPM (Society for Sedimentary Geology): Claremore, OK, USA, 2005. [Google Scholar]
  18. Ta, T.K.O.; Nguyen, V.L.; Tateishi, M.; Kobayashi, I.; Tanabe, S.; Saito, Y. Holocene delta evolution and sediment discharge of the Mekong River, southern Vietnam. Quat. Sci. Rev. 2002, 21, 1807–1819. [Google Scholar] [CrossRef]
  19. Nguyen, T.T.; Do, H.C.; Stattegger, K.; Bui, V.D.; Yang, S.; Ngo, T.K.C.; Nguyen, X.T.; Nguyen, V.T.; Ngo, T.N. Depositional sequences of the Mekong river delta and adjacent shelf over the past 140 kyr, southern Vietnam. J. Asian Earth Sci. 2021, 206, 104634. [Google Scholar] [CrossRef]
  20. Vietnam Department of Survey—Mapping and Geographic Information. Administrative Map of Socialist Republic of Vietnam. Available online: https://www.bandovn.vn/vi/page/mau-ban-do-hanh-chinh-nuoc-cong-hoa-xa-hoi-chu-nghia-viet-nam-181 (accessed on 11 August 2020).
  21. Sandmeier, K.-J. Reflexw—GPR and Seismic Processing Software. Available online: https://www.sandmeier-geo.de/reflexw.html (accessed on 7 July 2020).
  22. Institute of Coastal and Offshore Engineering Ho Chi Minh City Vietnam. Tide Level in May 2024 for Ganh Hao Station, Bac Lieu Province, Vietnam. Available online: http://www.icoe.org.vn/?mod=list&action=view&gid=1002&id=1013 (accessed on 20 July 2024).
  23. Brouwer, F.; Huck, A. An Integrated Workflow to Optimize Discontinuity Attributes for the Imaging of Faults. In Attributes: New Views on Seismic Imaging—Their Use in Exploration and Production; Marfurt, K.J., Gao, D., Barnes, A., Chopra, S., Corrao, A., Hart, B., James, H., Pacht, J., Rosen, N.C., Eds.; SEPM Gulf Coast Section Publications: Tulsa, OK, USA, 2011; pp. 496–533. [Google Scholar]
  24. Chopra, S.; Marfurt, K.J. Seismic Attributes for Prospect Identification and Reservoir Characteriztion; Society of Exploration Geophysicists: Tulsa, OK, USA, 2007. [Google Scholar]
  25. Yilmaz, O. Seismic Data Analysis: Processing, Inversion, and Interpretation of Seismic Data; Society of Exploration Geophysicists: Tulsa, OK, USA, 2001. [Google Scholar]
  26. Le, C.V.A.; Harris, B.D.; Pethick, A.M. New perspectives on Solid Earth Geology from Seismic Texture to Cooperative Inversion. Sci. Rep. 2019, 9, 14737. [Google Scholar] [CrossRef] [PubMed]
  27. Le, C.V.A.; Harris, B.D.; Pethick, A.M.; Takam Takougang, E.M.; Howe, B. Semiautomatic and Automatic Cooperative Inversion of Seismic and Magnetotelluric Data. Surv. Geophys. 2016, 37, 845–896. [Google Scholar] [CrossRef]
  28. Haralick, R.M.; Shanmugam, K.; Dinstein, I. Textural features for image classification. IEEE Trans. Syst. Man Cybern. 1973, 3, 610–621. [Google Scholar] [CrossRef]
  29. dGB Earth Sciences. OpendTect dGB Plugins User Documentation; Version 4.6; dGB Earth Sciences: Sugar Land, TX, USA, 2015. [Google Scholar]
  30. Hall-Beyer, M. GLCM Texture Tutorial. Available online: http://www.fp.ucalgary.ca/mhallbey/tutorial.htm (accessed on 3 May 2016).
  31. Wang, Z. Computational Seismic Interpretation Using Geometric Representation and Tensor-Based Texture Analysis; Georgia Institute of Technology: Atlanta, GA, USA, 2018. [Google Scholar]
  32. Nguyen, Q.D.; Nguyen, V.G.; Le, N.T. Investigation of Marine Sediments with a Subbottom Profilers System in West Coast of Camau, Vietnam. Inżynieria Miner. 2023, 2, 215–223. [Google Scholar]
  33. MathWorks. Interpolate 2-D or 3-D scattered Data. Available online: https://www.mathworks.com/help/matlab/ref/scatteredinterpolant.html (accessed on 7 July 2020).
  34. Orton, G.; Reading, H. Variability of deltaic processes in terms of sediment supply, with particular emphasis on grain size. Sedimentology 1993, 40, 475–512. [Google Scholar] [CrossRef]
Figure 2. Measurement equipment. The SyQwest Stratabox sonar equipment emits the seismic waves and receives their echoes from the marine environment [9].
Geosciences 15 00107 g002
Figure 4. Predicted tide level versus the time for four measurement days on 7, 8, 12 and 13 May 2024, in Ganh Hao, Bac Lieu Province, Vietnam [22].
Geosciences 15 00107 g004
Figure 5. Static shift. (a) Seismic data prior to the static-shift step, showing mismatches for the meeting points of three 2D seismic profiles, A32, A15, and A16. (b) Seismic data after applying the static-shift step, reaching the equal time of their meeting points (i.e., see the time for the meeting point as 18.2 ms).
Geosciences 15 00107 g005
Figure 6. Parameters used for processing the GLCM textures as mean and variance.
Geosciences 15 00107 g006
Figure 7. The workflow used for interpreting seismic data so to understand the earth structures in the Bac Lieu offshore, Vietnam [4,7,26].
Geosciences 15 00107 g007
Figure 8. Survey settings for 18 2D high-resolution seismic profiles in the Bac Lieu offshore, Vietnam, as 17 parallel profiles ranging from the smallest (around 6 km) to the longest (10 km), and a cross-profile with its distance (around 28 km). Three 2D seismic profiles traveling across two sediment zones as silt and sand sediments, namely, A15, A16, and A32 [13,16,17,19]. Drill hole locations are marked by red circles.
Geosciences 15 00107 g008
Figure 9. Seismic attributes with different seismic horizons: (a) seismic amplitude; (b) textural mean attribute; (c) textural variance attribute; (d) representation of the seismic amplitude and its textural attributes. The seabed, sand sediments, silt, and clay top were interpreted. Seabed and sediment boundaries (i.e., silty sand and sand) were detected through the analysis of variations in seismic attributes.
Geosciences 15 00107 g009
Figure 10. The 2D interpreted horizons from 18 2D seismic profiles. The green line represents the seabed, the cyan line represents the boundary of the silty sand and sand layer top, the red line represents the boundary of the sandy silt sediment layer top, and the yellow line represents the clay layer top. The 3D horizon for the clay layer top, interpolated by 2D horizons, plays a role as the bottom horizon of the younger Holocene sediments (i.e., sand and silt types).
Geosciences 15 00107 g010
Figure 11. Images of the seabed depth (a), the depth of the sand sediment layer top (b) and the sand thickness (c), and the depth of the clay layer top (d) in the survey area, the Bac Lieu offshore, Vietnam. The depths of the seabed and sand sediment layer top increase following the northwest to southeast direction. A greater distribution of sand sediments focuses in the center of the survey area, while less sand sediments are focused in the east (see Figure 11c). The sand sediment layer thickness is heavily affected by the depth of the clay layer top.
Geosciences 15 00107 g011
Figure 12. The 3D surface of the sandy silt layer top dividing two zones as sand and sandy silt sediments. Their different seismic patterns are well described by the mean texture attribute (i.e., see the seismic sections in Lines A17 and A32). Blue/cyan high-valued zones of the mean texture reflect the existence of silt sediments, while the smallest-to-medium-valued zones of the mean texture relate to sand sediments. The distributions of the sand and silt sediments interpreted from the 18 2D seismic profiles are compatible with their existence map analyzed from the published works [13,16,17]. The cyan line represents the boundary of the silty sand and sand layer top, the red line the boundary of the sandy silt sediment layer top and other materials, and the yellow line the clay layer top.
Geosciences 15 00107 g012
Figure 13. Representation of the 2D interpreted horizons of sand sediments, clay, and sandy silt sediments, and the 3D fill sediment bottom with two drill holes, BL01 and VC1 [17,19]. There is a clear seismic interpretation for the filling of sediment within the sand sediment layer. The cyan line represents the top of sand layer, the white line the boundary of the FILL sediment, and the yellow line the bottom of sand layer.
Geosciences 15 00107 g013
Figure 14. Images of the three drill holes near the 2D seismic profiles in the Bac Lieu offshore [17,19].
Geosciences 15 00107 g014
Disclaimer/Publisher’s Note: The statements, opinions and data contained in all publications are solely those of the individual author(s) and contributor(s) and not of MDPI and/or the editor(s). MDPI and/or the editor(s) disclaim responsibility for any injury to people or property resulting from any ideas, methods, instructions or products referred to in the content.

