
Kinetic Analysis of Carpathian Source Rock Pyrolysis Under Dynamic Conditions


Abstract
1. Introduction
2. Experimental
2.1. Materials and Methods
2.2. Kinetic Calculations
2.3. Kissinger Method
2.4. Kissinger–Akahira–Sunose Method
2.5. Friedman Method
3. Results
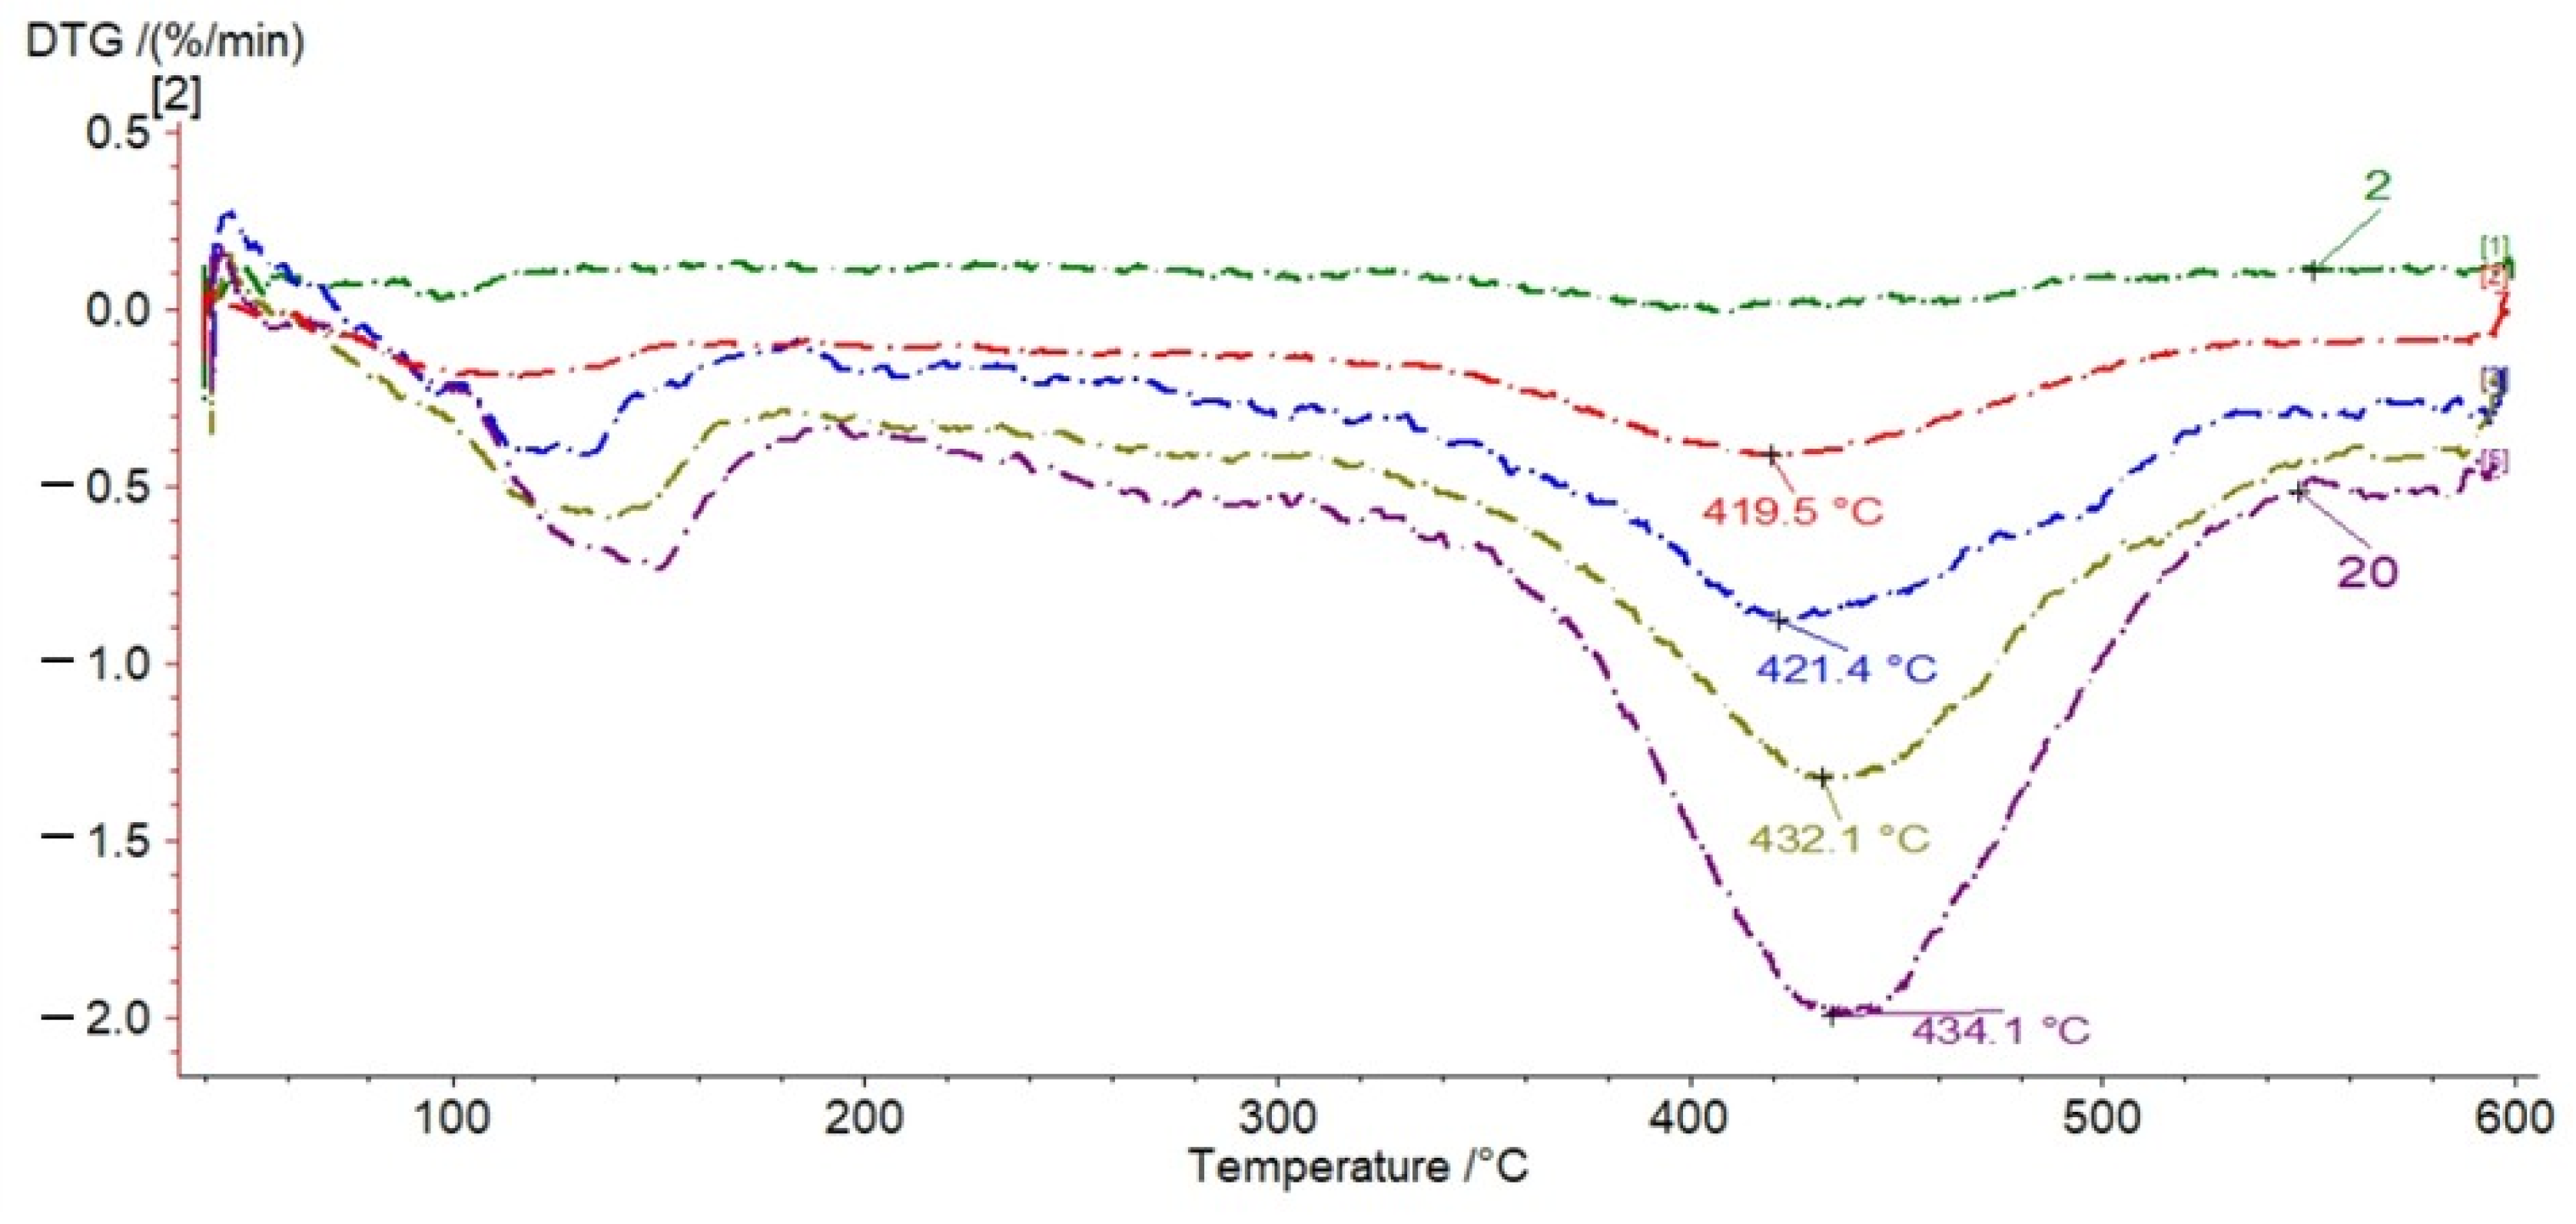
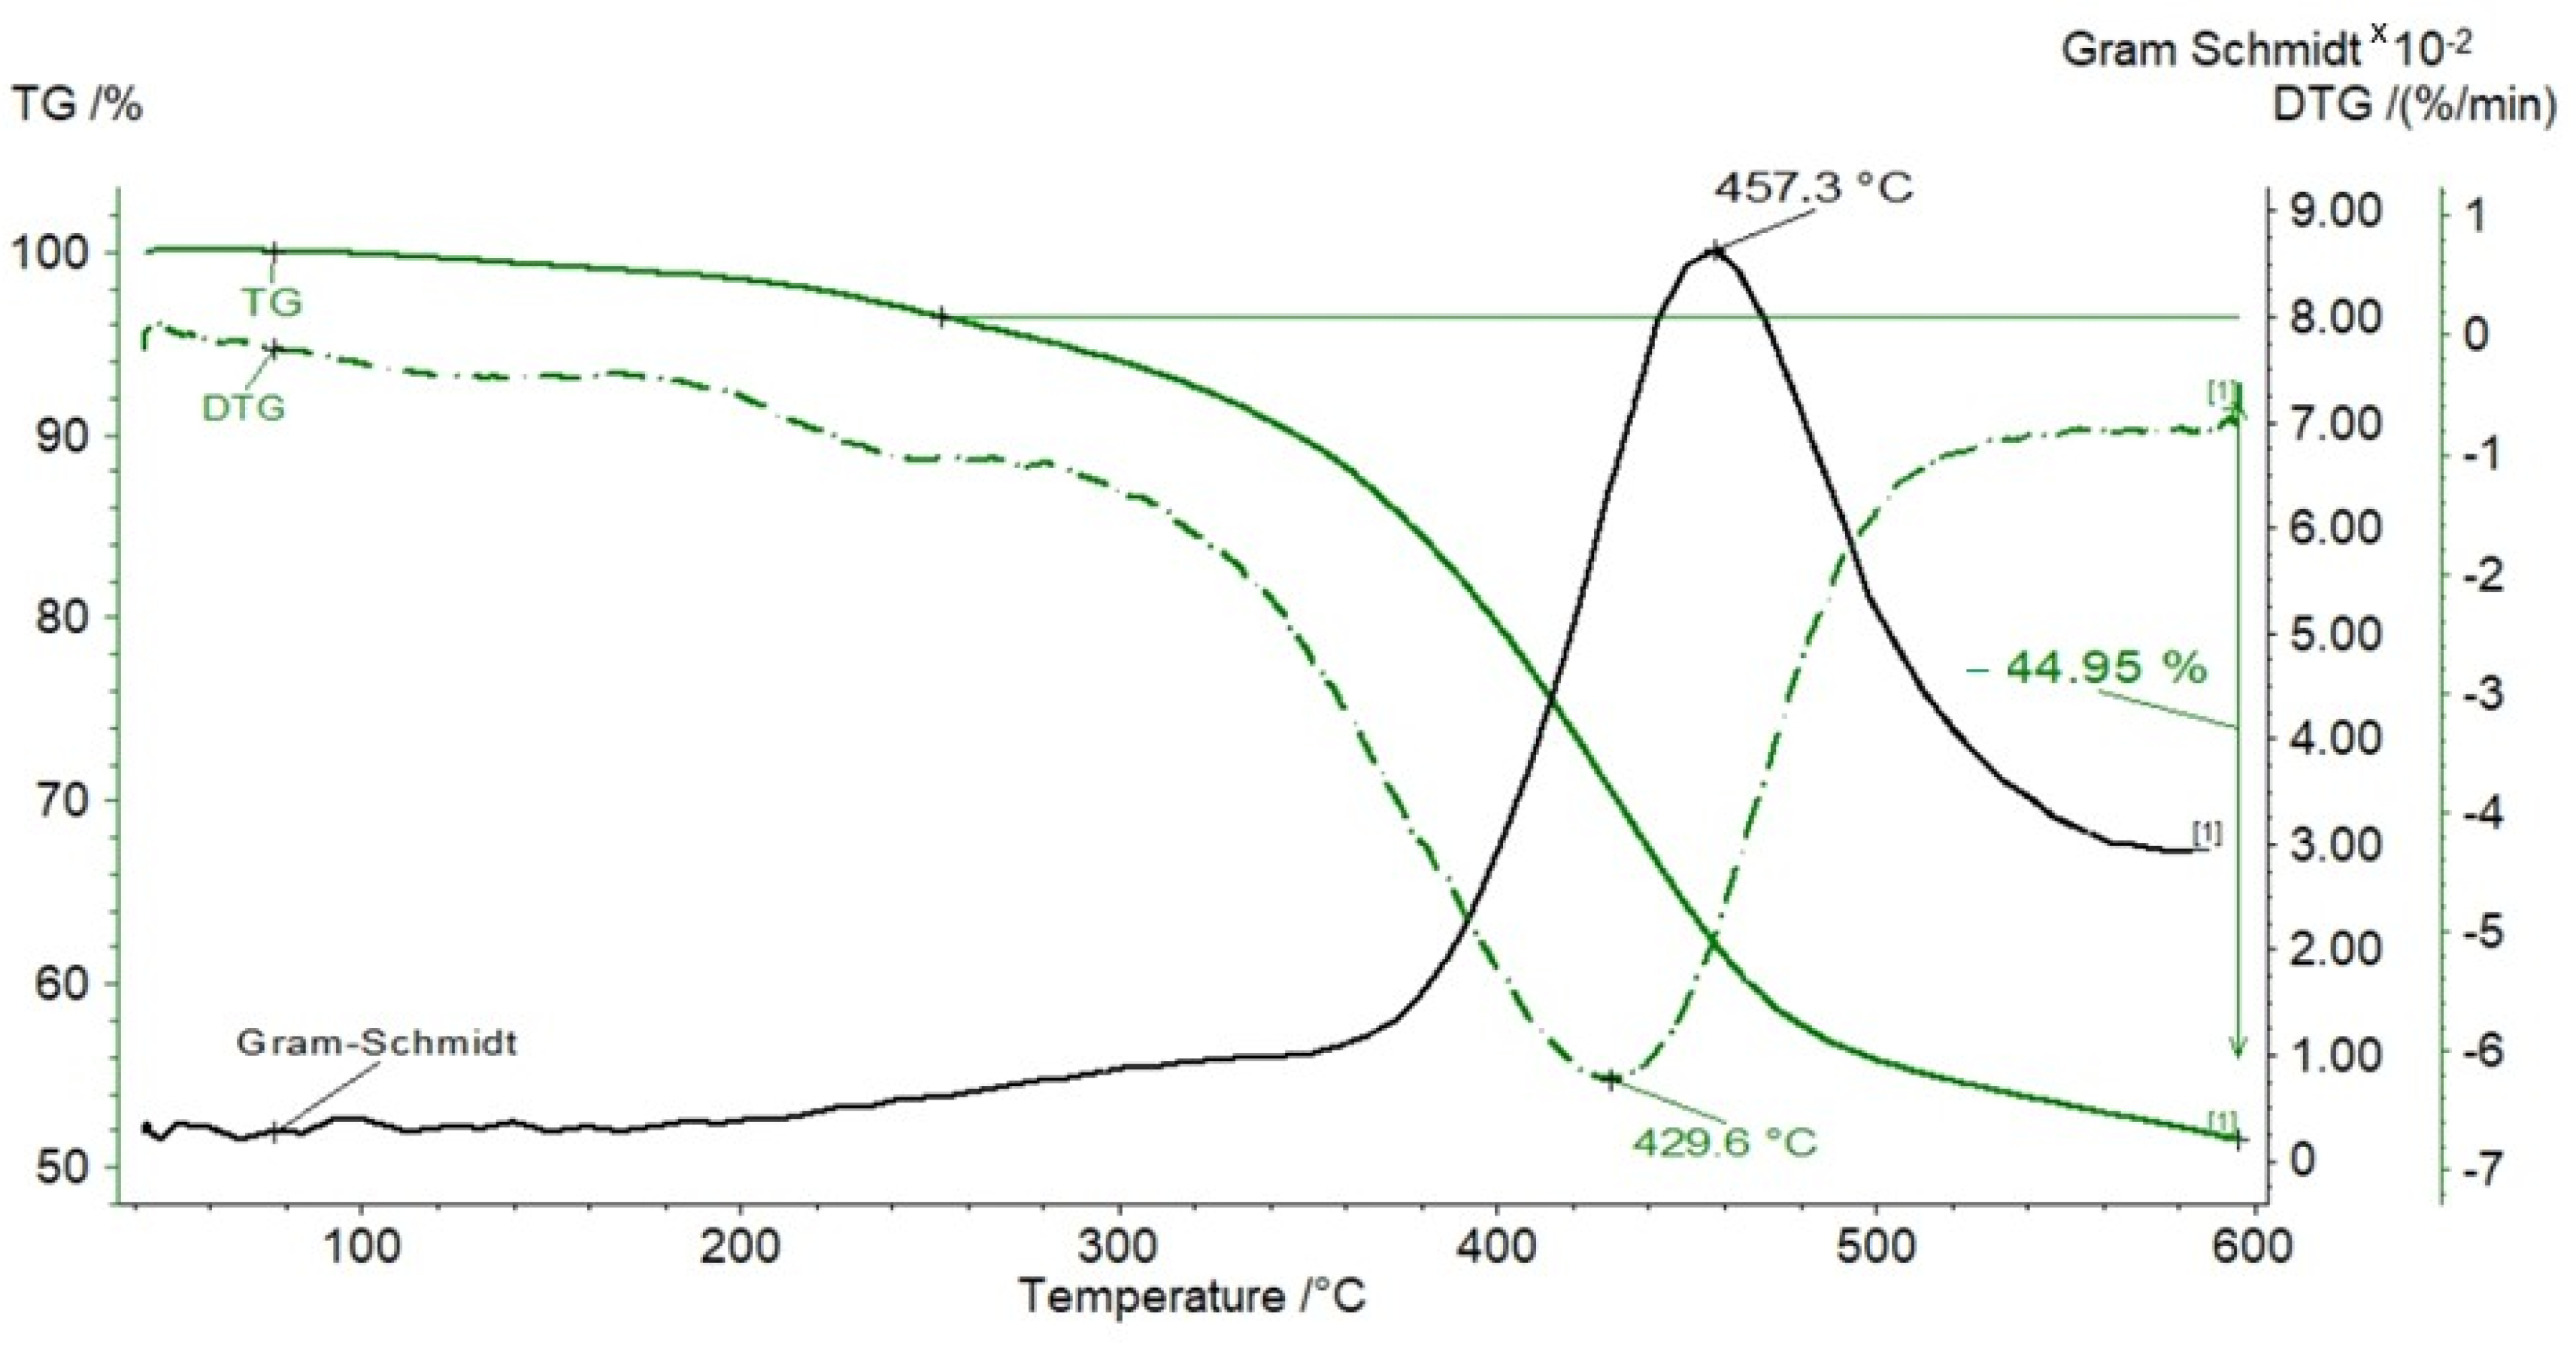
3.1. TG Analysis
- Pyrolysis of free bitumens or kerogen decomposition into pyrolytic bitumen, causing low mass loss, occurring in the temperature range of 185–350 °C.
- Bitumen decomposition into oil, gas, and char, occurring up to 600 °C, producing rapid and significant mass loss.
3.2. Kinetic Parameters of Pyrolysis
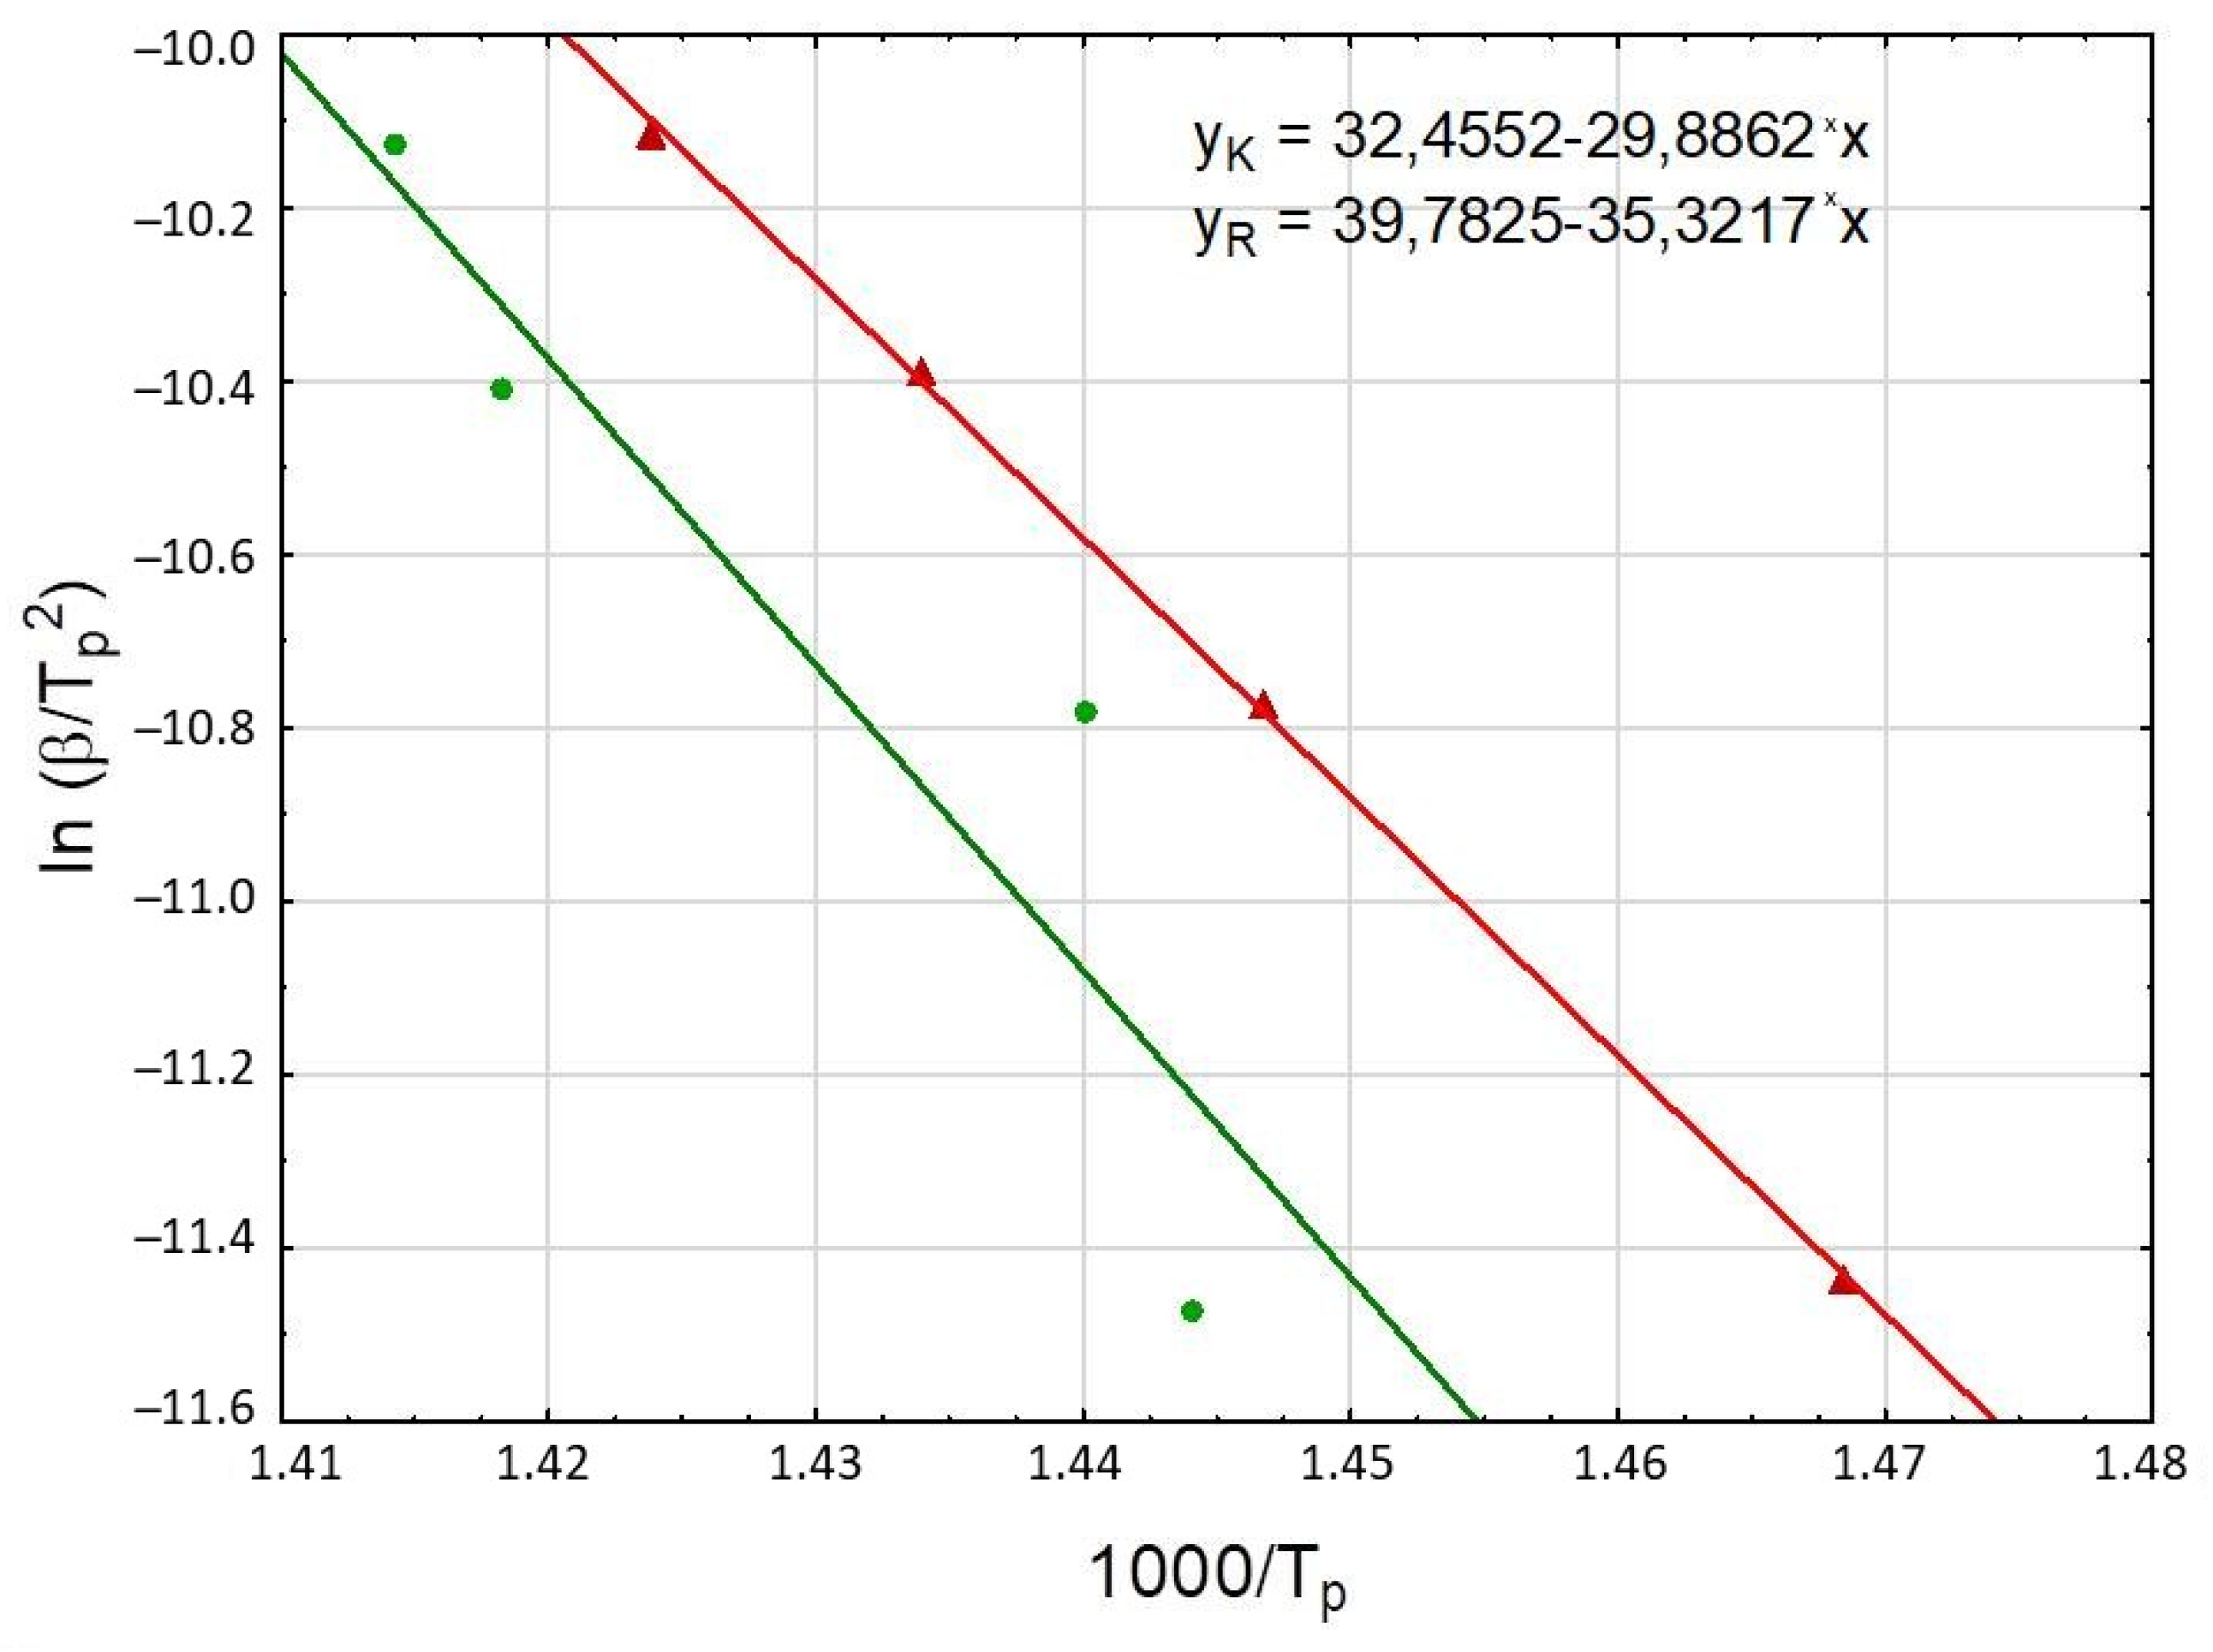
3.2.1. Kissinger Method
3.2.2. KAS and Friedman Methods
4. Discussion
5. Conclusions
Author Contributions
Funding
Data Availability Statement
Conflicts of Interest
Abbreviations
| DSC | differential scanning calorimetry |
| DTG | Derivative Thermogravimetry |
| KAS | Kissinger–Akahira–Sunose method |
| Py-GC/FID | Pyrolysis Gas Chromatography/Flame Ionization Detection |
| TG | thermogravimetry |
References
- Jarmołowicz-Szulc, K.; Jankowski, L. Geochemical Analysis and Genetic Correlations for Bitumens and Rocks of the Black Shale Type in the Outer Carpathians Tectonic Units in Southeastern Poland and the Adjacent Territory; Biuletyn PIG.: Warszawa, Poland, 2011; Volume 444, pp. 73–98. (In Polish) [Google Scholar]
- Ziemianin, K.; Brzuszek, P.; Słoczyński, T.; Jankowski, L. Dispersed organic matter in shales from Menilite Beds within Polish Outer Carpathians–preliminary diagnosis. Nafta-Gaz 2015, 9, 615–623. [Google Scholar]
- Matyasik, I.; Słoczyński, T. Calculation of the kerogen activation energy distribution used for model ling of unconventional petroleum systems. Conference materials. Geopetrol, Zakopane, 17–20 September 2012; pp. 661–666. (In Polish). [Google Scholar]
- Kosakowski, P.; Więcław, D.; Kotarba, M.J. Source rock characteristic of the selected flysch deposits in the transfrontier area of the Polish Outer Carpathians. Geologia 2009, 35, 155–190. (In Polish) [Google Scholar]
- Wood, D.A. Kerogen conversion and thermal maturity modelling of petroleum generation: Integrated analysis applying relevant kerogen kinetics. Mar. Pet. Geol. 2018, 89, 313–329. [Google Scholar] [CrossRef]
- Bhargava, S.; Awaja, F.; Subasinghe, N.D. Characterisation of some Australian oil shale using thermal, X-ray and IR techniques. Fuel 2005, 84, 707–715. [Google Scholar] [CrossRef]
- Karabakan, A.; Yürüm, Y. Effect of the mineral matrix in the reactions of shales. Part 2. Oxidation reactions of Turkish Göynük and US Western reference of shales. Fuel 2000, 79, 785–792. [Google Scholar] [CrossRef]
- Breen, C.; Clegg, F.; Herron, M.M.; Hild, G.P.; Hillier, S.; Hughes, T.L.; Jones, T.G.J.; Matteson, A.; Yarwood, J. Bulk mineralogical characterisation of oilfield reservoir rocks and sandstones using Diffuse Reflectance Infrared Fourier Transform Spectroscopy and Partial Least Squares analysis. J. Pet. Sci. Eng. 2008, 60, 1–17. [Google Scholar] [CrossRef]
- Cronauer, D.C.; Snyder, R.W.; Painter, P.C. Characterization of oil shale by FTIR spectroscopy. Abstr. Pap. Am. Chem. Soc. 1982, 27, 122–130. [Google Scholar]
- Warne, S.S.J.; Dubrawski, J.V. Applications of DTA and DSC to coal and oil shale evaluation. J. Therm. Anal. 1989, 35, 219–242. [Google Scholar] [CrossRef]
- Ballice, L.; Yüksel, M.; Saglam, M.; Schulz, H.; Hanoglu, C. Application of infrared spectroscopy to the classification of kerogen types and the thermogravimetrically derived pyrolysis kinetic of oil shales. Fuel 1995, 74, 1618–1623. [Google Scholar] [CrossRef]
- Kok, M.V. Thermal investigation of Seyitomer oil shale. Thermochim. Acta 2001, 369, 149–155. [Google Scholar] [CrossRef]
- Fan, C.; Yan, J.; Huang, Y.; Han, X.; Jiang, X. XRD and TG-FTIR study of the effect of mineral matrix on the pyrolysis and combustion of organic matter in shale char. Fuel 2015, 139, 502–510. [Google Scholar] [CrossRef]
- Skala, D.; Korica, S.; Vitorović, D.; Neumann, H.J. Determination of kerogen type using DSC and TG analysis. J. Therm. Anal. 1997, 49, 745–753. [Google Scholar] [CrossRef]
- Liu, Q.Q.; Han, X.X.; Li, Q.Y.; Huang, Y.R.; Jiang, X.M. TG-DSC analysis of pyrolysis process of two Chinese oil shales. J. Therm. Anal. Calorim. 2014, 116, 511–517. [Google Scholar] [CrossRef]
- Labus, M. Thermal methods implementation in analysis of fine-grained rocks containing organic matter. J. Therm. Anal. Calorim. 2017, 129, 965–973. [Google Scholar] [CrossRef]
- Chi, M.; Xu, X.; Ciu, D.; Zhang, H.; Wang, Q. A TG-FTIR investigation and kinetic analysis of oil shale kerogen pyrolysis using the distributed activation energy model. Oil Shale 2016, 33, 228–247. [Google Scholar] [CrossRef]
- Han, J.; Sun, Y.; Guo, W.; Deng, S.; Hou, C.; Qu, L.; Li, Q. Non-isothermal thermogravimetric analysis of pyrolysis kinetics of four oil shales using Sestak-Bergen method. J. Therm. Anal. Calorim. 2019, 135, 2287–2296. [Google Scholar] [CrossRef]
- Jaber, J.O.; Probert, S.D. Non-isothermal thermogravimetry and decomposition kinetics of two Jordanian oil shales under different processing conditions. Fuel Process. Technol. 2000, 63, 57–70. [Google Scholar] [CrossRef]
- Yongjiang, X.; Huaqing, X.; Hongyan, W.; Zhiping, L.; Chachoe, F. Kinetics of isothermal and non-isothermal pyrolysis of oil shale. Oil Shale 2011, 28, 415–424. [Google Scholar] [CrossRef]
- Marshall, C.P.; Kannangara, G.S.K.; Wilson, M.A.; Guerbois, J.P.; Hartung-Kagi, B.; Hart, G. Potential of thermogravimetric analysis coupled with mass spectrometry for the evaluation of kerogen in source rocks. Chem. Geol. 2002, 184, 185–194. [Google Scholar] [CrossRef]
- Vyazovkin, S.; Wight, C.A. Isothermal and non-isothermal kinetics of thermally stimulated reactions of solids. Int. Rev. Phys. Chem. 1998, 17, 407–433. [Google Scholar] [CrossRef]
- Galukhin, A.; Gerasimov, A.; Nikolaev, I.; Nosov, R.; Osin, Y. Pyrolysis of kerogen of Bazhenov Shale: Kinetics and influence of inherent pyrite. Energy Fuels 2017, 31, 6777–6781. [Google Scholar] [CrossRef]
- Kissinger, H.E. Reaction Kinetics in Differential Thermal Analysis. Anal. Chem. 1957, 29, 1702–1706. [Google Scholar] [CrossRef]
- Vyazovkin, S.; Burnham, A.K.; Criado, J.M.; Pérez-Maqueda, L.A.; Popescu, C.; Sbirrazzuoli, N. ICTAC Kinetics Commitee recommendations for performing kinetic computations on thermal analysis data. Thermochim. Acta 2011, 520, 1–19. [Google Scholar] [CrossRef]
- Friedman, H.L. Kinetics of thermal degradation of char-forming plastics from thermogravimetry. Application to a phenolic plastic. J. Polym. Sci. Part C Polym. Symp. 1964, 6, 183–195. [Google Scholar] [CrossRef]
- Williams, P.F.V. Thermogravimetry and decomposition kinetics of British Kimmeridge clay oil shales. Fuel 1985, 64, 540–545. [Google Scholar] [CrossRef]
- Labus, M.; Kierat, M.; Matyasik, I.; Spunda, K.; Kania, M.; Janiga, M.; Bieleń, W. The use of compiled thermal methods in the characteristics of source rocks on the example of menilite beds. Nafta-Gaz 2019, 75, 67–76. [Google Scholar] [CrossRef]
- Maaten, B.; Loo, L.; Konist, A.; Pihu, T.; Siirde, A. Investigation of the evolution of sulphur during the thermal degradation of different oil shales. J. Anal. Appl. Pyrolysis 2017, 128, 405–411. [Google Scholar] [CrossRef]
- Han, H.; Zhong, N.N.; Huang, C.X.; Zhang, W. Pyrolysis kinetics of oil shale from northeast China: Implications from thermogravimetric and Rock–Eval experiments. Fuel 2015, 159, 776–783. [Google Scholar] [CrossRef]
- Bouamoud, R.; Moine, E.C.; Mulongo-Masamba, R.; El Hamidi, A.; Halim, M.; Arsalane, S. Type I kerogen-rich oil shale from the Democratic Republic of the Congo: Mineralogical description and pyrolysis kinetics. Pet. Sci. 2020, 17, 255–267. [Google Scholar] [CrossRef]
- Lewan, M.D.; Kotarba, M.J.; Curtis, J.B.; Więcław, D.; Kosakowski, P. Oil-generation kinetics for organic facies with Type-II and –IIS kerogen in the Menilite Shales of the Polish Carpathians. Geochim. Cosmochim. Acta 2006, 70, 3351–3368. [Google Scholar] [CrossRef]
- Tegelaar, E.W.; Noble, R.A. Kinetics of hydrocarbon generation as a function of the molecular structure of kerogen as revealed by pyrolysis-gas chromatography. Adv. Org. Geochem. 1994, 22, 543–574. [Google Scholar] [CrossRef]
- Bai, F.; Sun, Y.; Liu, Y.; Li, Q.; Guo, M. Thermal and kinetic characteristics of pyrolysis and combustion of three oil shales. Energy Convers. Manag. 2015, 97, 374–381. [Google Scholar] [CrossRef]
- Bai, F.; Liu, Y.; Lai, C.; Sun, Y.; Sun, P.; Xue, L.; Zhao, J.; Guo, M. Thermal degradations and processes of four kerogens via TG-FTIR: Pyrolysis performances, products, and kinetics. Energy Fuels 2020, 34, 2969–2979. [Google Scholar] [CrossRef]
- Lu, Y.; Wang, Y.; Wang, Q.; Zhang, J.; Zhao, Y.; Zhang, Y. Investigation on the catalytic effect of AAEMs on the pyrolysis characteristics of Changji oil shale and its kinetics. Fuel 2020, 267, 117287. [Google Scholar] [CrossRef]
- Matyasik, I.; Labus, M.; Kierat, M.; Spunda, K. Differentiation of the Generation Potential of the Menilite and Istebna Beds of the Silesian Unit in the Carpathians Based on Compiled Pyrolytic Studies. Energy 2021, 14, 6866. [Google Scholar] [CrossRef]
- Tang, Y.; Perry, J.K.; Jenden, P.D.; Schoell, M. Mathematical modelling of stable carbon isotope ratios in natural gases. Geochim. Cosmochim. Acta 2000, 64, 2673–2687. [Google Scholar] [CrossRef]


| Samples | Tmax | S1 | S2 | S3 | PI | PC | RC | TOC | HI | OI | MINC |
|---|---|---|---|---|---|---|---|---|---|---|---|
| Bulk rock | 407 | 1.65 | 55.45 | 2.14 | 0.03 | 4.86 | 8.31 | 13.17 | 421 | 16 | 0.25 |
| Kerogen | 401 | 5.39 | 261.76 | 12.77 | 0.02 | 23.88 | 31.56 | 55.44 | 472 | 23 | 1.67 |
| Heating Rate β [K/min] | Tp [K] | Linear Regression | Linear Correlation r2 | Activation Energy Ea [kJ/mol] | Frequency Factor A [s−1] |
|---|---|---|---|---|---|
| rock | |||||
| 5 | 692.5 | y = 39.78 − 35.32x | 0.8396 | 293 | 1.11 × 10²⁰ |
| 10 | 694.4 | ||||
| 15 | 705.1 | ||||
| 20 | 707.1 | ||||
| kerogen | |||||
| 5 | 681.0 | y = 32.46 − 29.89x | 0.9996 | 248 | 6.19 × 10¹⁶ |
| 10 | 691.2 | ||||
| 15 | 697.4 | ||||
| 20 | 702.3 | ||||
| Conversion α | Kissinger–Akahira–Sunose | Friedman | ||
|---|---|---|---|---|
| Ea (kJ/mol) | Log A (Log(1/s)) | Ea (kJ/mol) | Log A (Log(1/s)) | |
| 0.1 | 376.908 | 50.829 | 336.286 | 46.186 |
| 0.2 | 157.600 | 28.665 | 152.583 | 27.369 |
| 0.3 | 134.782 | 25.464 | 134.759 | 24.678 |
| 0.4 | 173.360 | 27.873 | 187.041 | 28.224 |
| 0.5 | 261.628 | 34.305 | 297.796 | 36.355 |
| 0.6 | 358.818 | 41.296 | 392.651 | 43.101 |
| 0.7 | 479.445 | 49.912 | 554.653 | 54.795 |
| 0.8 | 740.899 | 68.872 | 945.262 | 83.197 |
| 0.9 | 1627.533 | 133.359 | 1919.576 | 153.787 |
| Conversion α | Kissinger–Akahira–Sunose | Friedman | ||
|---|---|---|---|---|
| Ea (kJ/mol) | Log A (Log(1/s)) | Ea (kJ/mol) | Log A (Log(1/s)) | |
| 0.1 | 188.141 | 32.455 | 153.073 | 28.53 |
| 0.2 | 129.731 | 25.711 | 126.802 | 24.76 |
| 0.3 | 170.258 | 28.294 | 200.169 | 30.05 |
| 0.4 | 236.220 | 33.021 | 274.241 | 35.32 |
| 0.5 | 302.393 | 37.678 | 331.881 | 39.22 |
| 0.6 | 352.165 | 40.967 | 386.303 | 42.82 |
| 0.7 | 434.835 | 46.724 | 489.899 | 50.10 |
| 0.8 | 578.686 | 56.933 | 670.648 | 62.97 |
| 0.9 | 1017.825 | 88.636 | 1255.099 | 105.20 |
| Sample | Kissinger | KAS | Friedman | ||||||
|---|---|---|---|---|---|---|---|---|---|
| Ea (kJ/mol) | Log A (Log(1/s)) | r2 | Ea (kJ/mol) | Log A (Log(1/s)) | r2 | Ea (kJ/mol) | Log A (Log(1/s)) | r2 | |
| Source rock | 293 | 20.05 | 0.8396 | 302 | 37.42 | 1.0000 | 345 | 39.84 | 0.9907 |
| Kerogen | 248 | 16.79 | 0.9996 | 305 | 37.79 | 0.9764 | 342 | 39.88 | 0.9991 |
| Sample | Kerogen Type | HI (mg HC/g TOC) | Tmax (°C) | Ea (kJ/mol) | Log A (Log(1/s)) | References |
|---|---|---|---|---|---|---|
| Green River oil shale | I | no data | no data | 201 | 32.41 | [29] |
| Huadian oil shale | I | 670 | 442 | 231 | 36.79 | [30] |
| Central Congo oil shale | I | 746 | 438 | 212 | 33.41 | [31] |
| Mongolia oil shale | II | no data | no data | 379 | 89.80 | [18] |
| Iwonicz Zdrój Menilite shale | II | 601 | 431 | 219 | 13.37 | [32] |
| Gorlice Menilite shale | II | 472 | 401 | 305 | 37.79 | This study |
| Process | Pyrolysis 300–650 °C | Combustion 650–1000 °C | ||||
|---|---|---|---|---|---|---|
| Hydrocarbon Fraction | C1–C9 | C9–C15 | C15+ | C1–C9 | C9–C15 | C15+ |
| Sample | Fraction Share [%] | Fraction Share [%] | ||||
| Bulk rock | 53.54 | 24.00 | 22.46 | 100.00 | 0 | 0 |
| Kerogen | 40.96 | 27.48 | 31.56 | 93.63 | 0 | 6.37 |
Disclaimer/Publisher’s Note: The statements, opinions and data contained in all publications are solely those of the individual author(s) and contributor(s) and not of MDPI and/or the editor(s). MDPI and/or the editor(s) disclaim responsibility for any injury to people or property resulting from any ideas, methods, instructions or products referred to in the content. |
© 2025 by the authors. Licensee MDPI, Basel, Switzerland. This article is an open access article distributed under the terms and conditions of the Creative Commons Attribution (CC BY) license (https://creativecommons.org/licenses/by/4.0/).
Share and Cite
Labus, M.; Matyasik, I. Kinetic Analysis of Carpathian Source Rock Pyrolysis Under Dynamic Conditions. Geosciences 2025, 15, 106. https://doi.org/10.3390/geosciences15030106
Labus M, Matyasik I. Kinetic Analysis of Carpathian Source Rock Pyrolysis Under Dynamic Conditions. Geosciences. 2025; 15(3):106. https://doi.org/10.3390/geosciences15030106
Chicago/Turabian StyleLabus, Małgorzata, and Irena Matyasik. 2025. "Kinetic Analysis of Carpathian Source Rock Pyrolysis Under Dynamic Conditions" Geosciences 15, no. 3: 106. https://doi.org/10.3390/geosciences15030106
APA StyleLabus, M., & Matyasik, I. (2025). Kinetic Analysis of Carpathian Source Rock Pyrolysis Under Dynamic Conditions. Geosciences, 15(3), 106. https://doi.org/10.3390/geosciences15030106