Abstract
Oases are part of the natural wealth and heritage of Morocco and contribute to the social, economic, and touristic environment. Morocco has lost more than 2/3 of its oases during the past century due to water scarcity, succession of drought periods, climate change and over-exploitation of groundwater resources. Palm trees are strongly dependent on irrigation and availability of surface water as soon as the water table depth falls below the root zone of 9 m. Improving management and monitoring of oasis ecosystems is strongly encouraged by UNESCO Biosphere Reserve and RAMSAR guidelines. The Boudenib and Tafilalet oases are among the biggest palm groves located in the south-eastern part of Morocco. These oases belong to catchments of the rivers Guir and Ziz, respectively. This paper uses remotely sensed data from PROBA-V for monitoring vegetation in oases, and linking vegetation characteristics to water availability, water management and quality and quantity of date crops. The Normalized Differential Vegetation Index (NDVI) derived from optical images provides a good estimation of changes in vegetation cover over time. Images of various spatial resolutions (100 m, 300 m and 1 km) obtained with the frequently revisiting Belgian satellite PROBA-V and available since 2014, can be successfully used for deriving time series of vegetation dynamics. TREX—Tool for Raster data Exploration—is a Python-GDAL processing tool of PROBA-V NDVI images for analyzing vegetation dynamics, developed at the Vrije Universiteit Brussel and available online. TREX has various applications, but the main functionality is to provide an automatic processing of PROBA-V satellite images into time series of NDVI and LAI, used in vegetation monitoring of user-defined points of interest. This study presents the results of application of TREX in the arid ecosystems of the Boudenib oasis for the period 2014–2018. The resulting NDVI and LAI time series are also compared to time series of groundwater depth and date crops quantity and quality. Low LAI is observed when water depth is low, and the palm trees lose their greenery. Low LAI is also correlated to low quantity and quality of dates in October 2015 and October 2017. PROBA-V images can therefore be used for monitoring the health of palm trees in oasis environments. However, considering the fact that the PROBA-V satellite mission has ended, this approach could instead be applied to Sentinel-3 data using the same analysis. These results have important implications for water management in the area and can help decision-makers to make better decisions about prevention of water scarcity in the region.
Keywords:
Oasis; Palms trees; Guir watershed; TREX; remote sensing; NDVI; LAI; PROBA-V; MODIS; LANDSAT; VITO; ESA 1. Introduction
The Boudenib Oasis is the largest palm grove in the southeastern region of Morocco, located within the Guir watershed, close to the Moroccan–Algerian border. The region, characterized by an arid climate, faces significant water resource shortages and relies on irrigation from dams [1]. This oasis has recently been the subject of agricultural and hydrological studies due to growing concerns about water scarcity and stress [2]. These challenges, including recurrent droughts and poverty, threaten one of the country’s most vital ecosystems, which is also listed under the Ramsar Convention [3].
In recent years, the Moroccan government has placed increased emphasis on the conservation of its oases, which are recognized as key cultural and ecological heritage sites. UNESCO and Ramsar guidelines have also encouraged efforts to improve the sustainability of these ecosystems (https://www.ramsar.org/news/morocco-names-20-varied-new-ramsar-sites, accessed on 15 January 2005). The Sahara region, where the oasis is located, is home to an estimated five million date palms, some of which can live up to 150 years. These palms are crucial to the local economy, providing the primary source of income for the population. Additionally, the palm trees offer essential shade for other crops and fruit trees that grow beneath their broad fronds (https://maroc.costasur.com/en/arbres-de-paume.html, accessed on 21 January 2025).
Morocco not only meets domestic demand for dates but also exports over 90,000 tons annually (https://maroc.costasur.com/en/arbres-de-paume.html, accessed on 21 January 2025). The deep, binding roots of the date palms play a crucial role in preventing soil erosion caused by desert winds, contributing to the stabilization of the ecosystem. Historically, the oases were created by Arab warriors through the khettara network, further enhancing the region’s landscape. Date palms thrive in a delicate ecosystem with high evapotranspiration, making groundwater an essential resource for their growth. However, the oasis faces increasing degradation driven by periodic droughts, rising temperatures due to climate change, and the overexploitation of groundwater resources, which has led to the drying of wells in the region [4].
Oases in arid regions such as Boudenib are vital ecosystems that sustain biodiversity, provide water resources, and support agricultural practices, particularly date palms. These oases, with their fragile water availability, are increasingly vulnerable to degradation due to a variety of factors including water scarcity, climate change, and overexploitation of groundwater resources. Monitoring these ecosystems is crucial for their sustainable management, particularly given the significant role they play in the local economy and the cultural heritage of Morocco. The decline in the health of these oases, driven by periodic droughts, soil salinity, and poor land management practices, highlights the importance of continuous monitoring to ensure the sustainability of these ecosystems.
The use of remote sensing (RS) for vegetation monitoring has advanced significantly, particularly in spectral indices, high-resolution, and hyperspectral data time series analysis. Studies in Morocco’s Tafilalet Oasis have utilized Sentinel-1 and Sentinel-2 data to investigate irrigation patterns, vegetation moisture, and the impacts of climate change on water availability [5,6]. Sentinel-2 imagery, in particular, has shown a consistent decline in the Leaf Area Index (LAI) from July 2015 to May 2018, indicating deterioration in the structure of palm trees. This trend suggests that the oasis is facing degradation due to factors such as water scarcity and land mismanagement. Additionally, soil salinity in the region has led to water pollution [2]. These studies have provided valuable insights into water management and the effects of water scarcity on vegetation health.
However, similar remote sensing applications are lacking for the Boudenib Oasis, which remains under-monitored using geospatial technologies. While the Tafilalet Oasis has been extensively studied using conventional satellites such as MODIS, LANDSAT, and Sentinel, the spatial and temporal resolution of these satellites varies. Sentinel-2 offers higher resolution (10–60 m) but has a revisit time of 5 days, while Sentinel-3 provides broader spectral coverage but with a less frequent revisit. Landsat (30 m, 16-day revisit) and MODIS (250–1000 m, daily revisit) offer either limited spatial detail or temporal frequency.
In contrast, Boudenib Oasis has not been monitored using remote sensing technologies. This research follows a similar approach to previous remote sensing studies, but with the distinction of using alternative input data applied to the Boudenib Oasis, which has been under-researched in terms of geospatial monitoring. The primary contribution of this study is to fill this gap, enriching previous research in the region and providing decision-makers with valuable data to help preserve this important heritage.
Despite the growing recognition of the importance of oases like Boudenib, there is a significant lack of in-depth research focusing on the environmental and hydrological conditions of this specific oasis. While studies have been conducted in other Moroccan oases, such as Tafilalet, which have used remote sensing technologies to monitor vegetation health and water resources, Boudenib has remained underexplored in this regard. Furthermore, existing studies on Boudenib have not employed remote sensing validation to assess the extent of environmental degradation or its link to groundwater depletion. This research gap limits the ability to accurately assess the current state of Boudenib and to develop strategies for its preservation and sustainable management.
Over the past decade, there has been increasing interest among scientists in using Earth observation satellite data to monitor land surface parameters [7]. Remote sensing (RS) is particularly valuable in regions where field data are scarce or unavailable, such as the Boudenib Oasis. Remote sensing involves detecting and monitoring an area’s characteristics from a distance, typically using satellites or aircraft. In countries with limited access to real-time data, RS provides a vital alternative for gathering information across various domains. It offers substantial insights for mapping and assessing environmental challenges, especially in areas facing water scarcity and desertification, which are among the most significant threats in Morocco, particularly in the oases of the southeastern part of the country [8].
While RS data have been widely utilized for vegetation monitoring, particularly in the Middle East to assess water quality and the effects of salinity on palm tree growth [9], fewer studies have focused on applying spatial tools and satellite imagery to monitor spatiotemporal dynamics in arid regions like Boudenib. Notable studies in this context include long-term vegetation change detection using Landsat data from 1974 to 1999 and the monitoring of land cover in the Zagora Oasis from 1984 to 2015 [8].
The potential of remote sensing in vegetation monitoring and water resource management has been widely acknowledged. Research in crop water parameters using RS techniques has been growing since the 1970s [10], with applications related to water consumption and irrigation water supply for crop growth. Additionally, advances in geoinformatics software have provided users with sophisticated tools to handle large datasets, further enhancing the ability of remote sensing to monitor the extent of irrigated vegetated areas [11].
Previous studies on vegetation monitoring in Morocco’s oases have primarily relied on Landsat imagery and GIS-based software for image processing [12]. To overcome the lack of field measurements in the region, this study will use remote sensing to monitor key vegetation parameters, specifically utilizing the PROBA-V Belgian satellite. Launched in 2013, PROBA-V provides daily, medium-resolution imagery with spatial resolutions of 100 m, 300 m, and 1 km, and is focused on land use and crop monitoring (https://earth.esa.int/eogateway/missions/proba-v, accessed on 21 January 2025). The TREX algorithm, developed at VUB, will be employed to automatically process these satellite images into time series of NDVI (Normalized Difference Vegetation Index) and LAI (Leaf Area Index) [13]. This tool has not yet been applied to monitor palm trees, making this study a novel application of PROBA-V data in the context of Boudenib Oasis.
While Sentinel-2 and Sentinel-3 satellites offer higher spatial resolution and more spectral bands, PROBA-V’s combination of medium resolution, high temporal frequency, wide swath width, and optimized spectral bands make it an ideal choice for vegetation monitoring in oasis environments. Its near-daily revisit time allows for frequent land observations, making it particularly well-suited for large-scale, long-term trend analysis. PROBA-V’s optimized spectral bands—Blue, Red, NIR, and SWIR—are specifically designed for deriving vegetation indices like NDVI and LAI, which makes it a better fit for this research compared to the more complex datasets of Sentinel products that require additional image processing.
The choice of PROBA-V is driven by its mission objectives, which align with the goals of this research: land use and crop monitoring. The 100 m resolution strikes a balance between spatial detail and coverage, allowing us to observe vegetation changes across Boudenib Oasis. Given the region’s low landscape contrast, green pixels correspond to palm tree areas, while brown represents desert areas. This provides a clear indication of crop yield, which in turn reflects the quality of dates produced in Boudenib Oasis [8]. This research expands the use of remotely sensed data in arid regions by applying an automated method to process NDVI and LAI maps from PROBA-V. The results are compared with groundwater depth data, using piezometric level time series provided by the area’s watershed agency (ABHZGR). The outcome will aid in monitoring crop yield, offering insights into water availability for date productivity, especially during the harvest season.
The analysis focuses on three key parameters: NDVI, LAI, and water availability. Remote sensing data from PROBA-V enables continuous monitoring of the oasis environment, and, notably, few studies have applied PROBA-V data to Moroccan oases. Thus, this research represents a significant contribution, particularly in areas where field measurements are difficult to obtain.
This research will contribute to the existing literature by extending the use of remote sensing in Morocco, particularly in regions like the Boudenib Oasis that have not been previously studied using PROBA-V data. The findings will enhance the understanding of vegetation–water interactions in arid environments, specifically in oasis ecosystems. Moreover, the results will support decision-making processes for sustainable water management and provide a scientific basis for the protection and conservation of this crucial oasis. By linking vegetation health with groundwater data, this study aims to offer practical solutions for improving irrigation practices and safeguarding water resources in the Boudenib Oasis, thereby contributing to the preservation of this important cultural and environmental heritage.
This study uses remote sensing techniques to monitor vegetation dynamics in Boudenib Oasis, specifically employing PROBA-V satellite data to derive vegetation indices like NDVI and LAI. The goal is to assess the health of date palms in relation to groundwater levels. The hypothesis is that combining remote sensing data with groundwater depth measurements will reveal vegetation stress patterns due to water scarcity and environmental pressures. This research aims to improve understanding of water-vegetation interactions in arid environments, offering solutions for better irrigation and water management in the oasis. Additionally, it seeks to provide data for decision-makers to support the protection and conservation of the oasis, vital for the local economy and environmental heritage.
2. Materials and Methods
2.1. Case Study: Boudenib Oasis and Guir Catchment
The palm grove of Boudenib oasis belongs to the Guir watershed (Figure 1), located in the south-east of Morocco with an area of 5 km2, surrounded by the high Atlas Mountains.
Figure 1.
The geography of Boudenib oasis and the Guir watershed. Coordinate unit (m).
The palm grove of Boudenib is situated near the town of Boudenib in the Guir Valley (Figure 1). This oasis is renowned for its diverse flora, structured into distinct layers that serve vital ecological and agricultural roles. The ecosystem is primarily composed of date palms, which thrive in the arid climate, along with other vegetation sustained by traditional oasis irrigation systems.
The date palms of Boudenib provide much-needed shade and produce high-quality dates, which form the cornerstone of the region’s economy and the primary livelihood for its population. These palms are still supported by the traditional khettara irrigation methods, an ancient system that channels groundwater to sustain the oasis.
In addition to its agricultural importance, the oasis serves as a habitat for various bird species and wildlife, enhancing its ecological richness. The palm leaves provide shelter from the intense heat, contributing to a dynamic landscape that transitions from lush green to desert brown.
Boudenib itself is a small city of approximately 10,000 inhabitants, known for its agricultural activities and desert tourism. The oasis relies heavily on its water resources for irrigation and domestic use. However, the palm groves have been significantly affected by water scarcity, losing their greenery due to the impacts of recent climate changes in Morocco, including severe droughts and occasional floods.
The Boudenib oasis is characterized by flat to gently undulating terrain, where seasonal streams (oueds) and traditional irrigation systems influence the landscape. The elevation of the area is approximately 1200 m above sea level, which contributes to its semi-arid climate with significant diurnal temperature variations. The soils in the Boudenib oasis are primarily alluvial, deposited by periodic flooding of the Guir River. These soils are generally sandy to silty with moderate clay content, and are low in organic matter. The soil in Boudenib suffers from a significant salinity issue exacerbated by over-irrigation and water evaporation, which leaves salt deposits on the surface.
This area is known for an arid climate characterized by low and irregular rainfall, coupled with significant temperature variations. The mean annual rainfall is 157 mm and mean annual temperature is 25 °C [14].
Boudenib oasis has two main aquifers, a shallow aquifer (Quaternary) and a deep aquifer (Cretaceous) (Figure 2). Groundwater is mainly supplied by temporary surface water infiltration or flooding. These aquifers are therefore a product of irrigation and infiltration in arid areas, but originate from a humid area. The flow of the aquifers varies irregularly from upstream to downstream with an irregular piezometric level [15].
Figure 2.
Study area: geological cross section (Boudenib) [15]. Coordinate unit (m).
The hydrographic network of Boudenib oasis is provided by the water catchments of the rivers Guir and Bouanane which flow on into Algerian territory from their origin in the high Atlas Mountains [14].
The Guir catchment occupies an area of 19,000 km2 in which there are several hydrometric and climatological stations (around 20 stations) for the assessment of surface water resources. The basin has historical rainfall potential of 400 mm/year, and 5% of its area is cultivated [1].
2.2. Field Visit and Data Collection
This study aims to evaluate groundwater dynamics by conducting field measurements and analyzing water quality.
The field program was designed to obtain precise groundwater depth measurements, collect hydrological data from the Catchment Agency ABH-ZGR of Errachidia, identify dry wells, and perform chemical analyses of groundwater in the Guir watershed. Water sampling was systematically conducted for each well, with two samples per well collected in specialized bottles to ensure proper preservation for laboratory analysis. The results of this study will contribute to a better understanding of groundwater availability and quality, providing valuable insights for sustainable water management in the region.
2.2.1. Water-Depth Measurements in Boudenib Oasis and Water Quality
The Boudenib oasis (Figure 1) is characterized by the presence of groundwater resources containing different types of geological sediments and formation (clay, sand and sandy rock).
The piezometric measurements (Figure 3) conducted on these aquifers provide insights into the temporal evolution of groundwater levels in both shallow and deep aquifers. These measurements also facilitate the identification of dry wells and contribute to monitoring both the quantity and quality of groundwater resources, which are essential for local water supply. The black dots indicate the wells where water depth measurements were recorded during the field survey. Groundwater levels were manually measured using an electric probe meter, which emits a signal upon contact with the water surface, ensuring accurate depth assessment.
Figure 3.
Wells where the piezometric measurements were taken (Boudenib oasis and Guir watershed). Digital elevation model (DEM) of the Guir catchment (https://earthexplorer.usgs.gov/, accessed on 21 January 2025). Ordinate unite (km).
Table 1 provides an overview of the water quality in the study area, based on laboratory chemical analyses of two samples collected from each well. The analysis was limited to the wells listed in the table, as the remaining wells shown in the map (Figure 3) were either dry due to the seasonal aridity during the summer or inaccessible for sampling. These constraints highlight the challenges associated with data collection in the region, particularly under seasonal and logistical limitations.

Table 1.
Table of water quality results June/2018.
Physicochemical analyses were conducted on water samples collected from wells to assess the water quality in the region. The results indicate that the water quality is generally good and suitable for various uses, including drinking, irrigation, and domestic purposes. However, the groundwater in the region tends to have elevated levels of salinity, while maintaining a neutral to alkaline pH, which is typically favorable for agricultural and domestic use.
It was concluded that the water resources in the area are generally safe for irrigation after basic filtration or treatment. However, the high salinity levels can negatively affect soil fertility and crop yield, particularly for salt-sensitive plants. Therefore, careful management is needed to mitigate these impacts on agriculture.
2.2.2. Aquifers Delineation
Data obtained from ABHZGR-Errachidia identified two aquifers within the Guir catchment area (Figure 4). These aquifers primarily belong to the Cretaceous and Quaternary geological periods, providing valuable groundwater resources for the region; however, Boudenib oasis is primarily located over the Quaternary aquifer which is relatively recent in geological terms and formed by the deposition of alluvial materials like sand and clay. This aquifer is the dominant source of groundwater in the Boudenib oasis.
Figure 4.
Aquifers in the Guir basin.
Figure 5 illustrates the groundwater measurements for May and June 2018 conducted during the field visit, revealing a slight variation in the water level of the Boudenib oasis, ranging from 2 to 8 cm in June. This fluctuation can be attributed to the high temperatures during this period, which often exceed 40 °C, leading to rapid water evaporation and, in some cases, dry wells.
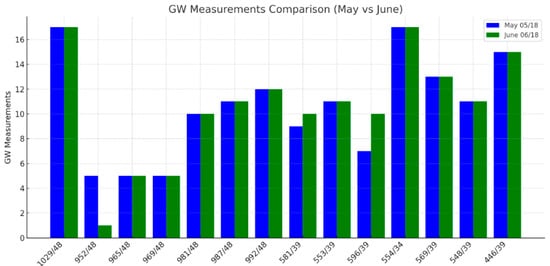
Figure 5.
Ground water (GW) measurements level (m) in May and June2018.
During the field visit, many wells were dry in summer due to a combination of water abstraction and evaporation. This issue is exacerbated by excessive water pumping, primarily for irrigating nearby farms. In some wells, the water depth has decreased by as much as 3 m (e.g., well 952/48), highlighting the urgent need for sustainable water management practices in the area.
2.3. TREX—Description of the Tool
Time series analysis of vegetation cover is widely used to detect land degradation [16]. and assess crop yield. Changes in vegetation are considered key indicators of land responses to various environmental factors, such as climate variations [17]. Traditionally, time series of NDVI (Normalized Difference Vegetation Index) were extracted by downloading spectral satellite images from platforms like Landsat and processing them using GIS tools [18].
The Tool for Raster Data Exploration (TREX) enables the automated processing of medium-resolution PROBA-V satellite images into time series of Leaf Area Index (LAI) and NDVI. TREX is particularly effective in mitigating the adverse effects of cloud cover on optical satellite data [13]. This tool is highly flexible and can process data for any selected study area, across various time periods, spatial resolutions, and projection systems, provided the satellite images for the area are available.
TREX, developed at the Vrije Universiteit Brussel (VUB), is an algorithm written in Python that processes hundreds of PROBA-V satellite images into maps with user-specified spatial resolutions and projections. PROBA-V, a small satellite launched by the European Space Agency (ESA) and managed by the Flemish Institute for Technological Research (VITO), provides daily NDVI maps at multiple spatial resolutions (100 m, 300 m, and 1 km) [19]. These PROBA-V images, which include NDVI maps and status maps, can be requested for free through the VITO Earth observation portal (https://www.vito-eodata.be/PDF/portal/Application.html#Home (accessed on 10 May 2021)). The development and application of TREX were the result of close collaboration within our research team, aiming to refine its capabilities for vegetation monitoring. Its implementation in this study aligns with our department’s objective of testing and expanding TREX’s applicability in arid environments. This collaboration has been instrumental in enhancing the tool’s accuracy, particularly in handling remote sensing challenges such as cloud contamination and atmospheric corrections. Moreover, there are very few software solutions or platforms that enable the automatic processing of remote sensing products without requiring extensive GIS analysis and imagery treatment. These tools streamline the generation of NDVI and LAI maps, making remote sensing analysis more efficient and accessible.
The PROBA-V satellite mission was designed to bridge the gap between vegetation monitoring and the Sentinel missions, ensuring continuity in satellite imagery. This approach is applicable to both historical PROBA-V data and newer Sentinel-3 data, which shares similar imaging capabilities. Although the PROBA-V mission ended in 2021 (https://blog.vito.be/remotesensing/probav-whatsnext, accessed on 21 January 2025), the methodology developed for PROBA-V can be seamlessly applied to Sentinel-3 data, ensuring ongoing consistency in medium-resolution remote sensing data.
PROBA-V measures reflectance across four spectral bands—Green, Red, Near-Infrared (NIR), and Shortwave Infrared (SWIR)—which are used to calculate one of the most widely applied remote sensing indices, the NDVI. NDVI (Normalized Difference Vegetation Index) is a critical indicator of vegetation health (Figure 6), derived from the contrast between red and near-infrared reflectance. Ranging from −1 to +1, NDVI is particularly valuable for monitoring agricultural health, vegetation growth, and environmental stresses, such as droughts [20]. Values close to −1 typically indicate water bodies, while values near +1 correspond to dense green vegetation. Healthy vegetation reflects more near-infrared and green light, while absorbing red and blue light, making NDVI an effective tool for assessing vegetation condition and environmental changes (https://gisgeography.com/ndvi-normalized-difference-vegetation-index/, accessed on 21 January 2025).
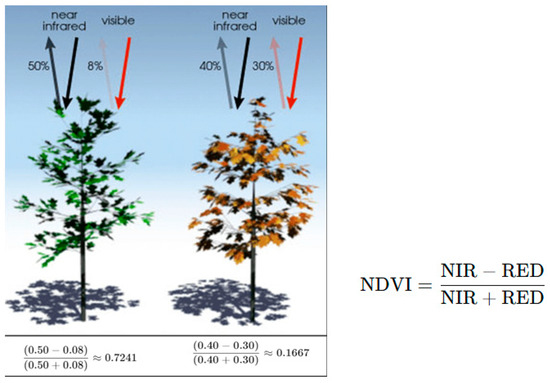
Figure 6.
NDVI physical functionality (https://gisgeography.com/ndvi-normalized-difference-vegetation-index/, accessed on 21 January 2025).
The choice of PROBA-V over other satellites stems from its potential to expand the application of remote sensing data to Africa, where it has yet to be widely applied, as most studies have focused on Europe. The calculation of NDVI (Figure 6) anomalies involves comparing current values to historical averages, whether on a monthly, yearly, or seasonal basis, and is conducted at the pixel level. The products are generated with a 100 m resolution since the PROBA-V satellite offers sufficient spatial resolution to monitor larger-scale vegetation patterns, aligning with its primary mission objectives of land use and crop vegetation monitoring. This resolution is well-suited for monitoring the state of vegetation in the Boudenib oasis. Furthermore, the 100 m resolution provides a good balance between spatial detail and coverage. It is sufficient to monitor palm trees due to the low land-use contrast in the area, where green typically represents palm tree zones and brown indicates desert.
LAI can be used to predict primary productivity and crop growth and it has an important influence on exchanges of energy, water vapor and carbon dioxide between plants and the atmosphere. This index can be easily derived from NDVI or other equations (Figure 6) [21].
Various applications of NDVI and LAI require image processing and application of mathematical functions on satellite image bands. This may look easy in terms of single images, but when we have a monthly variability of NDVI we might easily have issues with manually processing big datasets. It is also a time-consuming operation.
Pixels of PROBA-V images after re-projecting from original degree units into metric system are reshaped into rectangles, thus enabling their use for multi-spatial analysis, through the improved utilization of GDAL software 2.2.2 and programming in Python (2.7/3.X). Based on initial user inputs, this tool can automatically check radiometric quality, select cloudless images, re-project, resample, clip and adjust NDVI products of 100 m PROBA-V images. After specifying the reference raster of the shapefile, this tool can produce the following:
- NDVI raster maps in .tif format for each input image;
- Monthly NDVI raster maps in .tif or .asc format;
- LAI raster maps in .tif or .asc format for each input image;
- Monthly LAI raster maps in .tif or .asc format;
- Interpolated raster LAI maps in .asc format;
- Color representation of LAI maps in .jpg format;
- LAI time series extracted for specific points in .csv format;
- Color representation of LAI time series in .jpg format [13];
- Color representation NDVI maps and time series.
The easiest way to set up the tool is to install Anaconda for Python 2.7.14, which provides the Spyder Python environment, managing the installation of Python packages and handling environmental variables for Windows. This allows us to do the following:
- Check radiometric quality with PROBA-V status map (SM) and exclude from processing images with too many invalid pixels;
- Select cloudless images with automatic resampling, reprojection and clipping to the exact extent of the study area;
- Convert images from digital values to physical values;
- Re-project maps based on the user input;
- Resample and filter maps to a given grid based on user input;
- Clip and separate out regions based on user input;
- Deliver NDVI maps in .asc or .tif format;
- Compute LAI maps from NDVI maps;
- Simulate values for missing pixels if enough information is available;
- Deliver 3 types of LAI maps in .asc, or .tif: LAI maps based on 5 days synthesized NDVI maps and monthly maps of average LAI with or without simulating missing data;
- Extract time series of NDVI or LAI for selected points and save in .csv format (readable by MS Excel);
- Prepare and save in .PNG format visualization of LAI maps.
The radiometric quality of NDVI maps with the PROBA-V SM allows quick filtering out of those maps which contain too many invalid pixels (clouds). GDAL in TREX consists of translating digital numbers (DN) in PROBA-V to physical values (PV) [11].
PV—a value of NDVI;
DN—digital number ranging from 0 to 250 assigned to each pixel;
offset and scale—take constant values of 20 and 250, respectively.
TREX always processes all maps to match the exact properties of the input reference (Figure 7) such as raster extent, masked values, projections, or spatial resolution. Using the ‘Reference Map’ as input, all selected images are clipped to the area of interest, potentially reducing the subsequent processing time and power needed significantly. The leaf area index (LAI) is computed from NDVI using the following Equation (2) [19].
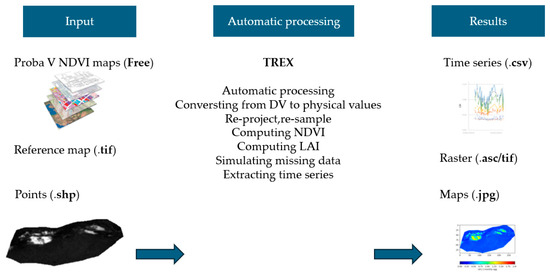
Figure 7.
TREX processing chain (https://github.com/VUB-HYDR, accessed on 21 January 2025).
LAI Equation (2) is applied to NDVI maps assisted by TREX which produce LAI values above 0. Monthly maps of LAI are generated based on the aggregation of five-day synthesized maps whenever data is available. When TREX completes processing of NDVI and LAI maps, the tool generates time series of the same parameters (Figure 7).
There are three types of input data:
- Reference map: Contour map or shapefile of Boudenib oasis, in .tif format. The extension, resolution, projection and masked areas within this file will be used for processing raw PROBA-V images, which means that all properties of the output map will match with this reference map. Size and resolution of the reference map are only limited by the processing capacity of the local machine;
- Reference point: in a SHP format. Each point should have an attribute specified named ‘ID’ which could be any number or name. The geographic projection system of the reference map and the reference point must be similar;
- Free PROBA-V NDVI images obtained from the website (https://www.vito-eodata.be, accessed on 21 January 2025), with a resolution of 100 m products specified as ‘S5-TOC—5-daily global composites, Top-Of-Canopy’. Each NDVI image downloaded from the website should be associated to a status map (SM).
The following scripts were applied to these input data:
TREX_dowload.py: this script is used for downloading satellite images from an FTP server provided by VITO, i.e, PROBA-V NDVI images with the status map (MP); TREX_processing.py: this script calls GDAL functions for processing raster data, checks radiometric quality of images, discards clouded images, converts to physical values and produces maps in .tif or .asc format suitable for ARCGIS and QGIS; TREX_visualisation.py: this script is focused on producing secondary output time series or color representation of processed maps.
The TREX scripts have been structured, incorporating cloud and atmospheric condition handling. The scripts automatically filter out maps with dominant cloud cover and apply cloud removal techniques for cases where cloud presence is minimal, ensuring cleaner and more reliable vegetation indices.
2.4. TREX Inputs and Application in Boudenib Oasis
Three types of input data for TREX were complemented with meteorological, hydrological, and agricultural data to link vegetation characteristics to water availability, water management and crop health:
- PROBA-V satellite images of NDVI (and corresponding SM), five-day synthesis, TOC correction for the period April 2014–October 2018 (52 images for the year 2014 and 72 for each year 2015, 2016, and 2017), with a spatial resolution of 100 m;
- A reference map of Boudenib oasis, with a spatial resolution of 30 m, and a size of 2 × 10 km;
- A point map with several GPS points of palm trees and desert;
- The time series of meteorological data (temperature and precipitation) and hydrogeological data obtained from La Diréction génerale de la Météorologie de Rabat, and ABH Errachidia;
- Agricultural data about dates productivity in Morocco obtained from Ministére d’Agriculture du Maroc.
The first three data sources were used as geospatial references to extract NDVI maps from the PROBA-V satellite dataset and reshape them automatically using the oasis contour map. Only these input data were required for executing the TREX script and producing NDVI/LAI maps or deriving time series of NDVI/LAI for selected points. Meteorological data (4) and agricultural data (5) were only used for analyzing the outcomes and data validation.
These three types of input data are required to execute TREX scripts for producing NDVI/LAI maps and time series for selected points for vegetation monitoring, the evolution of the vegetation in an oasis environment, spatial and temporal variability of some physical parameters, and the prediction of some natural hazards such us drought periods and erosion. The combination of TREX results and hydrological modelling helps in prediction of natural hazards and future climate change scenarios in the area.
2.5. Statistical Analysis and Correlation Methodoloy
The Spearman correlation coefficient is a non-parametric statistical method used to measure the relation and the direction of the relationship between two variables. This is unlike the Pearson methodology which assumes a linear correlation and normal distribution of data; therefore, Spearman is ideal for nonlinear or monotonic relationships. This analysis evaluates whether there is an increase or decrease in one variable and whether it consistently corresponds to an increase or decrease in the other variable. The coefficient varies between a range of −1 (which corresponds to negative correlation) and 1 (which corresponds to positive correlation). The value 0 indicates that there is no correlation [22]. This method is used in different fields like ecology and hydrology, where data may not meet the assumptions of parametric tests.
The statistical analysis was conducted using the R programming language after preprocessing the datasets for both groundwater levels and LAI time series in order to obtain averaged PL measurements and averaged LAI values for the correlation analysis. The data preparation process involved the following steps: data cleaning and transformation, data analysis, statistical correlation analysis, and the correlation matrix using the Spearman coefficient [23].
Data cleaning and transformation: A critical step in statistical analysis, this helps to ensure that the data are accurate and formatted correctly, improves data quality and prepares the dataset for analysis. This step involves many actions, such as handling missing data by replacing the missing values with average, mean, median or mode, removing rows/columns with excessive missing values, removing duplicates to avoid skewed results, correcting errors such as out-of-range values, and finally standardizing the data by ensuring the consistency of units, formats, and naming conventions. Data transformation includes scaling, encoding categorical variables, and data aggregation to combine multiple data points into summary metrics. In this study, averaged values were used for both variables.
Data analysis: This refers to the process of examining and interpreting the data to uncover meaningful patterns, trends and relationships or insights. It involves applying statistical methods and techniques to transform raw data into actionable information that can support decision-making and validate hypotheses.
Statistical correlation: This describes the strength and direction of the relationship between two variables and quantifies how changes in one variable are associated with the other. The correlation can have several interpretations: Positive Correlation: as one variable increases, the other also increases; Negative Correlation: as one variable increases, the other decreases; and finally, No Correlation: there is no discernible relationship between the two variables [24]. To decide on the on the sign of the correlation we have to create a correlation matrix using the Spearman method.
Analyzing the relationship between groundwater levels and the Leaf Area Index (LAI) is crucial for understanding the effects of fluctuating water availability on vegetation dynamics. Groundwater levels, measured through piezometry, indicate the availability of water resources, while LAI quantifies leaf area density, serving as a vital metric for plant growth and ecosystem health. Identifying correlations between these two time series provides valuable insights into the ecological and hydrological interactions in the region.
Spearman’s correlation coefficient is a statistical measure of the strength of a monotonic relationship between paired data. Its interpretation is similar to that of Pearson’s method, i.e., the closer the correlation is, the stronger the monotonic relationship. Correlation is an effect size, so we can verbally describe the strength of the correlation using the following guide for absolute values, as follows:
- 0.00–0.19 “very weak”
- 0.20–0.39 “weak”
- 0.40–0.59 “moderate”
- 0.60–0.79 “strong”
- 0.80–1.0 “very strong”
Note that, unlike Pearson’s correlation, there is no requirement for normality or monotonic data; the relationship between data when using Pearson’s method needs to be linear [25].
The Spearman correlation coefficient ranges between −1 and 1. A value close to 1 indicates a strong positive monotonic correlation, while a value close to −1 indicates a strong negative monotonic correlation (Figure 8). A value close to 0 indicates an absence of monotonic relationship. This matrix summarizes the correlation between the wells located in the same area of LAI surfaces. This method enables the analysis of correlations across a wide range of time series data, providing a general overview of their relationships. Alternatively, a more focused approach can be applied by considering only a specific number of wells for each corresponding surface. In this case, a yearly timestep was chosen to study this correlation.
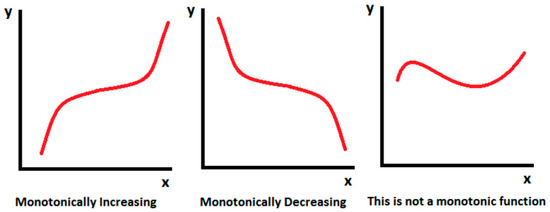
Figure 8.
Monotonic data representation [22].
2.6. Limitation of the Study
The data used in this study to characterize crop growth of palm trees in the Boudenib oasis were derived from PROBA-V satellite products with a 100 m resolution. In this study, we did not include a dedicated section for in situ data validation due to the lack of direct field measurements for NDVI and LAI. Instead, our validation approach relied on statistical analyses to establish the relationship between groundwater levels (GW) and LAI trends. Since groundwater depth and date yield are officially measured and recorded by government agencies, we used these datasets to assess the consistency of our TREX-derived NDVI and LAI maps. By applying statistical correlation analyses, we confirmed that both groundwater levels and LAI exhibited similar temporal patterns, supporting the reliability of our remotely sensed vegetation indices. While field validation remains an important future step, our current approach provides a robust preliminary assessment of the data’s accuracy in capturing vegetation dynamics in the Boudenib Oasis. Furthermore, PROBA-V provided valuable and reliable dataset inputs for our analysis; however, its relatively coarse spatial resolution imposed limitations on accurately capturing fine-scale vegetation variations and dynamics, particularly in heterogeneous arid environments.
The spatial resolution of remote sensing data plays a critical role in the accuracy and reliability of the results, particularly when characterizing crop growth and land cover. In this study, 100 m resolution provides a balance between spatial detail and the ability to cover large areas. However, the influence of this resolution on the study’s findings warrants further analysis. Higher spatial resolution data could offer more precise measurements of vegetation characteristics, potentially revealing finer-scale patterns of crop growth. On the other hand, coarser resolution data may lead to generalized or averaged results, potentially overlooking small-scale variations in vegetation. A comprehensive analysis of how spatial resolution impacts the interpretation of NDVI and LAI trends in relation to groundwater levels will be crucial for understanding the limitations of the current approach. Discussing these factors will provide greater context for the study’s conclusions and highlight areas for improvement in future remote sensing-based research.
Additionally, it is necessary to expand the discussion on potential sources of error in remote sensing analysis and their impact on result interpretation. Factors such as atmospheric disturbances, sensor calibration, and cloud contamination can influence NDVI and LAI calculations. To mitigate these issues, TREX was specifically chosen over other available NDVI/LAI processing methods due to its automated cloud detection and removal capabilities, as well as its ability to process time-series data efficiently. TREX’s integration with Python and GDAL ensures reliable data handling and minimizes errors caused by atmospheric interference, making it a suitable choice for long-term vegetation monitoring in arid environments like Boudenib Oasis.
3. Results and Discussion
3.1. Spatial and Temporal Variation of NDVI and LAI
The results obtained using the TREX scripts provide a detailed assessment of vegetation dynamics over the study area, with a monthly temporal resolution spanning from 2014 to 2017 and a spatial resolution of 100 m. This specific time frame was selected based on the availability of satellite and observational data, ensuring a consistent and reliable dataset for analyzing vegetation trends. Figure 9 and Figure 10 present the spatial and temporal variations of two key vegetation indices: the Normalized Difference Vegetation Index and the Leaf Area Index (LAI). NDVI is widely used as an indicator of vegetation health, biomass density, and photosynthetic activity, whereas LAI quantifies the total leaf surface area per unit ground area, providing insights into canopy structure and productivity [26]. By analyzing these indices, we aim to assess seasonal fluctuations, interannual variability, and their relationship with water availability.
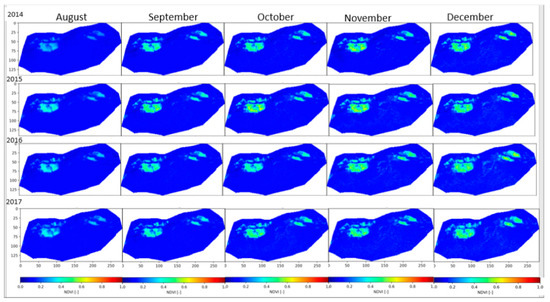
Figure 9.
NDVI monthly aggregation variability (August 2014–December 2017).
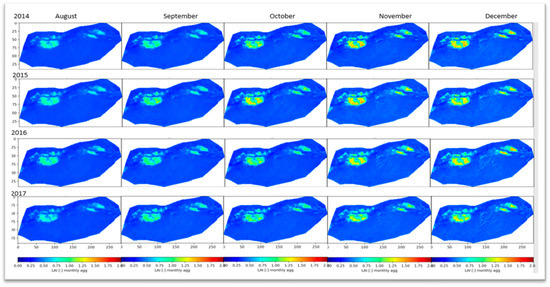
Figure 10.
LAI monthly aggregation variability (August 2014–December 2017).
- NDVI analysis:
Figure 9 highlights significant spatial and temporal variability in NDVI values within the palm tree areas, as reflected by changes in color brightness. According to the color scale bar, regions with blue indicate low NDVI values, suggesting sparse or stressed vegetation, while areas shaded in yellow to red correspond to high NDVI values (~1), representing dense and healthy vegetation cover.
Although the overall annual NDVI pattern remains relatively stable, notable monthly variations can be observed. Higher NDVI values (yellow to red) are most prominent during October and November, coinciding with the peak growth phase of palm trees. In Morocco, this period aligns with the date palm harvest season, reflecting enhanced photosynthetic activity and optimal canopy development. The increase in NDVI during these months suggests favorable environmental conditions, including adequate moisture availability and optimal temperatures, which support vigorous vegetation growth.
Conversely, lower NDVI values, particularly in drier months, indicate moisture-stressed vegetation, which may be linked to seasonal drought conditions, water scarcity, or physiological stress in palm trees. These fluctuations underscore the sensitivity of NDVI as a key indicator of vegetation health, providing critical insights into the ecological and climatic factors affecting palm tree development. The ability to monitor NDVI variability over time is essential for assessing crop health, optimizing irrigation strategies, and predicting potential yield fluctuations in date palm plantations.
- LAI analysis:
LAI varies with canopy architecture, which is influenced by geographic conditions, environmental factors, and agricultural practices. As illustrated in Figure 10, LAI exhibits seasonal fluctuations, with the lowest values recorded from July to September. This decline can be attributed to increased evapotranspiration, heat stress, and potential leaf senescence during the peak summer months. However, as the harvest season approaches in October and November, LAI progressively increases with a value of 1.25, indicating enhanced leaf development and photosynthetic activity. This seasonal variability reflects the growth cycle of date palms, where optimal canopy expansion before harvest plays a crucial role in fruit development.
While higher LAI generally contributes to improved date yield by maximizing photosynthetic capacity, excessive canopy density can negatively impact fruit quality and quantity. In late summer, when LAI is high, dense foliage may restrict light penetration to lower canopy layers, leading to suboptimal photosynthesis and uneven fruit ripening. This phenomenon is particularly pronounced in September, where shading effects may reduce the accumulation of sugars and essential metabolites in the fruit, ultimately affecting market quality.
Furthermore, LAI serves as a key indicator of leaf health and physiological efficiency, as it directly influences carbon assimilation, photosynthetic performance, and oxygen exchange. Given its strong correlation with crop productivity, LAI variability is a critical metric for assessing date palm yield in terms of both quality and quantity. Effective canopy management, such as strategic pruning, may help optimize LAI to balance light distribution and fruit development, ensuring both high yield and superior fruit quality.
- LAI profile using the coordinates of the extraction points (2014–2017):
The variability in the Leaf Area Index (LAI) profile across the extraction points (Figure 11) provides valuable insights into the evolution of this key eco-physiological parameter. Palm trees, which predominantly grow along streams and irrigated areas, rely on water sources supplied by geological faults and structural features originating from the High Atlas Mountains. Consequently, points 1 through 6 exhibit significant dynamic variability in LAI, reflecting the favorable conditions for palm tree development in these regions. In contrast, points 7, 8, and 9, located in a desert area, show LAI values approaching ~0, indicating minimal vegetation due to arid conditions. These findings underscore the critical role of LAI in influencing palm tree yield, both in terms of quality and quantity, and highlight its sensitivity to water availability and environmental conditions.
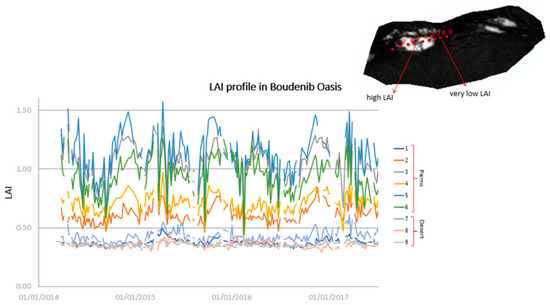
Figure 11.
LAI time series of the extraction points (2014–2017).
3.2. Statistical Analysis Proving the Correlation Between LAI and the Piezometry of Boudenib
Analyzing the relationship between groundwater levels and leaf area index (LAI) is essential to understanding the impact of changing water levels on vegetation monitoring. Piezometry reflects groundwater availability, while LAI measures leaf area density, which is a key indicator of plant growth. Understanding how these two time series are correlated can provide valuable insights into ecological and hydrological dynamics and understanding.
This statistical analysis was done following the steps below:
Data preparation: The databases for both water levels and LAI time series were cleaned and preprocessed. This step (Table 2 and Table 3) involved transforming all non-numeric values into numerical formats and addressing missing data by replacing empty fields with mean or median values. This approach ensures the dataset remains meaningful and usable for analysis while preserving the integrity of the original data.
Table 2.
Example of final dataset after computing and preparing the original database (Piezometry) for the period (2014–2017).
Table 3.
Example of final dataset after computing and preparing the original database (LAI) for the period (2014–2017).
Data analysis: These graphs show the different evolution patterns obtained after preparing the piezometry data of the wells in the Boudenib oasis (the Y axis represents the well ID). Interpolation was employed to estimate missing values based on neighboring data points, ensuring a continuous graph that preserves the overall trend and direction of data evolution. This step was crucial for analyzing the patterns of LAI and PL, providing valuable insights to support the statistical analysis.
Figure 12 illustrates the evolution of groundwater levels (piezometric levels) in the Boudenib oasis from 2014 to 2017, revealing key trends and patterns. Most graphs display gradual declines in water levels over time, indicating the depletion of groundwater resources due to recurring environmental and climatic factors, such as rising temperatures and reduced precipitation. However, some plots exhibit stable or slightly increasing trends, which can be explained by seasonal changes linked to rainfall or irrigation cycles, where groundwater recharge occurs during wet seasons. Notably, the piezometric levels show an increase in 2015 for the majority of the wells, likely reflecting temporary recharge events or improved water management practices. Some time series include flat sections, which may indicate periods of no data collection, interpolation, or static conditions where groundwater levels remained unchanged. These findings highlight the complex interplay between climatic variability, seasonal recharge, and anthropogenic pressures on groundwater resources in arid regions. The results underscore the need for sustainable water management strategies to mitigate groundwater depletion and ensure the long-term resilience of the Boudenib oasis. In terms of the statistical significance of trends, we can visually conclude (Figure 12) that some series show persistent increases or decreases over time while others exhibit short-term fluctuations without a consistent trend, and finally, the presence of sharp dips or peaks suggests potential structural breaks or nonlinear relationships.
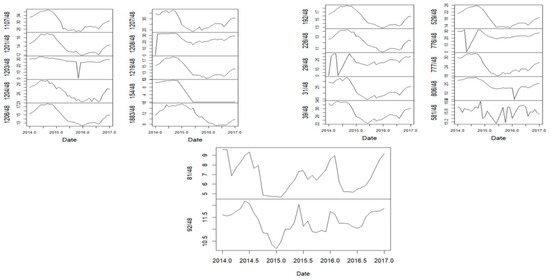
Figure 12.
Yearly piezometric level evolution for the period 2014 to 2017 in the wells of Boudenib.
The Leaf Area Index (LAI) exhibited temporal variability across all selected surfaces from 2014 to 2017 (Figure 13). An initial decline in LAI was observed during the first half of 2014, followed by a gradual increase in the second half, reaching its peak in 2015. This pattern demonstrated a consistent cyclical trend approximately every six months, suggesting seasonal influences on vegetation cover. Surfaces S1 to S6 displayed higher LAI values, with noticeable seasonal fluctuations, while surfaces S7, S8, and S9 exhibited consistently lower LAI values due to their extraction points being located in desert areas characterized by sparse vegetation and low LAI. The observed patterns emphasize the impact of both seasonal variations and surface-specific characteristics on LAI dynamics over time. Visually, surfaces S1–S4 show clear seasonal trends, and surfaces S7–S9 display relatively flat patterns, suggesting no significant upward or downward trends, though their variability might still be significant depending on the test used.
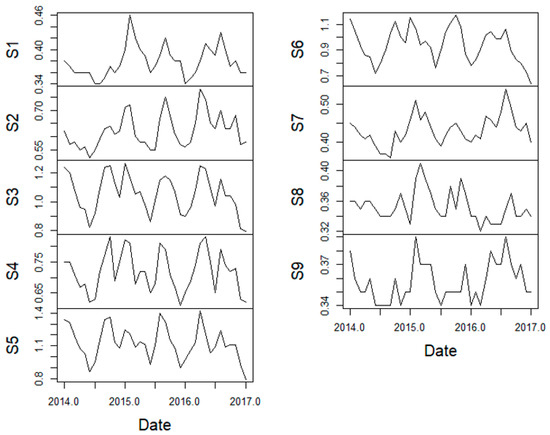
Figure 13.
Yearly LAI evolution for the period 2014 to 2017.
Statistical correlation analysis: From the above, we observed that the variations of the piezometric level and LAI depend largely on the factor of time. It emerged that the behavior of these two indicators is strongly linked to the time factor, which determines the period of heavy precipitation and the season of low precipitation in the region of Boudenib. An autocorrelation analysis is used in this study to confirm this aspect.
The question to be answered with this analysis is the following: Are these two indicators linked, and can they impact each other?
The methodology of cross-correlation was chosen to answer the question of the putative link between the piezometric level and LAI. This method consists of calculating the cross-correlation for each value in the piezometric level (X) using a value of the leaf area index (Y). For the correlation analysis, only the wells associated with the LAI surfaces were considered, which means wells in the same location; furthermore, the correlation was executed for the period 2014–2019, with a yearly timestep.
The first step of any correlation analysis of two quantitative parameters with a heterogeneous and diverse time series of data is checking the linearity of the relationship of the data before calculating the correlation. This step ensures that the analysis is relevant and allows the appropriate statistical tools to be chosen to capture the real relationship between the time series.
This study shows that the relationship between the LAI and piezometric level time series is non-linear, as illustrated in Figure 14, below. The data utilized in this model consist of yearly averaged values for both Leaf Area Index (LAI) and Piezometric Level (PL) for the period 2014–2017. This approach effectively reduces the influence of short-term fluctuations and enables a focus on the long-term trends and underlying relationships between these variables.. All results exhibited a similar pattern, indicating the absence of linearity.
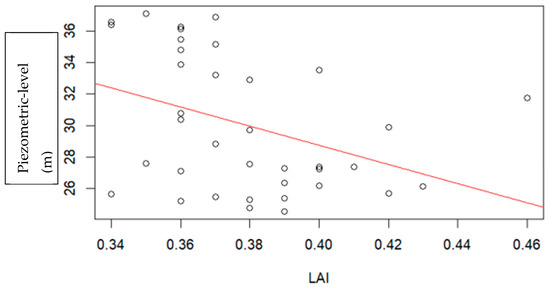
Figure 14.
Linear regression model for time series of yearly averaged LAI and piezometric level for the period (2014–2017).
This computation was performed using the Pearson correlation coefficient, and each test generated a p value which determined the statistical significance of the observed correlations.
The distribution of colors in Figure 15 looks approximately equal; purple areas indicate a negative monotonic correlation between the piezometric level of certain wells and LAI, which means that when LAI increases the PL decreases; however, orange indicates a positive monotonic correlation which means when the LAI decreases, the PL also decreases, thus confirming the hypothesis of this research.
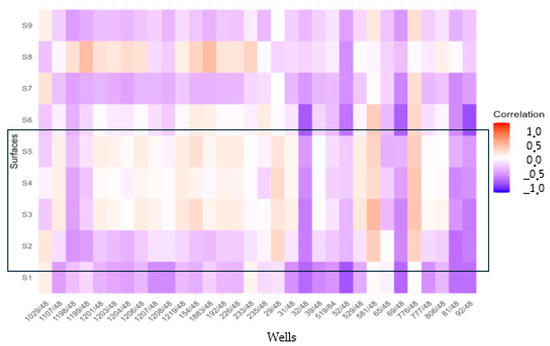
Figure 15.
Yearly correlation matrix for piezometry and LAI for surfaces S2,3,4 and 5 (Spearman’s method).
The areas with the highest level of LAI say a lot about the palm yield, and contain more data than other surfaces that may be desert or semi-desert; therefore, the surface samples of LAI used for the correlation analysis are S3, S4, and S5, corresponding to the palm trees area, based on the extraction points used previously. For these surfaces, the values of the correlation correspond to a strong positive monotonic correlation; therefore, when the LAI decreases, the PL also decreases, which confirms the hypothesis of an existing link between both parameters. The resulting LAI time series will be compared to time series of groundwater depth, and this comparison will confirm that low LAI is correlated to low PL.
3.3. Relations Between Vegetation Characteristics, Water Availability and Crop Health
LAI vs. Water depth data: The water depth of wells in the Boudenib oasis, as measured during the sampling campaign, does not exceed ±40 m, indicating that the water is primarily extracted from the shallow Quaternary aquifer, which contains fresh, potable water. However, excessive pumping in the region has led to a decline in water availability, adversely affecting irrigation for palm trees. To analyze this trend, monthly averaged time series of piezometric levels (PL) for wells in the Boudenib oasis were obtained from the Watershed Agency (ABHZ) for the period 2014–2017 and compared to monthly averaged time series of LAI for the same period.
The analysis reveals a strong correlation between the Leaf Area Index (LAI) and groundwater levels, as illustrated in Figure 16. A decrease in groundwater levels corresponds to a reduction in LAI values, highlighting the dependence of palm tree growth on shallow groundwater availability, particularly in arid regions. The results indicate that optimal palm tree growth in the Boudenib oasis occurs when groundwater depths are maintained between 8 and 9 m. This range corresponds to the piezometric levels associated with the highest LAI values, underscoring the critical role of groundwater in sustaining palm tree health and productivity in the oasis.
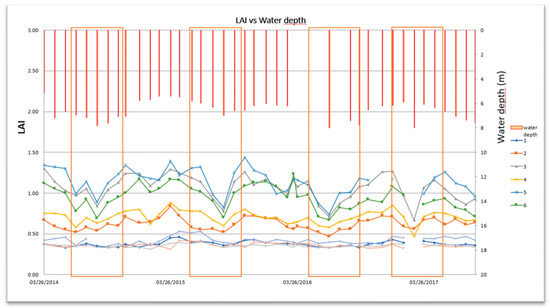
Figure 16.
Monthly averaged LAI vs. monthly averaged PL data (2014–2017).
Palm trees are relatively moderate consumers of water compared to other crops, but they rely significantly on groundwater for root development and growth. However, when the piezometric level declines due to factors such as excessive groundwater extraction, prolonged droughts, or climate change, palm trees are forced to extend their root systems deeper to access the receding water table. Research indicates that palm roots can grow to a maximum depth of approximately 9 m [27] beyond which they cannot effectively access groundwater.
The deep rooting system of palm trees enables them to maintain sufficient water supply to their canopies, even under arid conditions. However, when the groundwater table falls below the maximum rooting depth, the vegetation is unable to sustain adequate water uptake, leading to reduced canopy health and productivity. This highlights the critical relationship between groundwater availability and the physiological resilience of palm trees, particularly in water-scarce environments.
LAI vs Dates yield (October 2015/October 2017): In Morocco, the date harvest season typically occurs in October [28]. To assess the relationship between vegetation health and date production, Leaf Area Index (LAI) time series values were compared with date yield data for 2015 and 2017, as these years were identified as significant for date production in the country. In 2015, date production reached a high yield, whereas in 2017, production declined by 12% compared to 2015 (Figure 17). LAI experienced a decline in that same year. This reduction in yield was accompanied by a decline in LAI and quality, which was attributed to several factors including insufficient precipitation, reduced nutrient availability from palm leaves, and the overexploitation of groundwater resources due to excessive pumping—a critical issue in the region.
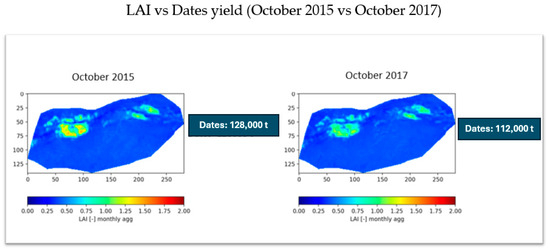
Figure 17.
Dates productivity (2015 and 2017).
In response to the unsustainable extraction of groundwater, the Moroccan government implemented regulatory measures to limit water pumping, including restrictions on the volume of water that can be extracted per individual [14]. These measures aim to mitigate the adverse effects of groundwater depletion on agriculture and ecosystems.
The analysis demonstrates that LAI values derived from TREX align with observed trends in groundwater levels and date yields in the study area. These findings highlight the utility of LAI as an indicator of vegetation health and its sensitivity to groundwater availability. However, further validation of these results through additional in situ measurements would strengthen the reliability of the findings and provide a more comprehensive understanding of the interactions between groundwater dynamics, vegetation health, and agricultural productivity.
3.4. General Interpretation and Recommendations
Numerous studies have demonstrated a strong positive correlation between vegetation indices, such as NDVI and LAI, and water availability in arid environments. Annual precipitation is a primary driver of vegetation growth and crop yield, while temperature variations, though less influential, also affect vegetation health and distribution. Human activities, including crop selection, sowing dates, and irrigation practices, further modify vegetation indices. Climate change exacerbates these challenges by increasing aridity and altering precipitation patterns, leading to long-term changes in vegetation cover. This analysis is thoroughly addressed in our ongoing future work, which aims to investigate the impact of climate change on the Boudenib oasis.
Our study of the Boudenib oasis revealed a significant correlation between LAI and groundwater levels, consistent with findings from other arid regions. For example, research in the Namoi catchment, Australia, highlighted the influence of groundwater levels on riparian vegetation, while a study in Ejina, China [29,30,31], demonstrated that areas with shallow groundwater depths, exhibited higher NDVI values. These findings underscore the critical role of groundwater in sustaining vegetation in arid ecosystems especially in the Moroccan oasis as cited before in previous studies [32].
The observed changes in NDVI and LAI in the Boudenib oasis are likely driven by a combination of natural climatic variability and anthropogenic factors. This analysis is further addressed in our ongoing research, which investigates the impact of climate change on the Boudenib oasis. Integrating our results with existing studies enhances the understanding of the intricate relationship between groundwater resources and vegetation dynamics, emphasizing the importance of sustainable groundwater management for maintaining vegetation cover in fragile arid ecosystems. This comprehensive approach provides a clearer understanding of the factors influencing vegetation changes and informs effective conservation strategies to ensure ecosystem resilience in the face of environmental change.
Based on these results, we recommend implementing sustainable groundwater management practices to prevent resource depletion by agricultural management policies and regulation of groundwater extraction to ensure long-term water availability. This should include promoting water-efficient irrigation techniques such as adopting drip irrigation to optimize water usage and reduce wastage, encouraging the cultivation of drought-tolerant crops, and establishing remote sensing-based monitoring systems for real-time vegetation and water resource assessment. Additionally, reforestation and land rehabilitation initiatives, investment in climate impact research, stakeholder training on sustainable practices, and collaboration with research institutions are essential for enhancing ecosystem resilience in arid regions like the Boudenib oasis.
4. Conclusions
This study demonstrates the potential of integrating remotely sensed data with GIS-based numerical models to monitor and analyze vegetation dynamics in oasis environments, particularly in areas where field access is limited or equipment for instant data collection is unavailable. By leveraging medium-resolution satellite imagery, such as PROBA-V and Sentinel-3, we employed the TREX method to derive key physical parameters, including the Leaf Area Index (LAI) and Normalized Difference Vegetation Index (NDVI), for vegetation monitoring. The integration of these remotely sensed datasets with field observations provides a robust framework for validating the reliability of this approach for future projections and analyses.
Our findings reveal a clear correlation between groundwater depth and vegetation health, as indicated by LAI. Specifically, low LAI values (0.5–0.8) were observed during periods of reduced groundwater availability with a groundwater depth ranging between 3 and 5 m, leading to decreased vegetation density in palm trees and a decline in both the quantity and quality of date production, as noted in October 2015 and October 2017. Conversely, high LAI values (1.25–1.5) were recorded when groundwater levels were elevated, with the piezometric level (PL) reaching 8 m, indicating a strong dependence of palm tree vitality on groundwater availability. These results underscore the utility of medium-resolution satellite imagery for monitoring palm tree health in oasis ecosystems, with significant implications for sustainable water resource management. By linking vegetation monitoring outcomes to groundwater depth, this study provides actionable insights for optimizing water use in arid regions.
However, the relationship between NDVI-derived vegetation indices and underlying groundwater resources remains complex. While automated time-series analysis of remotely sensed data has elucidated correlations between groundwater patterns and vegetation canopy dynamics, further research is needed to refine these findings.
Future research should focus on enhancing vegetation monitoring accuracy by integrating in situ NDVI and LAI measurements with high-resolution hyperspectral imagery. Incorporating land use change analysis will provide a more comprehensive understanding of NDVI and LAI variations, enabling a more precise assessment of vegetation dynamics in response to environmental and anthropogenic factors. Additionally, the transition to Sentinel-3 data should be explored to evaluate its potential for improving long-term vegetation monitoring at a broader spatial scale. The use of higher-resolution hyperspectral datasets is also recommended to refine both spatial and temporal analyses, allowing for more detailed assessments of vegetation health and productivity. These advancements will contribute to more accurate and effective ecosystem monitoring, supporting sustainable land and water resource management strategies. From an ecological perspective, the dual reliance of palm trees on surface water for irrigation and groundwater for root development highlights the need for a balanced approach to water resource management. Protecting groundwater reserves is critical for sustaining root growth, while surface water resources are essential for irrigation and crop nutrition. Achieving this balance is vital for the long-term health of oasis ecosystems.
Finally, from a socio-economic standpoint, the preservation and development of agriculture—central to the livelihoods of oasis communities—must be prioritized. Continuous vegetation monitoring, coupled with data-driven policies such as regulating water extraction rates, can safeguard these ecosystems for future generations. This study not only advances the application of remote sensing techniques in arid environments but also provides a foundation for informed decision-making to promote sustainable development in oasis regions.
Author Contributions
Conceptualization, K.B.; Methodology, K.B. and B.V.; Software, K.B.; Validation, B.V. and A.V.G.; Formal analysis, K.B.; Investigation, K.B.; Resources, K.B.; Data curation, K.B. and B.V.; Writing—original draft preparation, K.B.; Writing—review and editing, K.B. and V.B; Visualization, K.B. All authors have read and agreed to the published version of the manuscript.
Funding
This work was funded by the VLIR-UOS program under the WASIS project VLIR344.
Data Availability Statement
An ethical approval was not required for this research.
Acknowledgments
To Steven Eisenreich, and Boud Verbeiren, for their constant advice that helped in making and editing this manuscript. To Suliga Joanna, James Chawanda and the other colleagues of the HYDR department for their support and help in the methodology and their encouragement in getting me integrated into the department. To the team of ABH-GZR Errachidia, for their time in the field program and providing the input data we needed for this study.
Conflicts of Interest
The authors declare that the research was conducted in the absence of any commercial or financial relationships that could be construed as a potential conflicts of interest.
References
- Combe, M.; Simonot, M. Ressources en eaux du Maroc: La haute moulouya, le sillon d’Itzer-Enjil et le massif de Bou-Mia-Aouli. Notes Mémoires Serv. Géologique Maroc 1971, 231, 193–201. [Google Scholar]
- Eddahby, L.; Popov, M.A.; Stankevich, S.A.; Kozlova, A.A.; Svideniuk, M.O.; Mezzane, D.; Ibouh, H. Assessing vegetation structural changes in Oasis agro-ecosystems using sentinel-2 image time series: Case study for Drâa-Tafilalet region Morocco. Int. Arch. Photogramm. Remote Sens. Spat. Inf. Sci.-ISPRS Arch. 2019, 42, 69–73. [Google Scholar] [CrossRef]
- Bouaamlat, I.; Larabi, A.; Faouzi, M. Assessment of Water Resources in the Tafilalet Oasis System by a Mathematical Model (South East of Morocco). Hydrogeol. J. 2012, 24, 1479–1496. [Google Scholar] [CrossRef]
- Oufkir, M.A. Changements socio-économiques et recompositions territoriales dans le bassin du Guir (Sud-Est marocain). GéoDév 2020, 8, 1–10. [Google Scholar]
- Rafik, A.; Ibouh, H.; El Alaoui El Fels, A.; Eddahby, L.; Mezzane, D.; Bousfoul, M.; Amazirh, A.; Ouhamdouch, S.; Bahir, M.; Gourfi, A.; et al. Soil Salinity Detection and Mapping in an Environment under Water Stress between 1984 and 2018 (Case of the Largest Oasis in Africa-Morocco). Remote Sens. 2022, 14, 1606. [Google Scholar] [CrossRef]
- Rayne, L.; Brandolini, F.; Makovics, J.L.; Hayes-Rich, E.; Levy, J.; Irvine, H.; Assi, L.; Bokbot, Y. Detecting desertification in the ancient oases of southern Morocco. Sci. Rep. 2023, 13, 19424. [Google Scholar] [CrossRef]
- Bastiaanssen, W.G.M. Remote Sensing in Water Resources Management: The State of the Art; International Water Management Institute: Colombo, Sri Lanka, 1998; Available online: https://api.semanticscholar.org/CorpusID:127205500 (accessed on 8 February 2021).
- Lamqadem, A.A.; Saber, H.; Rahimi, A. Spatiotemporal Changes of Vegetation in the Middle Draa Valley Oasis: A Study Case of M’hamid El Ghizlane Oasis (Morocco). Eur. Sci. J. 2017, 13, 115–132. [Google Scholar] [CrossRef]
- Rashid, N.S.A.; Askari, M.; Tanaka, T.; Simunek, J.; van Genuchten, M.T. Inverse estimation of soil hydraulic properties under oil palm trees. Geoderma 2015, 241, 306–312. [Google Scholar] [CrossRef]
- Hiler, E.; Clark, R. stress Day Index to Characterize Effects of Water Stress on Crop Yields. Trans. ASAE 1971, 14, 757–761. Available online: https://api.semanticscholar.org/CorpusID:110532365 (accessed on 3 March 2019).
- Aldakheel, Y.Y. Assessing NDVI Spatial Pattern as Related to Irrigation and Soil Salinity Management in Al-Hassa Oasis, Saudi Arabia. J. Indian Soc. Remote Sens. 2011, 39, 171–180. [Google Scholar] [CrossRef]
- Meskour, A.; Ahattab, J.; Aachib, M.; Hasnaoui, M.D. Assessing the Impact of Drought and Upstream Dam Construction on Agriculture in Arid and Semi-Arid Regions: A Case Study of the Middle Draa Valley, Morocco. Environ. Monit. Assess. 2025, 197, 236. [Google Scholar] [CrossRef] [PubMed]
- Suliga, J.; Bhattacharjee, J.; Chormański, J.; van Griensven, A.; Verbeiren, B. Automatic Proba-V Processor: TREX—Tool for Raster Data Exploration. Remote Sens. 2019, 11, 2538. [Google Scholar] [CrossRef]
- Ministère de L’équipement et de L’eau du MAROC. Available online: https://www.equipement.gov.ma/eau/Pages/Accueil.aspx# (accessed on 2 June 2023).
- Tlemcani, J.; Hilali, M.; Mahboub, A.; Moudden, H.; Outaleb, A.; Boumeshoul, S.; Outaleb, A.; Boumeshoul, S. Hydrogeology and groundwater modeling of the Boudenib senonian aquifer (Southeastern Morocco). Environ. Water Sci. Public Health Territ. Intell. J. 2019, 3, 221–230. Available online: https://revues.imist.ma/?journal=ewash-ti/ (accessed on 4 April 2022).
- Eckert, S.; Hüsler, F.; Liniger, H.; Hodel, E. Trend analysis of MODIS NDVI time series for detecting land degradation and regeneration in Mongolia. J. Arid Environ. 2015, 113, 16–28. [Google Scholar] [CrossRef]
- Moumane, A.; Al Karkouri, J.; Benmansour, A.; El Ghazali, F.E.; Fico, J.; Karmaoui, A.; Batchi, M. Monitoring long-term land use, land cover change, and desertification in the Ternata oasis, Middle Draa Valley, Morocco. Remote Sens. Appl. Soc. Environ. 2022, 26, 100745. [Google Scholar] [CrossRef]
- Fayech, D.; Tarhouni, J. Climate variability and its effect on normalized difference vegetation index (NDVI) using remote sensing in semi-arid area. Model. Earth Syst. Environ. 2021, 7, 1667–1682. [Google Scholar] [CrossRef]
- Wolters, E.; Dierckx, W.; Iordache, M.-D.; Swinnen, E. PROBA-V Products User Manual v3.01; Image: Rochester, NY, USA, 2018; pp. 1–110. [Google Scholar] [CrossRef]
- Alhammadi, M.S.; Kurup, S.S. Impact of Salinity Stress on Date Palm (Phoenix dactylifera L.)—A Review. Crop Prod. Technol. 2012, 9, 169–173. [Google Scholar] [CrossRef][Green Version]
- Parker, G. Tamm review: Leaf Area Index (LAI) is both a determinant and a consequence of important processes in vegetation canopies. For. Ecol. Manag. 2020, 477, 118496. [Google Scholar] [CrossRef]
- Available online: https://statstutor.ac.uk/ (accessed on 12 January 2023).
- Senthilnathan, S. Usefulness of Correlation Analysis. SSRN Electron. J. 2019, 122, 200. [Google Scholar] [CrossRef]
- Available online: https://www.scribbr.com/statistics/correlation-coefficient/ (accessed on 5 August 2023).
- Ahmadi, H.; Fatemizadeh, E.; Motie-Nasrabadi, A. A Comparative Study of Correlation Methods in Functional Connectivity Analysis Using fMRI Data of Alzheimer’s Patients. J. Biomed. Phys. Eng. 2023, 13, 125–134. [Google Scholar] [CrossRef] [PubMed] [PubMed Central]
- Weiss, M.; Baret, F.; Smith, G.J.; Jonckheere, I.; Coppin, P. Review of methods for in situ leaf area index (LAI) determination Part II. Estimation of LAI, errors and sampling. Agric. For. Meteorol. 2004, 121, 37–53. [Google Scholar] [CrossRef]
- Moradkhani, H. Hydrologic Remote Sensing and Land Surface Data Assimilation. Sensors 2008, 8, 2986–3004. [Google Scholar] [CrossRef] [PubMed]
- Mazri, M.A.; Meziani, R.; El Fadile, J.; Ezzinbi, A.E. Optimization of medium composition for in vitro shoot proliferation and growth of date palm cv. Mejhoul. 3 Biotech 2016, 6, 111. [Google Scholar] [CrossRef]
- Acworth, R.I.; Timms, W.A.; Kelly, B.F.J.; Mcgeeney, D.E.; Ralph, T.J.; Larkin, Z.T.; Rau, G.C. Late Cenozoic paleovalley fill sequence from the Southern Liverpool Plains, New South Wales—implications for groundwater resource evaluation. Aust. J. Earth Sci. 2015, 62, 657–680. [Google Scholar]
- Xi, H.; Feng, Q.; Liu, W.; Si, J.; Chang, Z.; Su, Y. The research of groundwater flow model in Ejina Basin, Northwestern China. Environ. Earth Sci. 2010, 60, 953–963. [Google Scholar] [CrossRef]
- Jin, X.M.; Schaepman, M.E.; Clevers, J.G.P.W.; Su, Z.B.; Hu, G.C. Groundwater Depth and Vegetation in the Ejina Area, China. Arid. Land Res. Manag. 2011, 25, 194–199. [Google Scholar] [CrossRef]
- Margat, J. Hydrogéologie de la plaine du Tafilalt (Maroc Pré-Saharien). Houille Blanche 1961, 47 (Suppl. S2), 678–682. [Google Scholar] [CrossRef]
Disclaimer/Publisher’s Note: The statements, opinions and data contained in all publications are solely those of the individual author(s) and contributor(s) and not of MDPI and/or the editor(s). MDPI and/or the editor(s) disclaim responsibility for any injury to people or property resulting from any ideas, methods, instructions or products referred to in the content. |
© 2025 by the authors. Licensee MDPI, Basel, Switzerland. This article is an open access article distributed under the terms and conditions of the Creative Commons Attribution (CC BY) license (https://creativecommons.org/licenses/by/4.0/).