1. Introduction
Landslides generate two types of spatially oriented hazards. First, structures located within the initial failure boundary can be damaged or relocated by ground disturbances. Second, structures or people in the path of a moving landslide will be affected by the advancing toe or by the liquefied material running out some distance below the initial movement. This runout is extremely hazardous, because it can affect areas located far below the initial failure. Current technology and modeling help us to analyze landslides in terms of overall stability, triggers, and sensitivity to environmental changes, but landslide runout remains a difficult variable to predict.
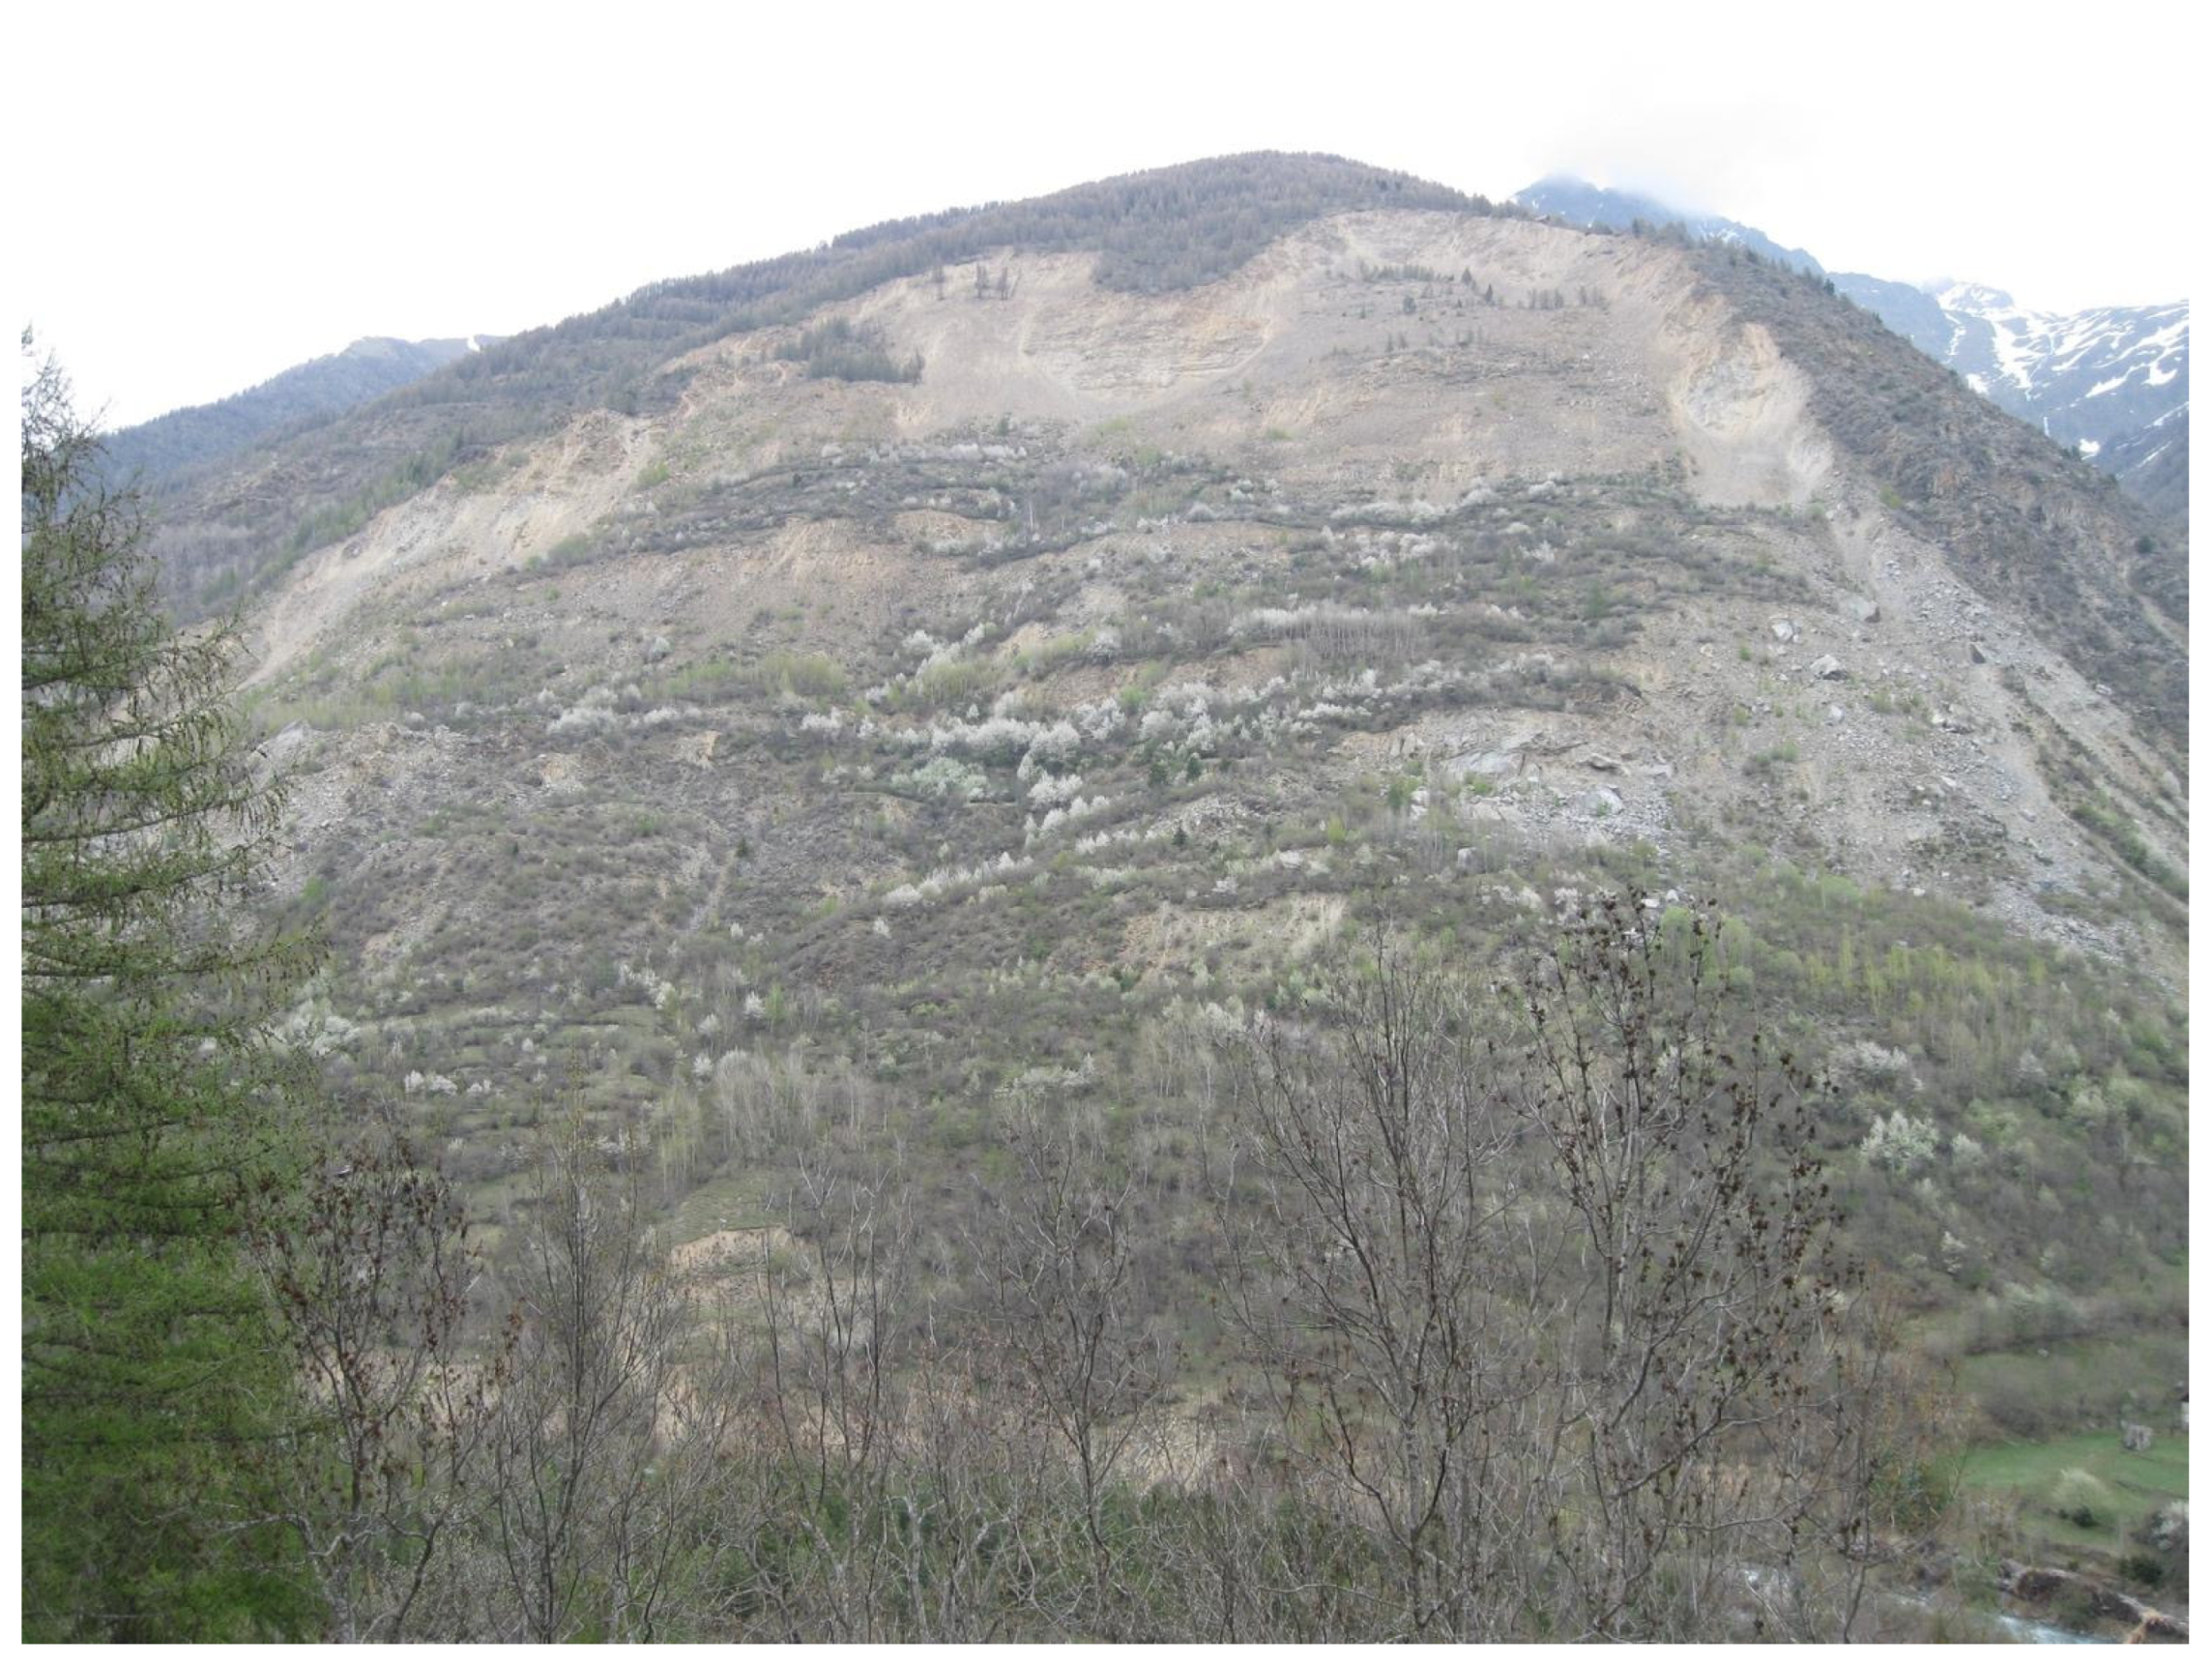
Short runout landslides, such as the 1980 Le Clapiere event in France (
Figure 1), might show an overall movement of only a few percent of the overall length, in this case less than 100 m. Despite being approximately 60 M m
3 in volume, no fatal injuries resulted from this event, and the only damage it caused was to a nearby railway [
1].
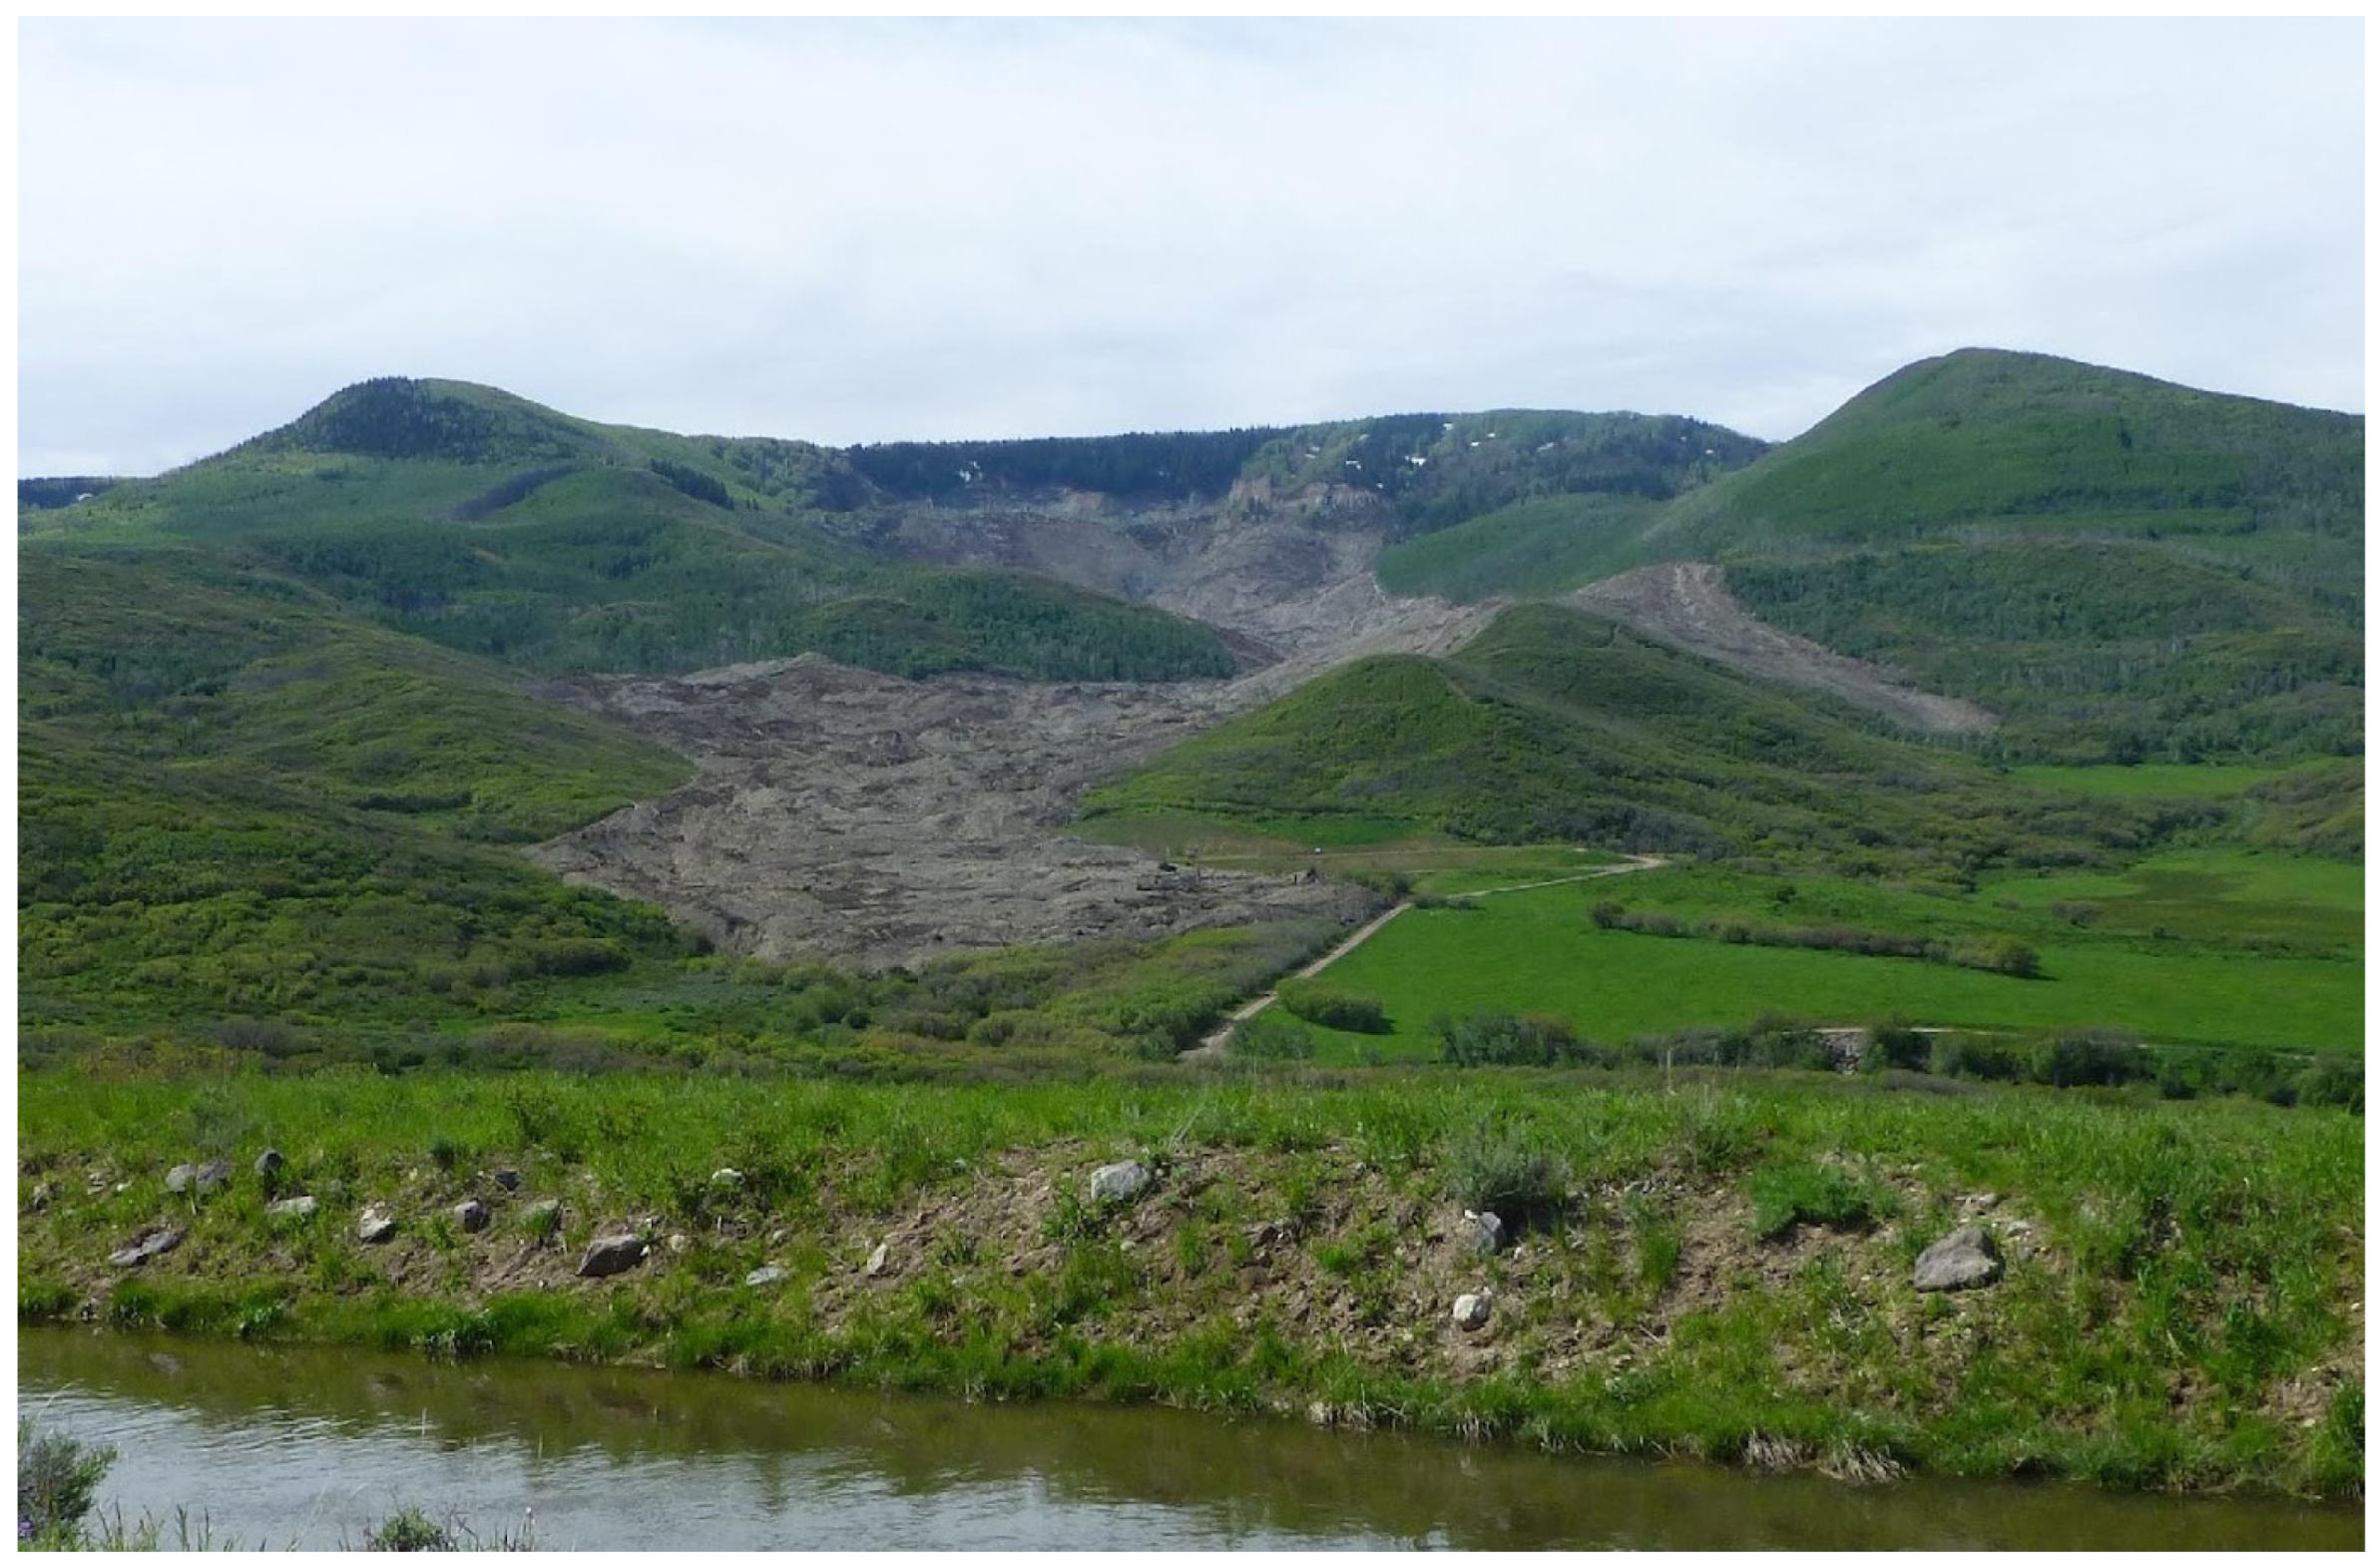
In contrast, long runout landslides can extend the hazard for many times their initial length. For example, the 2014 West Salt Creek event in Colorado, USA travelled 5 km [
2] (
Figure 2). It was a comparable size to Le Clapiere, at 80 M m
3 (both classified as “large” landslides according to McColl and Cook, 2004 [
3]), and also occurred in a rural area, but unlike Le Clapiere, it resulted in the deaths of three people.
The causes of long runout for landslides are not universally agreed upon, but in general, landslide materials liquefy after a short amount of movement. This material then moves as a high pore water pressure fluid, covering distances farther than expected based on the original frictional properties of the material [
4,
5,
6]. Movement may also be enhanced by trapped interstitial air [
7,
8].
The purpose of this paper is to review the published literature, in addition to some non-published works, to summarize available tools to predict landslide runout and to recommend workflows to better identify and manage this hazard. We start with a review of how runout is measured, in order to identify methods that best indicate the potential hazard. Next, we explore predictive methods and measurable parameters that correlate well to runout. Finally, we discuss ways to combine and apply these methods to optimize results. As a review paper, our intent is to identify the most useful works, rather than provide an exhaustive treatment capturing every publication on the subject. Herein, we focus on rotational and translational earth slides occurring in soil or weak rock, rather than debris flows or rock slides (using definitions from Cruden and Varnes, 1996 [
9]). While we may incorporate their general findings, we avoid referring to prediction methods that rely on machine learning or complex numerical methods because of the difficulty and time commitment to replicate the models for general use.
2. Measuring Landslide Runout
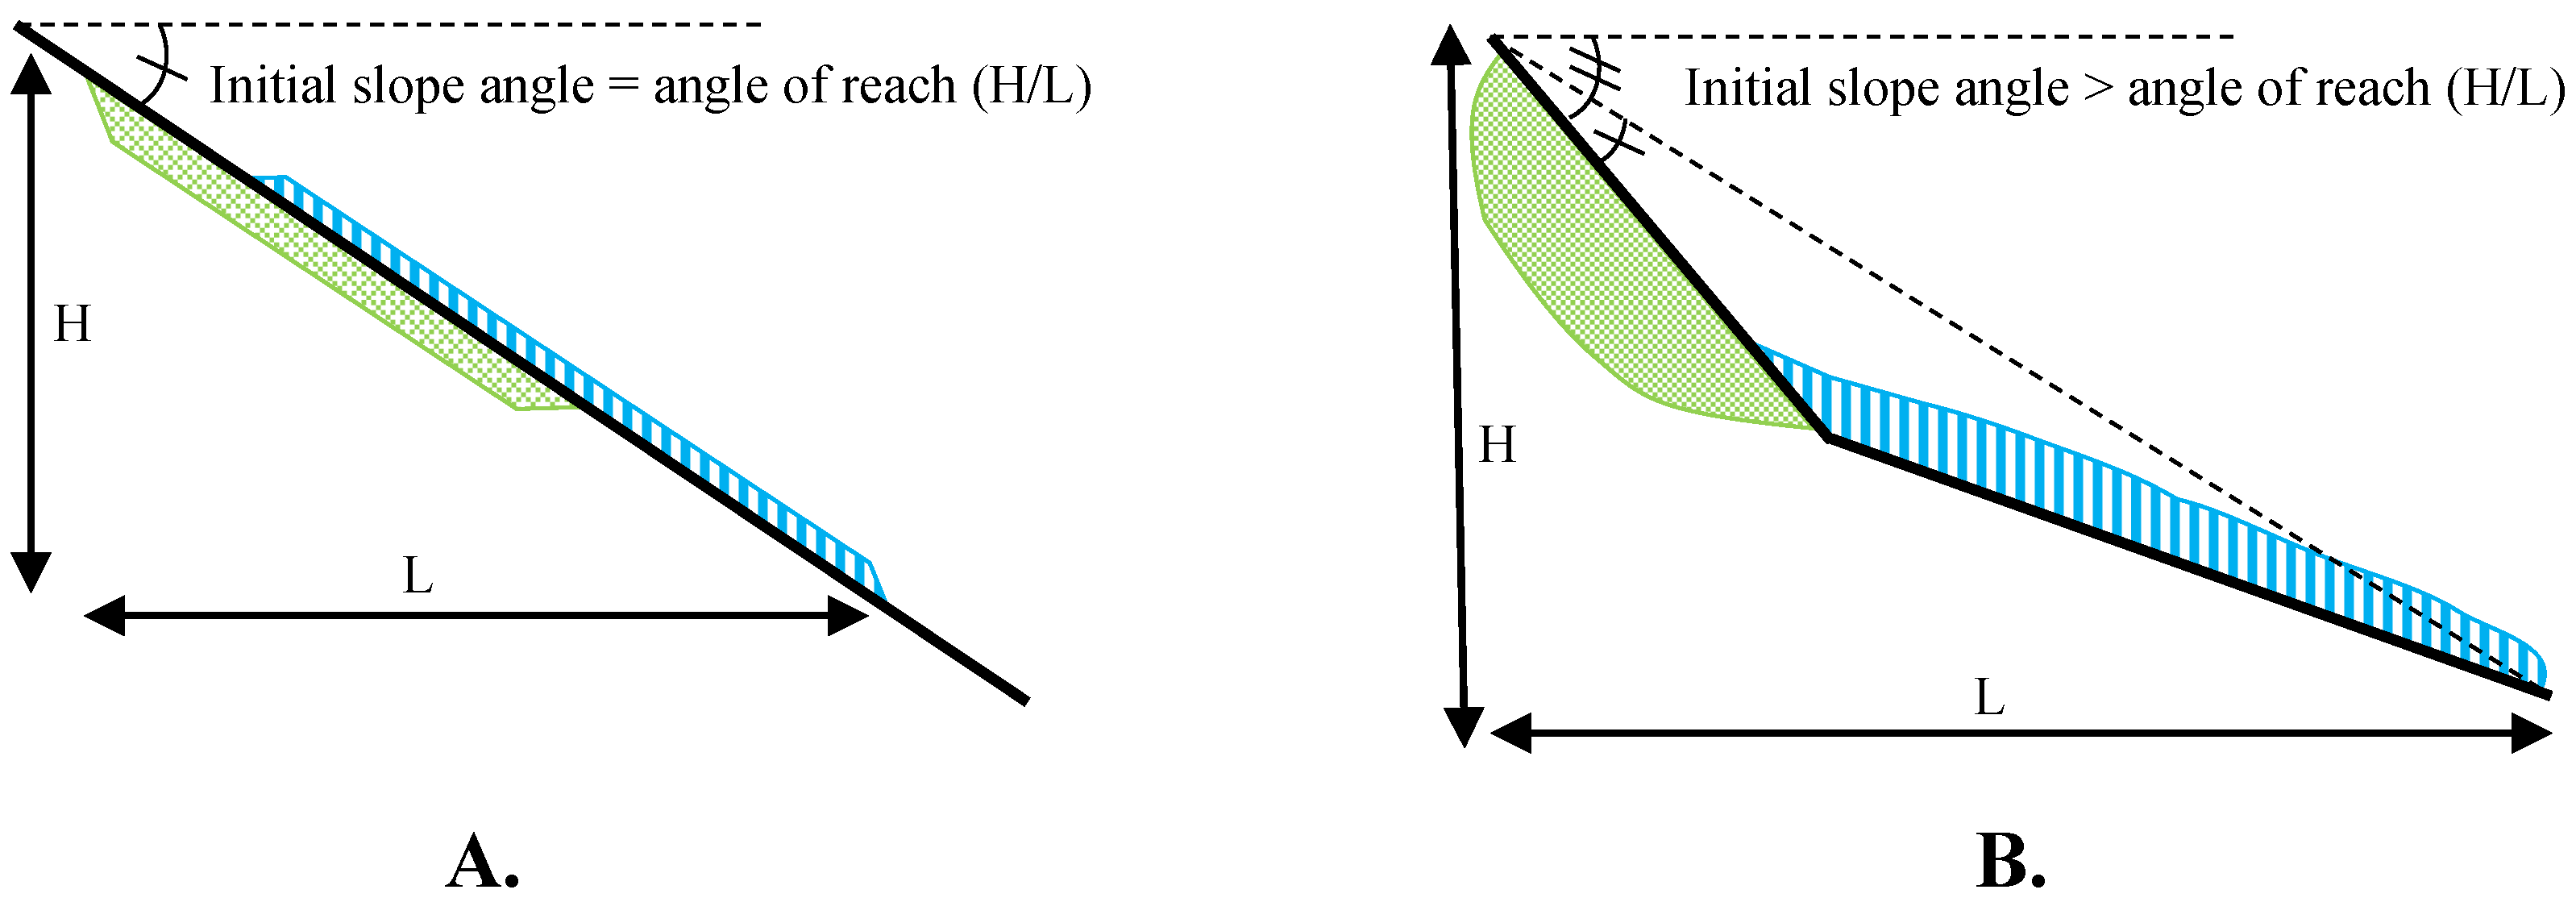
Landslide runout has typically been measured as the ratio of the total elevation drop of the disrupted area from scarp to toe (H) to the total map length of the disrupted area measured horizontally (L) (
Figure 3) (originally proposed by Heim and others, but also reported in Corominas, 1996; Hunter and Fell, 2003; and Hungr et al., 2005 [
10,
11,
12], for example). This height-to-length ratio, H/L, will be larger for short runout landslides and smaller for long runout landslides. The inverse tangent of the ratio yields a number referred to as the “angle of reach” or “travel angle” [
13], which is also inversely correlated to the length of the runout. Although seemingly a robust and precise measurement, H/L is approximately equal to the slope of the terrain for uniform slopes [
14,
15]. In such cases, a landslide where the ground barely moves can have the same runout (measured as H/L) as one where the material displaced in the landslide travels quite far. For example, Wallace and Santi (2021) [
16] selected a group of example landslides with shapes ranging from circular to elongate to ribbon-like (from the landslide inventory in Wagner, et al., 2002 [
17]), and showed that there was little variation in the H/L ratio, and specifically that the ribbon-like landslides did not have significantly smaller ratios. They conclude that “the steep terrain does not have any slope breaks, so H/L merely measures the slope angle”.
Several researchers have tried to overcome this problem by suggesting other measures of landslide runout, or mobility, including methods that measure from the center of the pre- and post-movement mass [
5,
18,
19], that measure the change in landslide area from source to deposit [
10], or that measure a length-to-width ratio [
20]. Still others compare the runout length as the actual travel angle compared to a standard travel angle of 32° [
14,
21].
Wallace and Santi (2021) and Lockyear (2018) [
16,
22] describe these other mobility measures in detail, and also review other commentaries on their utility and practicality, concluding with the suggestion of a more robust measurement as the ratio of runout length to the square root of area, L/A
1/2, a unitless number which Wallace and Santi (2021) [
16] refer to as the “runout number”. This number recognizes the strong correlation between landslide size and mobility seen by other researchers [
10,
11,
15,
19,
21,
23]. It also provides a better range of values that are not so dependent on local topography [
16], with suggested thresholds values of the runout number of 1.5 to distinguish between “short” and “medium” runout, and 2.5 to distinguish between “medium” and “long” runout [
24].
While certain topographic situations are described better by the runout number, some situations are described better by the H/L travel angle. These situations are explored in detail in Wallace and Santi (2021) [
16] and summarized in
Table 1. Because of these differences, they recommend measuring both values, or predicting them as well as possible based on the available data and with reasonable assumptions.
3. Correlative Parameters
Numerous studies have sought to relate easily measured parameters to landslide runout, using statistical and even observational links to try to predict runout behavior, although the field is still understudied [
25]. Some of the stronger correlations are summarized in the following sections.
3.1. Landslide Size
Various researchers have shown a correlation between landslide size and mobility [
10,
11,
15,
19,
21,
23,
26,
27], with larger landslides generally traveling longer distances (
Figure 4). These relations typically use volume as an indicator of landslide size. Several researchers [
19,
28,
29,
30] recommend using landslide area instead, showing a comparable correlation to volume, but requiring one less assumed or measured value (of distal landslide thickness). The measurement of the landslide area nevertheless requires either a landslide that has moved previously, for which the boundaries can be delineated, or an estimate of the expected size of a future landslide, which adds a potential source of error. Scheevel et al. (2017) [
29] addresses this problem, in part, by using an inventory of previous local landslides to bracket the range of potential behaviors of future landslides. This also overcomes a concern that other size–runout correlative studies use regional databases that may not reflect local behavior. In
Figure 5, local data are shown alongside maps of predicted runout for the entire range of expected travel angles as a way to identify potential hazard zones.
3.2. Contractive Behavior
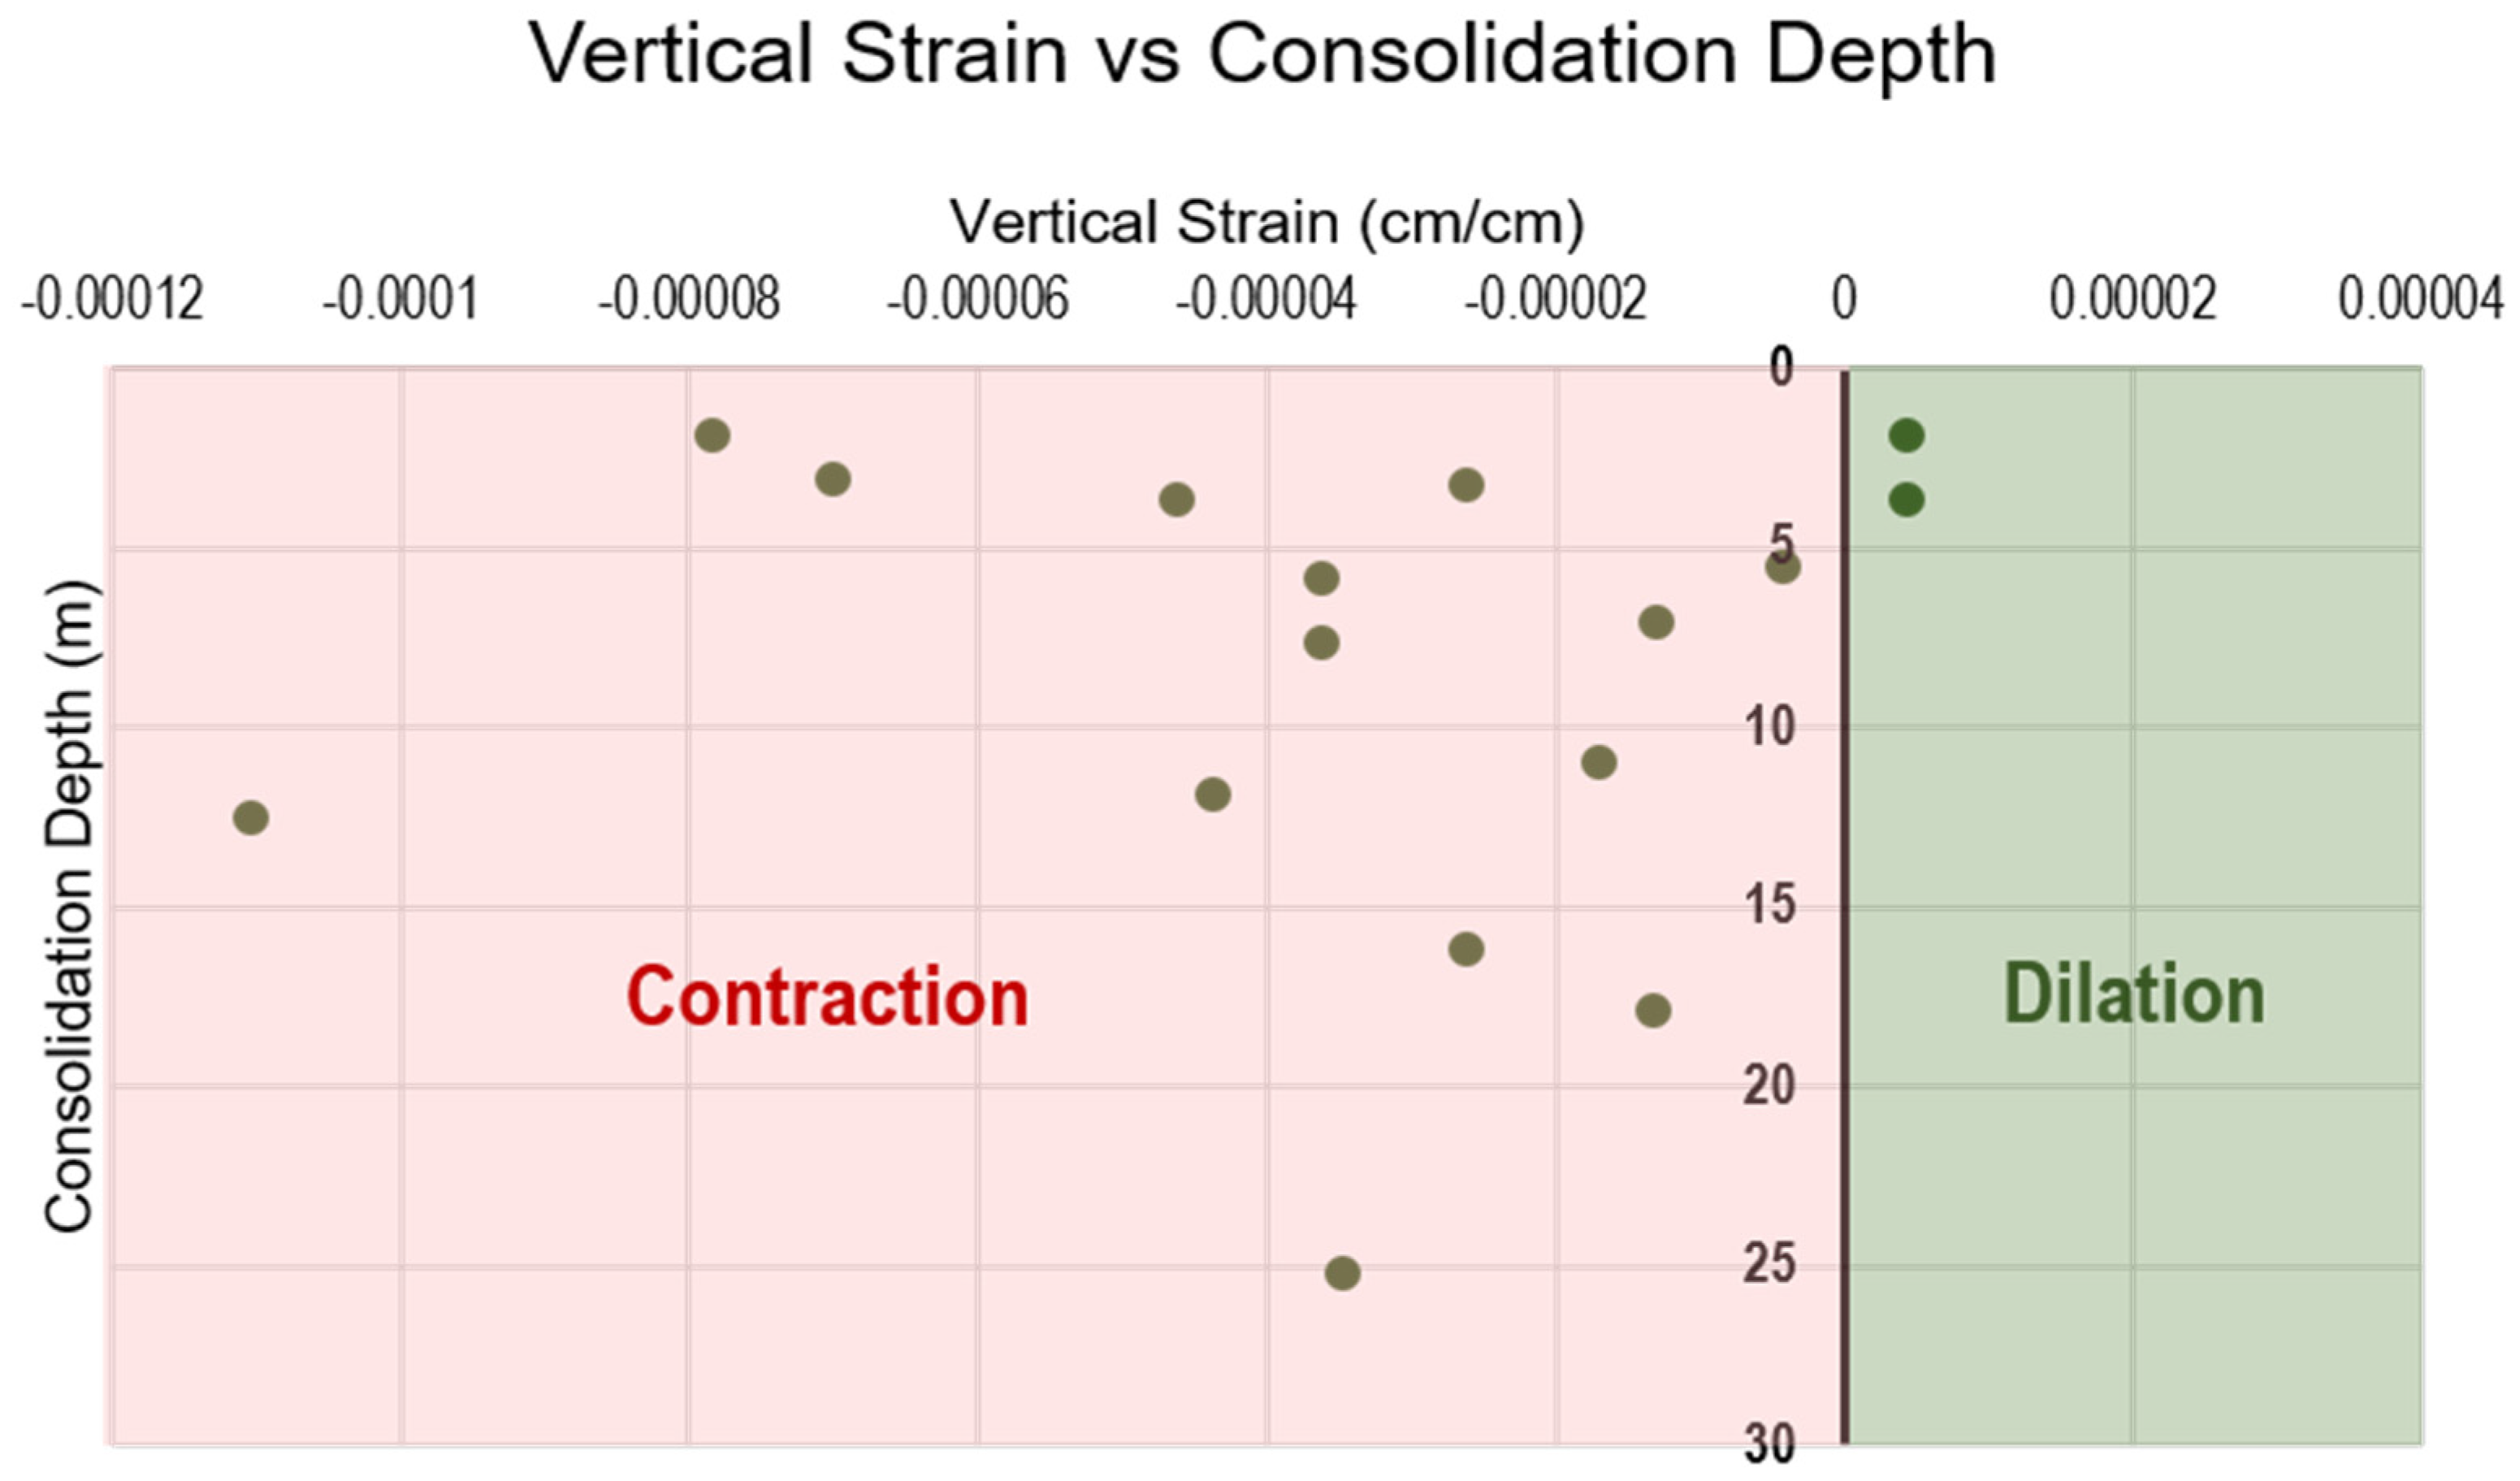
The relationship between soil density and soil mobility upon loading has long been understood within the context of critical state soil mechanics. For example, Iverson et al. (2000) [
31] tested loamy sand in the laboratory inclined at 31°, measuring porosity as a surrogate for density. They found that material with a porosity in excess of 50% accelerated rapidly upon failure, material with a porosity between 41 and 44% underwent slow slumping, and material with a porosity of 39% did not move at all. To summarize, soils that are more dense than the critical state threshold density will expand in volume upon shearing, as individual grains ride up and over one another. This increase in volume, shown as a positive vertical strain during shear testing, results in a drop in pore water pressure that can add effective strength to the soil. This is a dilative behavior, and natural movements such as landslide initiation can be arrested quickly as effective strength is mobilized, restricting runout to short distances. By contrast, soils that are less dense than the critical state will contract upon movement, thereby causing a spike in pore water pressure that induces a more liquid movement and long runout landslides [
32]. Therefore, soils that contract upon shearing, with a negative vertical strain, would be expected to produce landslides with longer runout, as in the example in
Figure 6. In this case, for intact samples collected from geologic units adjacent to the Cook Lake Landslide in Wyoming, the majority show contractive behavior, indicating the susceptibility of these units to move longer distances upon failure.
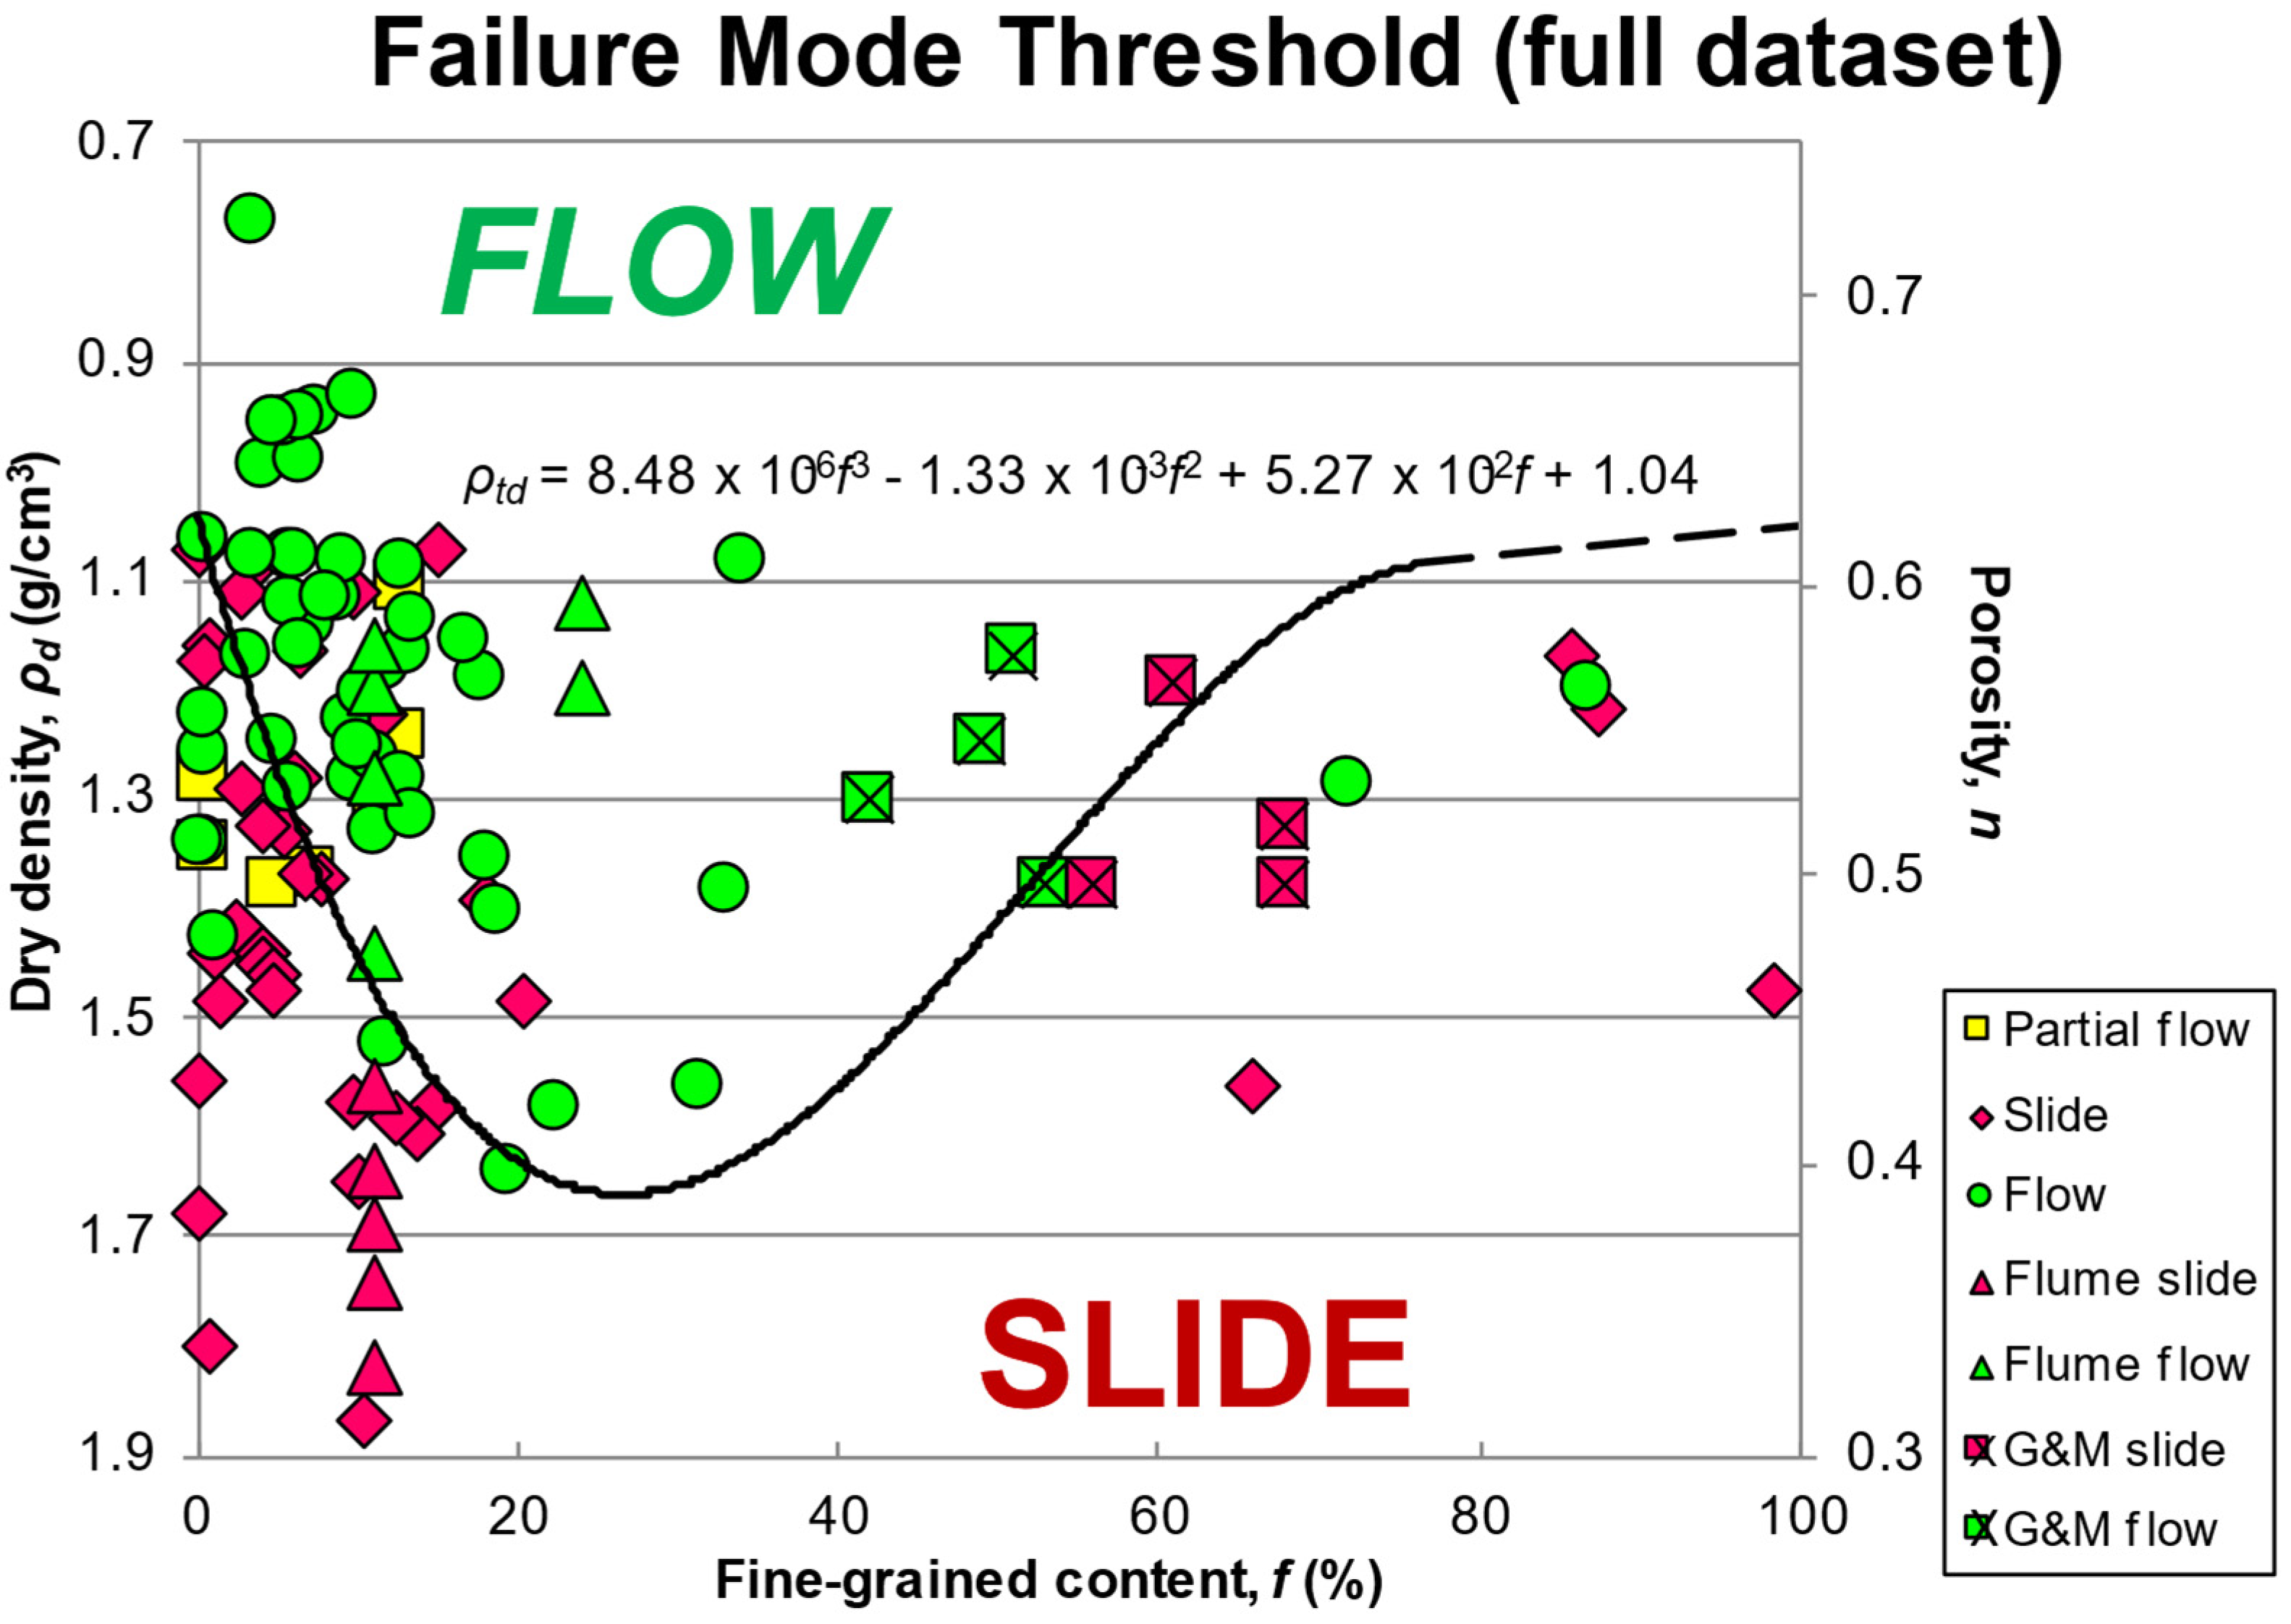
Contractive behavior can be identified by establishing a threshold density for a local or regional area. McKenna et al. (2012) [
33] analyzed the flow response using a database of 87 events in Oregon and Colorado: 50 long runout events were referred to as “flows” and 37 short runout events were referred to as “slides”. The threshold density varies with the fine-grained content of the soil (silt plus clay fraction), so they fit a polynomial curve to equalize the number of Type I (false positive) and Type II (false negative) errors, as shown in
Figure 7. On this basis, the threshold density predicts slide versus flow behavior (short runout versus long runout) with 79% accuracy, with the best results for soils that are of low to moderate plasticity (liquid limit < 40), with a moderate amount of fines (1–18%), and well-graded (coefficient of uniformity, Cu > 8).
3.3. Topographic Curvature
Landslide runout has been shown to relate to topographic curvature, which is intuitive, as concave, geomorphic hollows would have converging water sources and create zones of sediment accumulation and wetter materials. These conditions would be expected to result in longer runout. Open slopes with a flat or convex topography result in divergent water movement with drier materials, which would produce shorter runout. The dataset used in McKenna et al. (2012) [
33] showed that distinguishing between geomorphic hollows and open slopes allowed for the prediction of flow versus slide behavior with 66% accuracy. Lockyear (2018) [
22] developed a database of 226 landslide runout measurements at eight areas in California, Colorado, Utah, Oregon, and Washington states, and divided the individual events into concave, gentle, and convex topography (
Table 2). He showed that H/L measurements of runout were longer for concave and gentle slopes for all of the areas.
3.4. Water Availability
Moriwaki et al. (2004) [
35] identify a process of “self-fluidization”, where saturated slopes will fluidize and flow long distances upon collapse. This highlights the importance of water availability on landslide runout. Hutchinson and Bhandari (1971) [
36] proposed that the rapid loading of the head of a landslide elevates pore pressures and the speed of the loading allows little time for the pore water to escape, creating undrained loading conditions. The rear portion of the mass movement then drives the frontal portion forward. This can cause movement along very shallow slopes or rapid velocities on steeper slopes, resulting in long runout landslides [
36]. This mechanism has received wide acceptance, appearing in accounts of recent events such as with the Oso landslide in 2014 [
37].
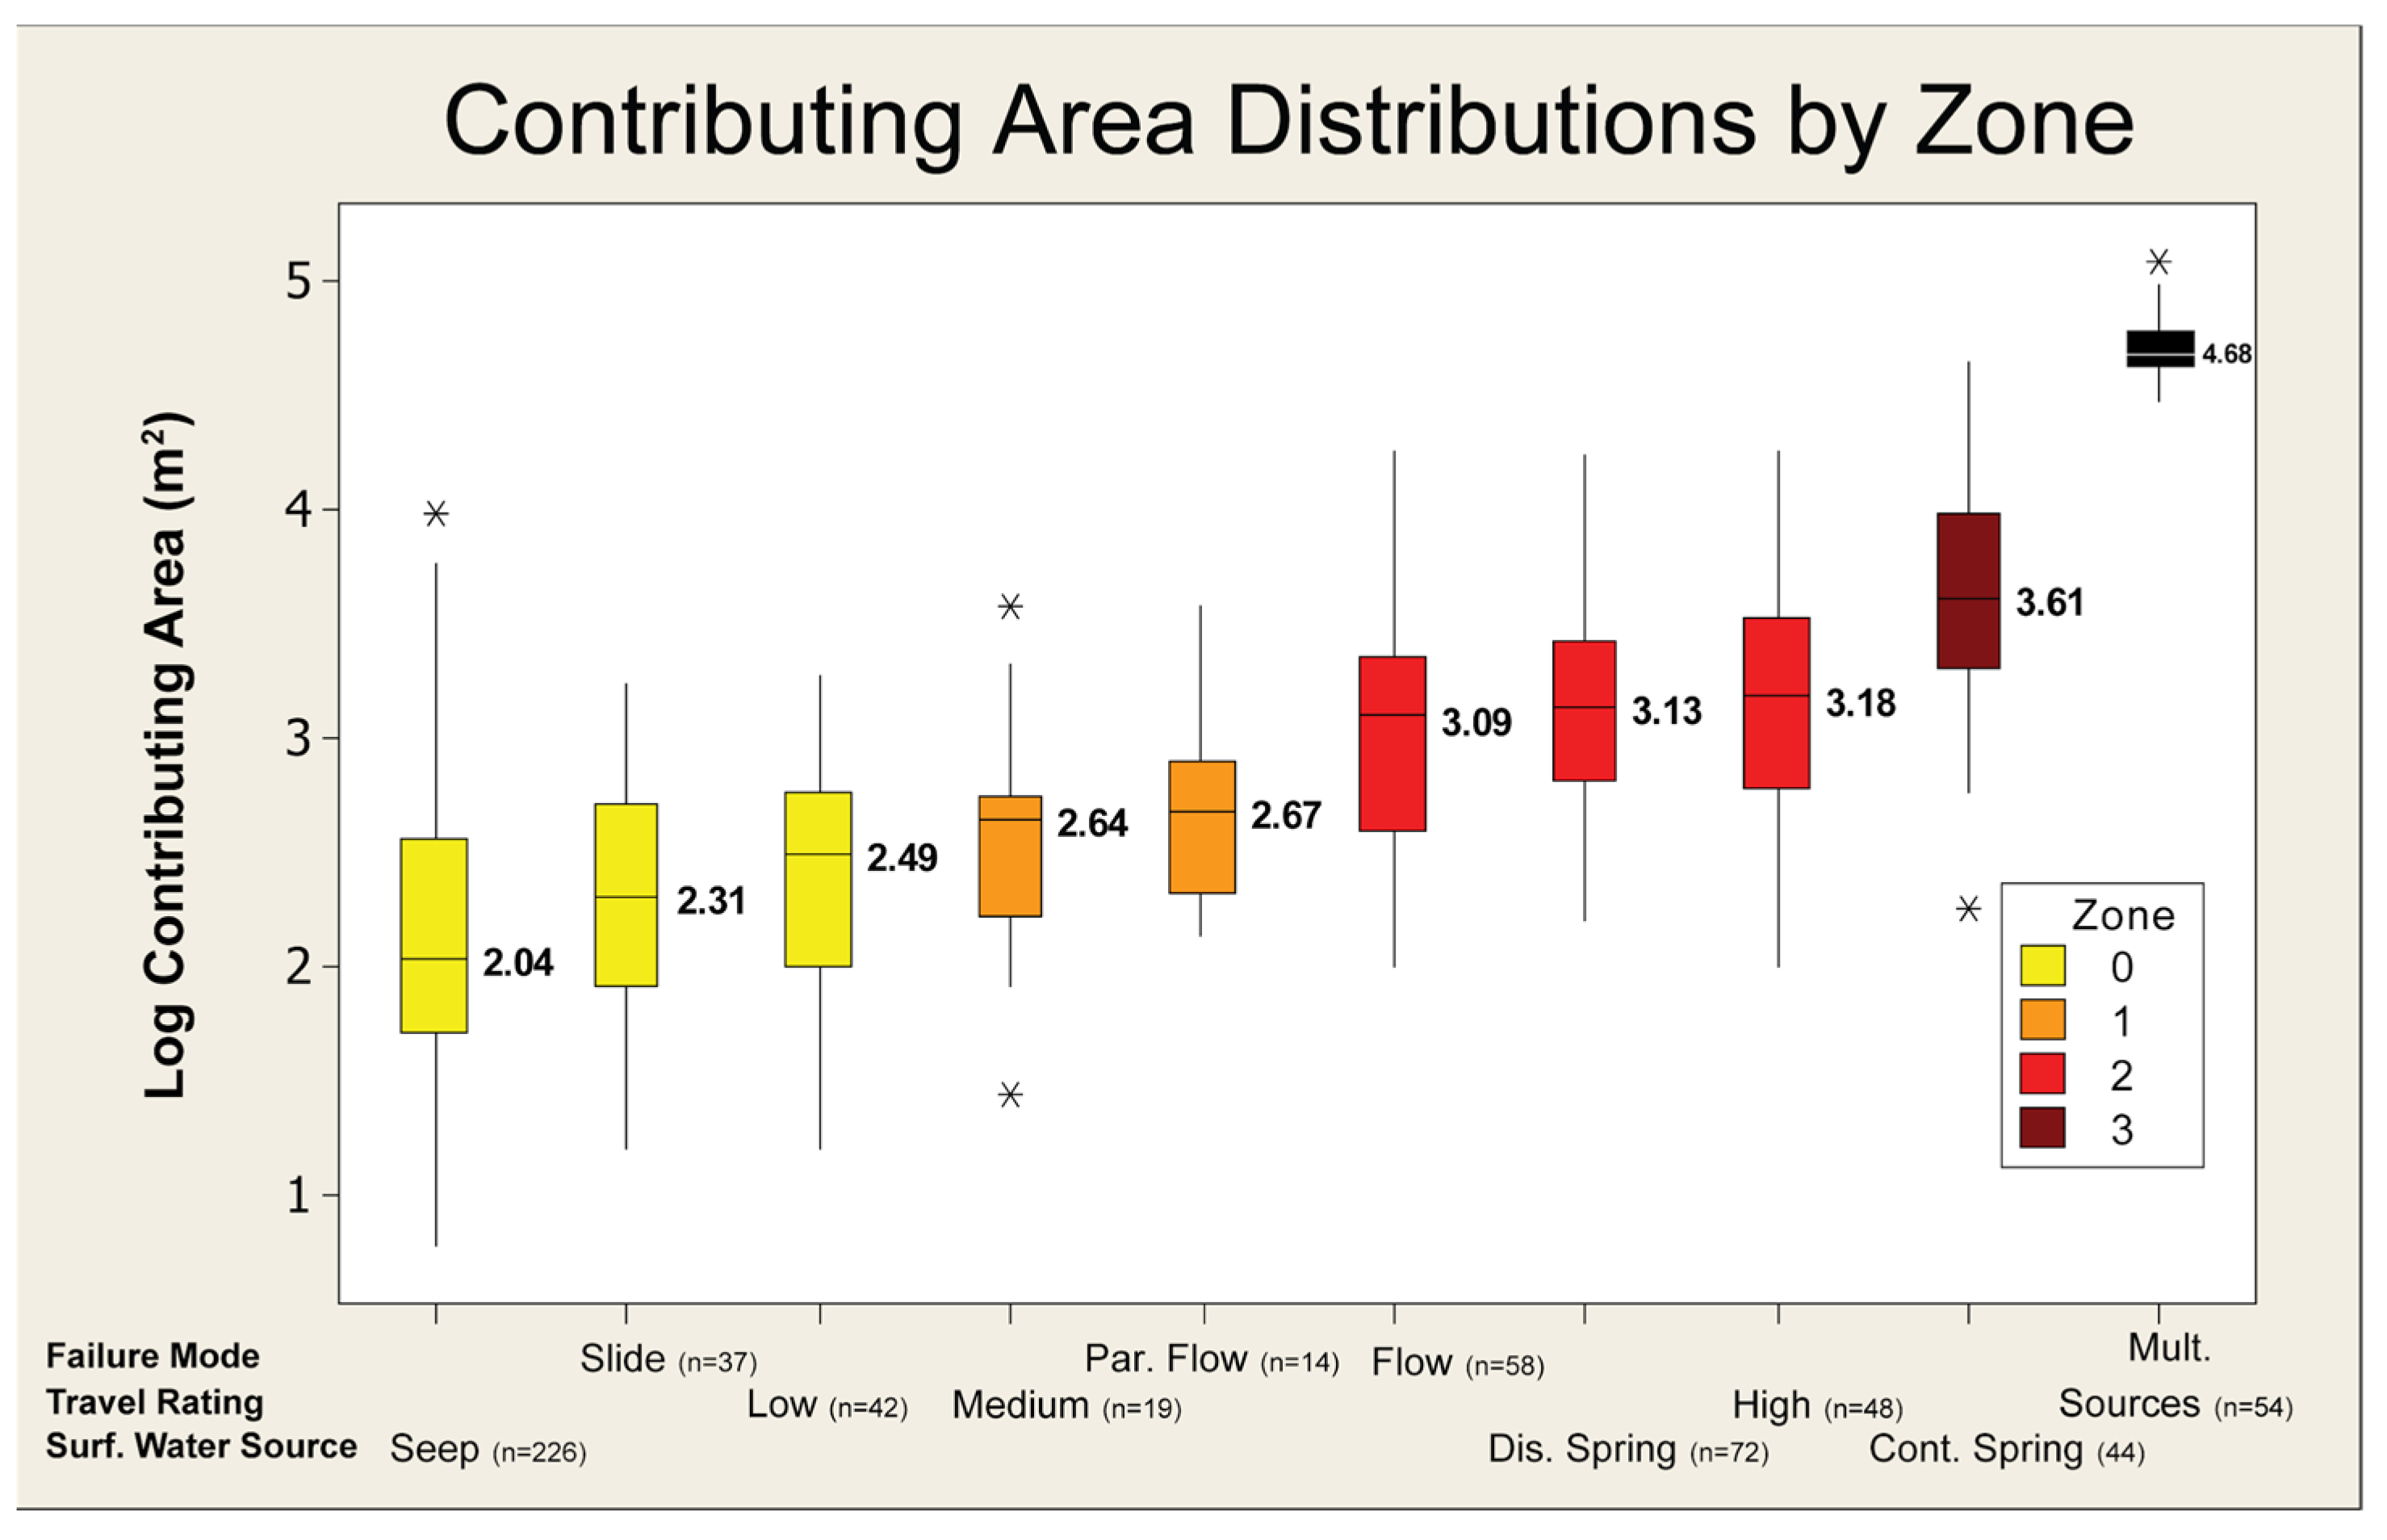
While the topographic curvature serves as a surrogate measure of water availability, other hydrologic measurements can also indicate the soil wetness, and therefore the potential for long runout landslides. For example, McKenna (2011) [
38] evaluated the influence of the upstream contributing area, defined as the area of watershed that topographically drains onto the initiation point of a landslide, as well as the distance to water sources, defined as the ground-surface distance between seeps and springs to the landslide boundary. They showed that both variables correlate positively to flow-like behavior.
Figure 8 shows that mobility, indicated by the flow category (slide, partial flow, flow, events with multiple sources), increases with the upstream contributing area, with averages for each category shown in
Table 3. The median distance to water sources is also shown in
Table 3, with shorter distances producing longer runout events. Differences between all groups are statistically significant. It should be noted that the McKenna (2011) [
38] dataset includes only relatively small events, with an average landslide volume of ~450 m
3.
Johnson and Rodine (1984) [
39] introduce a mobility index, M, to identify soils prone to long runout mobilization. M is defined as the ratio of the water content at field capacity (where an intact soil sample drains to equilibrium under gravity) to the water content of the soil observed to flow in a defined channel in the laboratory. They found that when M < 0.9, soils did not have flow-like behavior, but when M > 1, soils flowed longer distances.
Other indicators of water availability have been shown to correlate to landslide runout, including the GIS-derived Topographic Wetness Index (a calculation of potential water accumulation based on topography) [
40,
41,
42,
43] and slope aspect (the predominant compass orientation of a slope) [
40,
41,
43].
3.5. Slope Angle
The initial slope angle before failure is another parameter that intuitively should be a predictor of landslide runout. Iverson et al. (2015) [
44] suggest that highly mobile events such as debris flows initiate on slopes greater than 20°. However, Lockyear (2018) [
22], using the database described earlier for sites in the western U.S., measured a positive overall correlation between initial slope angle and H/L with R
2 = 0.62 (n = 282 for this specific comparison). Not all locations performed the same, with sites in Washington state and Ferndale California showing statistically significant values, but a noticeably lower correlation. Similarly, Wallace and Santi (2021) [
16] found a positive correlation with R
2 = 0.30 for their dataset of 158 events in the Pacific Northwest of the U.S. Given our earlier observation that H/L is often simply a direct measurement of slope angle for landslides on uniform slopes, these results are not surprising. The initial slope angle did not correlate well with other measurements of landslide stability, such as runout number, suggesting that it should be used with caution as a predictive parameter.
Topographic obstacles such as bends in a travel path or elevated stretches, as one might expect, have been shown to reduce runout distance. Corominas (1996) [
10] showed that large translational landslides were the most strongly affected, having the same H/L values that would be expected for landslides “three to four orders of magnitude smaller”. Vegetation also reduces flow distance [
22]. Corominas (1996) [
10] found that the presence of forests reduced the angle of reach for events that would otherwise be expected to have high mobility due to their volume. This effect is especially prominent for smaller landslides under volumes of 1 M m
3.
3.6. Geology
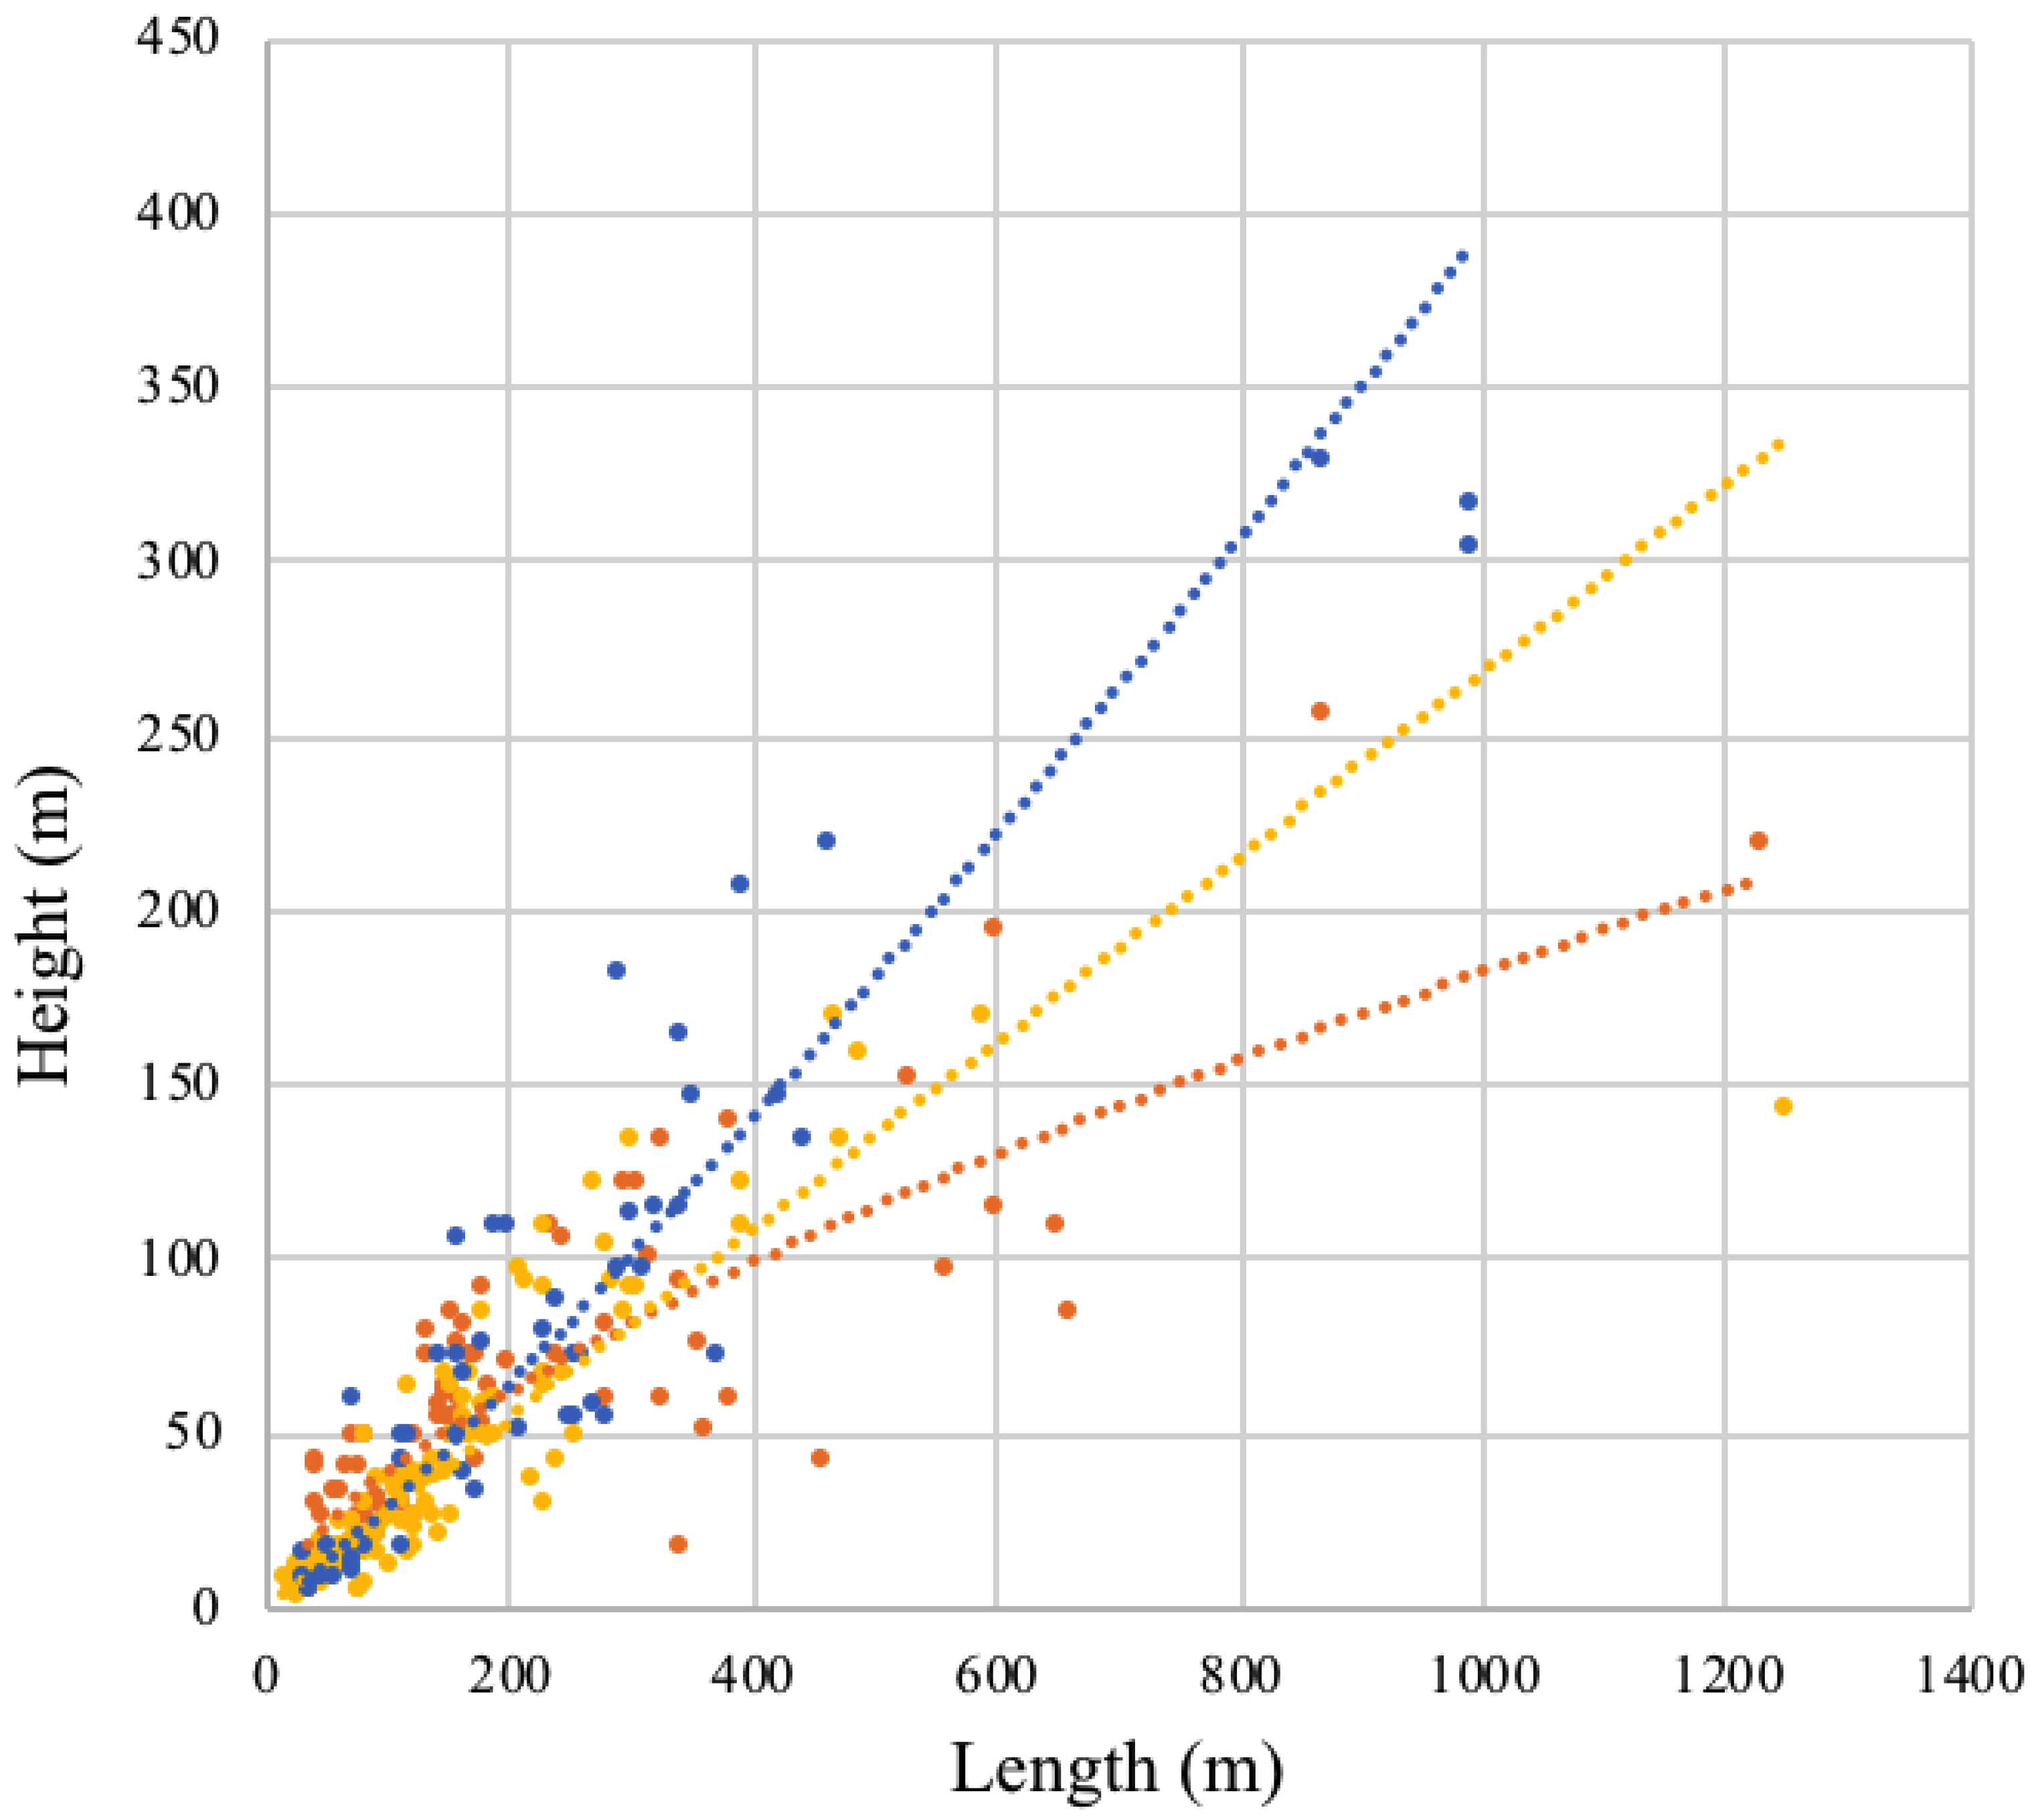
Lockyear (2018) [
22] demonstrated longer runout for weaker geological materials, in general, as shown in
Figure 9. Hunter and Fell (2003) [
11] also observed longer and faster runout for landslides in weak materials such as saturated granular fills, mine tailings, hydraulic fills, quick clays, glaciolacustrine deposits, and steep weathered materials. Hungr et al. (2005) [
12] found that rapid failure and flowing motion were typically indicative of long runout, with sensitive clays, collapsible soils, and saturated loose sands having greater mobility. They also observed that rotational landslides, which are more common in thick weak soils or shales, have a failure surface that forces material upward near the slope face, resulting in decreased momentum and leading to shorter runout. By contrast, compound landslides that transition to a planar movement surface near the slope face are able to maintain momentum and are more likely to have longer runout. Glaciolacustrine soils are prone to this type of failure mode [
45]. In flume tests, Wang and Sassa (2003) [
46] showed that finer sands, or sand mixed with loam, had longer travel distances than coarser sand.
McKenna et al. (2012) [
33] investigated flow versus slide behavior based on material properties expressed by the Approximate Mobility Index (AMI), defined as the ratio of the in situ saturated water content divided by the liquid limit. The idea of predicting mobility using the AMI was originally introduced by Ellen and Fleming (1987) [
47]. Using a threshold of AMI > 1 predicting flows and AMI < 1 predicting slides, they were able to correctly predict the behavior of 66% of the events in their database, with lower reliability when considering only open slope events.
Guo et al. (2014) [
25] showed a strong correlation to geology by generating a predictive equation for 54 landslides initiated during the 2008 Wenchuan earthquake in China, as shown in Equation (1).
where L
max is the landslide travel distance (m), RT is a factor related to rock type (where 4 is for weaker soil and 3 is for stronger soil), V is the landslide volume (m
3), and β is the transition angle from a steep source area to a shallower runout area (degrees). This equation produced R
2 = 0.51, with most predicted values within ±50%. The events used to develop this equation are generally large, ranging from 37,000 to 2,900,000 m
3.
3.7. Previous Movement
Longer runout would be expected at locations where there has been previous landslide movement [
22], as there is decreased bulk density and increased potential for water infiltration from ground cracking, disrupted topography, ponding of water, and piping of subsurface soils. Scarps and oversteepened areas from previous landsliding could also result in longer runout. Lockyear (2018) [
22] found that areas with previous movement had approximately 40% longer runout distances than areas without previous movement (
Figure 10).
4. Systems to Predict Landslide Runout
Wallace et al. (2022) [
24] developed and optimized a scoring system to predict the runout number, L/A
1/2, using a database of 158 landslides in California, Oregon, and Washington State. Summarized in
Table 4, the system relies on measurements of the planimetric curvature of the expected landslide area (derived from 1/3 arc-second digital elevation models as the second derivative of slope, representing the change in slope), sand content percent (in the U.S., this can be derived from widely available U.S. Department of Agriculture Soil Surveys), and upslope watershed area (measured using GIS tools). Using this system, a score ≥ 30 would indicate long runout landslides (runout number ≥ 2.5), a score between 12 and 30 would indicate medium runout landslides (runout number between 1.5 and 2.5), and a score ≤ 12 would indicate short runout landslides (runout number ≤ 1.5). They were able to predict categories with 65% accuracy for short and long runout, and 58% accuracy for medium runout.
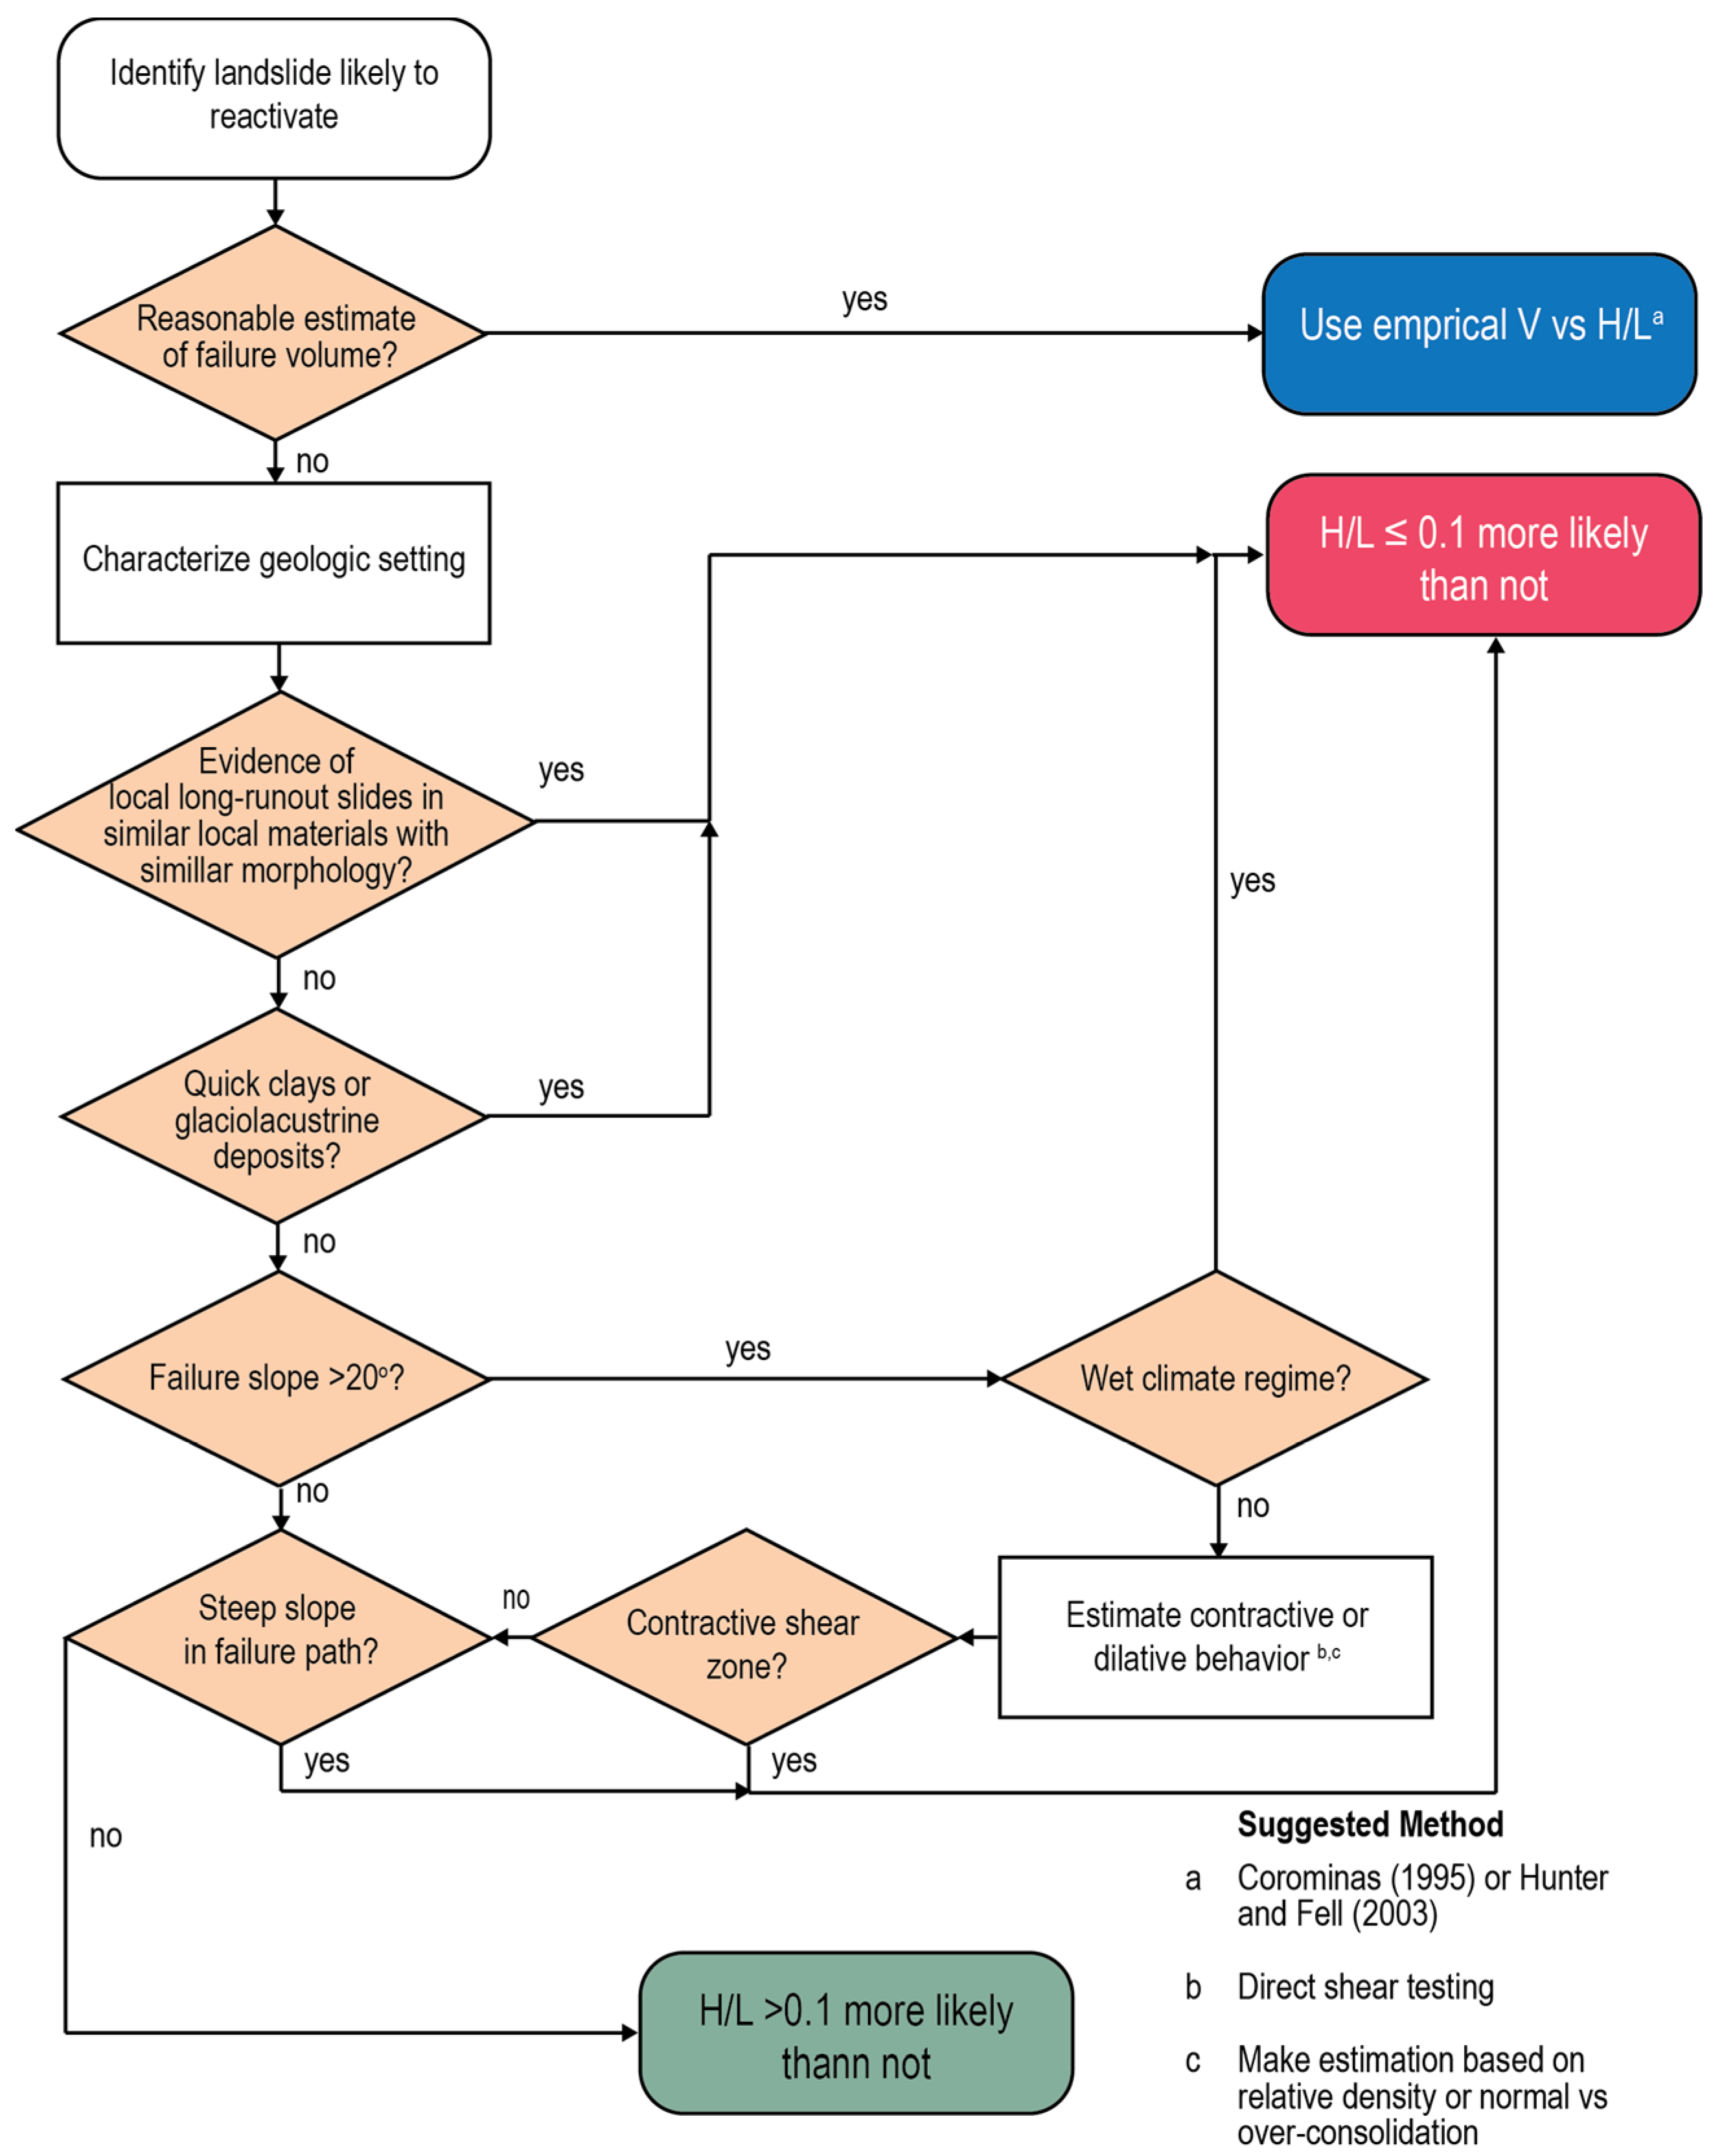
Using the travel angle H/L of 0.1 as a threshold between short and long runout, Scheevel (2017) [
30] developed a decision tree flowchart to predict likely versus unlikely long runout behavior, as shown in
Figure 11. This system requires the estimation or measurement of behavior of previous local landslides, sensitive geology types, steep slopes with steep travel paths, potential for contractive behavior, and wet climate regimes (higher availability of water).
5. Recommendations for Application
No single parameter or method is infallible in predicting whether or not a landslide will runout long distances. However, by integrating several approaches, it is possible to identify the relative likelihood of long runout so that investigation and planning may focus on those locations. The identification process consists of four steps, detailed as follows.
Identify landslides of interest and their boundaries. For locations with previous movement, landslide boundaries can be mapped as polygons in the field, or by using remote sensing methods such as aerial imagery or lidar. For areas where future landslide movement is possible, but no distinct geomorphic features are available to identify specific locations, we recommend developing a local inventory of mapped landslides and using that to identify susceptible future areas. The local inventory will indicate the typical size ranges and runouts of previous events, the geologic units most commonly associated with landslide movement, and the topographic and hydrologic conditions most likely to have slope failures. If there is no indication or a record of local landslides, numerous predictive models have been developed that use logistic regression or machine learning methods to identify susceptible locations. These models should be used with caution because they are generally site-specific and not applicable outside of the geomorphic and geologic setting of their source data. A few meta-analyses summarizing these types of models include Budimir et al. (2015), Panda et al. (2024), Ma et al. (2021), and Tehrani et al. (2022) [
48,
49,
50,
51].
Measure parameters associated with landslide runout. These are identified earlier in this review, and the user should strive to capture as many of them as possible, recognizing that access, time, budget, and other constraints will limit the number and accuracy of the data collected. Parameters should be recorded for each location of possible landslide movement, and for the geologic units within the landslide mass and encompassing the slide plane itself. This would include the following:
- (a)
H/L and L/A1/2 for local landslides;
- (b)
Area and volume for local landslides;
- (c)
Soil density, porosity, critical state density, contraction, or dilation upon shearing;
- (d)
Fine fraction and sand content of soils, coefficient of uniformity (Cu), and liquid limit;
- (e)
Topographic curvature, or an indication of concave, gentle, or convex topography;
- (f)
Distance to water sources like seeps, springs, and saturated areas;
- (g)
Upstream contributing watershed area;
- (h)
Climate regime (how wet is the area?);
- (i)
Mobility index, M, (ratio of field capacity moisture content to moisture content where soil flows in the laboratory);
- (j)
Approximate Mobility Index (AMI) (ratio of the in situ saturated water content divided by the liquid limit);
- (k)
Slope angle near the centroid of the landslide area and slope angles along the potential flow path;
- (l)
Identification of particularly weak geologic materials such as clays and shales, and other materials listed above in
Section 3.6;
- (m)
Indications of previous movement beneath the landslide footprint.
Identify correlations to runout. Apply these parameters to as many potential correlations as possible, including the prediction systems in
Section 4. For each correlation, the user should be able to indicate either the likelihood of long runout as a yes/no criterion, a general correlation to a predictive parameter, or the potential length of runout. In addition, the user should indicate the level of confidence in the result and the level of sufficiency of the evidence. Summarizing this information in a chart format will aid in weighing the evidence in the next step and also in communicating the results of the analysis.
Weigh the evidence. Although there will not typically be enough information to conduct a formal Weight of Evidence assessment (Committee, 2017) [
52], by using multiple lines of inquiry, the user will be able to advance to the intermediate steps (2 through 5 of the 7 steps) of this assessment, as defined by Linkov (2009) [
53]:
- (2)
Best professional judgement: qualitative integration of multiple lines of evidence;
- (3)
Causal criteria: a criteria-based methodology for determining cause and effect relationships;
- (4)
Logic: standardized evaluation of individual lines of evidence based on qualitative logic models;
- (5)
Scoring: quantitative integration of multiple lines of evidence using simple weighting or ranking.
While the goal of the analysis is to reach a quantitative, scored ranking, it is more likely that there will only be enough data to integrate several indicators and perhaps give a qualitative rating to each one based on the confidence in the input data.
6. Conclusions
Predicting landslide runout is a crucial step in hazard identification and management, but it remains difficult to do accurately. First of all, simply measuring runout requires thought to ensure that the data are meaningful. We recommend measuring by two methods. First, the more common measurement of the height drop divided by runout length, H/L, while biased by topography, correlates well to specific predictive parameters. This measurement can be expressed as the “angle of reach” or the “travel angle”. A measurement that better represents the actual runout with less bias is the “runout number”, defined as the runout length divided by the square root of landslide area.
Regional inventories of landslide runout can establish typical runout ranges as a function of the landslide area and are a good starting place to identify the likely possible responses of the landscape during slope movement. This approach is especially effective for analyzing existing landslides, as the size of the event during a potential reactivation will likely be similar and can be compared to the runout of other similarly sized events in the inventory.
A number of parameters that can be measured in the field, laboratory, or with remotely sensed information correlate to landslide runout and can be used to assess the likelihood of long runout events. These include soil density and contractive behavior, topographic curvature, proximity to water sources and upstream watershed areas, previous movement, certain geologic materials, slope angle, and landslide size.
Finally, there are various scoring systems that combine these parameters to indicate the qualitative likelihood for long runout behavior.
Author Contributions
Conceptualization, P.S.; investigation, methodology, formal analysis, validation, visualization, R.L., J.M., C.S. and C.W.; writing—original draft preparation, P.S.; writing—review and editing, R.L., J.M., C.S. and C.W. All authors have read and agreed to the published version of the manuscript.
Funding
Components of research by McKenna were funded by the U.S. Geological Survey. Components of research by Scheevel were funded by the U.S. Forest Service. Components of research by Wallace were funded by the Geological Society of America, Environmental and Engineering Geology Division; the Four Corners Geological Society Foundation; and the Colorado Scientific Society.
Data Availability Statement
No new data were created for this review manuscript.
Conflicts of Interest
Author Russell Lockyear was employed by the company BRS Inc. Engineering. Author Jon McKenna was employed by the company Microseismic Inc. Author Caroline Scheevel was employed by the company BGC Engineering Inc. Author Cory Wallace was employed by the company Gannett Fleming. The remaining author declares that the research was conducted in the absence of any commercial or financial relationships that could be construed as a potential conflict of interest.
References
- Palis, E.; Lebourg, T.; Tric, E.; Malet, J.-P.; Vidal, M. Long-Term Monitoring of a Large Deep-Seated Landslide (La Clapiere, South-East French Alps): Initial Study. Landslides 2017, 14, 155–170. [Google Scholar] [CrossRef]
- White, J.L.; Morgan, M.L.; Berry, K.A. Bulletin 55—The West Salt Creek Landslide: A Catastrophic Rockslide and Rock/Debris Avalanche in Mesa County. Colo. Geol. Surv. Bull. 2015, 55, 45. [Google Scholar]
- McColl, S.T.; Cook, S.J. A Universal Size Classification System for Landslides. Landslides 2024, 21, 111–120. [Google Scholar] [CrossRef]
- Iverson, R.M.; Denlinger, R.P. Flow of Variably Fluidized Granular Masses across Three-dimensional Terrain: 1. Coulomb Mixture Theory. J. Geophys. Res. Solid Earth 2001, 106, 537–552. [Google Scholar] [CrossRef]
- Legros, F. The Mobility of Long-Runout Landslides. Eng. Geol. 2002, 63, 301–331. [Google Scholar] [CrossRef]
- Collins, B.D.; Reid, M.E. Enhanced Landslide Mobility by Basal Liquefaction: The 2014 State Route 530 (Oso), Washington, Landslide. GSA Bull. 2020, 132, 451–476. [Google Scholar] [CrossRef]
- Kent, P.E. The Transport Mechanism in Catastrophic Rock Falls. J. Geol. 1966, 74, 79–83. [Google Scholar] [CrossRef]
- Shreve, R.L. Leakage and Fluidization in Air-Layer Lubricated Avalanches. Geol. Soc. Am. Bull. 1968, 79, 653–658. [Google Scholar] [CrossRef]
- Cruden, D.M.; Varnes, D.J. Landslide Types and Processes. In Landslides: Investigation and Mitigation; Transportation Research Board Special Report 247; National Academy of Sciences: Washington, DC, USA, 1996; pp. 36–75. [Google Scholar]
- Corominas, J. The Angle of Reach as a Mobility Index for Small and Large Landslides. Can. Geotech. J. 1996, 33, 260–271. [Google Scholar] [CrossRef]
- Hunter, G.; Fell, R. Travel Distance Angle for “Rapid” Landslides in Constructed and Natural Soil Slopes. Can. Geotech. J. 2003, 40, 1123–1141. [Google Scholar] [CrossRef]
- Hungr, O.; McDougall, S.; Bovis, M. Entrainment of Material by Debris Flows. In Debris-Flow Hazards and Related Phenomena; Springer: Berlin/Heidelberg, Germany, 2005; pp. 135–158. [Google Scholar] [CrossRef]
- Turner, A.K.; Schuster, R.L. Landslides: Investigation and Mitigation; National Academy Press: Washington, DC, USA, 1996; Available online: http://books.google.com/books?id=VjlSAAAAMAAJ (accessed on 12 November 2024).
- Hsu, K.J. Catastrophic Debris Streams (Sturzstroms) Generated by Rockfalls. Geol. Soc. Am. Bull. 1975, 86, 129–140. [Google Scholar] [CrossRef]
- Roback, K.; Clark, M.K.; West, A.J.; Zekkos, D.; Li, G.; Gallen, S.F.; Chamlagain, D.; Godt, J.W. The Size, Distribution, and Mobility of Landslides Caused by the 2015 Mw7. 8 Gorkha Earthquake, Nepal. Geomorphology 2018, 301, 121–138. [Google Scholar] [CrossRef]
- Wallace, C.S.; Santi, P.M. Runout Number: A New Metric for Landslide Runout Characterization. Environ. Eng. Geosci. 2021, 27, 455–470. [Google Scholar] [CrossRef]
- Wagner, D.L.; Spittler, T.E.; Sydnor, R.H. Landsliding Along the Highway 50 Corridor: Geology and Slope Stability of the American River Canyon Between Riverton and Strawberry, El Dorado County, California. In Proceedings of the Better Highways Through Applied Geology, 53rd Annual Highway Geology Symposium, San Luis Obispo, CA, USA, 13–16 August 2002; pp. 252–263. [Google Scholar]
- Davies, T.R.H. Spreading of Rock Avalanche Debris by Mechanical Fluidization. Rock Mech. 1982, 15, 9–24. [Google Scholar] [CrossRef]
- Prochaska, A.; Santi, P.; Higgins, J.; Cannon, S. Debris-flow runout predictions based on the average channel slope (ACS). Eng. Geol. 2008, 98, 29–40. [Google Scholar] [CrossRef]
- Taylor, F.E.; Malamud, B.D.; Witt, A.; Guzzetti, F. Landslide Shape, Ellipticity and Length-to-width Ratios. Earth Surf. Process. Landf. 2018, 43, 3164–3189. [Google Scholar] [CrossRef]
- Nicoletti, P.G.; Sorriso-Valvo, M. Geomorphic Controls of the Shape and Mobility of Rock Avalanches. Geol. Soc. Am. Bull. 1991, 103, 1365–1373. [Google Scholar] [CrossRef]
- Lockyear, R.A. Identification of Parameters for Predicting Long-Runout Landslides in the Western United States. Master’s Thesis, Colorado School of Mines, Golden, CO, USA, 2018. [Google Scholar]
- Scheidegger, A.E. On the Prediction of the Reach and Velocity of Catastrophic Landslides. Rock Mech. 1973, 5, 231–236. [Google Scholar] [CrossRef]
- Wallace, C.S.; Santi, P.M.; Walton, G. Scoring System to Predict Landslide Runout in the Pacific Northwest, USA. Landslides 2022, 19, 1449–1461. [Google Scholar] [CrossRef]
- Guo, D.; Hamada, M.; He, C.; Wang, Y.; Zou, Y. An Empirical Model for Landslide Travel Distance Prediction in Wenchuan Earthquake Area. Landslides 2014, 11, 281–291. [Google Scholar] [CrossRef]
- Parez, S.; Aharonov, E. Long Runout Landslides: A Solution from Granular Mechanics. Front. Phys. 2015, 3, 80. [Google Scholar] [CrossRef]
- Zou, Z.; Xiong, C.; Tang, H.; Criss, R.E.; Su, A.; Liu, X. Prediction of Landslide Runout Based on Influencing Factor Analysis. Environ. Earth Sci. 2017, 76, 723. [Google Scholar] [CrossRef]
- Klar, A.; Aharonov, E.; Kalderon-Asael, B.; Katz, O. Analytical and Observational Relations between Landslide Volume and Surface Area. J. Geophys. Res. Earth Surf. 2011, 116, 39–50. [Google Scholar] [CrossRef]
- Scheevel, C.; Santi, P.; Emmanuel, K. Stability and Runout Analysis of the Cook Lake Landslide, Wyoming. In Proceedings of the 3rd North American Symposium on Landslides, Roanoke, VA, USA, 4–8 June 2017; pp. 645–655. [Google Scholar]
- Scheevel, C.R. Predicting Landslide Stability, Runout, and Failure Velocity at Cook Lake Landslide, Wyoming; Colorado School of Mines: Gloden, CO, USA, 2017. [Google Scholar]
- Iverson, R.M.; Reid, M.E.; Iverson, N.R.; LaHusen, R.G.; Logan, M.; Mann, J.E.; Brien, D.L. Acute Sensitivity of Landslide Rates to Initial Soil Porosity. Science 2000, 290, 513–516. [Google Scholar] [CrossRef]
- Schofield, A.N.; Wroth, P. Critical State Soil Mechanics; McGraw-hill: London, UK, 1968; Volume 310. [Google Scholar]
- McKenna, J.P.; Santi, P.M.; Amblard, X.; Negri, J. Effects of Soil-Engineering Properties on the Failure Mode of Shallow Landslides. Landslides 2012, 9, 215–228. [Google Scholar] [CrossRef]
- Gabet, E.J.; Mudd, S.M. The Mobilization of Debris Flows from Shallow Landslides. Geomorphology 2006, 74, 207–218. [Google Scholar] [CrossRef]
- Moriwaki, H.; Inokuchi, T.; Hattanji, T.; Sassa, K.; Ochiai, H.; Wang, G. Failure Processes in a Full-Scale Landslide Experiment Using a Rainfall Simulator. Landslides 2004, 1, 277–288. [Google Scholar] [CrossRef]
- Hutchinson, J.N.; Bhandari, R.K. Undrained Loading, a Fundamental Mechanism of Mudflows and Other Mass Movements. Geotechnique 1971, 21, 353–358. [Google Scholar] [CrossRef]
- Stark, T.D.; Baghdady, A.K.; Hungr, O.; Aaron, J. Case Study: Oso, Washington, Landslide of March 22, 2014—Material Properties and Failure Mechanism. J. Geotech. Geoenvironmental Eng. 2017, 143, 5017001. [Google Scholar] [CrossRef]
- McKenna, J.P. Transition from Slide to Flow: Factors Controlling Failure Mode and Travel Distance of Shallow Landslides. Ph.D. Thesis, Colorado School of Mines, Golden, CO, USA, 2011. [Google Scholar]
- Johnson, A.M.; Rodine, J. Debris Flow. In Slope Instability; Wiley: New York, NY, USA, 1984; pp. 257–361. [Google Scholar]
- Bordoni, M.; Persichillo, M.G.; Meisina, C.; Crema, S.; Cavalli, M.; Bartelletti, C.; Galanti, Y.; Barsanti, M.; Giannecchini, R.; D’Amato Avanzi, G. Estimation of the Susceptibility of a Road Network to Shallow Landslides with the Integration of the Sediment Connectivity. Nat. Hazards Earth Syst. Sci. 2018, 18, 1735–1758. [Google Scholar] [CrossRef]
- de Oliveira, G.G.; Ruiz, L.F.C.; Guasselli, L.A.; Haetinger, C. Random Forest and Artificial Neural Networks in Landslide Susceptibility Modeling: A Case Study of the Fão River Basin, Southern Brazil. Nat. Hazards 2019, 99, 1049–1073. [Google Scholar] [CrossRef]
- Pham, B.T.; Nguyen-Thoi, T.; Qi, C.; Van Phong, T.; Dou, J.; Ho, L.S.; Van Le, H.; Prakash, I. Coupling RBF Neural Network with Ensemble Learning Techniques for Landslide Susceptibility Mapping. CATENA 2020, 195, 104805. [Google Scholar] [CrossRef]
- Giarola, A.; Meisina, C.; Tarolli, P.; Zucca, F.; Galve, J.P.; Bordoni, M. A Data-Driven Method for the Estimation of Shallow Landslide Runout. CATENA 2024, 234, 107573. [Google Scholar] [CrossRef]
- Iverson, R.M.; George, D.L.; Allstadt, K.; Reid, M.E.; Collins, B.D.; Vallance, J.W.; Schilling, S.P.; Godt, J.W.; Cannon, C.M.; Magirl, C.S.; et al. Landslide Mobility and Hazards: Implications of the 2014 Oso Disaster. Earth Planet. Sci. Lett. 2015, 412, 197–208. [Google Scholar] [CrossRef]
- Hungr, O.; Leroueil, S.; Picarelli, L. The Varnes Classification of Landslide Types, an Update. Landslides 2014, 11, 167–194. [Google Scholar] [CrossRef]
- Wang, G.; Sassa, K. Pore-Pressure Generation and Movement of Rainfall-Induced Landslides: Effects of Grain Size and Fine-Particle Content. Eng. Geol. 2003, 69, 109–125. [Google Scholar] [CrossRef]
- Ellen, S.D.; Fleming, R.W. Mobilization of Debris Flows from Soil Slips, San Francisco Bay Region, California. Rev. Eng. Geol. 1987, 7, 31–40. [Google Scholar]
- Budimir, M.E.A.; Atkinson, P.M.; Lewis, H.G. A Systematic Review of Landslide Probability Mapping Using Logistic Regression. Landslides 2015, 12, 419–436. [Google Scholar] [CrossRef]
- Panda, G.K.; Shaw, R.; Pal, S.C.; Chatterjee, U.; Saha, A. Landslide: Susceptibility, Risk Assessment and Sustainability; Springer: Cham, Switzerland, 2024. [Google Scholar]
- Ma, Z.; Mei, G.; Piccialli, F. Machine Learning for Landslides Prevention: A Survey. Neural Comput. Appl. 2021, 33, 10881–10907. [Google Scholar] [CrossRef]
- Tehrani, F.S.; Calvello, M.; Liu, Z.; Zhang, L.; Lacasse, S. Machine Learning and Landslide Studies: Recent Advances and Applications. Nat. Hazards 2022, 114, 1197–1245. [Google Scholar] [CrossRef]
- Committee, E.S.; Hardy, A.; Benford, D.; Halldorsson, T.; Jeger, M.J.; Knutsen, H.K.; More, S.; Naegeli, H.; Noteborn, H.; Ockleford, C.; et al. Guidance on the Use of the Weight of Evidence Approach in Scientific Assessments. EFSA J. 2017, 15, e04971. [Google Scholar] [CrossRef]
- Linkov, I.; Loney, D.; Cormier, S.; Satterstrom, F.K.; Bridges, T. Weight-of-Evidence Evaluation in Environmental Assessment: Review of Qualitative and Quantitative Approaches. Sci. Total Environ. 2009, 407, 5199–5205. [Google Scholar] [CrossRef]
| Disclaimer/Publisher’s Note: The statements, opinions and data contained in all publications are solely those of the individual author(s) and contributor(s) and not of MDPI and/or the editor(s). MDPI and/or the editor(s) disclaim responsibility for any injury to people or property resulting from any ideas, methods, instructions or products referred to in the content. |
© 2025 by the authors. Licensee MDPI, Basel, Switzerland. This article is an open access article distributed under the terms and conditions of the Creative Commons Attribution (CC BY) license (https://creativecommons.org/licenses/by/4.0/).


