Review

Quantifiable Elements of Seismic Image Fidelity: A Tutorial Review

1
Department of Earth & Atmospheric Sciences, University of Houston, Houston, TX 77204, USA
2
College of Marine Geosciences, Ocean University of China, Qingdao 266100, China
3
School of Geosciences, Sarkeys Energy Center, The University of Oklahoma, Norman, OK 73019, USA
4
School of Geoscience and Technology, Southwest Petroleum University, Chengdu 610500, China
5
Department of Geosciences and Geography, University of Helsinki, PL 68, 00014 Helsinki, Finland
*
Author to whom correspondence should be addressed.
Geosciences 2025, 15(12), 445; https://doi.org/10.3390/geosciences15120445 (registering DOI)
Submission received: 28 September 2025 / Revised: 4 November 2025 / Accepted: 21 November 2025 / Published: 23 November 2025
(This article belongs to the Section Geophysics)

Abstract

The interpretability of seismic images of Earth’s interior properties relies on the quantifiable level of image fidelity. We recommend evaluating seismic image fidelity via three quantifiable elements: image resolution, artifact level, and position accuracy. Though the resolution of seismic images is routinely assessed, it is difficult to detect deceiving image artifacts or evaluate the accuracy of image position beyond the drilling limit. Many image artifacts, such as fake or distorted features, are generated by mistaking the signals in the imaging process or due to limitations in seismic illumination and imaging methods. Most image position errors are produced by erroneous velocity models used in seismic imaging. To ensure seismic image fidelity, we should establish practical evaluation standards during the processes of making and interpreting seismic images. For mitigating image artifacts and position errors, we should analyze their causes and follow practical rules, such as “from known to unknown”, in evaluating and interpreting seismic images.

1. Introduction

Seismic images are visual representations of the Earth’s interior properties, such as variations in seismic velocity and density [1]. Before using seismic imagery to infer subsurface properties, we must conduct the quality control (QC) process to ensure sufficient image fidelity. Here, we define seismic image fidelity as how accurately the features in a seismic image have been mapped at correct positions with accurate shapes and relative amplitudes. Traditionally, the QC of seismic images in both exploration and deep earth seismology has focused on quantifying the resolution of field seismic data (e.g., [2,3,4,5,6,7,8]). Constrained by wavefield expansion and attenuation in earth media, the resolution scale of seismic images decreases with increasing depth and source to receiver distance. It is about meter scale near surface (e.g., [9]), tens to hundreds of meters in shallow crust (e.g., [7]), and from several to hundreds of kilometers in deep crust, mantle, and core (e.g., [10,11,12,13,14,15,16]).
To quantify seismic image fidelity, we should understand the general principles of seismic imaging behind various types of methods and waves. For example, seismic tomography inverts for seismic velocities using body waves (e.g., [17,18,19]) and surface waves (e.g., [20,21,22]); seismic migration maps reflectivity images using reflected waves [1,23,24,25,26]; and receiver functions construct major seismic discontinuities using converted waves (e.g., [27,28,29]). Most near-surface applications of seismic imaging use refracted and surface waves via modeling and inversion techniques (e.g., [9,30]). A majority of reflection surveys use primary reflections via velocity model building (VMB), seismic migration, and full waveform inversion (FWI) (e.g., [1,7,31,32]). In contrast, seismic studies of crustal and mantle targets are based on many types of body waves and surface waves via various imaging techniques (e.g., [33,34]).
It is challenging for seismic imaging to achieve high-fidelity images of subsurface features due to limitations in recorded data quality and imaging methodology. Fundamentally, seismic imaging is a remote sensing of subsurface because most recording stations are located along ground surface or in limited boreholes. Field seismic data have inherent uncertainties due to insufficiency in signal-to-noise ratio (SNR) and seismic illumination over the subsurface. Overall, the fidelity of seismic images is impacted by data SNR and illumination limitations of the acquisition and imaging processes. Though we might be able to fully quantify the image fidelity at places with coring samples or well logs, the overwhelming majority of seismic images are from places without drilling records, where we can only assess the relative image fidelity. Numerous misinterpretations due to using erroneous seismic images (e.g., [35,36]) underscore the need for improving the QC of seismic images.
The purpose of this tutorial review is to advocate for the adequate use of seismic images by raising awareness of seismic image fidelity. Our intended readers are early-career geoscientists using seismic images and seismic interpreters in exploration and crustal geophysics. Here, we begin by using tutorial examples to review three quantifiable elements of seismic image fidelity, including resolution, artifacts, and position accuracy, and highlight the importance of QC of artifacts and position accuracy whenever reading seismic images. Taking examples from both exploration and crustal seismology, we then analyze major challenges in quantifying seismic image fidelity. Furthermore, we offer some practical strategies for seismic image QC.

2. Three Quantifiable Elements of Seismic Image Fidelity

Based on studying ways of QC seismic images (e.g., [35,36,37,38]), we examine three quantifiable elements of seismic image fidelity in this section: resolution, artifacts, and position accuracy.

2.1. Image Resolution and Influencing Factors

As a well-known topic in seismic data processing (e.g., [6,7,39,40]), image resolution defines the level of detail in seismic images, such as the minimum detectable distance between two features that are close together [3]. The resolution of seismic images is often insufficient in field applications. This section starts by introducing several concepts on seismic resolution, then explains the following factors influencing image resolution:
  • Data frequency content;
  • Seismic illumination of the acquisition setup;
  • Methodology of data processing and imaging.

2.1.1. Resolution of Seismic Images

There are several classic concepts on the resolution of seismic images [1]. Vertical resolution is the resolving level along the direction of seismic wave propagation, such as along the vertical axis on reflection seismic profiles, while horizontal resolution defines the resolving level perpendicular to the direction of wave propagation. A general concept of wavefield resolution as a function of frequency is illustrated in Figure 1 from Pratt [41], showing monochromatic wavefields in constant velocity from a source and a receiver, respectively, in Figure 1a,b. A stacking of the source and receiver wavefields over the model space produces the superposed wavefield in Figure 1c, which shows a series of elliptical wavefronts. These elliptical wavefronts are Fresnel zones resulting from the constructive and destructive interferences between the source and receiver wavefields. In this case, horizontal resolution is the width (or the diameter in 3D case) of the first Fresnel zone portrayed by the green dashed ellipse in Figure 1c.
Regarding vertical resolution, one definition is the ability to distinguish two points near each other on a seismic trace (e.g., [3]), based on some measures about the resolvable limit of waveforms, especially the Rayleigh criterion. Vertical resolution is taken to quantify a thin-bed thickness [3], or the uncertainty of traveltime picks (e.g., [42]). When the direction of wave propagation deviates from vertical, the concepts of vertical resolution and horizontal resolution are still applicable, as shown in Figure 1c.

2.1.2. The Influence on Image Resolution by Data Frequency Content

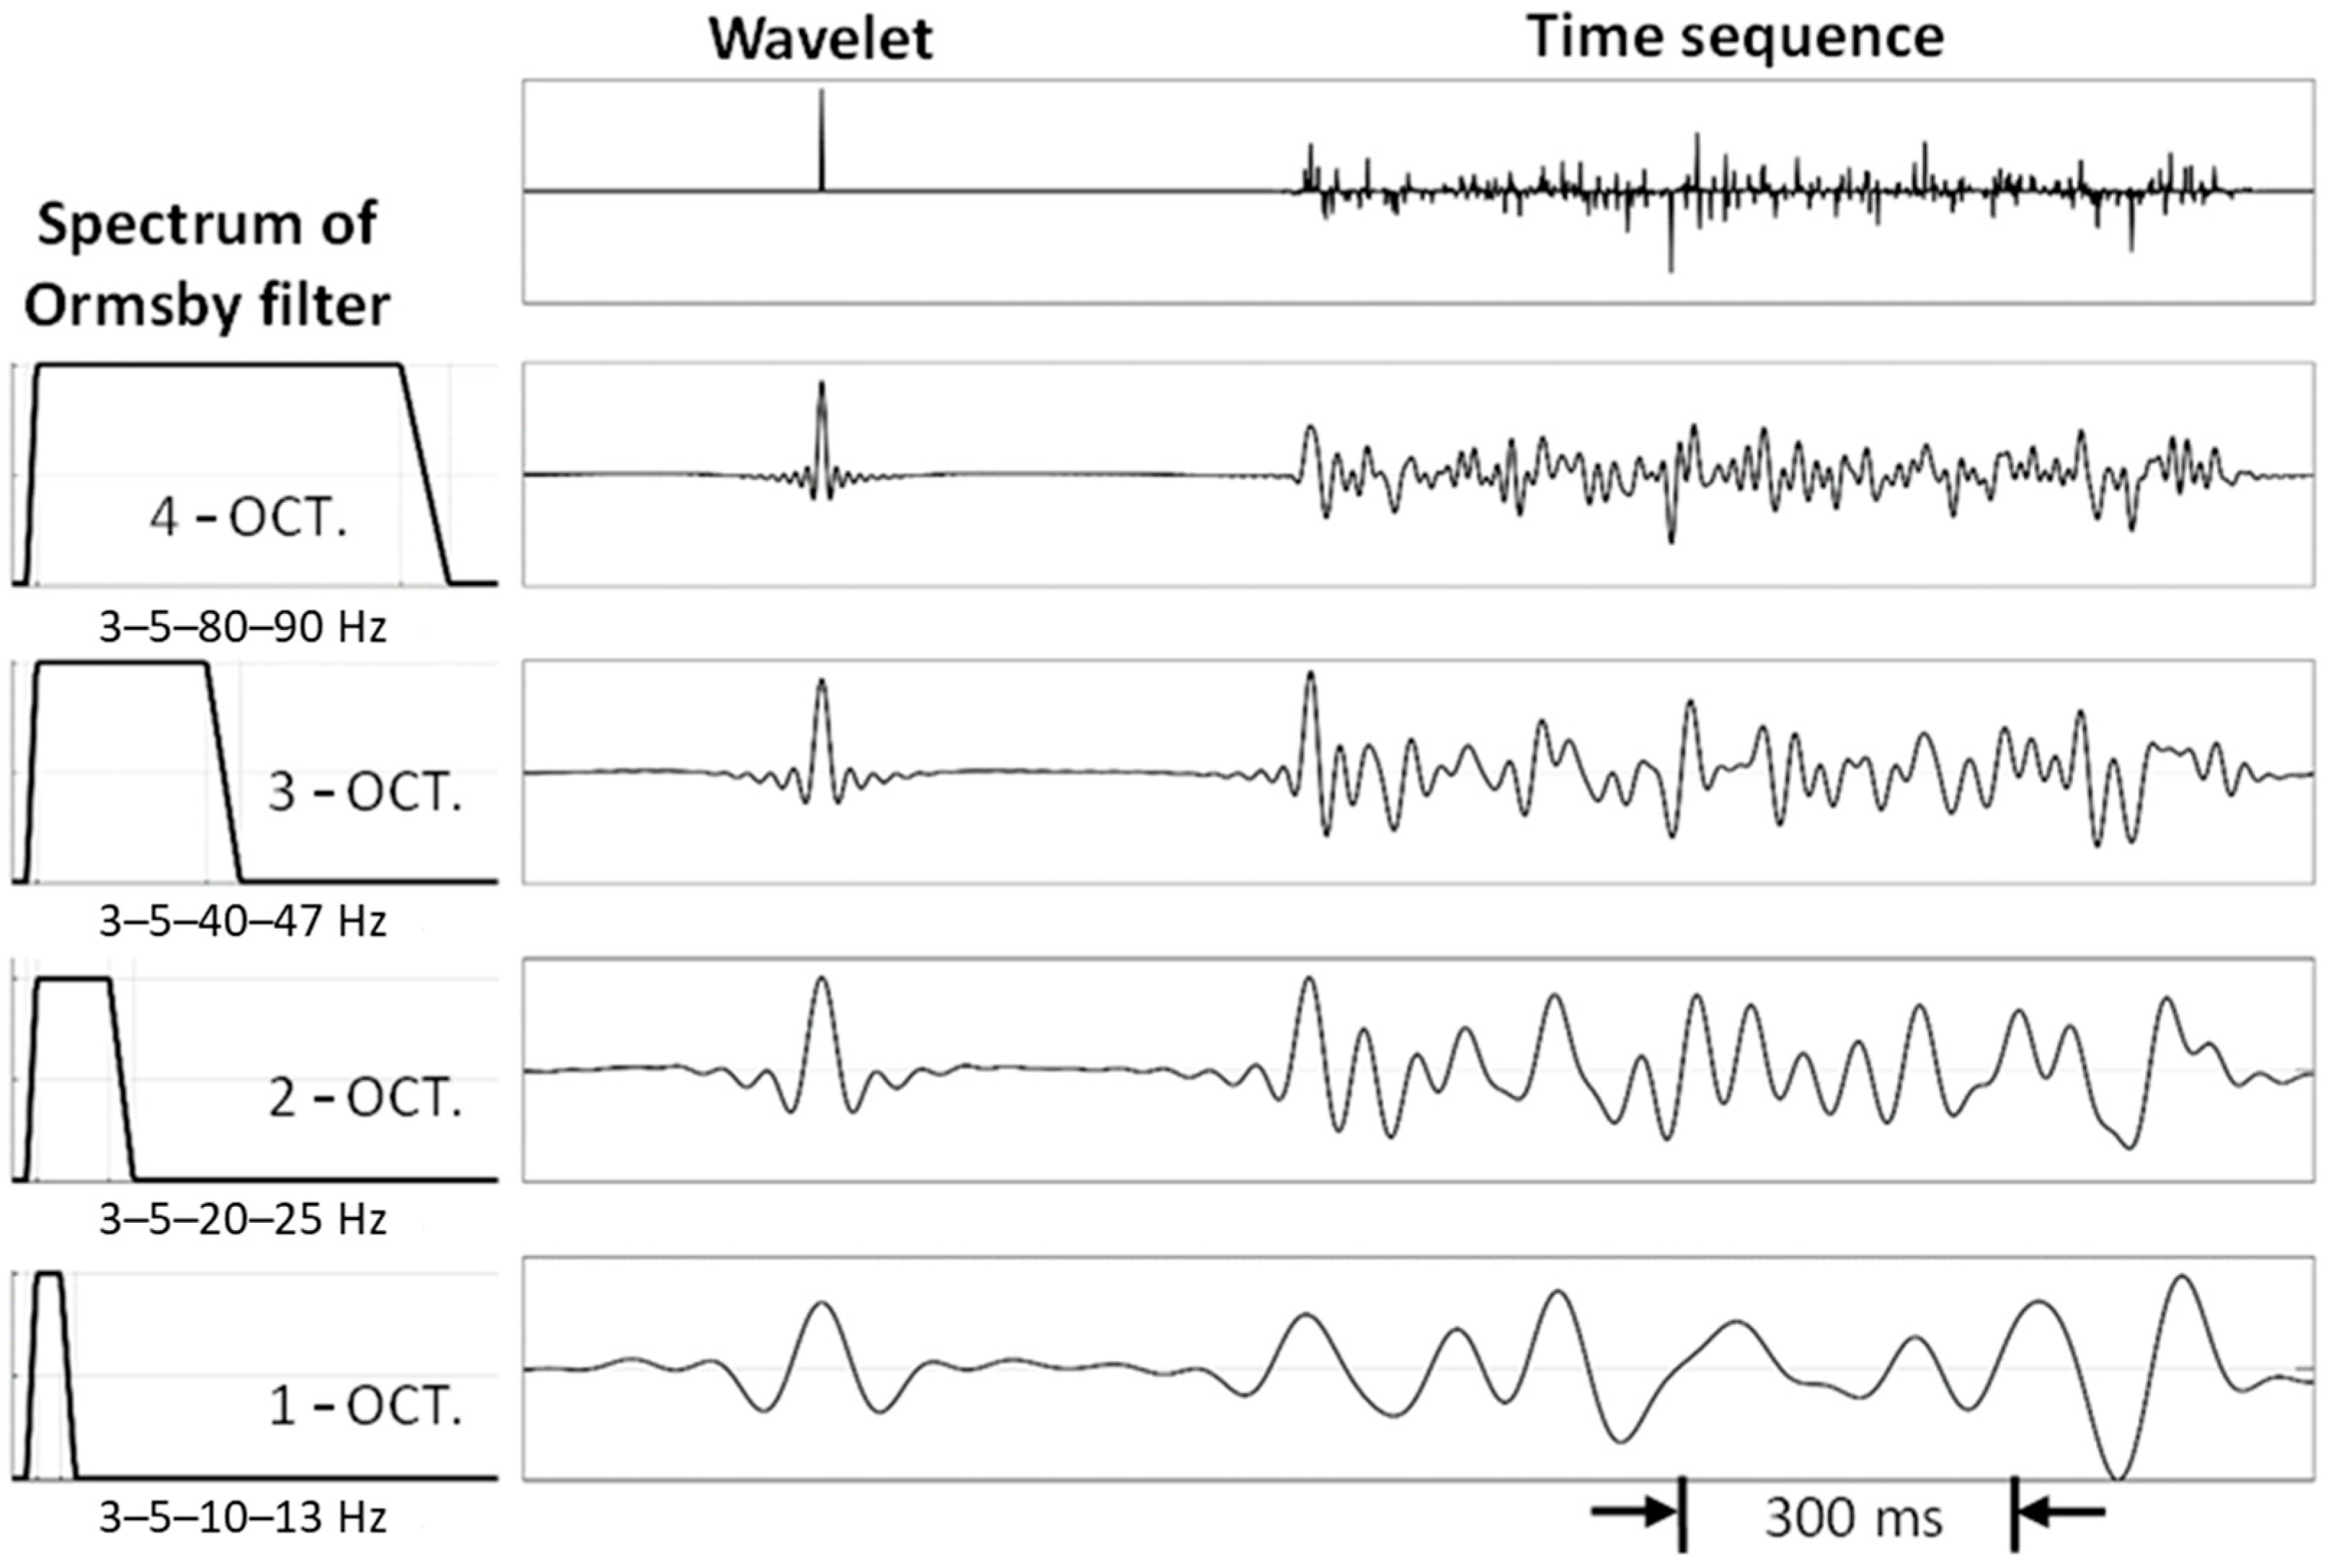
The frequency content of seismic data dictates the resolution of seismic images in two aspects. Firstly, the central frequency of seismic waveforms defines the dominant wavelength of seismic wavelet, controlling the uncertainty level in picking traveltimes of phase arrivals or matching waveforms. Secondly, the frequency bandwidth of seismic data controls time-domain resolution, or how well we can distinguish neighboring events such as two adjacent reflectors. The frequency bandwidth of a data trace is quantified by the ratio of the high-effective frequency (high-corner frequency) to the low-effective frequency (low-corner frequency). The bandwidth can be easily measured with an Ormsby filter which has a trapezoid spectrum like those shown in Figure 2.
Following [43], the top row of Figure 2 shows an impulse wavelet and a reflectivity function, over four band-limited traces after Ormsby filtering. All filtered wavelets have sidelobes of wiggles due to limited bandwidth. While the impulse wavelet has only positive amplitude, all filtered wavelets have positive and negative wiggles with a zero-mean amplitude. Filtering out low frequencies is a demeaning process. As the frequency bandwidth of the filtered wavelets in Figure 2 decreases from 4 octaves to 1 octave, the sidelobes of the wavelet increase, raising the overlapping level of neighboring reflectors. Hence, narrowing the frequency bandwidth means increasing the level of overlapping neighboring reflectors. Conversely, the broader the frequency bandwidth, the higher the time-domain resolution due to less energy in the sidelobes of all reflectors.
Since a typical reflection profile contains tens of reflectors, insufficient frequency bandwidth will produce ringing artifacts around the dominant frequency. Hence, a minimum level of frequency bandwidth is required for distinguishing neighboring reflectors. A rule of thumb in exploration seismology is to require over 2 octaves in signal bandwidth, or the ratio of the high-corner frequency over the low-corner frequency must be over 4 [1]. As the cause of certain image artifacts, a very narrow signal frequency bandwidth would make the reflection data uninterpretable [1,39].
Due to the attenuative nature of earth media, high-frequency components of seismic waves are attenuated much more quickly than low-frequency components during wave propagation, especially in highly attenuated media such as poorly consolidated sediments. In a constant Q model, the rate of intrinsic seismic attenuation per wavelength in rocks is independent of frequency [44]. In exploration seismology, the rule of thumb for sand and shale strata is that the SNR of seismic data becomes insufficient after one to two hundred wavelengths of wave propagation. Due to seismic attenuation, both the central frequency and the frequency bandwidth of seismic signals decrease with increasing traveling distance or time. Hence, the overall resolution of seismic images decreases for deeper and farther targets.

2.1.3. The Influence on Image Resolution by Seismic Illumination

Seismic illumination at a spatial location is measured in two aspects: the hit count and the angular range of traversing seismic waves [1]. Other names of seismic illumination include data coverage, spatial illumination, waveform illumination, and fold for reflection images. Seismic illumination impacts both the levels of resolution and distortional image artifacts because each seismic image is the product of mapping the traversing seismic waves over the image area. Either insufficient or uneven seismic illumination could generate image artifacts, such as distortions of imaged features.
Spatial illumination is a property of multiple seismic traces with respect to each spatial point in the imaging space. The level of seismic illumination depends on the distributions of sources and receivers with respect to the imaging targets, data frequency bandwidth, and velocity variations. Like a ray curving through a lens, seismic wavepaths bend in the presence of velocity variation. For instance, seismic illumination beneath salt bodies is deflected by the high velocity contrast between each salt body and surrounding sediments.
Analysis of seismic illumination can be conducted quantitatively, such as the work by Xie et al. [45] using localized energy fluxes for the source and receiver wavefields. In high-frequency seismic studies, when seismic waves are approximated by seismic rays (e.g., [42,46]), seismic illumination is simplified into raypath coverage, the number and angular variation in seismic raypaths traversing through each target location. Analysis of seismic illumination could reveal the potential of certain image artifacts, such as illumination shadows, which are footprint artifacts due to uneven and insufficient ray coverage or inadequate processing [1].
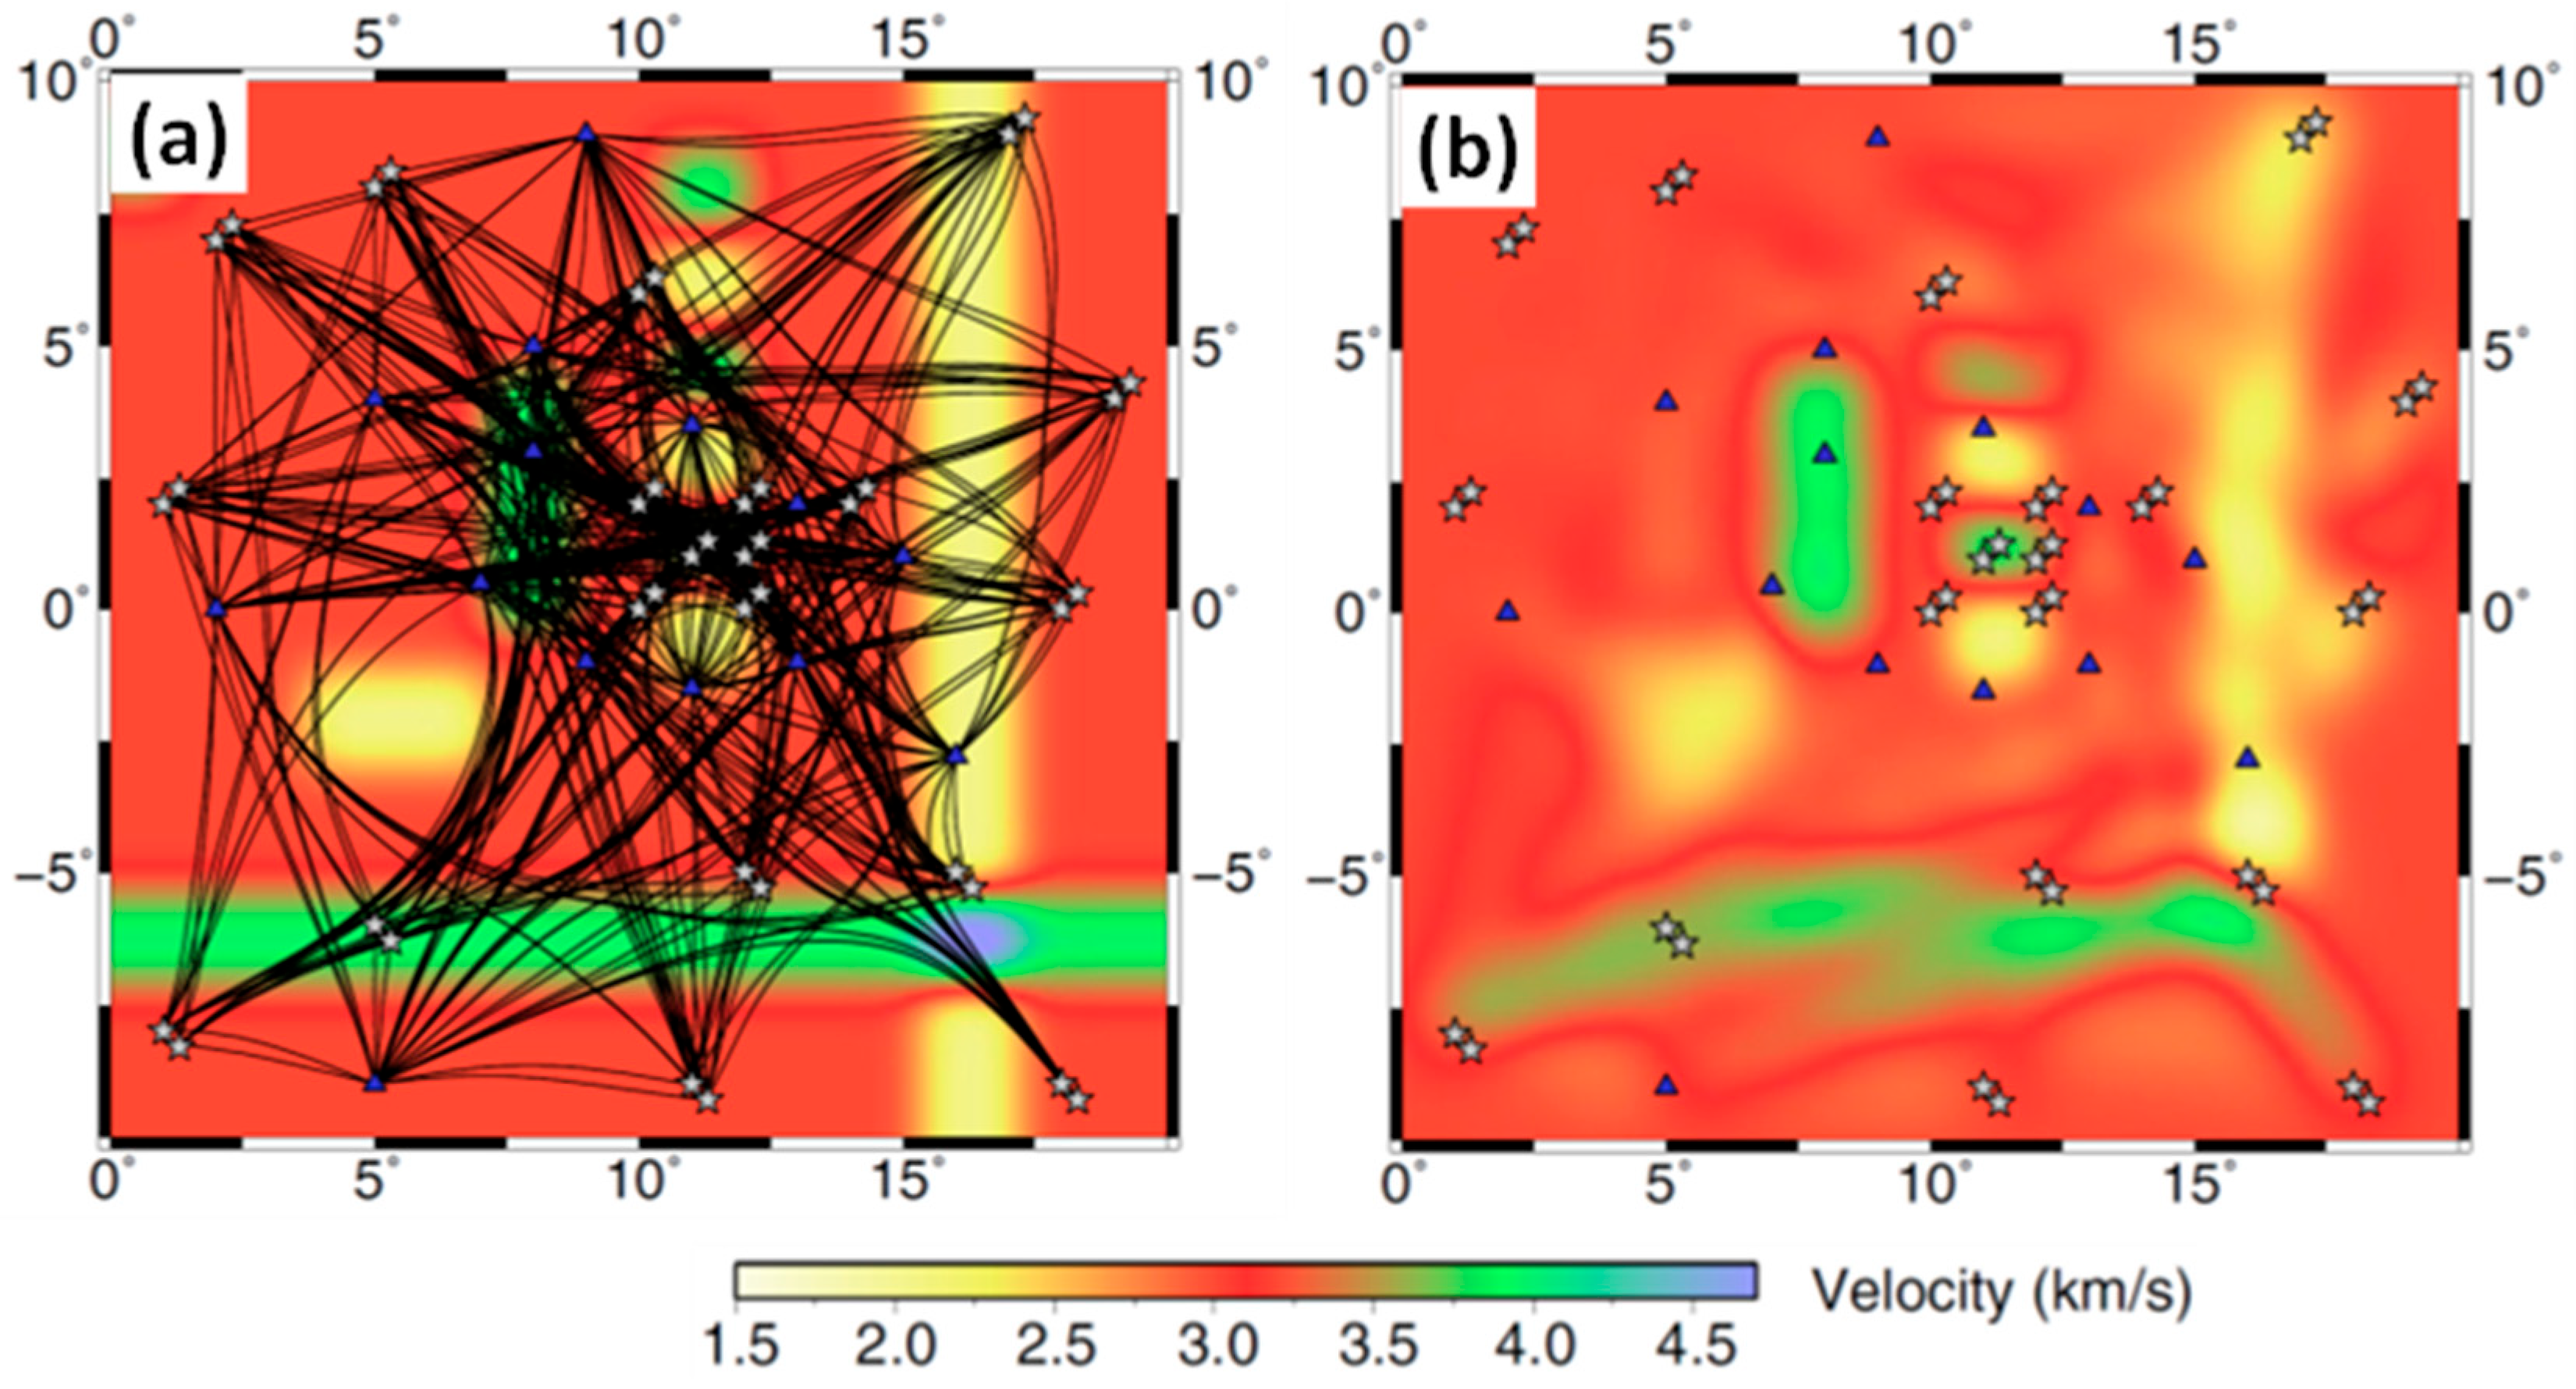
Using seismic illumination analysis to identify the artifacts in seismic tomography is widely performed in exploration and crustal seismology. A common artifact in seismic tomography is along-raypath smearing. As a rule, any ray-like tomographic anomaly could be along-raypath smearing if it resembles the pattern of the raypaths [35]. Figure 3 shows an example of synthetic reconstruction test using 560 first arrival traveltimes from 40 sources to 14 receivers [47]. Figure 3a shows the tendency of raypaths to bend away from slow velocity anomalies and bend toward fast velocity anomalies. Compared with the true velocity model and raypaths shown in Figure 3a, along-raypath smearing appears in the reconstructed velocity model in Figure 3b, particularly at those places that lack crisscrossing raypaths. As seen in this example, understanding image artifacts is required for all interpreters of seismic images. Similarly, unbalanced/insufficient illumination will bias the inverted velocity model using other inversion methods.
A quantitative QC of image resolution and artifacts requires quantifying image similarity, like that between the true and reconstructed images in Figure 3. One straightforward measurement is the correlation coefficient between the pixel values of two local images at the same positions [48]. Statistical matrices on image similarity (e.g., [49,50,51]) include mean squared error (MSE), by measuring the mean difference between the pixel values; structural similarity index measure (SSIM), by comparing the structural content; feature similarity indexing measure (FSIM), focusing on key visual features; and structural similarity model (SDSS) mimicking the human vision system.

2.1.4. The Influence on Image Resolution by Processing and Imaging Methods

As the process of transferring seismic records into subsurface images, seismic imaging methods directly impact the image fidelity. Typically, a seismic imaging method uses a particular type of data to produce the image. For instance, seismic migration focuses on mapping short-wavelength seismic reflectivity for petroleum exploration and crustal studies (e.g., [24,52,53]); receiver functions focus on mapping long-wavelength seismic discontinuities in the crust and mantle (e.g., [27,28,54]); and seismic tomography aims at mapping seismic velocities in the crust and mantle (e.g., [16]). The resolution level in the seismic image produced by an imaging method is assessable for each given set of seismic data and associated illumination.
To map a particular target in the Earth’s interior, we should select suitable data and methods aiming at sufficient image fidelity. In the planning stage of a seismic imaging project, trial resolution tests are conducted, as in Figure 3, to assess the feasibility of the given data and methods. For the same dataset, the resolution level can still vary for different targets, signals, and methods. The more we know about the imaging targets, the better chance for selecting the most suitable signal and method for achieving the optimal seismic images.
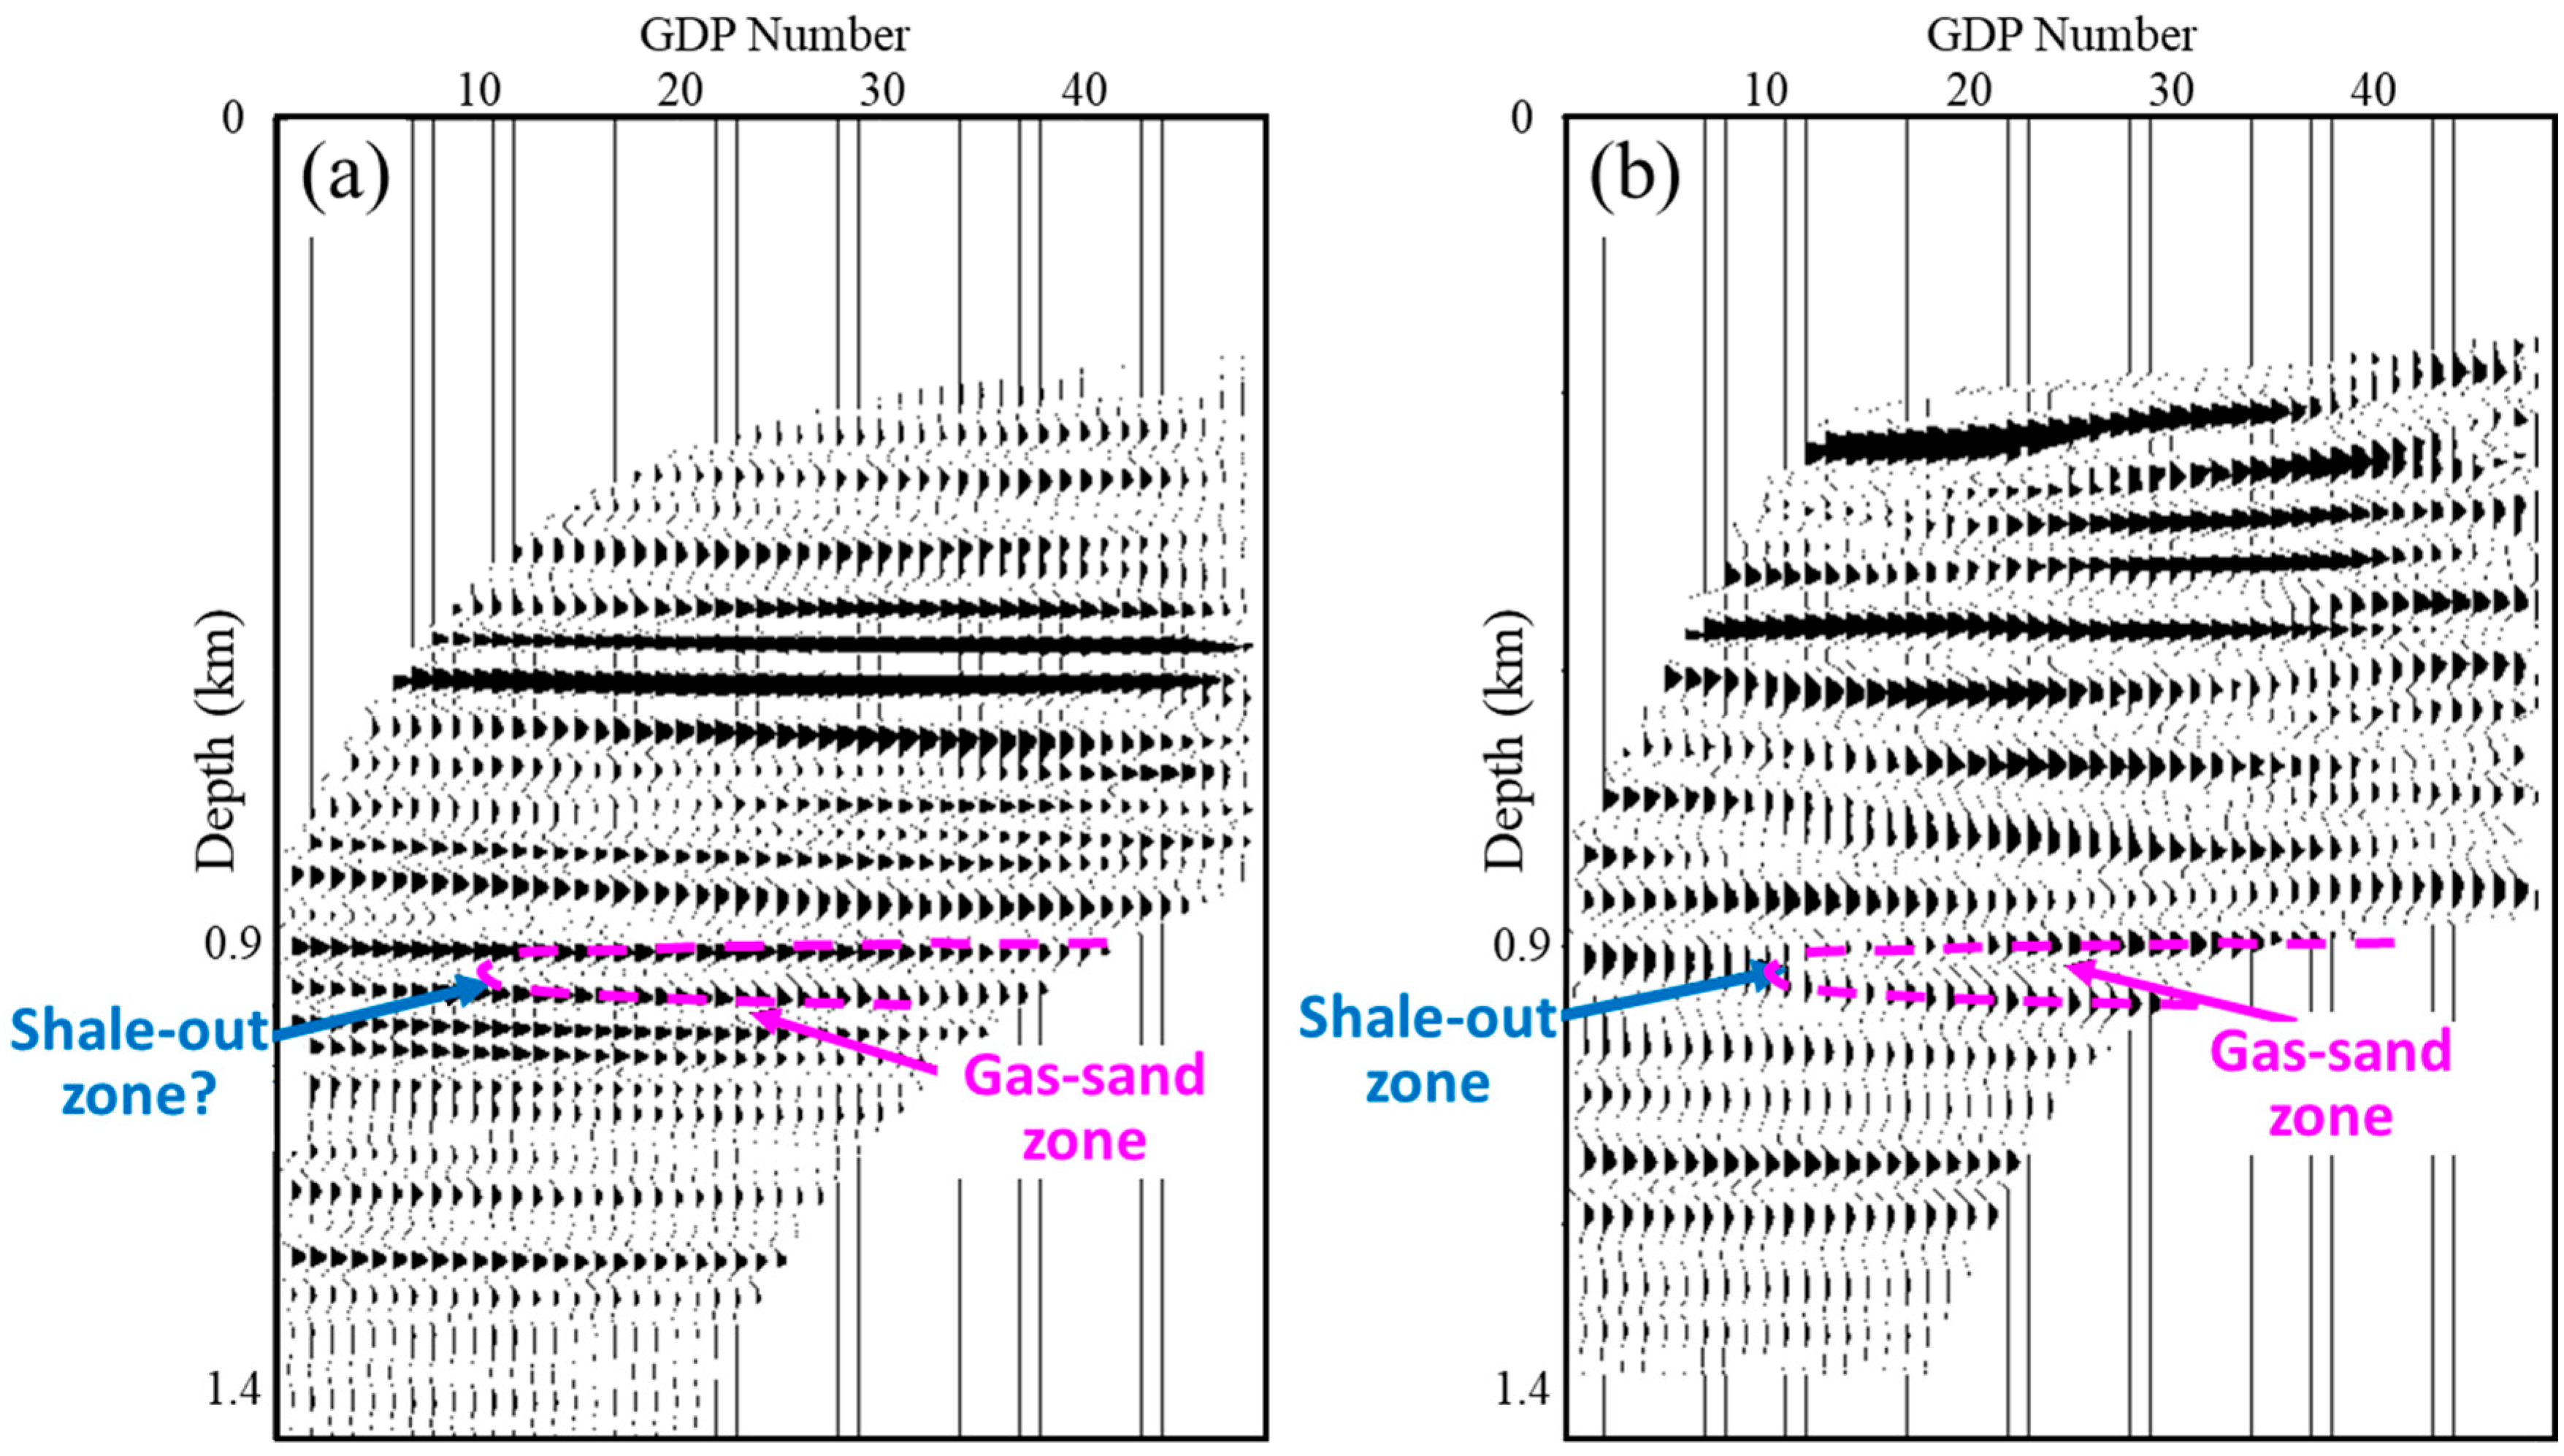
Figure 4 compares two vertical seismic profile (VSP) images produced by two different migration methods [55]. This VSP survey aims at identifying the shale-out zone that seals off the gas-sand zone of a sand layer on the right side of the profile. Although the first image by conventional migration shows higher resolution than the second image by reverse time migration (RTM), we cannot see the pinchout of the gas-sand zone from the first image. In contrast, we can clearly see the pinchout on the RTM image which was produced using both up-going and down-going reflections. This comparison demonstrates that the best resolution alone may not warrant the fidelity of seismic image.

2.1.5. Quantification of Seismic Image Resolution

Since resolution is the most quantifiable element of seismic image fidelity, it has many ways of quantification (e.g., [2,3,4,5,6,7,8]). In terms of the vertical resolution, for example, the minimum detectable distance between two neighboring reflections on a seismic trace is quantified by Widess [3] as a quarter of the dominant wavelength of the reflection waves. Another classic quantification of seismic image resolution follows a classic view that each seismic image is a superposition of impulse responses that each can be approximated as a Ricker wavelet [2]; then we can quantify the resolution by the main-lobe width of the Ricker wavelet.
We can quantify the dependency of imaging resolution on the given survey geometry, imaging method, and targets via numerical reconstruction exercises (e.g., [19,47,56]). Such exercises take the modeled data generated in synthetic models to image the targets, then quantify the resolution level of the reconstructed images with respect to changes in seismic illumination, target complexity, and imaging methodology. As shown in Figure 3, such reconstruction exercises are very effective in revealing the image artifacts due to poor seismic illumination. One variant of reconstruction exercise takes impulsive synthetic models for verifying the impulse responses of the imaging methods (e.g., [39,57,58]). The reconstructed images could reveal the limitations of the imaging algorithms, which is useful for improving them [59].
Another variant of the reconstruction exercise is the checkerboard resolution tests, which are commonly used to assess the resolution of seismic tomography. Figure 5 shows an example for QC cross-well traveltime tomography [56]. A checkerboard model composes regularly spaced impulsive velocity anomalies of alternating polarities. Typically, the resolution of a given dataset is coarser than the model grid size. In this figure, the inverted model reveals a moderate level of resolution and some smearing artifacts along raypaths.
A problem in practicing the checkerboard resolution tests in many published studies is the assumption that the reference velocity model is correct. In mapping the crustal and deep Earth targets, however, it is difficult to obtain a sufficiently accurate reference velocity model (e.g., [11]). Due to the dependency of seismic wavepaths on velocity variation, an erroneous reference velocity model not only hinders the success rate of tomographic inversion but also leads to the demean artifact which is illustrated in Section 2.2.3. It is important to assess the uncertainty in the reference velocity model when conducting a reconstruction exercise for QC seismic images.

2.2. Artifacts in Seismic Images

Artifacts exist in all seismic images produced from field data [35]. These artifacts may be associated with the signal from real targets, or from other subjects such as sideswipes. Sideswipe is an image artifact produced from using out-of-line reflections in 2D seismic profiles. Many artifacts are easily identifiable, such as survey footprints in reflection volumes at shallow depths and along-raypath smearing in velocity tomography as shown in Figure 3b and Figure 5c. However, there are deceiving artifacts that resemble geologic features, such as that from mistaking noise for signal.
The common causes of seismic image artifacts include the following:
  • Poor and uneven seismic illumination;
  • Using improper signals in seismic imaging;
  • Limitations in data processing and interpretation;
  • Erroneous velocity models.
In the following we elaborate on the image artifacts from these causes.

2.2.1. Image Artifacts from Insufficient Seismic Illumination

Following the discussion in Section 2.1.3, a negative consequence of uneven seismic illumination is the generation of image artifacts, including morphological distortions of the image features. An example is the along-raypath smearing in velocity tomography shown in Figure 3 and Figure 5. Because seismic imaging methods use the observed seismic waveforms or traveltimes to produce seismic images, an image may lose the correct amplitude when there are biases or unevenness in the radiation pattern of sources, in the wave-propagation properties of the media over the imaging targets, and in the seismic illumination of the targeted locations. Unfortunately, many seismic images have not been subjected to vigorous analysis of seismic illumination.
As an example of seismic imaging using reflections, Kirchhoff migration generates subsurface images by stacking primary reflections along isochrons, which are equal-traveltime contours from seismic sources via reflectors to receivers. Such mapping tends to generate along-isochron smearing artifacts at places of insufficient angular coverage from different shots and receivers. There are many published examples of image artifacts from low-seismic illumination level (e.g., [35,45]).

2.2.2. Image Artifacts from Using Improper Signals

The most harmful image artifacts are those that are difficult to distinguish from properly imaged geologic features. In exploration seismology, most seismic migration methods use only primary reflections and scattering energies that were bounced only once from reflectors as the effective signals, while treating the rest waves, such as first arrivals and multiple reflections, as noises. Unfortunately, it is often difficult to distinguish non-primary events from primary reflections in field data, leading to artifacts from the mistaken signals (e.g., [60]). Figure 6a shows such an artifact in the dashed ellipse from mistaking internal multiples further bounced between the top and bottom interfaces of the salt body as primary reflections [61]. Though Figure 6b has many of the artifacts removed by applying a surface-related multiple elimination algorithm, we have not yet been able to identify and eliminate all internal multiples.
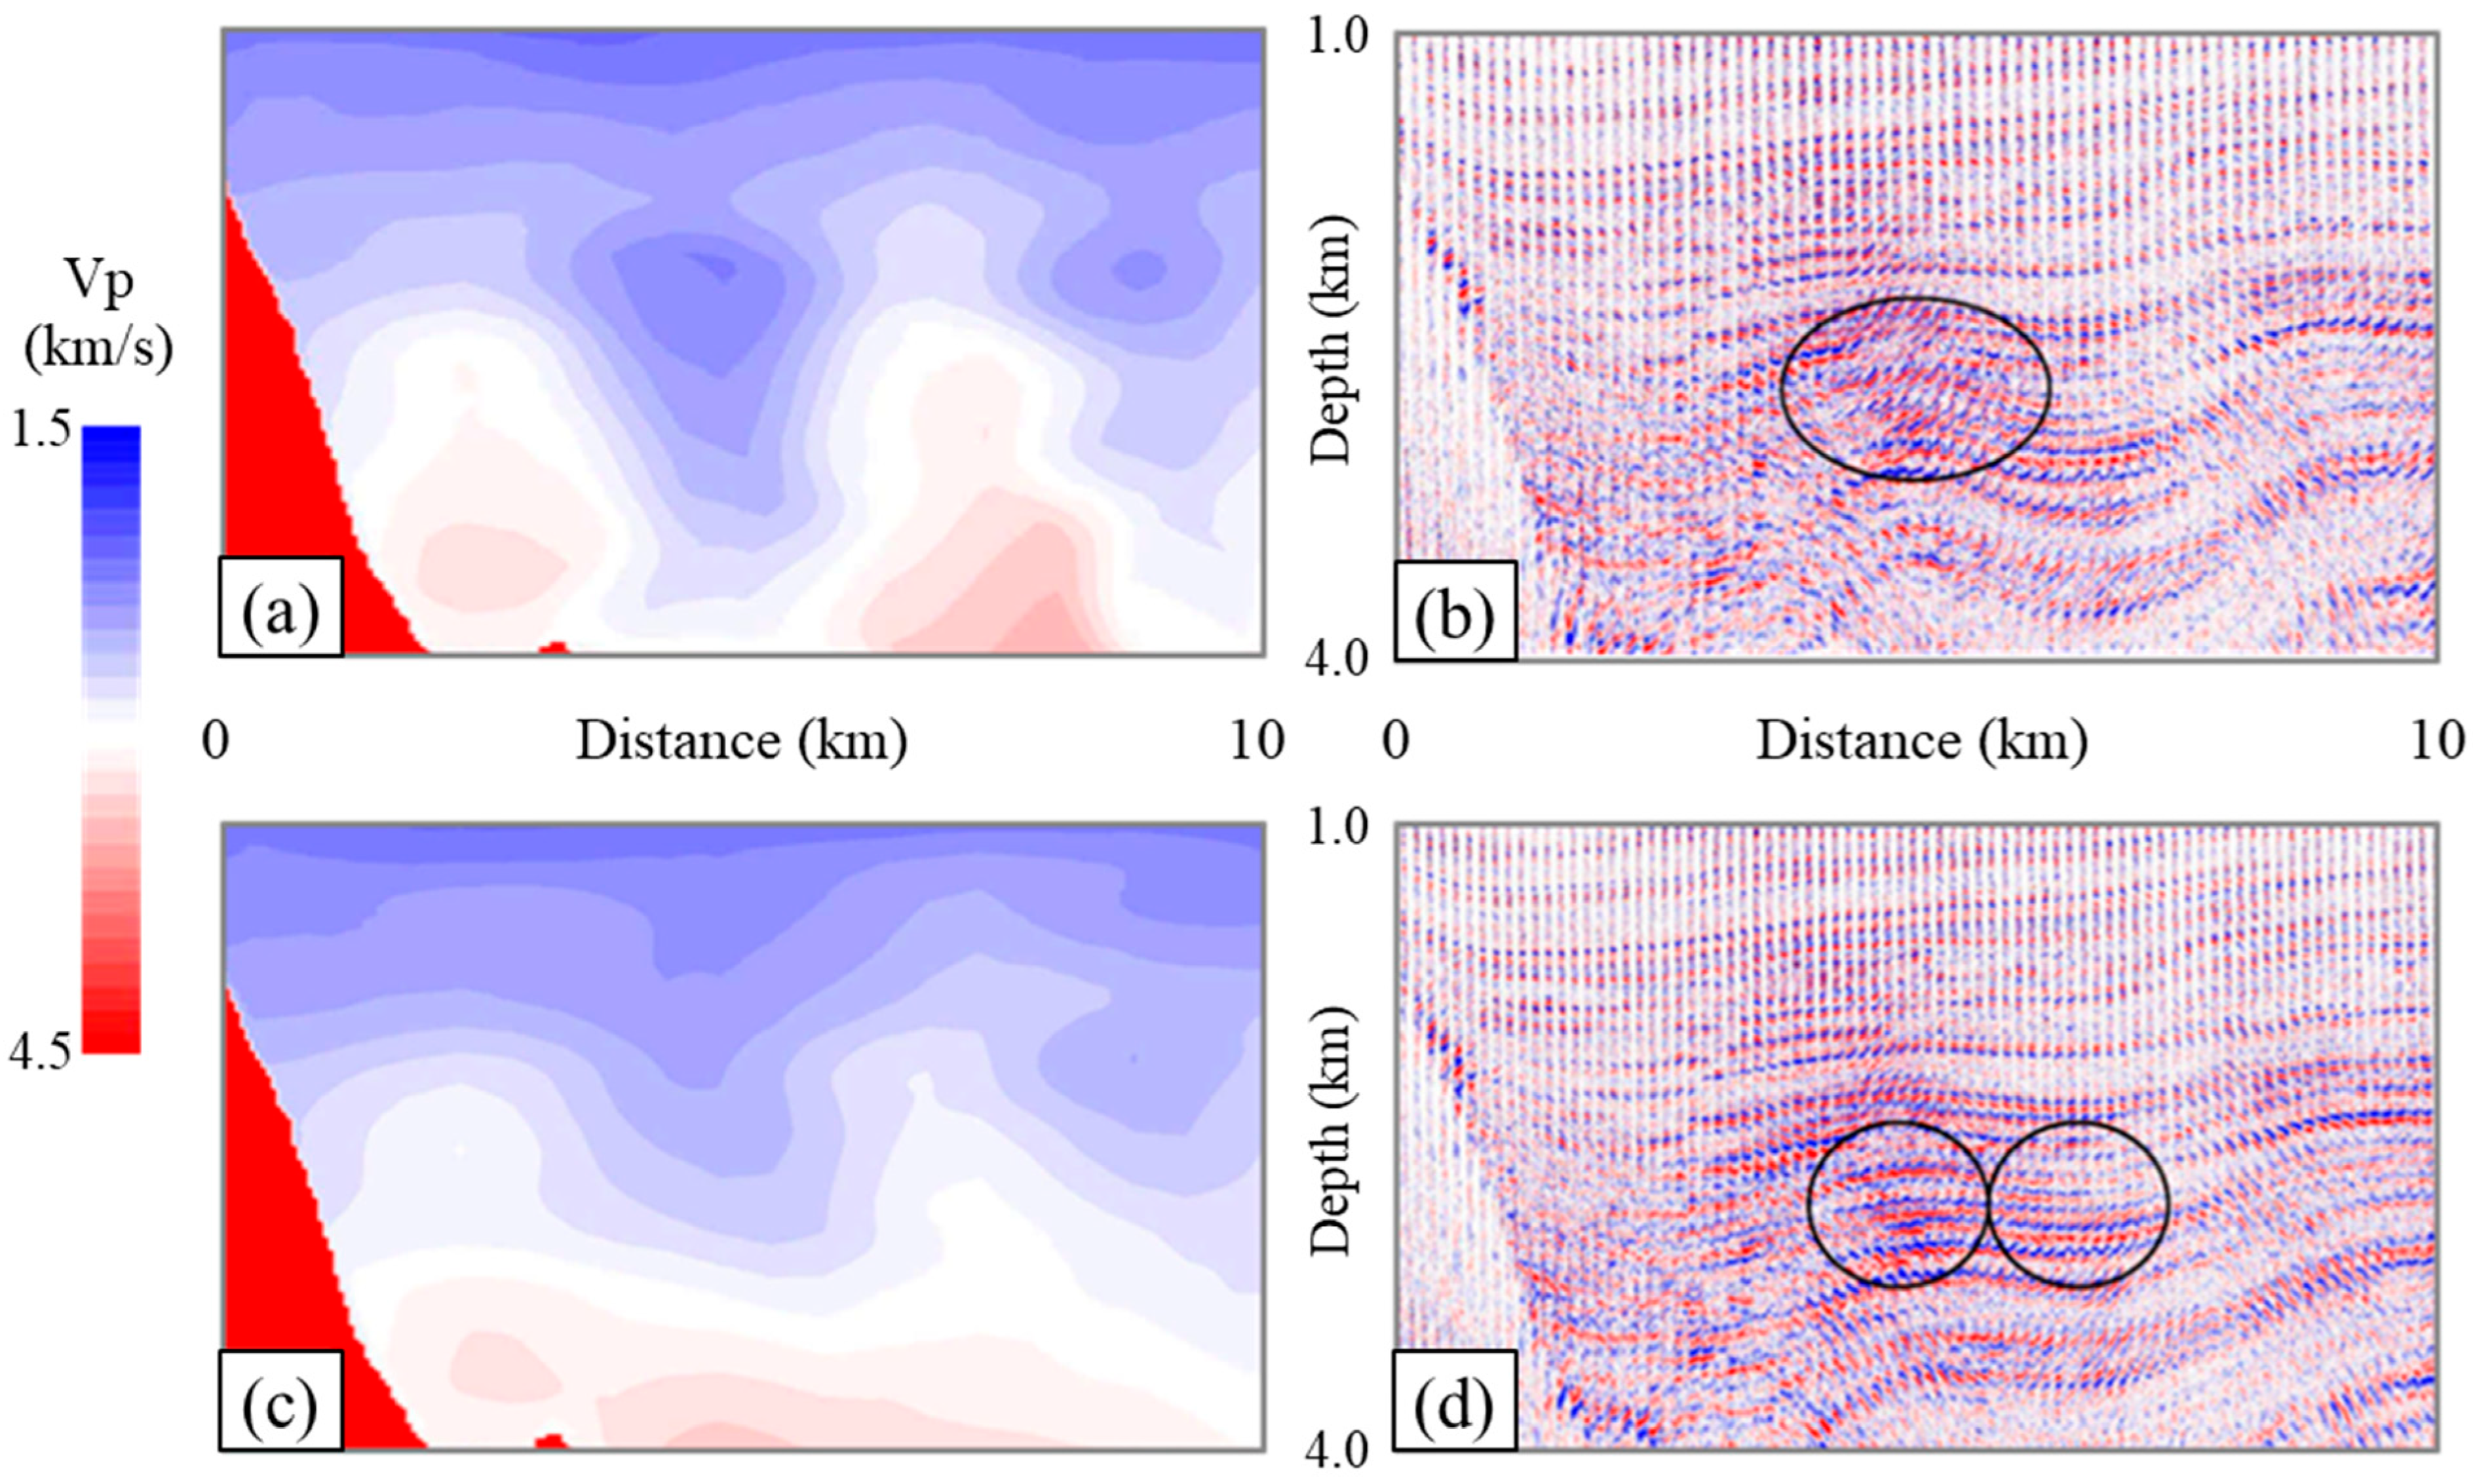
Based on a case study [62], Figure 7 compares two seismic profiles using the same data but different imaging methods. In the portion of the seismic profile highlighted by the dashed ellipse in Figure 7a, there are many overlapping and ringing features that are suspected to be artifacts from multiple reflections and sideswipes. While the seismic imaging method for Figure 7a assumes the input consists of only primary reflections from reflectors vertically beneath the survey line along sea surface, the study area offshore California has a rugged seafloor consisting of hard rocks that produce strong multiple reflections and sideswipes. In Figure 7b, many of the suspected features disappear because this profile is based on the RTM method which takes both primary and multiple reflections as signals. The cross-correlational imaging condition of the RTM method helps reduce the impact of noise such as sideswipes [53]. However, Figure 7b contains long-wavelength imaging artifacts at shallow depths.

2.2.3. Image Artifacts from Limitations in Data Processing and Interpretation

Limitations in data processing and interpretation processes may result in image artifacts. For instance, the long-wavelength imaging artifacts shown in Figure 7b are side effects of the imaging condition. Once we recognize an image artifact, we may find ways to suppress it in post-imaging data processing. A synthetic example of post-imaging processing is illustrated in Figure 8, where the profile in Figure 8a shows strong sub-vertically oriented long-wavelength artifacts produced by the cross-correlation imaging condition of the RTM method [63]. Figure 8b shows the profile after applying the Laplacian filtering [55], which has removed many of the long-wavelength artifacts. However, because data processing methods are imperfect, they alter both data noise and signal. Hence, we may just label a recognized artifact if it does not trouble the interpretation. If we do conduct post-imaging processing, we should provide the subsequent interpretation with both the images before and after the process that impacts the images significantly.
Regarding the image artifacts from limitations in interpretation, one example is the demean artifact which is commonly seen in tomographic images [35]. Demean or deaverage refers to removing the average of data. Several types of demean processes exist in seismic imaging. One example is the removal of the average of traveltime residuals between seismic phases. Another example is the assumption for most inverse operators that the average of the misfits between data and model predictions is zero.
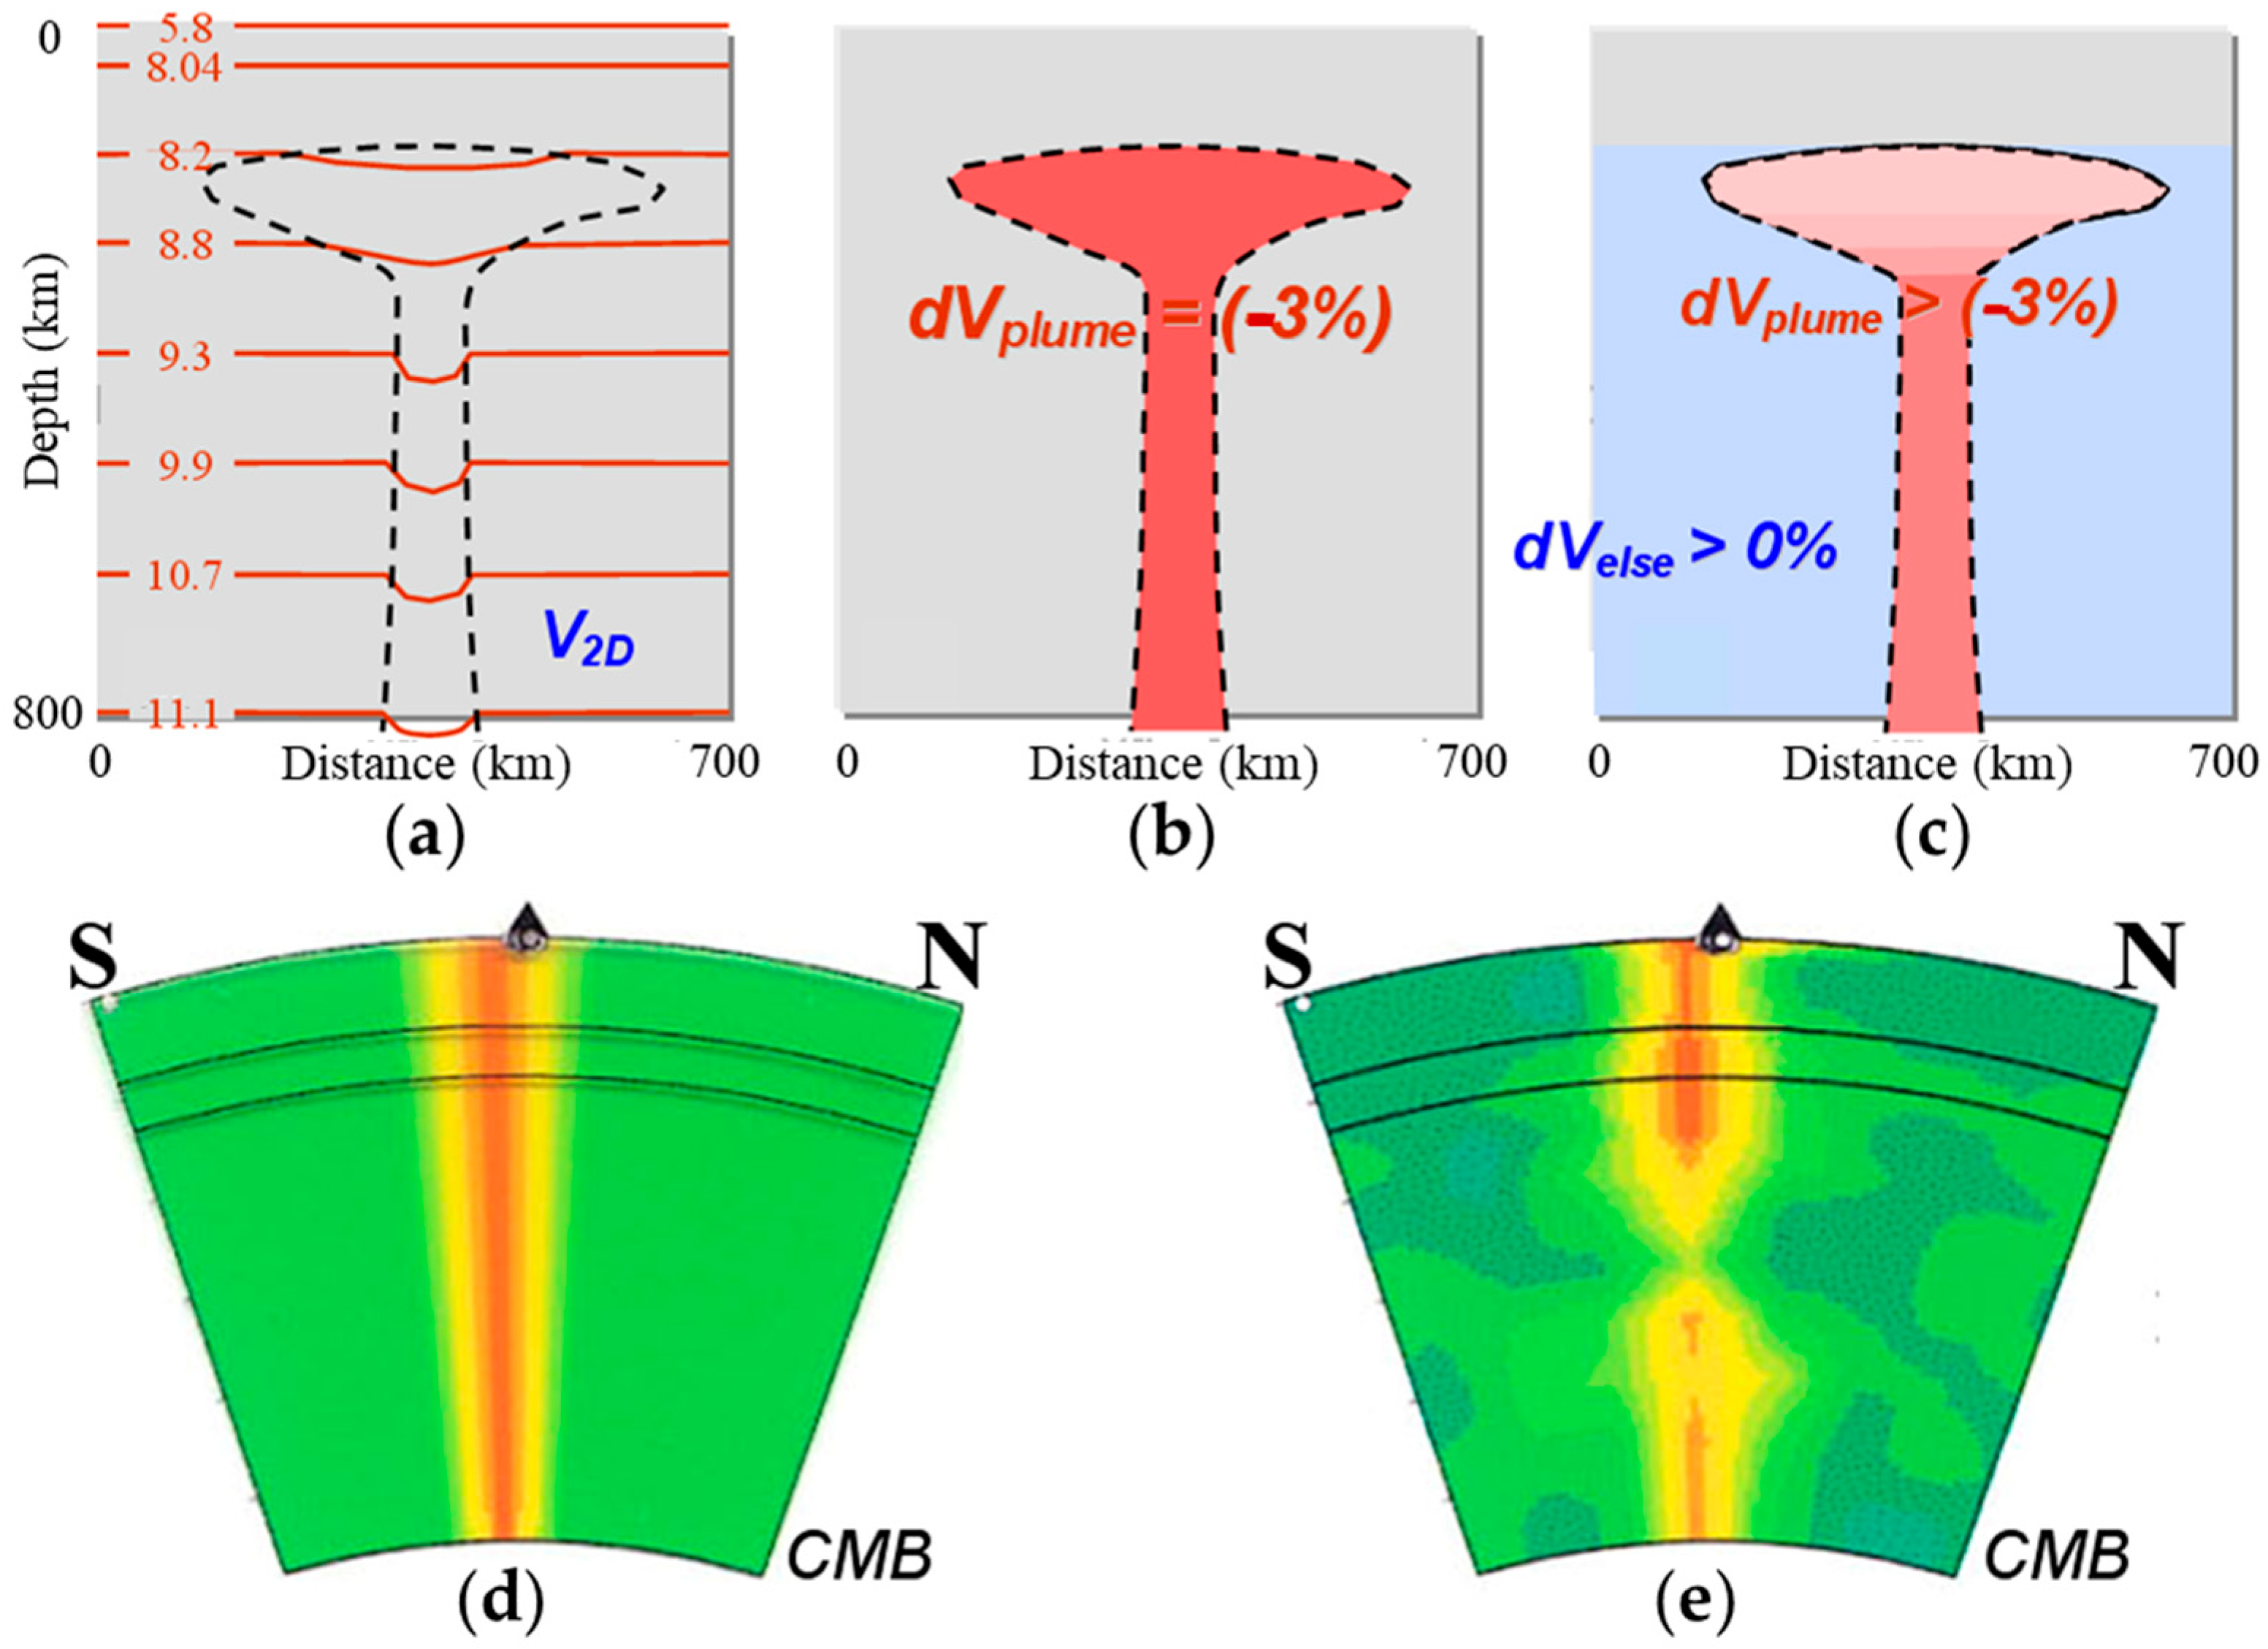
A third example of demean is removing the layer averages of tomographic solutions, which is illustrated in Figure 9 using cartoon cross-sections of a low-velocity plume anomaly. A perfect plume anomaly in Figure 9b has a slower velocity than the regional 1D velocity model. We often approximate the regional 1D model using the layer averages of the tomographic velocities, as shown in Figure 9a, which is slower than the global 1D velocity model due to the slow-velocity plume anomalies. Then the demean artifacts occur like that shown in Figure 9c, in which the plume area is under-corrected while the ambient area is overcorrected. Such a tendency of the demean artifacts can be seen in Figure 9e after removing the layer averages of the model in Figure 9d [64].

2.2.4. Image Artifacts from Using an Erroneous Velocity Model

In order to map subsurface reflective structures, a good reference velocity model is required by seismic imaging methods, such as reflection stacking, receiver functions, seismic migration, and full waveform inversion. A velocity error produces both position error and image artifact. Figure 10 compares prestack depth migration results using synthetic model data and three different velocity models [65]. The correct velocity model delivered focused reflectors at correct positions in Figure 10a. In contrast, faster or slower velocity models lead to unfocused reflectors at incorrect positions and image artifacts, such as the ‘smile’ artifacts in Figure 10b and ‘frown’ artifacts that appear in Figure 10c, respectively.

2.3. Position Accuracy of Seismic Images

In exploration seismology, accuracy in the reflection image position is critical for drilling to the targeted reservoirs. Even in cases where the imaging targets are beyond the drilling limit, we may still need sufficient accuracy in image position in order to estimate the size and shape of each target and its physical properties. For reflection images, all three elements of image fidelity rely on the accuracy of velocity model employed in the imaging process, in addition to other factors such as acquisition parameters, data SNR and seismic illumination.

2.3.1. The Reliance of Image Position on Imaging Velocity Model

There are a number of studies on the impact of velocities on reflection images (e.g., [66,67,68]). Essentially, a velocity model is necessary for seismic imaging to map time records of seismic data into subsurface reflection spatial positions. Using an erroneous velocity model in seismic imaging will not only misplace image position but also blur the solution image and increase the chance of image artifacts, as demonstrated in Figure 10.
Taking from a study by Sarkar and Tsvankin [69], Figure 11 demonstrates two seismic images using the same field data but different velocity models with vertical transverse isotropy (VTI). The arrows in this figure mark some of the reflectors that have changed positions significantly between the two images. The difference between the velocity models alters both the position and appearance of the image features.

2.3.2. Quantifying the Absolute Accuracy in Seismic Image Position

The absolution image position of seismic profiles can be evaluated by tying the image reflections with that on well logs measured in wellbores. An illustration of the well-seismic tie process is shown in Figure 12, which is modified from Abrams [70]. In this case, the two closely located boreholes provide drilling cores and well logs that provide depth measurements of lithology, age, P-wave velocity, and density of rock strata at each depth position in the wellbores. As the vertical derivative of seismic impedance, the product of velocity and density, the reflectivity trace is convolved with the estimated source wavelet, delivering the synthetic seismic trace in two-way time domain. We prefer conducting the well-seismic tie matching process in the time domain, where the likely causes of mis-tie can be better addressed than that in the depth domain. Like this figure, a synthetic seismogram trace is usually plotted multiple times to ease the comparison with the reflections on seismic profile.
The well-seismic tie process is the most effective way to establish the genuine value of a reflection profile when a close tie is established. In practice, it is difficult to achieve a well-seismic tie perfectly due to several reasons. Firstly, the two types of data in the tying process are responses to similar subsurface properties measured at different vertical scales. Seismic traces are recorded in time domain at frequencies of several to tens of Hz, corresponding to wavelengths from tens to hundreds of meters. In contrast, well logs are measured in depth domain at a wavelength from several to tens of centimeters. Secondly, there are significant differences in the lateral range of these two types of data. Well logs are responses to medium properties around the wellbore, while a seismic profile is based on reflection records covering a much greater lateral distance, such as several kilometers from the wellbore. Hence the well-seismic tie level is much higher at near offset than at far offset. Thirdly, by convolving the wavelet estimated from the surface seismic data with the reflectivity derived from well logging data, the resultant synthetic seismogram is a smoothing of the density and sonic logs at the seismic frequency range. In addition, the use of velocity in the time-to-space conversion is indicative of the impact of velocity on the position of seismic images.

2.3.3. Quantifying the Relative Accuracy in Seismic Image Position

In common situations without direct position measurements like well logs, we can compare the positions of seismic images based on different types of data and methods to gauge the relative accuracy or uncertainty in image positions. One approach is to make a general estimation of the overall range of position errors. Such estimates would consider the ranges of vertical resolution and horizontal resolution based on the given data frequencies and velocities, in addition to acquisition parameters such as the position errors of the sources and receivers employed.
A practical approach to quantify the relative position accuracy is to measure the level of tie (similarity and difference) between different profiles across each other. Such analysis is based on the notion that the same geologic structures traversed by different profiles support a high correlation between the tie level and the image fidelity. The profiles under examination could be seismic images from similar or different surveys, or seismic versus non-seismic and geologic profiles. Figure 13 provides a VSP-seismic tie case study [71], showing the alignment between reflections on a seismic profile, a VSP corridor stack with reflections along the wellbore, and a VSP migrated image. The tie level provides a quantifiable QC of the uncertainties in relative image position and velocity model of the crossing profiles.
In exploration seismology [7], because all reflection profiles are achieved using velocity models, quantification of the relative accuracy of seismic image position is closely associated with the QC of velocity models. Field practice in petroleum exploration has long established an iterative approach of seismic imaging with two processes. The first one is VMB to establish the long-wavelength velocity model, and the second process is prestack depth migration to map the short-wavelength reflectivity structures [1]. While these two processes complement each other, VMB aims at improving the accuracy of image positions, and prestack depth migration aims at improving the resolution and SNR. The FWI, which has gained much popularity in recent years (e.g., [72,73,74,75]), combines the above two-fold approach into a single step of seismic imaging.

2.3.4. Quantifying the Uncertainties in Imaging Velocity Models

Since the uncertainties in image position and velocity model error are highly connected, we can map the locations of significant velocity error through quantifying the flattening level of reflections in common image gathers (CIGs) retrieved from depth migrated seismic data (e.g., [1,66,76]). As a practical and effective way to assess the velocity error, CIG is a collection of prestack depth migrated data traces at the same location (Section 8.3.4 of [1]). In the past two decades, migration velocity analysis based on CIGs has become the leading way of VMB in exploration seismology.
Figure 14 provides an example of velocity model QC using CIGs. In this case, dozens of CIGs in Figure 14b,d reveal the locations of significant velocity error. Though not all reflection events on a CIG could be totally flat even in the correct velocity model, the relative flatness of reflection events on CIGs provides an indicator for the quality of the velocity models. This figure shows a comparative study [76] between single-scale tomography and multi-scale tomography [11,77]. This example demonstrates that, when one fidelity element, such as position accuracy, is improved, other fidelity elements often increase as well.
In recent years, deep learning has been widely applied in the field of seismology, demonstrating its ability to solve nonlinear problems and integrate multiple data sources, thereby providing new insights for seismic velocity model building. A deep-learning-based VMB process views seismic forward and inverse modeling as a domain transformation problem [78], automatically learning the relationship between seismic waveform data and subsurface velocity models to enable rapid construction of velocity models [79,80,81,82,83]. Recent studies have demonstrated a promising potential for deep-learning-based velocity modeling. Araya-Polo et al. [84] established a deep-learning-based velocity modeling method using velocity spectra as feature datasets. Han et al. [85] improved the accuracy of deep-learning-based velocity modeling by combining velocity spectra and reflection waveforms as joint feature datasets. Geng et al. [86] proposed a convolutional neural network-based velocity modeling method using common image point gathers as feature datasets. To address the weak correspondence between seismic data and velocity models, transformations can be applied to enhance the information in seismic data that reflects velocity structures, thereby improving the stability of deep-learning-based velocity modeling [87,88]. Guo et al. [89] employed supervised descent learning for traveltime tomography, achieving the integration of machine learning inversion with traditional traveltime velocity modeling.

3. Challenges to Quantify Seismic Image Fidelity Beyond Drilling Limit

Because only a tiny portion of seismic images are verifiable using wellbore data, it is important to quantify seismic image fidelity beyond the drilling limit. To provide additional background for readers who are interested in seismic image fidelity, we review the data quality factors and major challenges to quantify seismic image fidelity.

3.1. Data Quality Factors Impacting Seismic Image Fidelity

As a remote sensing method, seismic imaging relies on data quality, which must obey natural laws. Here we have compiled in Table 1 six factors and their impacts on seismic images, including the elements of image fidelity. We put order 0 for the first factor because it is a practical limit differing from the other factors.
Understanding the factors in Table 1 allows us to generate some typical case scenarios concerning the fidelity of seismic images. Below are three sample illustrations.
  • Low data SNR at far mapping distance. The SNR of seismic data depends on the following: (1) quality of the sources in terms of their strength and the radiation patterns; (2) attenuation property and complexity of the media above the imaging targets; and (3) quality of the receivers and data processing process. Low SNR is a major reason for generating the deceiving artifacts due to mistaking improper data as the signal in seismic imaging. A rule of thumb in Section 2.1.2 is that the SNR of seismic data becomes insufficient after one to two hundred wavelengths of wave propagation in sediments.
  • Insufficient data frequency content. Depending on the following: (1) source frequency content and radiation pattern; (2) property of the media above the imaging targets; and (3) ability of receivers in recording low-frequency signals and sample rate. Insufficient signal bandwidth will result in losing the ability to distinguish each reflector from other reflectors. Another rule of thumb in Section 2.1.2 is that we need at least 2 octaves in signal bandwidth in exploration seismology.
  • Poor seismic illumination. The fidelity of seismic images requires sufficient seismic illumination for the imaging targets and their overburden, the media overlying the targets to the survey sources and receivers. Poor and uneven seismic illumination not only leads to the generation of various image artifacts but also hinders the VMB effort to reduce image position errors.

3.2. Challenges to Improving and Quantifying Seismic Image Fidelity

Table 2 shows ten major challenges to improving the fidelity of seismic images, following roughly the sequence from data acquisition to denoising, VMB and imaging, and to image QC and interpretation. For each challenge, the common symptoms and likely causes are briefly summarized. Some of the challenges, like those prefixed by “limited” in the table, are due to natural limitations that are beyond our control. Other challenges are due to limitations in the current technology that are improvable in the future.
The last challenge in Table 2, the lack of quantitative QC for the fidelity of seismic images, expresses the current status of using seismic images. This is likely the main reason behind many of the failures in using seismic images. To promote more adequate use of seismic images, we advocate establishing standards for assessing image fidelity. We need to assess image fidelity as a requirement and hopefully a tradition.
Understanding these challenges allows us to better quantify seismic image fidelity. By studying these challenges, we may find ways to improve our approaches in the processes of seismic survey design, data acquisition, processing, VMB, imaging, and interpretation. There are additional challenges, such as limitations in the mythology of data acquisition, processing, and imaging. A common challenge is the non-uniqueness in solution images from all imaging methods and in different interpretations of the same image.

4. Strategies for Quantifying Seismic Image Fidelity

We suggest several strategies for quantifying seismic image fidelity. Modifications in practice are necessary, based on study goals, available resources, and limitations.

4.1. Establishing Practical Rules for Assessing Image Fidelity

For better making and use of seismic images, we need to establish practical rules for assessing image fidelity. These rules cover specific measures on data quality and quantification of image resolution, artifacts, and position errors. Standard tests can be designed based on key factors impacting data quality (Table 1) and image fidelity (Table 2). Three aspects of practical rules are elaborated below.

4.1.1. Promoting Best Practice Rules in Creating and Using Seismic Images

We advocate using best practice rules to ensure proper use of seismic images. To establish the rules for each study, we must address principal measures to the study objectives, such as:
  • Scientific principles for the study;
  • Practical ways to QC main technical parameters;
  • Practical limitations and the underlying reasons;
  • Pitfalls in practice and examples of success and failure cases.

4.1.2. Ensuring QC Tests on Image Fidelity

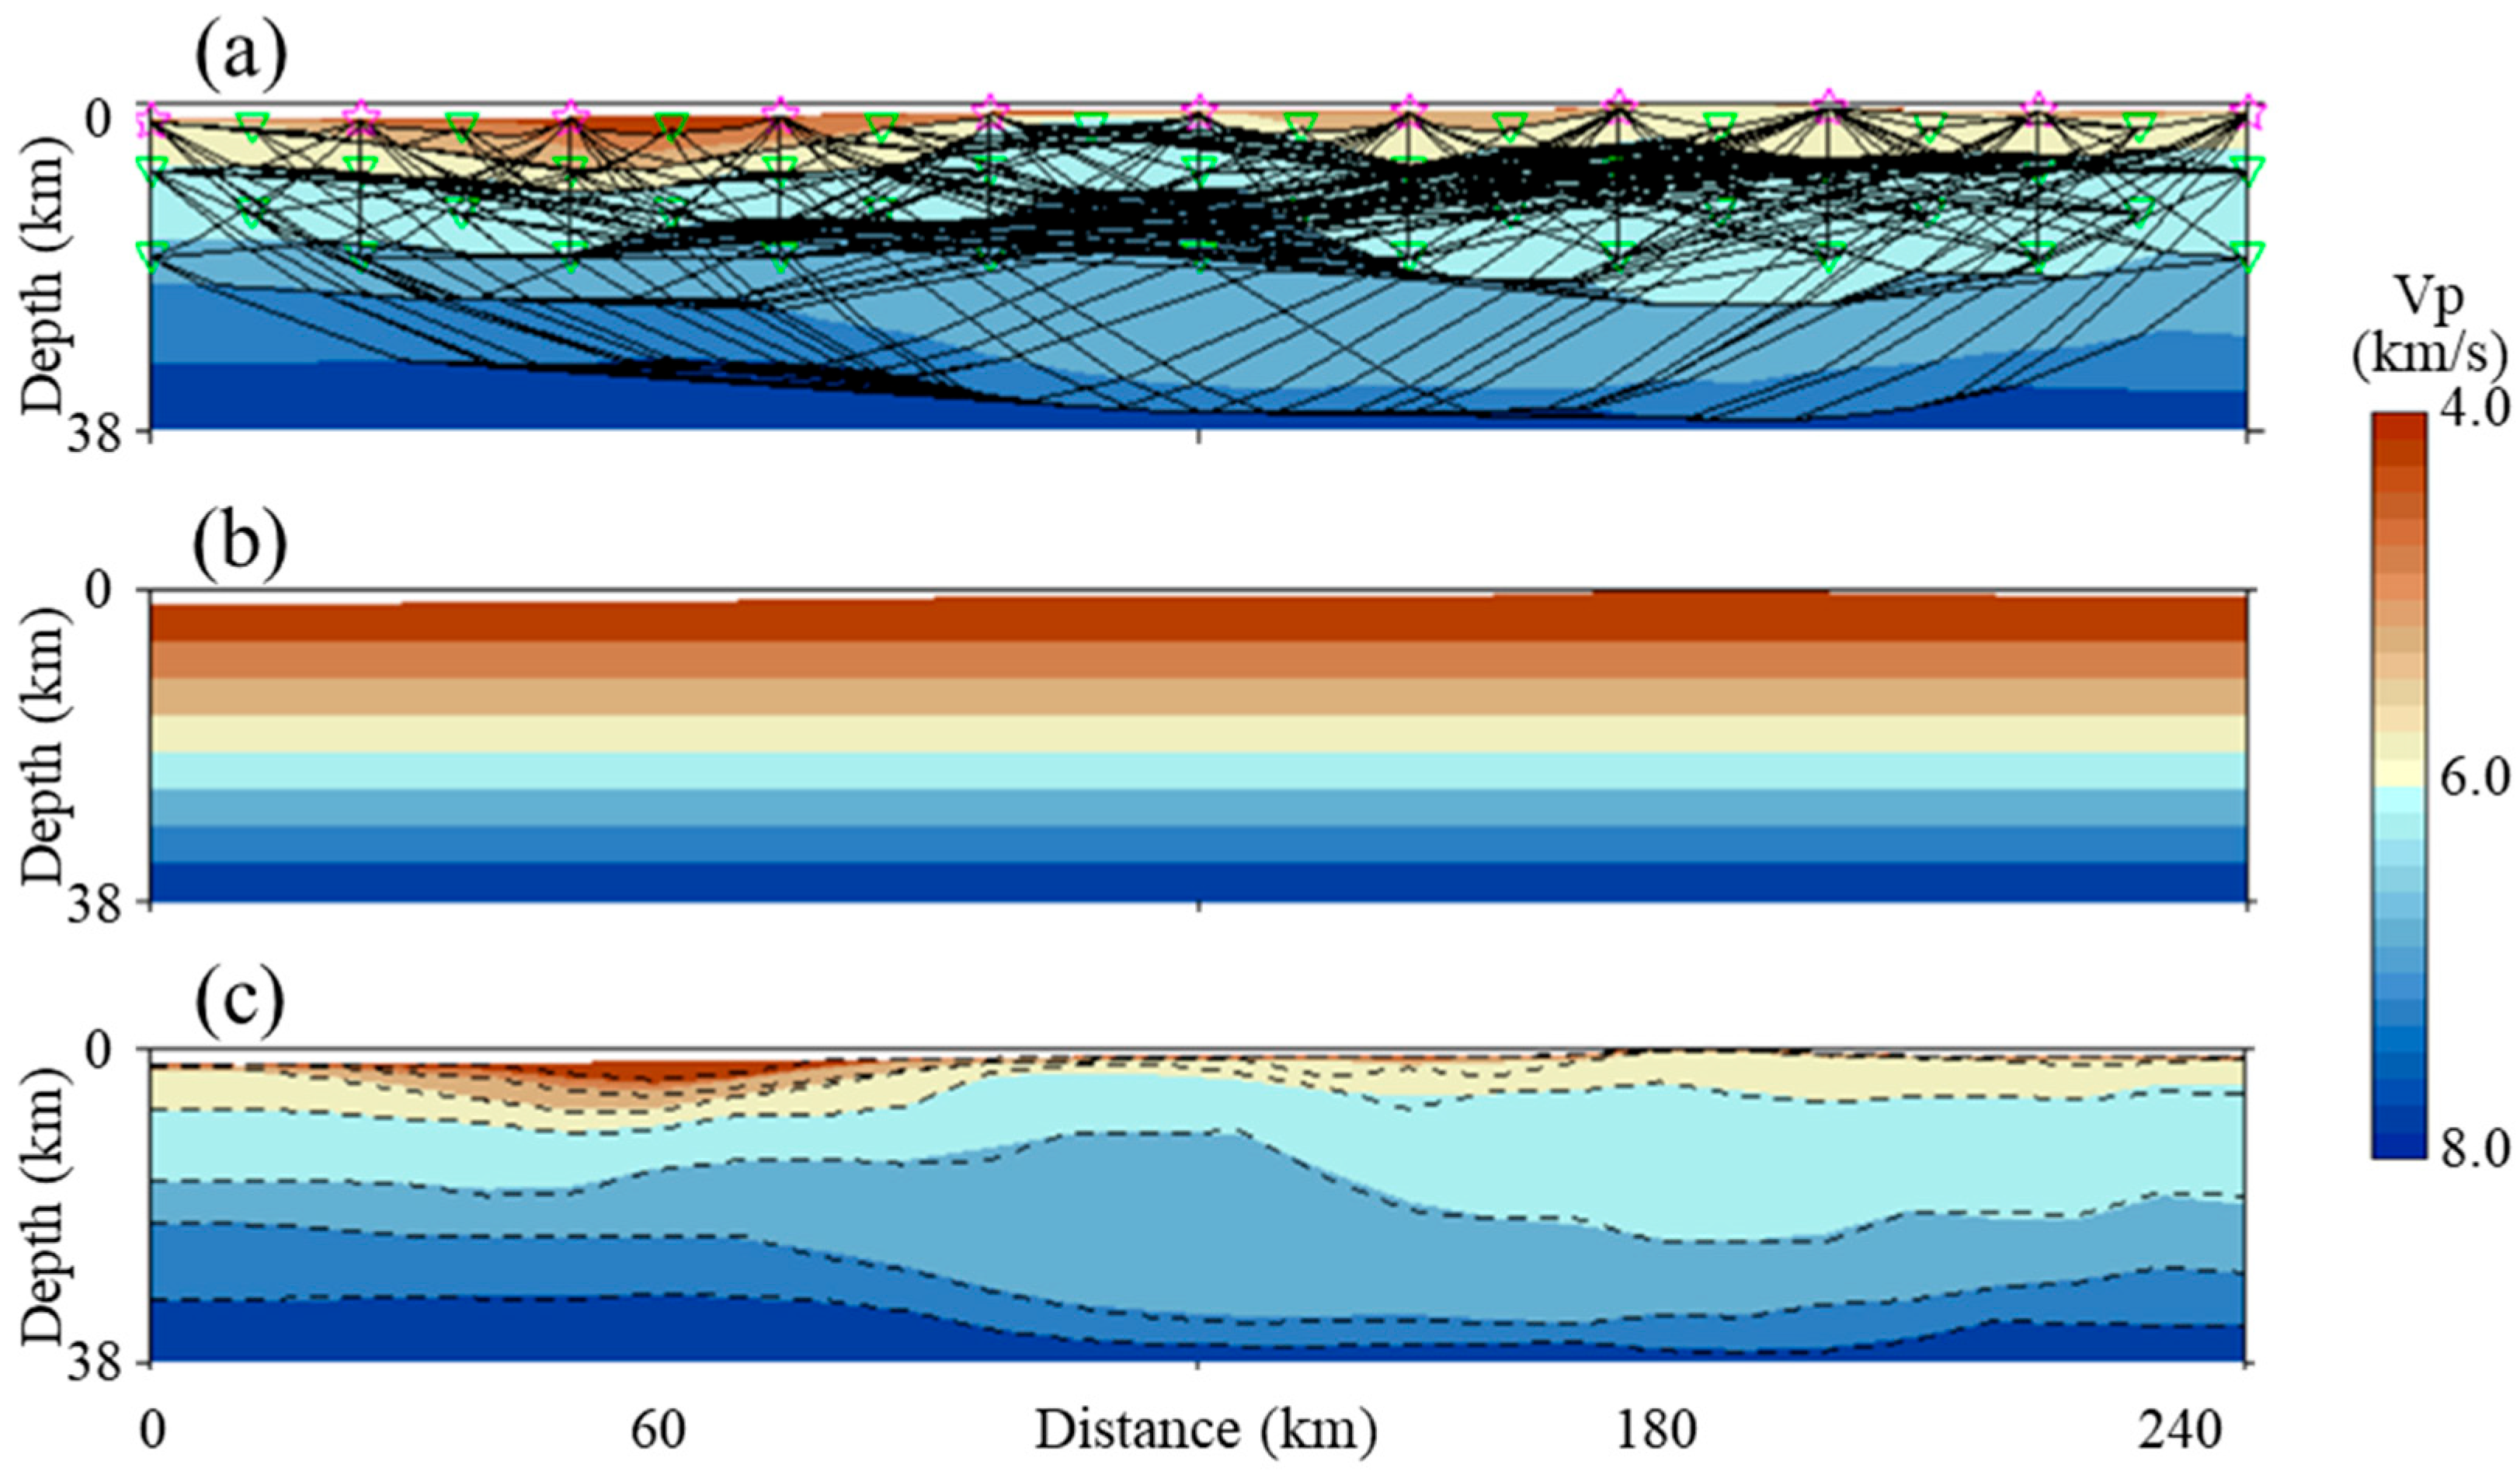
Conducting QC tests on image fidelity is a precondition for using seismic images. Such tests help evaluate the impacts of the available data SNR, frequency content, and seismic illumination. Following the reconstruction exercises described in Section 2.1, Figure 15 shows another synthetic test to assess the accuracy in reconstructing crustal velocity interfaces in southern California using first arrival data from local earthquakes [90]. The angular illumination of first arrival raypaths is extremely poor in most crustal studies, with nearly parallel raypaths as shown in Figure 15a. To solve the problem of parallel raypaths, a deformable layer tomography was developed to invert for the geometry of velocity interfaces using layer velocities that are measurable from refraction data [48,90]. Starting from an initial reference model shown in Figure 15b with constant velocity layers and flat interfaces, the deformable layer tomography has reconstructed most of the velocity interfaces, matching well with the true interfaces denoted by the dashed lines in Figure 15c. The mismatched values of the interfaces quantify the uncertainty in the fidelity of the inverted velocity interfaces.

4.1.3. Establishing Standards for Verifying Image Fidelity

It is important to establish quantifiable QC standards for seismic images, especially in cases without direct measures. Ideally, there are three general levels of validation:
  • Direct proof;
  • Verifiable independently;
  • Consistency with all measurable data.
As we have explained in Section 1, a direct proof includes wellbore coring samples or well-seismic ties between the imaged events with well logs. In most applications without direct proofs, we can focus on validating the relative image fidelity by verifying the images based on independent data, methods, and by independent people if possible. In most applications, however, the fidelity of seismic images is only supported by parts of the data.
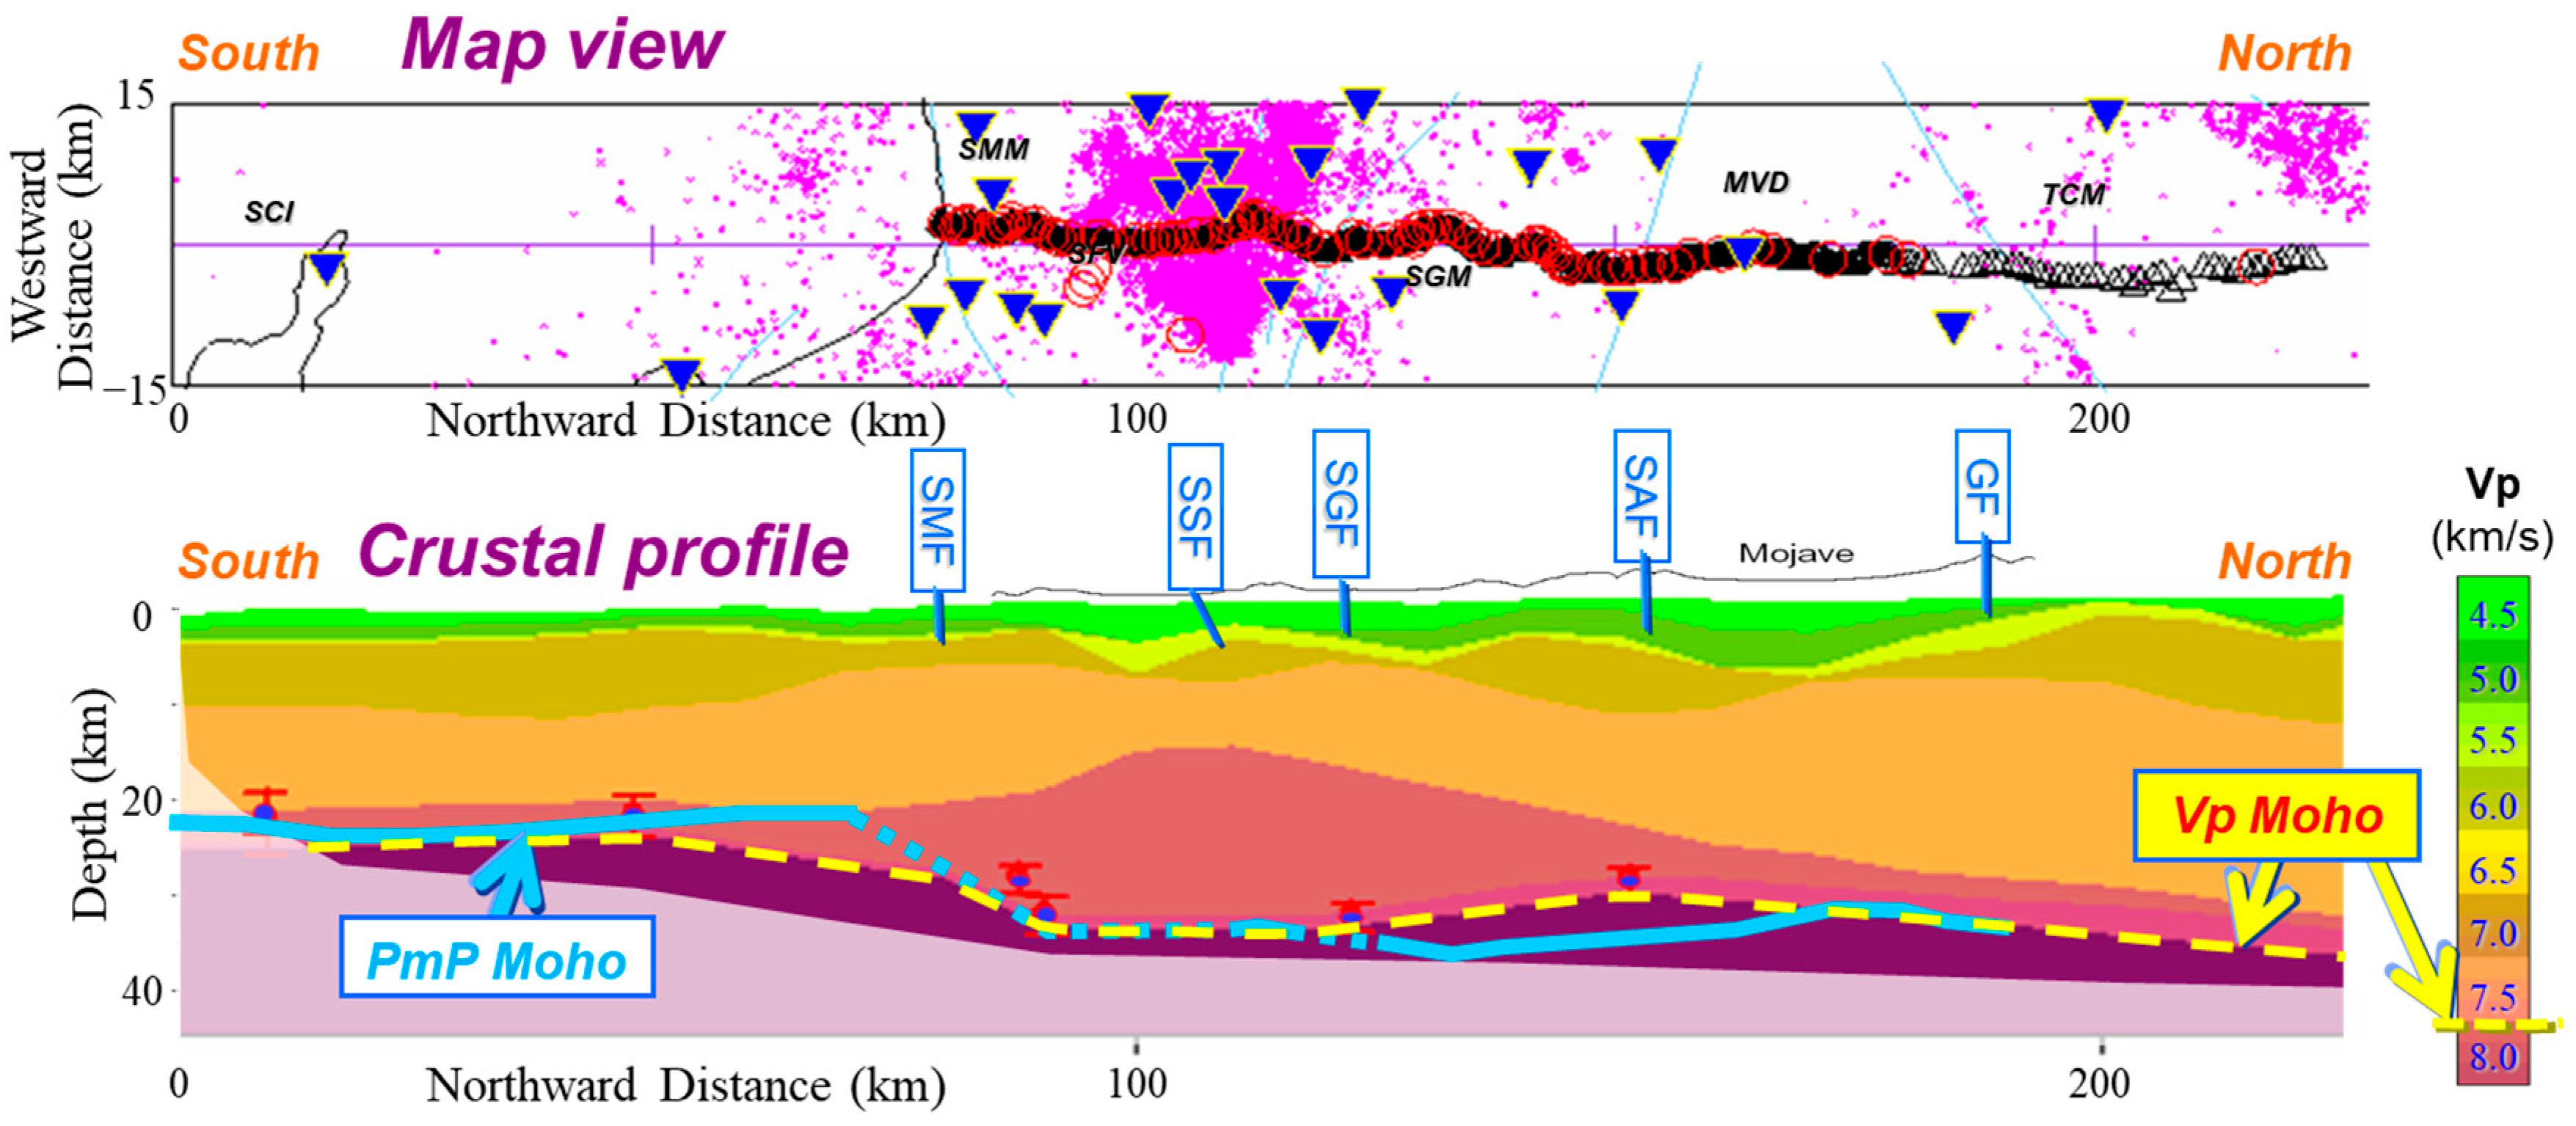
As an example of quantifying seismic image fidelity independently, Figure 16 shows a case verifying the geometry of the Moho discontinuity on a crustal seismic profile in southern California. The images in this figure are taken from three groups of researchers who employed diverse types of data and methods; there are additional depth-migrated images for this profile [36]. In this figure, the receiver functions [91] are constructed with high SNR, but low in resolution and are available only at six locations. Compared with the receiver functions, the PmP reflection data [92] has higher resolution, though the confidence is reduced for the dotted portions of the interpreted PmP Moho. The PmP Moho depth is within the depth ranges of five out of six receiver function results. The tomographic velocity profile has been verified by reconstruction tests [48], like that shown in Figure 15 [90].
The global 1D seismological models, such as the PREM model [93] and the IASP91 model [94], mark the Moho as a seismic discontinuity where the P-wave velocity reaches 8 km/s at the top of the mantle (e.g., [95]). Since the crustal velocity in a tectonically active region like California should be slightly slower than the global average, we take the interface between the 7.5 km/s and 8 km/s in Figure 16 to approximate the Vp Moho here. In this figure, the fidelity of three seismic imaging results is cross-validated. The Vp Moho from traveltime tomography agrees well with that from the receiver functions and the PmP Moho along this profile. However, their differences can be used to quantify the uncertainty in the Moho depth solutions.

4.2. Finding the Resolvable Targets and Suitable Signals for Study Goals

A good strategy to maximize the fidelity is to find the most resolvable targets for the given study goals and resources. Though seismic resolution has limits (e.g., [7,43]), we see that even for the same dataset, different imaging targets have diverse levels of resolution and fidelity. Obviously, it is much more feasible to search for a known feature than to find unknown features in a seismic image. Even with an estimate about the expected targets, we can analyze the likely seismic responses to help us select suitable signals and methods. We should conduct sufficient tests at the planning stage to verify the survey design and data processing workflow, thus optimizing the chance for achieving the best image fidelity of the expected targets.
An effective way of finding the most resolvable targets would be scanning the seismic responses of the targeted features, such as fractures, pinchout, and velocity anisotropy. Feature scanning is a simple and practical approach for seismic VMB and imaging under complex geological conditions. In cases of poor seismic illumination and missing data like that in subsalt imaging, data-driven tomography that relies on the accurate measurement of event curvatures in CIGs would fail. To cope with this challenge, a feature scan scheme can make many runs of depth migration systematically using a set of scaled model parameters (e.g., from 90% to 110% of the base velocity model). The best model parameters will be tracked at places of the best image fidelity (e.g., amplitude and reflector continuity) on CIGs. The scanning scheme can be target-oriented in practice to ensure efficiency and accuracy as shown in field data applications (e.g., [96,97]).
In dealing with real-world challenges in seismic imaging, it is useful to develop some practical rules, because we have limited information during the processes of generating and interpreting seismic images. A general rule in practicing geosciences is the rule of “from known to unknown.” In geology, the uniformitarianism theory uses this rule in time. In interpreting geophysical images, experienced interpreters tend to go from the knowns to the unknowns in space, like that illustrated in the well-seismic tie process in Figure 12.

4.3. Improving Seismic Illumination and Signal Bandwidth

Seismic illumination should be among the most crucial factors to be considered in seismic acquisition design. Every user of seismic images should realize that, without a sufficient level of seismic illumination in both angular coverage and hit count over the targeting space, there is no hope for achieving sufficient image fidelity. In other words, a seismic dataset is useless without sufficient seismic illumination over the targeted locations. The data hit count is needed for assuring sufficient SNR, and the angular coverage is necessary for suppressing image artifacts. At the survey design stage, we can compute the expected level of seismic illumination to estimate the level of sufficiency. At the data processing and imaging stage, we can significantly increase the level of seismic illumination by employing more advanced imaging techniques that enable the use of more wave phases (e.g., [53,98,99]). On the other hand, using additional data types might require us to improve the suppression of imaging noises (e.g., [55,100]).
Another strategy for improving the fidelity of seismic images is to improve the frequency bandwidth of the signals and seismic illumination at data acquisition and processing stages. As is elaborated in Section 2.1.2, both the image resolution and artifact levels depend on data frequency content, especially the signal bandwidth. Due to seismic attenuation, it is more effective to retrieve the low-frequency signals in order to broaden the frequency bandwidth. However, low-frequency seismographs cost much more than high-frequency seismographs because the former require higher sensitivity components, which are also expensive. Hence, all seismic recording devices have low frequency limits. Although we can boost up the energy of the recorded waveforms below the low-corner frequency in processing, both the signal and noise are amplified at the same time.

4.4. Mitigating the Non-Uniqueness in Seismic Imaging

Considering the impact of seismic imaging methodology, we examine the non-uniqueness in the inversion or modeling approaches commonly employed in geophysical studies. Both approaches seek the solution model whose predictions best match the observations in data space. Thus, the selection of the best model to output is not performed in the output space. This fact has exacerbated the non-uniqueness problem for inversion and modeling. From the perspective of image fidelity, non-unique solutions mean a high chance of image artifacts.
Though we are not aware of a general solution to the non-uniqueness problem, there are practical ways to mitigate this problem. For example, the RTM approach (e.g., [53,98]) maps the data waveforms into an output space called image space, where the output reflection images of the subsurface are formed based on an imaging condition. This method seeks the reflectivity image as the best fit in the image space between the extrapolation of time-reversed waveform data and the prediction of wavefields based on the estimated velocity model and source parameters. The modeling nature of RTM eases the use of different wave modes (e.g., [99]) and model complexity like attenuation and velocity anisotropy (e.g., [101]). It should be truly beneficial to apply geologic constraints in seismic imaging processes, though this has not been widely performed in seismic imaging studies so far. Whenever possible, we need to use as many signals from the data as possible and find the most suitable method. In all processes involved, including data acquisition, processing, imaging, and interpretation, we recommend following the rule of “from known to unknown” wherever it is applicable.

4.5. Quantifying Seismic Image Fidelity via Machine Learning

In recent years, machine learning has also delivered success in seismic signal/event picking (e.g., [102,103,104]) and structural interpretation (e.g., [105,106,107,108]). In the areas of imaging algorithms and VMB, machine learning advances rapidly and shows strong potential to improve and quantitatively assess seismic image fidelity. For instance, machine learning has been applied to capture the temporal-frequency features from the labeled noise and signals for suppressing noise in field data [109,110]. It has also been experimentally applied to mitigate artifacts in seismic imaging, tomographic VMB, and full-waveform inversion. One common strategy is to train neural network models using synthetic data where the ground truth is known, to learn how to differentiate images with and without artifacts. Typically, a vast number of synthetic models and images are generated as known “labels”, and the neural network models learn to recognize and capture the features of artifacts from synthetic clean images to synthetic contaminated images and subsequently identify and mitigate the artifacts in field data images.
In seismic reflection imaging, Yoo and Zwartjes [111] used “UNet” to separate the hyperbolic artifacts from the background reflectivity. Essentially, the network was assembled to identify and suppress the low-amplitude and hyperbolic events (the smiles), while preserving the true geological reflectors. In least-square migration context, Kaur et al. [112] employed a conditional “CycleGAN” to improve reflectivity images, in which the generator network learns to convert a conventional migration image into a result that resembles a least-squares migration image with more balanced amplitudes, wider spectrum, and fewer artifacts.
In the VMB based on seismic tomography and FWI, direct mapping from the data domain to the model domain using neural networks could be very challenging because of the high nonlinearity in their relationship, the vast number of possible models, and the difficulty in generalizing trained models to varying field data applications [80]. Thus, post-inversion training has been tried, which requires much fewer training samples and focuses on suppressing the inverted velocity artifacts during the inversion. For example, Yang et al. [113] train the U-Net using the true model and first-arrival traveltime tomography result. The trained network has been applied to field data and effectively suppressed the tomographic artifacts. Besides the training of the prediction strategy, another application of neural networks to FWI is based on the concept of deep image prior [114], in which the neural network itself is updated to yield a velocity model (or model updates) that minimizes the data misfit [115]. Under this framework, structural regularization could take migrated images to constrain the inversion and suppress artifacts [116].

5. Discussion

In the early days of exploration seismology, people described seismic image fidelity chiefly on image resolution, and hence improving image resolution was the top priority. For instance, the English translation of a famous Chinese book is titled “High resolution seismic exploration” [6]. However, even for those studies in which accurate image position is not of top concern, we still need to assess the level of image artifacts, which are often associated with the accuracy of image position. Though most resolution tests are able to address distortional artifacts due to insufficient seismic illumination and erroneous velocity model, resolution tests are unable to detect those image artifacts due to mistaking input signals in the making of seismic images. Hence, resolution alone is a necessary but insufficient QC on seismic images. In fact, high resolution is meaningless for distorted or mispositioned images in many situations.
We hope this tutorial review will be useful for geoscientists to better assess seismic image fidelity beyond just the resolution. We recommend quantifying seismic image fidelity via three quantifiable elements: image resolution, artifacts, and position accuracy. These elements are closely related to each other. The level of image artifacts usually decreases with an increase in the accuracy of the velocity model and image position [67]. Further studies are necessary to quantify the relationship between these elements and to develop new imaging methods by taking advantage of the close relationship between the fidelity elements.
To help users unfamiliar with pitfalls in seismic imaging, this tutorial review has taken lessons from exploration and crustal seismology, where verification of the fidelity is the key assurance for success. There is a wider range of methodologies and applications of seismic imaging beyond the examples shown here, though the concept of image fidelity discussed here should still hold. The additional examples include, for instance, the velocity inversion using finite-frequency tomography (e.g., [117,118]) and full-waveform tomography (e.g., [72,75]), ambient-noise tomography (e.g., [119,120,121]), and elastic property inversion using amplitude-versus-offset/angle (e.g., [122,123,124,125]). These image results are impacted by similar limitations and challenges discussed in this review, because the fundamental issues associated with seismic image fidelity occur widely.
Though this review emphasizes the quantifiable elements of seismic image fidelity, we have not delved into the details in assessing the uncertainty in image fidelity. Since uncertainty is a characteristic of seismic data and images, the need for quantifying uncertainty in image fidelity has employed a wide range of statistical approaches (e.g., [49,50,51]). For instance, Monte Carlo statistics are often involved in crustal and mantle ambient-noise tomography and data analysis [120,126,127,128], Bayesian inversion has been taken to map receiver functions and surface wave dispersion [129,130], and energy likelihood function is applied in inversion of surface wave dispersion [131]. To learn the details about uncertainty assessment, we recommend reading case studies like the above, because the key to selecting suitable statistical assessment tools is to fit with the problem we need to solve.
Because seismic imaging aims at assisting the mapping of Earth’s interior properties, there are always new challenges from new practices. Taking a specific example, we have not found an uncomplicated way to tie seismic images with highly deviated wells or horizontal wells commonly seen today. Even for vertical wells, in the presence of significant dip in the rock strata, it is questionable to make the synthetic seismogram based on the convolution model in an assumed layer-cake Earth. Therefore, we must keep the challenges to image fidelity in mind in developing new seismic imaging methods.

6. Conclusions

We have demonstrated the necessity to assess the fidelity of seismic images through a tutorial review on three quantifiable elements: image resolution, artifact, and position. To help find the truth about the Earth’s interior, seismic images are useful only when they possess sufficient fidelity, which must be verified in field applications. The fidelity quantifies the geologic interpretability of seismic images, or how accurately the imaged features have been mapped at the correct positions. While the resolution of seismic images is commonly checked, it is less common and difficult to evaluate the position accuracy of imaged features and detect all artifacts. Most position errors of seismic images are due to errors in the velocity model used by seismic imaging, and VMB is a highly interpretive process. Many deceiving artifacts are produced by mistaking signals, in addition to poor seismic illumination. Based on analyzing the challenges to seismic image fidelity, we propose some general strategies for improving the fidelity. We recommend establishing practical evaluation standards and promoting best practice rules in the processing, imaging, and interpretation of seismic images. To mitigate the image artifacts and position errors, we need to identify their causes and follow the practical rules, such as the rule of “from known to unknown”, in the making and using of seismic images.

Funding

This research received no external funding.

Conflicts of Interest

The authors declare no conflicts of interest.

Abbreviations

The following acronyms are used in this manuscript:
CIGCommon image gather
CMBCore-mantle boundary
FSIMFeature similarity indexing measure
FWIFull waveform inversion
MSEMean squared error
mbsfMeters below seafloor
msbsfMilliseconds below seafloor
QCQuality control
RTMReverse time migration
SNRSignal-to-noise ratio
SSIMStructural similarity index measure
SDSSStructural similarity model
SYNSynthetic seismogram
TWTTwo-way traveltime
VMBVelocity model building
VSPVertical seismic profile
VTIVertical transverse isotropy

References

  1. Zhou, H. Practical Seismic Data Analysis; Cambridge University Press: Cambridge, UK, 2014; p. 482. [Google Scholar]
  2. Ricker, N. Wavelet contraction, wavelet expansion, and the control of seismic resolution. Geophysics 1953, 18, 769–792. [Google Scholar] [CrossRef]
  3. Widess, M.B. Quantifying resolving power of seismic systems. Geophysics 1982, 47, 1160–1173. [Google Scholar] [CrossRef]
  4. Zhou, H. How well can we resolve the deep seismic slab with seismic tomography. Geophys. Res. Lett. 1988, 15, 1425–1428. [Google Scholar] [CrossRef]
  5. Li, Q. The Way Toward Accurate Seismic Prospecting; Petroleum Industry Press: Beijing, China, 1993; p. 196. [Google Scholar]
  6. Li, Q. High Resolution Seismic Exploration; Society of Exploration Geophysicists: Tulsa, OK, USA, 2017; p. 318. [Google Scholar]
  7. Sheriff, R.E.; Geldart, L.P. Exploration Seismology; Cambridge University Press: Cambridge, UK, 1995. [Google Scholar]
  8. Zelt, C.A. Lateral velocity resolution from three-dimensional seismic refraction data. Geophys. J. Int. 1998, 135, 1101–1112. [Google Scholar] [CrossRef]
  9. Zelt, C.A.; Haines, S.; Powers, M.H.; Sheehan, J.; Rohdewald, S.; Link, C.; Hayashi, K.; Zhao, D.; Zhou, H.; Burton, B.L.; et al. Blind test of methods for obtaining 2-D near-surface seismic velocity models from first-arrival traveltimes. J. Environ. Eng. Geophys. 2013, 18, 183–194. [Google Scholar] [CrossRef]
  10. Anderson, D.L. Theory of the Earth; Blackwell Scientific Publications: Oxford, UK, 1989. [Google Scholar]
  11. Zhou, H. A high-resolution P wave model for the top 1200 km of the mantle. J. Geophys. Res. Solid Earth 1996, 101, 27791–27810. [Google Scholar] [CrossRef]
  12. Song, X.D. Anisotropy of the earth’s inner core. Rev. Geophys. 1997, 35, 297–313. [Google Scholar] [CrossRef]
  13. Song, X.D.; Helmberger, D.V. Seismic evidence for an inner core transition zone. Science 1998, 282, 924–927. [Google Scholar] [CrossRef]
  14. Aki, K.; Richards, P.G. Quantitative Seismology, 2nd ed.; University Science Books: Sausalito, CA, USA, 2002. [Google Scholar]
  15. Zheng, Y.C.; Lay, T.; Flanagan, M.P.; Williams, Q. Pervasive seismic wave reflectivity and metasomatism of the Tonga mantle wedge. Science 2007, 316, 855–859. [Google Scholar] [CrossRef]
  16. Nolet, G. A Breviary of Seismic Tomography; Cambridge University Press: Cambridge, UK, 2008. [Google Scholar]
  17. Devaney, A.J. Geophysical diffraction tomography. IEEE Trans. Geosci. Remote Sens. 1984, 22, 3–13. [Google Scholar] [CrossRef]
  18. Wu, R.S.; Toksöz, M.N. Diffraction tomography and multisource holography applied to seismic imaging. Geophysics 1987, 52, 11–25. [Google Scholar] [CrossRef]
  19. Zhou, H.; Clayton, R.W. P and S-wave travel time inversions for subducting slab under the island arcs of the Northwest Pacific. J. Geophys. Res. Solid Earth 1990, 95, 6829–6851. [Google Scholar] [CrossRef]
  20. Nolet, G. Partitioned wave-form inversion and 2-dimensional structure under the network of autonomously recording seismographs. J. Geophys. Res. Solid Earth 1990, 95, 8499–8512. [Google Scholar] [CrossRef]
  21. Billien, M.; Leveque, J.J.; Trampert, J. Global maps of Rayleigh wave attenuation for periods between 40 and 150 seconds. Geophys. Res. Lett. 2000, 27, 3619–3622. [Google Scholar] [CrossRef]
  22. Zheng, S.H.; Sun, X.L.; Song, X.D.; Yang, Y.J.; Ritzwoller, M.H. Surface wave tomography of China from ambient seismic noise correlation. Geochem. Geophys. Geosyst. 2008, 9, Q02018. [Google Scholar] [CrossRef]
  23. Berkhout, A.J. Seismic Migration, Imaging of Acoustic Energy by Wavefield Extrapolation, Theoretical Aspects; Elsevier: Amsterdam, The Netherlands, 1982. [Google Scholar]
  24. Gardner, G.H. Migration of Seismic Data; Society of Exploration Geophysicists: Tulsa, OK, USA, 1985. [Google Scholar]
  25. Steer, D.N.; Knapp, J.H.; Brown, L.D. Super-deep reflection profiling: Exploring the continental mantle lid. Tectonophysics 1998, 286, 111–121. [Google Scholar] [CrossRef]
  26. Etgen, J.; Gray, S.H.; Zhang, Y. An overview of depth imaging in exploration geophysics. Geophysics 2009, 74, WCA5–WCA17. [Google Scholar] [CrossRef]
  27. Langston, C.A. Structure under Mount Rainier, Washington, inferred from teleseismic body waves. J. Geophys. Res. 1979, 84, 4749–4762. [Google Scholar] [CrossRef]
  28. Zhu, L.; Kanamori, H. Moho depth variation in southern California from teleseismic receiver functions. J. Geophys. Res. Solid Earth 2000, 105, 2969–2980. [Google Scholar] [CrossRef]
  29. Savage, M.K.; Park, J.; Todd, H. Velocity and anisotropy structure at the Hikurangi subduction margin, New Zealand from receiver functions. Geophys. J. Int. 2007, 168, 1034–1050. [Google Scholar] [CrossRef]
  30. Reynolds, J.M. An Introduction to Applied and Environmental Geophysics, 2nd ed.; John Wiley & Sons: Chichester, UK, 2011. [Google Scholar]
  31. Biondi, B.L. 3D Seismic Imaging; SEG: Tulsa, OK, USA, 2006. [Google Scholar]
  32. Ikelle, L.T.; Amundsen, L. Introduction to Petroleum Seismology, 2nd ed.; SEG: Tulsa, OK, USA, 2018. [Google Scholar]
  33. Dziewonski, A.M.; Romanowicz, B.A. Deep Earth seismology. In Treatise on Geophysics, 2nd ed.; Schubert, G., Ed.; Elsevier: Amsterdam, The Netherlands, 2015; Volume 1, pp. 11–50. [Google Scholar]
  34. Stern, T.A.; Henrys, S.A.; Okaya, D.; Louie, J.N.; Savage, M.K.; Lamb, S.; Sato, H.; Sutherland, R.; Iwasaki, T. A seismic reflection image for the base of a tectonic plate. Nature 2015, 518, 85–88. [Google Scholar] [CrossRef] [PubMed]
  35. Zhou, H. On the layering artifacts in seismic imageries. J. Earth Sci. 2011, 22, 182–194. [Google Scholar] [CrossRef]
  36. Zhou, H.; Zou, Z.; Li, Z. Detecting artifacts in seismic profiles. Rev. Geophys. Planet. Phys. 2021, 52, 45–53. [Google Scholar] [CrossRef]
  37. Barbosa, N.D.; Prado, R.; Costa, J.C.; Siqueira, S.R. Workflow for seismic imaging with quantified uncertainty. Geophysics 2020, 85, 104615. [Google Scholar] [CrossRef]
  38. Liu, X.; Chen, Y.; Huang, L.; Zhang, H. Uncertainty quantification in full-waveform inversion using BFGS-based Hessian approximations. Geophysics 2022, 87, R425–R440. [Google Scholar]
  39. Yilmaz, O. Seismic Data Processing; Investigations in Geophysics, No. 2; Society of Exploration Geophysicists: Tulsa, OK, USA, 1987. [Google Scholar]
  40. Sheriff, R.E. Encyclopedic Dictionary of Exploration Geophysics, 3rd ed.; Society of Exploration Geophysicists: Tulsa, OK, USA, 1991. [Google Scholar]
  41. Pratt, R.G. A Short Course on Waveform Tomography; Queen’s University: Kingston, ON, Canada, 2005. [Google Scholar]
  42. Wielandt, E. On the validity of the ray approximation for interpreting delay times. In Seismic Tomography; Nolet, G., Ed.; Springer: Dordrecht, The Netherlands, 1987; pp. 85–98. [Google Scholar]
  43. Kallweit, R.S.; Wood, L.C. The limits of resolution of zero-phase wavelets. Geophysics 1982, 47, 1035–1046. [Google Scholar] [CrossRef]
  44. Knopoff, L. Q. Rev. Geophys. 1964, 2, 625–660. [Google Scholar]
  45. Xie, X.B.; Jin, S.W.; Wu, R.S. Wave-equation-based seismic illumination analysis. Geophysics 2006, 71, S169–S177. [Google Scholar] [CrossRef]
  46. Rawlinson, N.; Spakman, W. On the use of sensitivity tests in seismic tomography. Geophys. J. Int. 2016, 205, 1221–1243. [Google Scholar] [CrossRef]
  47. Rawlinson, N.; Fichtner, A.; Sambridge, M.; Young, M.K. Seismic tomography and the assessment of uncertainty. In Advances in Geophysics; Dmowska, R., Ed.; Elsevier: Amsterdam, The Netherlands, 2014; Volume 55, pp. 1–76. [Google Scholar]
  48. Zhou, H.; Li, L.; Bjorklund, T.; Thornton, M. A comparative analysis of deformable layer tomography and cell tomography along the LARSE lines in southern California. Geophys. J. Int. 2010, 180, 1200–1222. [Google Scholar] [CrossRef]
  49. Wang, Z.; Bovik, A.C.; Sheikh, H.R.; Simoncelli, E.P. Image Quality Assessment: From Error Visibility to Structural Similarity. IEEE Trans. Image Process. 2004, 13, 600–612. [Google Scholar] [CrossRef]
  50. Yang, N.; Duan, Y. Human vision system-based structural similarity model for evaluating seismic image quality. Geophysics 2018, 83, F49–F54. [Google Scholar] [CrossRef]
  51. Chacon-Buitrago, N.; Pyrcz, M.J. Machine learning-based soft data checking for subsurface modeling. Geosciences 2025, 15, 288. [Google Scholar] [CrossRef]
  52. Louie, J.N.; Chavez-Perez, S.; Henrys, S.; Bannister, S. Multimode migration of scattered and converted waves for the structure of the Hikurangi slab interface, New Zealand. Tectonophysics 2002, 355, 227–246. [Google Scholar] [CrossRef]
  53. Zhou, H.; Hu, H.; Zou, Z.; Wo, Y.; Youn, O. Reverse time migration: A prospect of seismic imaging methodology. Earth-Sci. Rev. 2018, 179, 207–227. [Google Scholar] [CrossRef]
  54. Rumpfhuber, E.M.; Keller, G.R.; Sandvol, E.; Velasco, A.A.; Wilson, D.C. Rocky Mountain evolution: Tying Continental Dynamics of the Rocky Mountains and Deep Probe seismic experiments with receiver functions. J. Geophys. Res. Solid Earth 2009, 114, B08312. [Google Scholar] [CrossRef]
  55. Youn, O.K.; Zhou, H. Depth imaging with multiples. Geophysics 2001, 66, 246–255. [Google Scholar] [CrossRef]
  56. Zhou, H.; Mendoza, J.A.; Link, C.A.; Jech, J.; McDonald, J.A. Crosswell imaging in a shallow unconsolidated reservoir. Lead. Edge 1993, 12, 32–36. [Google Scholar] [CrossRef]
  57. Zelt, C.A. Modelling strategies and model assessment for wide-angle seismic traveltime data. Geophys. J. Int. 1999, 139, 183–204. [Google Scholar] [CrossRef]
  58. Shearer, P.M. Introduction to Seismology, 3rd ed.; Cambridge University Press: Cambridge, UK, 2019. [Google Scholar]
  59. Zhang, Y.; Sun, J.C.; Gray, S.H. Aliasing in wavefield extrapolation prestack migration. Geophysics 2003, 68, 629–633. [Google Scholar] [CrossRef]
  60. Hu, H.; Wang, Y.; Chang, X.; Xie, S. Migration of free-surface-related multiples: Removing artifacts using a water-layer model. J. Appl. Geophys. 2015, 112, 147–156. [Google Scholar] [CrossRef]
  61. Dragoset, W.H.; Jericevic, Z. Some remarks on surface multiple attenuation. Geophysics 1998, 63, 772–789. [Google Scholar] [CrossRef]
  62. Gantela, C.; Bian, A.; Zhou, H.; Bjorklund, H. De-masking multiple artifact in crustal seismic images from marine reflection data in southern California borderland. J. Earth Sci. 2015, 26, 592–597. [Google Scholar] [CrossRef]
  63. Guitton, A.; Kaelin, B.; Biondi, B. Least-squares attenuation of reverse-time-migration artifacts. Geophysics 2007, 72, S19–S23. [Google Scholar] [CrossRef]
  64. Zhao, D. Seismic structure and origin of hotspots and mantle plumes. Earth Planet. Sci. Lett. 2001, 192, 251–265. [Google Scholar] [CrossRef]
  65. Lazarevic, I. Impact of Kirchhoff and Wave Equation Prestack Depth Migrations in Improving Lateral Resolution in a Land Data Environment. Master’s Thesis, University of Houston, Houston, TX, USA, 2004. [Google Scholar]
  66. Alyahya, K. Velocity analysis by iterative profile migration. Geophysics 1989, 54, 718–729. [Google Scholar] [CrossRef]
  67. Mackay, S.; Abma, R. Imaging and velocity estimation with depth-focusing analysis. Geophysics 1992, 57, 1608–1622. [Google Scholar] [CrossRef]
  68. Kosloff, D.; Sherwood, J.; Koren, Z.; Machet, E.; Falkovitz, Y. Velocity and interface depth determination by tomography of depth migrated gathers. Geophysics 1996, 61, 1511–1523. [Google Scholar] [CrossRef]
  69. Sarkar, D.; Tsvankin, I. Anisotropic migration velocity analysis: Application to a data set from West Africa. Geophys. Prospect. 2006, 54, 575–587. [Google Scholar] [CrossRef]
  70. Abrams, L.J. Correlation between core, logging, and seismic data at Site 1149 in the Nadezhda Basin. In Proceedings of the Ocean Drilling Program, Scientific Results; Ludden, J.N., Plank, T., Escutia, C., Eds.; Texas A&M University: College Station, TX, USA, 2002; Volume 185, pp. 1–14. [Google Scholar]
  71. O’Brien, J.; Harris, R. Multicomponent VSP imaging of tight-gas sands. Geophysics 2006, 71, E83–E90. [Google Scholar] [CrossRef]
  72. Tarantola, A. Inversion of seismic-reflection data in the acoustic approximation. Geophysics 1984, 49, 1259–1266. [Google Scholar] [CrossRef]
  73. Tarantola, A. Inverse Problem Theory and Methods for Model Parameter Estimation; Society for Industrial and Applied Mathematics (SIAM): Philadelphia, PA, USA, 2005; p. 354. [Google Scholar]
  74. Virieux, J.; Operto, S. An overview of full-waveform inversion in exploration geophysics. Geophysics 2009, 74, WCC1–WCC26. [Google Scholar] [CrossRef]
  75. Tromp, J. Seismic wavefield imaging of Earth’s interior across scales. Nat. Rev. Earth Environ. 2019, 1, 40–53. [Google Scholar] [CrossRef]
  76. Cao, H.M.; Xie, J.; Kim, Y.; Zhou, H. Multiscale migration tomography to constrain depth-imaging artifacts. Geophysics 2008, 73, VE217–VE222. [Google Scholar] [CrossRef]
  77. Zhou, H. Multiscale traveltime tomography. Geophysics 2003, 68, 1639–1649. [Google Scholar] [CrossRef]
  78. Mosser, L.; Kimman, W.; Dramsch, J.; Purves, S.; De la Fuente, A.; Ganssle, G. Rapid seismic domain transfer: Seismic velocity inversion and modeling using deep generative neural networks. In Proceedings of the 80th EAGE Conference and Exhibition 2018, Copenhagen, Denmark, 11–14 June 2018; pp. 1–5. [Google Scholar]
  79. Wu, Y.; Lin, Y.Z.; Zhou, Z. InversionNet: Accurate and efficient seismic waveform inversion with convolutional neural networks. SEG Expand. Abstr. 2018, 2096–2100. [Google Scholar] [CrossRef]
  80. Yang, F.; Ma, J. Deep-learning inversion: A next-generation seismic velocity model building method. Geophysics 2019, 84, R583–R599. [Google Scholar] [CrossRef]
  81. Zhang, Z.P.; Lin, Y.Z. Data-driven seismic waveform inversion: A study on the robustness and generalization. IEEE Trans. Geosci. Remote Sens. 2020, 58, 6900–6913. [Google Scholar] [CrossRef]
  82. Wang, W.L.; Ma, J.W. Velocity model building in a crosswell acquisition geometry with image-trained artificial neural networks. Geophysics 2019, 85, U31–U46. [Google Scholar] [CrossRef]
  83. Yuan, C.; Zhang, X.; Jia, X.F.; Zhang, J. Time-lapse velocity imaging via deep learning. Geophys. J. Int. 2020, 220, 1228–1241. [Google Scholar] [CrossRef]
  84. Araya-Polo, M.; Jennings, J.; Adler, A.; Dahlke, T. Deep-learning tomography. Lead. Edge 2018, 37, 58–66. [Google Scholar] [CrossRef]
  85. Han, M.L.; Zou, Z.H.; Ma, R. Deep learning-driven velocity modeling based on seismic reflection data and multi-scale training sets. Oil Geophys. Prospect. 2021, 56, 935–946. (In Chinese) [Google Scholar]
  86. Geng, Z.C.; Zhao, Z.Y.; Shi, Y.Z.; Wu, X.M.; Fomel, S.; Sen, M. Deep learning for velocity model building with common-image gather volumes. Geophys. J. Int. 2022, 228, 1054–1070. [Google Scholar] [CrossRef]
  87. Li, S.C.; Liu, B.; Ren, Y.X.; Chen, Y.; Yang, S.; Wang, Y.; Jiang, P. Deep-learning inversion of seismic data. IEEE Trans. Geosci. Remote Sens. 2020, 58, 2135–2149. [Google Scholar] [CrossRef]
  88. Liu, B.; Yang, S.L.; Ren, Y.X.; Xu, X.J.; Jiang, P.; Chen, Y.K. Deep-learning seismic full-waveform inversion for realistic structural models. Geophysics 2021, 86, R31–R44. [Google Scholar] [CrossRef]
  89. Guo, R.; Li, M.K.; Xu, S.H.; Abubakar, A. First-arrival traveltime tomography using supervised descent learning technique. Inverse Probl. 2019, 35, 105008. [Google Scholar] [CrossRef]
  90. Zhou, H. Direct inversion of velocity interfaces. Geophys. Res. Lett. 2004, 31, 447–450. [Google Scholar] [CrossRef]
  91. Zhu, L. Deformation in the lower crust and downward extent of the San Andreas Fault as revealed by teleseismic waveforms. Earth Planets Space 2002, 54, 1005–1010. [Google Scholar] [CrossRef]
  92. Fuis, G.S.; Kohler, M.D.; Scherwath, M.; Ten Brink, U.; Van Avendonk, H.J.; Murphy, J.M. A comparison between the transpressional plate boundaries of South Island, New Zealand, and southern California, USA: The Alpine and San Andreas fault systems. Tectonophysics 2007, 429, 307–327. [Google Scholar]
  93. Dziewonski, A.M.; Anderson, D.L. Preliminary reference Earth model. Phys. Earth Planet. Inter. 1981, 25, 297–356. [Google Scholar] [CrossRef]
  94. Kennett, B.L.N.; Engdahl, E.R. Traveltimes for global earthquake location and phase identification. Geophys. J. Int. 1991, 105, 429–465. [Google Scholar] [CrossRef]
  95. Rabbel, W.; Kaban, M.; Tesauro, M. Contrasts of seismic velocity, density and strength across the Moho. Tectonophysics 2013, 609, 437–455. [Google Scholar] [CrossRef]
  96. Wang, B.; Dirks, V.; Guillaume, P.; Audebert, F.; Epili, D. A 3D subsalt tomography based on wave-equation migration-perturbation scans. Geophysics 2006, 71, E1–E6. [Google Scholar] [CrossRef]
  97. Liu, J.; Quan, H.; Li, X.; Marcinkovich, C. Velocity tomography using property scans. SEG Expand. Abstr. 2018, 5157–5162. [Google Scholar] [CrossRef]
  98. Li, Z.; Qu, Y. Research progress on seismic imaging technology. Pet. Sci. 2022, 19, 128–146. [Google Scholar] [CrossRef]
  99. Li, J.; Qu, Y.; Li, Y.; Huang, C.; Li, Z. Ocean bottom dual-sensor Q-compensated elastic least-squares reverse time migration based on acoustic and separated-viscoelastic coupling. Geophysics 2024, 89, S155–S173. [Google Scholar] [CrossRef]
  100. Wang, Y.; Huang, C.; Qu, Y.; Li, M.; Li, J. Velocity-adaptive irregular point spread function deconvolution imaging using X-shaped denoising diffusion filtering. IEEE Trans. Geosci. Remote Sens. 2023, 61, 1–8. [Google Scholar] [CrossRef]
  101. Qu, Y.; Zhu, J.; Chen, Z.; Huang, C.; Wang, Y.; Liu, C. Q-compensated least-squares reverse time migration with velocity-anisotropy correction based on the first-order velocity-pressure equations. Geophysics 2022, 87, S335–S350. [Google Scholar] [CrossRef]
  102. Mousavi, S.M.; Ellsworth, W.L.; Zhu, W.; Chuang, L.Y.; Beroza, G.C. Earthquake transformer—An attentive deep-learning model for simultaneous earthquake detection and phase picking. Nat. Commun. 2020, 11, 3952. [Google Scholar] [CrossRef] [PubMed]
  103. Cano, E.V.; Akram, J.; Peter, D.B. Automatic seismic phase picking based on unsupervised machine-learning classification and content information analysis. Geophysics 2021, 86, V299–V315. [Google Scholar] [CrossRef]
  104. Zhu, W.; Tai, K.S.; Mousavi, S.M.; Bailis, P.; Beroza, G.C. An end-to-end earthquake detection method for joint phase picking and association using deep learning. J. Geophys. Res. Solid Earth 2022, 127, e2021JB023283. [Google Scholar] [CrossRef]
  105. Wang, Z.; Di, H.; Shafiq, M.A.; Alaudah, Y.; AlRegib, G. Successful leveraging of image processing and machine learning in seismic structural interpretation: A review. Lead. Edge 2018, 37, 451–461. [Google Scholar] [CrossRef]
  106. Xiong, W.; Ji, X.; Ma, Y.; Wang, Y.; AlBinHassan, N.M.; Ali, M.N.; Luo, Y. Seismic fault detection with convolutional neural network. Geophysics 2018, 83, O97–O103. [Google Scholar] [CrossRef]
  107. Wu, X.; Liang, L.; Shi, Y.; Fomel, S. FaultSeg3D: Using synthetic data sets to train an end-to-end convolutional neural network for 3D seismic fault segmentation. Geophysics 2019, 84, IM35–IM45. [Google Scholar] [CrossRef]
  108. Anjom, F.K.; Vaccarino, F.; Socco, L.V. Machine learning for seismic exploration: Where are we and how far are we from the holy grail? Geophysics 2024, 89, WA157–WA178. [Google Scholar] [CrossRef]
  109. Gao, Y.; Zhao, P.; Li, G.; Li, H. Seismic noise attenuation by signal reconstruction: An unsupervised machine learning approach. Geophys. Prospect. 2021, 69, 984–1002. [Google Scholar] [CrossRef]
  110. Yang, L.; Chen, W.; Wang, H.; Chen, Y. Deep-learning seismic random-noise attenuation via improved residual convolutional neural network. IEEE Trans. Geosci. Remote Sens. 2021, 59, 7968–7981. [Google Scholar] [CrossRef]
  111. Yoo, J.; Zwartjes, P. Attenuation of seismic migration smile artifacts with deep learning. Artif. Intell. Geosci. 2022, 3, 123–131. [Google Scholar] [CrossRef]
  112. Kaur, H.; Pham, N.; Fomel, S. Improving the resolution of migrated images by approximating the inverse Hessian using deep learning. Geophysics 2020, 85, WA173–WA183. [Google Scholar] [CrossRef]
  113. Yang, H.; Li, P.; Ma, F.; Zhang, J. Building near-surface velocity models by integrating the first-arrival traveltime tomography and supervised deep learning. Geophys. J. Int. 2023, 235, 326–341. [Google Scholar] [CrossRef]
  114. Ulyanov, D.; Vedaldi, A.; Lempitsky, V. Deep image prior. In Proceedings of the Conference on Computer Vision and Pattern Recognition, Salt Lake City, UT, USA, 18–22 June 2018; IEEE: New York, NY, USA, 2018. [Google Scholar]
  115. Zhu, W.; Xu, K.; Darve, E.; Biondi, B.; Beroza, G.C. Integrating deep neural networks with full-waveform inversion: Reparameterization, regularization, and uncertainty quantification. Geophysics 2022, 87, R93–R109. [Google Scholar] [CrossRef]
  116. Lu, K.; Wang, Y. Seismic full-waveform inversion regularized with a migration image. Geophysics 2025, 90, R143–R157. [Google Scholar] [CrossRef]
  117. Marquering, H.; Dahlen, F.A.; Nolet, G. Three-dimensional sensitivity kernels for finite-frequency traveltimes: The banana-doughnut paradox. Geophys. J. Int. 1999, 137, 805–815. [Google Scholar] [CrossRef]
  118. Tape, C.; Liu, Q.; Tromp, J. Finite-frequency tomography using adjoint methods: Methodology and examples using membrane surface waves. Geophys. J. Int. 2007, 168, 1105–1129. [Google Scholar] [CrossRef]
  119. Shapiro, N.M.; Campillo, M. Emergence of broadband Rayleigh waves from correlations of the ambient seismic noise. Geophys. Res. Lett. 2004, 31, L07614. [Google Scholar] [CrossRef]
  120. Shapiro, N.M.; Campillo, M.; Stehly, L.; Ritzwoller, M.H. High-resolution surface-wave tomography from ambient seismic noise. Science 2005, 307, 1615–1618. [Google Scholar] [CrossRef]
  121. Bonnefoy-Claudet, S.; Cotton, F.; Bard, P.Y. The nature of noise wavefield and its applications for site effects studies—A literature review. Earth-Sci. Rev. 2006, 79, 205–227. [Google Scholar] [CrossRef]
  122. Shuey, R.T. A simplification of the Zoeppritz equations. Geophysics 1985, 50, 609–614. [Google Scholar] [CrossRef]
  123. Hilterman, F.J. Is AVO the seismic signature of rock properties? SEG Expand. Abstr. 1989, 559. [Google Scholar] [CrossRef]
  124. Rutherford, S.R.; Williams, R.H. Amplitude-versus-offset variations in gas sands. Geophysics 1989, 54, 680–688. [Google Scholar] [CrossRef]
  125. Persh, S.E.; Vidale, J.E. Reflection properties of the core-mantle boundary from global stacks of PcP and ScP. J. Geophys. Res. Solid Earth 2004, 109, B04309. [Google Scholar] [CrossRef]
  126. Shapiro, N.; Ritzwoller, M. Monte Carlo inversion for a global shear-velocity model of the crust and upper mantle. Geophys. J. Int. 2002, 151, 88–105. [Google Scholar] [CrossRef]
  127. Yao, H.; Van der Hilst, R.D. Analysis of ambient-noise energy distribution and phase-velocity bias in ambient-noise tomography, with application to SE Tibet. Geophys. J. Int. 2009, 179, 1113–1132. [Google Scholar] [CrossRef]
  128. Zhang, X.; Curtis, A.; Galetti, E.; de Ridder, S. 3-D Monte Carlo surface-wave tomography. Geophys. J. Int. 2018, 215, 1644–1658. [Google Scholar] [CrossRef]
  129. Dreiling, J.; Tilmann, F. BayHunter—McMC Transdimensional Bayesian Inversion of Receiver Functions and Surface Wave Dispersion; Version 1.0; GFZ Data Services: Potsdam, Germany, 2019. [Google Scholar]
  130. Dreiling, J.; Tilmann, F.; Yuan, X.; Haberland, C.; Seneviratne, C.W.M. Crustal structure of Sri Lanka derived from joint inversion of surface-wave dispersion and receiver functions using a Bayesian approach. J. Geophys. Res. Solid Earth 2020, 125, e2019JB018688. [Google Scholar] [CrossRef]
  131. Zhang, X.; Zheng, Y.; Curtis, A. Surface-wave dispersion inversion using an energy likelihood function. Geophys. J. Int. 2023, 232, 523–536. [Google Scholar] [CrossRef]
Figure 1. An illustration of Fresnel zones of wavefields in a model of constant velocity of 3 km/s (after [41]). (a) Transmitted wavefield of 300 Hz from a source (star). (b) Transmitted wavefield of 300 Hz from a receiver (triangle). (c) The combined wavefield is a superposition of two wavefields in (a,b), consisting of elliptical wavefronts known as Fresnel zones due to interferences between the two monochromatic wavefields. The width of the first Fresnel zone (green dashed ellipse) is the horizontal resolution (red line with arrows).
Geosciences 15 00445 g001
Figure 2. Filtering an impulse wavelet and a reflectivity time sequence (the top trace) with Ormsby filters at four bandwidths. The four numbers below each spectrum are the lowest, low-corner, high-corner, and highest frequencies of the filter in Hz. Notice in the four filtering cases, the increasing amplitude and width of the sidelobes of the wavelet with the narrowing of frequency bandwidth.
Geosciences 15 00445 g002
Figure 3. Synthetic reconstruction test by Rawlinson et al. [47]. (a) Raypaths from 40 sources (white stars) to 14 receivers (blue triangles) in the synthetic true velocity model. (b) Reconstructed model using an initial model of a uniform velocity of 3.0 km/s.
Geosciences 15 00445 g003
Figure 4. Two VSP images from (a) conventional migration using up-going primary reflections and (b) RTM using both up-going and down-going waves (modified from [55]).
Geosciences 15 00445 g004
Figure 5. Velocity contour plots of a checkerboard resolution test for a cross-well tomography [56]. (a) Synthetic model of velocity anomalies. (b) First arrival raypaths. (c) Recovered structures, showing uncovered areas in black and some along-raypath smearing artifacts.
Geosciences 15 00445 g005
Figure 6. Depth migration profiles showing the effects of using improper signals in seismic imaging [61]. (a) Profile with artifacts in the dashed ellipse from mistaking multiple reflections from salt interfaces as primary reflection signals. (b) After eliminating surface-related multiple reflections in the dashed ellipse.
Geosciences 15 00445 g006
Figure 7. Seismic profiles of LARSE Line 1 produced by (a) normal moveout stacking and (b) RTM [62]. The dashed ellipse in pink color in (a) highlights the artifacts from multiples and sideswipes. Many of the artifacts disappear in (b), though some long-wavelength imaging artifacts appear over shallow sediments.
Geosciences 15 00445 g007
Figure 8. An example of processing artifacts. (a) Seismic reflection profile from RTM imaging, showing low-frequency artifacts due to the cross-correlation imaging condition [63]. (b) After the Laplacian filtering [55].
Geosciences 15 00445 g008
Figure 9. Cartoon cross-sections showing the demean artifact (after [35]). (a) A Vp model containing a plume and the numbers denote velocity contours in km/s. (b) Perfect plume velocity anomaly that is −3% slower than the background 1D velocities in (a). (c) Imperfect plume velocity anomaly after removing the layer averages of (a). Panels (d,e) are the synthetic and inverted models, respectively, of a resolution test along a cross-section beneath Hawaii [64], from surface down to core-mantle boundary (CMB). Reddish, yellow and greenish colors in (d,e) denote slow, neutral and fast velocities, respectively.
Geosciences 15 00445 g009
Figure 10. Three profiles of color-coded migrated images of a synthetic salt model showing the impact of velocity variations [65]. (a) Result using the correct velocity model. (b) Result using a 10% slower velocity model, showing many migration ‘smile’ artifacts, like that denoted by an arrow. (c) Result using a 10% faster velocity model, showing some migration ‘frown’ artifacts.
Geosciences 15 00445 g010
Figure 11. Two reflection profiles based on the same data but different velocity models and imaging methods [69]. (a) Prestack time migration using a VTI velocity model from time processing. (b) Prestack depth migration using a VTI velocity model from migration velocity analysis. The arrows point to similar features that changed positions and appearance.
Geosciences 15 00445 g011
Figure 12. Illustration of tying the well-based lithology, stratigraphy, and reflectivity in CPA Holes 1149 A and B with a color-coded seismic profile in the Nadezhda Basin (after [70]) in the NW Pacific Ocean. Each trace of the synthetic seismogram (SYN) is a convolution of the source wavelet with the reflectivity curve derived from the velocity and density logs. The vertical scale is measured in depth of meters below seafloor (mbsf) for the columns in the green box, and in two-way traveltime (TWT) of milliseconds below seafloor (msbsf) for the columns in the pink box.
Geosciences 15 00445 g012
Figure 13. A VSP-seismic tie [71] showing the same formations in color. (a) A seismic profile coincides with the offset VSP. (b) VSP corridor stack. (c) VSP migrated image.
Geosciences 15 00445 g013
Figure 14. Examples showing the influence of velocity models on the reflectors on common image gathers or CIGs in Gulf of Mexico [76]. (a) Velocity model of a salt body in the lower-left corner and sediments. (b) Migrated CIGs using the model in (a). (c) Updated velocity model. (d) Migrated CIGs using the model in (c). The ellipses in (b,d) highlight areas of improvement in the CIGs.
Geosciences 15 00445 g014
Figure 15. Synthetic reconstruction exercise for evaluating the recovery of velocity interfaces by deformable layer tomography [90]. (a) First-arrival raypaths (black curves) in the synthetic true velocity model. Stars and triangles denote stations and events, respectively. (b) Initial reference model of some constant-velocity layers. (c) Reconstructed velocities in color, in comparison with the true velocity interfaces marked by the dashed lines.
Geosciences 15 00445 g015
Figure 16. Map view and crustal profile for mapping the Moho discontinuity in Southern California via three different datasets and methods. (1) Vp Moho (dashed line in yellow color) from tomography velocities using earthquake data [48]. (2) PmP Moho (solid and dotted line in light blue color) based on reflection data [92]. (3) Moho depth ranges at six locations (bars in red color) based on receiver functions [91]. The map view shows the stations (blue triangles) and earthquakes (purple dots) used by [48], and shots (red circles) and stations (black triangles) provided the PmP data [92]. Names of faults: Santa Monica (SMF), Santa Susana (SSF), San Gabriel (SGF), San Andreas (SAF), and Garlock (GF).
Geosciences 15 00445 g016
Table 1. Six data quality factors impacting seismic image fidelity.
Data Quality FactorImpacts on Seismic Image Fidelity
0.
Delivery time and cost
Setting practical limits on data size and image fidelity
1.
SNR (signal to noise ratio)
Defining the quality of signals, requiring sufficiently high-quality sources and receivers and sufficiently good control on site effects
2.
Frequency content (bandwidth and central frequency)
High time resolution requires broad signal bandwidth (especially low frequencies) and high central frequency
3.
Seismic illumination (or data coverage, spatial coverage)
Sufficiently fine and even spatial coverage of targets require sufficiently wide-angle and dense survey layout; Key for spatial resolution to suppress artifacts, and for VMB to reduce position errors
4.
Sample rate in time and space
Sufficiently fine to avoid temporal aliasing in each data trace and spatial aliasing in multi-dimensional images
5.
Multi-Component data
Increasing information content that can be especially beneficial at hard-to-access locations (e.g., borehole and ocean bottom)
Table 2. Ten major challenges to seismic image fidelity.
ChallengesCommon SymptomsLikely Causes
1. Limited seismic illuminationWeak/missing reflectors; poor continuityAcquisition gaps; complex overburden
2. Acquisition footprintStripping; azimuthal biasSparse/irregular sampling; footprint artifacts
3. Random noiseLoss of coherence; low SNREnvironmental/cultural noise; weak sources
4. Limited resolutionBlurred thin beds; merged reflectorsBandwidth/aperture limits; overlapping wavelet sidelobes
5. Internal multiples and coherent noiseFalse reflectors; spurious eventsUnable to recognize interbed multiples; reverberations
6. Limited low-frequency signalPoor large-scale recovery; cycle skippingSource and receiver limits; absorption/attenuation
7. Velocity model uncertaintyMispositioned reflectors; image distortionInaccurate picking; unaccounted velocity anisotropy
8. Anisotropy effectsCurved reflections on gathers; depth errorsNeglecting VTI/TTI; poor azimuth/offset coverage
9. Lack of uncertainty quantificationNo error bounds; misleading imagesDeterministic workflows; few probabilistic methods
10. Imaging artifactsSmearing; smiles and frown; fake featuresLimited illumination; improper signal and processing
Disclaimer/Publisher’s Note: The statements, opinions and data contained in all publications are solely those of the individual author(s) and contributor(s) and not of MDPI and/or the editor(s). MDPI and/or the editor(s) disclaim responsibility for any injury to people or property resulting from any ideas, methods, instructions or products referred to in the content.