Article

Geomorphodynamic Controls on the Distribution and Abundance of the Federally Threatened Puritan Tiger Beetle (Ellipsoptera puritana) Along the Maryland Chesapeake Bay Coast and Implications for Conservation

by
Michael S. Fenster
1,* and
C. Barry Knisley
2
1
Geology/Environmental Studies Programs, Randolph-Macon College, Ashland, VA 23005, USA
2
Department of Biology, Randolph-Macon College, Ashland, VA 23005, USA
*
Author to whom correspondence should be addressed.
Geosciences 2025, 15(12), 444; https://doi.org/10.3390/geosciences15120444 (registering DOI)
Submission received: 1 October 2025 / Revised: 4 November 2025 / Accepted: 18 November 2025 / Published: 22 November 2025
(This article belongs to the Section Biogeosciences)

Abstract

The federally threatened Puritan tiger beetle (Ellipsoptera puritana; PTB) inhabits Upper Chesapeake Bay bluffs, beaches and Connecticut River point bars. This study focuses on Maryland’s Chesapeake Bay population (Calvert County and Sassafras River), where adult PTBs prey on beach arthropods but establish larval habitat on the adjacent bluffs. A combination of panoramic photography, GIS mapping, and field and laboratory measurements of sedimentological and ecological characteristics were measured across 17 high- and low-density Maryland beetle sites to identify the geologic and biological controls on population distribution and abundance. Results indicate that temporal and spatial fluctuations in PTB abundance are governed by bluff face quality, which in turn, is shaped by antecedent geology (medium-compacted, fine-to-medium, well-sorted sands) and bluff dynamics. We present a four-stage, multi-decadal geomorphodynamic conceptual model in which long-term bluff recession and short-term storm-driven colluvium removal periodically expose fresh bluff surfaces required for larval establishment. By integrating geomorphic, geologic, and ecological perspectives, this study highlights the role of sedimentary processes in maintaining critical estuarine habitats and provides a framework for predicting species persistence in dynamic coastal landscapes.

1. Introduction

1.1. Background and Study Motivation

The Puritan Tiger Beetle (Ellipsoptera puritana, PTB) inhabits bluffs and beaches along the Upper Chesapeake Bay in Maryland and point bars within the Connecticut River in New England. However, the Maryland populations of this federally threatened species have declined in abundance since the mid-1990s. Moreover, efforts to preserve this species in the Chesapeake Bay have led to tension between homeowners who live on top of the eroding bluffs and the PTB that inhabit the “fresh” surfaces produced by the eroding bluffs.
The United States Fish and Wildlife Service (USFWS) listed the PTB as a Threatened Species in 1990 because of the loss of most populations along the Connecticut River and the lack of protection for most existing sites in Maryland [1]. Maryland state law also designates this species as “Endangered.” The New England populations have been small (totals of less than 1000 adults in most years) but relatively stable [2,3]. At the time of this study (2007–2008), the species was known to exist at two locations in Maryland separated by the Chesapeake Bay—the western shore along most of Calvert County (nine sites), the eastern shore along or adjacent to the Sassafras River mouth in Cecil and Kent Counties (eight sites; Figure 1). Two additional sites with small numbers of adults (<25) were discovered in 2014 along the Severn River near the mouth of the Bay [3,4]. Since the time of this study, an additional site has been added to the western shore of the Chesapeake Bay (10 total sites) and at the mouth of the Sassafras River (nine sites) [3,5].
Annual counts for all populations have indicated that the Calvert County metapopulation fluctuated from peak abundance (≈10,000 adults) in the mid- to late-1990s and 2008 to their lowest abundance (<2000 adults) between 1999 and 2005 [5,6]. Since 2008, this metapopulation has fluctuated from high to low numbers on an apparent two- to four-year cycle [5]. Population estimates for the Sassafras River metapopulation show similar fluctuations between high and low numbers with peaks occurring in 2010, 2014, and 2018 [5]. However, PTB numbers currently remain well below peak abundance. A Population Viability Analysis (PVA) based on these annual monitoring data suggested that the significant fluctuations in abundance of both metapopulations caused this species to be at risk of extinction [7]. The effort to manage and recover the species depends on an analysis of habitat quality and how changes in various habitat parameters drive population dynamics [5]. However, much about the habitat indicators and the specific causes of year-to-year variations in abundance is unknown. Ashby [8] and the Maryland Natural Heritage Program [9] speculated that eroding shorelines, structural disturbances, increased coastal development, and increased vegetation growth on the bluffs may have disrupted habitat and consequently led to population declines. Indeed, development along the Chesapeake Bay shore has increased over time with waterfront housing, shoreline stabilization structures, and recreational and tourism activities resulting in potential negative environmental impacts (e.g., ecological and physical system degradation [10,11,12,13,14,15,16]).
Both larvae and adults of PTBs prey on a variety of arthropods and require habitats free of vegetation for their predatory activities. Larvae are sit-and-wait predators that live in burrows, from which they capture prey organisms that pass near their burrows. Adults of the PTB are visual hunters which actively prey on small arthropods and occasionally scavenge on dead fish and crabs found along the shoreline or the bases of bluffs [6,17]. The larvae occupy separate habitats from adults within burrows on the vertical bluff faces adjacent to the narrow sandy beaches where adults are active. Studies have suggested that larvae are largely restricted to patches of fine- to medium-grained sands, often in the upper strata of the bluffs [6,10,17]. Larval habitat is established by the selection of an oviposition site by the adult females, which apparently move from their foraging areas along the beach to the adjacent bluffs, possibly at night. Studies in Maryland found that females oviposit their eggs primarily in sandy deposits on the vertical bluff faces, or sometimes at the base of the bluff in sediment eroded from the bluff face [18]. The first instars hatch during the late summer and dig a burrow at the oviposition site in the bluffs. Development through the three larval instars continues for two years until the second spring when pupation occurs. Adults emerge from their pupal stages in mid-June and reach peak numbers in late June and early July [18].
Although it is generally thought that habitat degradation negatively affects PTB abundance, the specific habitat parameters that control the distribution and abundance of this declining species are not well known. Previous research on the PTB population along the Connecticut River analyzed the effects of moisture, vegetation cover, grain size, and prey availability on the abundance of PTB populations [19]. Particle size emerged as the main density-determining parameter. Omland [19] found that sediment containing mostly medium and fine sand was positively correlated to areas of high larvae density. Also, the grain size on the surface of the burrows had higher correlation to larval density than the grain size of sediment at a depth of 30 cm into the burrows.
The purpose of this study was to determine the geologic and biologic controls on PTB populations in the remaining habitat sections along the Calvert County and Sassafras River shores of Maryland, where coastal habitats differ markedly from the New England riverine setting. Our experimental design integrated a first-order (large spatial scale) assessment of geologic strata and bluff-face vegetation with second-order (smaller spatial scale) comparisons of beach and bluff parameters at high- and low-density adult patches at selected Calvert and Sassafras sites. Although the fieldwork was conducted prior to 2008, these data represent the most comprehensive field-based assessment available for this region and remain critical for understanding long-term organism-habitat relationships. The study enabled development of a four-stage conceptual model linking bluff-face conditions to PTB abundance and provides management guidance for identifying potential restoration sites through vegetation removal.

1.2. Geology of the Study Areas

The two study areas containing PTB populations within the Chesapeake Bay are located approximately 110 km apart on opposite sides of the Chesapeake Bay, and their depositional environments are separated in geologic time by >47.5 my (Figure 1). Both areas contain unconsolidated-to-semi-consolidated Coastal Plain sediments that were deposited during multiple sea-level change episodes. The Calvert County study area contains Lower-to-Middle Miocene-aged units ranging in thickness from 25 to 35 m and in age from c. 17.5 my to 6.3 my [20]. The Sassafras River study area bluffs consist of Upper Cretaceous stratigraphic units, which range in thickness from 4 to 21 m and age from 83 my to 65 my [21]. While the lithology, thickness, and dip of the units vary as a function of broad, tectonic controls and more local variable depositional environments, the units generally dip to the south-southeast at <1° such that the older units descend below the surface, and the younger formations crop out successively to the southeast. The separation of populations by geologic strata and geographic space raises intriguing questions about the geologic and geographic controls on the distribution and abundance of the PTB.

1.2.1. Calvert County, Maryland

The distribution of the PTB in Calvert County, MD spans approximately 40 km along the western shore of the Chesapeake Bay and, at the time of this study, included nine sites: Randle Cliffs, Bayside Forest, Warrior Rest, Scientist Cliffs, Western Shores, Calvert Cliffs Nuclear Power Plant, Calvert Cliffs State Park, Little Cove Point and Cliffs of Calvert (Figure 1). The Calvert County bluffs that back the narrow beaches and provide habitat for larvae consist of three primary geologic formations (i.e., distinct layers of sedimentary rock or unconsolidated-to-semi-consolidated sediments that can be mapped and recognized over a region). These three Tertiary (Miocene) -aged (c. 6.3–17.5 mya) Coastal Plain formations together comprise the Chesapeake Group of the Calvert County cliffs [22,23]. Ward [24] provides a detailed geologic description of the Calvert County bluffs and selected stratigraphic sections.
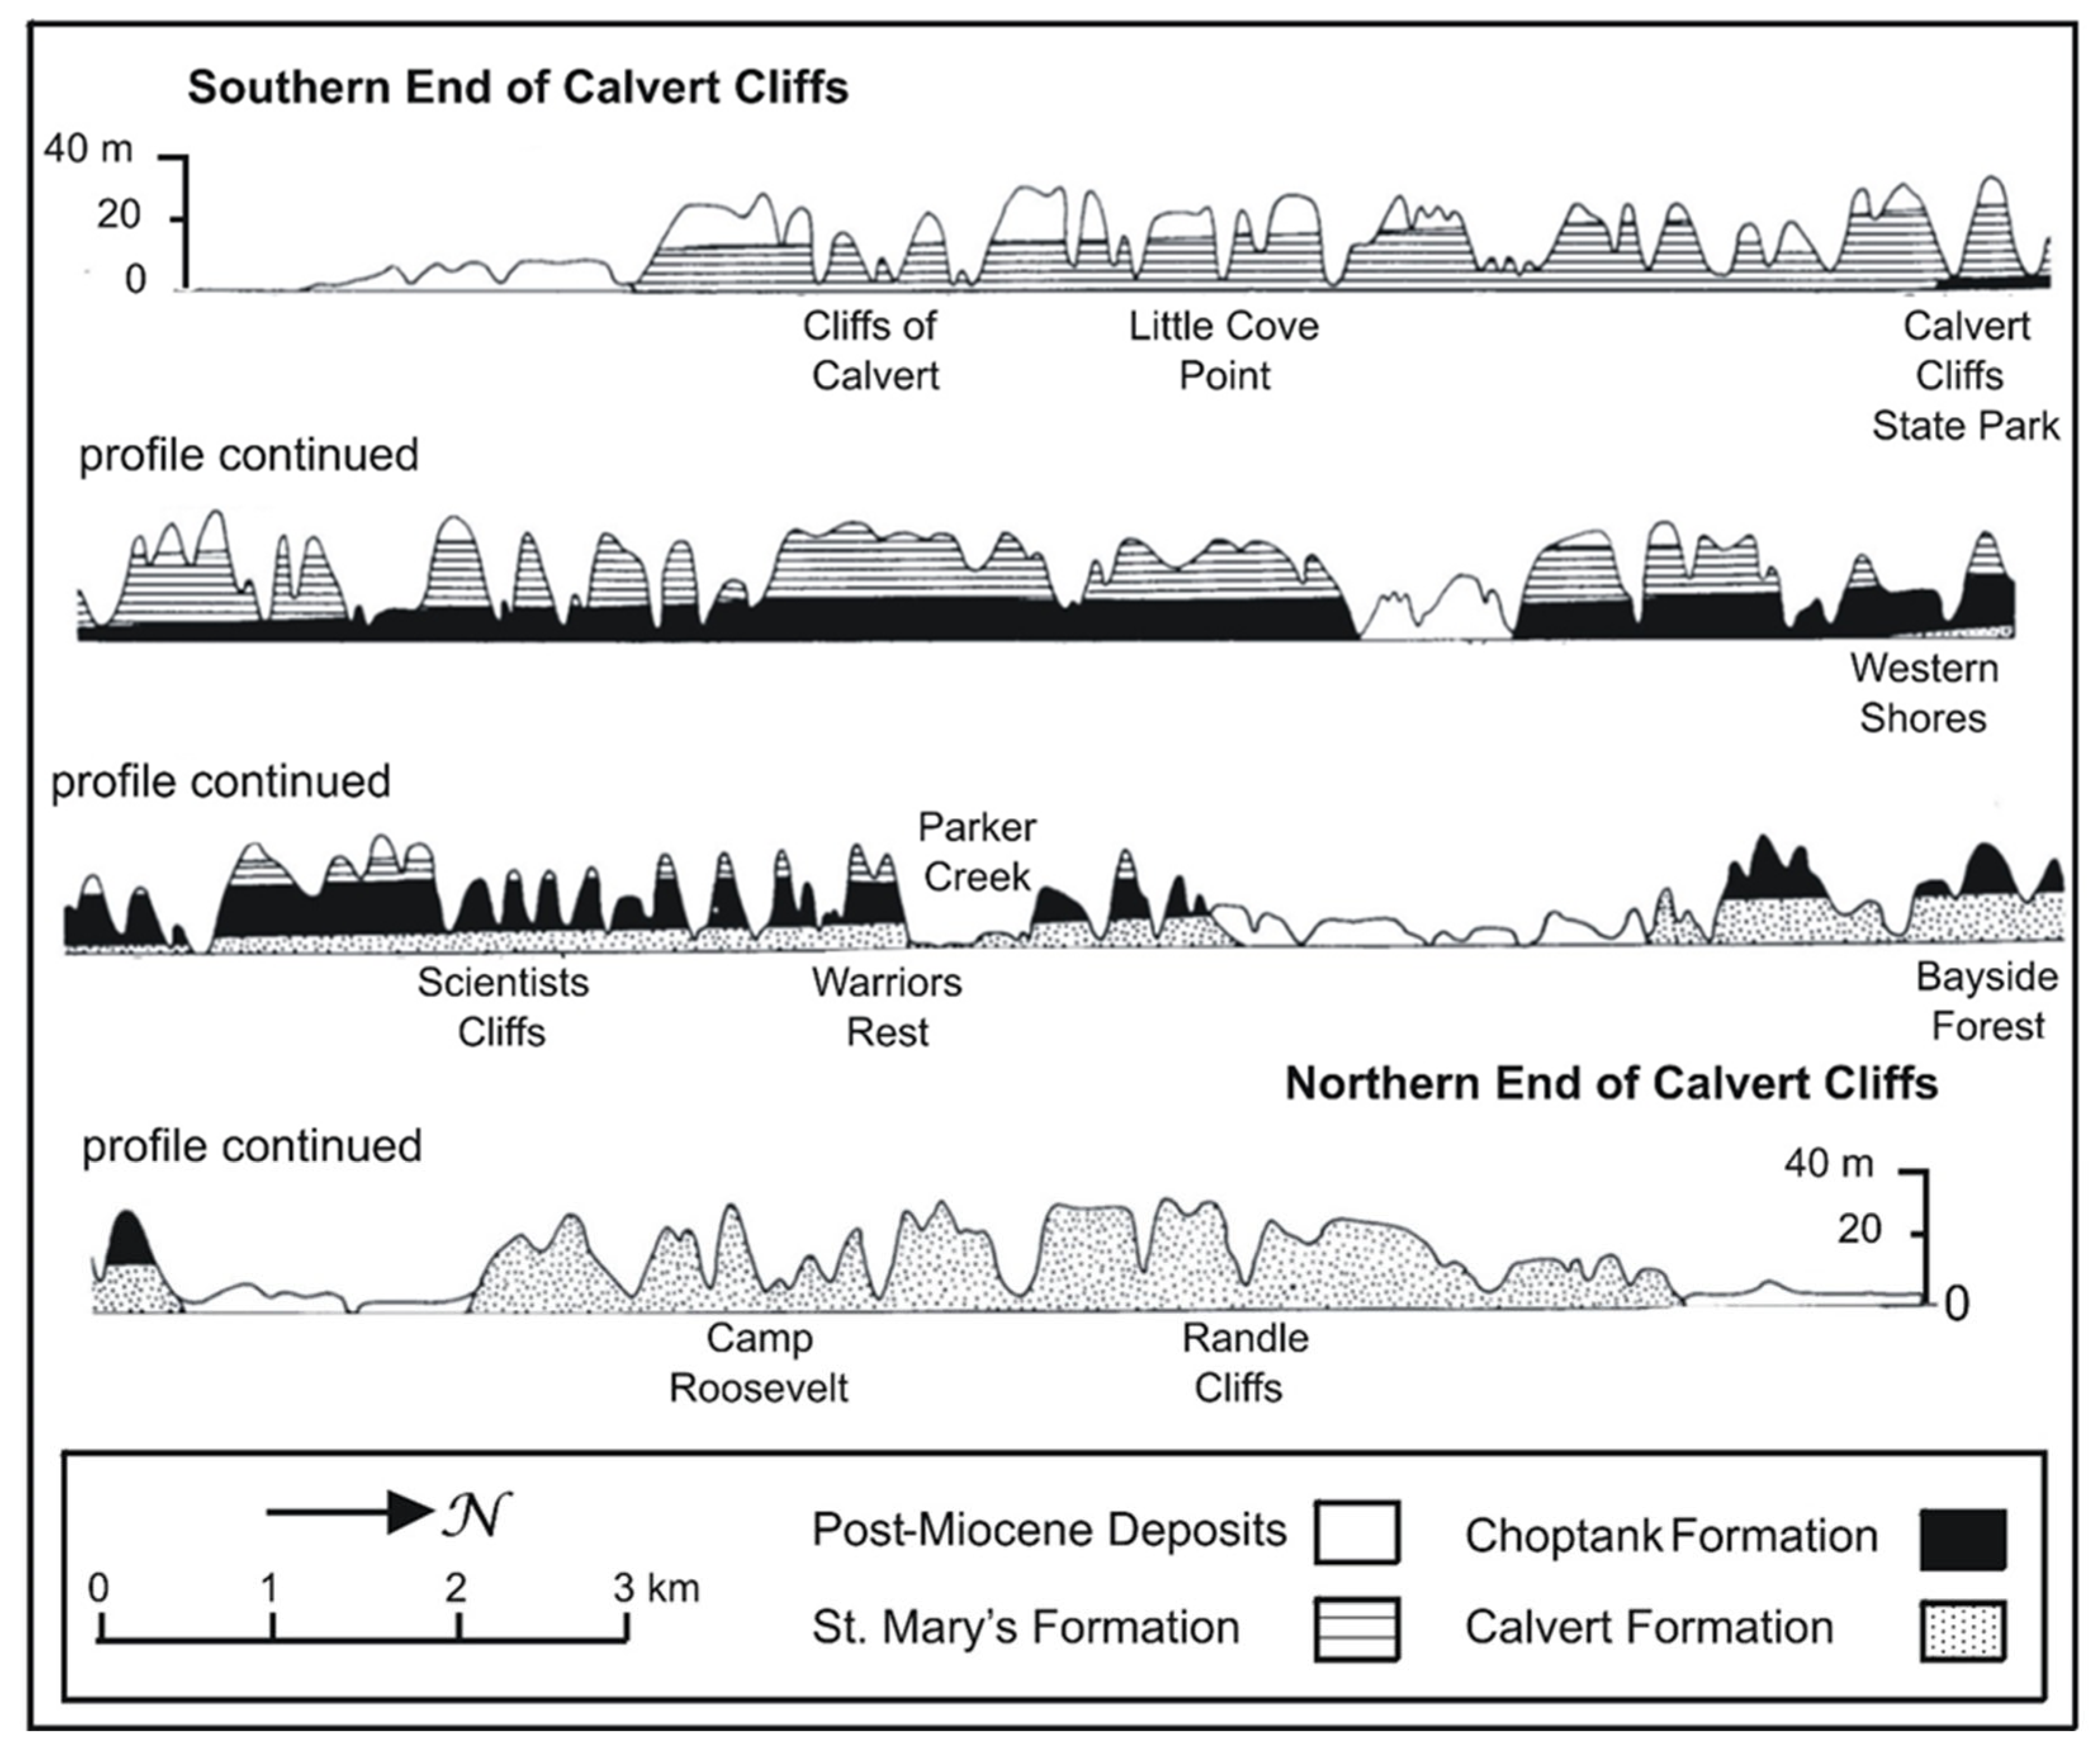
The southeastern dip (or tilt) to these formations (<1°; approximately 2 m/km) results in a decrease in exposed thickness to the south as they ultimately descend beneath the waters of the Chesapeake Bay. Consequently, in Calvert County, the youngest St. Mary’s Formation outcrops along the southern part of the study area at the base of the bluffs from Drum Point to Calvert Cliffs State Park (Figure 2). The next oldest unit, the Choptank Fm., outcrops at the base of the Calvert Cliffs State Park, where it underlies the St. Mary’s Fm. and extends northward to Plum Point. South of Governor Run, the oldest unit of the study area, the Calvert Fm. occupies the base of the bluffs where it underlies the Choptank Fm. and increases in exposed thickness to the north. The Calvert Fm. completely dominates the geologic profile of the bluffs from Camp Roosevelt northward to Chesapeake Beach, including the sites of Bayside Forest and Randle Cliffs (Figure 1 and Figure 2).
The Calvert County formations can contain substantial lateral and vertical facies changes. Each formation has been mapped as having several members, and as many as 24 stratigraphic units (zones) have been identified [20,23,25,26]. While these zones do not meet the standards of the International or North American Codes of stratigraphic nomenclature [27,28], most authors of Calvert County bluff studies use the 24 “zones” or beds. This study sought to determine if the geologic variability (horizontal and vertical facies changes) within and among formations plays a role in the distribution and abundance of PTB.
A cursory qualitative comparison of the stratigraphy and geology of Warrior Rest and Randle Cliffs illustrates the first-order geologic influence on tiger beetle populations [24]. Warrior Rest consists of the Plum Point and Calvert Beach Members of the Calvert Fm. overlain by the Drumcliff, St. Leonard, and Boston Cliffs Members of the Choptank Fm. The St. Mary’s Fm. caps this area. At Warrior Rest, the clayey, habitat-poor Plum Point Member of the Calvert Formation occupies the base of this bluff (≈4.6 m), but approximately 16 contiguous meters of five sandy members (and eight beds/zones) overlie the Plum Point Member—including the apparent prime larval habitat of the St. Leonard Member of the Choptank Fm. By comparison, the Randle Cliff exposure at the northern limit of the Calvert PTB range contains fine-grained argillaceous (clay-rich) sand and sandy clay that is largely unsuitable as PTB habitat. It is important to note that local lithologic variation (vertical facies changes) within a formation (i.e., beds) may create suitable PTB habitat, despite overall habitat unsuitability at the formation scale.

1.2.2. Sassafras River, Maryland

The tidal Sassafras River location spans approximately 14 km along the north and south shores of the Sassafras River in Kent and Cecil Counties and includes eight study sites: Grove Point, Ordinary Point, East Turner, West Turner, East Lloyd, East Betterton, West Betterton and North Still Pond (Figure 1). The Sassafras River sites contain 100–65 my Upper Cretaceous-aged Coastal Plain sediments of the Potomac Group that dip east–southeast [29]. Several formations are well-exposed along the south and north bank of the Sassafras River where PTB are found. These units include, from oldest (bottom) to youngest (top), the Merchantville Fm., the Englishtown Fm., the Marshalltown Fm. and the Mount Laurel Sand [29]. Similarly to the younger western Chesapeake Bay units, these units vary laterally and vertically. The Merchantville Fm. consists of 6–12 m of thick-bedded dark gray-to-grayish-black clayey silt to fine and very fine sand and is well-exposed as the lower formation at Grove Point. The fine-to-very fine silt and clay comprising this formation make it unfavorable for tiger beetle habitat. However, the southerly regional dip of the units causes a decrease in the thickness of their exposure at Grove Point (and increases the exposure of the more favorable Englishtown Fm.) from north to south. The Englishtown Fm. is characterized by fine-to-very fine quartz sand and prominent thinly bedded cross stratification. The thickest outcrop of the Englishtown occurs east of the Betterton boat pier, where 10 m of the formation is exposed. The Marshalltown Fm. (5–6 m thick) is thick-bedded, mottled, fine-to-medium glauconitic quartz sand. The Mt. Laurel Sand is the thickest unit (24 m thick at the western edge of the Betterton quadrangle and 50 m thick to the northwest) in the Sassafras region and overlies the Marshalltown Fm. The Sassafras region contains the best exposures of the Mt. Laurel Sand in the North Atlantic Coastal Plain [21]. The upper and lower parts contain coarse sands and gravel and medium-greenish-gray-to-medium-dark-greenish-gray, fine-to-medium, silty, glauconitic quartz sand [21]. The Mount Laurel Sand is found primarily at the East Lloyd and West Turner locations along the southern coast of the Sassafras River.

2. Materials and Methods

The methods used in this study consisted of field, laboratory, computer-based (Geographic Information Systems, GIS), and quantitative analyses. We used field studies to determine beetle numbers and assess habitat parameters. A GIS photographic analysis enabled a determination of potential and probable habitat (defined below). Both parametric and nonparametric statistics were used to identify parameters that control PTB densities. We did not include the two Severn River sites discovered in 2014 in these analyses because they were discovered after the field data collection efforts for this project (2007–2008). Those two sites have routinely had low PTB counts and one has apparently become extirpated [3,4,30,31].

2.1. Adult PTB Surveys

Standard index count methods were used for adult beetle surveys. The method provides a relatively quick, cost-effective method for estimating population size and has been used at all PTB survey sites since the mid-1980s. Although this method provides a good comparison among sites and years, studies with Habroscelimorpha dorsalis and several other tiger beetle species have demonstrated that index counts may underestimate actual beetle numbers two- to three-fold [17]. Because climatic conditions, time of day, surveyor and seasonality can affect index counts, this method controls for as many of these factors as possible by surveying during peak adult season, in full sun, and during low-to-mid-tide to ensure a high level of activity. The survey method involves one person walking slowly along the water’s edge and counting all adults seen on the beach. In areas with a narrow beach, the base of the cliffs was also examined. In 2008, adult beetles were surveyed at low-to-mid-tide between 25 June and 14 July in sunny conditions with temperatures conducive to high levels of activity. Counts were recorded in relatively short reaches of approximately 10–20 m to provide an accurate measure of beetle abundance and density within each site. These density data were used to select low- and high-density sites for habitat analysis in this study.

2.2. Larval PTB Surveys

We also conducted field surveys of larvae at selected sites by searching for the characteristic larval burrows in the bluffs, determining their identity (E. puritana or C. repanda), recording density (number/m2) and collecting sediment samples at some of these sites where larvae occurred. These surveys were conducted in mid-July when C. repanda larvae were most abundant and on several dates in late September and to early November when E. puritana larvae were active. Most survey locations included the more accessible lower strata of the bluffs (<2–5 m), but other mid-level strata (>5–10 m) were also searched. The survey method involved a visual search for larval burrows and, when found, numbers and stage of each species within the surrounding 1 m2 were recorded. Two to five 1 m2 patches were sampled at most sites and counts summarized as the mean number of burrows. Species identity was based on burrow depth, as an earlier study [32] confirmed that burrows <20 cm deep were those of C. repanda and burrows >25 cm deep were those of E. puritana. Sediment samples from the surface to a depth of 20 cm were collected at representative larvae sites. The mean grain size and sorting of the samples were determined using the Ro-Tap, mechanical shaking methods described in more detail below.

2.3. Habitat Studies

A primary objective of this study was to determine the distribution, amount and quality of PTB larval habitat at both Calvert and Sassafras sites. Because larval habitat is selected by the adult female and is the site where their development occurs, the presence of larvae burrows is the best indicator of suitable habitat for tiger beetles. Using this factor to achieve our objective was difficult because larval burrows were found high on the bluff face at many sites (especially Calvert sites) and not accessible. Consequently, we used a combination of photographic and stratigraphic analyses, and adult density data to determine probable PTB habitat. Monitoring and observations over the years have indicated that adult densities along the shoreline are a reliable indicator of larval habitat quality and are thus used in this study to establish shoreline sections as high- or low-density sites (Knisley, unpublished data).

2.3.1. Photographic Vegetation Comparative Analysis

Vegetative cover and stratigraphy were analyzed from photographs taken of all bluffs along the Calvert County and Sassafras River sites from a research vessel located approximately 100 m offshore on 7–8 July 2008. All photographs were organized into panoramas to display complete sections of habitat for these two metapopulations. The total bluff face area for each site was determined from digital topographic maps (Terrain Navigator Pro) using the bluff face area between the shoreline or bluff toe, and the bluff “edge” at the top of the bluff. Common cultural features (e.g., houses, roads, etc.) and natural features (e.g., creeks, depressions, etc.) provided geographic controls for the panorama photos and topographic maps. Error may occur as a result of oblique angles between the camera and bluff face or difficulties involved in determining the bluff surface. However, the error associated with this method was minimized by calculating the bluff face area at each site a minimum of 10 times until the standard error dropped below 10% of the mean bluff face area. Once the error fell below this acceptable limit, the replicated area calculations were averaged to obtain bluff area.
These panoramas were also used to delineate potential and probable habitat on the bluffs. Because earlier studies demonstrated that PTB larval habitat included only bare, unvegetated bluff faces, we categorized all areas of unvegetated bluff as potential habitat. In order to quantify potential habitat, we used Geographic Information Systems software (ArcGIS, version 9.3; ESRI, Redlands, CA, USA) to scale the photos using the area calculations from the maps, and to digitize the areas of the bare bluff faces and vegetative cover. The potential habitat (total exposed area and percent of bare bluff) was calculated by subtracting the area of the vegetative cover from the total bluff area at each site. However, because earlier studies indicated that only unvegetated bluff strata with grain sizes in the sand fraction size range supported larvae [32], we defined probable habitat as having exposed bluff face (i.e., non-vegetated) that contained favorable geologic materials (e.g., sand). This prerequisite would exclude the fine-grained Calvert Fm., for example, as probable habitat along the Calvert County coast. The area of each unsuitable formation was determined and subtracted from the area of the potential habitat for each site to calculate probable habitat. This analysis provided a first-order examination of the geologic and biologic parameters that influence or control beetle density.
Difficulties arose when the contacts between formations within the photos were not discernable. In some areas, slumping from higher stratigraphic formations or vegetation would cover the contacts. However, the lateral continuity and planar nature of the contacts enabled accurate interpolations in these cases. Given the potential for other variables to control preferred habitat, the calculated probable habitat area provided an overestimate of actual habitat.
Finally, an additional photo set taken in 2000 at the Calvert sites enabled us to determine if changes in bluff vegetation might explain changes in PTB numbers over time. To this end, we quantified the percent (net) vegetation change that occurred between 2000 and 2007 at the Calvert County sites and compared those changes to changes in beetle numbers from the same time period.

2.3.2. Field Data Collection and Parameter Determination

A field test of probable habitat was conducted by analyzing a series of parameters measured at high- and low-density sections at selected PTB sites along the Calvert and Sassafras coasts. Sites selected for analysis along the Calvert coast included one high- and one low-density area at Calvert Cliffs State Park and two high- and one low-density sampling sites at Little Cove Point. Along the Sassafras shore, we sampled one high- and one low-density area at West Betterton, East Lloyd D, East Lloyd E and West Turner B; two high- and two low-density areas at Grove Point; and one high-density area at West Turner A. Significant differences in parameters between high- and low-density areas were evidence that these parameters might explain the differences in abundance of PTBs at these low- and high-density areas.
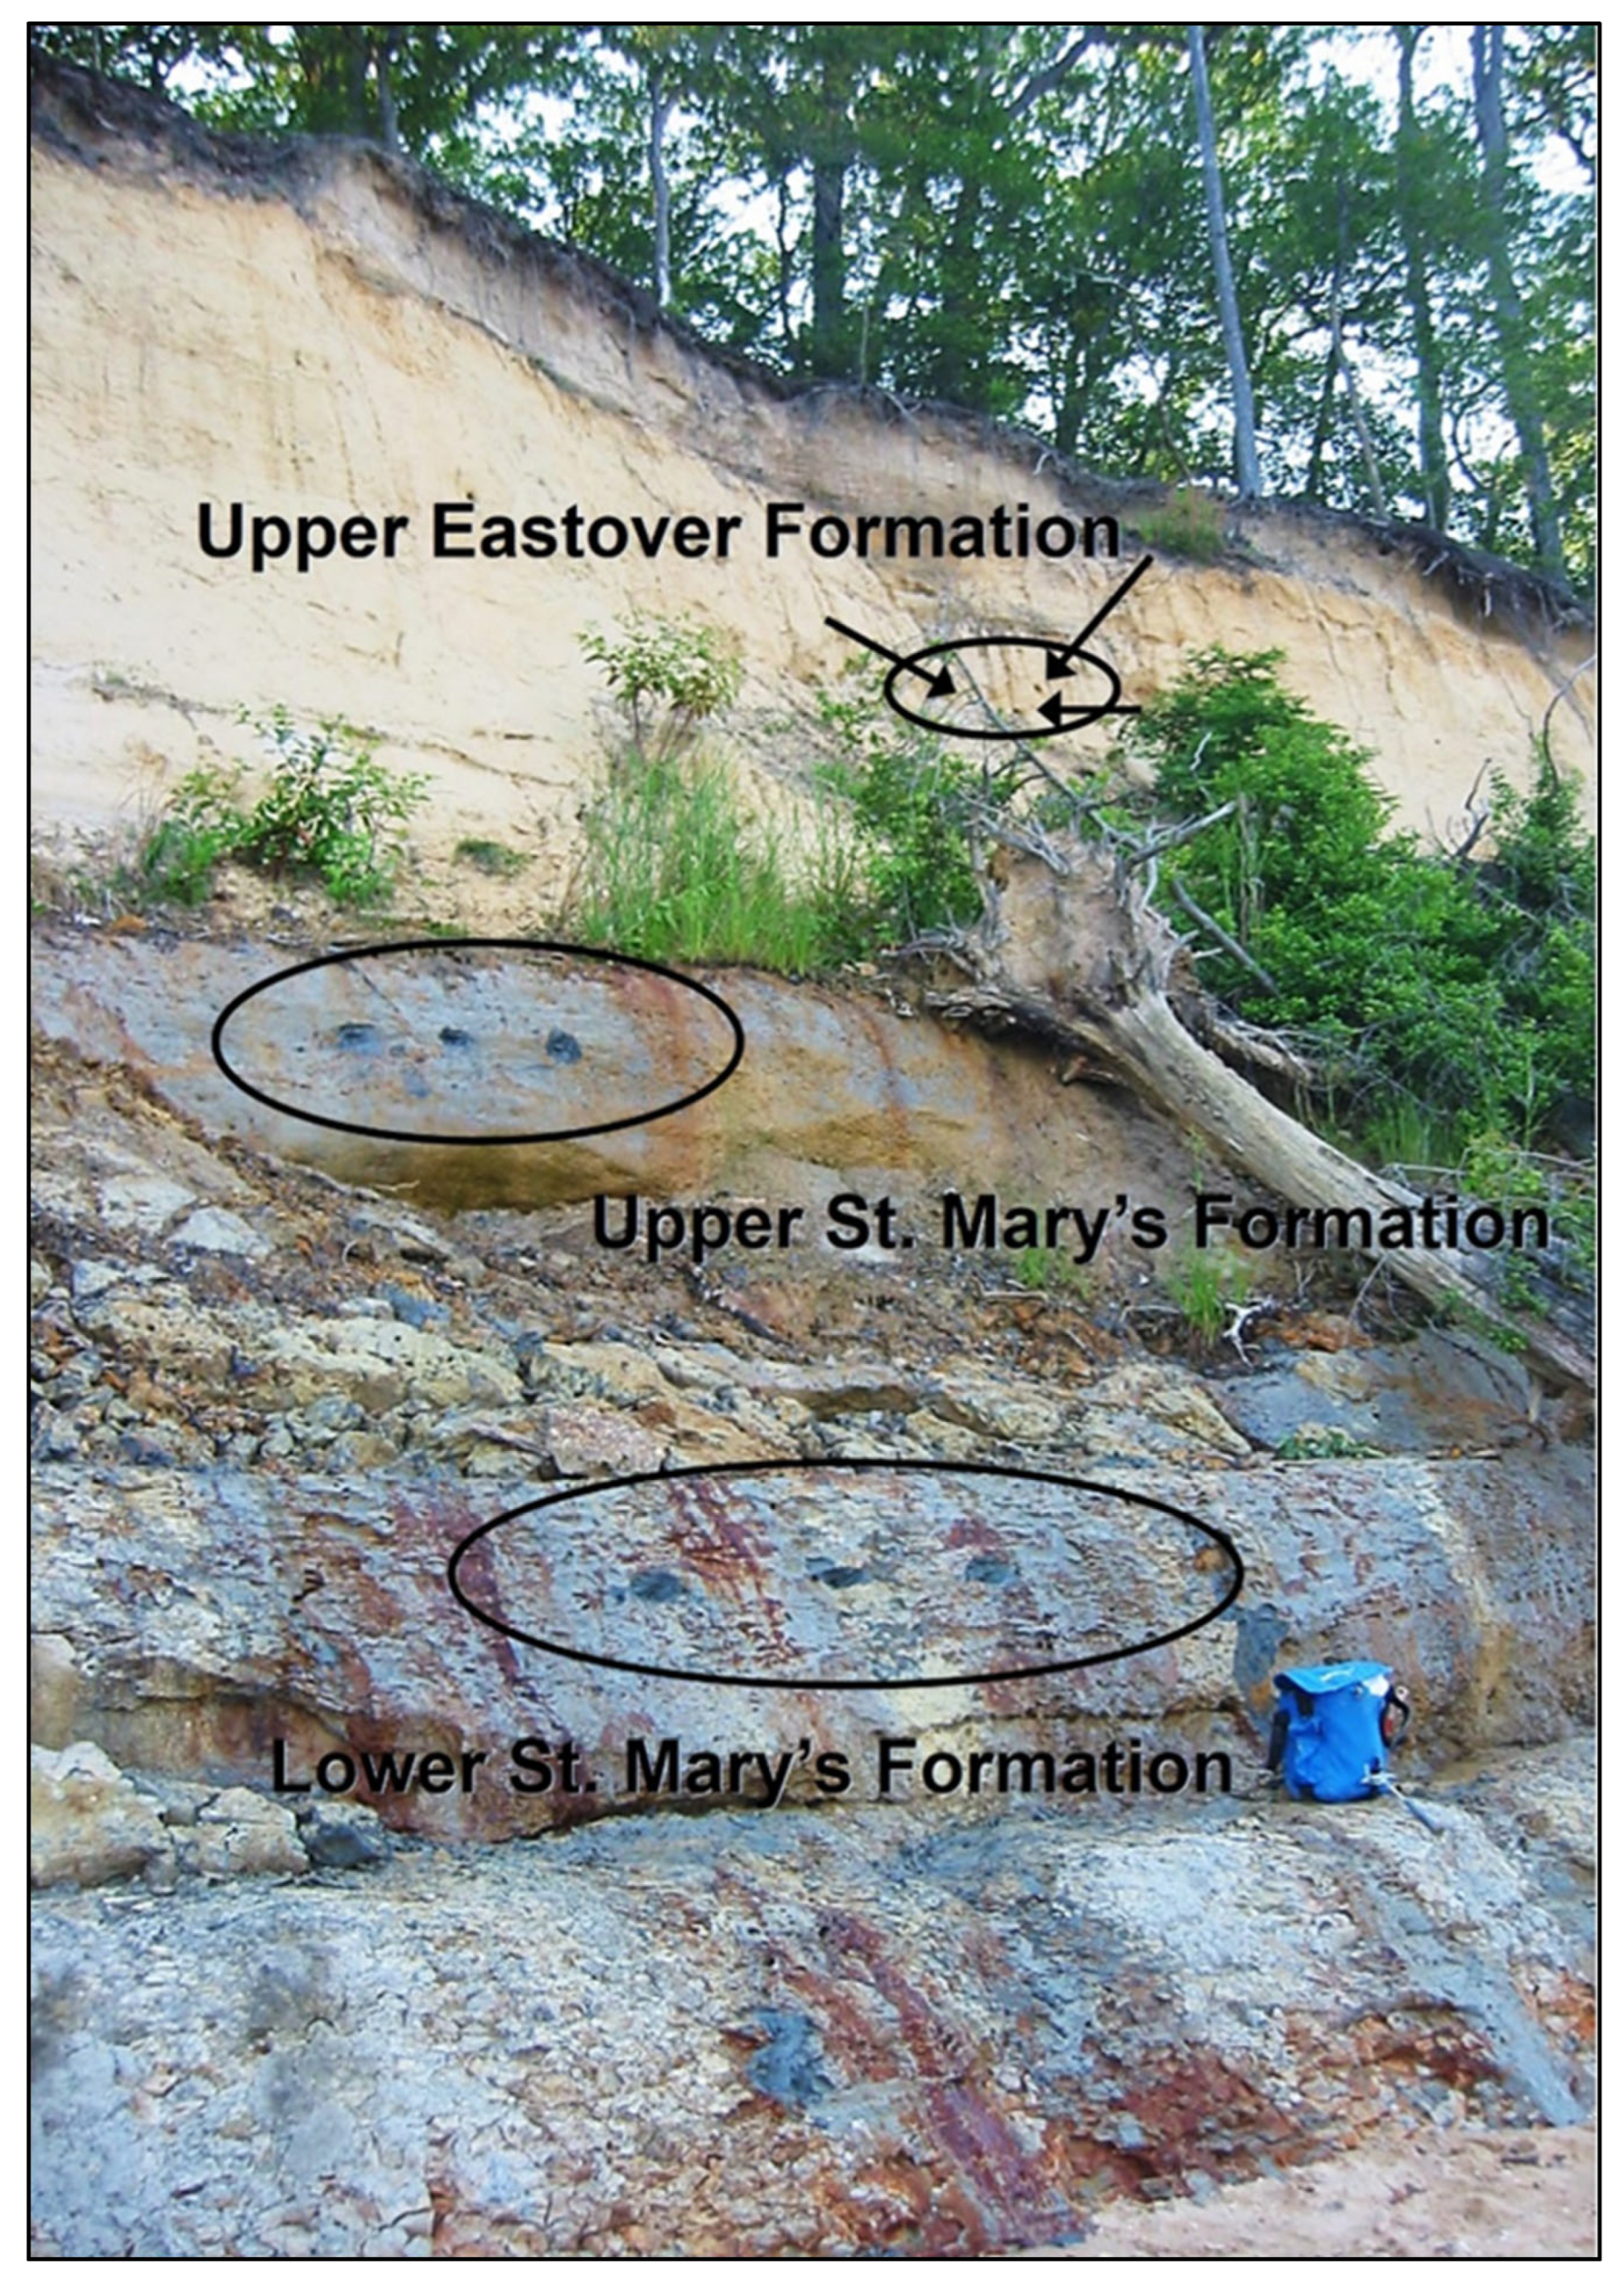
Sampling at each site was carried out vertically on the bluff face within all accessible formations in order to capture the range of geologic conditions available to the beetles for burrowing. Where accessible, we used an extension ladder to access and sample a representative location within each formation (and, in some cases, more than one bed) on the lower, middle, and upper bluff face. Three replicates were taken at each sample site on the bluff face (Figure 3). Data collected included moisture content (volumetric water content, VWC), temperature (°C) and conductivity (bulk dS/m) using a 5TE Decagon probe (Decagon Devices, Inc., Pullman, WA, USA). Compaction was measured using an analog Spectrum Technologies 6100 penetrometer (Spectrum Technologies, Inc., Aurora, IL, USA). Color of lithologies was determined using a Munsell color chart. The slope of the bluff face was measured with a Brunton-compass clinometer (Brunton, Inc., Riverton, WY, USA). Sediment samples of the upper 5–10 cm of the bluff face were also taken in replicates of three at each of the vertical sample sites. The grain size analysis consisted of washing (in 100 mL of deionized water) and drying (at 120°C for 24 h) each sample, splitting the dried sample to 20–40 g using an Ottoman-type sample splitter (Tyler/Testing Equipment, Inc., Mentor, OH, USA) and then sieving the subsample for 10 min using a RoTap mechanical sieve shaker (Tyler/Testing Equipment, Inc., Mentor, OH, USA). The mechanical shaker contained nested sieves at whole phi intervals (4 ϕ = 0.0625 mm; 3 ϕ = 0.125 mm; 2 ϕ = 0.25 mm; 1 ϕ = 0.5 mm; 0 ϕ = 1.0 mm; −1 ϕ = 2.0 mm). Gravel consisted of all material remaining on the 2.0 mm sieve and the pan fraction contained mud (silt and clay). We did not remove the carbonates because of their relatively minor abundance and detrital nature. Grain size distributions were calculated using the logarithmic method of moments [33].
Other parameters, such as percentage of vegetation coverage, were measured using a box-transect approach. We counted the number of larvae burrows at each site using this approach but did not include these numbers in the statistical analysis as a habitat parameter. Finally, we measured the beach characteristics adjacent to each bluff face sample site. In particular, we measured beach slope near the high tide line and at the bluff toe; beach width; percent coverage by gravel, shells, woody debris, and heavy minerals; and shoreline orientation at each bluff sampling site.

2.3.3. Data Analysis

The block experimental design incorporated three factors: sampling site, PTB density, and vertical position (elevation) along the bluff face. The bluff was stratified into three vertical sections (low, medium, and high) as described above to account for lithologic variation among geological formations and bedding units. Within each section, measured parameters at high-density sites were compared to those at low-density sites. To control for site-specific effects, the nonparametric paired Wilcoxon Signed Rank Test was applied, with each pair consisting of the same parameter measured at adjacent high- and low-density sites within a vertical section. A one-tailed test at a 95% confidence level (α = 0.05) was used to evaluate whether the paired differences between parameter values at high- and low-density sites deviated significantly from zero. In contrast, beach variables were collected as independent samples across sites; therefore, differences among groups were evaluated using analysis of variance (ANOVA) to compare means across unpaired observations.

3. Results

3.1. PTB Abundance and Density at All Sites

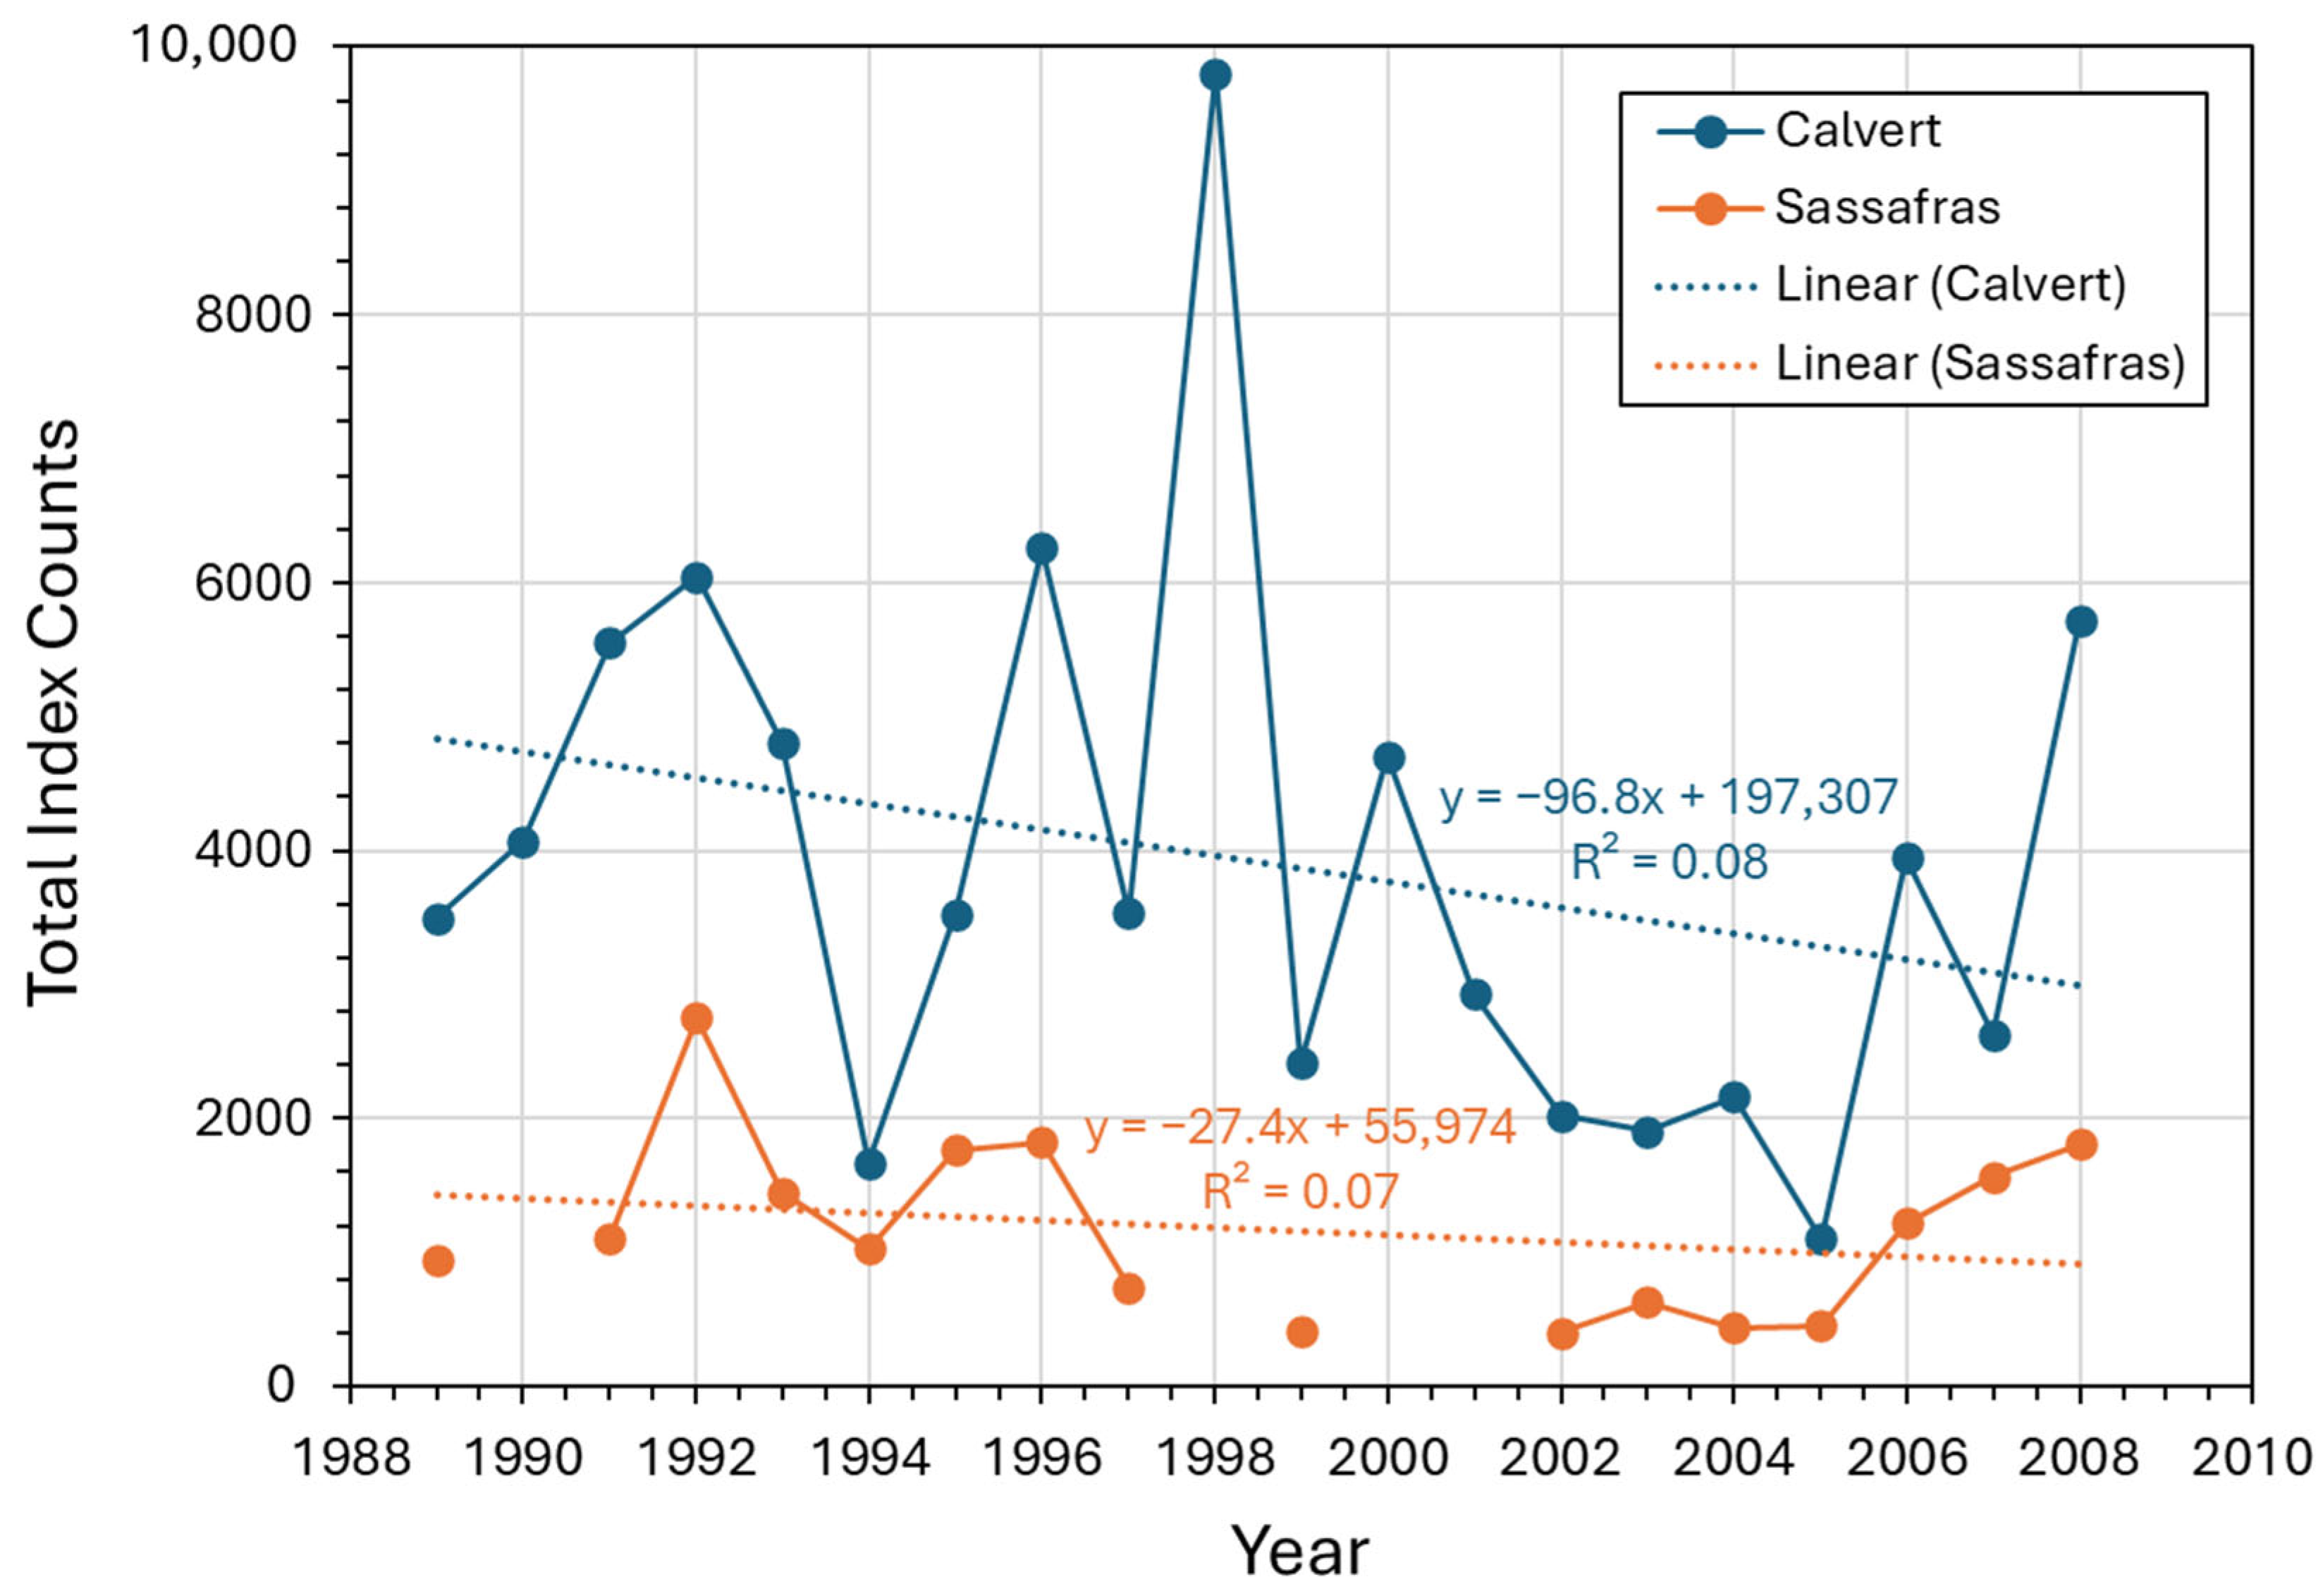
The results of the index surveys showed that the adult numbers along Calvert County’s coast exceeded those of the Sassafras River coast by a factor of 2–9 between the late-1980s and 2008 (Figure 4). Total peak and low adult numbers generally correspond between Calvert County and Sassafras River. Knisley and Fenster [34] provide adult numbers for individual sites within the larger reaches.
The adult population within Calvert County remained relatively stable but declined during the 20-year monitoring period, averaging approximately 3915 individuals and exhibiting considerable variability (SE ≈ 462). Annual estimates ranged from a low of 1101 adults in 2005 to a high of 9801 in 1988 (Figure 4). The alternating pattern of abundance, with even-numbered years typically supporting higher adult numbers, likely reflects the species’ two-year life cycle and/or fluctuations in recruitment associated with changing habitat conditions or climatic variability (e.g., storms).
During the same period, total index counts from the Sassafras River sites indicated fewer and less variable adult numbers, averaging approximately 1160 individuals (SE ≈ 170), with annual totals ranging from 400 in 2002 to 2755 in 1992 (Figure 4). Similarly to the Calvert County sites, adult numbers at the Sassafras River sites decreased during this time period, with low numbers between 1998 and 2005 (with some missing years) and higher numbers from before and after this time period.

3.2. Potential and Probable Habitat

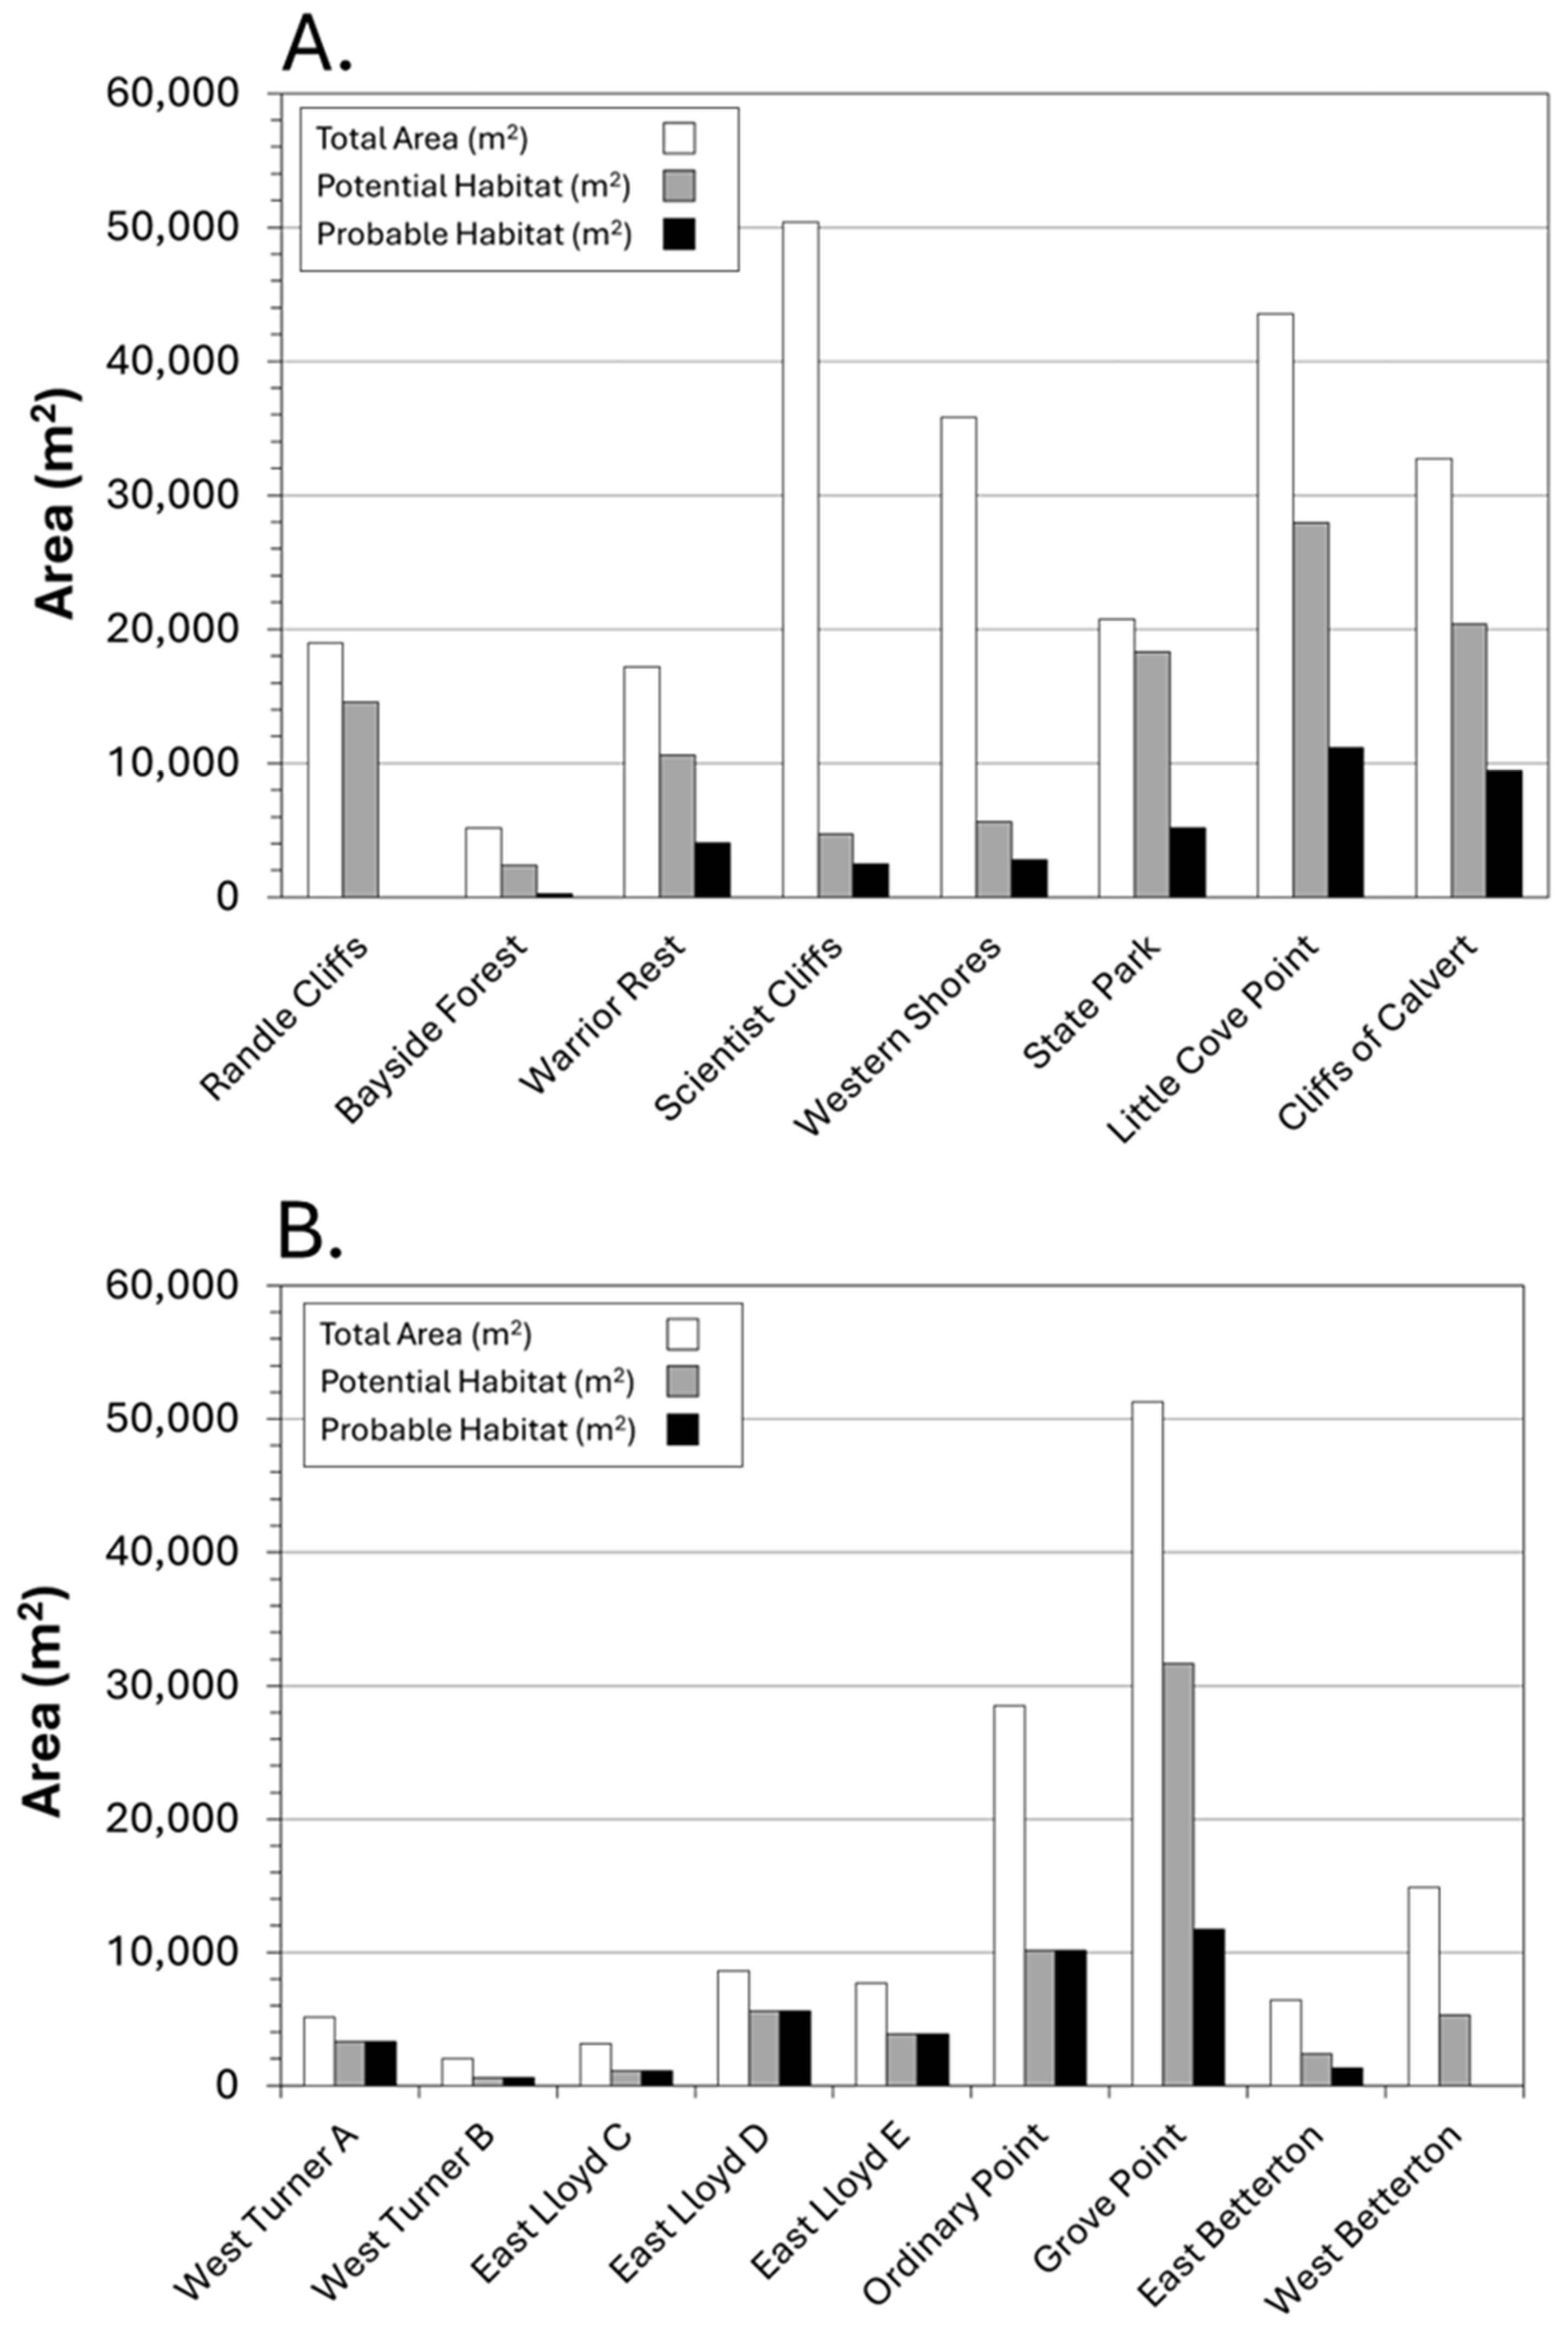
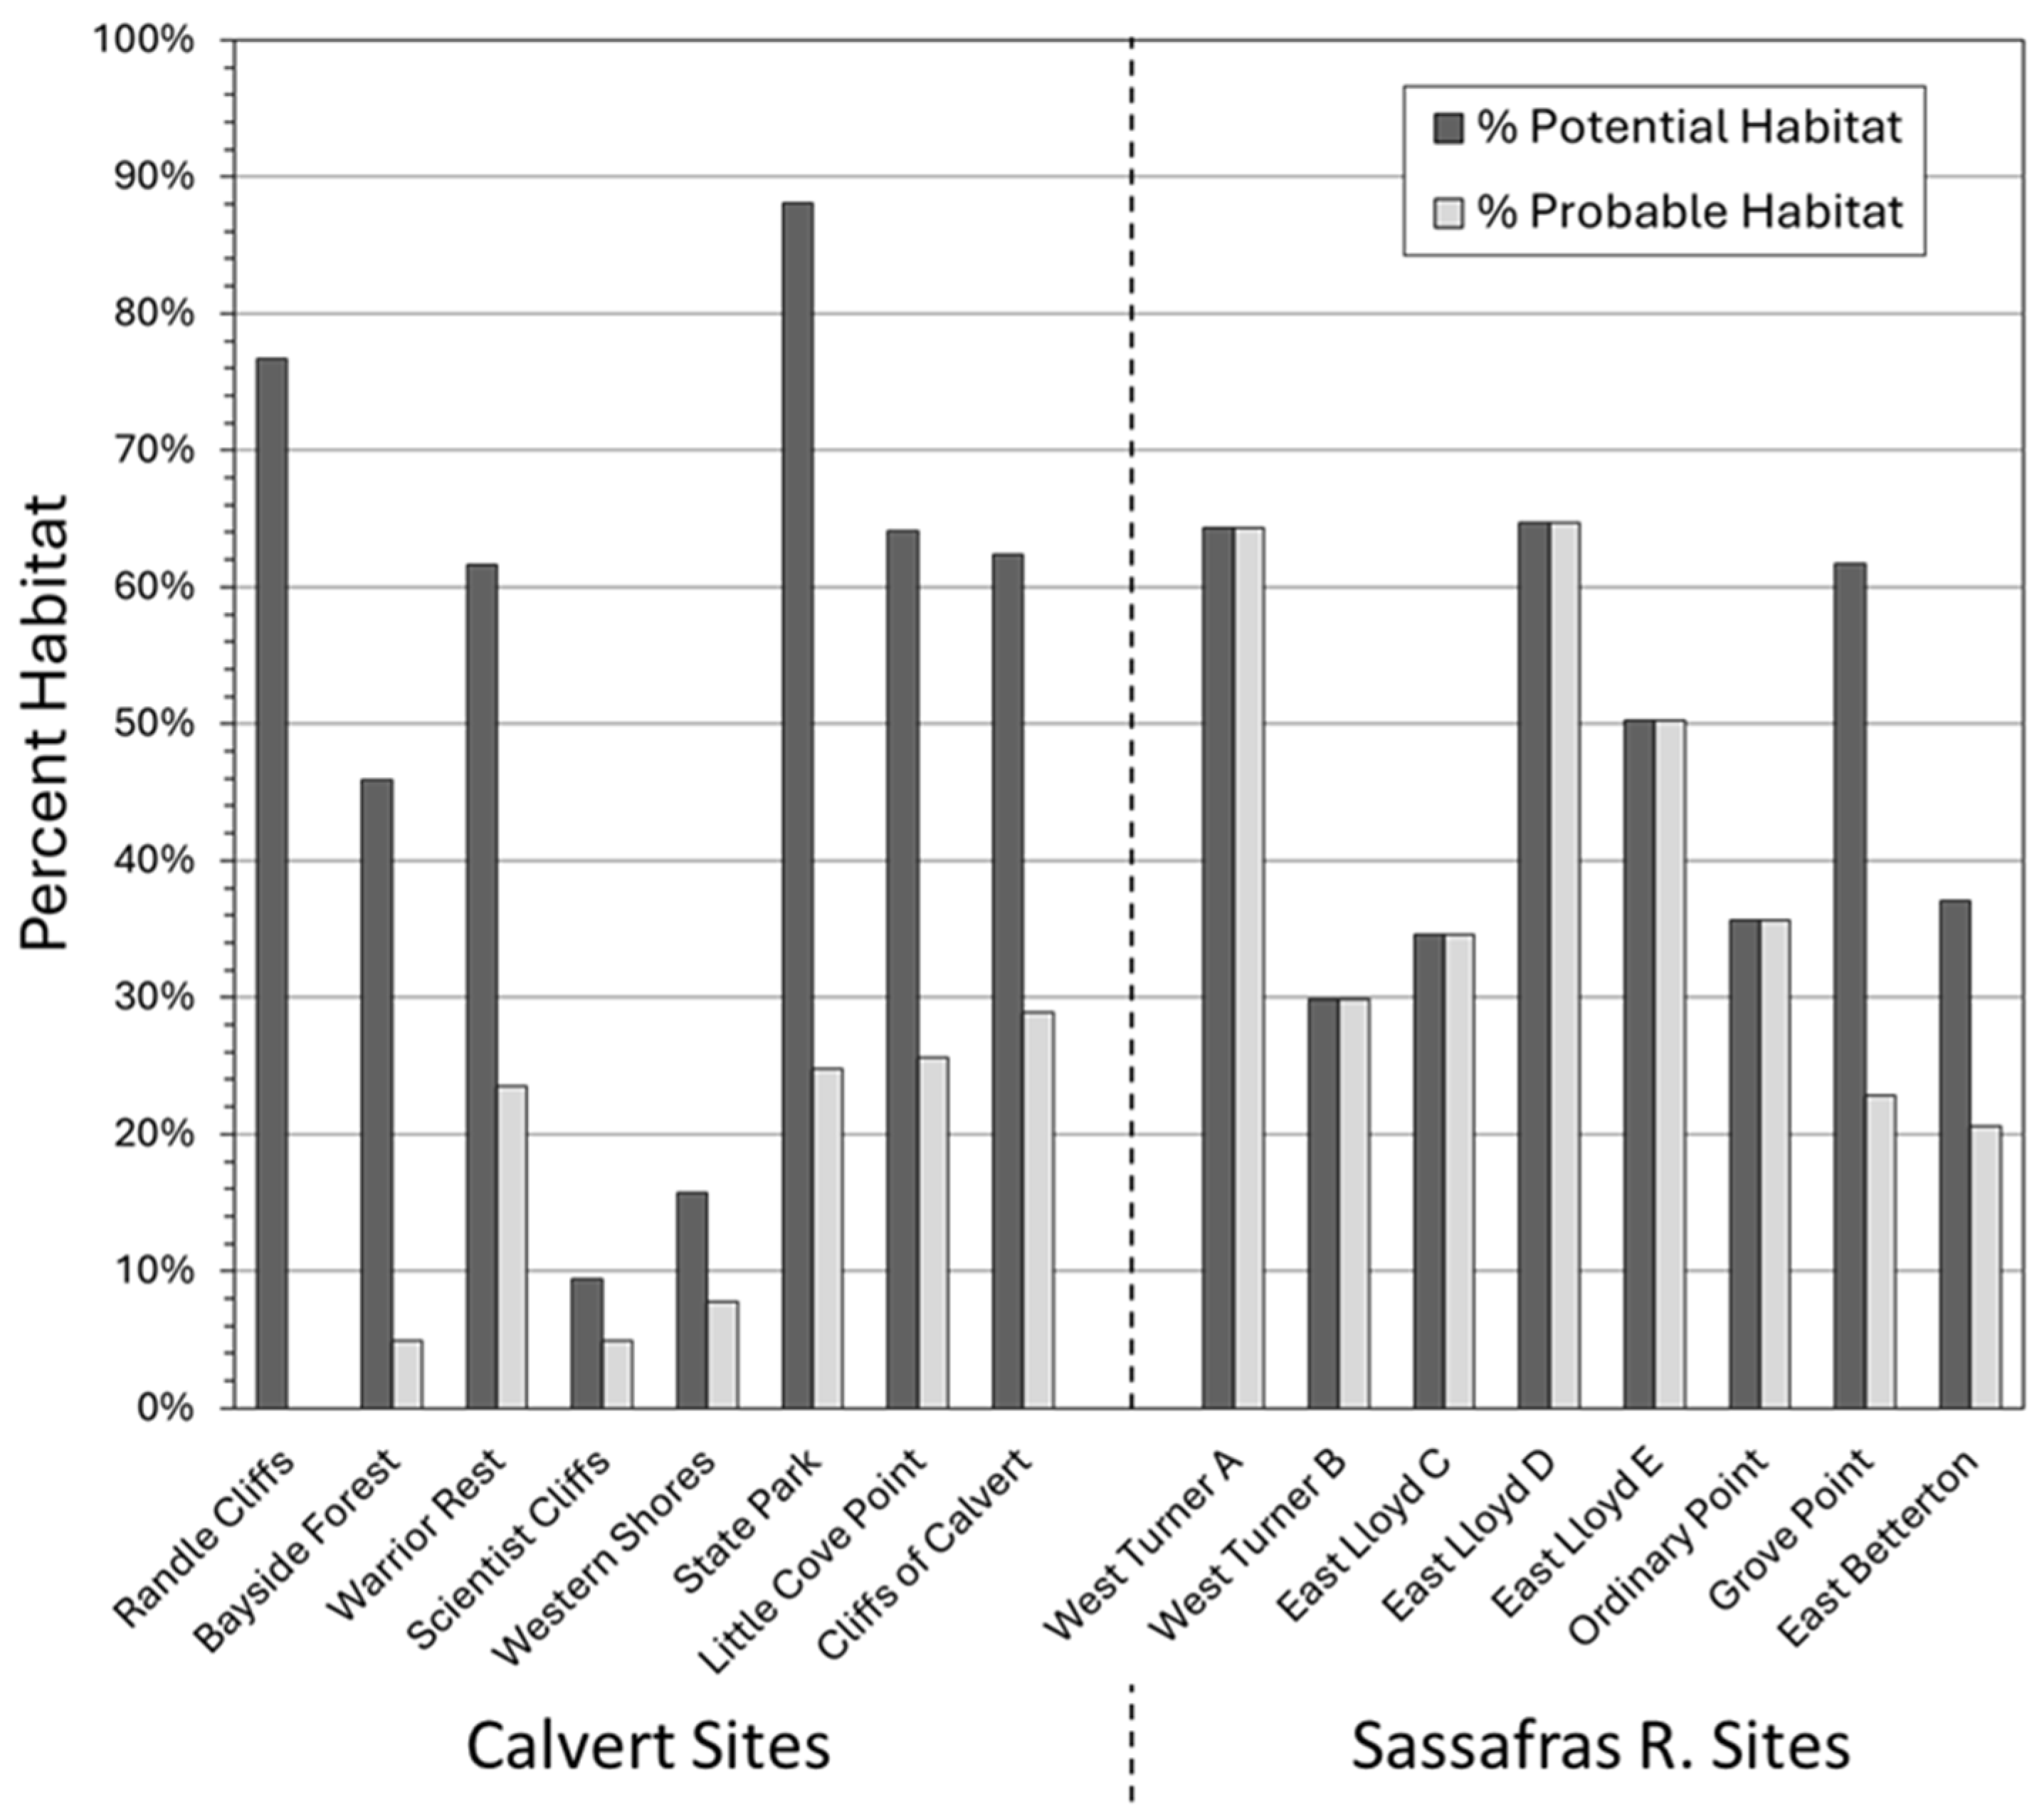
Potential habitat included all unvegetated bluffs while probable habitat consisted only of those unvegetated bluffs with formations having suitable larval habitat parameters. The results from this analysis showed that amount and percentage of potential habitat exceeded probable habitat at both the Calvert and Sassafras sites as expected, although the differences between potential and probable habitat diminish as the potential habitat decrease (Figure 5 and Figure 6). End members of this analysis include West Turner, East Lloyd and Ordinary Point along the Sassafras River, where the favorable Mt. Laurel Fm. dominates the composition of the bluff faces and, consequently, the smallest differences existed between potential and probable habitat. On the other end of the spectrum, the well-exposed, but lithologically unfavorable Calvert Fm. at Randle Cliffs in Calvert County results in a large difference between potential and probable habitat.
At the Calvert Sites, the Choptank and Eastover Fms. comprised the probable habitat because of the abundance of sand-sized particles within each formation. The Calvert and St. Mary’s Fm., consisting mostly of clay and silt, are largely unsuitable for oviposition and larval development. Consequently, because of the large exposures of the Calvert Fm. to the north and the regional southerly dip (Figure 2), the probable habitat increased to the south along the Calvert County coast with extreme values of probable habitat at both ends of the study area: Little to no probable habitat was found to the north at Randle Cliffs and Bayside Forest, and the greatest area of probable habitat occurred to the south at Calvert Cliffs State Park, Little Cove Point, and Cliffs of Calvert (Figure 5 and Figure 6). Although these broad generalizations hold true, field observations showed that sandy members within the generally finer-grained St. Mary’s Fm. provided suitable habitat, especially at higher elevations on the bluff face.
In the middle of the Calvert County section, Scientists Cliffs and Western Shores contained a large amount of total bluff area, but very little potential habitat because of heavy vegetative cover, and little probable habitat because of unsuitable strata. At Scientists Cliffs, a groin field stabilized most of the shoreline and encouraged heavy vegetation growth on the bluffs, thereby resulting in unsuitable habitat. Warrior Rest is a shorter reach than the adjacent Scientists Cliffs site, but the combination of favorable strata similar to Scientists Cliffs and less vegetation resulted in greater amounts by area (and percentage) of potential and probable habitat (Figure 5 and Figure 6). In fact, this site had the overall highest densities of adults despite having a very narrow beach and lithologically unfavorable lower strata (i.e., the Calvert Fm.). Although we could not survey the upper units along this high-bluffed section, the upper stratum (Choptank Fm. and in some places, suitable beds of the St. Mary’s Fm.) of this site must support a high density of larvae. The Calvert Cliffs State Park site had nearly double the amount of probable habitat compared to any site to the north, except for Warriors Rest, but half the amount of probable habitat compared to sites to the south (Figure 5 and Figure 6). The Calvert Cliffs State Park contained relatively little vegetative cover, most likely due to persistent bluff face erosion, but had less probable habitat than sites to the south. Consequently, the Calvert Cliffs State Park may serve as a transition “point” for probable habitat based on available surface area, suitable lithology and lack of vegetation. Additionally, post-Miocene deposits outcrop at Calvert Cliffs State Park and at sites to the south, thereby providing probable habitat. Little Cove Point and Cliffs of Calvert included a long shoreline reach with abundant bluff area and potential habitat, as well as the largest area of probable habitat of any of the sites. These sites consisted of mostly the St. Mary’s Fm. underlying the favorable post-Miocene deposits (Figure 2 and Figure 3).
The geology of the PTB habitat at the Sassafras sites differs from that of Calvert sites (in age and lithostratigraphy). The Sassafras sites, predominantly those to the east within the Sassafras River (e.g., East Lloyd, West Turner, and Ordinary Point), contain the favorable, sandy Mount Laurel Fm. The Mt. Laurel Fm. overlies the less favorable, predominately fine-grained Marshalltown Fm. The good exposure of the Mt. Laurel Fm. at these sites (minimal vegetative cover) resulted in nearly equal amounts of potential and probable habitat, giving the East Lloyd site the second-largest amount of probable habitat along the Sassafras River (Figure 5B). The Grove Point site contained the greatest amount of potential habitat of all Calvert and Sassafras sites (Figure 5B). While only approximately one-third of Grove Point contained probable habitat, the total area exceeded that of all other sites.
The combined adjacent sections of West Turner A and B and East Lloyd C, D, and E included moderate lengths of shoreline and bluff area, but relatively little potential and probable habitat (Figure 5B). The existing potential and probable habitat was limited to several separate sections. Of these sections, West Turner A and East Lloyd D had relatively high amounts of probable habitat, primarily because of a vegetation removal project [5]. The two heavily vegetated control sites (West Turner B and East Lloyd C) had little potential and probable habitat. However, the short control site at East Lloyd (East Lloyd E) had favorable strata and little vegetation, and thus, a relatively large amount of probable habitat. All other sites, except West Betterton, are much shorter in length than Grove Point and Ordinary Point, and thus, have much less potential and probable habitat. West Betterton is heavily vegetated over much of its length and has very little probable habitat, due to mostly unfavorable strata. From bottom (oldest) to top (youngest), this site and East Betterton consist of the Englishtown Fm., Marshalltown Fm. and the Mt. Laurel Sand. The Marshalltown Fm. is 5–6 m thick in this area. The lower 2 m contains abundant coarse-to-very coarse gravels up to 2 cm in diameter. The Mount Laurel Sand may provide the only probable habitat at these sites. During our fieldwork, we found considerable slumping of the Mt. Laurel Sand, which may have increased the amount of probable habitat. In particular, the Mount Laurel Sand dominates most of the bluff face at East Lloyd, West Turner, and Ordinary Point sites, thus providing a large amount of probable habitat (Figure 5B and Figure 6).
A bay-wide comparison of the Calvert County and Sassafras River potential and probable habitat indicates that Little Point Cove, Cliffs of Calvert, and Grove Point contained the greatest amounts (by area) of probable habitat (Figure 5). The 10,000 m2 of probable habitat at these sites nearly doubles the probable habitat at any other site within the Bay. Calvert Cliffs State Park in Calvert County and East Lloyd D on the Sassafras River contain the next-greatest amount of probable habitat, followed by East Lloyd E, West Turner A, Warrior’s Rest, Scientist’s Cliffs, and Western Shores. As stated earlier, probable habitat is absent in the northern reach of Calvert (i.e., Randle Cliffs and Bayside Forest).
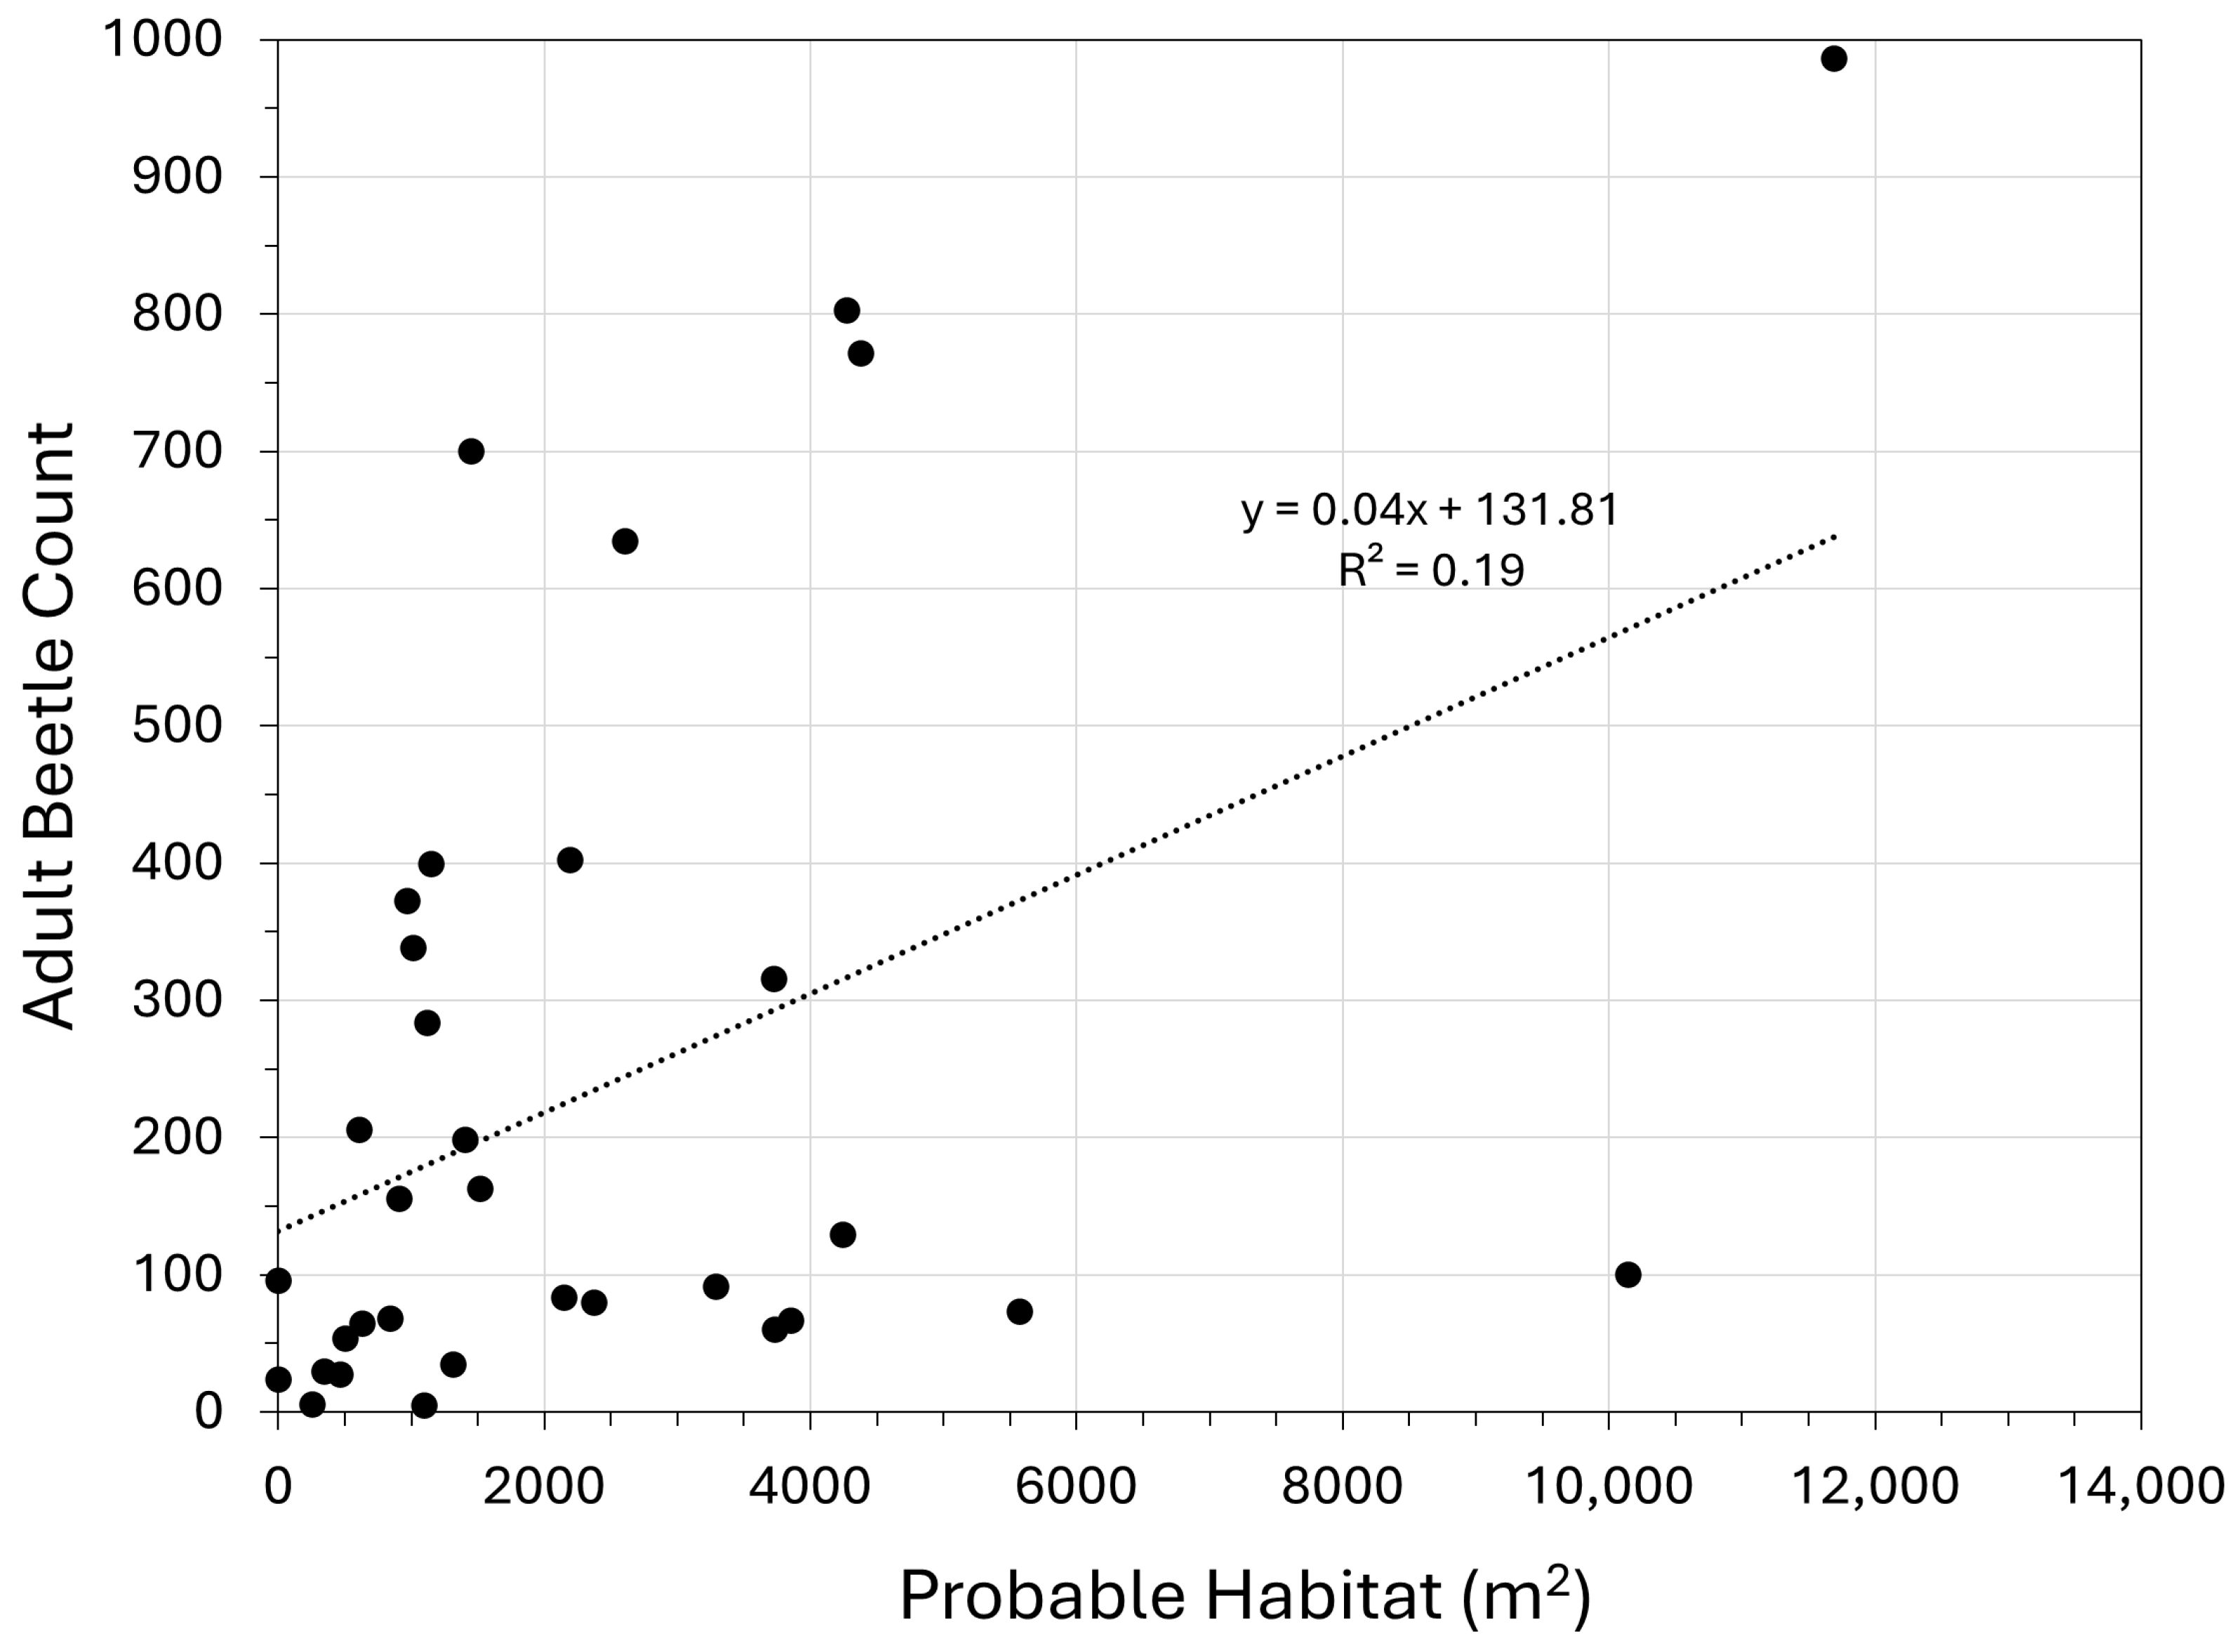
A correlation between probable habitat and adult beetle numbers yielded a low correlation coefficient (R2 = 0.19), suggesting that additional factors affect the distribution and abundance of PTBs at a site (Figure 7). For example, some sites with high amounts of probable habitat had relatively small PTB populations, while some areas with low amounts of probable habitat yielded large PTB populations. Vegetative cover and lithostratigraphic characteristics can control the distribution and abundance on regional scale (first-order influences), but more localized habitat and microhabitat differences (second-order influences) ultimately affect PTB abundance. It is also possible that specific beds within each formation yield more favorable habitat than others. The next section explores the geologic aspects of the probable habitat that could affect PTB habitat selection.

3.3. Bluff Parameters

The nonparametric paired Wilcoxon Signed Rank Test indicated that no parameter differed significantly between high- and low-density beetle sites when analyzed within individual vertical sections, after accounting for site effects. Thus, the null hypothesis of no difference between PTB density classes within each stratum could not be rejected. However, when data from all strata were combined (i.e., without vertical delineation but still controlling for site effects), compaction, mean grain size, and sorting differed significantly between inhabited high- and low-density sites (Table 1). Mean grain size, in particular, has previously been identified as a biologically important habitat parameter for the PTB along the Connecticut River and for other beach-dwelling tiger beetles [19,34,35,36,37].

3.4. Beach Parameters

Results of the statistical analysis of high- versus low-density sites (ANOVA, one-tailed) indicated no significant differences for any parameter (Table 2). This suggests that beach characteristics do not account for patterns of PTB abundance and distribution. The Warrior Rest site exemplifies this result, supporting high PTB densities, despite its limited beach width.

3.5. Larval Surveys

The results of these surveys indicated the presence of both C. repanda and E. puritana at West Turner A, B, D, E, Grove Point and at Calvert Cliffs State Park, but only C. repanda at West Betterton and West Turner C. These latter two sites had small adult numbers of E. puritana during the summer surveys, apparently because of low-quality larval habitat (dense vegetation and unsuitable geological parameters). Larvae of both species were common and at high densities along much of the W. Turner A site, and East Lloyd E. densities of C. repanda were as high as 20–30/m2 during July in some patches at these two sites and as high as 18–22/m2 for E. puritana in some patches in October. Both species were common but less dense at other sites with frequent co-occurrence in the same or nearby habitat patches. Despite very large populations of adult E. puritana at Calvert Cliffs State Park and Warrior Rest, no larvae were found within the lower accessible strata, thus indicating that larval habitat was restricted to the bluff top strata.
The results of grain size analysis indicated larvae of E. puritana were present in sediments with a higher percentage of medium and fine sand and a narrower range than C. repanda, which was present in the same patches of sediment, but also in sediments that were much higher in clay and in coarse sand (Table 3).

3.6. Vegetation Comparison: 2000 and 2007

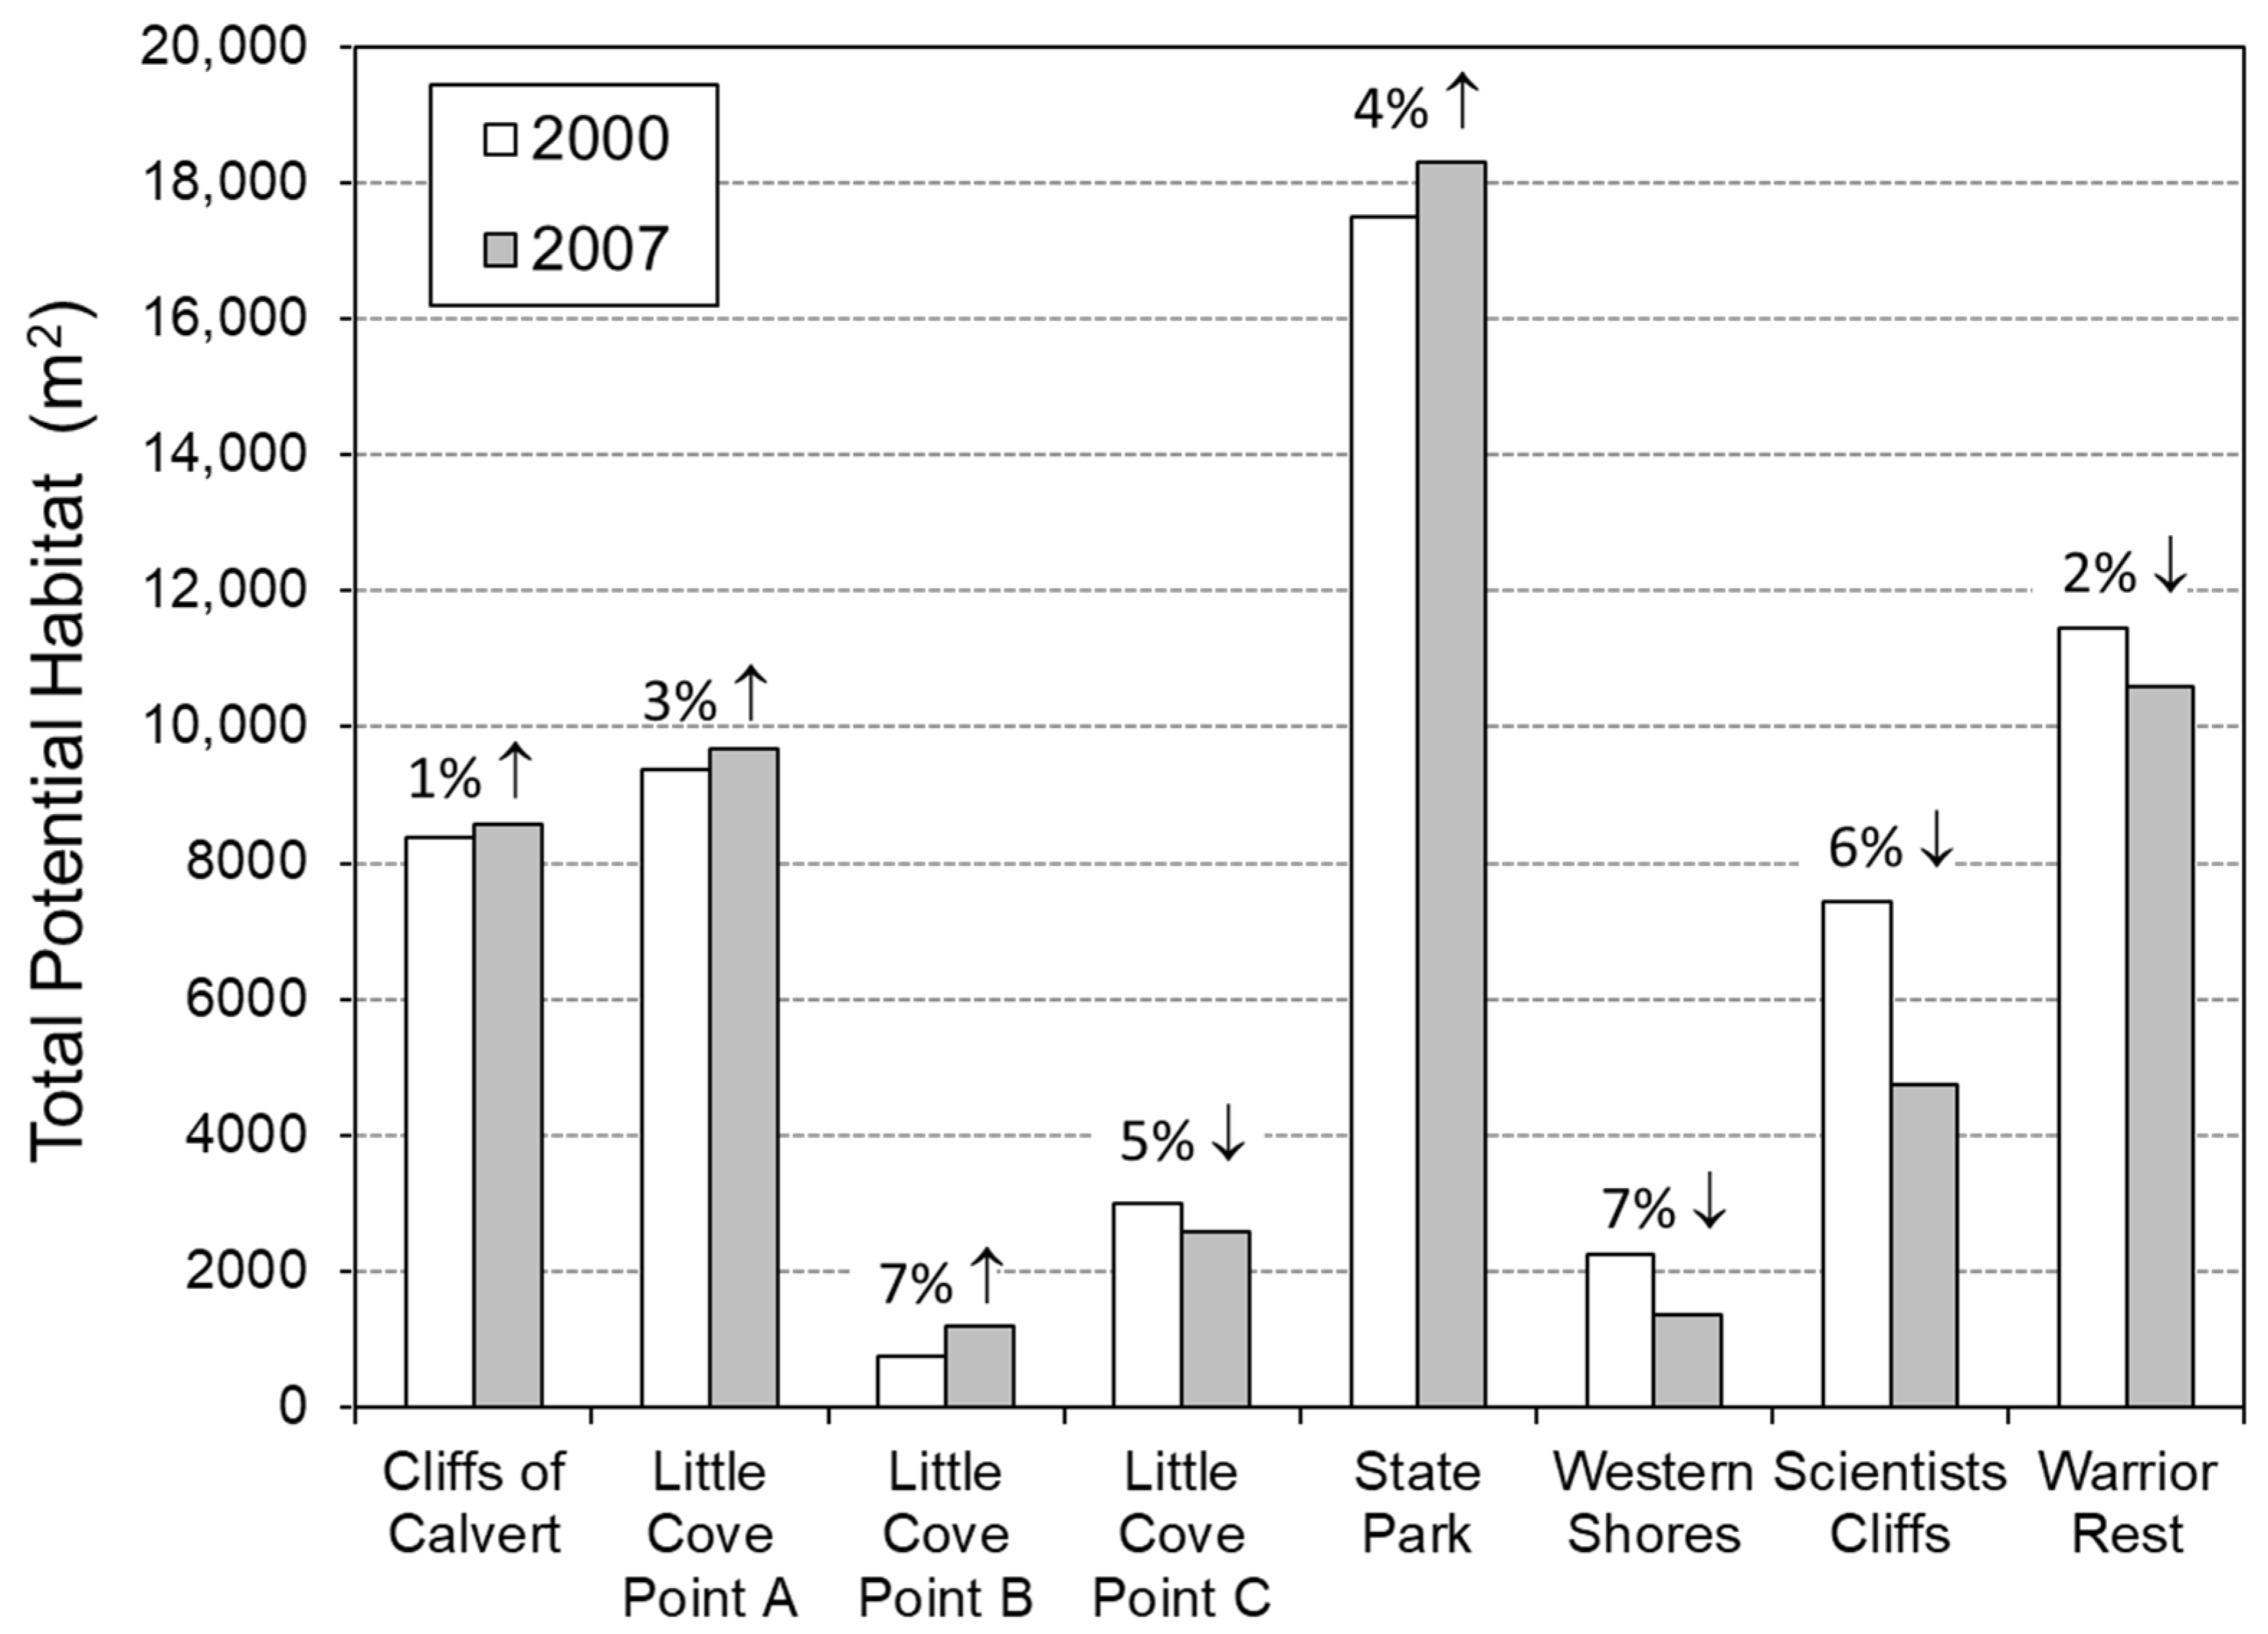
The comparative photographic analysis of selected sites for the years 2000 to 2007 showed an overall decrease in total potential habitat of 5.2% (increase in vegetation). However, variation existed among sites where half of the sites analyzed increased and half decreased in total potential habitat (Figure 8). In particular, the three southern sites (Cliffs of Calvert, Little Cove Point A, and Little Cove Point B) and the Calvert Cliffs State Park in Calvert County showed an increase in total potential habitat (decrease in vegetation) and the northern sites (Western Shores, Scientists Cliffs, and Warrior Rest) and Little Cove Point B showed a decrease in total potential habitat (increase in vegetation) (Figure 8). Ground surveys at these sites corroborated the photographic analyses.

4. Discussion

This study sought to determine the preferred habitat of the federally threatened Ellipsoptera puritana (the Puritan tiger beetle) and to account for spatial and temporal variability in the abundance and distribution of this species. To achieve this goal, we used companion geologic and biologic datasets obtained prior to 2008. These data represent the most comprehensive field-based assessment available for this region and remain critical for understanding long-term organism-habitat relationships. The results from this study indicate that variations in spatial and temporal population trends in PTB abundance relate to bluff face quality where the antecedent geology of, vegetative cover on, and the dynamics operating at the bluff face determine quality. The potential/probable habitat analysis indicated that PTB females prefer fresh (i.e., newly exposed) and vegetation-free exposures of suitable geologic material (fine-to-medium [0.30 mm, SE = 0.05 mm], very well-sorted [0.24 mm, SE = 0.03 mm], well-compacted sand [140.2 psi, SE = 7.2 psi]) for ovipositing, and thus, establishing the larval habitat. Subsequent studies have also shown that the largest subpopulations of PTB thrived in areas with the least amount of bluff vegetation [5].
Grain size distribution differences may explain, in part, E. puritana’s presence in a more specific type of habitat and over a smaller geographic area in comparison to the greater geographic range and habitat types occupied by C. repanda [17]. Although these two species do overlap significantly in their larval distributions, they have different seasonal periods of activity and are at least partially segregated temporally. Adults of C. repanda emerge in late March to April and continue activity into June and July. First-instar larvae first appear in April to May and progress to third instars, which are at peak abundance in July when adults of E. puritana are most abundant and seeking oviposition sites. Consequently, females of E. puritana could be deterred or even preyed upon by C. repanda larvae in these high-density patches of third instars as they move up the bluff face to find ovipositon sites. First-instar larvae of E. puritana that emerge at this time in these same patches would likely use the same prey items as C. repanda during their early development, and because of their much smaller size, would likely be at a significant competitive disadvantage in prey selection. High densities of C. repanda larvae on these bluffs could also reduce food availability to adult E. puritana when they are on the bluffs to oviposit. These important and unexpected results of the larval surveys suggest that competition with and predation by C. repanda may be a significant limiting factor for populations of E. puritana, at least at some sites.
Fresh bluff face surfaces most often result from cumulative and/or aperiodic processes acting over various time scales at both the bluff toe and higher up on the bluff face. Within-site variability of preferred habitat arises from vertical variations in geologic units (i.e., beds) along the bluff face and the amount of probable habitat surface area. At most sites, the favorable larval habitat occurred at the top of the bluff, while at other sites (especially some of the Sassafras River sites), favorable conditions existed lower on the bluff and closer to the beach. Surprisingly, none of the beach parameters tested, including beach width, slope, grain size, and percentage and type of cover emerged as statistically significant; only the presence or absence of beaches may influence PTB abundance. However, recent annual surveys of the PTB have found that progressive narrowing of the adult beach habitat may limit adult foraging activity, and consequently larval recruitment and population size [6].
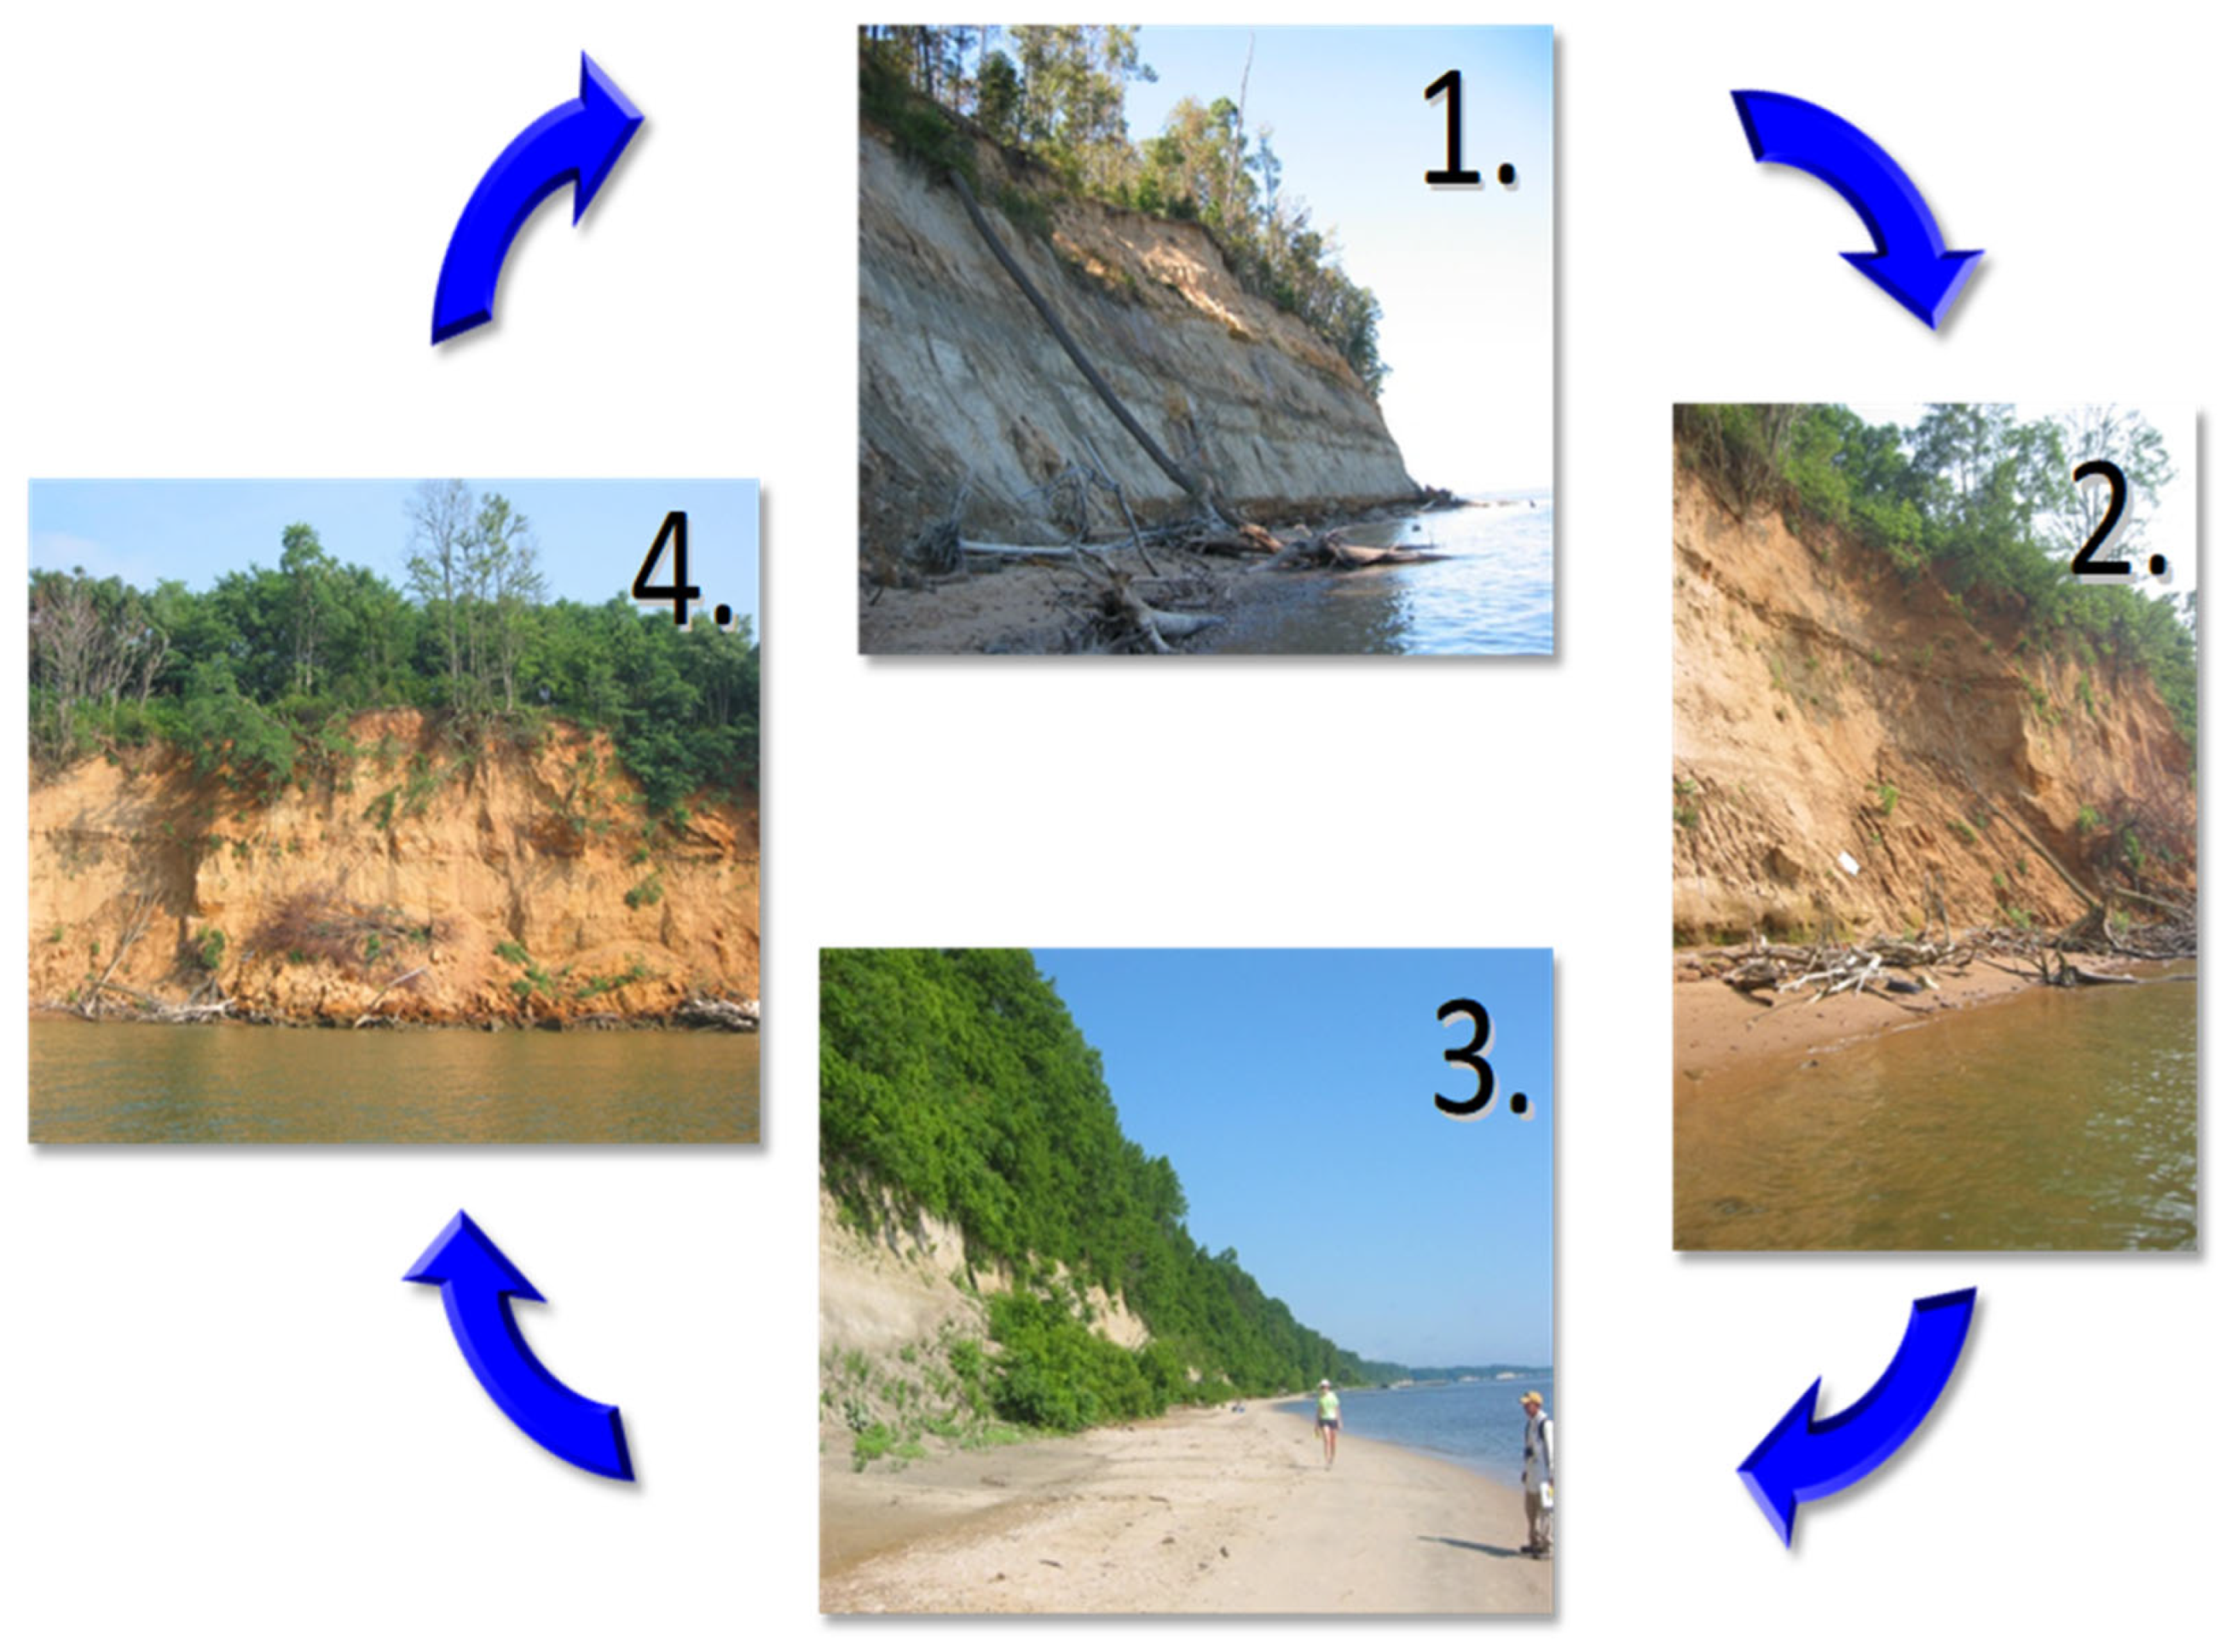
Several studies have documented the processes responsible for bluff erosion in the Chesapeake Bay [11,38,39]. These studies have shown that both oversteepening caused by wave activity at the bluff toe, freeze–thaw action, and/or rotational slumping caused by groundwater infiltration and flow along the upper surface of an aquiclude (impermeable) layer can cause erosion of the bluff face. The ensuing erosion of the bluff face produces deposition on the beach and bayward of the bluff toe of loosely consolidated colluvium (i.e., a detritus cone or colluvial fan). These deposits then become sites of vegetation growth and incursion. Given the (often) large volume of material contained in these deposits and the ensuing vegetative growth, the bluff stabilizes until that material is removed and redistributed to adjacent beaches and the nearshore. The main process responsible for removal of the colluvium is wave activity—especially large waves associated with tropical and extratropical storms (more specifically, the magnitude and frequency of storms). Clark et al. [11] estimated that the timescale involved in slope stabilization is on the order of decades (i.e., 40 yr on average). This result indicates that, under natural conditions, the fresh bluff face-to-fresh bluff face geomorphodynamic erosion cycle (caused by bluff face erosion and ensuing removal of debris) is a long-term (decadal- to possibly centennial-scale) process (Figure 9).
Given sufficient time, bluff face erosion and colluvium deposition would reduce the pre-existing bluff face slope to the angle of repose (31° on average; range = 25–37°) [11]. Also, given that the PTB burrows are most often found on fresh bluff face surfaces with a slope of 65°, on average (range = 46–90°), bluff face erosion, colluvium deposition at the bluff toe, vegetation growth, and slope reduction decrease probable habitat.
Wilcock et al. [39] showed that cumulative wave energy does not necessarily correlate with locations that experience the largest rates of slope recession. Instead, Wilcock et al. [39] developed an index of relative wave strength (T/S), which is a function of both wave pressure (T) and the cohesive strength of the antecedent bluff material (S), to predict the wave strength required to erode intact material. A cumulative duration of ≥ 50 h per year of a T/S index of 0.1 is a threshold for undercut and non-undercut slopes. Given that Calvert Cliffs showed a T/S of 0.05–0.1, for example, these bluffs would erode at durations less than 50 h per year. Although Wilcock et al. [39] used this index to identify sites at risk to erosion, this parameter could also be used to predict beetle abundance (or probable habitat availability) and possibly, to identify potential restoration sites. Wilcock et al. [39] address cumulative processes and the nature of the bluff material; however, they did not discuss the impact of short-term (episodic), large-magnitude events. Single, large-magnitude tropical or extratropical storms may accelerate the bluff erosion cycle by relatively fast removal and dispersal of the sediment within a colluvium fan [40]. Thus, creating fresh bluff exposures by removal of the colluvium fan can occur through longer-term, cumulative processes or shorter-term and episodic large-magnitude events.
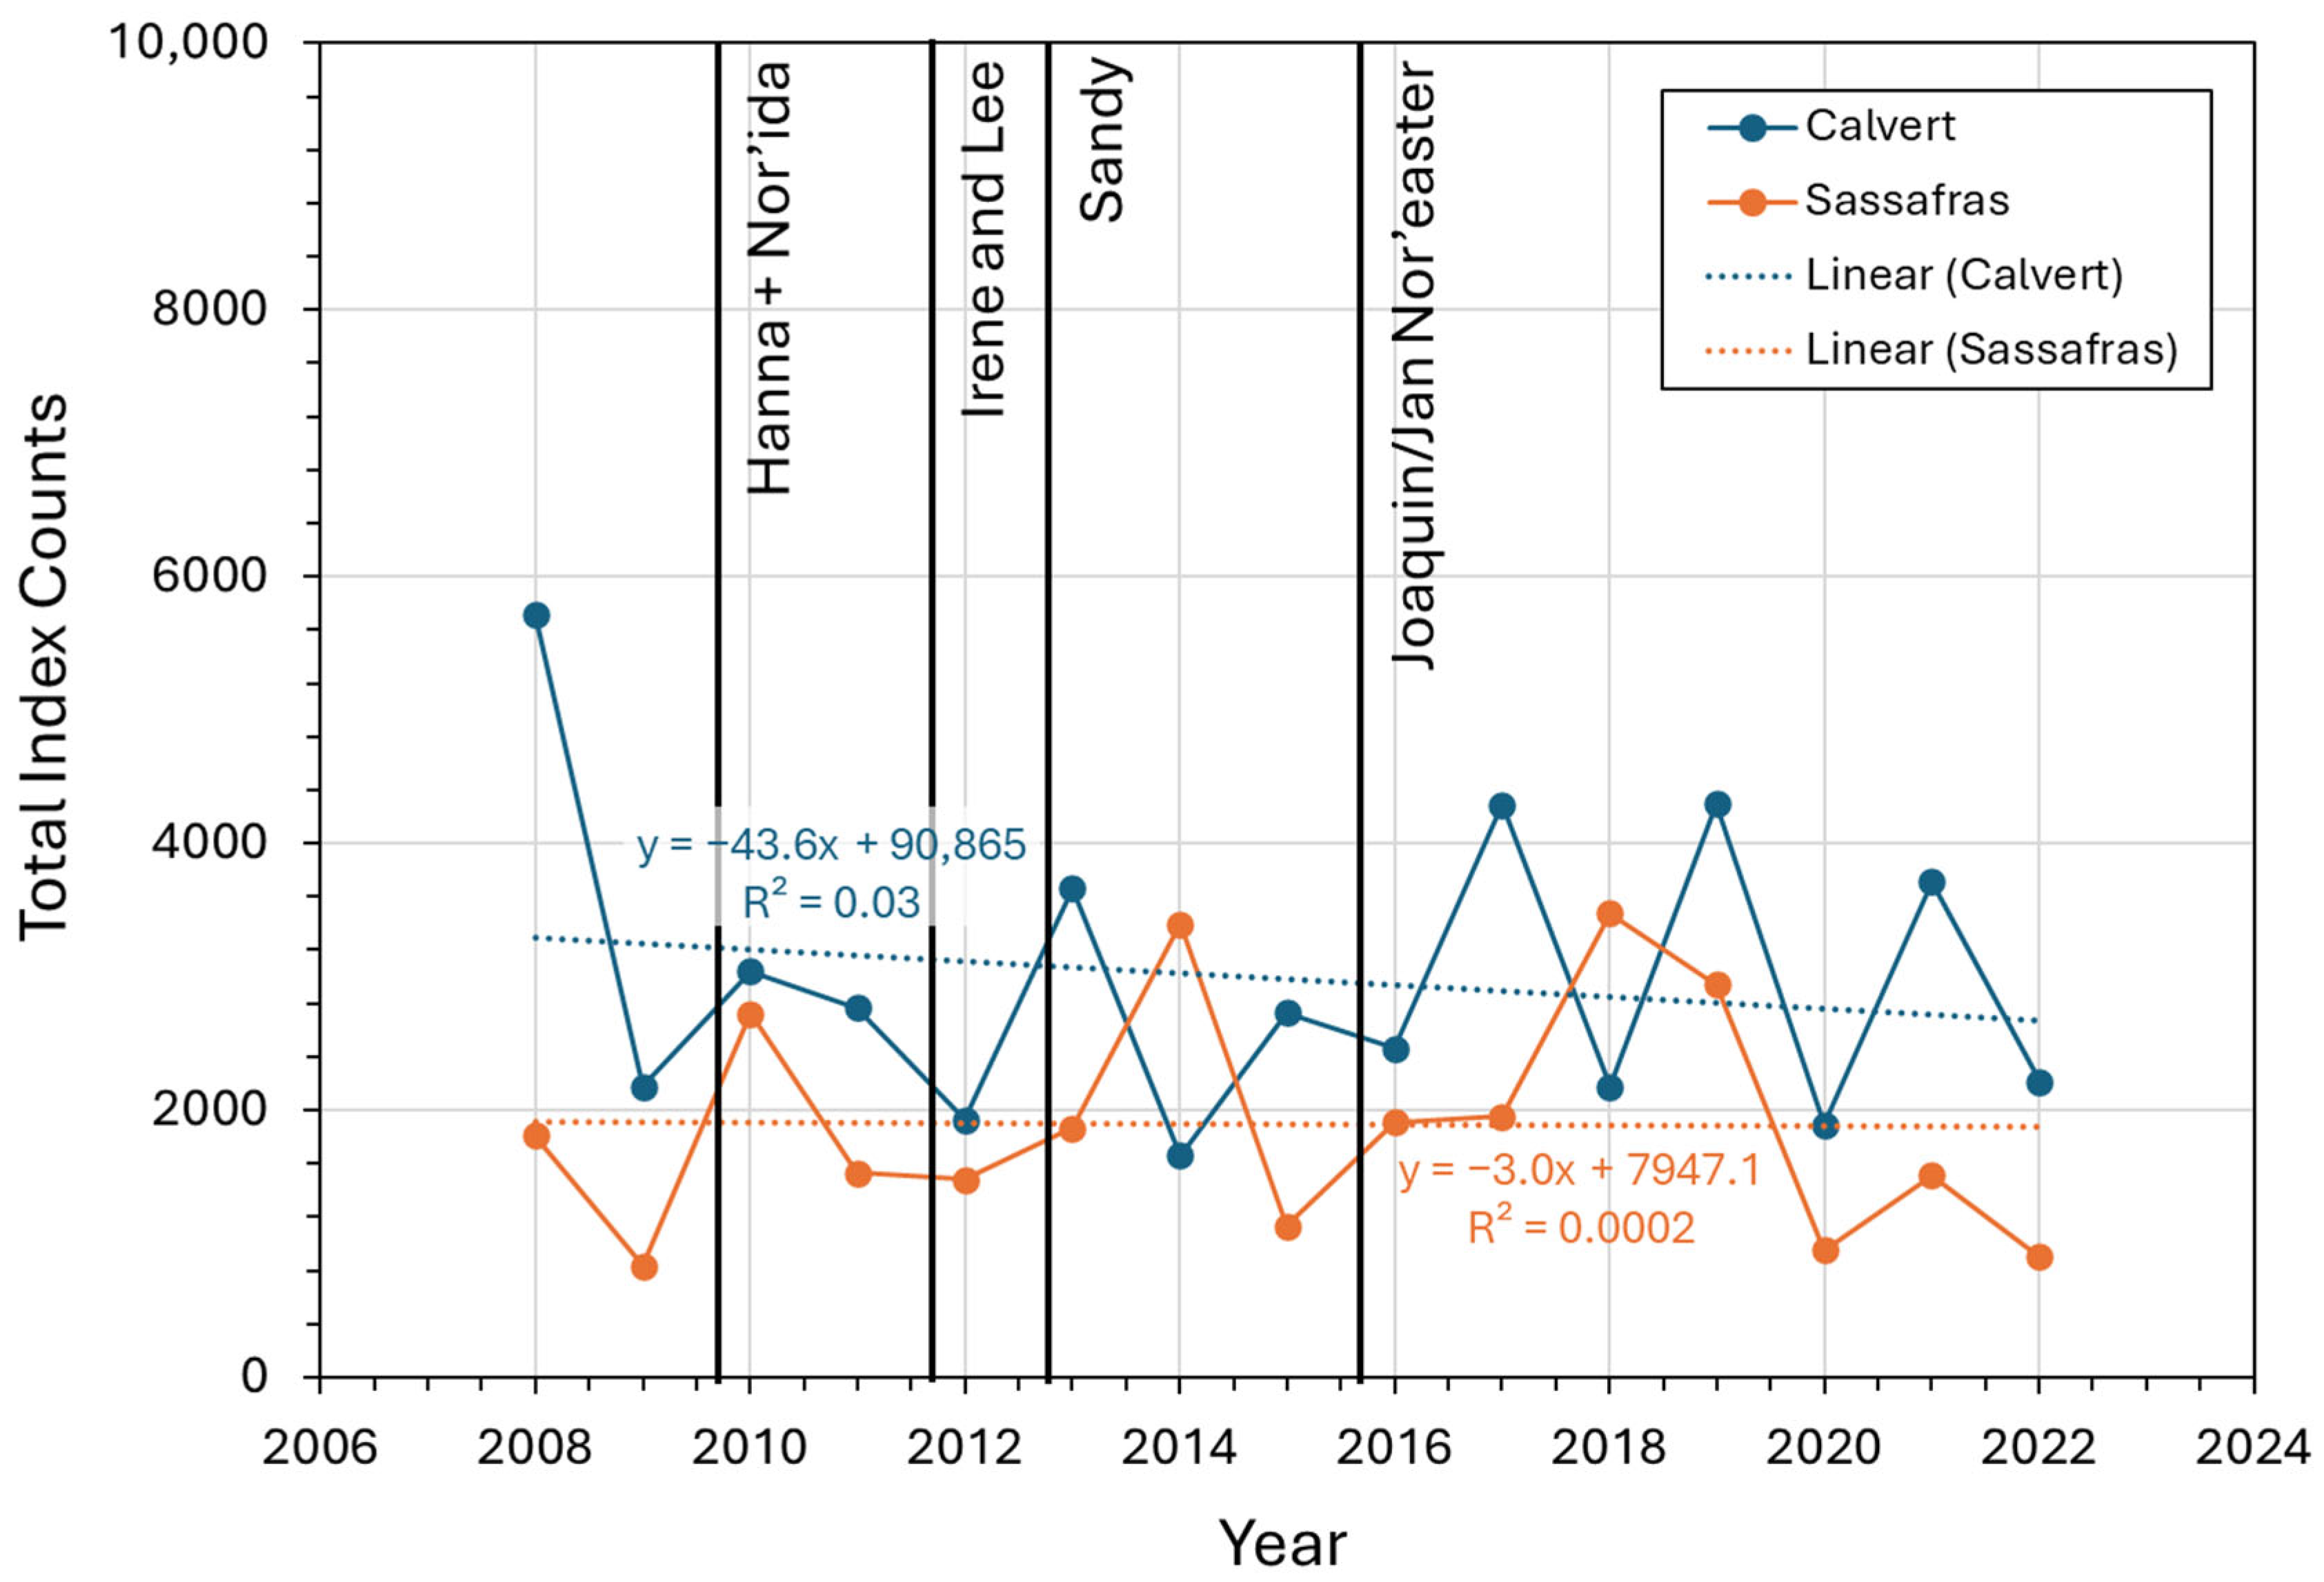
The passage and impact of Hurricane Isabel through Maryland in 2003 demonstrated the impact of large-magnitude events on bluff and habitat exposures, and of a process that results in rapid colluvium erosion and dispersion. Although erosion patterns throughout the Bay following Hurricane Isabel (a tropical storm when reaching Maryland) were irregular and mainly concentrated on the western shore [40], this large outlier storm [41] may explain the causes of post-Isabel PTB abundance increases (and reversal from a population decline from the 1990s to 2005). The decline in PTB numbers during the 1990s to 2005 may have resulted from limited storm activity (frequent and/or large-magnitude storms), continued bluff erosion and slumping, and ensuing bluff stabilization (Stages 2 and 3 of the bluff erosion cycle; Figure 9). In contrast, the subsequent increase in PTB abundance at both metapopulation sites in the Chesapeake Bay beginning in 2005 (especially at the Calvert Cliffs State Park, Little Cove, and Cliffs of Calvert sites) may be directly linked to the creation of fresh bluff face exposures (i.e., decreasing vegetation and increasing habit) as a consequence of Isabel (Figure 4). Given that little or no PTB recruitment would have occurred during the spring and summer seasons immediately following the passage of Isabel, the creation of new bluff face exposures for the 2004 PTB adult population, and the two-year PTB life cycle, we would expect to find the PTB numbers increasing beginning in 2005. The PTB count data support the hypothesis that a three-year lag existed between the storm passage and a recovery of the population. More recent data indicate that PTB adult numbers have continued to fluctuate at both the Calvert County and Sassafras River sites on a two-to-four-year cycle, reflecting the species’ two-year life cycle and/or fluctuations in recruitment associated with changing habitat conditions related to climatic variability (e.g., storm impacts). (Figure 10). Calvert sites sustained higher numbers on average (2786.5, SE = 236.9) than Sassafras River sites (1900.9, SE = 241.2) as had happened historically. However, peak numbers at Calvert and Sassafras sites (4294 and 3479 beetles, respectively) have not approached the peak numbers observed during the 1980s and 1990s (Figure 4 and Figure 10).

5. Conclusions

Multiple factors influence the distribution and abundance of PTBs, including first-order geologic and biologic conditions, as well as a suite of more localized, second-order variables. Within each site, PTBs select the best available habitat consisting of fine-to-medium-grained, well-sorted sand of moderate compaction. Because these sediment characteristics occur in beds of different formations, the PTBs find suitable habitat primarily at two locations along Maryland’s Chesapeake Bay coast but separated by approximately 120 km in distance, estuarine water, and geologic environments that were deposited 45–85 million years apart. At both, PTBs occupy fresh, steep, unvegetated bluff exposures that provide ideal substrate for burrowing and oviposition. The natural processes that produce such exposures operate cyclically over decades, with each bluff existing at any given time in one phase of an ongoing erosion cycle (Figure 9). The geomorphodynamics associated with this cycle—both cumulative and episodic—produce spatial variation in bluff states around the Bay. PTBs appear to colonize bluffs where the current erosion phase and underlying geology favor species persistence. Annual surveys across Maryland sites continue to document extreme fluctuations in adult numbers, and observational evidence links these variations to episodic cliff erosion and associated habitat change [6].
Recent surveys and studies of other beach-dwelling species have also noted the progressive narrowing of the beaches at all sites due to sea-level rise (SLR) and storm activity [42,43]. Surprisingly, this beach-narrowing phenomenon may have contrasting effects on populations of E. puritana [5,6]. Narrower beaches reduce the area and time for adult foraging, and as result, may reduce larvae recruitment, and consequently, adult population size. Narrower beaches will also expose the bluffs to increased erosion and sediment supply that could create more bare patches of suitable habitat. Consequently, predictions and hypotheses regarding the impact of future storms, increasing storminess, and SLR must account for the relative rates at which storms occur and bluffs erode compared to the pace of SLR rates (or large lake water level changes) [44,45,46]. For example, if SLR proceeds faster than the rate at which storms erode coastal bluffs and replenish beach sand, the littoral zone may become inundated, reducing habitat availability and potentially extirpating the PTB and other beach-dwelling organisms. In addition, the physical factors that control bluff stability and the height and failure mechanism (e.g., fall, shallow slide, or slump) must also be considered [46]. Overall, scientific consensus indicates that bluff erosion is likely to accelerate under four projected SLR scenarios, which range from 20th-century rates to as much as +2 m of rise by 2100 [47].
Strategies used along the Chesapeake Bay shores to prevent bluff erosion include bluff toe revetments (e.g., Little Cove Point and Scientists Cliffs), groins (e.g., Scientists Cliffs), and nearshore breakwaters (e.g., Grove Point; Figure 11). Photographic and field analyses showed that these structures can lead to rapid growth of bluff vegetation within two years of placement. However, bluff toe stabilization (via groins or revetments) and increasing the amount of vegetation on the bluff faces will not effectively stabilize slopes over the long term [11,36,48,49]. Leatherman [38] and Clark et al. [11] indicated that planting vegetation can exacerbate bluff erosion in areas where groundwater seeping is active. Thus, revetments and other toe-stabilization methods that reinforce the base of bluffs over a 30–40-year period do not necessarily prevent continued erosion [11]. Overall, such structures tend to slow the natural bluff erosion cycle—the interval between fresh bluff face exposures—by decades (Figure 11). It is likely that a slowdown in the bluff erosion cycle would have an attendant negative impact on the PTB which, like other tiger beetles, prefer dynamic habitat [50]. For example, installation of erosion control structures at several Calvert County sites corresponded with a decline in suitable habitat and PTB numbers between 2000 and 2005, as observed during prior field investigations (e.g., Western Shores, southern Scientists Cliffs). Therefore, bluff erosion management strategies should account for the ecological consequences of reduced natural bluff dynamics, ensuring that stabilization efforts balance shoreline protection with the preservation of early-successional habitat essential for sustaining PTB populations.

Author Contributions

Conceptualization, M.S.F. and C.B.K.; methodology, M.S.F. and C.B.K.; formal analysis, M.S.F. and C.B.K.; investigation, M.S.F. and C.B.K.; resources, M.S.F. and C.B.K.; data curation, M.S.F. and C.B.K.; writing—original draft preparation, M.S.F.; writing—review and editing, C.B.K.; visualization, M.S.F. and C.B.K.; and project administration, M.S.F. and C.B.K. All authors have read and agreed to the published version of the manuscript.

Funding

Funding for this work was provided by the U.S. Fish and Wildlife Service using internal year-end resources and a Shapiro Undergraduate Research Fellowship at Randolph-Macon College. Neither source of support carried a specific grant number.

Data Availability Statement

The original data presented in the study are openly available in GitHub at https://github.com/mfenster-beaches/Puritana-project-data-storage (accessed 14 October 2025).

Acknowledgments

We thank Mary Ratnaswamy and Andy Moser for their interest in the project and securing funding. We also thank Christine Ebert for her outstanding contributions to this project. Her exceptional field, laboratory, and computational efforts were instrumental to the success of this study. Charles Gowan provided invaluable support with statistical analyses, which greatly enhanced the rigor and quality of our results, and Jim McCann assisted with the field studies.

Conflicts of Interest

The authors declare no conflicts of interest.

Abbreviations

The following abbreviations are used in this manuscript:
ANOVAAnalysis of Variance
GISGeographic Information Systems
PTBPuritan tiger beetle
PVAPopulation Viability Analysis
SEStandard error
USFWSUnited States Fish and Wildlife Service
VWCVolumetric water content

References

  1. U.S. Fish and Wildlife Service (USFWS). Endangered and threatened wildlife and plants; determination of threatened status for Puritan Tiger Beetle and the Northeastern Beach Tiger Beetle. Fed. Regist. 1990, 55, 32088–32094. [Google Scholar]
  2. Omland, K.S. Puritan Tiger Beetle (Cicindela puritana) on the Connecticut River: Habitat management and translocation alternatives. In Species Conservation and Management: Case Studies; Akçakaya, H.R., Burgman, M.A., Kindvall, O., Wood, C.C., Sjögren-Gulve, P., Hatfield, J.S., McCarthy, M.A., Eds.; Oxford University Press: New York, NY, USA, 2004; pp. 137–149. [Google Scholar] [CrossRef]
  3. Knisley, C.B.; Gwiazdowski, R. Conservation strategies for protecting tiger beetles and their habitats in the United States: Studies with listed species (Coleoptera: Carabidae: Cicindelidae). Ann. Entomol. Soc. Am. 2021, 114, 293–301. [Google Scholar] [CrossRef]
  4. Pagac, B.B.; Ranum, K.L.; Knisley, C.B.; McCann, J.M.; Moser, G.A.; McGowan, P.C. Discovery of the Puritan Tiger Beetle, Ellipsoptera puritana (G. Horn) (Coleoptera: Carabidae), along the Severn River, Maryland. Coleopt. Bull. 2017, 71, 357–360. [Google Scholar] [CrossRef]
  5. U.S. Fish and Wildlife Service (USFWS). Puritan Tiger Beetle (Ellipsoptera puritana) 5-Year Review: Summary and Evaluation; U.S. Fish and Wildlife Service: Annapolis, MD, USA, 2025; 35p.
  6. Knisley, C.B. Studies of Cicindela puritana and C. d. dorsalis in Maryland, 2019; Unpublished report; Maryland Department of Natural Resources: Annapolis, MD, USA, 2019. [Google Scholar]
  7. Gowan, C.; Knisley, C.B. A population Viability Analysis for the Puritan Tiger Beetle in the Chesapeake Bay Region; U.S. Fish and Wildlife Service: Annapolis, MD, USA, 2016. [Google Scholar]
  8. Ashby, W.L. Fossils of Calvert Cliffs, 3rd ed.; Calvert Marine Museum: Solomons, MD, USA, 1995; 19p. [Google Scholar]
  9. Maryland Natural Heritage Program. Habitat Conservation Planning Assistance Grant Proposal; U.S. Fish and Wildlife Service, Region 5: Hadley, MA, USA, 2003. [Google Scholar]
  10. Vogler, A.P.; Knisley, C.B.; Glueck, S.B.; Hill, J.M.; Desalle, R. Using molecular and ecological data to diagnose endangered populations of the Puritan Tiger Beetle Cicindela puritana. Mol. Ecol. 1993, 2, 375–383. [Google Scholar] [CrossRef] [PubMed]
  11. Clark, I.; Larson, C.E.; Herzog, M. Evolution of equilibrium slopes at Calvert Cliffs, Maryland: A method of estimating the time scale of slope stabilization. Shore Beach 2004, 72, 17–23. [Google Scholar]
  12. Goetz, S.J.; Jantz, C.A.; Prince, S.D.; Smith, A.J.; Varlyguin, D.; Wright, R. Integrated analysis of ecosystem interactions with land use change: The Chesapeake Bay watershed. In Ecosystems and Land Use Change; Geophysical Monograph Series; DeFries, R.S., Ed.; AGU: Washington, DC, USA, 2004; Volume 153, pp. 263–275. [Google Scholar]
  13. Jantz, P.; Goetz, S.J.; Jantz, C.A. Urbanization and the loss of resource lands within the Chesapeake Bay watershed. Environ. Manag. 2005, 36, 808–825. [Google Scholar] [CrossRef]
  14. Bilkovic, D.M.; Roggero, M.M. Effects of coastal development on nearshore estuarine nekton communities. Mar. Ecol. Prog. Ser. 2008, 358, 27–39. [Google Scholar] [CrossRef]
  15. Goetz, S.J.; Jantz, P. Satellite maps show Chesapeake Bay urban development. Eos 2011, 87, 149–152. [Google Scholar] [CrossRef]
  16. Bilkovic, D.M.; Mitchell, M.M.; Havens, K.J.; Hershner, C.H. Chesapeake Bay. In World Seas: An Environmental Evaluation, 2nd ed.; Sheppard, C., Ed.; Academic Press: Cambridge, MA, USA, 2019; Volume I: Europe, the Americas and West Africa, pp. 379–404. [Google Scholar] [CrossRef]
  17. Knisley, C.B.; Schultz, T.D. The Biology of Tiger Beetles and a Guide to the Species of the South Atlantic States; Special Publication Number 5; Virginia Museum of Natural History: Martinsville, VA, USA, 1997. [Google Scholar]
  18. Hill, J.M.; Knisley, C.B. Puritan Tiger Beetle Recovery Plan; U.S. Fish and Wildlife Service, Northeast Region: Hadley, MA, USA, 1993. [Google Scholar]
  19. Omland, K.S. Larval habitat and reintroduction site selection for Cicindela puritana in Connecticut. Northeast. Nat. 2002, 9, 433–451. [Google Scholar] [CrossRef]
  20. Kidwell, S.M. Stratigraphic condensation of marine transgressive records: Origin of major shell deposits in the Miocene of Maryland. J. Geol. 1989, 97, 1–24. [Google Scholar] [CrossRef]
  21. Minard, J. Geology of the Betterton Quadrangle, Kent County, Maryland, and a discussion of the regional stratigraphy. In U.S. Geological Survey Professional Paper 816; U.S. Department of the Interior: Washington, DC, USA, 1974. [Google Scholar]
  22. Shattuck, G.B. The Miocene formations of Maryland. Science 1902, 15, 906. [Google Scholar]
  23. Shattuck, G.B. Geological and paleontological relations, with a review of earlier investigations. In The Miocene Deposits of Maryland; Clark, W.B., Shattuck, G.B., Dall, W.H., Eds.; Maryland Geological Survey: Baltimore, MD, USA, 1904; Volume 1, pp. xxxiii–cxxxvii. [Google Scholar]
  24. Ward, L.W. Molluscan biostratigraphy of the Miocene, Middle Atlantic Coastal Plain of North America. In Virginia Museum of Natural History Memoir Number 2; Virginia Museum of Natural History: Martinsville, VA, USA, 1992; 159p. [Google Scholar]
  25. Kidwell, S.M. Anatomy of extremely thin marine sequences landward of a passive-margin hinge zone: Neogene Calvert Cliffs succession, Maryland. J. Sediment. Res. 1997, 67B, 322–340. [Google Scholar] [CrossRef]
  26. Ward, L.W.; Powars, D.S. Tertiary lithology and paleontology, Chesapeake Bay region. In Geology of the National Capital Region—Field Trip Guidebook; Circular 1264; Southworth, S., Burton, W., Eds.; Geological Society of America: Boulder, CO, USA, 2004; pp. 263–297. [Google Scholar]
  27. International Union of Geological Sciences (IUGS); Geological Society of America (GSA). International Stratigraphic Guide: A Guide to Stratigraphic Classification, Terminology, and Procedure; Geological Society of America: Boulder, CO, USA, 2013. [Google Scholar]
  28. North American Commission on Stratigraphic Nomenclature (NACSN). North American Stratigraphic Code. Stratigraphy 2021, 18, 153–204. [Google Scholar] [CrossRef]
  29. Owens, J.P.; Minard, J.P.; Sohl, N.F.; Mello, J.E. Stratigraphy of the outcropping Post-Magothy Cretaceous formations in southern New Jersey and northern Delmarva Peninsula. In U.S. Geological Survey Paper 674; U.S. Government Printing Office: Washington, DC, USA, 1970; 59p. [Google Scholar]
  30. U.S. Fish and Wildlife Service (USFWS). Puritan Tiger Beetle (Cicindela puritana) 5-Year Review: Summary and Evaluation; U.S. Fish and Wildlife Service: Annapolis, MD, USA, 2019; 38p.
  31. Meyer, M.; Knisley, C.B. Studies of Ellipsoptera puritana and Habroscelimorpha d. dorsalis in Maryland, 2023; Report; Maryland Wildlife and Heritage Service: Annapolis, MD, USA, 2023; 31p. [Google Scholar]
  32. Knisley, C.B.; Hill, J.M. Studies of Cicindela dorsalis dorsalis and Cicindela puritana in Calvert, Cecil, and Kent Counties, Maryland: Site Surveys and Biological Studies; Final Report; Maryland Department of Natural Resources: Annapolis, MD, USA, 1993. [Google Scholar]
  33. Folk, R.L.; Ward, W.C. Brazos River bar: A study in the significance of grain size parameters. J. Sediment. Petrol. 1957, 27, 3–26. [Google Scholar] [CrossRef]
  34. Knisley, C.B.; Fenster, M.S. Studies of the Puritan Tiger Beetle (Cicindela puritana) and Its Habitat: Implications for Management; Final Report; U.S. Fish and Wildlife Service: Annapolis, MD, USA, 2009. [Google Scholar]
  35. Fenster, M.S.; Knisley, C.B. Impact of dams on point bar habitat: A case for the extirpation of the Sacramento Valley Tiger Beetle, Cicindela hirticollis abrupta. River Res. Appl. 2006, 22, 881–904. [Google Scholar] [CrossRef]
  36. Fenster, M.S.; Knisley, C.B.; Reed, C.T. Habitat preference and the effects of beach nourishment on the federally threatened Northeastern Beach Tiger Beetle, Cicindela dorsalis dorsalis: Western Shore, Chesapeake Bay, Virginia. J. Coast. Res. 2006, 22, 1133–1144. [Google Scholar] [CrossRef]
  37. Cornelisse, T.M.; Hafernik, J.E. Effects of soil characteristics and human disturbance on tiger beetle oviposition. Ecol. Entomol. 2009, 34, 495–503. [Google Scholar] [CrossRef]
  38. Leatherman, S.P. Cliff stability along western Chesapeake Bay, Maryland. Mar. Technol. Soc. J. 1986, 20, 28–36. [Google Scholar]
  39. Wilcock, P.R.; Miller, D.S.; Shea, R.H.; Kerkin, R.T. Frequency of effective wave activity and the recession of coastal bluffs: Calvert Cliffs, Maryland. J. Coast. Res. 1998, 14, 256–268. [Google Scholar]
  40. Hennessee, E.L.; Halka, J.P. Hurricane Isabel and erosion of Chesapeake Bay shorelines, Maryland. In Chesapeake Research Consortium Publication 05-160; Chesapeake Research Consortium: Edgewater, MD, USA, 2005; pp. 81–87. [Google Scholar]
  41. Callahan, J.A.; Leathers, D.J.; Callahan, C.L. Skew Surge and Storm Tides of Tropical Cyclones in the Delaware and Chesapeake Bays for 1980–2019. Front. Clim. 2021, 3, 610062. [Google Scholar] [CrossRef]
  42. Woodland, R.J.; Rowe, C.L.; Henry, P.F.P. Changes in habitat availability for multiple life stages of diamondback terrapins (Malaclemys terrapin) in Chesapeake Bay in response to sea-level rise. Estuaries Coasts 2017, 40, 1502–1515. [Google Scholar] [CrossRef]
  43. Fenster, M.S.; Knisley, C.B.; Gowan, C. Developing best management practices to enhance critical beach habitat for the northeastern beach tiger beetle (Habroscelimorpha dorsalis dorsalis) and human community resilience in the Chesapeake Bay (Virginia and Maryland). Part I: Effects of structures on Chesapeake Bay’s endangered beaches. In Technical Report Submitted to the National Fish and Wildlife Foundation; Technical Report; Randolph-Macon College: Ashland, VA, USA, 2025; EasyGrantsID: 76061. [Google Scholar]
  44. Volpano, A.; Zoet, L.K.; Rawling, J.E.; Theuerkauf, E.J.; Krueger, R. Three-dimensional bluff evolution in response to seasonal fluctuations in Great Lakes water levels. J. Great Lakes Res. 2020, 46, 1533–1543. [Google Scholar] [CrossRef]
  45. Zoet, L.K.; Rawling, J.E., III. Analysis of a sudden bluff failure along the southwest Lake Michigan shoreline. J. Great Lakes Res. 2017, 43, 999–1004. [Google Scholar] [CrossRef]
  46. Krueger, R.; Zoet, L.K.; Rawling, J.E., III. Coastal bluff evolution in response to a rapid rise in surface water level, 2020. J. Geophys. Res. Earth Surf. 2020, 125, e2019JF005428. [Google Scholar] [CrossRef]
  47. Gutierrez, B.T.; Williams, S.J.; Thieler, E.R. Potential for shoreline changes due to sea-level rise along the U.S. mid-Atlantic region. In USGS Open-File Report 2007-1278; U.S. Geological Survey: Reston, VA, USA, 2007; pp. 1–25. [Google Scholar] [CrossRef]
  48. Shultz, L.P.; Ashby, W. An analysis of an attempt to control beach erosion in the Chesapeake Bay, at Scientist Cliffs, Calvert County, Maryland. Chesapeake Sci. 1967, 8, 237–252. [Google Scholar] [CrossRef]
  49. Palmer, H.D. Shoreline erosion in Upper Chesapeake Bay: The role of groundwater. Shore Beach 1973, 41, 1–5. [Google Scholar]
  50. Knisley, C.B. Anthropogenic disturbances and rare tiger beetle habitats: Benefits, risks, and implications for conservation. Terrestr. Arthropod Rev. 2011, 4, 1–21. [Google Scholar] [CrossRef]
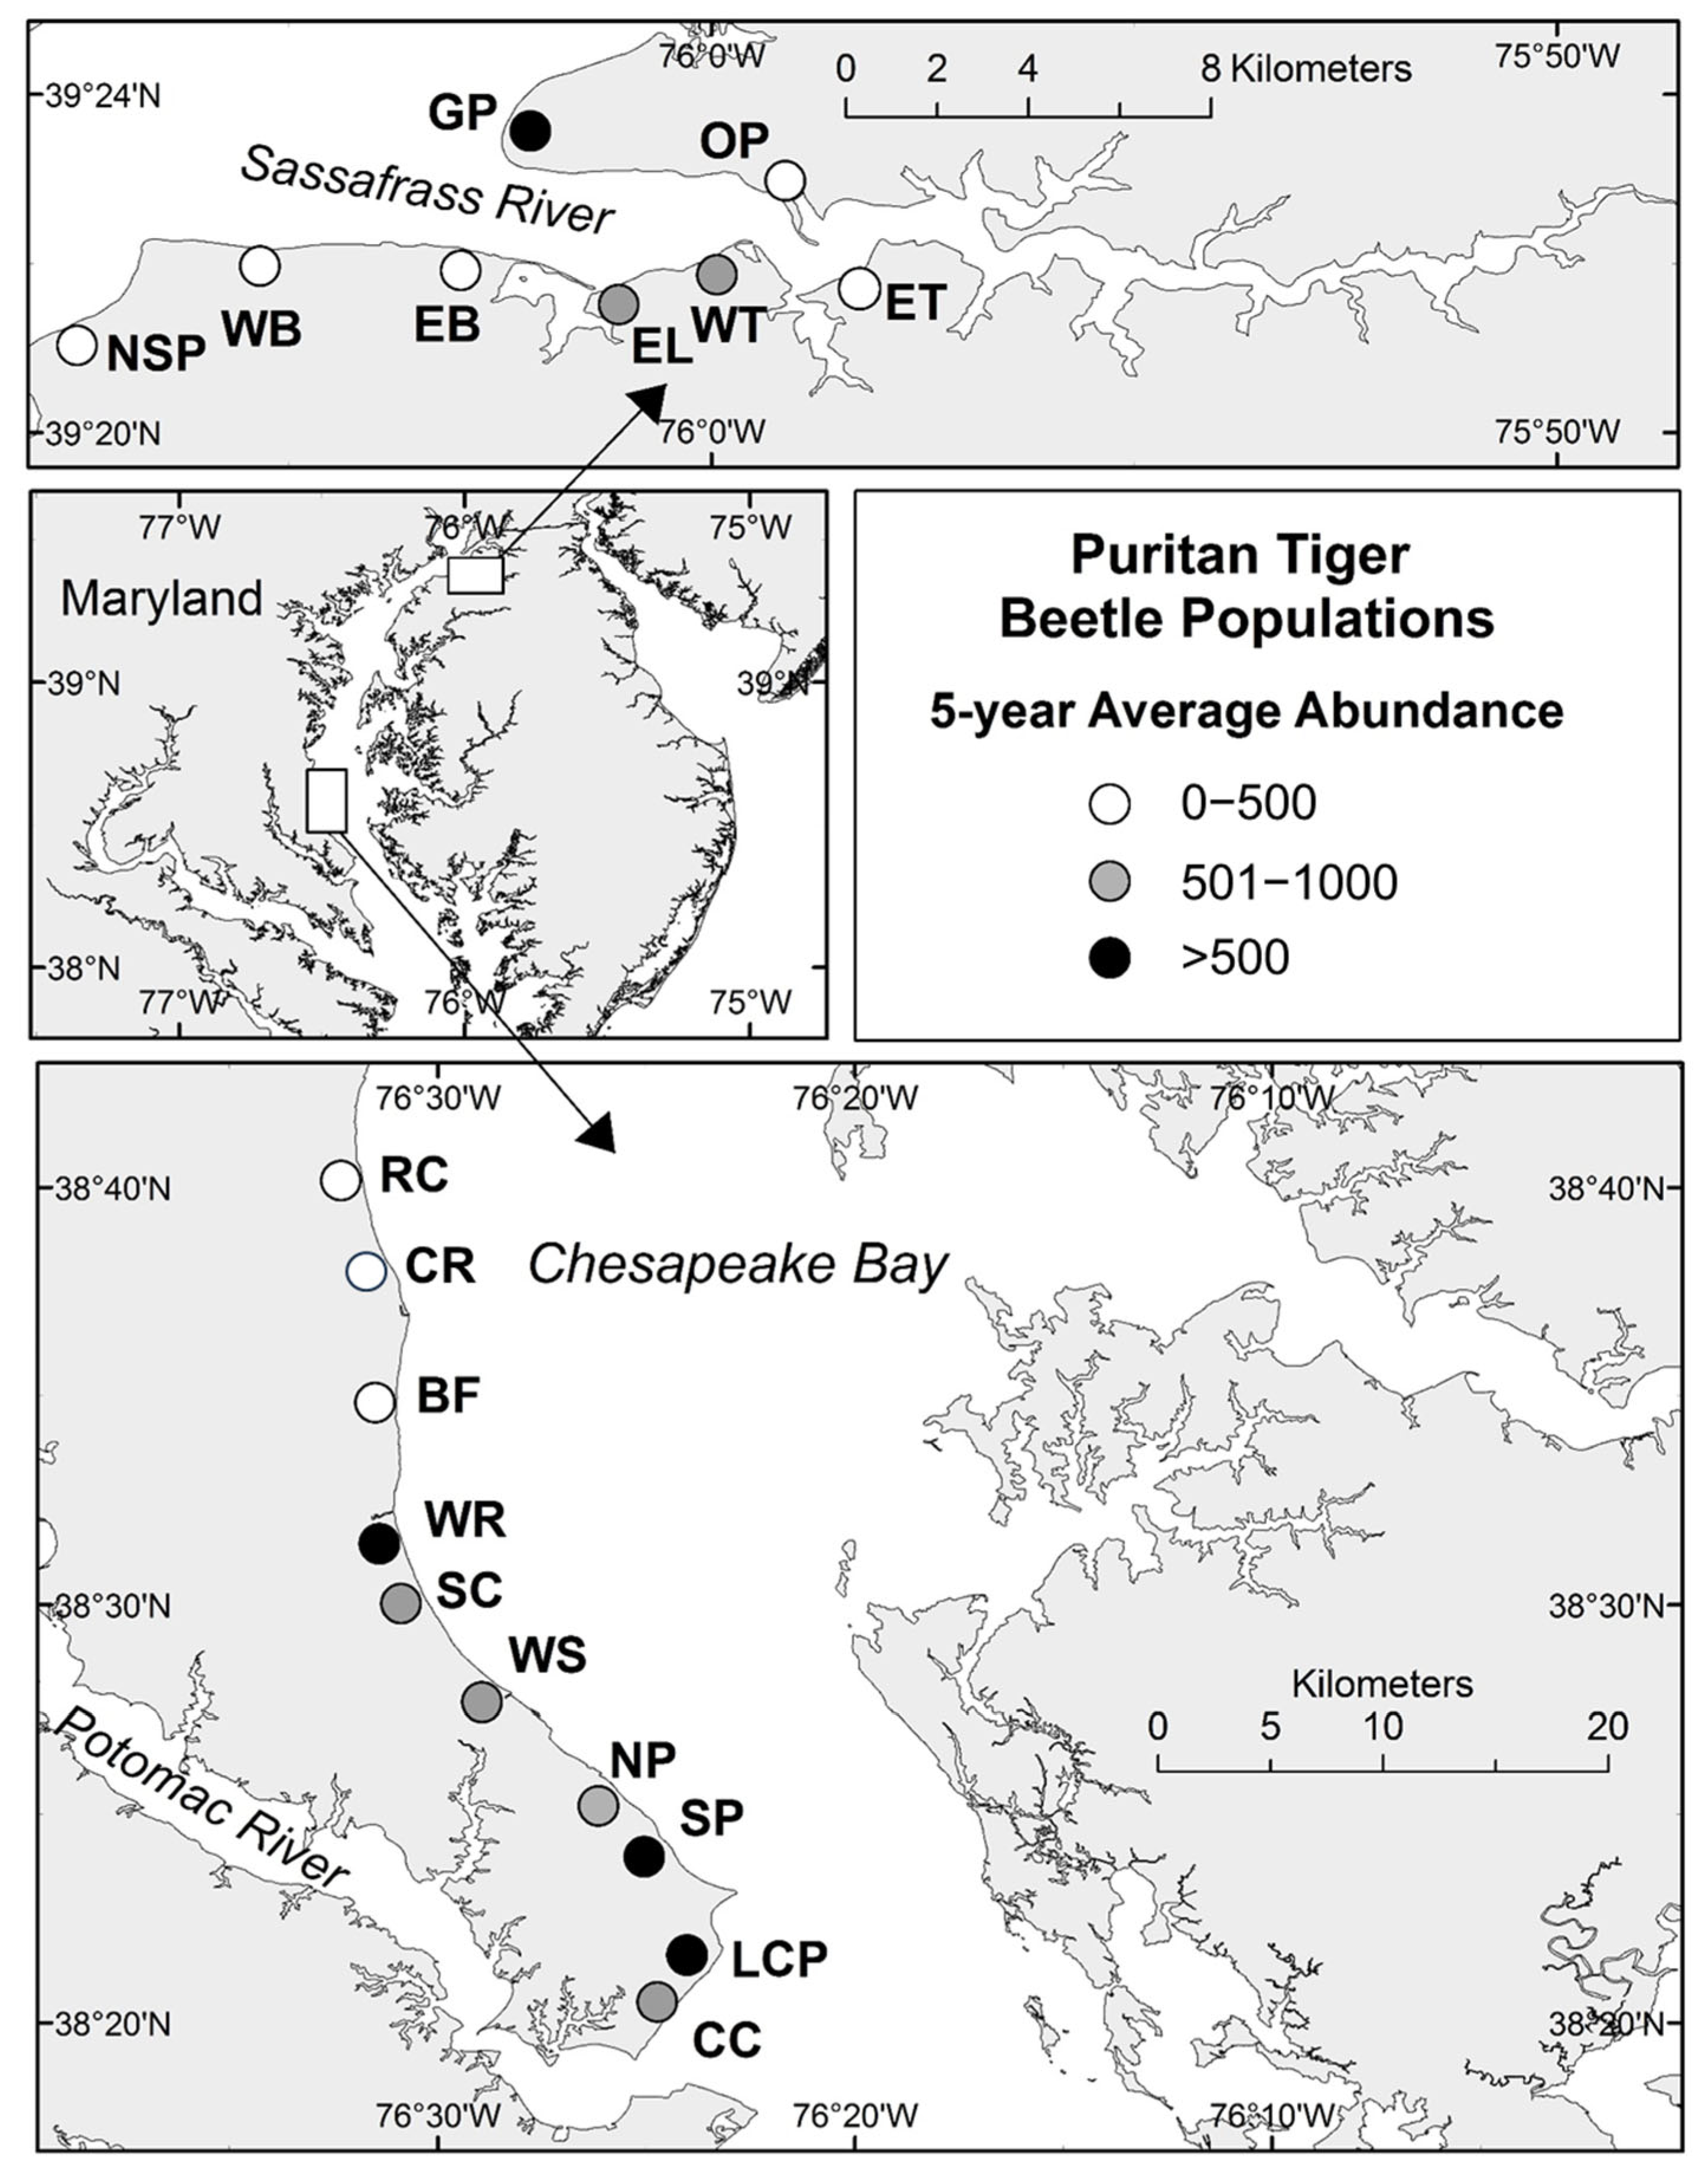
Figure 1. Map of the Sassafras River and Calvert County PTB sites within Maryland with five-year average abundances shown for the study sites. On the Sassafras River (top): GP = Grove Point, OP = Ordinary Point, NSP = North Still Pond, WB = West Betterton, EB = East Betterton, EL = East Lloyd, WT = West Turner, ET = East Turner. In Calvert County (bottom): RC = Randle Cliffs, CR = Camp Roosevelt, BF = Bayside Forest, WR = Warriors Rest, SC = Scientists Cliffs, WS = Western Shores, NP = (Calvert Cliffs) Nuclear Power (Plant), SP = (Calvert Cliffs) State Park, LCP = Little Cove Point, CC = Cliffs of Calvert.
Geosciences 15 00444 g001
Figure 2. Generalized geological profile of Calvert County bluffs showing the regional southerly dip and exposures of geological formations at the various study sites. Note the predominance of the unfavorable (PTB habitat) Calvert Formation at the north end of the Calvert Cliffs (bottom), and the more favorable habitat Choptank Formation (black) to the south (middle two sections; after Ashby [8].
Geosciences 15 00444 g002
Figure 3. Representative sampling site at Little Cove Point. Samples were taken (3 replicates—within ovals and at arrows) at three different levels, two within the St. Mary’s Fm. and one within the Eastover Fm.
Geosciences 15 00444 g003
Figure 4. Total index counts for E. puritana adults in Calvert County and the Sassafras River, Maryland metapopulation sites, 1989–2008.
Geosciences 15 00444 g004
Figure 5. Areas of total bluff, potential habitat and probable habitat at all (A) Calvert County sites and (B) all Sassafras River sites.
Geosciences 15 00444 g005
Figure 6. Comparison of potential and probable habitat area in percentage along the bluffs for the Calvert and Sassafras sites. For all sites except the West Turner, East Lloyd and Ordinary Point sites, the amount of probable habitat is less than the amount of potential habitat. West Turner A and East Lloyd D emerge as having the largest percentage probable habitat.
Geosciences 15 00444 g006
Figure 7. Analysis of the amount of available habitat (in m2) compared to the adult beetle count for individual bluffs within the Calvert and Sassafras sites in 2007.
Geosciences 15 00444 g007
Figure 8. Change in total potential habitat between 2000 and 2007 as documented by photographic analyses. The percentages indicate the gain (↑) or loss (↓) in total potential habitat (decrease in vegetative cover).
Geosciences 15 00444 g008
Figure 9. Geomorphodynamic bluff erosion cycle showing bluffs in various stages ranging from steep, freshly exposed bluff faces to low-angle, colluvium-covered bluff faces. Stage 1. Fresh (unvegetated, unstable), steep, bluff face exposure; Stage 2. Gradual slumping (translational slides) at the top of the bluff through groundwater seepage, reduced bluff slope, and possible vegetative growth; Stage 3. Continued slumping of the top layers and/or slumping through wave cut activity of intact bluff material and oversteepening of the bluff face producing a stable colluvium fan at the bluff toe with slopes at angle of repose and that encourages vegetative growth; Stage 4. Erosion and dispersal of colluvium fan; Stage 5 = Stage 1 (back to beginning).
Geosciences 15 00444 g009
Figure 10. Total index counts for E. puritana adults in Calvert County and the Sassafras River, Maryland metapopulation sites, 2008–2022. Vertical lines represent approximate timing of named tropical and extratropical storms to have impacted upper Chesapeake Bay. Vertical scale identical to Figure 4 for comparison.
Geosciences 15 00444 g010
Figure 11. Photograph of one of the high beetle density sites at Grove Point, Maryland. Notice the difference in the vegetative cover behind the breakwater to the south (right in the photograph) compared to the unprotected bluff to the north (left in the photograph).
Geosciences 15 00444 g011
Table 1. Nonparametric paired Wilcoxon Signed Rank Test eliminating the effect of site on determining statistically significant differences between high and low larval beetle densities (combined strata) using a one-tailed test at a 95% confidence level (α = 0.05).
VariableSignificance
(p-Value)
High-Density
Mean
SELow-Density
Mean
SE
Moisture (% VWC)0.0616.21.816.6 2.3
Conductivity (dS/m)0.180.30.10.2 0.1
Temperature (°C)0.3327.61.525.62.3
Compaction (psi)0.01140.27.2162.26.6
Slope (°)0.3564.12.763.33.8
Mean grain size (mm)0.030.30.050.5 0.1
Sorting (mm)0.030.20.030.5 0.1
Percentage sand/mud (%)0.327.48.123.29.2
Table 2. Means and p-values from high- and low-density beetle sites for beach parameters (one-tailed ANOVA at a 95% confidence level, α = 0.05).
VariableSignificance (p-Value)High-Density
Mean
SELow-Density
Mean
SE
Width (m)0.765.00.34.80.6
Beach cover (%)0.2925.24.236.97.8
Beach cover type0.65dead wood and vegetationnadead wood and vegetationna
% shell and gravel0.7411.61.612.63.3
% heavy minerals0.671.30.51.60.8
Shoreline orientation (°)0.64277.538.7215.155.7
Slope at bluff toe (°)0.4711.61.010.11.3
Foreshore slope (°)0.387.60.78.61.0
Mean grain size (mm)0.150.4 0.070.6 0.2
Sorting (mm)0.470.30.080.40.1
Table 3. Means and ranges of grain size (in percent) for sediment samples where one or both E. puritana and C. repanda were present. Grain size categories include Coarse, >0.50 mm; Medium, 0.25–0.50 mm; Fine, 0.125–0.25 mm; Clay, <0.063 mm.
Number of SamplesMean %
Coarse
Range % CoarseMean % MediumRange % MediumMean %
Fine
Range %
Fine
Mean %
Clay
Range
Clay %
C. puritana17224–643811–66367–6150–15
C. repanda22264–86266–54266–62221–71
Both sp.9234–643914–48357–6230–15
Disclaimer/Publisher’s Note: The statements, opinions and data contained in all publications are solely those of the individual author(s) and contributor(s) and not of MDPI and/or the editor(s). MDPI and/or the editor(s) disclaim responsibility for any injury to people or property resulting from any ideas, methods, instructions or products referred to in the content.