Article

Depositional Environment as Main Controlling Factor for Low TOC Sediments in the Early Carboniferous Dawuba Formation of the Qiannan Depression

1
College of Petroleum Engineering, Shandong Institute of Petroleum and Chemical Technology, Dongying 257061, China
2
Shandong Key Laboratory of Shale Oil Exploration and Development in Continental Faulted Basin, Dongying 257015, China
3
Oil and Gas Survey, China Geological Survey, Beijing 100083, China
4
School of Chemical Engineering, Shandong Institute of Petroleum and Chemical Technology, Dongying 257061, China
5
School of Earth Resources, China University of Geosciences, Wuhan 430074, China
6
School of Geology and Mining Engineering, Xinjiang University, Urumqi 830047, China
7
School of Civil Engineering, Hubei Engineering University, Xiaogan 432000, China
*
Authors to whom correspondence should be addressed.
Geosciences 2025, 15(12), 442; https://doi.org/10.3390/geosciences15120442
Submission received: 13 October 2025 / Revised: 18 November 2025 / Accepted: 19 November 2025 / Published: 21 November 2025

Abstract

The evolution of the sedimentary environment in the Early Carboniferous Dawuba Formation of the Qiannan Depression significantly controlled the distribution of low-total organic carbon (TOC) sediments. In this study, the core samples were analyzed by thin section microscopy, field emission-scanning electron microscopy, pyrite morphology, X-ray diffraction, and geochemical analysis (TOC, sulfur, organic petrography, and major and trace elements). The formation is vertically divided into two members from bottom to top: Member 1 (average TOC = 1.15%) and Member 2 (average TOC = 0.88%). Depositional environment parameters indicate that Member 1 was in a suboxic-oxic transition environment, with weak detrital influx, and moderate paleoproductivity (more developed algae). Member 2 evolved into a stable oxic environment, with significantly enhanced detrital influx and reduced paleoproductivity. The correlations between multiple geochemical proxies (paleoredox, paleoproductivity, and terrestrial detrital influx) and TOC content indicate that high productivity in Member 1 was the main driver of organic matter accumulation, but the suboxic-oxic environment limited preservation efficiency (1.00% < TOC < 2.00%). Member 2, deposited during sea-level fall, experienced long-term oxic conditions and low productivity due to shallower water. Nevertheless, the partial reduction in the exposure time of organic matter within the oxic water column-driven by rapid detrital accumulation-represents a critical mechanism favoring organic-poor sediments (TOC < 1.00%). In conclusion, the development of low-TOC sediments in the Dawuba Formation reflects a transition from a relatively deep to shallow water column, where the synergistic effects of redox conditions, paleoproductivity, and terrigenous detrital influx controlled the distribution and enrichment of organic matter.

1. Introduction

China has achieved remarkable breakthroughs in shale gas exploration and production, particularly in the Sichuan Basin and its adjacent region [1,2,3]. Previous studies have focused on elucidating the processes governing organic matter accumulation and preservation in deep-water shelf shales, while the depositional dynamics of shallow-water shelf systems remain underexplored [4,5]. The Dawuba Formation, deposited in the shallow shelf environment of the Youjiang Basin in southern China during the Early Carboniferous, is extensively developed in the Qiannan Depression [6,7]. Controlled by the synergistic effects of global sea-level fluctuations and the palaeogeography of the rifted trough, sediments with hydrocarbon-generating material foundations exhibit distinct distribution patterns both vertically and horizontally across this region [8,9]. However, a critical question persists: the Qiannan Depression is dominated by low total organic carbon (TOC) sediments [10,11], though certain intervals exhibit relative enrichment of organic matter. Avoiding areas with low organic matter shale development is an effective method to identify sweet spots in organic-rich shale [12]. Consequently, exploring the organic matter accumulation processes in organic-poor shale can not only clarify the mechanisms underlying the formation but also provide novel insights for shale gas exploration.
Organic matter concentration in marine mudstones, a pivotal parameter for paleoenvironmental reconstruction and hydrocarbon resource evaluation, is governed by the dynamic interplay of three main factors: primary productivity in the water column, redox-dependent preservation efficiency at the sediment-water interface, and sedimentation rates [13,14]. The hierarchical dominance of these variables has led to the establishment of two end-member conceptual models explaining organic matter accumulation: the preservation-centric model and the productivity-driven model [15,16]. The preservation-centric model emphasizes anoxic bottom-water conditions as the key control, where depleted dissolved oxygen levels inhibit aerobic microbial degradation, thereby promoting the preservation of sedimented organic matter [17,18]. In contrast, the productivity-driven model posits that elevated primary productivity-fueled by nutrient availability and favorable climatic conditions-generates organic carbon fluxes that outpace decomposition rates, even under suboxic or oxic conditions, leading to net accumulation [19,20].
For instance, Yuan et al. proposed a redox-dominated, transgression-regression-controlled organic matter accumulation model for the Dawuba Formation sediments [21]. However, this model fails to account for the co-occurrence of both high-TOC and low-TOC shale during both transgressive and regressive intervals. Carboniferous shale in the Central Hunan region-characterized by a comparable rift trough paleogeographic setting-exhibit TOC contents primarily controlled by terrigenous clastic flux [8,9]. Nevertheless, studies within the target area have demonstrated inconsistent control of terrigenous clastic input on organic matter accumulation in shale.
To reference the organic matter accumulation environment and formation mechanism of low-TOC sediments, 27 samples from Well SD representing the Dawuba Formation were selected. Thin section microscopy, field emission-scanning electron microscopy, X-ray diffraction, and geochemical analyses (TOC content, organic petrography, major/trace elements) were conducted to identify and quantify variations in redox conditions, paleoproductivity, and terrigenous detrital influx. This study aimed to: (1) identify distribution patterns of low-TOC (organic-rich and organic-poor) sediments; (2) explain factors controlling low-TOC sedimentation; (3) clarify organic matter accumulation processes; and (4) propose a model for organic matter accumulation in low-TOC sediments. The findings of this study are expected to provide insights into the variability of low-TOC sediments in rifted trough-type basins, such as the Qiannan Depression.

2. Geological Background

The Qiannan Depression, located in southern Guizhou Province, occupies a tectonically transitional zone between the Yangtze Block and Jiangnan Orogenic Belt [8,9,21] (Figure 1a). The Hercynian Orogeny induced extensive marine transgression across the Qiannan Depression, with intensified rifting facilitating the deposition of deep-water sedimentary sequences within the developing rift trough system [6,9]. During the Late Devonian, the study area exhibited the coexistence of shallow-water carbonate platforms and deep-water rift basins [16,22]. During the Early Carboniferous, the Qiannan Depression maintained the archipelagic ocean paleogeography inherited from the Devonian [23,24]. This complex tectono-sedimentary setting resulted in a marked facies variation: shelf facies dominated the Bijie City, Guiyang City, and Dushan City, slope facies associations characterized the Liupanshui City, and basin facies sequences were deposited in Ziyun City and Luodian City (Figure 1b).
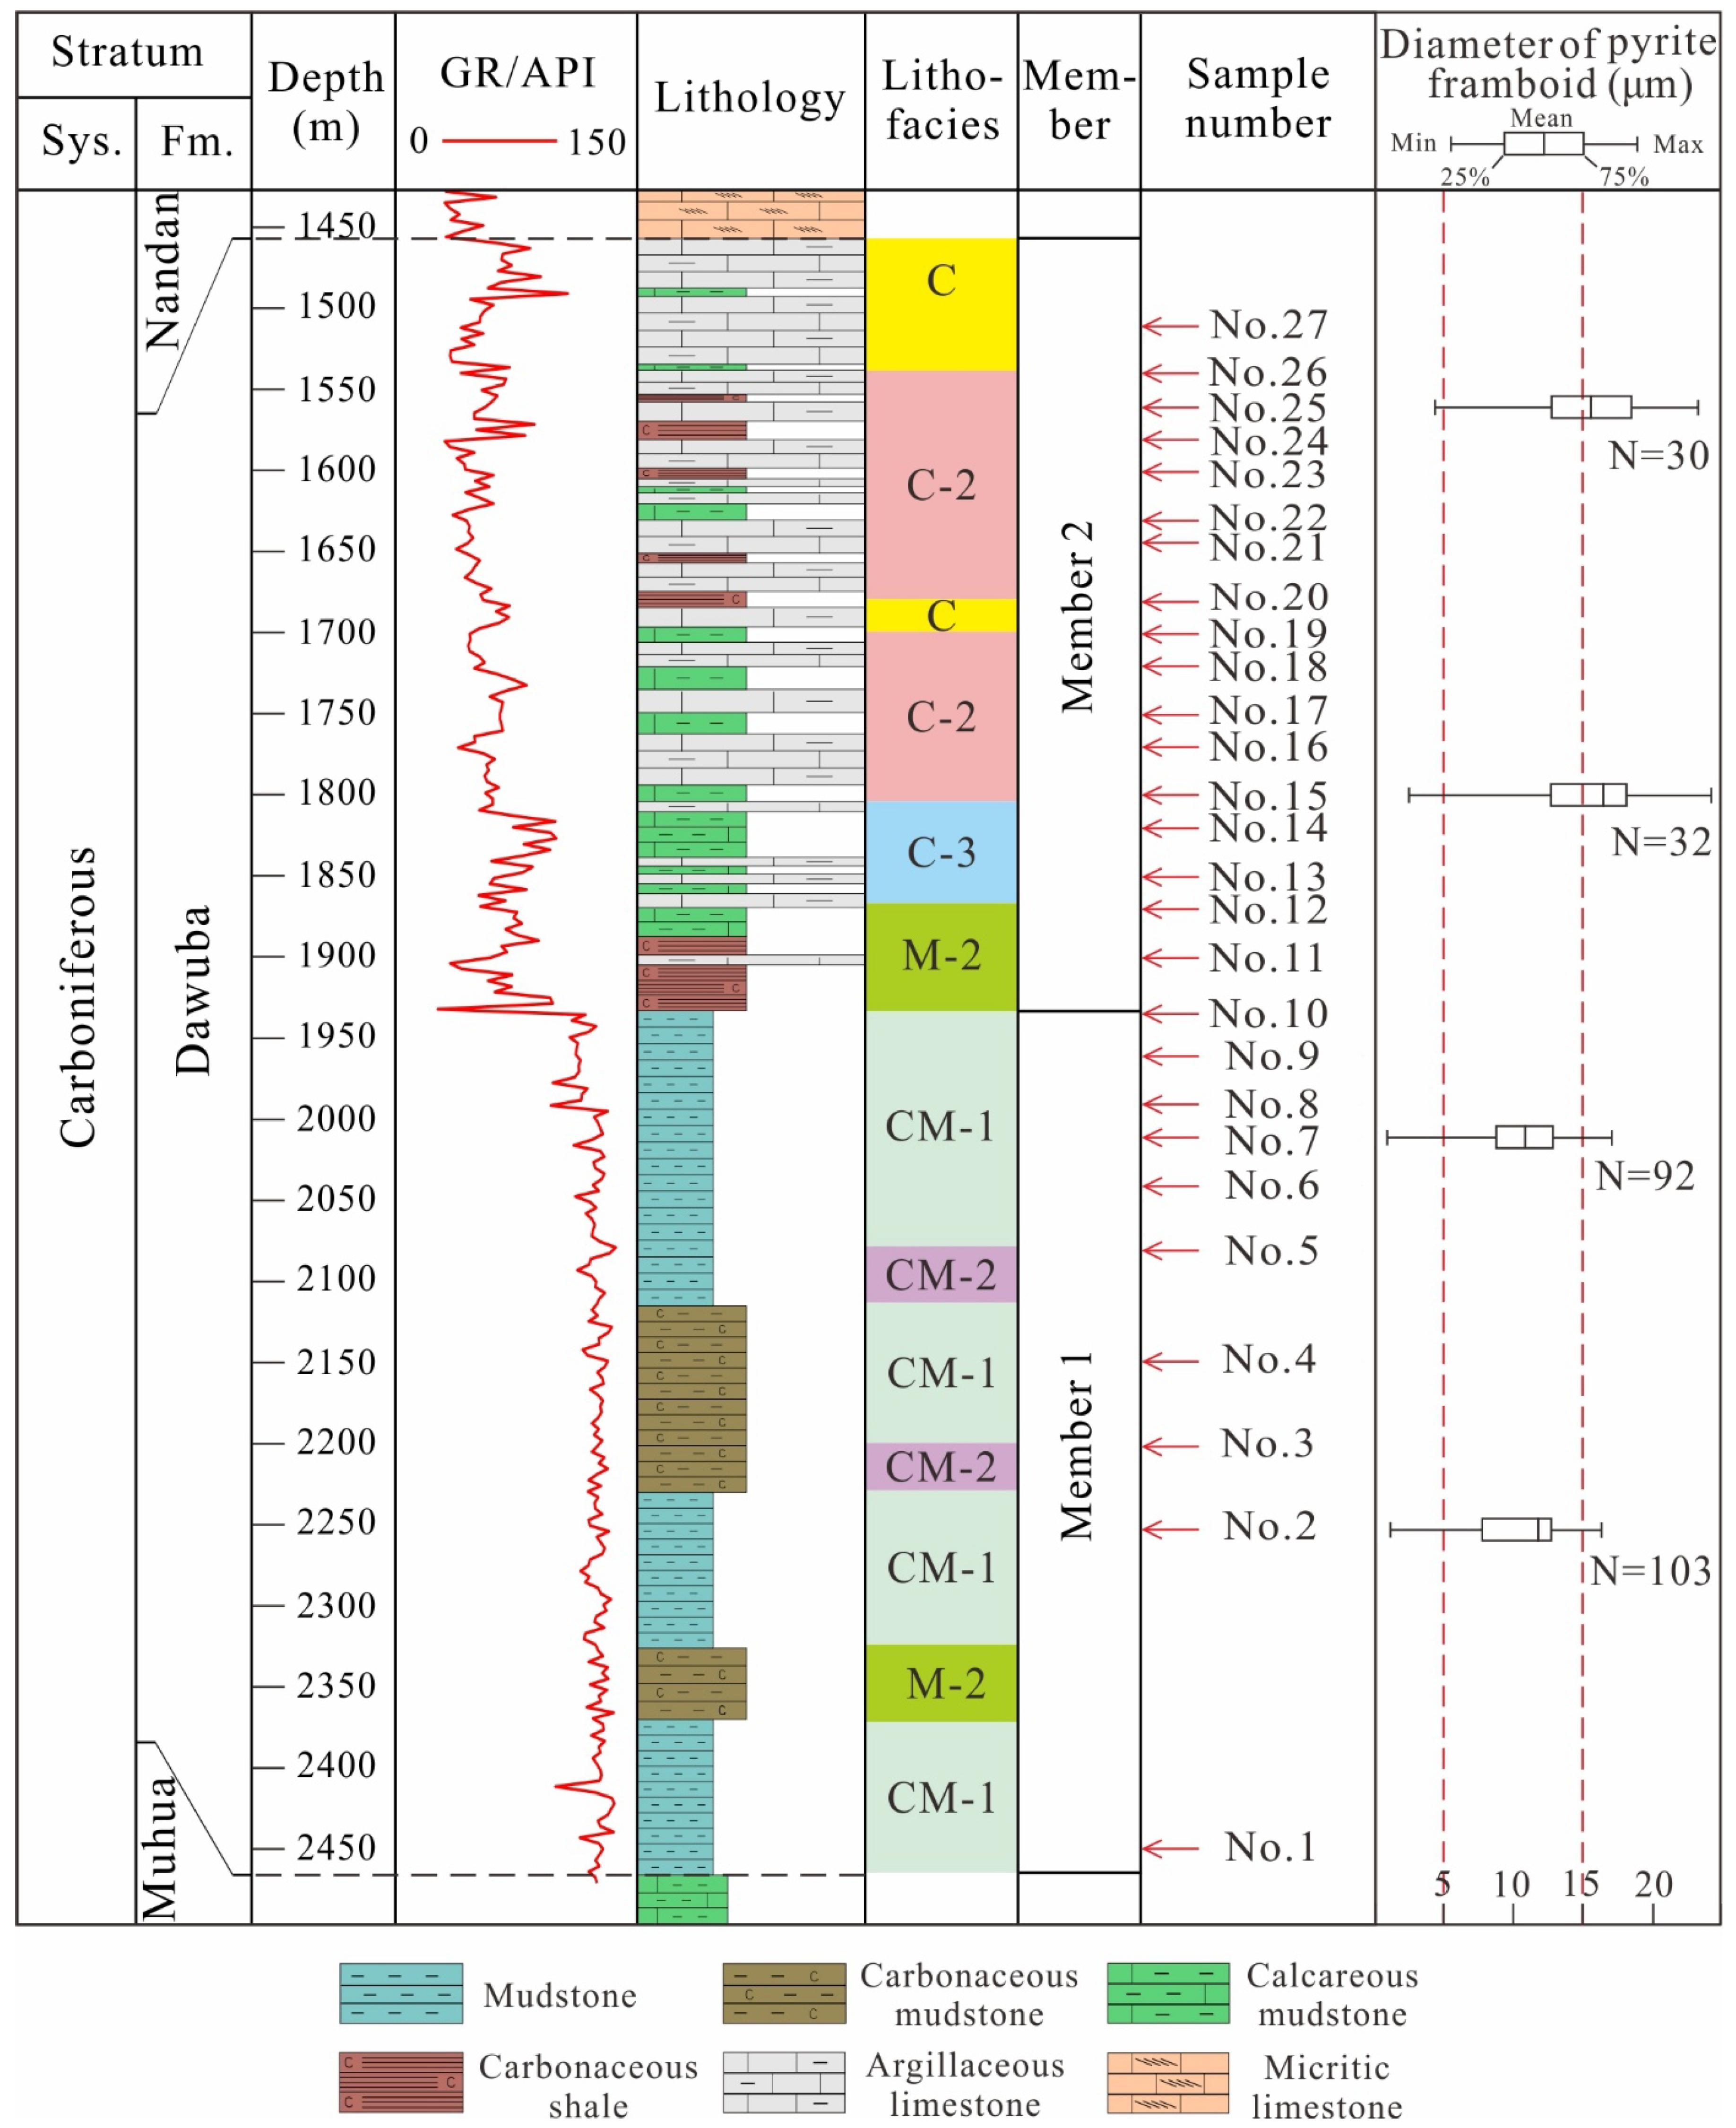
Well SD is situated in Liupanshui City, Guizhou Province (Figure 1b). Within Well SD, the Dawuba Formation is subdivided into two members: the lower member (Member 1: 2466–1933 m) and the upper member (Member 2: 1933–1457 m) (Figure 2). The Member 1 comprises predominantly thick-bedded mudstones and carbonaceous mudstones, resting conformably on the calcareous mudstones of the underlying Muhua Formation. The Member 2 is characterized by argillaceous limestones interbedded with calcareous mudstones and carbonaceous shales; the latter are more abundant in the lower and upper intervals, whereas calcareous mudstones predominate in the middle section. Member 1 exhibits generally higher GR values, whereas Member 2 shows lower GR values (Figure 2). Correspondingly, Member 1 is predominantly composed of argillaceous lithofacies sediments, while Member 2 is characterized by carbonate-rich lithofacies (see Section 4.1 for lithofacies details).

3. Samples and Methods

3.1. Core Samples

To show variations in the sedimentary environment in the study area, a series of core samples at depth ranging from 2466 m to 1457 m were selected from Well SD (Figure 2). The 27 representative samples underwent mineralogical and petrographic analyses through X-ray diffraction (XRD) coupled with integrated petrological examinations using thin-section optical microscopy and field emission-scanning electron microscopy (FE-SEM). Concurrent geochemical investigations were conducted, encompassing organic geochemical parameters (including quantification of total organic carbon (TOC) content and identification of organic matter origins) and inorganic geochemical profiling through major oxide and trace element analyses. Importantly, all core samples were maintained in pristine condition prior to examination, ensuring that the test results accurately reflect the sedimentary conditions of the Dawuba Formation.

3.2. XRD, Thin Section Optical Microscopy and FE-SEM

XRD analysis was conducted using a X’Pert PRO diffractometer on powdered samples (<200 mesh), with duplicate measurements performed in accordance with Chinese Petroleum Industry-Standard SY/T 5163-2018 to ensure analytical precision.
Thin sections were analyzed for mineral assemblages, textural relationships, kerogen features, and microstructures using an Olympus BX53 polarized light microscope.
High-resolution morphological characterization was achieved through FE-SEM using a ZEISS Gemini 500 system (Oberkochen, Germany). Samples underwent precision argon-ion polishing (Gatan 697 cross-section polisher, Pleasanton, CA, USA) prior to multi-point imaging.

3.3. TOC Content

The carbon in the sample was oxidized into CO2 gas using high-temperature heating in an oxygen-rich atmosphere with the Leco CS-230 Carbon Analyzer, LECO Corporation, St. Joseph, MI, USA. The resulting gas was processed and introduced into an absorption cell where specific infrared radiation was absorbed. The detector converted the optical signals into electrical signals, which were subsequently analyzed to determine the organic carbon content.

3.4. Organic Petrography

The petrographic analysis of organic matter focused on characterizing maceral compositions using standardized classification systems: vitrinite [25], liptinite [26], and inertinite [27]. The Dawuba Formation samples were analyzed using a Leica DM4500P polarized fluorescence microscope equipped with transmitted light and oil immersion objectives (×50).

3.5. Major and Trace Elements

The sample was fused with anhydrous lithium tetraborate (Li2B4O7) as the primary flux, using ammonium nitrate (NH4NO3) as an oxidizing agent, along with lithium fluoride (LiF) and trace lithium bromide (LiBr) as auxiliary fluxing agents and mold release agents, maintaining a sample-to-flux mass ratio of 1:8. Fusion was conducted at 1150 °C to 1250 °C in an automatic fusion machine to prepare homogeneous glass beads. Elemental measurements were performed using an X-ray fluorescence spectrometer (XRF), where Compton scattering radiation was applied as an internal standard for matrix effect corrections of Ni, Cu, Sr, and Zr, while theoretical alpha coefficients were utilized to correct absorption-enhancement interferences for other elements. Major and minor components were quantified based on fluorescence intensities. Analyses were conducted at Wuhan SampleSolution Analytical Technology Co., Ltd. following the Chinese National Standard GB/T 14506.28-2010.

3.6. Data Processing

Aluminum (Al) is widely used as a reliable indicator for characterizing detrital clay mineral content in fine-grained sediments [28,29]. Titanium (Ti), due to minimal susceptibility to post-depositional alteration, serves as a reference element for evaluating weathering-leaching intensity and elemental leaching-enrichment degree [30]. Authigenic minerals formed in situ preserve diagnostic signatures of paleo-environment [31]. To eliminate trace element contributions from terrestrial detritus, elemental concentrations are Ti-normalized given Ti’s stability as a terrestrial detrital influx proxy [16]. The enrichment factor (XEF), defined as
XEF = (X/Ti)sample / (X/Ti)PAAS
where XEF is the enrichment factor of the element X, (X/Ti)sample is the ratio of element X to Ti measured in the sample, and (X/Ti)PAAS is the ratio of element X to Ti in the Post-Archean Australian Shale (PAAS) [32]. The larger the value of XEF, the greater the elemental enrichment [33,34].
The degree of pyritization (DOP) is the ratio of iron in pyrite to total active iron [17,19]. Previous studies have shown that the proportion of pyritic iron relative to total iron approximates DOP; thus, DOPT can substitute DOP when estimating pyritic iron content, assuming sulfur occurs as FeS2 [16]. The value of DOPT is calculated by the formula:
DOPT = (55.85/64.16) × S/Fe
where 55.85 and 64.16 are the atomic masses of Fe and S. S represents the measured inorganic sulfur content, while Fe denotes the total iron content in a sample.
In siliciclastic-dominated sedimentary systems devoid of magmatic inputs, the excess barium (Babio) fraction closely approximates the respective biogenic component [35]. The Babio is quantified using the depletion-enrichment model:
Babio = [Basample] − [Tisample × (Ba/Ti)PAAS]
where Basample and Tisample are the measured contents of elements Ba and Ti in the samples, respectively. The value of (Ba/Ti)PAAS is the ratio of Ba/Ti in PAAS.
The genetic typing of kerogen organic matter is quantitatively assessed through the Thermal Index (TI), a petrographic parameter derived from the proportional distribution of maceral assemblages (vitrinite, liptinite, inertinite) [36]. The TI value, a metric utilized in hydrocarbon source rock assessment, is calculated through the following computational method:
T I = a + 100 + b + 50 + c 75 + d ( 100 ) 100
Herein, a, b, c, and d denote the relative contents of sapropelinite, exinite, vitrinite, and inertinite, respectively. TI < 0 corresponds to Type III kerogen, 0 ≤ TI < 40 represents Type II2 kerogen, 40 ≤ TI < 80 designates Type II1 kerogen, and 80 ≤ TI ≤ 100 identifies Type I kerogen.

4. Results

4.1. Mineral Components and Lithofacies

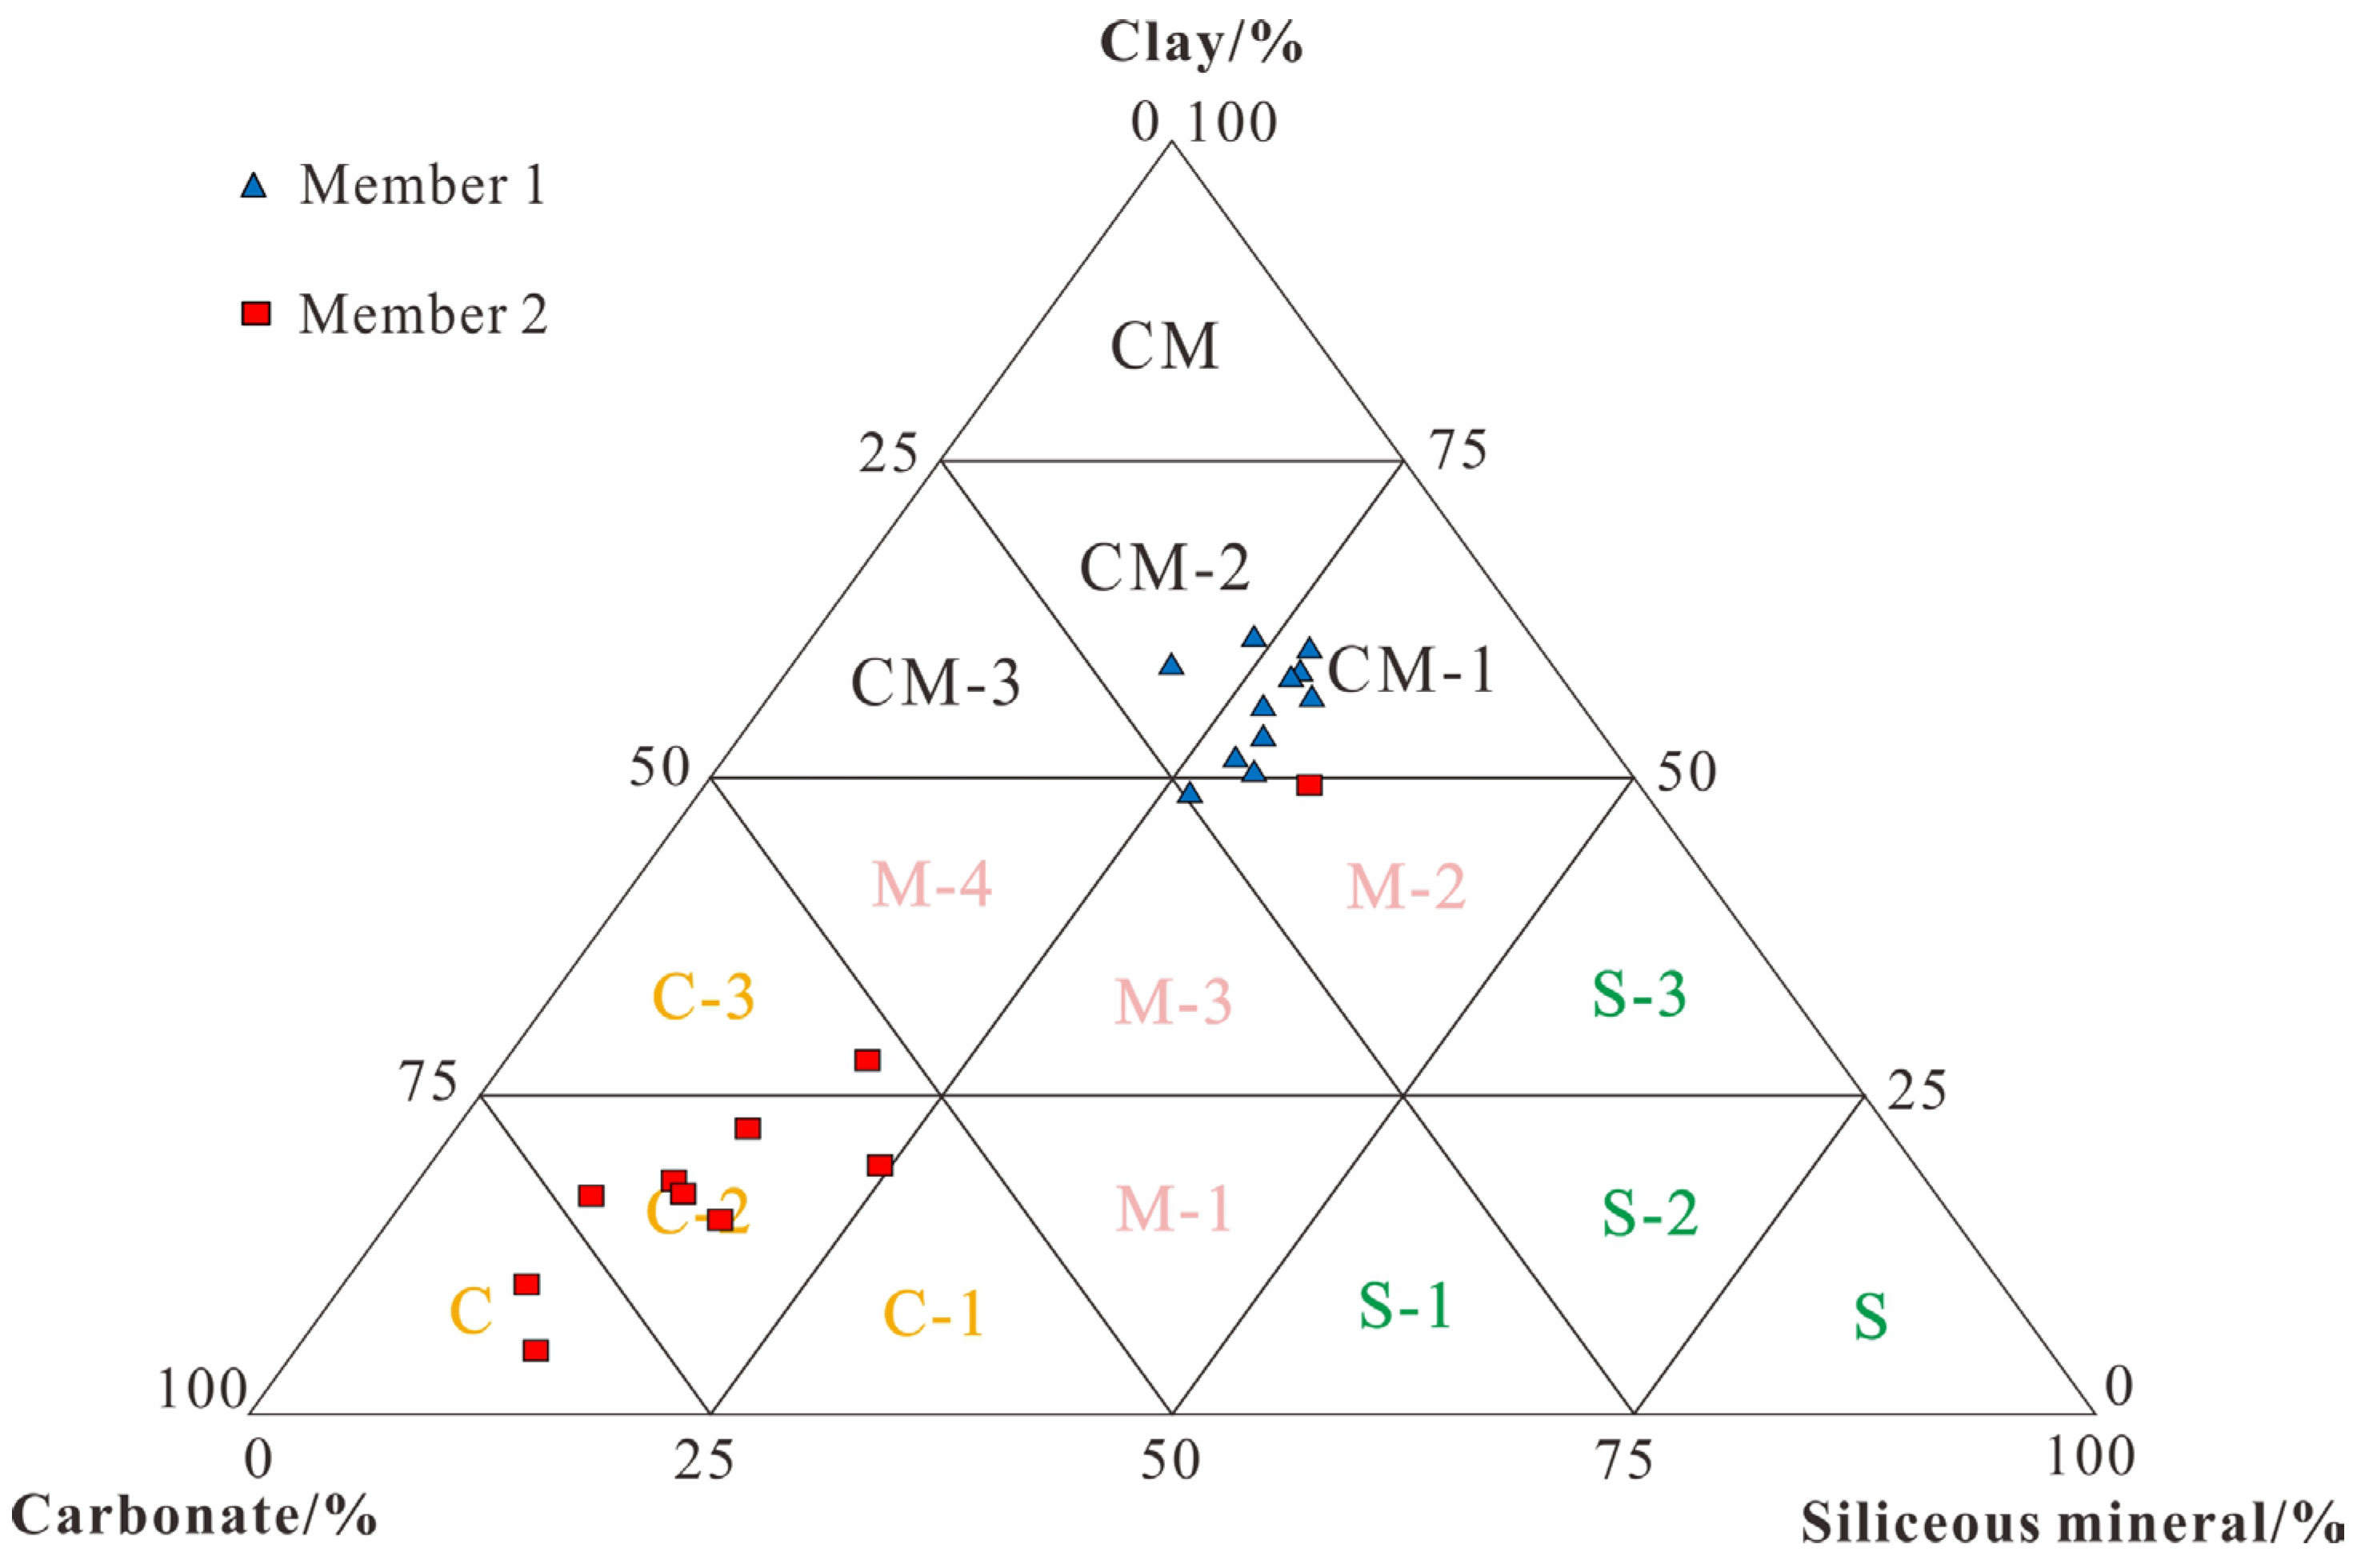
The mineralogical analysis via XRD reveals that the Dawuba Formation consists primarily of carbonate minerals and clay minerals (Table 1). Specifically, pronounced variations in mineral composition are evident across different members (Figure 3). 21 samples from Member 1 and Member 2 reveal that calcite constitutes the principal carbonate mineral, with illite better representing the more abundant and prevalent clay mineral. Member 1 has a high content of clay minerals, ranging from 44.00 wt% to 56.00 wt%, with an average of 51.17 wt%. Carbonate minerals slightly exceed silicate minerals, with the former ranging from 14.40 wt% to 27.00 wt% (average 19.67 wt%) and the latter from 1.00 wt% to 2.00 wt% (average 1.18 wt%). Explicitly, the highest content of calcite is 18.00 wt%, with an average of 12.36 wt%, while the content of dolomite ranges from 5.00 wt% to 14.40 wt%, with an average of 7.30 wt%. In Member 2, the content of carbonate minerals (average 19.30 wt%) is significantly higher than that of clay minerals (average 63.00 wt%), with calcite content ranging from 14.00 wt% to 74.00 wt% (average 46.20 wt%) and dolomite content ranging from 6.00 wt% to 33.00 wt% (average 16.80 wt%). Compared to Member 1 (average 2.00 wt%), Member 2 (average 2.17 wt%) has a relatively lower content of pyrite.
A ternary diagram plotting silicate minerals, carbonate minerals, and clay minerals is shown in Figure 3. The samples are classified into three lithofacies groups and six lithofacies, including calcareous shale lithofacies (C), mixed calcareous shale lithofacies (C-2), clay-rich calcareous shale lithofacies (C-3), argillaceous/siliceous mixed shale lithofacies (M-2), silica-rich argillaceous shale lithofacies (CM-1), and mixed argillaceous shale lithofacies (CM-2) [37] (Figure 3). Member 1 reveals that the majority of samples belong to argillaceous shale lithofacies, including CM-1 and CM-2 (Figure 2). In addition, carbonaceous mudstones are also observed. Member 2 is predominantly composed of carbonate-rich sediments (C, C-2 and C-3), with the exception of argillaceous/siliceous mixed shale lithofacies in the basal interval.

4.2. Total Organic Carbon Content

The total organic carbon (TOC) content of samples from the two members displayed a statistically significant variation (Figure 4). This is reported just below, the TOC content of 10 samples from Member 1 ranges from 0.73% to 1.63%, with an average of 1.15%. The TOC content of 17 samples in Member 2 ranges from 0.43% to 1.90%, with an average of 0.88%, and peak values are primarily distributed in the lower section. TOC content of the Dawuba Formation shows a general decreasing trend from Member 1 to Member 2 (Figure 4).

4.3. Petrographic Characteristics

In Member 1, mudstone lithotypes prevail, made up of sparse carbonate minerals surrounded by abundant clay minerals, as visible in the sample at 1930 m (Figure 5a). Figure 5b–d show that argillaceous limestone contains a large amount of carbonate minerals and a small amount of clay minerals. Carbonate grains in the Dawuba Formation occur as poorly defined particles or aggregates (Figure 5a), whereas those in Member 2 appear better defined and lithified and suggest both a detrital and intrabasinal origin [38] (Figure 5b-d). Additionally, bioclastic debris is commonly found in Member 2 of the Dawuba Formation (Figure 5b–d).

4.4. Organic Matter Petrography

Whole-rock analyses indicate that the organic matter within the Dawuba Formation primarily consists of sapropelinite (Figure 6a,b,d), exinite (Figure 6c), and vitrinite (Figure 6b–d). Sapropelinite originates from algal material undergoing sapropelic transformation [25]. At the overmature stage, residual algal structures remain visible without fluorescent properties. Importantly, the high thermal maturity of the studied samples complicates the identification of oil-prone macerals such as sapropelinite in whole-rock sections (Figure 6a,b,d). Exinite typically derives from reproductive organs of higher plants [25] and appears grayish-white under white reflected light in Dawuba Formation samples (Figure 6c). Vitrinite is formed from botanical tissues rich in lignin and/or carbohydrates [25], with overmature vitrinite exhibiting gray coloration and high relief under oil-immersed reflected light (Figure 6b–d).
Table 2. Kerogen maceral analysis results (%) of each sample in the Dawuba Formation.
Depth/mMemberSapropeliniteExiniteVitriniteTIKerogen Type
1755.00 2 45.00 0.00 55.00 3.75 II2
1782.50 2 55.00 7.00 38.00 30.00 II2
2062.00 1 70.00 0.00 30.00 47.50 II1
2280.00 1 75.00 0.00 25.00 56.25 II1

4.5. Petrographic Features of Pyrite

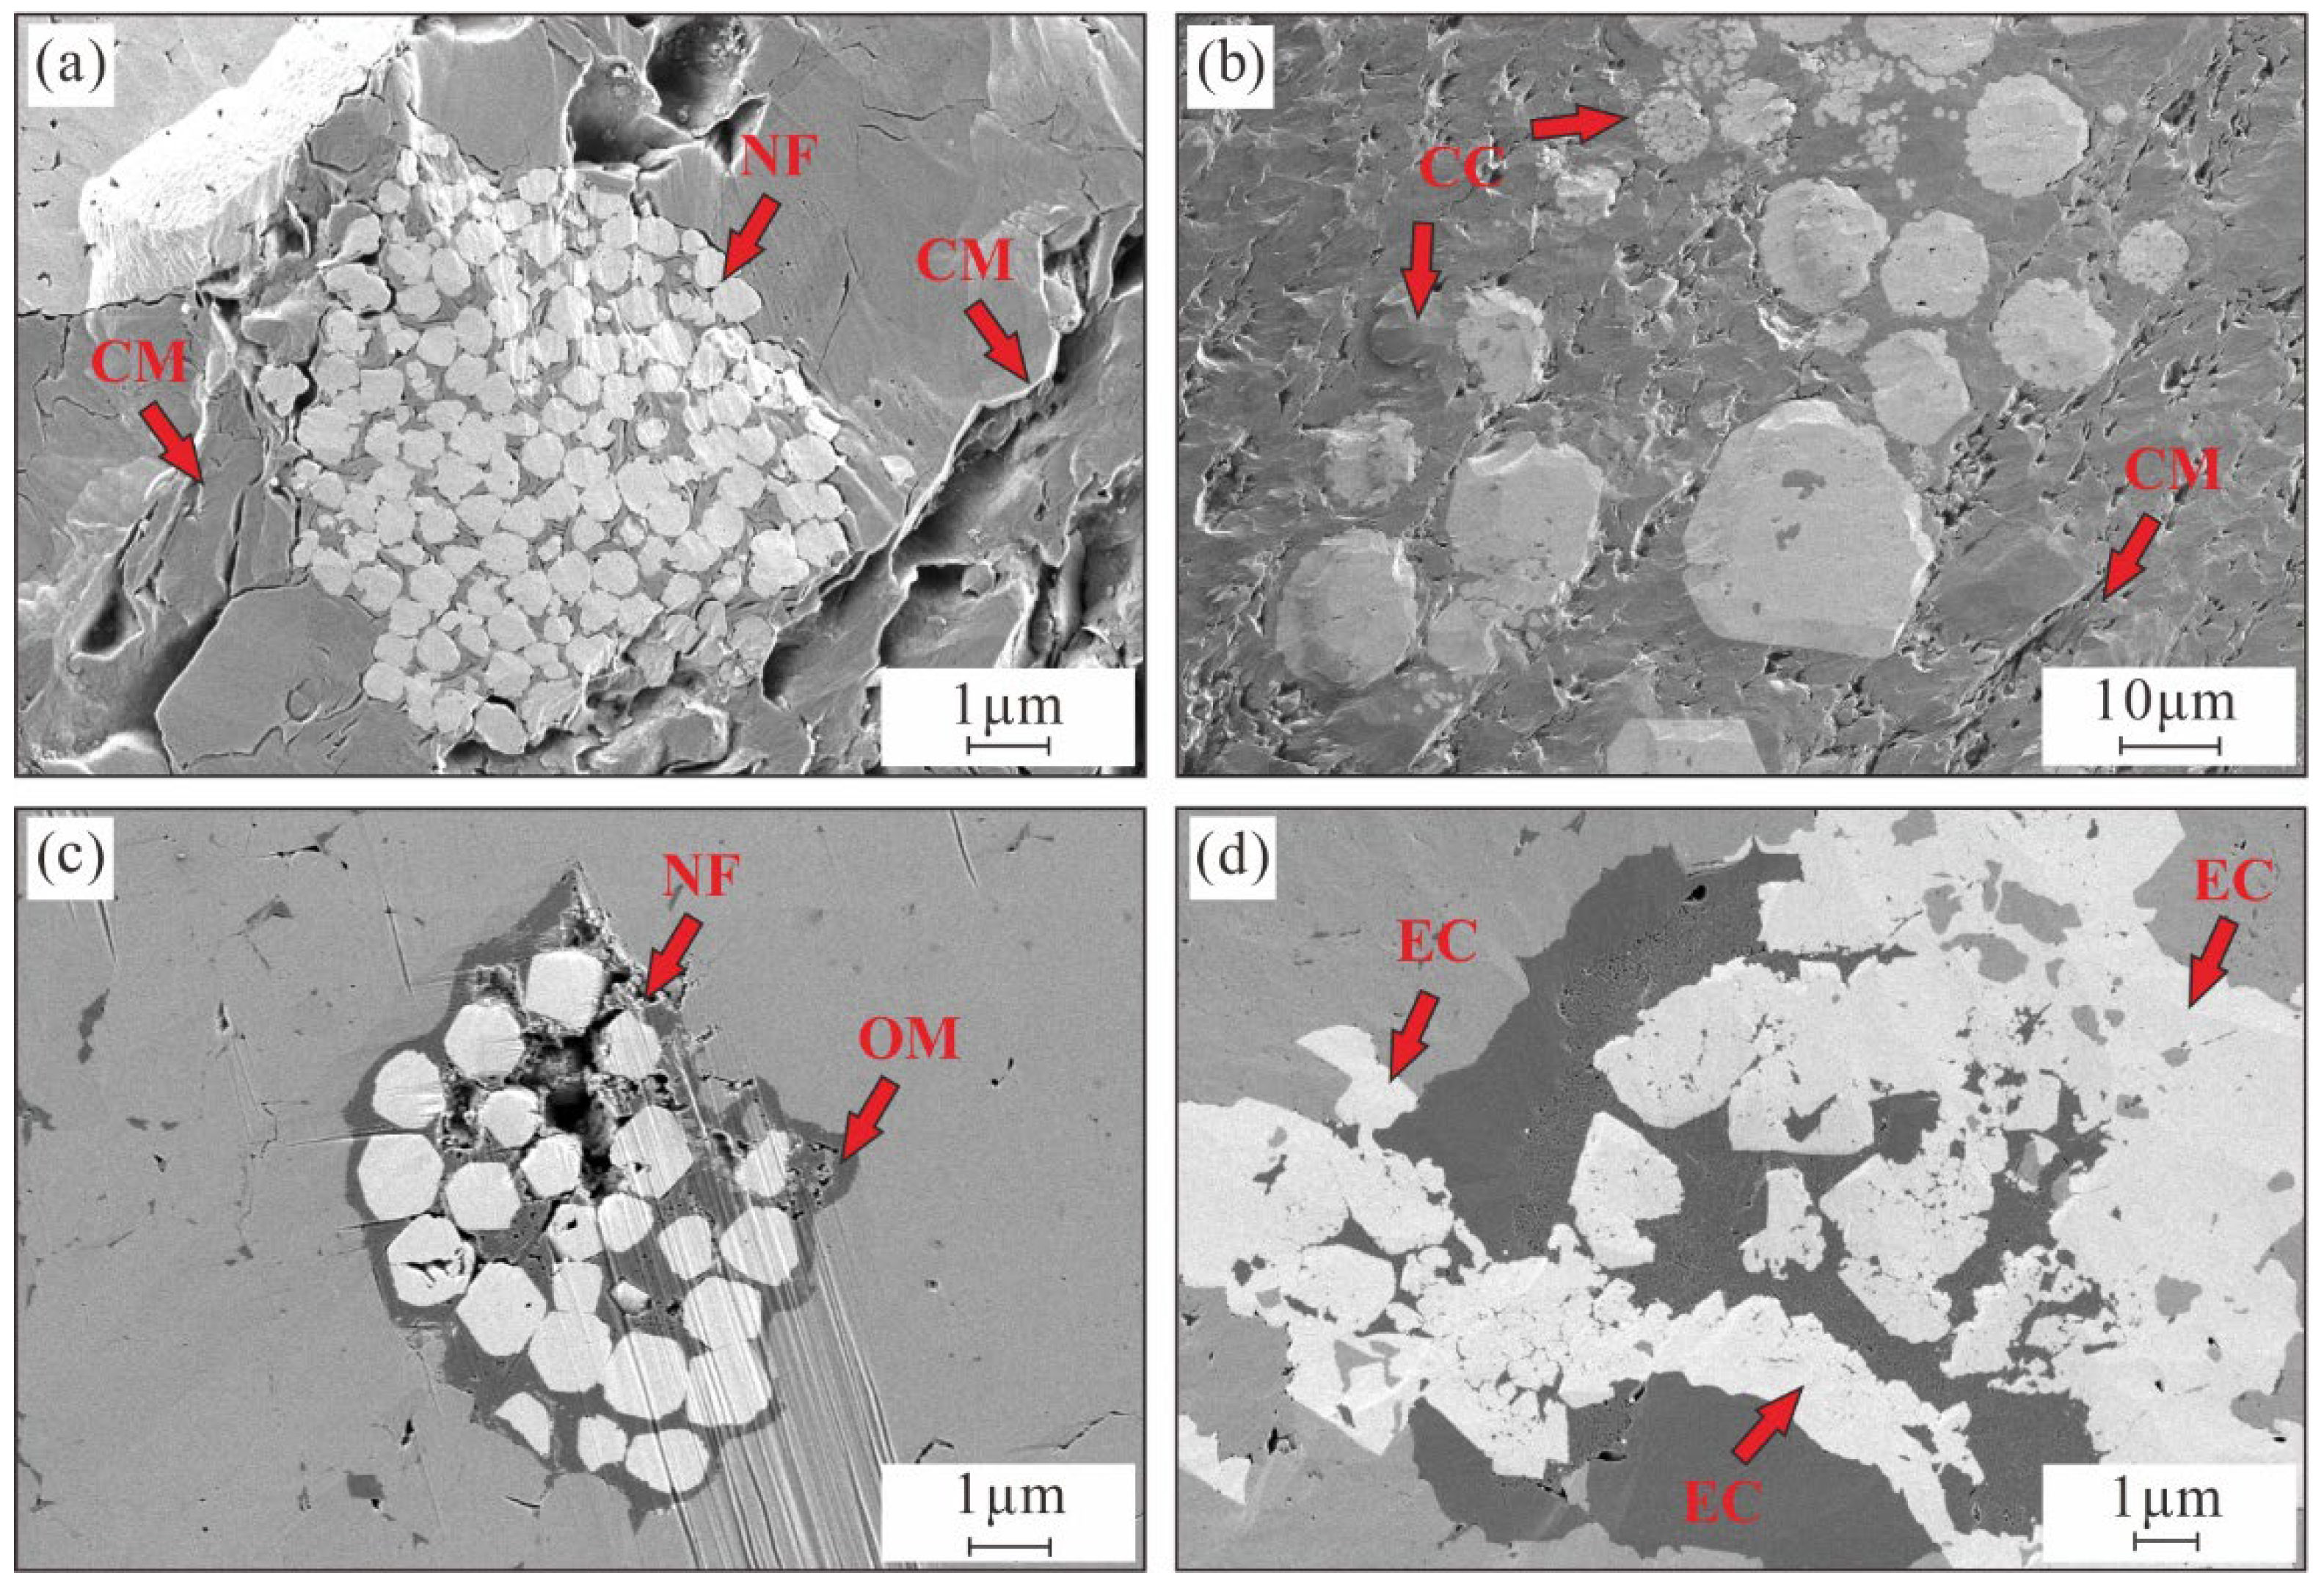
Based on SEM and polished section observations, pyrite framboids are well-developed in Member 1 (Figure 7a,b) and are almost absent in Member 2 (Figure 7c,d). There are various pyrite morphologies in the Dawuba Formation, including normal framboids (Figure 7a,c), clustered crystals (Figure 7b), and euhedral crystals (Figure 7d).
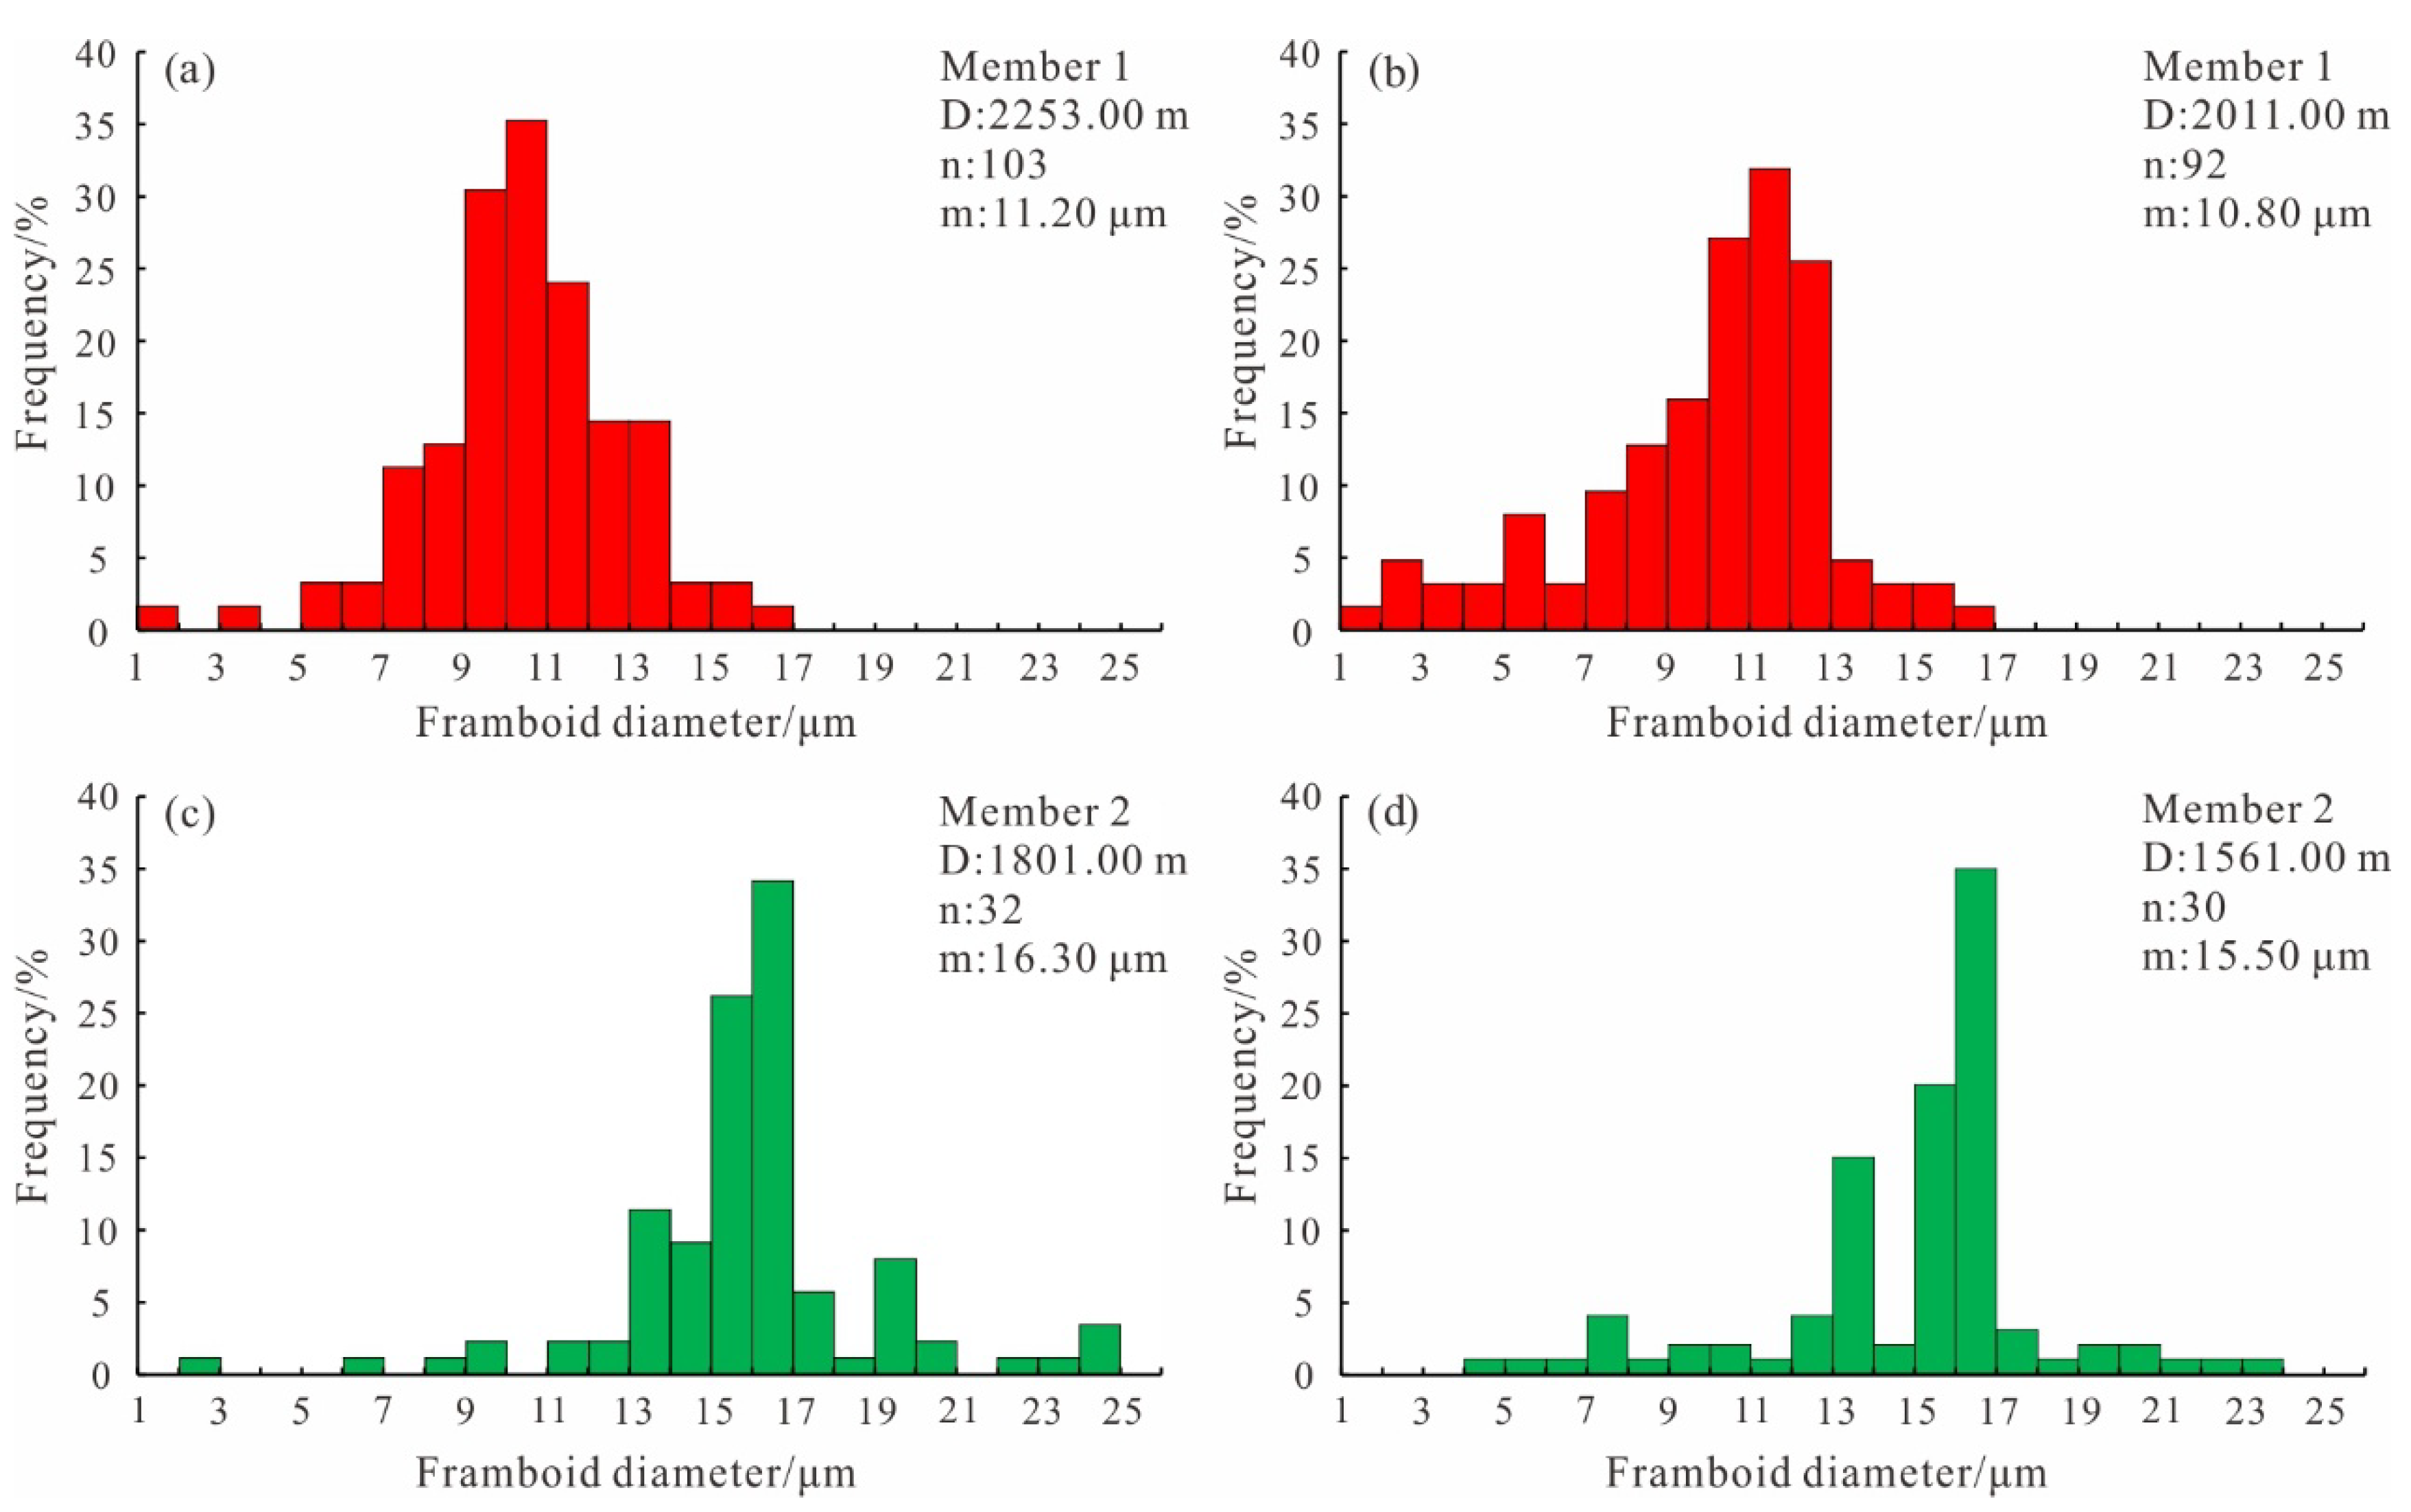
In Member 1, clay minerals and pyrite coexist (Figure 7a,b). Framboids show significant variations in diameter (Figure 7a), ranging from 1.00 μm to 17.00 μm and averaging between 10.80 μm and 11.20 μm (Figure 2 and Figure 8a,b). In Member 2, pyrite framboids are predominantly euhedral crystals characterized by contiguous sheet-like distribution (Figure 7d), with a minor fraction of normal framboids (Figure 7c) exhibiting dimensions ranging from 2.00 μm to 25.00 μm and a mean size spanning 15.50 μm–16.30 μm (Figure 2 and Figure 8c,d).

4.6. Elemental Geochemistry

4.6.1. Major Elements

The major elements, expressed as oxides, are listed in Table 3. In Member 1, the contents of SiO2 are relatively high, with small variation from bottom to top and an average of 48.05 wt%. At the same time, the content of Al2O3 (average 18.86 wt%) also shows such a trend of change. The contents of Fe2O3 (average 9.10 wt%), CaO (average 8.93 wt%), and MgO (average 2.03 wt%) all show a trend of slight fluctuation, and their contents are generally low. Compared with Member 1, the contents of SiO2 in Member 2 are much lower (average 27.82 wt%). From bottom to top, the contents of SiO2 and Al2O3 both show a gradually decreasing trend. Compared with Member 1, the CaO content in Member 2 shows a significant excess (16.52 wt%–42.77 wt%, average 31.08 wt%), while the contents of Fe2O3 (average 2.70 wt%) and MgO (average 2.01 wt%) compounds are generally low.

4.6.2. Trace Elements

Relative to trace element concentrations in Dawuba Formation sediments, V, Ni, Zn, and Ba are enriched in Member 1 and depleted in Member 2 (Table 4). In Member 1, samples show relatively high values of V/Cr (average 1.13), Babio (average 1803.42 ppm), P/Al (average 68.49), and Co/Ti (average 52.84 × 10⁻⁴). In Member 2, the average values of Si/Ti (average 60.67) and Si/Al (average 3.21) remain generally below the average values of the Dawuba Formation samples.

5. Discussion

5.1. Terrestrial Detrital Influx

Organic matter enrichment is regulated by a multiplicity of environmental and geological factors [39]. Among these, the influx of terrestrial detrital materials emerges as a critical modulator, exerting dual, often opposing effects: it may directly attenuate organic matter enrichment by diluting its concentration, or conversely function as an adsorbent to promote organic matter accumulation and enhance the settling rate of organic particles [16,40].
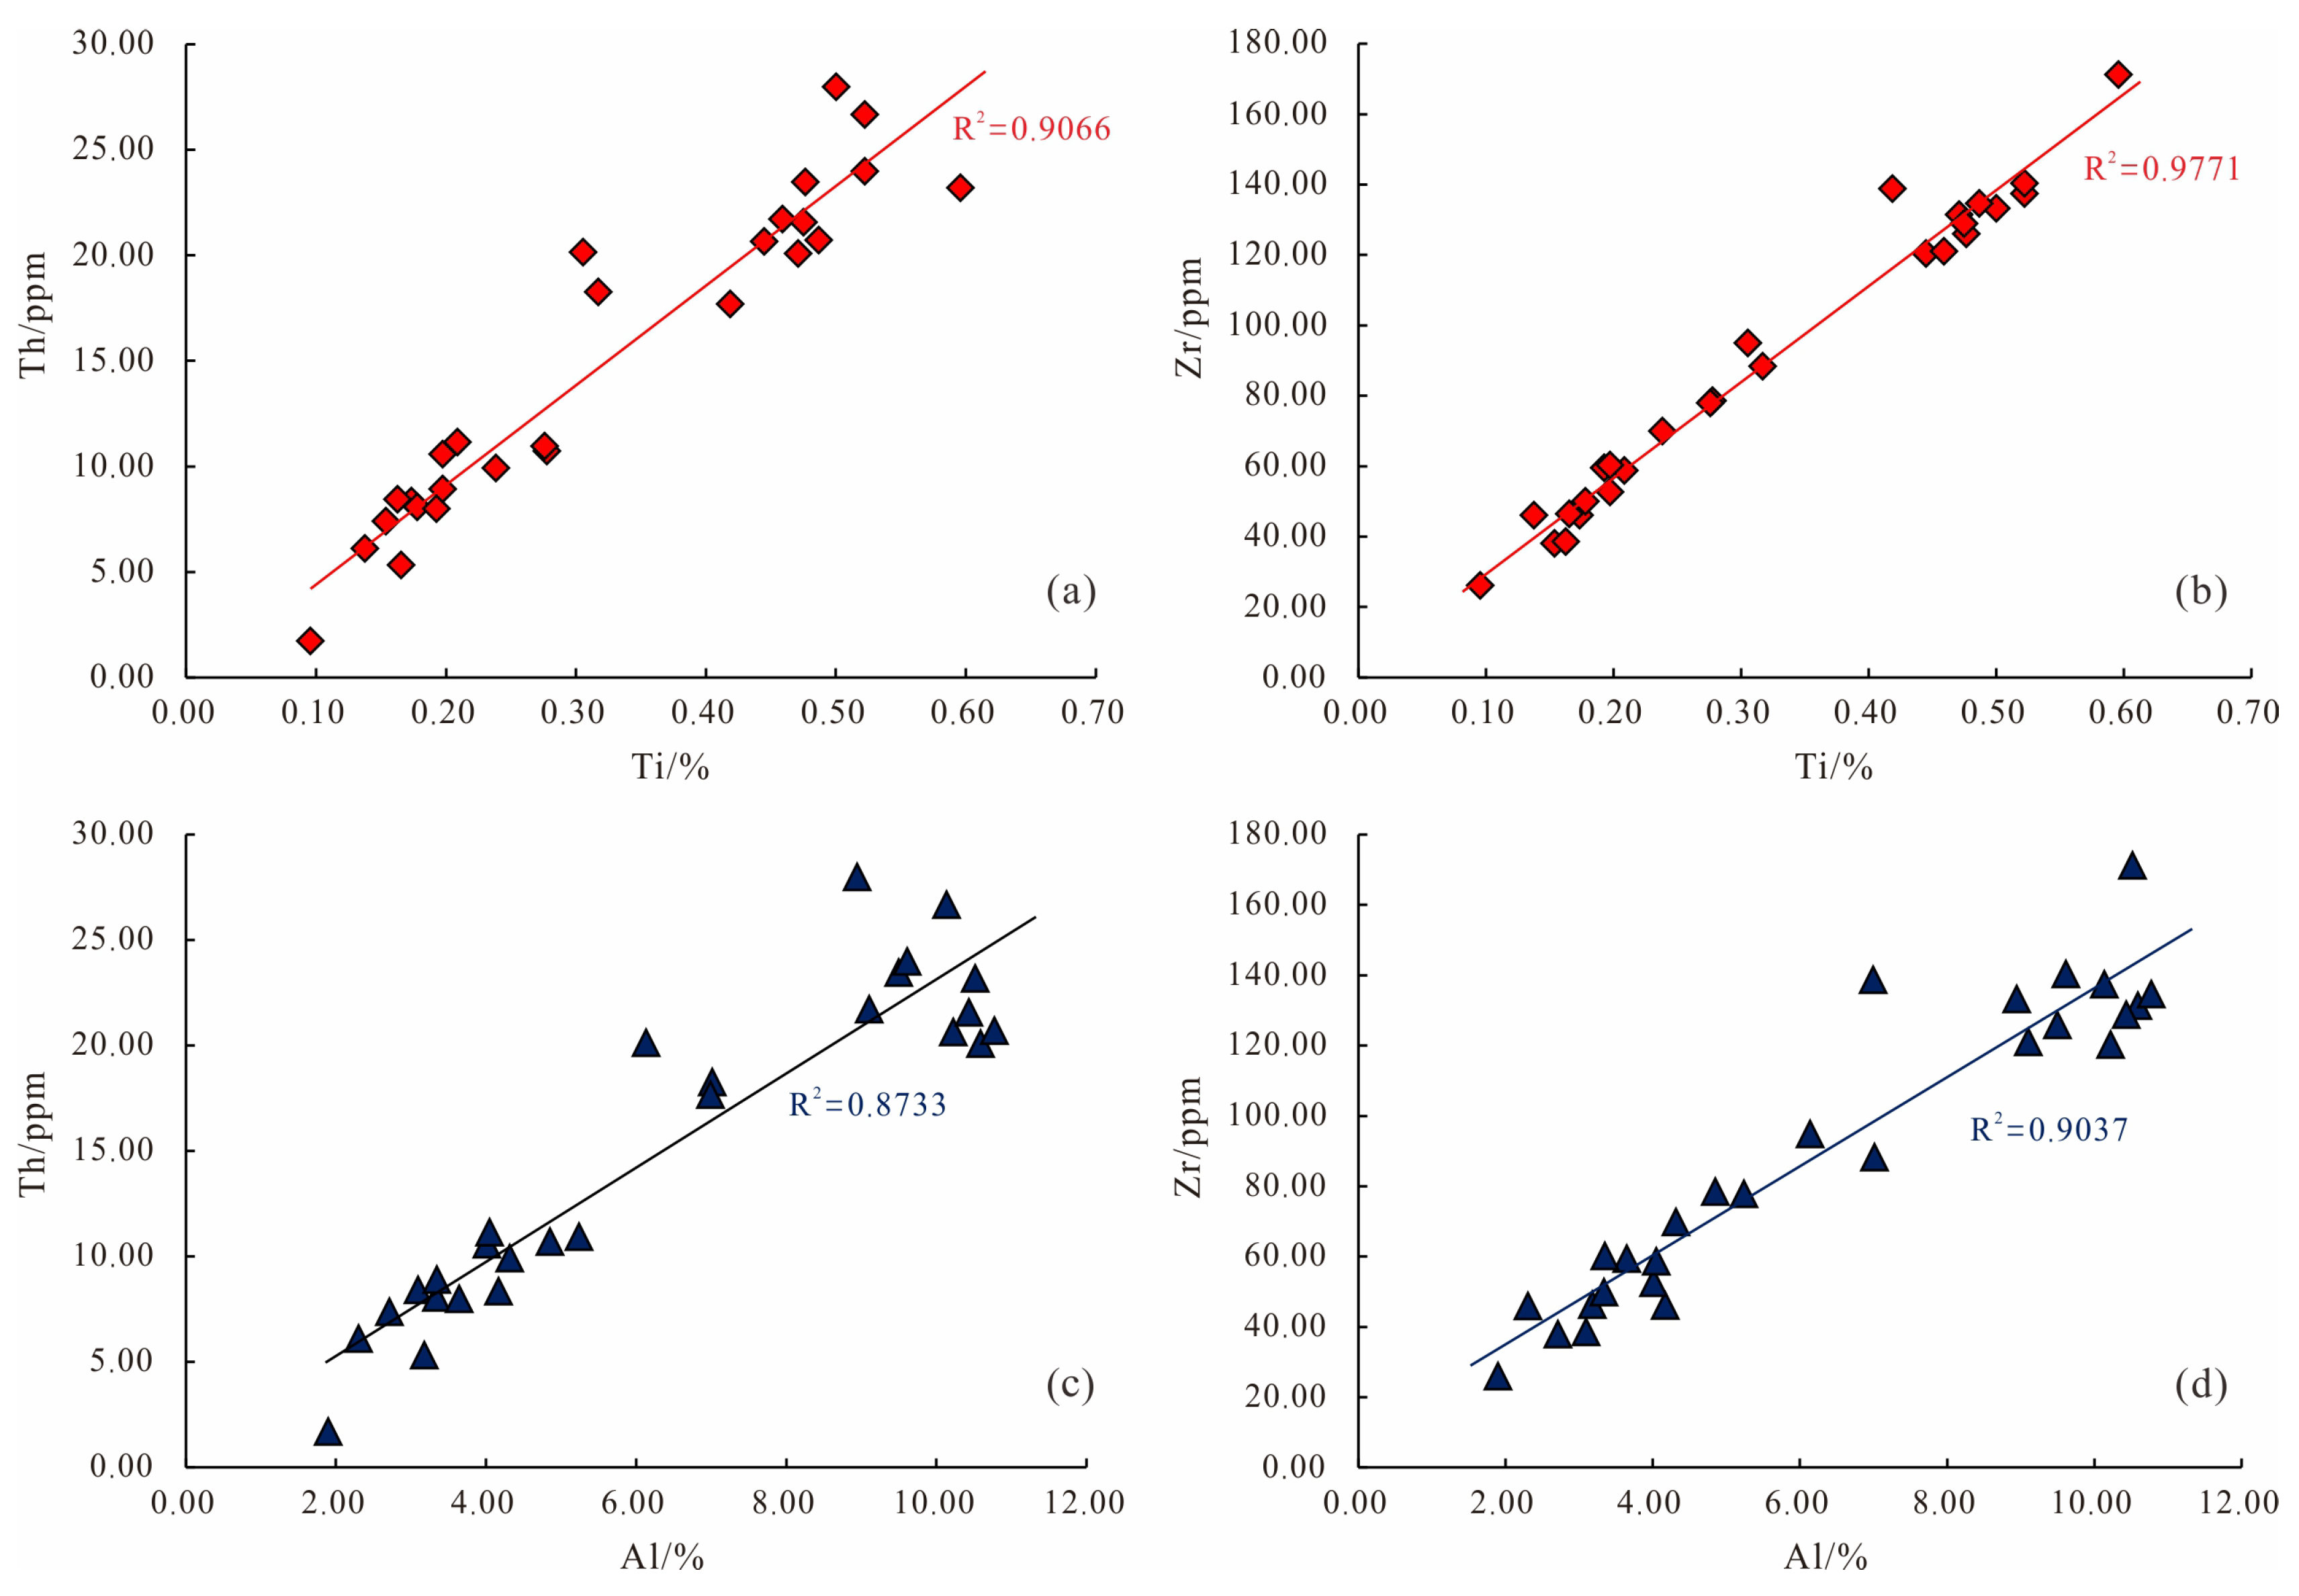
Terrestrial detrital influx is commonly quantified using Ti, Th, and Al elemental concentrations in terrigenous detritus as established proxies [41]. The correlation diagrams demonstrate statistically significant positive relationships between Ti and Th, as well as Ti and Zr, characterized by substantially higher R2 values of 0.9066 and 0.9771 (Figure 9a,b). Furthermore, a strong positive correlation is also observed between Al and Th (R2 = 0.8733), as well as between Al and Zr (R2 = 0.9037) (Figure 9c,d). Taken together, these observations indicate that Ti, Al, Th, and Zr serve as more robust proxies for reflecting terrestrial detrital input, among which Ti and Al are particularly suitable for elemental normalization purposes [42].
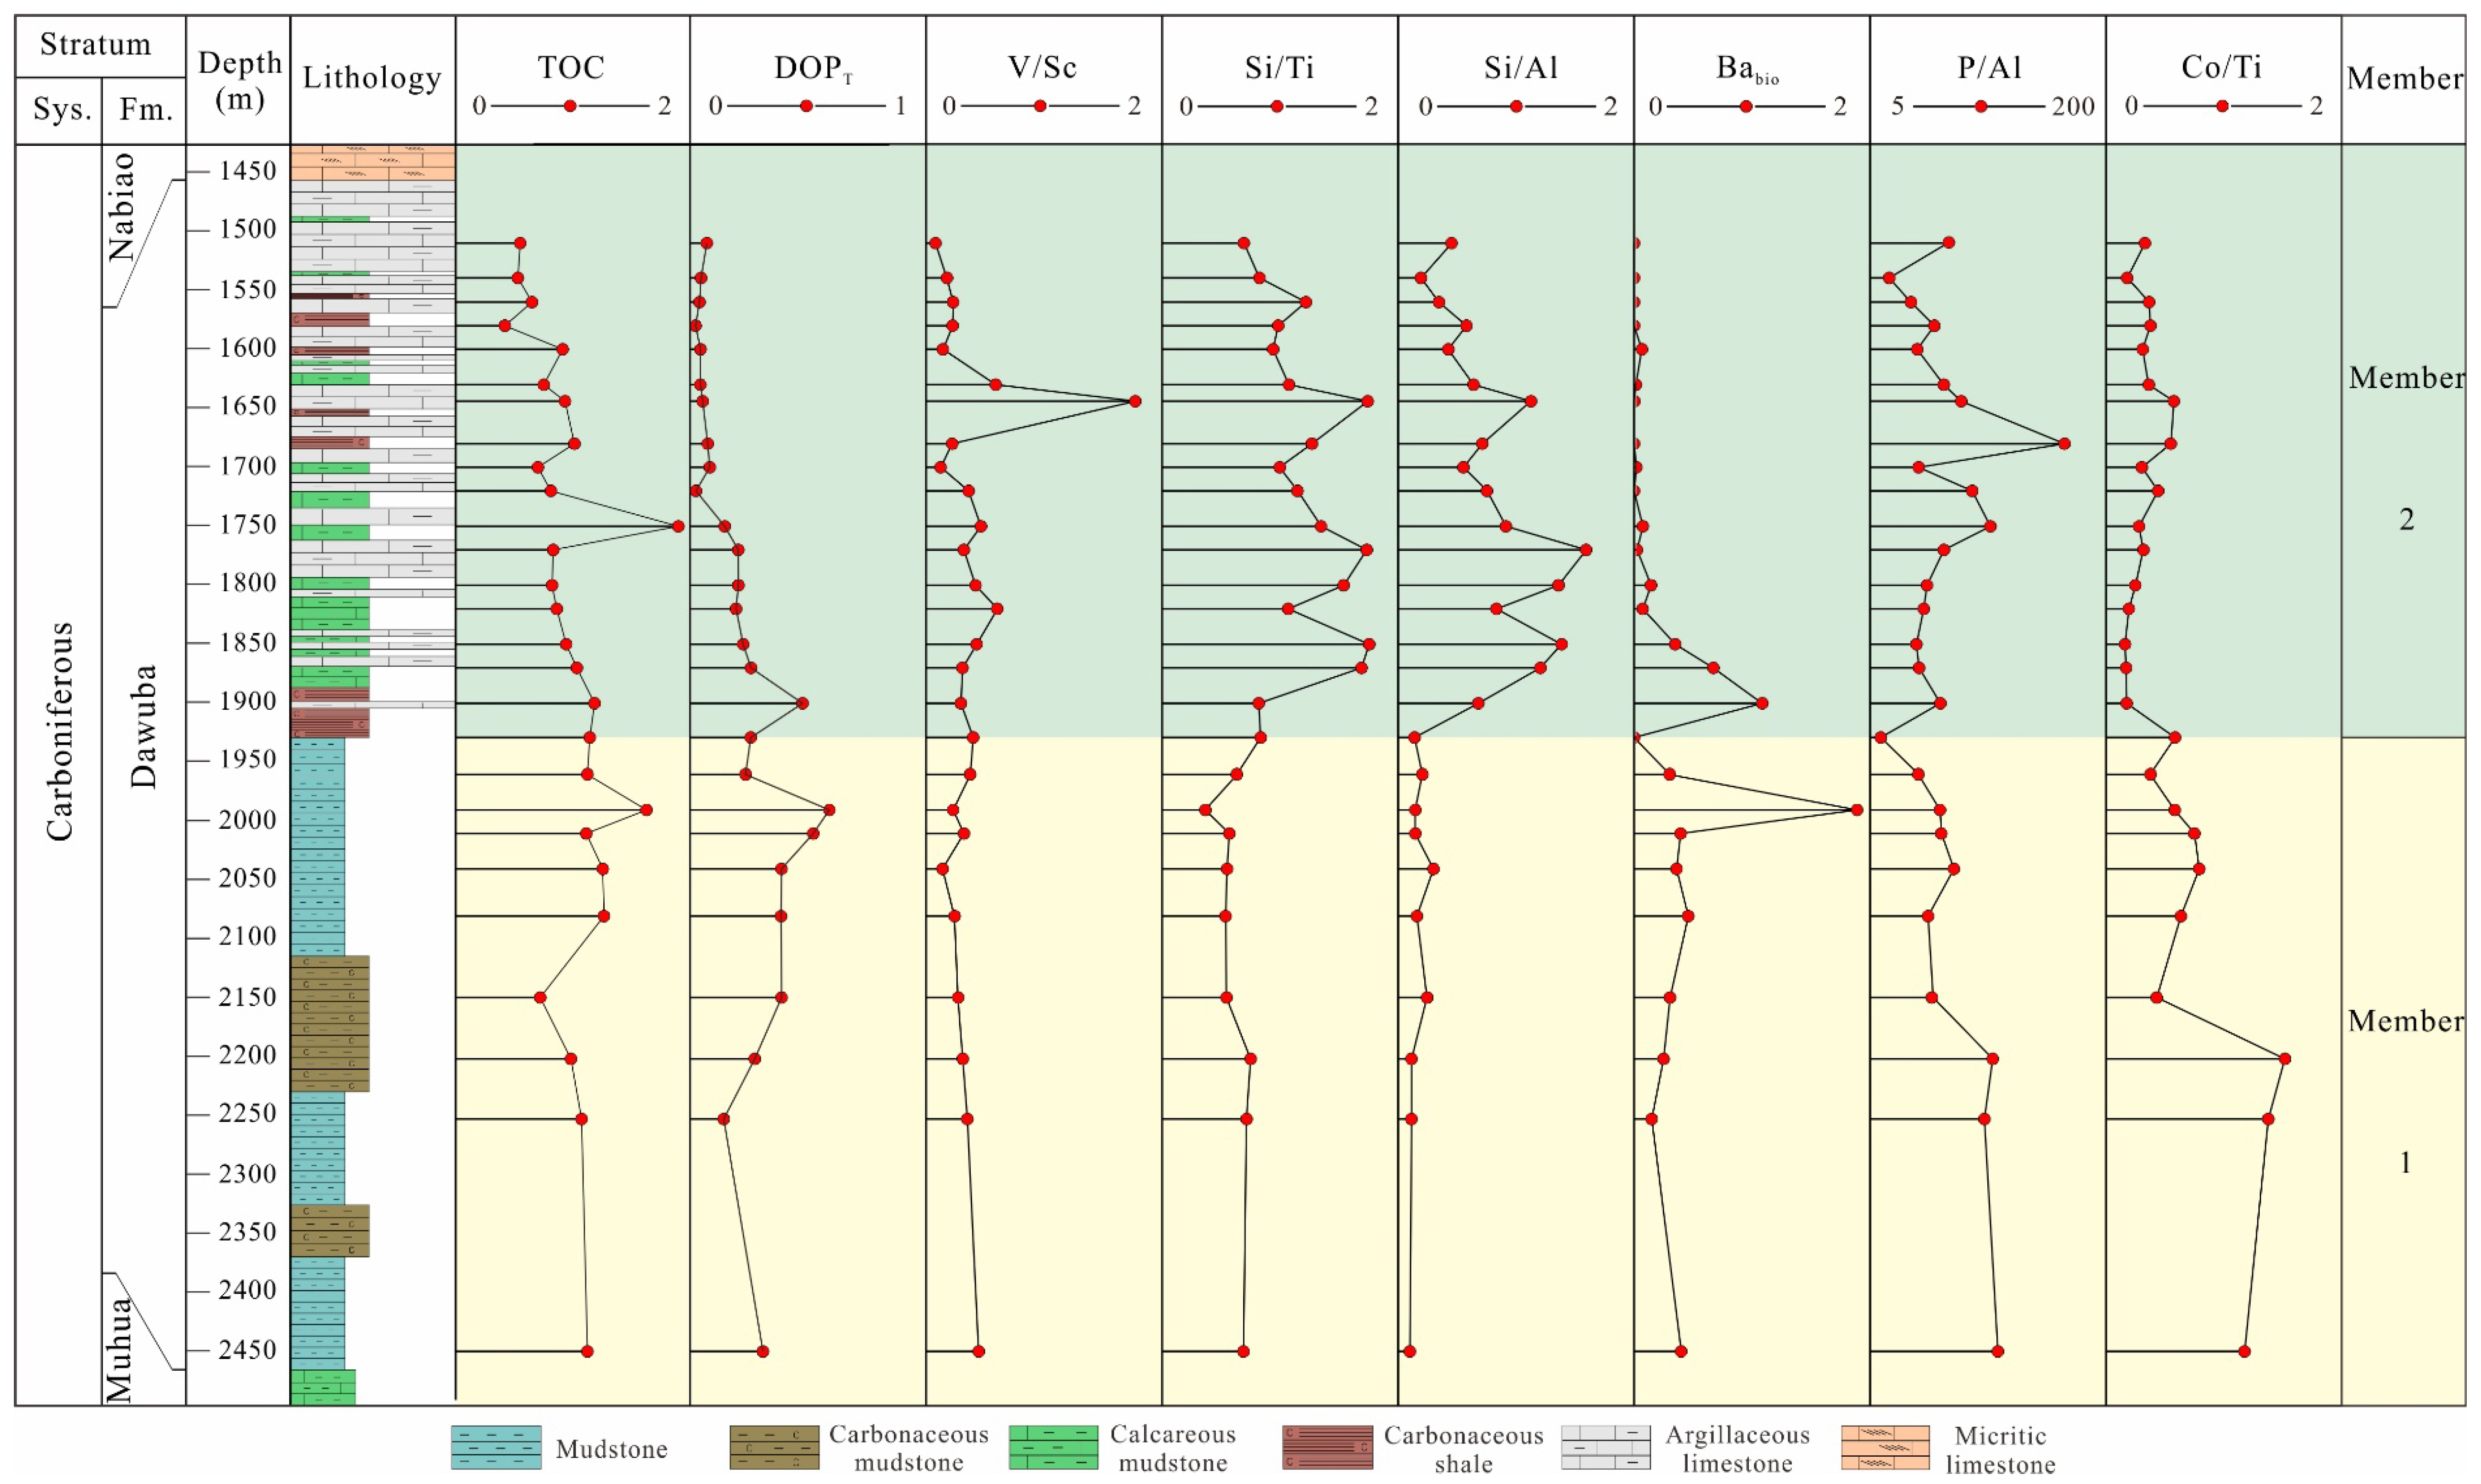
As illustrated in Figure 4, significant changes in the indices of terrestrial detrital influx (Si/Ti and Si/Al) are observed across all samples of the Dawuba Formation. The Si/Ti value of Member 1 was significantly lower than that of Member 2, and the Si/Al value of Member 1 was also generally lower than that of Member 2 (Table 5). These observations indicate that the terrestrial detrital flux of Member 1 is statistically significantly lower than that of Member 2.

5.2. Evolution of Paleoredox Condition

The growth kinetics and morphological characteristics of framboidal pyrite are inherently governed by the redox chemistry of the ambient marine environment, with distinct patterns observed in oxic versus sulfidic settings [43,44]. In oxic water columns, framboidal pyrite formation is geochemically constrained to sulfidic microenvironments within sedimentary pore waters, as the oxidized water column itself lacks the reducing conditions required for pyrite nucleation [45,46]. Under such conditions, the limited supply of bioavailable Fe2+ and S2− (or polysulfides) restricts the rate of microcrystal aggregation, resulting in framboids with heterogeneous size distributions and larger individual microcrystal diameters [47,48]. Conversely, in sulfidic seawater (euxinic or dysoxic-sulfidic systems), elevated concentrations of dissolved Fe and reduced sulfur species (e.g., H2S, HS) accelerate the nucleation and aggregation of pyrite microcrystals, promoting rapid formation of framboidal aggregates [49,50].
In the Dawuba Formation, the size characteristics of pyrite can reflect the redox conditions of water bodies during the deposition. Member 1 exhibits notable pyrite occurrence with distinct morphological development (Figure 7a), whereas Member 2 is characterized by minimal pyrite formation, limited morphological expression (Figure 7c), and the occurrence of euhedral crystals (Figure 7d). Most notably, pyrite grains in Member 1 exhibit a generally smaller diameter of framboidal pyrites compared to those in Member 2 (Figure 8a–d). Previous studies have established that the average diameter of framboidal pyrites exhibits a systematic correlation with the paleoredox conditions of the depositional environment, serving as a robust geochemical proxy for reconstructing ancient redox states [16,43]. Thus, the water column during Member 1 deposition exhibited a more strongly reducing environment than that during Member 2 deposition.
Framboidal pyrites exhibit significant variations in both abundance and grain size among different stratigraphic members (Figure 7 and Figure 8). Framboidal pyrites in the first member are predominantly smaller than 12.00 μm in diameter, with some under 5.00 μm (Figure 8a,b). In contrast, those in the second member are less abundant but generally larger, often exceeding 15.00 μm (Figure 8c,d). Previous studies have demonstrated that the average diameter of framboidal pyrites is linked to paleoredox conditions, with the water column in Member 1 being more reducing compared to Member 2.
No proxy is universally reliable, and all redox analyses should be on a formation-specific basis [51,52]. All elemental proxies are linked to a specific sediment fraction [53]. Previous studies have demonstrated that the morphological development of framboidal pyrite indicates the redox level [48,49,50]. Thus, the contents of Fe and S elements can, to some extent, indicate the initial water column redox level of sediments in the Dawuba Formation. Prior research has also demonstrated that DOPT values serve as an indicator of paleoredox conditions [16]. The DOPT values of the Dawuba Formation samples range from 0.02 to 0.67 with a mean value of 0.22, indicating a dysoxic-to-oxic environment (Figure 4). The values of DOPT in Member 1 (mean 0.36) are generally higher than 0.14, indicating a gradual oxidation process of the water column from Member 1 to Member 2.
Previous studies have demonstrated that multiple proxies are essential for reconstructing paleoredox conditions [39,41,44]. Redox-sensitive trace elements (e.g., V and Sc) have been extensively utilized to identify such conditions [33,54]. Under reducing conditions, trace element V exhibits sedimentary enrichment [55]. V/Sc ratio in the range of <9.00, 9.00–30.00, and >30.00 reflects oxic condition, dysoxic condition, and anoxic condition, respectively [16]. In Member 1, the marine redox state, as indicated by the V/Sc ratios (Table 5), exhibits a downward trend, reflecting a progressive transformation of the water column from dysoxic to oxic conditions (Figure 4). This environmental shift is further supported by progressively decreasing Co/Ti ratios (Figure 4), which collectively suggest a shallowing of the water column. Concurrently, carbonate minerals begin to appear in the mudstone (Figure 5a). In Member 2, V/Sc ratios consistently indicate a persistently oxic water column (Figure 4). This sustained oxic condition is likely associated with a shallow water column, as evidenced by the Co/Ti ratios (Figure 4) and corroborated by the extensive development of carbonate minerals (Figure 5b–d). Collectively, these data suggest that Member 1 is characterized by a suboxic-to-oxic transitional environment, which evolves into a stable oxic environment in Member 2.
The Dawuba Formation samples exhibit pronounced vertical variations in redox conditions. Specifically, Member 1 records a transition from suboxic to oxic conditions, likely driven by a sea-level fall. In contrast, Member 2 is characterized by an oxic water column, supported by the occurrence of redox-sensitive indicators.

5.3. Paleoproductivity

Primary productivity refers to the capacity of autotrophic organisms to synthesize organic matter from water, carbon dioxide, and inorganic nutrients through photosynthesis and chemosynthesis [56]. In surface marine waters, primary productivity is influenced by multiple environmental factors, including sunlight availability, water temperature, and salinity [9,30]; however, the primary controlling factors are the availability of essential nutrients, such as the macronutrient P and trace elements Ba and Zn [57].
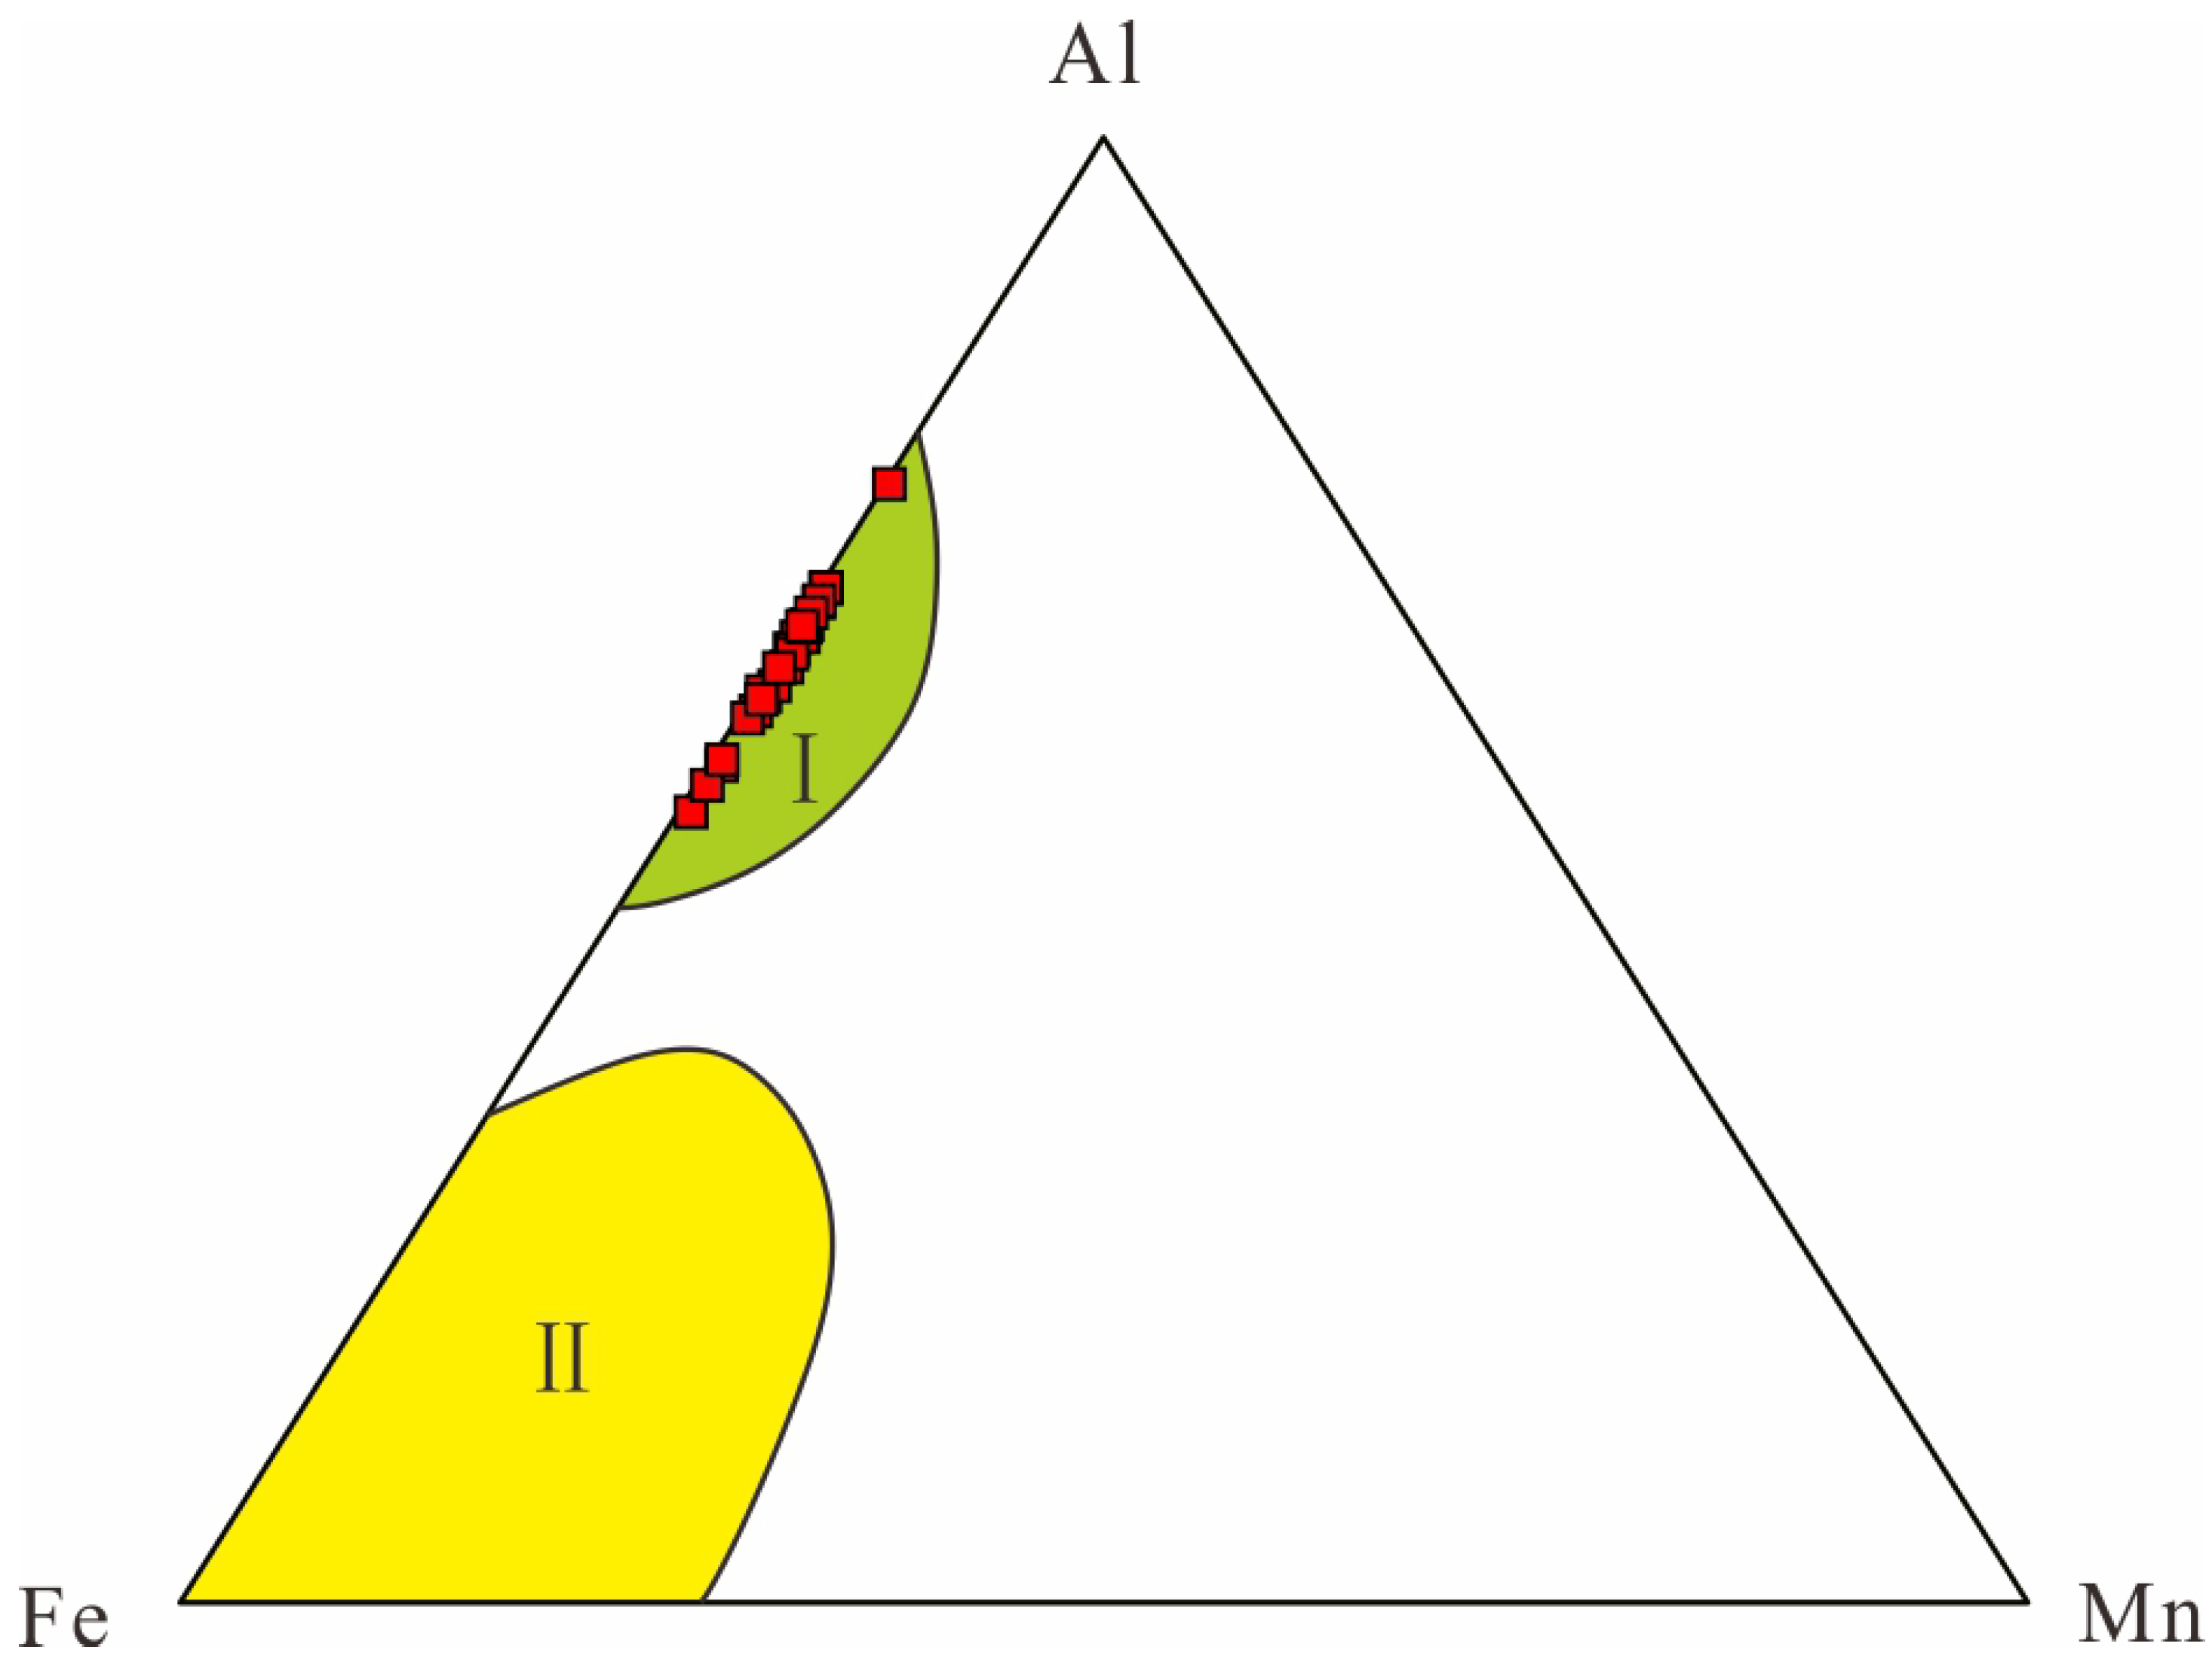
The barium concentration in marine sediments is derived from three primary sources: biogenic inputs, terrigenous detrital materials, and carbonate mineral lattices [13,58]. Among these, biogenic barium (Babio) undergoes a critical transformation following the death of marine organisms: the release of Babio from decaying biomass reacts with ambient seawater sulfate, facilitating the formation of authigenic barite (BaSO4), which is then preserved in sediments [59]. Consequently, the accumulation rate of Babio has been widely employed as a proxy for reconstructing marine paleoproductivity levels [41,51]. In Member 1, the Babio concentrations exhibit a high-value characteristic (Figure 4). Compared to Member 2, Babio concentrations in Member 1 are generally higher (Table 5), and this geochemical contrast indicates that the productivity level in Member 2 is generally higher than that in Member 1. The Al-Fe-Mn ternary diagram analysis reveals no hydrothermal activity in the study area (Figure 10), thereby excluding hydrothermal inputs as a confounding factor for productivity proxies. Thus, the higher productivity in Member 2 may be attributed to algal blooms, a hypothesis further supported by the developmental characteristics of the sapropelic facies (Figure 6a,b,d).
Phosphorus (P) is an essential nutrient element for organisms [60]. Upon organism death, tissue P is sequestered into sediments via sedimentation, thus serving as a common proxy for primary productivity assessment [59]. In marine environments, P sources primarily include marine biogenic inputs and terrigenous inputs [49,61]. Constrained by transport capacity, terrigenous inputs are predominantly restricted to coastal regions [62]. Therefore, when evaluating marine biological productivity in shallow-water areas, the P/Al ratio is commonly employed to normalize P concentrations, aiming to eliminate the influence of terrigenous P inputs [16,17]. In Member 1, the P/Al ratio exhibits a gradual decrease, indicating a progressive decline in productivity levels (Figure 4). Furthermore, compared to the relatively high P/Al ratios in Member 1 (with an average of 68.49), Member 2 displays relatively lower P/Al ratios (averaging 64.60) (Table 5). This observation suggests that Member 2 has relatively lower productivity, which is consistent with the variations in Babio content (Figure 4).

5.4. Controlling Factors of the Organic Matter Accumulation

The accumulation of organic matter is a complex physicochemical process regulated by multiple factors, including redox conditions, primary productivity, and terrestrial detrital input [8,18,40]. Even within the same sedimentary period, the dominant controls on organic matter accumulation can shift due to geological events and other perturbations [63,64]. Consequently, the difficulty in organic matter accumulation-i.e., the deposition of sediments with low TOC content-is also influenced by multiple factors.
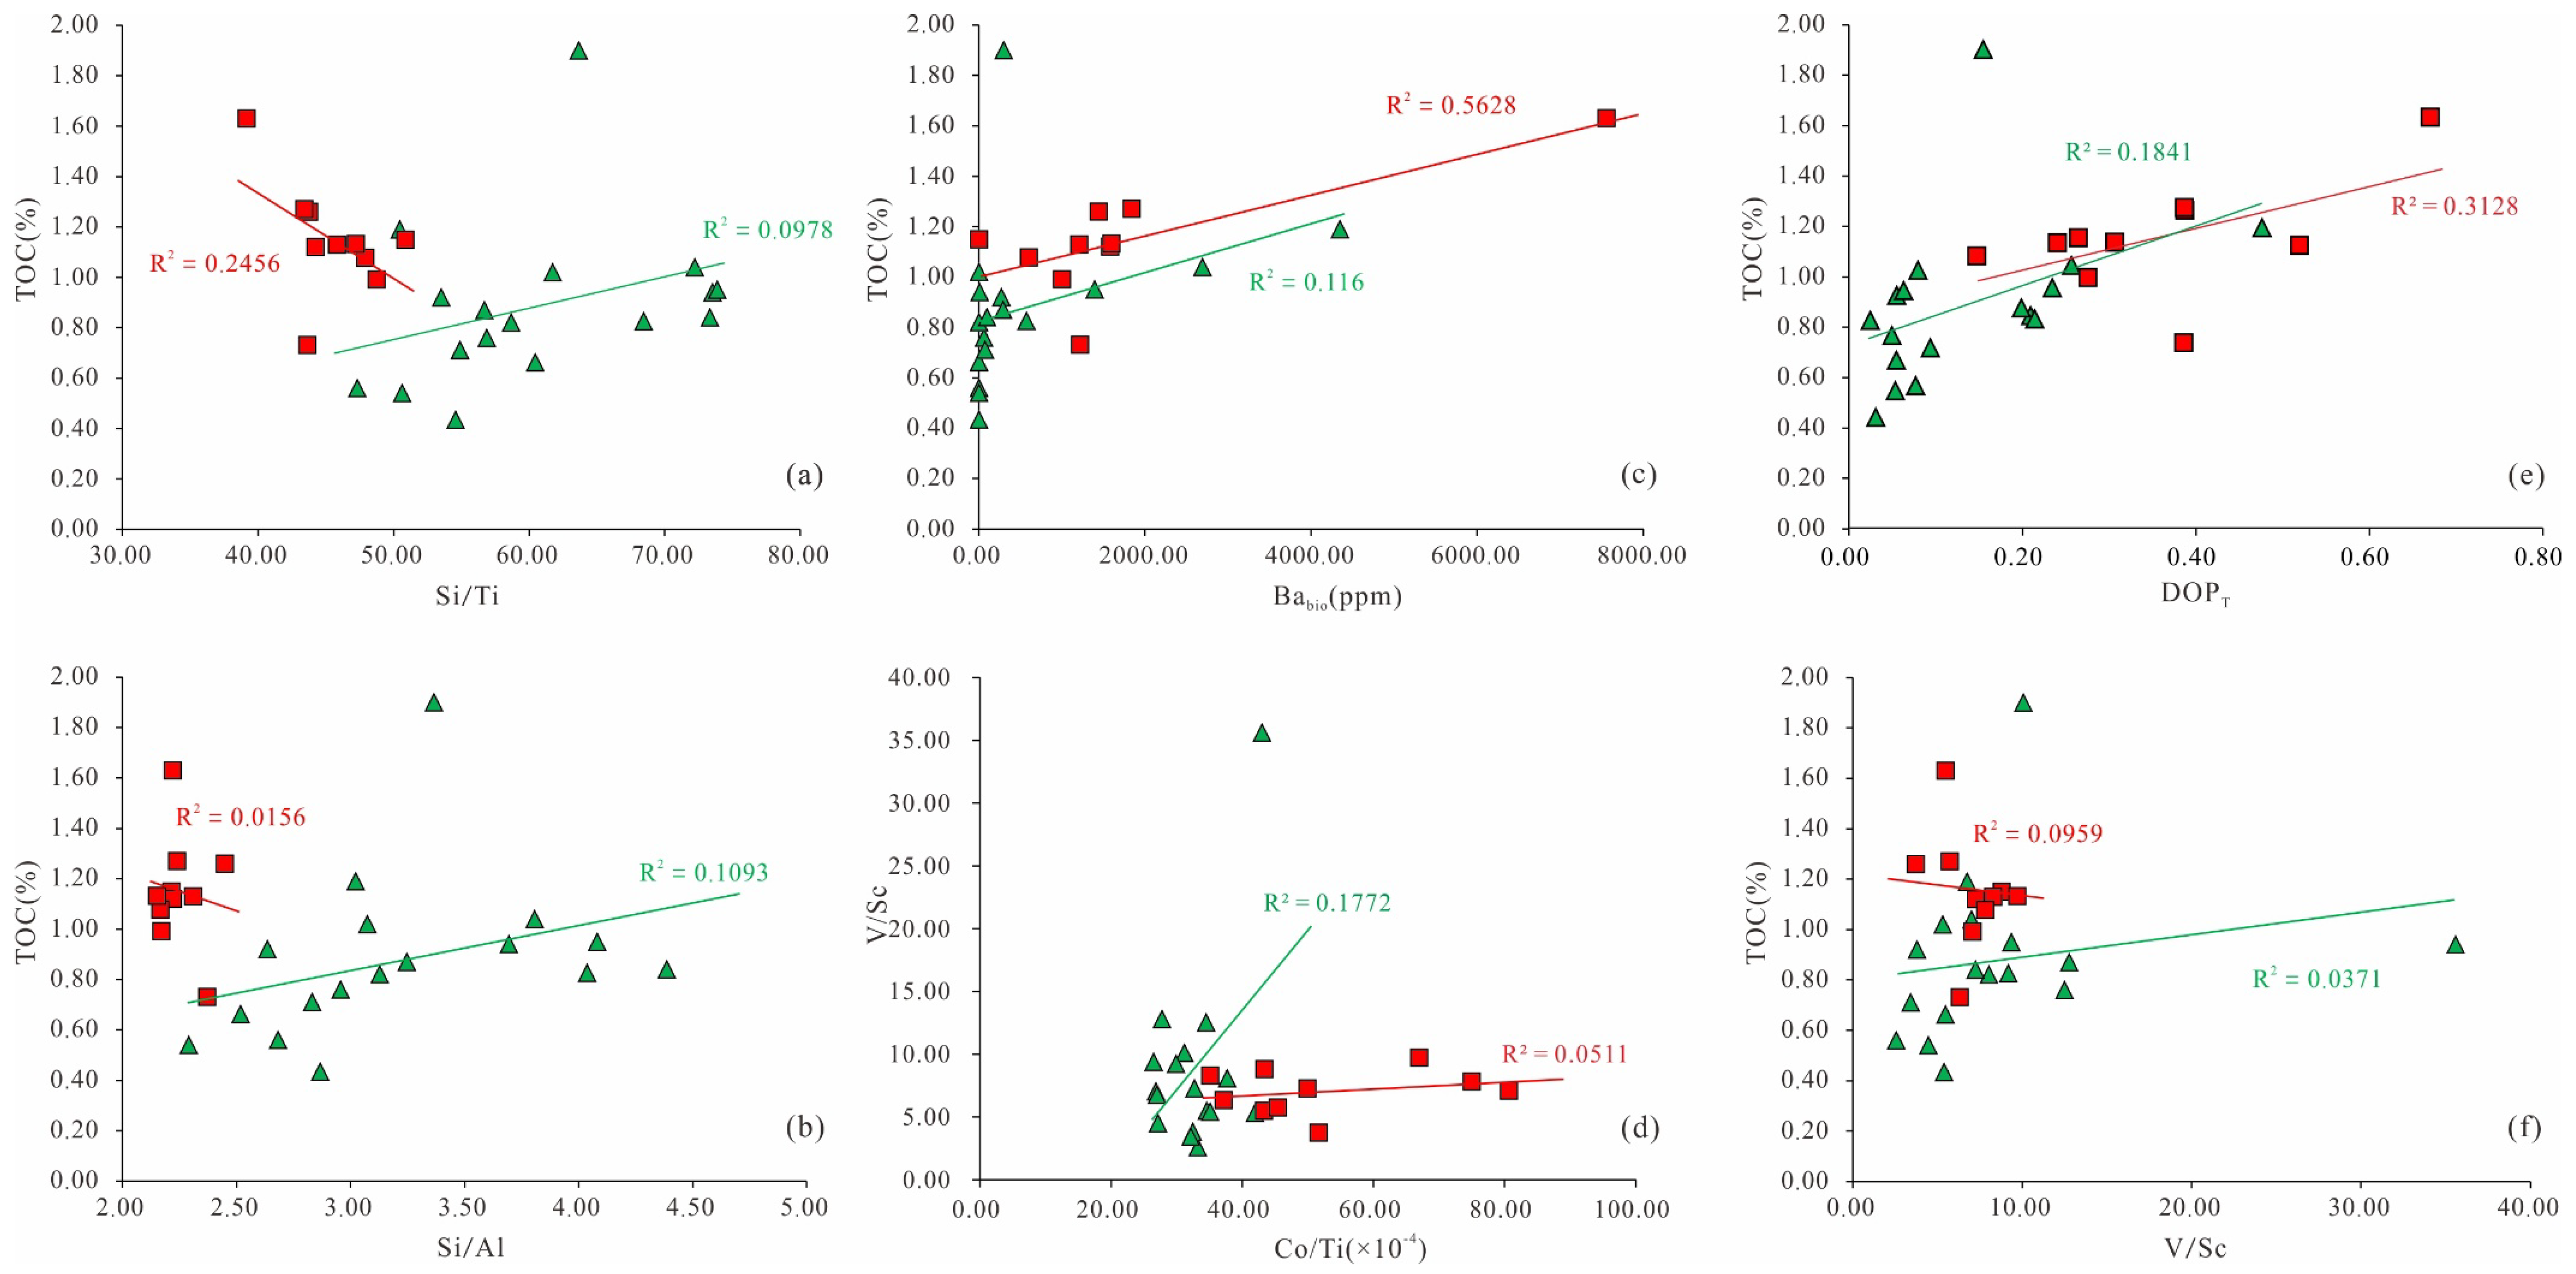
In Member 1, the negative correlations between Si/Ti and Si/Al ratios and TOC content indicate that terrestrial detrital influx hinders the accumulation of organic matter (Figure 11a,b). The productivity proxy (Babio) exhibits a strong positive correlation with TOC content, with a correlation coefficient of R2 = 0.5628, suggesting that primary productivity promotes organic matter accumulation to some extent (Figure 11c). Although an increase in water column height enhanced the reducing conditions of bottom water to a certain degree (Figure 11d), the water column in Member 1 was generally under oxic-to-suboxic conditions (Figure 4); thus, the oxic environment did not facilitate organic matter accumulation. This is further supported by the extremely weak correlations between redox proxies (DOPT and V/Sc) and TOC content (Figure 11e,f). Overall, high primary productivity is the key factor controlling organic matter accumulation in Member 1.
In Member 2, correlation plots of redox proxies (DOPT and V/Sc) against TOC content reveal that oxic water conditions do not exert a significant facilitative effect on organic matter accumulation (Figure 11e,f). Compared to Member 1, the terrestrial detrital influx in Member 2 increased markedly (Figure 4). Correlation analyses between Si/Ti and Si/Al ratios and TOC content demonstrate that enhanced terrestrial detrital input promotes organic matter accumulation (Figure 11a,b). This phenomenon is likely attributed to the increased terrestrial detrital flux per unit time within the oxic water column, which induces rapid burial and thereby facilitates organic matter preservation [65]. The productivity proxy (Babio) exhibits an extremely weak positive correlation with TOC content, indicating that high productivity in Member 2 fails to substantially enhance organic matter accumulation (Figure 11c). Overall, organic matter accumulation in Member 2 is largely driven by reduced exposure time within the oxic water column.

5.5. Model of Organic Matter Accumulation

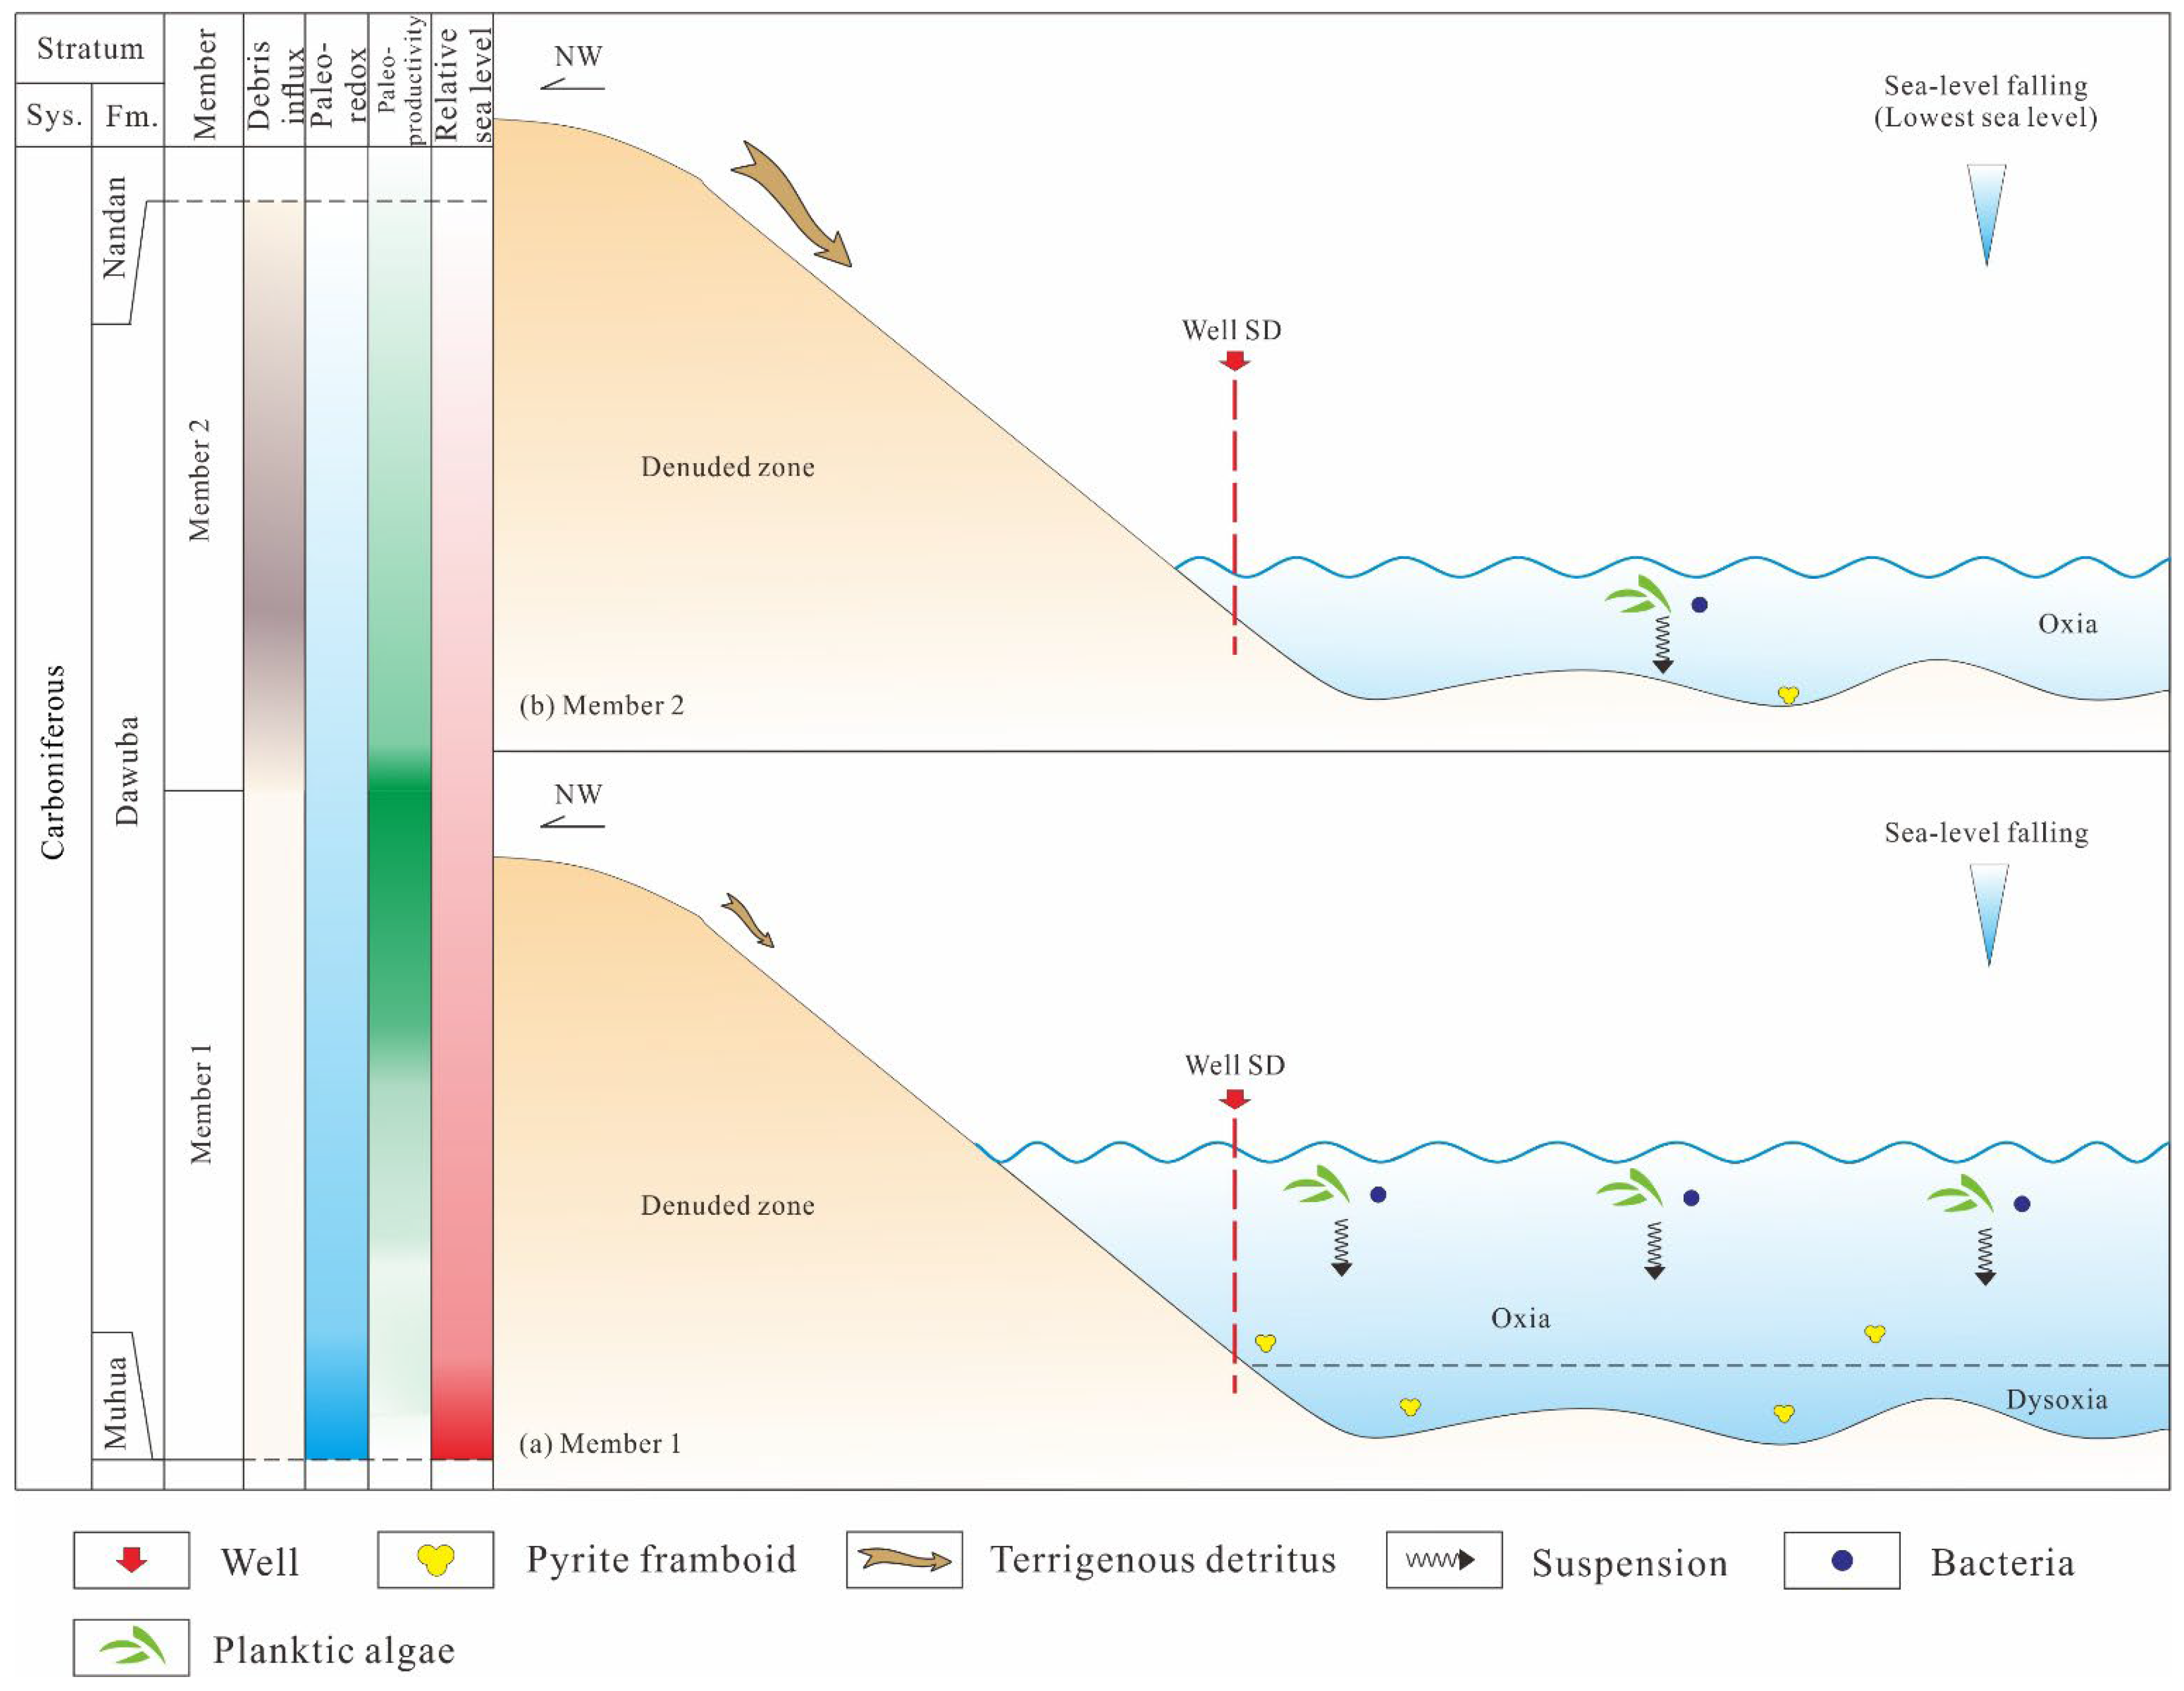
By comparing environmental differences among low-TOC sediments, including organic-containing (1.00% < TOC < 2.00%) and organic-poor (TOC < 1.00%), and analyzing redox conditions, productivity, and terrestrial detrital influx across each member, we propose an integrated environmental and organic matter accumulation model for the Early Carboniferous Qiannan Depression.
In Member 1, terrestrial detrital influx exhibited relatively stable variations (Figure 4), and it only marginally mitigated the degree of organic matter accumulation (Figure 11a,b). Productivity proxies (Babio) (Table 5) and kerogen macerals (Figure 6a,b) collectively indicate that algal blooms resulted in enhanced paleoproductivity. Meanwhile, the correlation between Babio and TOC contents revealed that increased productivity played a crucial role in promoting organic matter accumulation (Figure 11c). However, accompanied by a regional regression in South China [66], the water column underwent significant shoaling (Figure 4), with bottom water conditions shifting from suboxic to oxic (Figure 10). This redox transition subsequently promoted the consumption of a part of the organic matter (Figure 11e,f). Therefore, low TOC sediments were widely deposited (Figure 12a). The organic-rich sediments are mainly clay-rich lithofacies (shale), among which the CM-1 and CM-2 lithofacies have higher organic matter content (Figure 2 and Figure 4).

6. Conclusions

This study systematically investigates the Early Carboniferous Dawuba Formation in the Qiannan Depression through petrology, organic geochemistry, and major-trace element analysis, focusing on the controlling mechanisms of sedimentary environments on low-TOC sediment formation. The key findings are summarized as follows:
(1)
The Early Carboniferous Dawuba Formation in the Qiannan Depression comprises two members: Member 1 is characterized by the CM-1 lithofacies (thick-bedded mudstone), while Member 2 is dominated by the C-2 lithofacies (marl).
(2)
Sediments of the Dawuba Formation are characterized by overall low TOC contents, comprising two distinct types: organic-containing sediments (1.00% < TOC < 2.00%) and organic-poor sediments (TOC < 1.00%). The accumulation of organic matter in these sediments is collectively controlled by three key factors: redox conditions, primary productivity, and terrigenous detrital flux.
(3)
The organic-containing sediments of the Early Carboniferous Dawuba Formation developed in a deep-water suboxic-oxic transitional environment, characterized by intermittent weakly redox conditions, moderate primary productivity, and limited terrigenous detrital input, which sustained partial organic carbon preservation in Member 1. In Member 2, the organic-poor sediments were deposited in a shallow water column induced by sea-level fall, exhibiting persistent oxic conditions, decreased productivity, and enhanced terrestrial detrital influx. Notably, the decrease in organic matter exposure time within the oxic water column-driven by rapid terrigenous detrital accumulation-represents a critical factor for the formation of organic-poor sediments.

Author Contributions

Conceptualization, Y.L. and J.W.; methodology, T.L.; validation, formal analysis, investigation, resources, data curation, and writing—original draft preparation, D.L., J.C., S.W., W.S. and R.W.; writing—review and editing, visualization, supervision, and project administration, X.Z., X.X. and K.L. All authors have read and agreed to the published version of the manuscript.

Funding

This study was financially supported by the Shandong Institute of Petroleum and Chemical Technology Research Initiation Fund (Grant No. DJB20240013) led by Yuzuo Liu, the Dongying Natural Science Foundation (Grant No. 2025ZR018) led by Yuzuo Liu, and the Shandong Institute of Petroleum and Chemical Technology Research Initiation Fund (Grant No. DJB20240027) led by Dongxiao Li.

Data Availability Statement

All data and materials during this study are included in this manuscript.

Acknowledgments

Authors Yuzuo Liu, Jiao Wang, Jie Chen and Shengzhu Wang are all employed by the College of Petroleum Engineering, Shandong Institute of Petroleum and Chemical Technology and Shandong Key Laboratory of Shale Oil Exploration and Development in Continental Faulted Basin. Tuo Lin is employed by the China Geological Survey. Dongxiao Li is employed by the School of Chemical Engineering, Shandong Institute of Petroleum and Chemical Technology. Wanzhong Shi and Ren Wang are both employed by the China University of Geosciences. Xiaoming Zhang is employed by the Xinjiang University. Xiaofeng Xu and Kai Liu are both employed by theHubei Engineering University. They declare no conflicts of interest.

Conflicts of Interest

The authors declare no conflict of interest.

References

  1. Dong, D.Z.; Shi, Z.S.; Guan, Q.Z.; Jiang, S.; Zhang, M.Q.; Zhang, C.C.; Wang, S.Y.; Sun, S.S.; Yu, R.Z.; Liu, D.X.; et al. Progress, challenges and prospects of shale gas exploration in the Wufeng–Longmaxi reservoirs in the Sichuan Basin. Nat. Gas Ind. B 2018, 5, 415–424. [Google Scholar] [CrossRef]
  2. Guo, T.L.; Deng, H.C.; Zhao, S.; Wel, L.M.; He, J.H. Formation mechanisms and exploration breakthroughs of new type of shale gas in Cambrian Qiongzhusi Formation, Sichuan Basin, SW China. Pet. Explor. Dev. 2025, 52, 64–78. [Google Scholar] [CrossRef]
  3. Zhao, Z.; Yang, W.; Zhao, Z.Y.; Xu, W.L.; Gong, D.Y.; Jin, H.; Song, W.; Liu, G.; Zhang, C.L.; Huang, S.P. Research progresses in geological theory and key exploration areas of coal-formed gas in China. Pet. Explor. Dev. 2024, 51, 1435–1450. [Google Scholar] [CrossRef]
  4. Cunningham, C.M.; Arnott, R.W.C. Organic matter deposition and preservation in ancient deep-sea levée sediments: Implications for Neoproterozoic trends in carbon burial. Sedimentology 2023, 70, 475–504. [Google Scholar] [CrossRef]
  5. Liu, Z.S.; Zhang, Y.; Zhou, Q.H.; Wu, Z.B.; Wang, Y.X. In-situ Technologies for Controlling Sediment Phosphorus in Eutrophic Shallow Lakes: A Review. J. Earth Sci. 2025, 36, 113–133. [Google Scholar] [CrossRef]
  6. Yuan, K.; Huang, W.H.; Fang, X.X.; Wang, T.; Lin, T.; Chen, R. Evaluation of Favorable Shale Gas Intervals in Dawuba Formation of Ziyun Area, South Qian Depression. Geofluids 2021, 2021, 6688141. [Google Scholar] [CrossRef]
  7. Wang, T.; Xu, Z.J.; Yuan, K.; Wang, X.L.; Ge, M.N. Paleoenvironment and shale gas potential of the Carboniferous Dawuba and the Cambrian Niutitang shales in the Upper Yangtze Platform, South China. Front. Earth Sci. 2024, 12, 1404178. [Google Scholar] [CrossRef]
  8. Niu, J.L.; Zhang, J.C.; Tang, X.; Yuan, K.; Lin, T.; Liu, Y.; Niu, Y.J.; Li, P.; Liang, Y.T. Main Controlling Factors and Models of Organic Matter Accumulation in Lower Carboniferous Dawuba Formation Shale in Southern Guizhou, China. ACS Omega 2021, 6, 32441–32459. [Google Scholar] [CrossRef]
  9. Zheng, F.Z.; Tang, X.; Yuan, K.; Lin, T.; You, M.X.; Niu, J.L.; Zi, Y.Y.; Liang, Y.T. Sedimentation models and development mechanisms of organic-rich shales of the lower carboniferous dawuba formation: A case study in the yaziluo rift trough, south of Guizhou province, southern China. Acs Omega 2022, 7, 29054–29071. [Google Scholar] [CrossRef]
  10. Liang, Y.T.; Tang, X.; Zhang, J.C.; Liu, Y.; Zhang, Y.; Yuan, K.; Lin, T.; Ding, J.H.; Wang, Y. Origin of lower carboniferous cherts in southern Guizhou, south China. Palaeogeogr. Palaeoclimatol. Palaeoecol. 2022, 590, 110863. [Google Scholar] [CrossRef]
  11. Zhang, H.Q.; Zhang, Q.; Zhou, Y.X.; Lan, B.F.; Feng, X.T.; Chen, Y.; Yu, Q.; Cheng, J.X.; Men, Y.P.; Zhao, A.K. Geochemical characteristics and sedimentary environment of black mudstone in the early Carboniferous Dawuba Formation in the Middle and Upper Yangtze region. Front. Earth Sci. 2023, 11, 1277359. [Google Scholar] [CrossRef]
  12. Sun, C.X.; Nie, H.K.; Dang, W.; Chen, Q.; Zhang, G.R.; Li, W.P.; Lu, Z.Y. Shale gas exploration and development in China: Current status, geological challenges, and future directions. Energy Fuels 2021, 35, 6359–6379. [Google Scholar] [CrossRef]
  13. Lu, Y.B.; Jiang, S.; Lu, Y.C.; Xu, S.; Shu, Y.; Wang, Y.X. Productivity or preservation? The factors controlling the organic matter accumulation in the late Katian through Hirnantian Wufeng organic-rich shale, South China. Mar. Pet. Geol. 2019, 109, 22–35. [Google Scholar] [CrossRef]
  14. Liu, W.; Gao, P.; Xiao, X.M.; Zhao, Y.M.; Xing, Y.J.; Li, J.K. Variable depositional environments and organic matter enrichment of Early Cambrian shales in the Middle Yangtze region, South China. J. Asian Earth Sci. 2024, 259, 105874. [Google Scholar] [CrossRef]
  15. Ross, D.J.K.; Bustin, R.M. Investigating the use of sedimentary geochemical proxies for paleoenvironment interpretation of thermally mature organic-rich strata: Examples from the Devonian-Mississippian shales, Western Canadian Sedimentary Basin. Chem. Geol. 2009, 260, 1–19. [Google Scholar] [CrossRef]
  16. Liu, Y.Z.; Shi, W.Z.; Hu, Q.H.; Yuan, K.; Xu, X.F.; Zhang, X.M.; Wang, R.; Chen, X.L.; Gingras, M.K.; Konhauser, K.O. The mechanism of organic matter accumulation in the archipelago marine sediments: Insights from the Middle Devonian Givetian mudstone with low TOC in the Youjiang Basin, South China. Mar. Pet. Geol. 2024, 160, 106626. [Google Scholar] [CrossRef]
  17. Brumsack, H.J. The trace metal content of recent organic carbon-rich sediments: Implications for Cretaceous black shale formation. Palaeogeogr. Palaeoclimatol. Palaeoecol. 2006, 232, 344–361. [Google Scholar] [CrossRef]
  18. Li, P.; Liu, Z.B.; Bi, H.; Jiang, T.; Bian, R.K.; Wang, P.W.; Shang, X.Y. Differences in and factors controlling organic matter enrichment in the Ziliujing Formation shale in the Sichuan Basin. Pet. Sci. 2024, 21, 77–86. [Google Scholar] [CrossRef]
  19. Liu, Q.Y.; Li, P.; Jin, Z.J.; Sun, Y.W.; Hu, G.; Zhu, D.Y.; Huang, Z.K.; Liang, X.P.; Zhang, R.; Liu, J.Y. Organic-rich formation and hydrocarbon enrichment of lacustrine shale strata: A case study of Chang 7 Member. Sci. China Earth Sci. 2022, 65, 118–138. [Google Scholar] [CrossRef]
  20. Zhao, Z.F.; Zou, C.N.; Dai, S.F.; Guo, Z.J.; Li, Y.; Nielsen, A.T.; Schovsbo, N.H.; Jing, Z.H.; Liu, H.L.; Yuan, M.; et al. Weathering-induced organic matter enrichment in marine-continental transitional shale: A case study on the early Permian Taiyuan Formation in the Ordos Basin, China. Int. J. Coal Geol. 2024, 291, 104562. [Google Scholar] [CrossRef]
  21. Yuan, K.; Huang, W.H.; Fang, X.X.; Li, S.Z.; Wang, T.; Lin, T.; Liu, G.H. Geochemical characteristics and sedimentary environment of the middle Devonian organic-rich shales in the northwest of guizhong depression, southwest China. China Geol. 2020, 3, 567–574. [Google Scholar] [CrossRef]
  22. Yu, C.M.; Qie, W.K.; Lu, J.F. Emsian (early devonian) yujiang event in southsouth China. Palaeoworld 2018, 27, 53–65. [Google Scholar] [CrossRef]
  23. Mei, M.X.; Ma, Y.S.; Deng, J.; Chu, H.M.; Zheng, K.B. Sequence-stratigraphic frameworks and their palaeogeographic patterns for the Permian Lopingian of the Dianqiangui Basin and its adjacent areas of Southwestern China. Sci. China Ser. D: Earth Sci. 2007, 50, 869–885. [Google Scholar] [CrossRef]
  24. Qie, W.K.; Sun, Y.L.; Guo, W.; Nie, T.; Chen, B.; Song, J.J.; Liang, K.; Yin, B.A.; Han, S.P.; Chang, J.Y.; et al. Devonian-Carboniferous boundary in China. Palaeobiodiversity Palaeoenvironments 2021, 101, 589–611. [Google Scholar] [CrossRef]
  25. International Committee for Coal and Organic Petrology (ICCP). The new vitrinite classification (ICCP systems 1994). Fuel 1998, 77, 349–358. [Google Scholar] [CrossRef]
  26. Pickel, W.; Kus, J.; Flores, D.; Kalaitzidis, S.; Christanis, K.; Cardott, B.J.; Crosdale, P. Classification of liptinite-ICCP system 1994. Int. J. Coal. Geol. 2017, 169, 40–61. [Google Scholar] [CrossRef]
  27. International Committee for Coal and Organic Petrology (ICCP). The new inertinite classification (ICCP system 1994). Fuel 2001, 80, 459–471. [Google Scholar] [CrossRef]
  28. López, J.M.G.; Bauluz, B.; Fernández-Nieto, C.; Oliete, A.Y. Factors controlling the trace-element distribution in fine-grained rocks: The Albian kaolinite-rich deposits of the Oliete Basin (NE Spain). Chem. Geol. 2005, 214, 1–19. [Google Scholar] [CrossRef]
  29. Kang, Y.; Zhu, R.K.; Liu, K.Q.; Zhang, J.Y.; Zhang, S.R. Detrital and authigenic clay minerals in shales: A review on their identification and applications. Heliyon 2024, 10, e39239. [Google Scholar] [CrossRef]
  30. Xiao, B.; Liu, S.G.; Li, Z.W.; Ran, B.; Ye, Y.H.; Yang, D.; Li, J.X. Geochemical characteristics of marine shale in the Wufeng Formation-Longmaxi Formation in the northern Sichuan Basin, South China and its implications for depositional controls on organic matter. J. Pet. Sci. Eng. 2021, 203, 108618. [Google Scholar] [CrossRef]
  31. O’Connell, B.; Wallace, M.W. The palaeoenvironmental and biological significance of marine carbonate depositional surfaces. Geol. Soc. Lond. Spec. Publ. 2025, 556, 556–2024. [Google Scholar] [CrossRef]
  32. Taylor, S.R.; Mclennan, S.M. The Continental Crust: Its Composition and Evolution; Blackwell: London, UK, 1985. [Google Scholar]
  33. Reimann, C.; Caritat, P.D. Intrinsic flaws of element enrichment factors (EFs) in environmental geochemistry. Environ. Sci. Technol. 2000, 34, 5084–5091. [Google Scholar] [CrossRef]
  34. Liu, Y.; Wei, Y.; Liu, G.J.; Fu, B.; Chen, B.Y.; Zhang, J.M.; Gui, L.; Zhou, H.H.; Lu, M.Y. Fine chemical speciation and environmental impact capacity of trace elements with different enrichment levels in coal. Sci. Total Environ. 2023, 856, 158928. [Google Scholar] [CrossRef] [PubMed]
  35. Schoepfer, S.D.; Shen, J.; Wei, H.Y.; Tyson, R.V.; Ingall, E.; Algeo, T.J. Total organic carbon, organic phosphorus, and biogenic barium fluxes as proxies for paleomarine productivity. Earth Sci. Rev. 2015, 149, 23–52. [Google Scholar] [CrossRef]
  36. Zhong, N.N.; Lu, S.F.; Huang, Z.L.; Zhang, Y.S. TOC changes in the process of thermal evolution of source rock and its controls. Sci. China 2004, 47 (Suppl. S2), 141–149. [Google Scholar] [CrossRef]
  37. Wu, L.Y.; Hu, D.F.; Lu, Y.C.; Liu, R.B.; Liu, X.F. Advantageous shale lithofacies of Wufeng formation-longmaxi Formation in fuling gas field of Sichuan Basin, SW China. Petroleum. Explor. Dev. 2016, 43, 208–217. [Google Scholar] [CrossRef]
  38. Fontana, D. Detrital carbonate grains as provenance indicators in the Upper Cretaceous Pietraforte Formation (northern Apennines). Sedimentology 1991, 38, 1085–1095. [Google Scholar] [CrossRef]
  39. Ma, B.; Ji, L.M.; Zhou, Q.S.; Zhang, Y.; Fu, S.; Xiao, Y.Y.; Sun, H. Morphology and sulfur isotopes of pyrite in Chang73 shale: Indications for redox conditions and enrichment of organic matter and hydrocarbons. Mar. Pet. Geol. 2025, 180, 107484. [Google Scholar] [CrossRef]
  40. Qiao, J.Q.; Li, H.; Luo, Q.Y.; Liu, L.F.; Wang, D.D.; Shang, X.Q.; Xiao, F.; Zhang, T. Development conditions and factors controlling the formation of the Permian Pingdiquan source rocks in the Wucaiwan Sag, Junggar Basin, China: A comprehensively elemental, biomarker and isotopic perspective. J. Earth Sci. 2025, 36, 627–643. [Google Scholar] [CrossRef]
  41. Kang, J.H.; Wang, X.Z.; Huo, F.; Zeng, D.M.; Li, Y.; Huang, Z.S.; Zhu, Y.Q.; Li, B.; Xie, S.Y.; Yang, Y.R.; et al. Changes in lake sedimentary environment and characteristics of organic matter enrichment under the influence of geological events: The lower Jurassic (Sinemurian-Toarcian) organic-rich shale, Sichuan Basin, Upper Yangtze Plate. Mar. Pet. Geol. 2025, 177, 107390. [Google Scholar] [CrossRef]
  42. Tribovillard, N.P.; Desprairies, A.; Lallier-Vergès, E.; Bertrand, P.; Moureau, N.; Ramdani, A.; Ramanampisoa, L. Geochemical study of organic-matter rich cycles from the Kimmeridge Clay Formation of Yorkshire (UK): Productivity versus anoxia. Palaeogeogr. Palaeoclimatol. Palaeoecol. 1994, 108, 165–181. [Google Scholar] [CrossRef]
  43. Wilkin, R.T.; Barnes, H.L.; Brantley, S.L. The size distribution of framboidal pyrite in modern sediments: An indicator of redox conditions. Geochim. Et Cosmochim. Acta 1996, 60, 3897–3912. [Google Scholar] [CrossRef]
  44. Chang, J.Y.; Li, Y.Y.; Lu, H.L. The morphological characteristics of authigenic pyrite formed in marine sediments. J. Mar. Sci. Eng. 2022, 10, 1533. [Google Scholar] [CrossRef]
  45. Wilkin, R.T.; Barnes, H.L.; Brantley, S.L. Formation processes of framboidal pyrite. Geochim. Et Cosmochim. Acta 1997, 61, 323–339. [Google Scholar] [CrossRef]
  46. Wignall, P.B.; Bond, D.P.G.; Kuwahara, K.; Kakuwa, Y.; Newton, R.J.; Poulton, S.W. An 80-million-year oceanic redox history from Permian to Jurassic pelagic sediments of the Mino-Tamba terrane, SW Japan, and the origin of four mass extinctions. Glob. Planet. Change 2010, 71, 109–123. [Google Scholar] [CrossRef]
  47. Sawłowicz, Z. Framboids: From Their Origin to Application; Wydawnictwo Oddziału Polskiej Akademii Nauk: Warsaw, Poland, 2000; Volume 88. [Google Scholar]
  48. Ohfuji, H.; Rickard, D. Experimental syntheses of framboids-a review. Earth Sci. Rev. 2005, 71, 147–170. [Google Scholar] [CrossRef]
  49. Butler, I.B.; Rickard, D. Framboidal pyrite formation via the oxidation of iron (II) monosulfide by hydrogen sulphide. Geochim. Et Cosmochim. Acta 2000, 64, 2665–2672. [Google Scholar] [CrossRef]
  50. Duverger, A.; Berg, J.S.; Busigny, V.; Guyot, F.; Bernard, S.; Miot, J. Mechanisms of pyrite formation promoted by sulfate-reducing bacteria in pure culture. Front. Earth Sci. 2020, 8, 588310. [Google Scholar] [CrossRef]
  51. Algeo, T.J.; Liu, J.S. A re-assessment of elemental proxies for paleoredox analysis. Chem. Geol. 2020, 540, 119549. [Google Scholar] [CrossRef]
  52. Algeo, T.J.; Li, C. Redox classification and calibration of redox thresholds in sedimentary systems. Geochim. Et Cosmochim. Act 2020, 287, 8–26. [Google Scholar] [CrossRef]
  53. Lin, D.L.; Xi, Z.D.; Tang, S.H.; Lash, G.G.; Cheng, Y.; Zhang, Q.; Yang, X.X.; Jia, T.F. New insights into controlling factors of organic matter enrichment in Carboniferous–Permian shales based on machine learning. Geol. Soc. Am. Bull. 2025, 137, 2846–2866. [Google Scholar] [CrossRef]
  54. Zhou, D.S.; Dong, H.Z.; Huang, X.W.; Liang, Y.F.; Deng, Z.Y.; Huang, L.; Jiang, S. The paleo-oceanic environment and organic matter enrichment mechanism of the early Cambrian in the southern Lower Yangtze platform, China. Mar. Pet. Geol. 2024, 170, 107119. [Google Scholar] [CrossRef]
  55. Xu, H.Y.; Hou, D.J.; Löhr, S.C.; Liu, Q.Y.; Jin, Z.J.; Shi, J.Y.; Liang, X.P.; Niu, C.K.; George, S.C. Millimetre-scale biomarker heterogeneity in lacustrine shale identifies the nature of signal-averaging and demonstrates anaerobic respiration control on organic matter preservation and dolomitization. Geochim. Et Cosmochim. Acta 2023, 348, 107–121. [Google Scholar] [CrossRef]
  56. Doner, Z. Elemental geochemistry of upper Campanian shales in the western Pontides (Türkiye): Sedimentary environment controls on the organic matter accumulation and source rock potential. J. Earth Sci. 2025. [Google Scholar] [CrossRef]
  57. Salocchi, A.C.; Krawielicki, J.; Eglinton, T.I.; Eglinton, T.I.; Fioroni, C.; Fontana, D.; Conti, S.; Picotti, V. Biomarker constraints on Mediterranean climate and ecosystem transitions during the Early-Middle Miocene. Palaeogeogr. Palaeoclimatol. Palaeoecol. 2021, 562, 110092. [Google Scholar] [CrossRef]
  58. McManus, J.; Berelson, W.M.; Klinkhammer, G.P.; Johnson, K.S.; Coale, K.H.; Anderson, R.F.; Kumar, N.; Burdige, D.J.; Hammond, D.E.; Brumsack, H.J.; et al. Geochemistry of barium in marine sediments: Implications for its use as a paleoproxy. Geochim. Et Cosmochim. Acta 1998, 62, 3453–3473. [Google Scholar] [CrossRef]
  59. Griffith, E.M.; Paytan, A. Barite in the ocean–occurrence, geochemistry and palaeoceanographic applications. Sedimentology 2012, 59, 1817–1835. [Google Scholar] [CrossRef]
  60. Houk, R.S.; Fassel, V.A.; Flesch, G.D.; Svec, H.J.; Gray, A.L.; Taylor, C.E. Inductively coupled argon plasma as an ion source for mass spectrometric determination of trace elements. Anal. Chem. 1980, 52, 2283–2289. [Google Scholar] [CrossRef]
  61. Latimer, J.C.; Filippelli, G.M. Terrigenous input and paleoproductivity in the Southern Ocean. Paleoceanography 2001, 16, 627–643. [Google Scholar] [CrossRef]
  62. Jennerjahn, T.C. Biogeochemical response of tropical coastal systems to present and past environmental change. Earth Sci. Rev. 2012, 114, 19–41. [Google Scholar] [CrossRef]
  63. Hemmati, M.; Ahmadi, Y.; Vaferi, B.; Alibak, A.H.; Wood, D.A. Surveying Organic Matter, Thermal Maturity Level, and Paleo-Environmental Conditions by Considering Biomarker and Stable Carbon Isotopic Analysis. J. Earth Sci. 2025, 36, 428–440. [Google Scholar] [CrossRef]
  64. Li, Y.; Jiang, H.X.; Sun, C.H.; Yang, G.; Zhang, L.; Hu, Y.J. Comparison of end-Ediacaran to earliest Cambrian microbialites in the Tarim Basin, China: Diversities and paleo-environment. J. Earth Sci. 2025. [Google Scholar] [CrossRef]
  65. Ibach, L.E.J. Relationship between sedimentation rate and total organic carbon content in ancient marine sediments. AAPG Bull. 1982, 66, 170–188. [Google Scholar] [CrossRef]
  66. Wang, X.D.; Hu, K.Y.; Qie, W.K.; Sheng, Q.Y.; Chen, B.; Lin, W.; Yao, L.; Wang, Q.L.; Qi, Y.P.; Chen, J.T.; et al. Carboniferous integrative stratigraphy and timescale of China. Sci. China Earth Sci. 2019, 62, 135–153, (in Chinese with English abstract). [Google Scholar] [CrossRef]
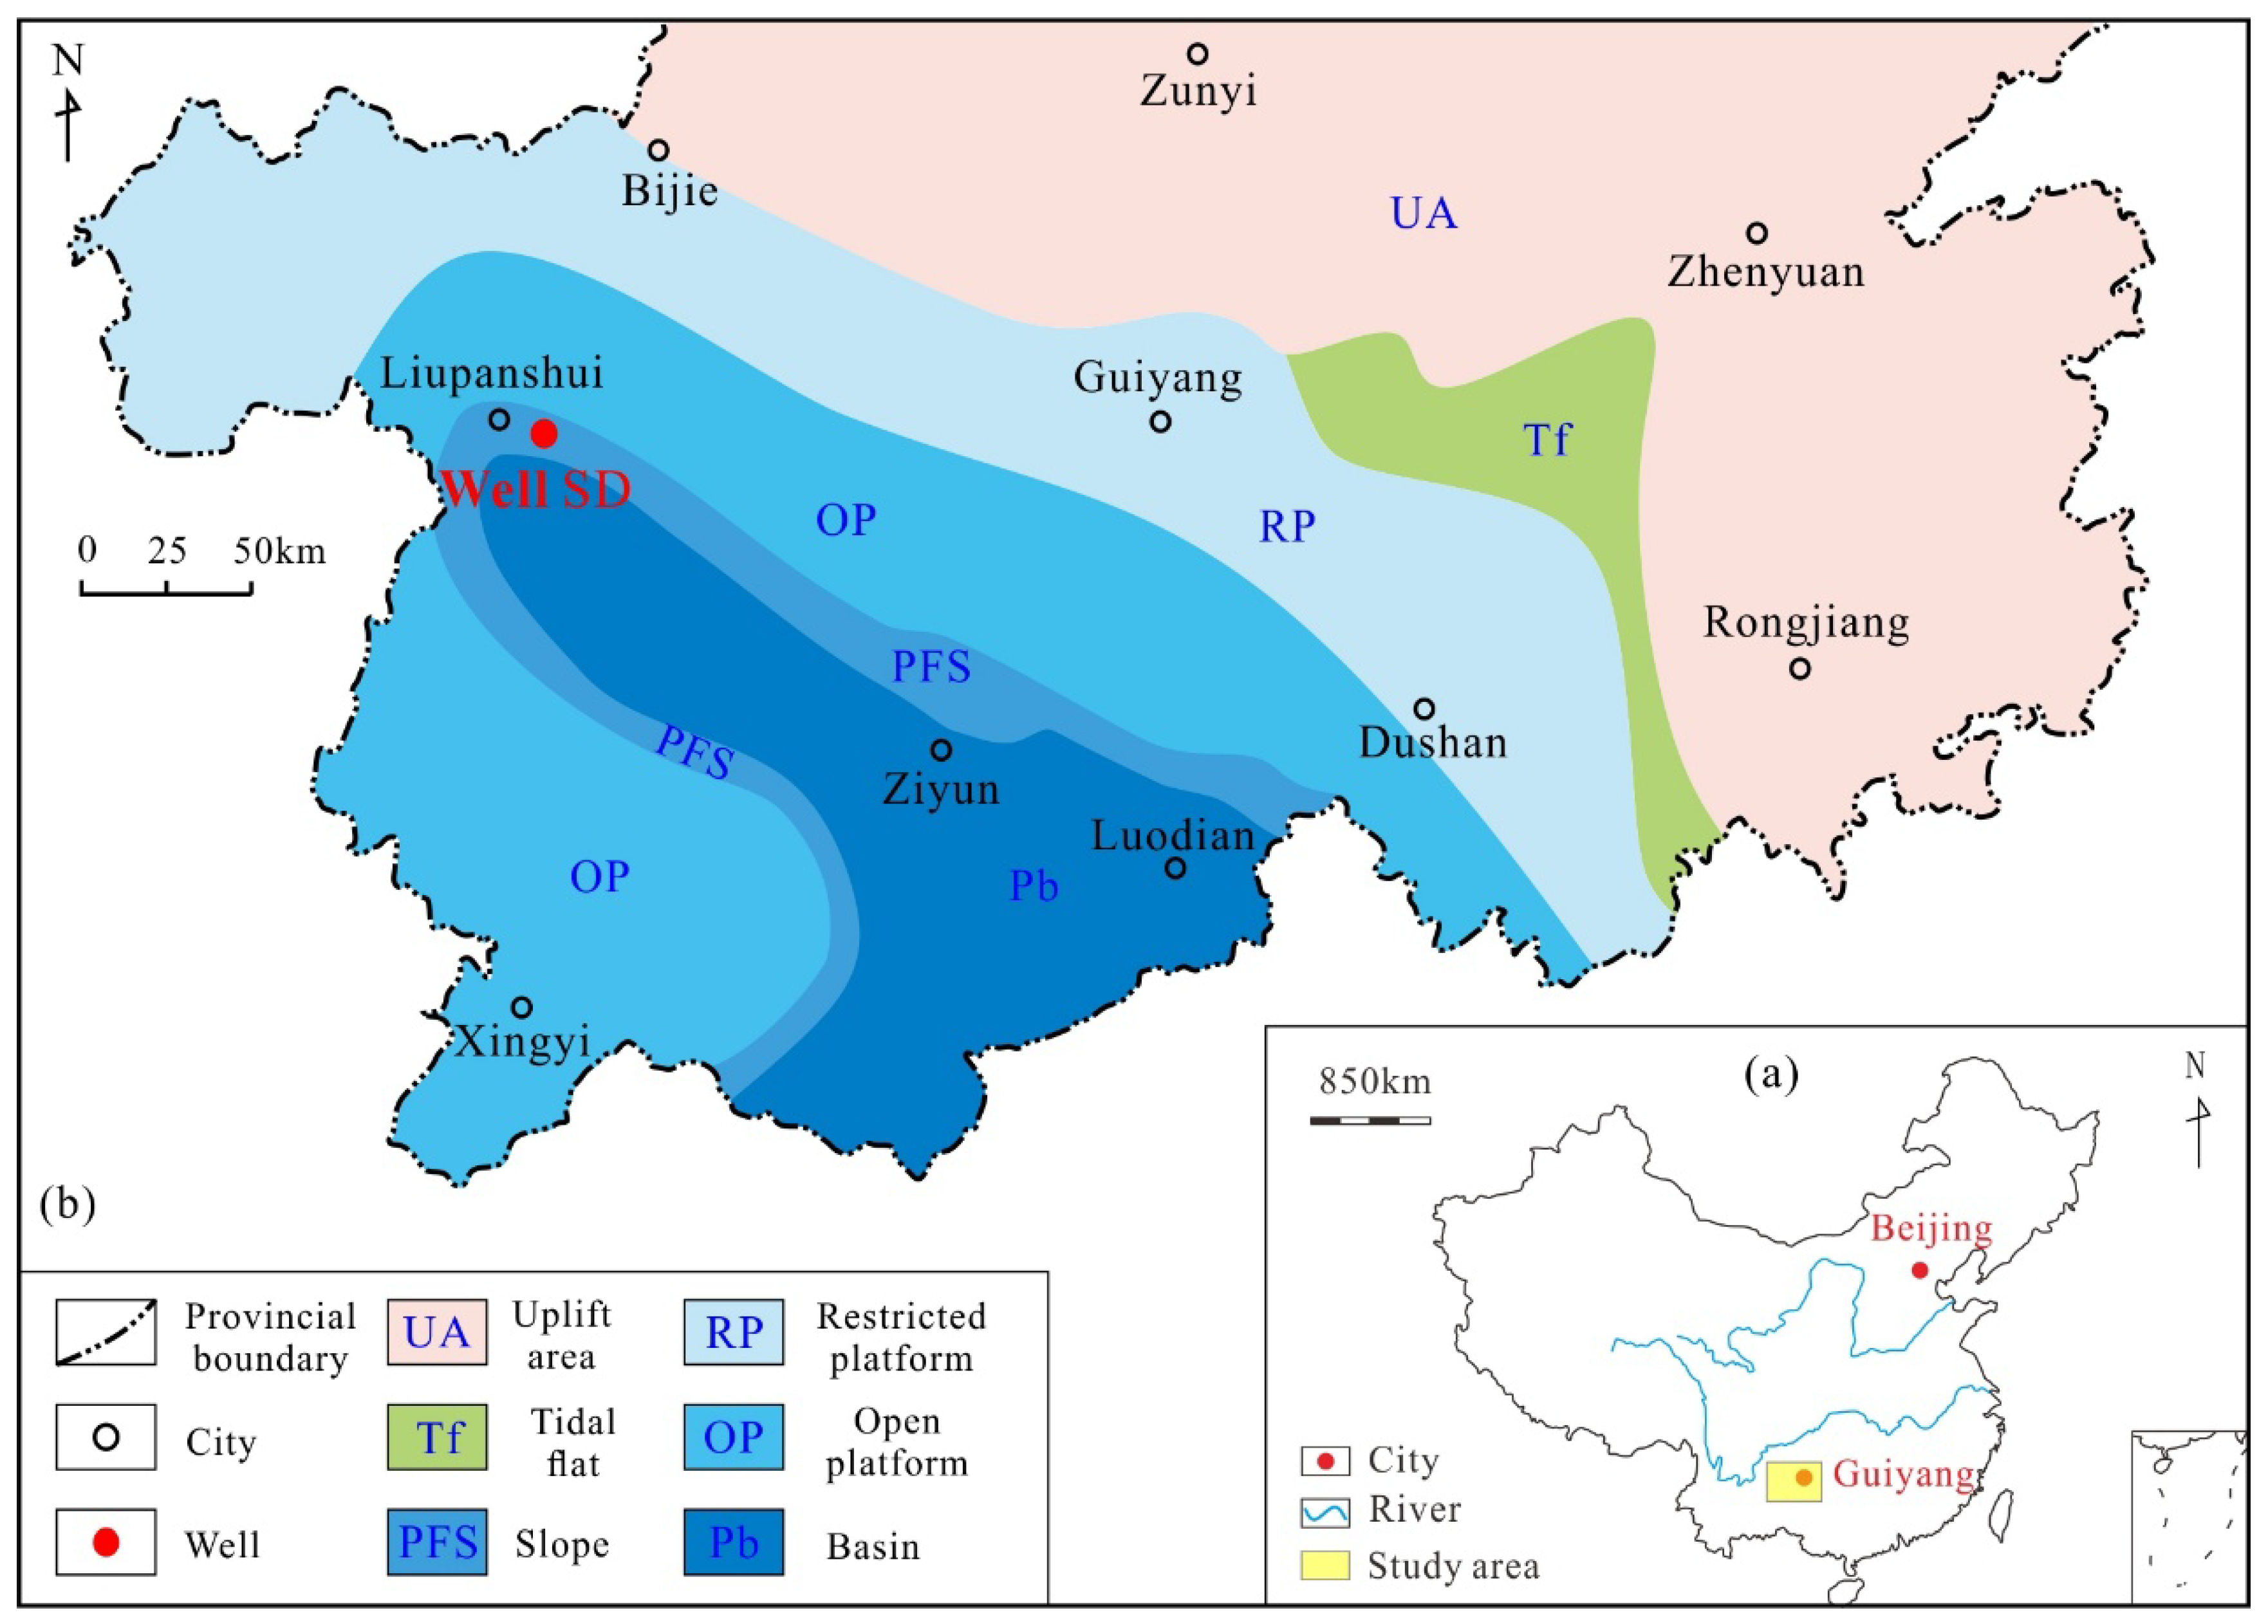
Figure 1. (a) Location of the study area in China [6,9]; (b) palaeogeographic map showing the distribution of sedimentary facies and locations of sampling Well SD.
Geosciences 15 00442 g001
Figure 2. Lithology, lithofacies, and GR logging of Well SD. Each lithofacies code (C-2 et al.) refers to Figure 3. N = quantity of measured framboids.
Geosciences 15 00442 g002
Figure 3. Ternary diagram showing the mineralogical composition of six major lithofacies in Well SD [37]. M-2: Argillaceous/siliceous mixed shale lithofacies, CM-1: Silica-rich argillaceous shale lithofacies, CM-2: Mixed argillaceous shale lithofacies, C-3: Clay-rich calcareous shale lithofacies, C-2: Mixed calcareous shale lithofacies, C: Calcareous shale lithofacies.
Geosciences 15 00442 g003
Figure 4. Vertical variations in multiple geochemical proxies from the Dawuba Formation of Well SD. Representative concentrations of Ba from PAAS vs. Ti (Ba/Ti = 0.0065).
Geosciences 15 00442 g004
Figure 5. Thin section optical microscopy images of prevalent minerals in the Dawuba Formation. (a) Abundant clay minerals in mudstone (1930.50 m); (b) A large number of carbonate minerals and a small number of clay minerals in argillaceous limestone (1693.00 m); (c) Carbonate grains and subordinate clay minerals in argillaceous limestone (1682.40 m); (d) Abundant carbonate grains and subordinate clay minerals in argillaceous limestone (1655.80 m); Photomicrographs (ad) are under mono-polarized light; CL = clay mineral; CM = carbonate mineral; BD = bioclastic debris.
Geosciences 15 00442 g005
Figure 6. Photomicrographs of organic matter under reflected white light with oil immersion and without oil immersion. (a) Sapropelinite and vitrinite (2280.00 m); (b) Sapropelinite and vitrinite (2062.00 m); (c) Vitrinite and exinite (1782.50 m); (d) Sapropelinite and vitrinite (1755.00 m); S = sapropelinite; E = exinite; V = vitrinite. In Member 1, the kerogen is mainly composed of sapropelinite (average 72.50%) and vitrinite (average 27.50%). The values of TI show that the whole kerogen belongs to Type II1 (Table 2). In Member 2, a small amount of exinite is developed (Figure 6c). Sapropelinite (45.00–55.00%, average 50.00%) and vitrinite (38.00–55.00%, average 46.50%) exhibit similar concentration ranges and together constitute the dominant maceral components, collectively accounting for over 95% of the total kerogen composition (Table 2).
Geosciences 15 00442 g006
Figure 7. SEM photos of pyrite in the Dawuba Formation. (a) Coexistence of normal framboids and clay minerals (1821.00 m); (b) clustered crystals with contiguous distribution (1821.00 m); (c) an aggregate of pyrite framboid and organic matter (1680.80 m); (d) a large number of euhedral crystals distributed consecutively and connected with organic matter (1645.00 m); OM = organic matter; CM = clay mineral; NF = normal framboid; EC = euhedral crystal; CC = clustered crystal.
Geosciences 15 00442 g007
Figure 8. Histograms showing the distribution of pyrite framboid diameter of Member 1 (a,b), and Member 2 (c,d) in the Dawuba Formation, D = depth, n =quantity of measured framboids, m = average diameter of framboids.
Geosciences 15 00442 g008
Figure 9. The cross plots depict the relationships between Th and Ti (a), Zr and Ti (b), Th and Al (c), and Zr and Al (d).
Geosciences 15 00442 g009
Figure 10. Ternary diagram of Al-Fe-Mn illustrating the Dawuba Formation samples of Well SD falling into the biogenic and non-hydrothermal area. I: biogenic and non-hydrothermal sediments, II: hydrothermal sediments [16].
Geosciences 15 00442 g010
Figure 11. Cross plots: (a) Si/Ti versus TOC contents; (b) Si/Al versus TOC contents; (c) Babio versus TOC contents; (d) Co/Ti versus V/Sc; (e) DOPT versus TOC contents; (f) V/Sc versus TOC contents (squares: Member 1; triangles: Member 2).
Geosciences 15 00442 g011
Figure 12. Models of organic matter accumulation in the Early Carboniferous Dawuba Formation of the Qiannan Depression. Compared to Member 1, Member 2 exhibits a lower proportion of sapropelic components in kerogen (Table 2), indicating reduced abundance of primary producers (e.g., algae) (Figure 6c,d). Consequently, Member 2 was characterized by prolonged low productivity (Figure 4), which hindered organic matter accumulation (Figure 11c). Furthermore, persistent regression during the deposition of Member 2 [66], accompanied by a shallowing water column-resulted in sustained oxic bottom-water conditions (Figure 4), further impeding organic matter preservation (Figure 11e,f). However, relative to Member 1, Member 2 experienced a significant, gradual increase in terrestrial detrital influx (Figure 4). This, coupled with rapid accumulation of detrital minerals, promoted the rapid burial of generated organic matter, thereby facilitating organic matter accumulation to some extent (Figure 11a,b). Ultimately, organic-poor sediments predominated in Member 2 (primarily M-2 lithofacies), with only minor organic-containing deposits (mainly C and C-2 lithofacies) (Figure 12b).
Geosciences 15 00442 g012
Table 1. XRD result (%) of the Dawuba Formation samples from Well SD.
Depth (m)MemberQuartzPlagioclaseCalciteDolomiteSideritePyriteClay
1540.6021.000.0074.006.000.002.0010.00
1561.0021.000.0055.0013.000.002.0018.00
1601.0021.000.0059.009.000.002.0017.00
1645.0021.000.0063.0010.000.001.0017.00
1680.8021.000.0037.0030.000.002.0015.00
1701.0021.000.0062.0020.000.001.005.00
1751.0021.002.0037.0019.000.002.0019.00
1801.0021.002.0029.0033.000.002.0022.00
1851.0021.001.0032.0021.000.003.0027.00
1901.0021.001.0014.007.0010.003.0043.00
1930.1511.000.000.0014.400.000.9055.90
2011.0011.001.0013.005.003.000.0054.00
2041.0011.001.0017.005.007.000.0047.00
2103.0011.000.0016.006.005.000.0056.00
2150.0011.000.0015.008.007.002.0047.00
2202.0011.000.0011.007.006.004.0055.00
2253.0011.000.0010.007.007.004.0052.00
2303.0011.000.0013.008.007.003.0048.00
2355.0011.000.0018.009.007.003.0044.00
2399.0011.000.0011.005.008.004.0053.00
2450.0011.000.0012.006.009.003.0051.00
Table 3. TOC and major oxide contents (%) of the Dawuba Formation samples from Well SD.
Depth (m)MemberTOCSiO2Al2O3Fe2O3CaOMgOK2ONa2OTiO2P2O5MnO
1511.00 2 0.43 15.59 5.13 1.96 39.62 1.85 0.74 0.27 0.26 0.08 0.01
1540.60 2 0.54 34.41 13.25 2.92 23.49 1.52 1.71 0.74 0.53 0.06 0.02
1561.00 2 0.56 22.48 7.87 2.50 34.40 1.78 0.75 0.50 0.29 0.07 0.01
1581.00 2 0.66 19.01 5.85 2.16 38.19 1.44 0.71 0.36 0.27 0.08 0.01
1601.00 2 0.71 22.64 7.57 2.40 35.05 1.49 0.80 0.46 0.33 0.08 0.01
1631.00 2 0.76 20.15 6.01 1.99 37.41 1.52 0.69 0.37 0.28 0.09 0.01
1645.00 2 0.82 15.03 3.59 1.57 42.77 1.55 0.47 0.25 0.16 0.07 0.02
1680.80 2 0.83 40.41 11.59 4.42 18.53 3.05 2.10 0.42 0.51 0.44 0.05
1701.00 2 0.84 24.56 7.64 2.70 33.19 1.96 1.08 0.40 0.35 0.08 0.03
1721.00 2 0.87 22.37 6.30 2.66 34.83 1.97 1.05 0.30 0.30 0.13 0.04
1751.00 2 0.92 26.28 6.88 2.52 32.37 2.16 1.07 0.46 0.32 0.16 0.04
1771.00 2 0.94 21.64 4.35 1.74 37.92 1.61 0.65 0.40 0.23 0.07 0.03
1801.00 2 0.95 28.95 6.32 2.44 31.75 1.86 0.97 0.52 0.33 0.08 0.03
1821.00 2 1.02 33.75 9.16 3.28 26.46 2.45 1.46 0.54 0.46 0.10 0.03
1851.00 2 1.04 37.71 8.15 2.91 25.04 2.79 1.16 0.52 0.40 0.08 0.02
1871.00 2 1.19 42.74 9.90 3.26 20.83 2.78 1.49 0.56 0.46 0.10 0.02
1901.00 2 1.90 45.29 13.21 4.53 16.52 2.48 1.79 0.66 0.70 0.19 0.02
1930.15 1 0.73 48.52 19.31 8.83 8.50 2.57 2.45 0.79 0.74 0.06 0.09
1961.00 1 0.99 45.07 17.20 6.16 13.47 2.24 2.20 0.78 0.76 0.18 0.03
1991.00 1 1.08 50.03 19.87 8.65 5.63 1.87 2.29 0.97 0.99 0.29 0.03
2011.00 1 1.12 45.20 17.94 8.41 12.11 2.06 2.08 0.79 0.79 0.26 0.05
2041.00 1 1.13 46.92 16.89 9.01 11.69 1.86 1.97 0.68 0.83 0.29 0.08
2081.00 1 1.13 48.61 19.14 8.48 9.24 1.94 2.43 0.85 0.83 0.23 0.07
2150.00 1 1.15 48.85 18.16 7.35 9.99 2.02 2.33 0.78 0.78 0.23 0.05
2202.00 1 1.26 49.25 20.00 12.18 5.83 1.92 2.18 0.88 0.81 0.49 0.08
2253.00 1 1.27 49.99 20.35 11.51 5.69 1.92 2.23 0.89 0.81 0.46 0.07
2450.00 1 1.63 48.08 19.71 10.39 7.16 1.85 2.20 0.86 0.79 0.50 0.06
Table 4. Trace element contents (ppm) of the Dawuba Formation samples from Well SD.
Depth(m)MemberVCrNiCuSrLiBaScZnGaAsRbMoCoCsWTlPbThU
1511.00 2 24.89 22.96 13.43 5.33 837.57 27.23 102.39 9.73 12.87 9.69 5.30 61.67 0.82 4.29 3.45 1.03 0.19 8.18 7.38 1.91
1540.60 2 68.89 53.91 16.82 8.55 4262.17 92.18 336.11 15.43 25.30 20.71 20.10 162.13 0.42 7.92 10.39 1.30 0.35 14.68 18.26 2.11
1561.00 2 36.14 38.64 19.36 6.38 1333.56 65.17 161.46 6.61 23.76 7.92 7.40 69.50 1.26 5.77 4.75 0.72 0.20 10.47 8.35 1.91
1581.00 2 32.92 28.98 15.21 5.67 1105.26 39.91 93.66 6.12 27.79 5.95 8.00 65.09 1.19 4.02 4.10 0.66 0.20 8.96 8.42 2.05
1601.00 2 40.47 33.92 17.91 6.89 1076.34 52.79 473.62 10.70 30.19 13.43 6.70 69.84 1.10 5.34 5.18 0.84 0.21 10.76 10.57 2.31
1631.00 2 38.72 31.09 14.87 5.53 2006.34 37.30 285.72 3.10 19.02 5.07 7.90 58.28 1.06 4.02 3.74 0.60 0.16 10.05 5.31 1.60
1645.00 2 24.14 26.49 12.16 3.55 1175.20 7.14 40.02 0.68 15.12 2.69 5.90 31.41 1.26 1.77 2.00 0.47 0.14 6.13 1.70 1.61
1680.80 2 87.52 62.59 39.05 10.86 395.55 42.20 105.49 16.49 22.68 19.89 12.30 173.50 1.34 16.75 8.79 1.52 0.40 34.09 20.13 3.84
1701.00 2 45.65 170.23 21.54 8.08 1480.53 36.61 295.84 13.43 44.25 16.39 8.60 89.47 32.41 6.68 5.30 1.00 0.25 14.92 11.14 2.39
1721.00 2 50.15 36.48 16.81 5.13 1143.18 31.12 257.73 6.24 31.12 6.26 8.90 87.12 0.84 7.43 4.74 0.76 0.23 15.10 8.06 1.56
1751.00 2 52.01 39.25 13.00 4.55 1372.56 20.99 629.36 5.16 38.47 5.64 7.20 79.19 1.30 4.61 3.85 0.72 0.19 13.78 7.98 1.87
1771.00 2 30.39 23.10 10.00 2.76 1538.35 11.06 223.31 4.20 25.18 3.51 9.80 44.95 1.35 2.58 2.37 0.48 0.14 6.48 6.10 2.23
1801.00 2 51.03 40.33 15.26 5.34 1249.15 18.11 940.43 5.56 42.90 5.26 7.40 77.95 1.87 4.50 3.51 0.80 0.19 13.46 8.90 2.51
1821.00 2 77.89 53.51 16.58 5.57 1116.92 26.26 698.36 6.10 51.77 7.32 9.30 109.94 2.26 5.81 4.69 1.02 0.23 18.33 10.71 2.27
1851.00 2 63.44 51.04 16.60 4.62 789.73 23.39 1872.88 6.78 50.29 6.22 5.00 83.33 1.56 4.61 3.99 0.79 0.20 14.58 9.91 2.11
1871.00 2 71.96 57.05 21.74 7.38 924.34 21.62 3742.07 10.28 74.29 12.77 6.10 110.63 1.54 5.81 5.23 0.97 0.30 17.89 10.94 2.65
1901.00 2 87.41 67.12 24.52 11.16 844.98 58.65 6748.43 12.96 78.03 15.34 9.10 134.47 1.49 8.81 7.31 1.45 0.33 23.24 17.67 2.91
1930.15 1 165.54 90.95 57.65 12.29 298.34 128.04 225.90 18.85 103.82 24.38 9.60 35.72 0.75 8.49 8.57 2.10 0.39 32.20 20.63 3.77
1961.00 1 138.83 87.12 59.49 12.77 639.26 157.03 2350.27 16.76 221.90 21.61 15.60 164.88 2.03 13.47 9.93 1.92 0.39 30.11 21.70 3.76
1991.00 1 140.87 82.50 54.98 12.23 299.51 137.81 6306.56 25.82 91.38 35.95 21.90 48.75 1.43 17.70 7.00 2.81 0.42 29.63 23.18 4.28
2011.00 1 134.62 83.97 50.48 14.77 661.06 159.58 2472.06 18.54 110.37 26.35 23.20 144.70 2.76 16.60 9.82 1.99 0.41 33.99 23.46 3.78
2041.00 1 114.79 76.54 52.61 17.38 463.25 145.74 2333.31 30.79 126.96 36.52 21.90 168.26 3.12 23.51 11.51 2.35 0.49 49.31 27.98 3.98
2081.00 1 121.82 70.72 62.24 34.32 344.49 170.47 1624.97 21.31 83.08 30.56 21.10 71.51 2.31 26.74 10.38 2.67 0.57 134.76 26.66 3.78
2150.00 1 123.78 70.47 42.17 14.42 838.56 130.10 1363.96 19.61 71.46 29.44 16.10 83.48 0.95 14.86 10.15 2.03 0.46 31.39 23.98 3.73
2202.00 1 131.07 74.62 48.17 19.60 255.23 142.87 1723.16 18.54 163.18 31.06 24.20 34.98 1.66 21.67 8.56 2.04 0.52 54.54 20.08 3.49
2253.00 1 135.18 76.45 56.27 18.50 262.02 154.45 1286.22 17.29 271.62 28.31 22.70 41.61 1.52 22.64 9.07 2.10 0.53 47.53 20.70 3.49
2450.00 1 158.83 88.60 60.56 17.62 333.91 188.06 2651.43 16.36 129.58 22.69 22.80 37.87 1.26 21.59 9.40 2.19 0.55 61.39 21.55 3.48
Table 5. The analysis indices of the Dawuba Formation samples from Well SD.
Depth/mMemberDOPTV/ScSi/TiSi/AlBabio(ppm)P/AlSr/BaCo/Ti (×10−4)
1511.00 2 0.08 2.56 47.34 2.68 0.00 69.33 6.84 33.18
1540.60 2 0.05 4.46 50.65 2.29 0.00 20.35 15.72 27.12
1561.00 2 0.05 5.47 60.48 2.52 0.00 38.47 7.78 34.59
1581.00 2 0.03 5.38 54.60 2.87 0.00 58.26 10.27 35.08
1601.00 2 0.05 3.78 53.54 2.64 268.60 43.82 2.22 32.43
1631.00 2 0.05 12.49 56.90 2.96 62.02 65.72 8.26 34.49
1645.00 2 0.06 35.58 73.57 3.69 9.68 80.15 10.31 42.99
1680.80 2 0.08 5.31 61.75 3.07 0.00 165.40 3.32 41.91
1701.00 2 0.09 3.40 54.93 2.83 74.37 44.78 4.89 32.12
1721.00 2 0.02 8.04 58.69 3.13 0.00 88.75 6.19 37.67
1751.00 2 0.15 10.07 63.69 3.37 297.34 104.47 2.70 31.16
1771.00 2 0.21 7.24 73.37 4.39 95.40 66.23 6.25 32.69
1801.00 2 0.21 9.18 68.47 4.04 572.53 52.41 1.58 29.90
1821.00 2 0.20 12.76 56.73 3.25 291.77 49.01 1.88 27.73
1851.00 2 0.23 9.35 73.90 4.08 1393.64 43.52 0.48 26.45
1871.00 2 0.26 7.00 72.26 3.81 2689.85 45.15 0.31 26.81
1901.00 2 0.48 6.75 50.49 3.02 4346.25 62.38 0.18 26.99
1930.15 1 0.26 8.78 50.90 2.21 0.00 13.84 0.84 43.38
1961.00 1 0.24 8.28 45.83 2.31 1207.47 44.88 0.37 35.08
1991.00 1 0.67 5.46 39.18 2.22 7558.23 63.05 0.04 43.29
2011.00 1 0.52 7.26 44.26 2.22 1578.28 63.48 0.31 49.93
2041.00 1 0.39 3.73 43.78 2.45 1441.22 74.45 0.23 51.59
2081.00 1 0.39 5.72 43.44 2.24 1836.77 52.90 0.14 45.38
2150.00 1 0.39 6.31 43.66 2.37 1218.39 55.76 0.47 37.16
2202.00 1 0.28 7.07 48.78 2.17 999.38 106.58 0.17 80.66
2253.00 1 0.15 7.82 47.92 2.17 598.62 99.41 0.23 74.99
2450.00 1 0.31 9.71 47.24 2.15 1595.88 110.54 0.16 66.95
Disclaimer/Publisher’s Note: The statements, opinions and data contained in all publications are solely those of the individual author(s) and contributor(s) and not of MDPI and/or the editor(s). MDPI and/or the editor(s) disclaim responsibility for any injury to people or property resulting from any ideas, methods, instructions or products referred to in the content.