Abstract
Soil piping is the process by which subsurface water creates and enlarges channels, or “pipes,” within soil, enabling rapid and preferential flow beneath the surface. The collapse of these eroded pipes can lead to land degradation, gully formation, and potential damage to overlying infrastructure. While the structural consequences of pipe collapse are well recognized, there is limited understanding of the factors controlling pipe collapse and how water within the pipe influences moisture levels within a slope. This study used physical models of unsaturated slopes to examine how compaction conditions, pipe characteristics, and hydraulic conditions affect the progression of internal erosion. Models were created with different initial pipe sizes, moisture contents, densities at compaction and levels of pipe connectivity. Volumetric water content (VWC) sensors and cameras were used to monitor the slope response to subsurface flow, and measurements of pipe geometry were collected after the tests. Results showed that lower initial soil water content was more susceptible to pipe collapse, while higher water content showed improved pipe stability and sustained preferential flow. Fully connected pipes grew through erosion due to the pipe flow, while disconnected pipes grew mainly through local pipe collapse. Hydraulic equilibrium and soil erodibility affected the final pipe morphology more than the initial pipe size. These experimental results demonstrate that soil fabric and hydraulic connectivity of the pipe control the progression of piping, likelihood of collapse, and movement of water within the soil matrix.
1. Introduction
Subsurface water flow comes from a combination of preferential and soil matrix flow [1,2]. Preferential flow refers to the rapid and uneven movement of water and solutes through a relatively small portion of the soil volume, often via macropores, cracks, root channels, and other structural heterogeneities, bypassing the surrounding soil matrix [1,3,4]. Preferential flow has been found to carry more than 90% of subsurface water flow in some areas [5], but this percentage is governed by the connectivity of preferential water flow pathways [6]. Preferential flow pathways enhance the transport of water and solutes but also intensify internal erosion, particularly where hydraulic connectivity with the matrix is limited [7,8]. Preferential flow can occur in either vertical or lateral directions and under saturated or unsaturated conditions [1,3,4,9,10]. This flow includes mechanisms such as macropore flow, finger flow, funnel flow, and hydrophobicity-induced flow at the pore scale, as well as pipe flow, return flow, throughflow, depression-focused flow, and flow along the soil–bedrock interface [1,2].
One of the most significant preferential flow pathways for hillslope and catchment hydrology is soil pipes [11,12,13]. Soil piping occurs as subsurface flow leads to the removal of soil particles and the formation of subsurface voids (pipes), which are only visible at the surface when a roof collapses [14,15]. Pipe flow can bypass large portions of the soil profile, significantly affecting infiltration, moisture redistribution, and runoff generation [16]. These pipes form through fissuring, root growth, animal burrowing, chemical dissolution, internal erosion, and other biogenic activities [17]. The development and connectivity of soil pipes are influenced by geomorphology, soil structure, and anthropogenic activities, further affecting hydrological processes at both slope and catchment scales [18].
Soil piping is a significant contributor to land degradation [19], gully formation [20], and soil loss during storm events [21,22], resulting in significant environmental, societal, and infrastructural impacts [19]. Clogging or blocking of soil pipes due to pipe collapse can also lead to landslides, debris flows, and gullies [20,21,23,24,25]. Pipe formation is influenced by factors such as topography, geological characteristics, climate, soil type, water content, hydraulic gradient, vegetation cover, and slope gradient [13,20,26]. Soil pipes typically develop above bedrock or impermeable layers, often running parallel to them [20,27]. Soil pipes may form single, isolated, interconnected, or dendritic systems and are classified as continuous or disconnected pipes based on hydraulic connectivity [7,28,29]. Despite the widespread occurrence of such processes, the mechanisms controlling the evolution and stability of soil pipes remain poorly understood.
The onset and progression of soil piping are influenced by pipe size and hydraulic connectivity [4,7]. Hydraulic connectivity, or the ability of water to sustain flow through the pipe, is crucial for ongoing erosion, as it maintains the hydraulic gradient and supplies water to eroding zones [3,4,7]. If connectivity is interrupted by soil swelling, collapse of the pipe roof, or effective filtering, the process may stabilize or halt [21,29]. Previous studies have shown that pipes require higher hydraulic gradients to initiate erosion due to increased shear stress, but as pipes enlarge, flow resistance decreases, and erosion accelerates if hydraulic connectivity is maintained [8,21,29,30,31,32,33]. Thus, while pipe size controls the local erosive forces and the rate at which erosion can progress, hydraulic connectivity determines whether these forces are sustained over time, making both factors critical and interdependent in the development and potential failure from soil piping. Therefore, understanding the relative impact of pipe size and hydraulic connectivity is essential for predicting the onset and progression of piping in soil.
The properties of the surrounding soil matrix are widely recognized as critical factors influencing soil piping in cohesive soils, as they directly impact both the stability and potential collapse of soil pipes [4]. Fell et al. [34] found that water content and density at the time of compaction, which control the soil fabric, play a key role in determining the likelihood of pipe stability or collapse within embankments. Additional research [35,36,37] demonstrated that matrix properties, such as density and moisture content, significantly affect the erodibility and rate of soil erosion of cohesive soils. Afolayan et al. [38] investigated how pipe collapse could lead to landslide initiation in model slopes. Afolayan et al. [39] demonstrated that soil moisture content plays a critical role in the progression and collapse of soil pipes in unsaturated slopes, identifying a specific range of water contents where piping is most likely to occur. Few studies have directly investigated how the properties of the surrounding soil matrix influence the stability of eroded pipes of different sizes.
While previous studies have advanced our understanding of internal erosion and its impact on hillslope hydrology, the combined effects of unsaturated conditions, pipe size, and hydraulic connectivity on the progression of soil pipes are not fully understood. To address these gaps, this study investigates three primary research questions: (1) How do variations in initial soil water content and dry density influence the stability and evolution of pre-existing voids under unsaturated conditions? (2) What is the relative impact of pipe size and hydraulic connectivity on the initiation and progression of soil piping? (3) How do the interactions between the soil matrix and preferential flow paths control erosion rates and void enlargement? To answer these questions, we conducted a series of physical model tests on unsaturated slopes to investigate the impact of soil matrix properties and pipe condition on internal erosion in unsaturated slopes.
2. Materials and Methods
2.1. Test Soil
We constructed the model slopes using soil obtained from the Auburn, Alabama, USA area. The soil in this region is primarily residual and part of the Piedmont province [40] with primarily kaolinitic clays [41]. The soil was classified as a clayey sand (SC) using the Unified Soil Classification System (USCS) with a liquid limit of 67, a plasticity index of 20, and a fines content of 21.5% based on wet sieving [42]. The grain size distribution curve for the soil is shown in Figure 1a. Compaction characteristics were determined using the Standard Proctor test [43], which showed an optimum moisture content (OMC) of 13% and a maximum dry density (ρd,max) of 1.90 Mg/m3 (Figure 1b).
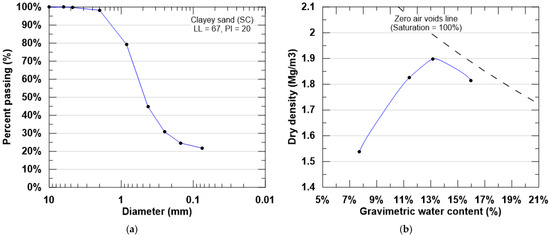
Figure 1.
(a) Grain size distribution curve and (b) Standard Proctor compaction curve for the tested soil.
We also measured the soil–water characteristic curve (SWCC) of the fill material using the HYPROP and WP4 devices from the Meter Environment Company (Figure 2). We tested samples compacted to 79% (ρd = 1.51 Mg/m3) and 93% (ρd = 1.76 Mg/m3) relative compaction (RC) and an initial gravimetric water content (GWC) of either 9% (4% dry of optimum) or 12% (1% dry of optimum). The relative compaction values were selected to capture a range of densities and expected strengths. We selected water contents dry of optimum as this condition is most susceptible to piping [34,35]. Future work is needed to examine the patterns over a wider range of water contents and densities. The SWCC of the tested soil at the lower RC exhibits a distinct bimodal pattern, which tends to correlate with a bimodal pore distribution [39]. Oualmakran et al. [44] also found that soils compacted dry of optimum tended to show a bimodal pore size distribution, while soils compacted wet of optimum showed a unimodal distribution. This is consistent with the reduction in the bimodal shape for the specimen compacted near optimum water content and the denser specimen. Pore size distributions were not directly measured for the soils tested in this study, but this should be considered for future work. The HYPROP also provides estimates of the unsaturated hydraulic conductivity of the soil, which is shown in Figure 2b. The looser specimens showed higher conductivities near saturation, while the specimen compacted near the optimum water content showed the highest conductivity at larger suction values.
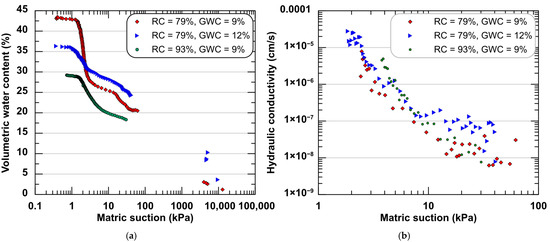
Figure 2.
Measured (a) SWCC data and (b) hydraulic conductivity data for the SC soil at different initial gravimetric water contents (GWC) and relative compactions (RC).
2.2. Experimental Design and Methodology
Our objective was to model the response of a natural soil pipe near an outlet, so we conducted a brief review of common features of soil pipes to design our experiment. Soil pipes typically form above bedrock or impermeable layers, developing parallel to these hydraulic barriers [21,45,46], and their outlets occur at depths of 15 to 80 cm, but can range from a few centimeters to 20 m [45,47]. Pipe diameters vary from 3 to 71 mm [48], with lengths between 2 and 61.8 cm, sometimes reaching more than 5 m [12,16]. Soil pipes are commonly found on slopes with a gradient of 0° to 30°, with 90% of collapsed pipes occurring in gradients of 4.6° to 13.5° [49]. Based on this information, we selected a steel container measuring 120 cm in length, 62 cm in width, and 62 cm in height for our experiments. The model slope had a maximum height of 45 cm and a base length of 94 cm (Figure 3). The container was placed on an inclined base to give a slight downward slope (4 degrees). A 1 cm thick layer of modeling clay was placed over a foundation of expanded polystyrene to simulate an impermeable base. Pre-formed soil pipes were introduced by placing either a 4 mm or 12 mm metal rod along the slope base before compaction. This diameter was selected as it is near the lower end of the range of diameters of soil pipes and would represent either a small pipe or a large macropore.
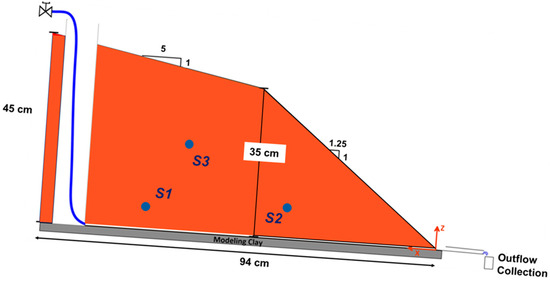
Figure 3.
Cross-section of the model. The model width (y-direction) is 62 cm. Slope is drawn with a base angle (θ) of 4 degrees. The locations of the three volumetric water content sensors (S1–S3) are indicated with blue circles.
We investigated three pipe conditions: a homogeneous slope with no soil pipe (T1), slopes with a full pipe across the model (T2–T8), and slopes with a partial pipe that terminated at some point in the slope (Tests P1–P4). The test parameters are summarized in Table 1. Tests P1–P3 had an initial pipe that was open at the toe of the slope and extended 70 cm upslope, terminating 13.5 cm from the water inlet. Test P4 utilized a shorter (60 cm) open pipe starting at the slope toe and terminating 23.5 cm from the water source. These conditions represent a range of scenarios observed in natural hillslopes, ranging from a control state to a fully developed pipe. A 10 cm (4 inches) diameter PVC standpipe was installed at the upslope boundary to deliver subsurface flow along the hydraulic barrier and into the initial void for the full pipe tests (Figure 3). The size of the standpipe was selected to be larger than the incoming pipes to avoid any flow restrictions at the inlet.

Table 1.
Experimental parameters used to investigate the influence of matrix properties and pipe conditions on preferential flow.
After placing the metal rod and PVC pipe, we prepared the soil at the required GWC (Table 1) and used a mixer attachment on an electric drill to thoroughly mix the soil. We placed the soil in 2.5 cm lifts and compacted the slope using flat-face hand tampers with 120 drops per lift to achieve the desired ρd throughout the slope height using the under-compaction method [50]. We weighed the soil required for each lift and used marks on the sides of the container to ensure the lifts were placed at the correct thickness. A temporary board was placed at the front of the container to keep the soil in place. To confirm the accuracy of the compaction method, samples were taken using rings at different lifts to verify the density and moisture content. Following compaction, we shaped the surface of the slope to achieve slopes of 1:5 (V:H) at the top and 1:2.5 (V:H) at the toe of the slope (Figure 3). We then carefully removed the rod by pulling it from the slope before starting the test.
2.3. Instrumentation and Monitoring
We monitored the behavior of the slope using a digital camera to record the slope profile before, during, and after the introduction of subsurface flow to identify the timing and progression of erosion and slope movements. We used Teros 10 and 11 volumetric water content (VWC) sensors (Meter Group) to monitor changes in water content at three locations (S1, S2, and S3) in the slope (Table 2 and Figure 3). Sensor S1 was placed near the slope base and the inflow standpipe to monitor changes in VWC from concentrated pipe flow. Sensor S2 was positioned 7.5 cm above the pipe axis to assess lateral pore water redistribution during flow events. Sensor S3 was located mid-slope to observe water movement in the upper slope zone. Care was taken during installation and compaction to prevent potential damage to the sensors by avoiding sudden or excessive forces on them. Data from these sensors was collected using the ZL6 Data Logger (Meter Group), and recordings were taken at 1 min intervals. We used the default calibration for the VWC sensors. We verified that this calibration was appropriate for our soil by preparing thirteen specimens at known densities and water contents and compared the measured VWC values with those from the sensor. The comparison showed good agreement (R2 = 0.99) with some deviations at VWC values below 5% and above 35%. This covers the range of values observed in our experiments, and so a soil-specific calibration was not needed for this soil.
Table 2.
Sensor locations in the slope. Distances are measured from the downslope edge of the slope (see coordinate system in Figure 3).
2.4. Test Procedure
To simulate subsurface seepage, a PVC standpipe was placed at the upslope end of the container to allow us to introduce water into the void created by the metal rod (Figure 4). The diameter of the standpipe was 10 cm, and a notch was cut at the base of the standpipe to fit over the metal rod during model construction. A flow rate ranging from 10 mL/s to 170 mL/s was used for the full pipe tests, falling within the range of flow observed in natural soil pipes, where pipe flow is predominantly driven by lateral subsurface flow associated with groundwater seepage [51,52]. We used a gate valve with pre-measured markings to set and maintain flow into the soil pipe (Figure 4b). For the experiments with no pipe or a partial pipe, a constant head boundary condition was used instead, with the water level set at the top of the slope.
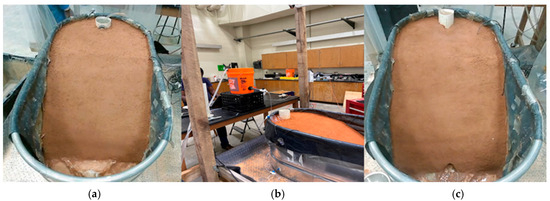
Figure 4.
Photos showing the stages of slope testing, including: (a) completed slope at the start of the test, (b) upper portion of the slope including the container for flow introduction, and (c) slope with eroded pipe during testing.
Key events during the experiments were documented through post-test video analysis, including the emergence of seepage flow at the pipe outlet (Figure 4c), erosion at the interface between the slope and the container, and evidence of erosion at the slope toe. After each test, changes in the pipe’s dimensions were measured during excavation using rulers and tape measures at multiple points along the pipe axis to capture its evolution. This semi-quantitative method provided insights into changes in pipe features due to flow; however, its precision could be limited by the tape resolution (0.5–1 mm) and potential inconsistencies in the measurement approach between tests. We also employed a bore camera during and after each test to visualize and document the changes in the pipe morphology, capturing both video and still photographs of the changes caused by erosion, sediment deposition, and collapse. The bore camera was inserted from the toe of the slope and care was taken during the insertion to prevent the pipe from growing or collapsing due to the camera. The camera was then slowly advanced while recording to capture the inside geometry of the pipe. Still images were collected periodically when changes in size or roughness were observed.
3. Results
We conducted twelve experiments to evaluate how initial water content and density affect the soil matrix response to pipe flow, and to examine how variations in initial pipe diameter and hydraulic connectivity influence the development of internal erosion within a clayey sand slope. The following sections first provide a detailed discussion of tests T1–T4, which assess matrix response using a 4 mm initial pipe, followed by tests T5–T8, which explored the effects of increasing the initial pipe diameter to 12 mm. We then present results from tests P1-P4, which examine how the hydraulic connectivity of the pipe influences slope behavior. The slope and pipe response for the tests are summarized in Table 3.
Table 3.
Internal erosion and preferential flow in slopes due to different compaction and pipe conditions.
3.1. Response of Soil Matrix to Water in the Pipe
We selected tests T1-T4 to discuss the response of the soil matrix to water in the pipe during the initial stage of the test. Test T1 was the control slope (no initial void/pipe) and had an initial GWC of 10.4% and a ρd of 1.51 g/cm3. Tests T2 and T3 were conducted at initial water contents of 9.1% and 12.2%, respectively, with an initial void of 4 mm that extended from the inlet to the outlet (full pipe). Test T4 also had a full pipe, but with a ρd of 1.76 g/cm3 and an initial GWC of 11.4%. The effect of pipe responses on the evolution of VWC based on the different pipe responses is shown in Figure 5.
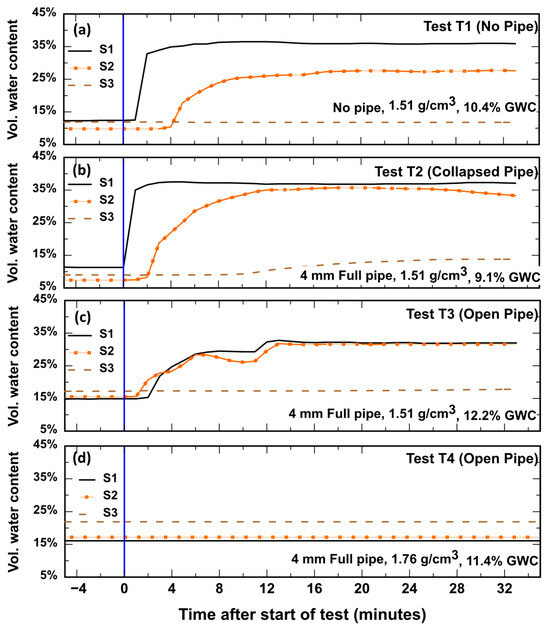
Figure 5.
Effect of pipe response on the evolution of volumetric water content in the slope for tests (a) T1, (b) T2, (c) T3, and (d) T4. Sensor locations are shown in Figure 3.
In test T1, no visible erosion or soil movement was observed at the start of the test. The VWC sensor closest to the standpipe (S1) showed an immediate response to inflow, while Sensor S2 did not respond for approximately 2 min. Sensor S3, which is located higher on the slope, showed no response (Figure 5a). This response was consistent with a uniformly advancing wetting front, indicative of matrix-dominated flow. The delay in response from sensors S2 and S3 (Figure 5a) was due to these sensors being further from the inlet, which confirmed the absence of preferential flow pathways in the homogeneous slope. Overall, the observations were consistent with expectations for steady flow through a uniform slope.
Test T2 had a full pipe to simulate an open preferential flow path through the slope. No flow was observed at the pipe outlet for the first 6 min of the test, indicating that a partial collapse of the pipe likely blocked the flow soon after the test began. This collapse likely occurred as the water from the pipe infiltrated the soil matrix and reduced the suction to the point where the soil could no longer support the open void. No erosion occurred, and the size of the pipe at the outlet was unchanged during the test. All three sensors exhibited faster responses than in test T1 (Figure 5a,b), indicating that even collapsed flow paths can facilitate faster water movement in the slope compared with a homogeneous slope.
Test T3 had a higher initial GWC than T2 and showed relatively constant flow from the outlet of the pipe, indicating the pipe remained open throughout the test. The diameter of the pipe at the exit grew during the test, and we observed sediment in the outflow, indicating internal erosion was occurring. The sensor response was also different with sensor S2 responding before sensor S1 (Figure 5c). Sensor S2 is further from the inlet, but closer to the pipe (Table 2), so the faster response indicates water was moving from the pipe into the matrix rather than moving downslope from the inlet, as was observed in tests T1 and T2. VWC at sensors S1 and S2 rose more slowly and plateaued at lower VWC than in the previous tests, while Sensor S3 did not change during the test (Figure 5c). This demonstrates that the continuous preferential flow path limited the height of the water table compared with the homogeneous case (Test T1) or the collapsed pipe (Test T2).
The difference in behaviors observed in tests T2 and T3 showed that GWC at the time of compaction played a crucial role in pipe stability. The slope compacted at ~12% GWC maintained a stable void, while the pipe in the slope with the lower GWC collapsed. The collapse of the pipe shifted the flow regime from preferential to matrix-dominated flow. This is consistent with the findings of Afolayan et al. [39] who tested small slopes using this same soil and found that the progression of piping occurred at GWC greater than 10%.
Test T4 was similar to test T3, but with a higher density (ρd = 1.76 g/cm3). In test T4, flow emerged at the pipe exit immediately after the start of the test and stayed consistent, indicating the pipe remained open. Erosion expanded the void to approximately 30 mm at the outlet, at which point it stabilized. All three VWC sensors remained constant (Figure 5d), indicating that the pipe remained open and all flow was in the pipe. This lack of response is likely due to the denser soil having a lower permeability near saturation (Figure 2b), which limited water infiltration into the surrounding matrix.
The final pipe geometry was measured at both the outlet and along the pipe length during excavation of the slope for the tests where the pipe remained open (Figure 6). The final pipe widths for tests T3 and T4 were similar along most of the pipe’s length, despite differences in initial density. Noticeable differences in pipe size were observed only within the first few centimeters of the outlet. Both tests produced horizontally elliptical pipe morphologies (Figure 7), consistent with [47,51], which documented similar shapes for pipes that formed at an interface with a hydraulic barrier. In both tests, the sides of the pipe were relatively smooth and uniform (Figure 7), indicating that the flow rate was sufficient to remove any protruding particles and to clear away the eroded sediment.
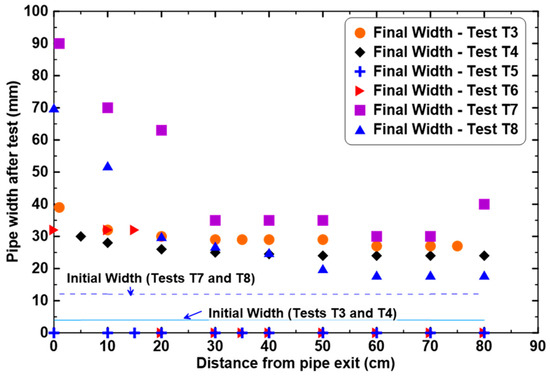
Figure 6.
Distribution of pipe diameter for tests T3-T8 along the length of the soil pipe at the end of the experiment. The pipe width was measured by dissection of the soil in the physical model.
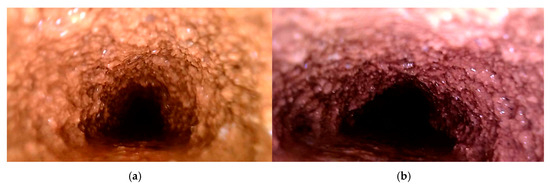
Figure 7.
Photos of the pipe interior from a bore cam for (a) test T3, (b) test T7.
3.2. Effect of Initial Pipe Size
We performed four additional tests (T5–T8) to study the effects of using a larger initial pipe size of 12 mm (compared with 4 mm in the previous tests) on the model behavior (Table 3). Tests T5–T7 were performed at a ρd of 1.51 g/cm3 and target GWC of either 9 or 12%. Test T8 used the higher ρd (1.76 g/cm3) and a GWC of 8.5%. The evolution of VWC for these tests is shown in Figure 8.
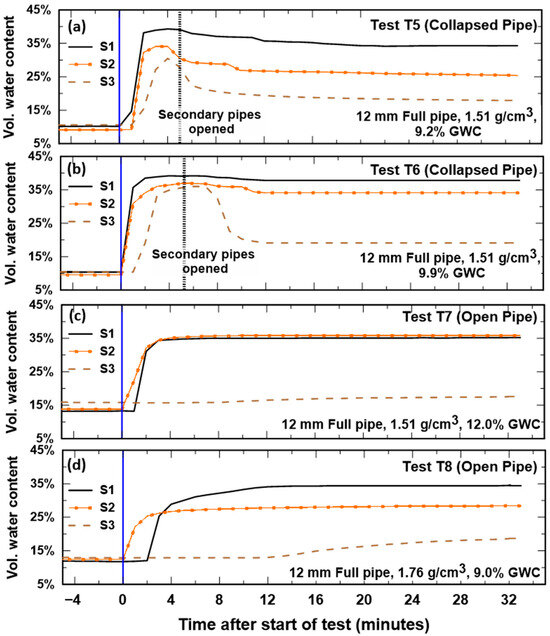
Figure 8.
Effect of pipe response on the evolution of volumetric water content in the slope for tests (a) T5, (b) T6, (c) T7, and (d) T8. Sensor locations are shown in Figure 3.
Tests T5 and T6 had similar initial conditions and responses despite test T6 using a slightly higher GWC (9.9% for T6 and 9.2% for T5). No flow was observed at the end of the pipe for the first several minutes of either test. The VWC sensor closest to the inlet (S1) responded immediately to the inflow, while S2 and S3 showed a delayed increase in water content (Figure 8a,b). This behavior is similar to test T2 and indicates that the pipe was unstable in tests T5 and T6, likely due to a loss of suction in the surrounding soil. After approximately five minutes, new flow paths opened along the sides of the container as the water reached the edges and began eroding the soil. The opening of these flow paths resulted in a sharp decrease in VWC at Sensors S2 and S3, as the newly formed preferential flow paths facilitated drainage. No contact erosion was observed in tests T1 and T2, indicating that the larger initial pipe size resulted in more flow into the slope.
Test T7 was performed at the same ρd as tests T5 and T6, but with a higher initial water content (12.04% GWC). After the flow was introduced, sensor S2 responded first, followed by S1 (Figure 8c), as was observed with the open pipe in test T3. The diameter of the pipe at the exit grew during the test, and sediment was observed in the outflow, indicating internal erosion was occurring. These observations were similar to those of test T3, but the final VWC values were higher than those of test T3 for all three sensors.
Test T8 was compacted to a higher ρd (1.76 g/cm3), but with a similar GWC to test T5. Sensor S2 was closer to the pipe and responded almost immediately after the flow started, while sensor S1 was delayed by approximately 2 min, and sensor S3 responded after approximately 12 min due to its location higher in the slope. The diameter of the pipe at the exit grew during the test due to internal erosion. These results differ from test T4, which had a similar ρd but a smaller initial pipe size and higher initial GWC. In test T4, there was no response from any of the VWC sensors, indicating that the higher initial water content and smaller pipe diameter limited the movement of water in the matrix compared with test T8. This demonstrates that both pipe size and compaction properties play key roles in the interaction between the matrix and pipe.
Following tests T7 and T8, we excavated the slopes to measure the pipe width (Figure 6). The pipe width at the outlet was larger and more varied than observed in tests T3 and T4, which may be partially attributed to the larger pipe size but was also influenced by differences in the modeling clay surface at the pipe outlet. However, the geometry between all four tests became similar (width of approximately 30 cm) approximately 25 cm from the pipe exit (Figure 6), where the influence of the exit conditions decreased.
3.3. Effect of Hydraulic Connectivity
We performed four partial pipe tests (P1–P4) with an initial 12 mm void, which terminated before the water inlet, to compare with the homogeneous and full pipe conditions in the previous section. The partial pipe scenario is meant to represent a slope with an eroded pipe that initiated at an unfiltered exit and progressed upslope but has not yet established full hydraulic connectivity with other preferential flow paths. The effect of pipe responses on the evolution of VWC is shown in Figure 9.
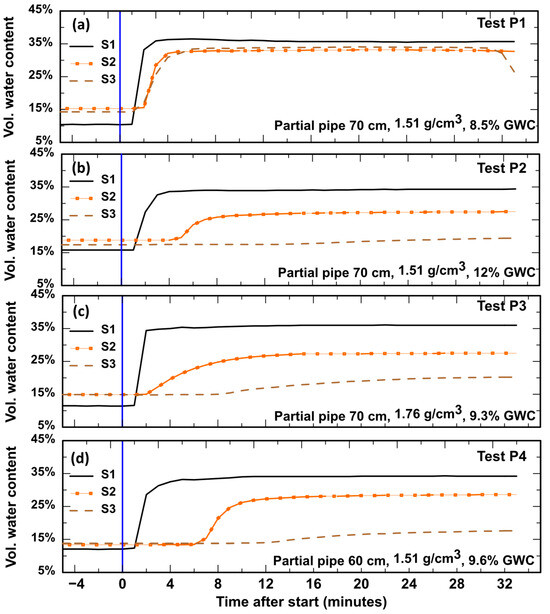
Figure 9.
Changes in volumetric water content under different conditions for tests (a) P1, (b) P2, (c) P3, and (d) P4. Sensor locations are shown in Figure 3.
Test P1 was constructed at a ρd of 1.51 g/cm3 and a target GWC of 9% with a partial pipe that terminated 20 cm before the water inlet. After starting the test, no visible erosion or soil movement was observed. VWC sensor S1 responded first, followed closely by sensors S2 and S3 (Figure 9a), with all the sensors reaching VWCs near 35%. Approximately 15 min after the flow was introduced, water emerged at the pipe outlet, indicating that flow was moving from the slope into the pipe. As the test continued, the diameter of the pipe at the exit increased, eventually growing to nearly 90 mm. The pipe growth was less uniform than in the previous tests and seemed to be occurring due to local collapse of the pipe walls rather than erosion.
Test P2 had a similar ρd to test P1 but a higher initial water content (12%). Similarly to test P1, no visible erosion or soil movement was observed at the start. Sensor S1 responded first, but Sensors S2 and S3 exhibited a delayed response compared to test P1 (Figure 9a,b). Flow was observed at the exit of the pipe after 9 min, indicating that water was flowing from the soil matrix into the pipe. The pipe diameter at the exit remained constant throughout the test, unlike in test P1. The higher GWC at compaction reduced the likelihood of pipe collapse, as was observed in the full pipe tests (T3 and T7).
Test P3 had a higher dry density at compaction (1.76 g/cm3) than test P1, with a similar initial GWC (9.3%). Similarly to test P1, no visible erosion or soil movement was observed at the start of the test, but the sensor response was different. Sensor S1 (located closest to the inlet) responded first, closely followed by sensor S2 (located directly above the pipe). Sensor S3 showed a change in water content 10 min after the test began, compared to just 2 min in test P1 (Figure 9a,c). Flow was observed at the exit of the pipe 3 min after flow was introduced and the diameter of the pipe grew, eventually reaching 35 mm at the outlet. Similarly to test P1, the pipe growth seemed to be driven by local collapse rather than erosion.
Finally, test P4 had similar initial conditions to P1, but with a shorter (60 cm) pipe. Similarly to test P1, no visible erosion or soil movement was observed at the start of the test and VWC sensor S1 responded after 2 min. Sensors S2 and S3, however, took longer to respond and stabilized at lower values than test P1 (Figure 9d). Flow was observed at the exit of the pipe 15 min after flow was introduced, but the pipe diameter at the exit did not change. This difference in behavior between tests P1 and P4 could be attributed to the larger distance between the inlet and open pipe, which reduced the hydraulic gradient and led to lower VWC at Sensors S2 and S3.
After the tests, we measured the final pipe geometry at the outlet and along the pipe length for all four tests (Figure 10). The pipes in tests P2 and P4 did not show any measurable change from the initial geometry. For test P1, the pipe grew at the outlet but collapsed approximately 40 cm from the outlet. Bore camera images from the open section (Figure 11a) revealed a more irregular geometry with many protruding particles compared with tests T3 and T7 (Figure 6). We also observed sediment on the bottom of the pipe (Figure 11a), indicating that the flow rate was insufficient to transport this sediment. We believe these differences are caused by the pipe growth resulting from local pipe collapse rather than erosion by flowing water, which would have removed these protruding particles and the sediment along the bottom of the pipe. Similar observations were made during the excavation of test P3 (Figure 10 and Figure 11b), but the pipe was smaller, indicating that less collapse occurred.
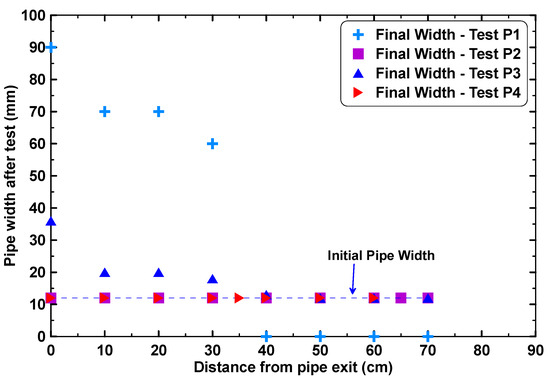
Figure 10.
The pipe diameter for P1–P4 tests will be distributed along the length of the soil pipe at the end of the experiment. The pipe width was measured by dissection of the soil in the physical model.
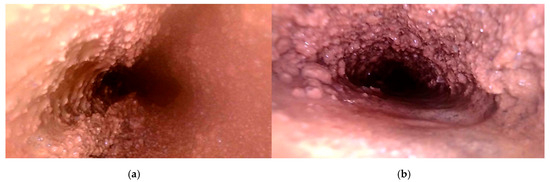
Figure 11.
Photos of the pipe interior from a bore cam for (a) test P1, and (b) test P3.
4. Discussion
Our findings demonstrate that initial GWC was a primary control on pipe stability for the range of conditions in this study. Tests conducted at lower GWC and lower RC with either full (T3, T5, and T6) or partial pipes (P1) showed pipe collapse, while tests at higher RC or higher initial GWC showed more stable pipes. We speculate that this difference in behavior is caused by differences in soil fabric, which resulted in the soil compacted at lower RC and dry of optimum to be more susceptible to collapse upon wetting. Additional tests to examine pipe stability at a wider range of densities and water contents, along with imaging studies to directly measure the soil fabric, are needed to quantitatively assess these effects and to develop methods to predict the likelihood of pipe collapse based on the hydromechanical properties of the soil.
Hydraulic connectivity is a critical factor in the progression of piping erosion, while initial pipe diameter appeared to be a secondary effect for the conditions examined in this study. In continuous pipes connected to the water source (e.g., tests T3 and T7), enlargement resulted primarily from erosion caused by pipe flow. By contrast, in disconnected pipes (e.g., tests P1 and P3), growth was primarily due to pipe collapse rather than erosion by flowing water. The observed behavior aligns with field observations of pipe networks in natural slopes, where connectivity and spatial arrangement of pipes influence hillslope hydrology and erosion [7,21,29]. Stable flow occurs in open, connected pipes, while collapse interrupts flow, leading to matrix saturation and potential destabilization of slopes. Further work is needed to verify that pipes in the field also experience growth due to collapse. One potential approach to distinguish between erosion and collapse is to examine the roughness of the sides of the pipe and the pipe geometry. In this study, pipe growth caused by local collapse led to more irregular geometries, wider pipes, and rougher side walls with many protruding particles. Pipes that had grown through erosion showed more elliptical geometries and smoother sides as the protruding particles were removed by the water.
The experiments presented in this study have several important limitations. The experiments were limited to a single soil type, two initial pipe diameters, two compaction densities, and two water contents. Future work should consider other soil types along with a broader range of compaction states and initial pipe diameters to develop a more complete understanding of how these factors influence pipe stability and erosion. Our experiments did not consider the influences of vegetation or natural hydrological processes, such as rainfall infiltration. These processes can generate preferential flow paths, accelerate infiltration, alter matrix properties, and ultimately affect pipe development and response. Future studies could consider effects of vegetation, roots, soil heterogeneity, and dynamic hydrological conditions on the piping process and potential for collapse. The observations in this study were mostly qualitative and incorporating more quantitative observations from image analysis, geophysical tests, and additional subsurface instrumentation would improve both the resolution and quality of the data collected. Additional analyses to understand the rate of wetting front advance and potential three-dimensional effects are also needed to apply these findings to field cases.
One important finding from this study is that both erosion and local collapse can drive pipe growth, but current approaches to assess piping focus only on comparing hydraulic shear stress to erosion resistance [53,54]. Some breach models for internal erosion (e.g., DLBreach) consider roof stability over eroded pipes, but widening of the pipe is still driven by hydraulic forces rather than local collapse. Other analytical models for piping (e.g., [55]) account for local collapse by considering arch stability, but do not account for the unsaturated conditions common in areas where piping is occurring. This is an important area for future research and will require a better understanding of the factors that control the stability of pipes in unsaturated slopes.
5. Conclusions
We conducted a series of experiments using physical slope models to investigate how soil fabric, pipe characteristics, and hydraulic conditions affect the progression of soil piping (internal erosion) in an unsaturated clayey sand slope. A thin metal rod was used to create an initial void in the model slope, and flow was introduced into the upslope to simulate subsurface flow. The slope response was monitored using VWC sensors and a video camera. Based on our investigations, the following conclusions are drawn:
- Slopes compacted with a GWC near optimum and at higher dry densities had more stable soil pipes, promoting continuous preferential flow and reducing the likelihood of pipe collapse. In contrast, slopes with a lower GWC (4% dry of optimum) had more pipes collapse. Pipe collapse shifts the flow regime toward matrix-dominated pathways and increases the VWC in the slope compared with cases with open pipes.
- The initial size of the pipe influences the interaction between the preferential flow path and the surrounding soil matrix, but did not change the final pipe diameter or the likelihood of pipe collapse for the sizes examined in this study (4 and 12 mm). Initial pipe size did affect the VWC distribution in the slope and the extent of interaction between the pipe and the matrix.
- A fully connected preferential flow path enables rapid water movement and pipe enlargement through internal erosion. In contrast, when pipes are disconnected or partially collapsed, preferential flow and pipe growth still occur, but pipe growth is due to local collapse rather than erosion.
- Final pipe geometry along most of the pipe’s length tended to converge regardless of initial soil conditions or pipe size for the conditions examined in this study. This suggests that hydraulic equilibrium and soil erodibility were the primary factors shaping the ultimate morphology of soil pipes in these experiments.
Our findings are based on a limited number of cases and are not sufficient to perform formal statistical analysis or error analysis. The findings of this study are only valid for range of tested conditions and cannot be generalized without additional study. In addition, our observations of pipe collapse were limited to external observations, but more advanced image analysis, internal instrumentation, or geophysical imaging could be used to more directly assess the timing and magnitude of collapse events. This remains an important area for future research.
In our experiments, initial matrix water content, pipe geometry, soil compaction, and hydraulic connectivity govern the evolution of internal erosion and preferential flow. These factors determine the progression and continuation of preferential flow and internal erosion features in unsaturated slopes. One important finding from this study is that both erosion and local collapse can cause the pipe to widen. The potential for local collapse to drive widening of the pipe is not considered in current analysis approaches for piping, and future methods should include this mechanism in addition to erosion.
Author Contributions
Conceptualization: J.M.; methodology: J.M. and O.A.; investigation: O.A. and A.L.; resources: J.M.; data curation: O.A. and A.L.; writing—original draft preparation: O.A.; writing—review and editing: A.L. and J.M.; supervision: J.M.; funding acquisition: J.M. All authors have read and agreed to the published version of the manuscript.
Funding
Funding for this work was provided by the National Science Foundation under award number CMMI 2047402, including REU supplements. Any opinions, findings, and conclusions or recommendations are those of the authors and do not necessarily reflect the views of the National Science Foundation.
Data Availability Statement
The experimental data from this study are available through the https://doi.org/10.17603/ds2-c5sm-1c95 (accessed on 19 May 2025).
Acknowledgments
The authors appreciate the support provided by India Warren, Evelyn Chavez, and Taylor Renfroe during the experimental testing and by Leila Rahimikhameneh with the characterization of the tested soil. Three anonymous reviewers provided valuable feedback on the manuscript.
Conflicts of Interest
The authors declare no conflicts of interest.
References
- Lin, H. Linking principles of soil formation and flow regimes. J. Hydrol. 2010, 393, 3–19. [Google Scholar] [CrossRef]
- Zhang, Y.; Zhang, Z.; Ma, Z.; Chen, J.; Akbar, J.; Zhang, S.; Che, C.; Zhang, M.; Cerdà, A. A review of preferential water flow in soil science. Can. J. Soil Sci. 2018, 98, 604–618. [Google Scholar] [CrossRef]
- Nimmo, J.R. Preferential flow occurs in unsaturated conditions. Hydrol. Process. 2012, 26, 786–789. [Google Scholar] [CrossRef]
- Nimmo, J.R. The processes of preferential flow in the unsaturated zone. Soil Sci. Soc. Am. J. 2021, 85, 1–27. [Google Scholar] [CrossRef]
- Leaney, F.W.; Smettem, K.R.J.; Chittleborough, D.J. Estimating the contribution of preferential flow to subsurface runoff from a hillslope using deuterium and chloride. J. Hydrol. 1993, 147, 83–103. [Google Scholar] [CrossRef]
- Anderson, A.E.; Weiler, M.; Alila, Y.; Hudson, R.O. Subsurface flow velocities in a hillslope with lateral preferential flow. Water Resour. Res. 2009, 45, W11407. [Google Scholar] [CrossRef]
- Nieber, J.L.; Sidle, R.C. How do disconnected macropores in sloping soils facilitate preferential flow? Hydrol. Process. 2010, 24, 1582–1594. [Google Scholar] [CrossRef]
- Wilson, G. Understanding soil-pipe flow and its role in ephemeral gully erosion. Hydrol. Process. 2011, 25, 2354–2364. [Google Scholar] [CrossRef]
- Jarvis, N.; Koestel, J.; Larsbo, M. Understanding Preferential Flow in the Vadose Zone: Recent Advances and Future Prospects. Vadose Zone J. 2016, 15, 1–11. [Google Scholar] [CrossRef]
- Nimmo, J.R.; Creasey, K.M.; Perkins, K.S.; Mirus, B.B. Preferential flow, diffuse flow, and perching in an interbedded fractured-rock unsaturated zone. Hydrogeol. J. 2017, 1, 421–444. [Google Scholar] [CrossRef]
- Uchida, T.; Kosugi, K.; Mizuyama, T. Effects of pipe flow and bedrock groundwater on runoff generation in a steep headwater catchment in Ashiu, Central Japan. Water Resour. Res. 2002, 38, 24-1–24-14. [Google Scholar] [CrossRef]
- Uchida, T.; Meerveld, I.T.-V.; McDonnell, J.J. The role of lateral pipe flow in hillslope runoff response: An intercomparison of non-linear hillslope response. J. Hydrol. 2005, 311, 117–133. [Google Scholar] [CrossRef]
- Jones, J.A.A. Soil piping and catchment response. Hydrol. Process. 2010, 24, 1548–1566. [Google Scholar] [CrossRef]
- Bernatek-Jakiel, A.; Kondracka, M. Combining geomorphological mapping and near surface geophysics (GPR and ERT) to study piping systems. Geomorphology 2016, 274, 93–209. [Google Scholar] [CrossRef]
- Wilson, G.V.; Rigby, J.R.; Dabney, S.M. Soil pipe collapses in a loess pasture of Goodwin Creek watershed, Mississippi: Role of soil properties and past land use. Earth Surf. Process. Landf. 2015, 40, 1448–1463. [Google Scholar] [CrossRef]
- Sidle, R.C.; Noguchi, S.; Tsuboyama, Y.; Laursen, K. A conceptual model of preferential flow systems in forested hillslopes: Evidence of self-organization. Hydrol. Process. 2001, 15, 1675–1692. [Google Scholar] [CrossRef]
- Uchida, T.; Kosugi, K.; Mizuyama, T. Runoff characteristics of pipeflow and effects of pipeflow on rainfall-runoff phenomena in a mountainous watershed. J. Hydrol. 1999, 222, 18–36. [Google Scholar] [CrossRef]
- Bernatek-Jakiel, A.; Kondracka, M. Detection of soil pipe network by geophysical approach: Electromagnetic induction (EMI) and electrical resistivity tomography (ERT). Land Degrad. Dev. 2022, 33, 1002–1014. [Google Scholar] [CrossRef]
- Bernatek-Jakiel, A.; Nadal-Romero, E. Can soil piping impact environment and society? Identifying new research gaps. Earth Surf. Process. Landf. 2023, 48, 72–86. [Google Scholar] [CrossRef]
- Bernatek-Jakiel, A.; Poesen, J. Subsurface erosion by soil piping: Significance and research needs. Earth-Sci. Rev. 2018, 185, 1107–1128. [Google Scholar] [CrossRef]
- Kosugi, K.; Uchida, T.; Mizuyama, T. Numerical calculation of soil pipe flow and its effect on water dynamics in a slope. Hydrol. Process. 2004, 18, 777–789. [Google Scholar] [CrossRef]
- Hencher, S.R. Preferential flow paths through soil and rock and their association with landslides. Hydrol. Process. 2010, 24, 1610–1630. [Google Scholar] [CrossRef]
- Wilson, G.V.; Fox, G.A. Pore-Water Pressures Associated with Clogging of Soil Pipes: Numerical Analysis of Laboratory Experiments. Soil Sci. Soc. Am. J. 2013, 77, 1168–1181. [Google Scholar] [CrossRef]
- Faulkner, H. Badlands in marl lithologies: A field guide to soil dispersion, subsurface erosion and piping-origin gullies. Catena 2013, 106, 42–53. [Google Scholar] [CrossRef]
- Uchida, T.; Kosugi, K.; Mizuyama, T. Effects of pipeflow on hydrological process and its relation to landslide: A review of pipeflow studies in forested headwater catchments. Hydrol. Process. 2001, 15, 2151–2174. [Google Scholar] [CrossRef]
- Bovi, R.C.; Pessoa, T.N.; Boschi, R.S.; Castilho, S.C.d.P.; Libardi, P.L.; Cooper, M. Effect of hydrophysical properties on pipe formation in tropical soils. Sci. Total Environ. 2022, 827, 154296. [Google Scholar] [CrossRef]
- Verachtert, E. Soil piping in a temperate humid climate. In The Flemish Ardennes (Belgium); Katholieke Universiteit Leuven, Groep Wetenschap & Technologie, Arenberg Doctoraatsschool, W. de Croylaan: Heverlee, Belgium, 2011. [Google Scholar]
- Beven, K.; Germann, P. Macropores and water flow in soils. Water Resour. Res. 1982, 18, 1311–1325. [Google Scholar] [CrossRef]
- Sharma, R.H.; Konietzky, H.; Kosugi, K. Numerical analysis of soil pipe effects on hillslope water dynamics. Acta Geotech. 2010, 5, 33–42. [Google Scholar] [CrossRef]
- Fox, G.A.; Wilson, G.V. The Role of Subsurface Flow in Hillslope and Stream Bank Erosion: A Review. Soil Sci. Soc. Am. J. 2010, 74, 717–733. [Google Scholar] [CrossRef]
- Nieber, J.; Wilson, G.; Fox, G. Modeling Internal Erosion Processes in Soil Pipes: Capturing Geometry Dynamics. Vadose Zone J. 2019, 18, 1–13. [Google Scholar] [CrossRef]
- Wilson, G.V.; Wells, R.; Kuhnle, R.; Fox, G.; Nieber, J. Sediment detachment and transport processes associated with internal erosion of soil pipes. Earth Surf. Process. Landf. 2018, 43, 45–63. [Google Scholar] [CrossRef]
- Fox, G.A.; Wilson, G.V.; Simon, A.; Langendoen, E.J.; Akay, O.; Fuchs, J.W. Earth Surface Processes and Landforms Earth Surf. Earth Surf. Process. Landf. 2007, 32, 1558–1573. [Google Scholar] [CrossRef]
- Fell, R.; Wan, C.F.; Cyganiewicz, J.; Foster, M. Time for Development of Internal Erosion and Piping in Embankment Dams. J. Geotech. Geoenviron. Eng. 2003, 129, 307–314. [Google Scholar] [CrossRef]
- Wan, C.; Fell, R. Laboratory Tests on the Rate of Piping Erosion of Soils in Embankment Dams. Geotech. Test. J. 2004, 27, 295–303. Available online: www.astm.org (accessed on 4 August 2023). [CrossRef]
- Khoshghalb, A.; Nobarinia, M.; Stockton, J.; Kalateh, F. On the effect of compaction on the progression of concentrated leaks in cohesive soils. Acta Geotech. 2021, 16, 1635–1645. [Google Scholar] [CrossRef]
- Hanson, G.J.; Robinson, K.M. The influence of soil moisture and compaction on spillway erosion. Trans. ASABE 1993, 36, 1349–1352. [Google Scholar] [CrossRef]
- Afolayan, O.; Lancaster, A.; Montgomery, J. Impact of Soil Piping on Shallow Landslide Initiation: Experimental Observations. Manuscript Under Review. 2025. Available online: https://essopenarchive.org/doi/full/10.22541/essoar.175195383.36518934 (accessed on 14 July 2025).
- Afolayan, O.; McLeod, J.; Montgomery, J. Effect of Water Content on Internal Erosion of an Unsaturated Slope. In Geo-Congress; ASCE: Reston, VA, USA, 2023; pp. 422–431. [Google Scholar]
- Szabo, M.; Osborne, W.; Copeland, C.J.; Neathery, T. Geologic Map of Alabama (1:250,000): Alabama Geological Survey Special Map 220; Geological Survey of Alabama: Tuscaloosa, AL, USA, 1988. [Google Scholar]
- Sowers, G.F.; Richardson, T.L. Residual Soils of Piedmont and Blue Ridge. Transp. Res. Rec. 1983, 919, 10–16. [Google Scholar]
- ASTM C92-95e1; Test Methods for Sieve Analysis and Water Content of Refractory Materials. ASTM International: West Conshohocken, PA, USA, 2022. Available online: http://www.astm.org/cgi-bin/resolver.cgi?C92-95R22E1 (accessed on 11 August 2024).
- ASTM D698-12; Test Methods for Laboratory Compaction Characteristics of Soil Using Standard Effort (12,400 ft-lbf/ft3 (600 kN-m/m3)). ASTM International: West Conshohocken, PA, USA, 2021. Available online: http://www.astm.org/cgi-bin/resolver.cgi?D698-12R21 (accessed on 11 August 2024).
- Oualmakran, M.; Mercatoris, B.; François, B. Pore-size distribution of a compacted silty soil after compaction, saturation, and loading. Can. Geotech. J. 2016, 53, 1902–1909. [Google Scholar] [CrossRef]
- Farifteh, J.; Soeters, R. Factors underlying piping in the Basilicata region, southern Italy. Geomorphology 1999, 26, 239–251. [Google Scholar] [CrossRef]
- McDonnell, J.J. The influence of macropores on debris flow initiation. Q. J. Eng. Geol. 1990, 23, 325–331. [Google Scholar] [CrossRef]
- Holden, J.; Burt, T.P. Piping and pipeflow in a deep peat catchment. Catena 2002, 48, 163–199. [Google Scholar] [CrossRef]
- Terajima, T.; Sakamoto, T.; Shirai, T. Morphology, structure and flow phases in soil pipes developing in forested hillslopes underlain by a Quaternary sand-gravel formation, Hokkaido, northern main island in Japan. Hydrol. Process. 2000, 14, 713–726. [Google Scholar] [CrossRef]
- Verachtert, E.; Eeckhaut, M.V.D.; Poesen, J.; Deckers, J. Factors controlling the spatial distribution of soil piping erosion on loess-derived soils: A case study from central Belgium. Geomorphology 2010, 118, 339–348. [Google Scholar] [CrossRef]
- Ladd, R.S. Specimen preparation and cyclic stability of sands. J. Geotech. Eng. Div. 1977, 103, 535–547. [Google Scholar] [CrossRef]
- Carey, S.; Woo, M.-K. The role of soil pipes as a slope runoff mechanism, Subarctic Yukon, Canada. J. Hydrol. 2000, 233, 206–222. [Google Scholar] [CrossRef]
- Noguchi, S.; Tsuboyama, Y.; Sidle, R.C.; Hosoda, I. Morphological Characteristics of Macropores and the Distribution of Preferential Flow Pathways in a Forested Slope Segment. Soil Sci. Soc. Am. J. 1999, 63, 1413–1423. [Google Scholar] [CrossRef]
- Wilson, G.V. Mechanisms of ephemeral gully erosion caused by constant flow through a continuous soil-pipe. Earth Surf. Process. Landf. 2009, 34, 1858–1866. [Google Scholar] [CrossRef]
- Bonelli, S. Erosion in Geomechanics Applied to Dams and Levees; ISTE Ltd.: London, UK; John Wiley and Sons, Inc.: Hoboken, NJ, USA, 2013. [Google Scholar]
- Xu, T.; Zhang, L. Simulation of Piping in Earth Dams Due to Concentrated Leak Erosion. In Geo-Congress; ASCE: Reston, VA, USA, 2013; pp. 1091–1099. [Google Scholar]
Disclaimer/Publisher’s Note: The statements, opinions and data contained in all publications are solely those of the individual author(s) and contributor(s) and not of MDPI and/or the editor(s). MDPI and/or the editor(s) disclaim responsibility for any injury to people or property resulting from any ideas, methods, instructions or products referred to in the content. |
© 2025 by the authors. Licensee MDPI, Basel, Switzerland. This article is an open access article distributed under the terms and conditions of the Creative Commons Attribution (CC BY) license (https://creativecommons.org/licenses/by/4.0/).