Article

Sedimentary Architecture Prediction Using Facies Interpretation and Forward Seismic Modeling: Application to a Mediterranean Land–Sea Pliocene Infill (Roussillon Basin, France)

1
CNRS (Centre National de la Recherche Scientifique), Université de Montpellier, 34090 Montpellier, France
2
BRGM—Bureau de Recherches Géologiques et Minières (BRGM), 45100 Orléans, France
3
CNRS (Centre National de la Recherche Scientifique), Université de Perpignan via Domitia, CEFREM, UMR5110, 66860 Perpignan, France
4
EPOC (Environnements & Paléoenvironnements Océaniques et Continentaux), Université de Bordeaux, UMR 5805, 33600 Pessac, France
5
Bordeaux INP (Institut National Polytechnique), Avenue des Facultés, 33405 Talence, France
6
CNRS (Centre National de la Recherche Scientifique), 75794 Paris, France
7
BRGM—Bureau de Recherches Géologiques et Minières (BRGM), 34000 Montpellier, France
*
Author to whom correspondence should be addressed.
Geosciences 2025, 15(10), 383; https://doi.org/10.3390/geosciences15100383
Submission received: 27 June 2025 / Revised: 12 September 2025 / Accepted: 16 September 2025 / Published: 3 October 2025

Abstract

This study predicts sedimentary architectures and facies distribution within the Pliocene prograding prism of the Roussillon Basin (Gulf of Lion, France), developed along an onshore–offshore continuum. Boreholes and outcrops provide facies-scale observations onshore, while seismic data capture basin-scale structures offshore. Forward seismic modeling bridges spatial and scale gaps between these datasets, yielding characteristic synthetic seismic signatures for the sedimentary facies associations observed onshore, used as analogs for offshore deposits. These signatures are then identified in offshore seismic data, allowing seismic profiles to be populated with sedimentary facies without a well tie. Predicted offshore architectures are consistent with shoreline trajectories and facies successions observed onshore. The Roussillon prism records passive margin reconstruction in the Mediterranean Basin following the Messinian Salinity Crisis, through the following three successive depositional profiles marking the onset of infilling: (1) Gilbert deltas, (2) wave- and storm-reworked fan deltas, and (3) a wave-dominated delta. Offshore, transitions in clinoform type modify sedimentary architectures, influenced by inherited Messinian paleotopography. This autogenic control generates spatial variability in accommodation, driving changes in depositional style. Overall, this multi-scale and integrative approach provides a robust framework for predicting offshore sedimentary architectures and can be applied to other deltaic settings with limited land–sea data continuity.

1. Introduction

Interpretation of sedimentation dynamics along passive margins has been the subject of intense research and advances over the past 50 years. Among the methodological breakthroughs, the development of sequence stratigraphy, along with reflection seismic development [1,2], has provided a framework for recomposing sedimentary architectures and their controlling parameters. When recomposing architecture and facies distribution along a passive margin using “conventional” seismic dataset, the geometry of deposits is reconstructed within the limits of seismic resolution but fails to capture the facies variability that controls reservoir properties [3]. The interpretation is often based on the analysis of seismic facies [4,5], which is not unequivocal and tends to merge different facies and lithologic variations that are typically at a sub-seismic scale [6]. The sub-seismic scale necessary for reservoir prediction has long been addressed by high-resolution sequence stratigraphy [7,8] using well-tied data, analogue studies, or model-based predictions. More recently, the increasing development of more resolved 3D seismic imagery has enabled detailed approaches to seismic geomorphology and highlighted the complex nature and spatial variability of sedimentary architectures along passive margins. Horizon-based interpretation can be enhanced by integrating quantitative seismic attribute analysis, including trace-derived attributes (e.g., amplitude and frequency) and horizon-based attributes (e.g., dip, geometry, and continuity [9]).
Clinoforms are the building blocks of passive margins [10], and their sedimentary architecture and facies content are key to recomposing reservoirs along a passive margin. They are basinward-dipping stratal, chronostratigraphic, and depositional surfaces corresponding to “frozen” paleo-bathymetric profiles [10,11]. While clinoforms have been widely used in sequence stratigraphy [1,2], a large variety of them has been recognized over the years, varying in size, depth, facies content, and progradation rate [10,12,13]. They range from small-scale shoreline clinoforms to large-scale deepwater clinoforms, where the rollover marks the shelf break and the topsets include shelf deposits [14]. Large-scale clinoforms can be relatively complex, from single, hybrid to compound clinoforms [10]. Significant efforts to classify clinoforms and catalogue their facies content have been made over the years [10]. Restoring sedimentary architecture and facies distribution at a sub-seismic scale, particularly regarding topset facies content [14], remains challenging without costly well-tie data.
In this study, we aim at recomposing the architecture and facies content of a large Pliocene prograding sedimentary wedge, which developed in the western part of the Gulf of Lion (Figure 1). This wedge outcrops partly onshore (Rousillon plain) and extends predominantly offshore, a setting hereafter referred to as “land–sea” configuration. While a land–sea configuration is commonly encountered on passive margins or modern deltas (e.g., Lobregat delta [15], Orinoco delta [16], New Jersey [17], and other examples in ref. [18]), quantitative offshore sedimentary predictions are rarely undertaken without a well tie. The present study is based on two distinct datasets: outcrops and/or downhole cores onshore, and seismic profiles offshore (without a well tie). The following two key challenges arise from using such disconnected datasets: (1) upscaling from meter-scale outcrop/core observations to conventional seismic resolution and (2) spatial variability in sedimentary systems, especially basinward, and possible use of onshore analogs to define offshore facies. We here propose an approach to bridge these gaps through (1) recomposing the different depositional facies and sedimentary architectures based on outcrops and borehole data, (2) performing detailed seismic data interpretation, and (3) comparing outcrops and seismic scales through forward seismic modeling applied on representative onshore datasets.
The Roussillon Basin, filled since 5.3 Ma with deltaic and continental deposits, is well suited for such a work to be led. It contains a well-developed Plio–Pleistocene land–sea prograding prism almost not affected by tectonic deformation (except for proximal uplift) [19]. Several outcrops exist and display a wide range of sedimentary facies ranging from coastal marine and palustral deposits belonging to well-preserved clinoform topsets [19,20,21] to Gilbert deltas [22]. Two cored drillholes and associated well logs complement these observations onshore [23]. Offshore, the prograding prism is well imaged by high-quality reflection seismic profiles with dense coverage (Figure 1). Clinothems are well developed with a good preservation of the clinoform topsets [24,25]. The Plio–Pleistocene Roussillon prism, moreover, hosts important aquifers that are well known onshore [26], where their high solicitation induces seawater intrusion problematics [27]. Less is known about the potential offshore extension of these aquifers, accounting for the overall distribution of freshwater resources. Consequently, predicting sedimentary architectures offshore at the reservoir scale may also help to ensure a sustainable management of freshwater resources in this region [26,28,29]. Sedimentary architecture predictions could also lead to the identification of new groundwater resources in the offshore domain. Recent studies have, indeed, highlighted the existence of possibly significant amounts of freshened water hosted in offshore aquifers in the Mediterranean and beyond [30,31].
To carry out this study, we used an approach similar to that in ref. [32]. We first defined sedimentary facies associations derived from the interpretation of outcrops and cored drillholes onshore. Then, we interpret offshore seismic facies through the geometry, amplitude, continuity, and position of seismic reflections within the clinothems. Uncertain interpretations are questioned by performing forward seismic modeling and comparing the resulting synthetic seismics to the actual seismic facies. Our modeling efforts focused on the topsets, which proved particularly challenging to predict. Based on this, three main seismic profiles of the Roussillon (on both the dip and strike axes) are subsequently interpreted in terms of sedimentary facies associations. Finally, the predicted offshore facies distribution was evaluated by confronting shoreline trajectory analysis, lateral facies trends, vertical facies successions from core data, and cross-profile correlations to assess their overall geological consistency.

2. Geological Background

2.1. Geodynamics

Located in an orogenic region, the Roussillon Basin bears witness to the complex tectonic history of the Pyrenees and the Gulf of Lion margin [33,34]. It marks the eastern termination of the Pyrenees [35]. The basin is bordered by the Agly Massif and the Corbières to the north, the Canigou Massif to the west, and the Albères to the south. It is limited to the east by the Mediterranean Sea and the Gulf of Lion margin (Figure 2). The latter results from a back-arc extension related to the retreating Apennines subduction that led to the Liguro–Provençal Sea opening during an Oligo–Miocene rifting phase [34,36,37,38]. The Roussillon Basin is a graben formed during this extensional phase. It is bounded by two normal faults (the Têt/Aspres Fault to the north, the Tech/Albères Fault to the south) [39,40].

2.2. Messinian Salinity Crisis (MSC) Event

The post-rift evolution of the Gulf of Lion margin and Roussillon Basin was strongly influenced by the Messinian Salinity Crisis (MSC) [41,42]. During that period, the Mediterranean water level was lowered by about 1500 m in the western Mediterranean Basin [43], which led to the erosion of the peri-Mediterranean margins through subaerial processes [44,45]. Deep narrow incisions or “canyons” were carved in the upper reaches of the rivers [46], and a well-developed fluvial network was created on the Miocene shelf [44,47]. As a result, an erosional unconformity is observed in both subsurface data and outcrops [45,48]. Known as the “MES” (Messinian Erosion Surface), this unconformity defines the basal surface over which the Plio–Pleistocene deposits have accumulated [47].
The MSC ended at 5.33 Ma with the Zanclean refilling of the Mediterranean Basin and the associated re-establishment of open-marine conditions [41]. This refill was fast [49] and relatively coeval with the highest global marine sea level (GMSL) ever reached since the late Miocene [50] which, combined with the deeply eroded margin, offered a huge accommodation space available for subsequent Pliocene sedimentation.

2.3. Post-MSC

In the Gulf of Lion, following the MSC, large sediment supply during the Pliocene–Pleistocene coupled with regional subsidence caused the progradation of well-developed clinothems [25]. In addition, seaward tilting of the margin due to the combination of post-rift thermal subsidence, sediment loading and post-MSC isostatic rebound enabled excellent preservation of the Plio–Pleistocene deposits on the margin, including the Pliocene topsets [20,21,24,25,51,52,53,54]. This geological context allowed for the preservation of a kilometer-thick Plio–Pleistocene sequence, particularly well-identified on seismic profiles [51,55], reaching a maximum thickness of 2 km on the outer shelf (Autan well, Figure 2 [56]). In the Roussillon Basin, the uplift of the border massifs during both the Late Miocene and the Pliocene also ensured a constant sediment supply to the basin [57,58].

2.4. Onshore Pliocene Geological Records

In the Roussillon Basin, the oldest terms of the post-MSC infill consist of debrites reworking boulders from the granitic basement [59] and are directly overlain by Gilbert deltas [60] first identified along the Têt River [22,61]. Similar structures are observed in other localities within the Roussillon (i.e., Le Boulou quarry and, more generally, along the Tech River). Gilbert deltas are now known as typical features of Messinian rias reflooding around the Mediterranean Basin [62,63]. Later, sedimentation evolved to more classical wave-dominated, deltaic-style environments, characterized by the record of coastal dynamics [52]. Sediments are mostly siliciclastic due to the prevalence of crystalline formations within the catchment area [64]. Numerous studies have described onshore marine and continental facies, as well as deltaic and palustrine facies, in the Pliocene [19,20,39,64,65,66,67,68]. Precise characterization of the sedimentary facies and architecture still needs to be achieved despite recent modeling efforts [69].
Figure 2. Key locations within the onshore Roussillon Basin. 1/50,000 geological map modified from BRGM [66]. The location of the Têt/Tech Fault systems is approximative, inspired by Refs. [40,59].
Geosciences 15 00383 g002

2.5. Offshore Pliocene Seismic Records

Offshore, the internal organization of the Plio–Pleistocene deposits is well imaged on seismic profiles [51,70]. It consists of a progradational prism made of large clinoforms organized as system tracts, essentially studied through seismic stratigraphy [71]. Ref. [51] first defined three main depositional units (U1 to U3) and five seismic facies briefly interpreted in terms of sedimentary processes, sedimentary facies, or depositional environments. Later, based on a land–sea stratigraphic correlation across the Roussillon Basin and adjacent continental shelf, ref. [20] identified eight dominantly prograding systems tracts. These eight system tracts were laid out in sedimentary facies associations by the same author, thus consisting of the first land–sea sedimentary architecture model for the Plio–Pleistocene prism of the Roussillon. Their model, although based on both onshore sedimentary architecture (inferred primarily from well logs) and offshore seismic geometries (e.g., topset/foreset/bottomset differentiation of clinoforms and offlap-break trajectory analysis), remains poorly constrained in terms of sedimentary facies distribution for the offshore segment. Several other studies focused on the offshore Plio–Pleistocene sedimentary architecture [24,25,54], but none of them provided interpretations on sedimentary facies organization.
We propose here a semi-quantitative prediction of the sedimentary facies organization based on the current nature and distribution of seismic facies as observed on key seismic profiles, coupled with a better understanding of the onshore sedimentary architecture from core analysis of recent drillholes.

3. Data and Methods

3.1. Onshore

Sedimentological analyses were performed within the exposed portion of the Roussillon sedimentary prism. The uplift and general tilting to the east of the Roussillon series [21,72] allow for the observation of older series to the west and more recent ones to the east. Eight kilometers of section were measured, distributed across 26 outcrops, two quarries, and a seven-kilometer-long WNW–ENE cross-section between Terrats and Nyls along the Canterrane River (Figure 2), which exposes relatively continuous cliffs displaying strata gently dipping eastward. These observation points enable us to recompose Pliocene sedimentary facies and architectures in different settings. Additionally, we used two boreholes (Dem’Mer and Dem’Ter, Figure 2), cored in 2018, in the framework of the Dem’Eaux Roussillon project [23]. The Dem’Mer borehole was drilled and cored near the shoreline (42°38′26.8465″ N, 3°1′59.0023″ E, Z = 2 m). It penetrated through both the Quaternary and Pliocene series and reached 320 mbgl (meters below ground level), providing an almost continuous sedimentary record from 0 to 292 mbgl. Spectral gamma ray (uranium, thorium, and potassium), electrical resistivity, and sonic downhole profiles were acquired in an open hole along almost the entire section [73]. The Dem’Ter borehole was drilled and cored in a more proximal location, about 13 km westward from that of Dem’Mer (42°38′24.5670″ N, 2°52′29.7757″ E, Z = 38 m). The later drillhole was cored from 8 to 120 mbgl. Both boreholes were described at a 1/50 scale through the description of classical sedimentological parameters (e.g., lithology, grain size, sorting, sedimentary structures, ichnofacies, and grading). The study of outcrops and boreholes allowed for the identification of numerous facies (and architectures), later grouped as coherent facies associations interpreted in terms of depositional environments. Finally, both lateral successions and stacking patterns between depositional environments were interpreted to reconstruct the depositional profile evolution across the onshore Pliocene.

3.2. Offshore

The offshore part of the basin is gridded by several seismic acquisition campaigns, two of them widely covering our area. We chose to focus on the LRM96 campaign, conducted by ELF, in 1996, providing high-quality multi-channel conventional seismic profiles with sufficient penetration to image the whole post-Messinian prism. The wavelet is of Ricker type (zero phase), and the polarity follows American standards, i.e., positive amplitudes go with the peak reflection represented by the red color, and negative amplitude goes with the trough reflection represented by the blue color. The calculated average vertical resolution is 15 m (see details in Section 3.3), corresponding to a 40 Hz dominant frequency on the Pliocene interval (see Section 3.3). These were acquired in 1996 by the ELF company using a cluster of air guns, along with a 3.6 km long seismic streamer. High-resolution multi-channel seismic profiles acquired during the Marion campaign, led by IFREMER, in 2000, offered a better vertical resolution than LRM96 but with a weaker signal penetration. In this study, these profiles were essentially used for regional correlations within the Pliocene interval.
Five petroleum exploration wells have been drilled offshore on the shelf (Figure 1). Because these wells targeted pre-Pliocene deposits, only a few sedimentological and biostratigraphic data points were recovered within the Pliocene interval [56], together with incomplete downhole logs. Sonic logs have, however, been acquired in the bottomsets of the Pliocene clinoforms in the Calmar, Rascasse, and Tramontane wells (Figure 1), as well as in both the bottomsets and foresets in the Agde Maritime well [74].
Offshore, LRM96 seismic profiles were first interpreted through the classical characterization of stratal terminations [1], seismic facies analysis [4], and trajectory analysis [75]. We identified eight seismic facies (see Section 4.2) based on the amplitude, geometry, continuity, and frequency of the reflections, as well as their position along clinoforms (topset, foreset, and bottomset). Each seismic facies has been tentatively assigned to a specific sedimentary facies association/depositional environment, based on both the aspect of seismic reflections [6] and the geological knowledge onshore (sedimentary associations). To reconstruct reservoir variations along a land–sea continuum, special attention was given to the facies content of the topsets. However, interpreting sedimentary facies in the topsets offshore, based on seismic data alone is not straightforward. Indeed, numerous papers have highlighted the possible importance of marine (shelf) facies in topsets, especially within compound clinoforms [10,14,76]. In such case, the identification of delta-scale clinoforms (10 s of meters tall), such as shoreline clinoforms nested within shelf-scale clinoforms (100 s of meters tall), is determinant for identifying the paleo-shoreline position, and, thus, assess the nature of topsets deposits [12,14]. However, while most of the clinoforms resolved by the LRM96 seismic dataset are shelf-scale clinoforms, the identification of delta-scale/shoreline clinoforms is challenging, as these features are typically close to the seismic resolution. To help with our facies interpretations, we identified rollover points along clinoforms on each profile, enabling the distinction between hybrid clinoforms, characterized by a single rollover per surface, and compound clinoforms, which exhibit multiple rollovers per surface. Among the equivalences established between seismic and sedimentary facies, those still considered uncertain after this step were tested through forward seismic modeling (see Section 3.3).

3.3. Synthetic Seismic Modeling

We performed 2D synthetic seismic modeling using the 2023 version of NORSAR’s SeisRoX pro software in order to investigate the seismic response of specific sedimentary facies associations identified onshore. The software allows for simulating the Prestack Depth Migration (PSDM) seismic response of complex geological models [77,78].
First, we estimated the dominant frequency and vertical resolution of the seismic data used (LRM96 profiles) in order to scale the 2D acoustic impedance models and the parameters used for the synthetic modeling. The wavelength was calculated as the mean P-wave velocity divided by the dominant frequency. We used 2350 m·s−1 as a mean value for Vp across the Plio–Quaternary interval, based on both sonic logs of the Dem’Mer borehole and published velocity laws in the offshore domain [53,79]. The dominant frequency was calculated by counting and averaging the number of peak reflections within the first 1 s twt (two-way travel time) from the seafloor at 3 different locations. A period of 0.025 s twt was obtained, corresponding to a 40 Hz dominant frequency, and a subsequent average vertical resolution of 15 m. We chose 0° phase 40 Hz, 50 Hz, and 60 Hz Ricker-type wavelets to be propagated through the models. The polarity is standard, with the positive amplitude being associated with peak reflection, positive reflectivity, and the color red; negative amplitude (trough reflection, negative reflectivity, and the color blue). Using the parameters described above, the model outputs (e.g., dominant frequency, polarity, and amplitude) are coherent with those observed on the seismic profiles. Finally, deduced sedimentary facies are used to fulfil the interpretation of seismic profiles based on seismic facies and their position within clinothems.
To perform the seismic modeling, we then defined an appropriate box size, which can be compared to the vertical resolution of our seismic datasets (~15 m, see below), and a horizontal-scale intermediate between the seismic resolution and outcrop observations (dimensions of 100 m in height x 80 m in length was chosen). Secondly, for each sedimentary facies association, we sketched 2D, small geological models representative of their internal main geometries and facies distribution, as observed on outcrops and downhole cores (geometries are postulated from current knowledge in such cases). The geological models were then converted into acoustic impedance models by attributing velocity (Vp; Vs) and density values, based on the Dem’Mer downhole measurements and core samples. Velocities were set either as constant (in homogeneous facies) or as gradients (to reflect vertical or lateral facies changes). A mean Vp value was associated to each sedimentary facies based on the Dem’Mer sonic logs (see Figure 3). All Vp values used in our models correspond to a burial depth of about 100 m (Dem’Mer borehole), except for those issued from offshore wells measured at a burial depth of ~280 m.
In the absence of Vp measurements for a facies, we used the Vp value available for the most similar lithology or applied gradient between two measured lithologies.
To better account for the geological reality, an arbitrary ± 0 to 15 ms was added to each Vp used in the models. This allows for imaging interfaces between strata displaying the same facies content and, thus, for reproducing impedance variability along stratigraphic surfaces [80]. In the absence of values for Vs, we assumed that vs. = Vp/2 (Wiggins approximation [81]). Density values were derived from porosity and grain-density measurements performed on Dem’Mer and Dem’Ter core samples in the laboratory [82].
As a last step, SeisRoX computes synthetic seismic profiles by simulating, through acoustic impedance models, the propagation of acoustic waves with the same peak frequency as the real seismic data (about 40 Hz). The synthetic seismic profile is finally compared to the real seismic lines. The interpretation of seismic facies in terms of sedimentary facies association is considered valid when the synthetic model best fits the real seismic data.

3.4. Analysis of the Interpreted Facies Distribution

Facies populated seismic profiles were analyzed to characterize the evolution of sedimentary architecture during the basin infill and to assess the overall coherence of the sedimentary facies predictions.
The shoreline trajectory defined by successive shoreline positions throughout the infill [75] was analyzed together with changes in clinoform type (hybrid vs. compound). This analysis segmented the prograding prism into distinct clinoform packages that correspond to variations in the ratio between accommodation-space creation and sedimentary flux (A/S ratio). Each clinoform package displays characteristic large-scale trends potentially recognizable across different locations in the basin.
Shoreline trajectory analysis is combined with the identification of seismic reflection terminations, allowing for the delineation of major stratigraphic surfaces following classical principles of seismic stratigraphy [1]. These surfaces were correlated across the selected seismic profiles based on their intersections and are likely to bind system tracts. Here, the clinoform packages are defined as complete sea-level cycles, i.e., between maximum regressive surfaces (MRSs) or undifferentiated sequence boundary (SB)/MRS surfaces.
Each of the three interpreted seismic profiles (two in the dip axis: LRM4 and LRM10; one in the strike axis: LRM11; Figure 2) was divided into laterally equivalent clinoform packages enabling comparison of the evolutionary trends among the profiles at different stages of basin infill. The evolution of the A/S ratio and facies distribution was evaluated within each clinoform package across all three profiles. This approach allowed for assessing the overall coherence of predictive interpretations and provided insights into sedimentary infill dynamics and associated control factors.

4. Results

4.1. Borehole and Outcrop Sedimentary Records

4.1.1. Sedimentary Facies Associations

Most sedimentary facies recognized on cores and in outcrops were grouped into eight sedimentary facies associations (AFs; Table 1), each characterizing distinct depositional environments in the sense in ref. [83]. These are labeled AF1 to AF8 and are described hereafter. Detailed lithological logs from the Dem’Mer and Dem’Ter boreholes are shown in Figure 3, while core pictures are available in Figure S1 (Supplementary Materials).
Figure 3. Sedimentological log of the Dem’Mer and Dem’Ter boreholes drilled, respectively, close to the coast and in the middle of the Roussillon Basin (see locations in Figure 2). Sedimentary facies associations (AFs) are described in the text below. Core recoveries are represented in black (recovery) or white (no recovery). GR = gamma ray. Sedimentary facies such as Lkl, Pa, and Ca are not represented in order to simplify the log.
Geosciences 15 00383 g003
AF1_Gilbert Deltas
  • Description:
AF1 displays three groups of facies, defining Gilbert deltas [22,60], corresponding to Gilbert delta topsets (GDt), foresets (GDf), and bottomsets (GDb). GDt are nearly horizontal, erosional sand/conglomerate alternations with mainly tractive transport features, including 3D megaripples, imbrications, and channel geometries. Conglomerates are clast- or matrix-supported with either no or normal grading. This group of facies corresponds to fluvial to alluvial fan deposits. GDf displays an increase in the sand proportion down dip. GDf deposition is essentially controlled by avalanching processes [84] and corresponds to steeply inclined, inverse-graded strata, with backset beds or antidunes. Infra-metric cemented and shelly strata have also been identified. GDb is composed of finer material, ranging from fine sands with hummocky cross-stratifications (HCS) to slumped marls, as well as bioturbated and shelly, nearly horizontal beds. These facies are spatially organized following the classical Roussillon Gilbert delta succession described in ref. [22], with clinoforms around 50 m high (delta scale).
  • Depositional system:
AF1 records Gilbert-type fan deltas [60,85] deposited in a marine coastal environment [85] with topset beds partly continental. They record thick, high-energy fluvial deposits in large-accommodation settings, with evidence of density currents and supercritical flows (e.g., backset beds in the contemporaneous Vintimiglia Gilbert delta [63]), highlighting strong sediment input from rivers. Several Gilbert deltas outcrop along both the Têt and Tech rivers (e.g., Bente Farine and Le Boulou, Figure 2), lying against the Paleozoic substratum, and represent the earliest post-MSC deposits of the Roussillon Basin, infilling the Messinian rias [85].
AF2_Confined Alluvial Plain
  • Description:
AF2 consists, essentially, of large oxidized clayey intervals (FPo), alternating with lens-shaped sandy levels (dm to few m) and thin (<1 m) limestone strata (Figure 4). Such an association is typical of alluvial plain environments, where oxidized clays correspond to a floodplain facies (FPo) alternating with fluvial sands. The floodplain as a depositional environment also contains pedogenic features such as calcretes (Ca) and pedoturbated horizons (Pa), as well as rare lacustrine limestones (Lkl). Ca contains more or less coalescent carbonated nodules, cementation halos, and some preserved root traces. Both are interpreted as the early development of Ca and usually form hardened massive horizons. Coalescent root traces and burrows without proper CaCO3 cementation are interpreted as pedoturbated horizons (Pa) and often found capping channel sequences or integrated within FPo. Pa can also display mottling. Nonetheless, Ca can be found as part of larger pedoturbated sequences and reach up to one meter in thickness, indicating a mature state. Whitish, fine-grained, and homogeneous limestones with no root traces are observed next to wavy stromatolitic beddings in the Trouillas transect (Figure 2), and they are interpreted as lacustrine limestones (Lkl).
Fluvial sands are essentially found in the form of meter- to multi-meter-thick meandering channel fills (MCf) and bars (MCb), as well as braided channels (BC). They fill narrow incisions that are laterally stacked along erosive surfaces. These fluvial facies consist of moderately sieved sands organized as 1 to 7 m thick, normally graded sequences, with an erosive basal surface, 3D megaripples, and rip-up clasts. In addition, MCb displays lateral accretion surfaces. Sparse sandy overbank deposits are present but much less developed than in AF3.
  • Depositional system:
AF2 represents an alluvial plain alternating between flooding, when clays accumulate in the floodplain, and subaerial exposure favoring pedogenesis (Ca and Pa). The dominance of channelized sands, scarcity of overbank deposits, and extensive pedogenesis suggest a confined fluvial system where entrenched incisions limit overbank deposition. Channel-base incisions appear sufficiently entrenched to accommodate the fluvial discharge and limit overbanks. This geomorphic configuration may indicate periods of low- or negative-accommodation-space creation.
AF3_Unconfined Alluvial Plain
  • Description:
AF3 displays sedimentary facies similar to AF2 but in different patterns and abundances. Indeed, inframetric, widespread strata of silty sands (CS1, CS2, and CS3) here are extensively developed and alternate with FPo. Rare meter-thick meandering channel fills (MCf) and bars (MCb) occur. Pedogenic features are rare and poorly developed.
Three subfacies can be distinguished within CS. These silty to sandy sediments are organized as typical, both thickening and coarsening upward sequences. CS3 displays progressive alternation between silts and fine sands, CS2 displays coarser and sharper basal contact, while CS1 shows an erosive base and gravelly sands, overlain by a fining upward trend including cross-bedded sandstone. CS1, CS2, and CS3 are, respectively, interpreted as the proximal, intermediary, and distal parts of crevasse-splay lobes. Despite being quite similar to MCf facies, CS1 rarely exceeds one meter. Structureless, decimetric strata without grading or sorting, displaying coarse material in a mostly muddy matrix, are identified as flood-related and named DFw.
  • Depositional system:
AF3 corresponds to an alluvial plain that is more strongly controlled by avulsion processes than AF2, with frequent floods and extensive overbank deposition. Typical 1.50 to 4 m thick sequences show gradual evolution from CS3 to CS1, capped by channel deposits, recording progressive levee breaching followed by channel avulsion. These deposits correspond to a weakly incised floodplain promoting frequent unconfinements of the fluvial discharge. Consequently, development of pedoturbated horizons and calcretes is repeatedly disrupted, accounting for their rarity and limited maturity. The good preservation of floodplain deposits suggests a relatively high accommodation rate.
Following the current understanding [86], AF3 and AF2 may alternate in time with A/S ratio variations or coexist along a depositional profile, with AF2 being more proximal.
AF4_Delta/Coastal Plain
  • Description:
AF4 comprises overbank deposits (CS1–CS3), rare channels (MC), and abundant beige to greenish silty clays (FPr) interpreted as reduced floodplain deposits (swamps). These clays differ from lacustrine reduced clays (Lk), which are plastic and form more continuous, bioturbated, O.M-rich blueish sequences. A distinctive AF4 feature is thin detrital pulses (CS3), ~10 cm thick, with gradational contacts into reduced clays.
  • Depositional system:
AF4 is mainly distinguished by reduced fine-grained sediments, evidencing lakes and swamps where the O.M is preserved. Thin sand bodies are deposited under unconfined conditions, while pedogenesis occurs locally in the periphery of lakes and swamps. This poorly drained environment, interpreted as a delta plain, was prone to sheet-sands deposition during floods.
AF5_Embayment
  • Description:
AF5 mainly consists of meter-thick levels of homogeneous greyish/blueish plastic clays with pyritic O.M-rich black levels (Lg). Locally, they are topped by poorly sorted sands denoted as Bh displaying small-to-medium dunes, O.M, and sometimes shells. Lg and Bh form coarsening-up sequences. Lg is locally associated with greenish, pedoturbated carbonated clays (Pa). AF5 is often associated with proximal marine facies, such as mouth bars, tidal flats, or beach deposits.
  • Depositional system:
AF5 is only observed in the Dem’Mer and Dem’Ter boreholes (Figure 3), overlying AF6 (shallow-marine deltas and shoreface) at the basin scale [52]. Bh, interpreted as bayhead-delta lobes, testifies to fluvial influence and limited wave processes. The clays reflect a lagoonal setting. Locally, greenish carbonated clays are interpreted as lagoon-shore carbonates or pedoturbated horizons (Pa). Overall, AF5 records protected bay or estuarine environments, partly overlapping with AF4; these associations are, thus, often referred to as AF4-5.
AF6_ Shallow Marine Sands 1
  • Description:
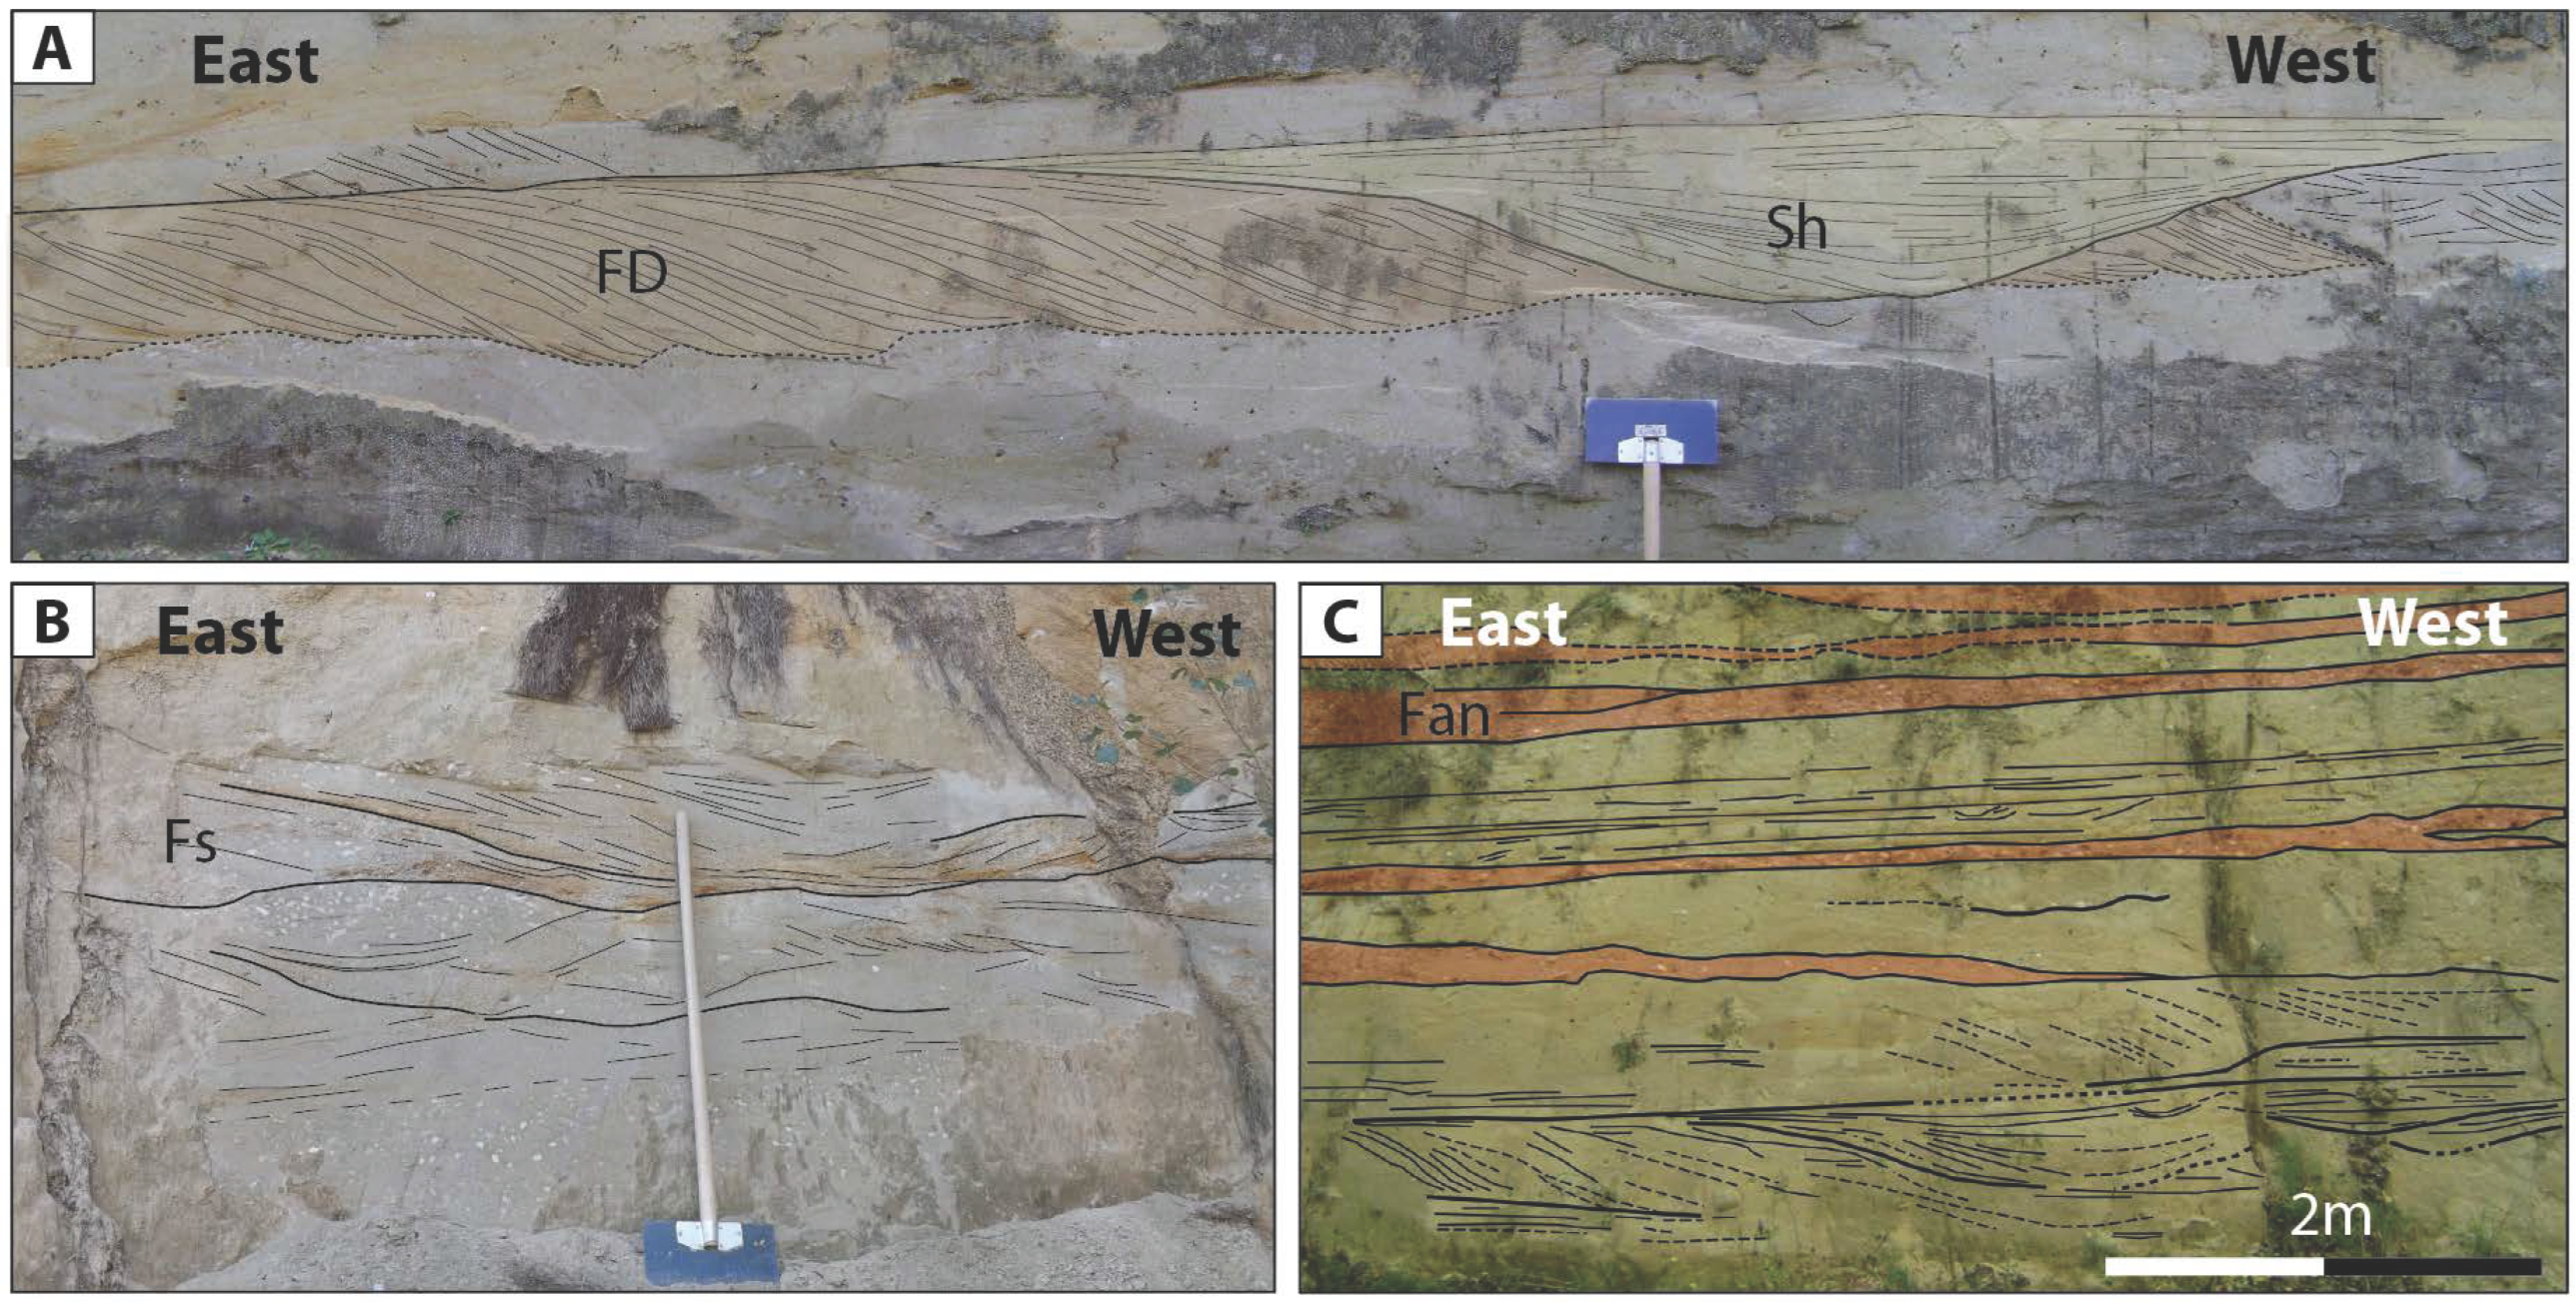
AF6 (Figure 5) is exposed in the Trouillas transect (Figure 2), where the following facies succession is observed down-dip (from east to west). Conglomerates (Fan, Figure 5C) made of contiguous pebbles in a sandy matrix alternate with poorly sorted sands, in the form of thickening–coarsening-upward sequences. Conglomerates, thus, range from pebble lag surfaces to >1 m thick strata (Figure 5C), passing laterally to medium-sorted sands with low-angle, high-energy planar beddings, gravel lenses, pebble lags, megaripples, and ridges and runnels geometries, interpreted as foreshore/beach deposits (Fs, Figure 5B). Sorting improves westward within medium sands dominated by swaley cross-stratifications (SCS) (Sh, Figure 5A), characteristic of a shoreface environment (Sh). This facies is locally interbedded with sets of medium-grained sigmoidal megaripples about 60 cm in amplitude, at least 15 m in lateral extension, and recording westward-directed currents (FD, Figure 5A). Sh units dip 5° to the east, with the material becoming progressively finer down-dip, suggesting foreset geometry within clinoforms. Fan and Fs are less inclined in comparison, accounting probably for topset counterparts. Despite the absence of clearly outcropping bottomsets, we estimate the clinoform amplitude to 30 m.
AF6 (and AF7, see below) although azoic, contain moderate-to-intense bioturbation including vertical burrows (chiefly with abundant Ophiomorpha), condensed along decimetric surfaces.
  • Depositional system:
AF6 is interpreted as fan delta lobes emplaced during floods, reworked by waves and storms as attested by ridges and runnels; low-angle, high-energy planar beddings; and SCS, as well as overall good sorting of marine sands. Local FD dunes record flood delta lobes through their upstream direction of propagation and their sigmoidal geometry. AF6 is organized along shoreline clinoforms, of which pebbly topsets (Fan) are alluvial fans. The foreset dipping angle measured in the outcrops may be overestimated due to margin tilting.
AF7_Shallow Marine Sands 2
  • Description:
It consists of bioturbated medium-to-coarse sands with gravels, shells, and crude dunes, interpreted as mouth bars (Mb). Laterally, foreshore (Fs), shoreface (Sh), and tidal flat (TF) deposits occur. Thick, coarsening-up foresets of well-sorted sands to silts (DF) form 30 m sequences in Dem’Ter. Rare shelly beds occur in the cores. Along Trouillas (Figure 2), Fs passes into Sh and then DF, with ~5° eastward dips.
AF7 is more developed in younger deposits (upward and eastward) and in boreholes (Figure 3) compared to AF6. It consists of highly bioturbated, poorly sorted, and medium-to-coarse sands with sparse gravels, gastropods, mussels, plant debris, and crude dunes, interpreted as mouth bar deposits (Mb). Distally, Mb grade into multi-meter-thick units (up to 30 m in the Dem’Ter borehole) of well-sorted medium sands to silts with large, 2D foresets and discrete dunes, interpreted as delta front lobes (DF). Together, Mb and DF form coarsening-upward sequences typical of deltaic settings. Aside from river mouths, foreshore and shoreface sands (Fs and Sh) may occur instead of Mb and DF. Rare 10 cm thick, cemented shelly beds are observed in the shoreface environment at 285 m in the Dem’Mer borehole. Locally, we identify millimetric wrinkling O.M laminae as clay drapes, interbedded with current ripples, characteristic of tidal flat environments (TF). Lateral facies variations from foreshore to shoreface to delta front record an increasing bathymetry observed along the Trouillas transect (Figure 2), with the delta front displaying foresets dipping ~5° eastward.
  • Depositional system:
The identification of a delta-front lobe topped by mouth bars record fluvial dynamics at the river mouth, although wave processes remain dominant as attested by the well-sorted sands of DF. Tidal dynamics, although limited, are recorded by clay drapes in tidal flat environments (TF). AF7 is organized as clinoforms, passing from proximal, nearly horizontal mouth bars to inclined DF strata describing foresets. As for AF6, the foreset dipping angle measured along the Trouillas transect must be overestimated.
AF8_Upper Offshore
  • Description:
AF8 displays a single facies (PD), only identified in the Dem’Ter (Figure 3) borehole. It consists of well-sorted silts and is organized as regular coarsening-upward sequences with rare shelly surfaces. On the cores, this facies passes upward to DF sands through gradual contact.
  • Depositional system:
Among the facies observed onshore, PD corresponds to the deepest depositional environment, representing transition from delta front to prodelta deposits. Prodeltaic/basin clays are not directly observed but clearly identified on seismic images and described in industry wells ([56], Figure 1).
All sedimentary facies are precisely described and synthesized in Table S1 (Supplementary Materials).

4.1.2. Synthesis of Sedimentary Facies and Environments

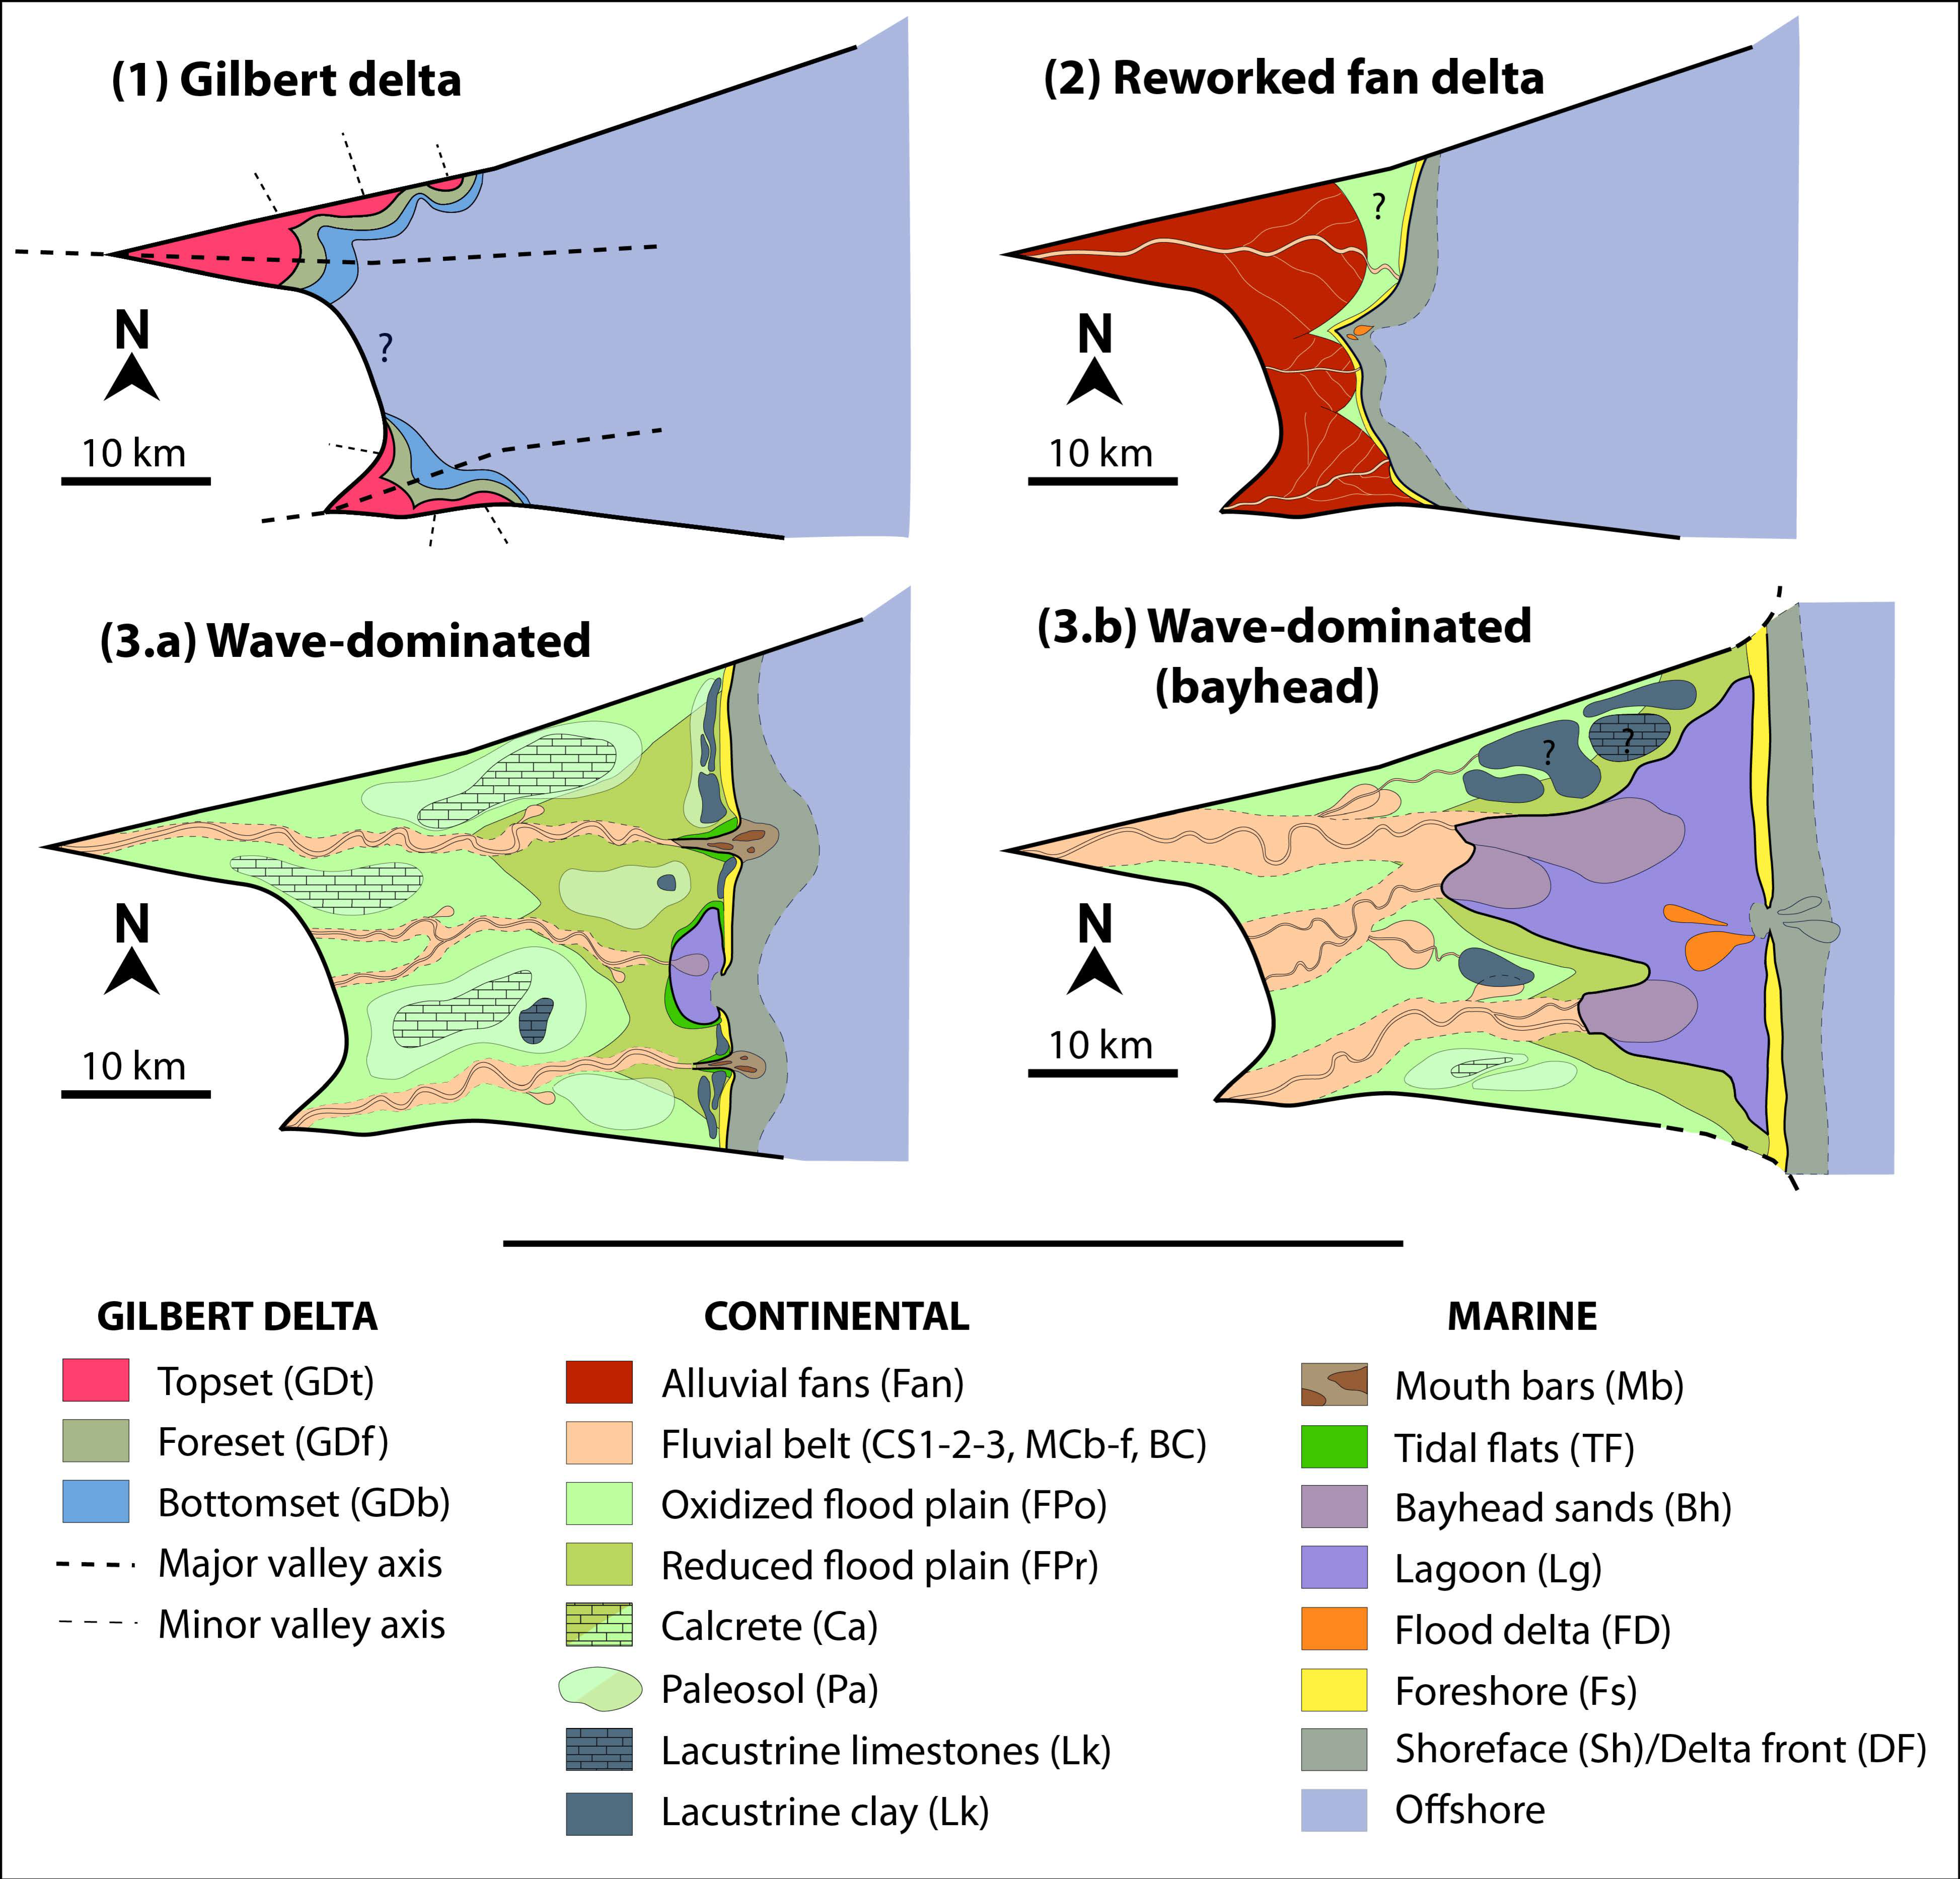
The sedimentary facies associations reveal different dynamics encountered along an older–younger, proximal–distal (relative to the source of sediment) direction due to margin tilting. We identified three successive depositional profiles described hereafter (denoted as DP1, DP2, and DP3), recording progressive margin reconstruction after its erosion during the MSC.
Deposition profile 1: The first and oldest depositional profile consists of “Gilbert-type deltas” (AF1) [60], already described in ref. [22]. These objects testify to large accommodation space, short transport due to nearshore reliefs, and a steep river gradient ranging between 10 and 35°. They are commonly observed in the Mediterranean Basin, infilling drowned Messinian paleovalleys after the Zanclean flooding [87]. The biggest Gilbert deltas of the Roussillon are found in the main valleys of the Têt and Tech [59,62]. In the Têt valley (Nefiach; Figure 2), Gilbert deltas are encountered near and at the same depth as Paleozoic formations, providing evidence for paleo-valley incision (our observations and in ref. [59]). At Nefiach, for example, associated formations are 60 m high, resulting in an (under)estimation of the local ria paleodepth. They are the first sedimentary systems and the most proximal deposits preserved in the post-MSC Plio–Pleistocene fill.
Deposition profile 2 (DP2): The second depositional profile is inferred from the close association of flood-related alluvial conglomerates with marine sands of Trouillas (AF6). It corresponds to a “fan delta reworked by wave and storm processes”. It is characterized by a close association between conglomerates influenced by fluvial processes and their reworking by waves and storms, forming a sandy prograding wedge (AF6). Proximal parts of this profile are rarely observed/preserved due to margin tilting.
Deposition profile 3 (DP3): The last depositional profile corresponds to a wave-dominated delta. Its evolution from DP2 is gradual, marked by the increasing development of a delta plain and sheltered embayments (AF4 and AF5). Fine-to-coarse sands are transferred to a wave-dominated delta and redistributed parallel to the coast by wave processes such as beach barriers and spits (AF7). Embayments are dominated by settling processes but also include bayhead delta lobes at the mouth of distributaries (AF5), while coastal lakes develop in areas of lower fluvial input (AF4). Although the regime was probably microtidal as today, tidal currents may have been locally expressed (tidal flats lateral to mouth bars, flood deltas) due to the embayment configuration. Unlike DP1 and DP2, the continental part of DP3 consists of alluvial plain deposits (AF2 and AF3), with the coarsest fraction being restricted to the foot of main reliefs. Vertical alternations between confined (AF2) and unconfined alluvial deposits (AF3) likely reflect variations in the A/S ratio, respectively, decreasing and increasing. Two configurations are identified within DP3 (Figure 6): in DP3a, sediments are transferred offshore, forming mouth bars and front delta lobes; in DP3.b, large embayments develop and host bayhead delta lobes protected by barrier beaches and spits. Following [88], these two profiles vary with the A/S ratio, with 3.b being more developed during the rising/highstand relative sea level. Regarding prior considerations about alluvial-plain types (AF2 or AF3) and associated variations in the A/S ratio, AF3 (unconfined) and AF2 (confined) might be more developed in DP3.b and DP3.a, respectively (Figure 6).
Considering clinothem architecture, the evolution from DP1 to DP3 shows a decrease in foreset angle and an increase in topset length. Within the Pliocene infill, DP3 occurs basinward in younger deposits and likely accounts for the largest sediment volume, whereas DP1 and DP2 are only observed farther inland in older deposits considered representative of early progradation. Therefore, within certain limits, DP3 is expected to be the most representative depositional profile in the offshore record and will be used as a reference for synthetic modeling.

4.2. Seismic Facies

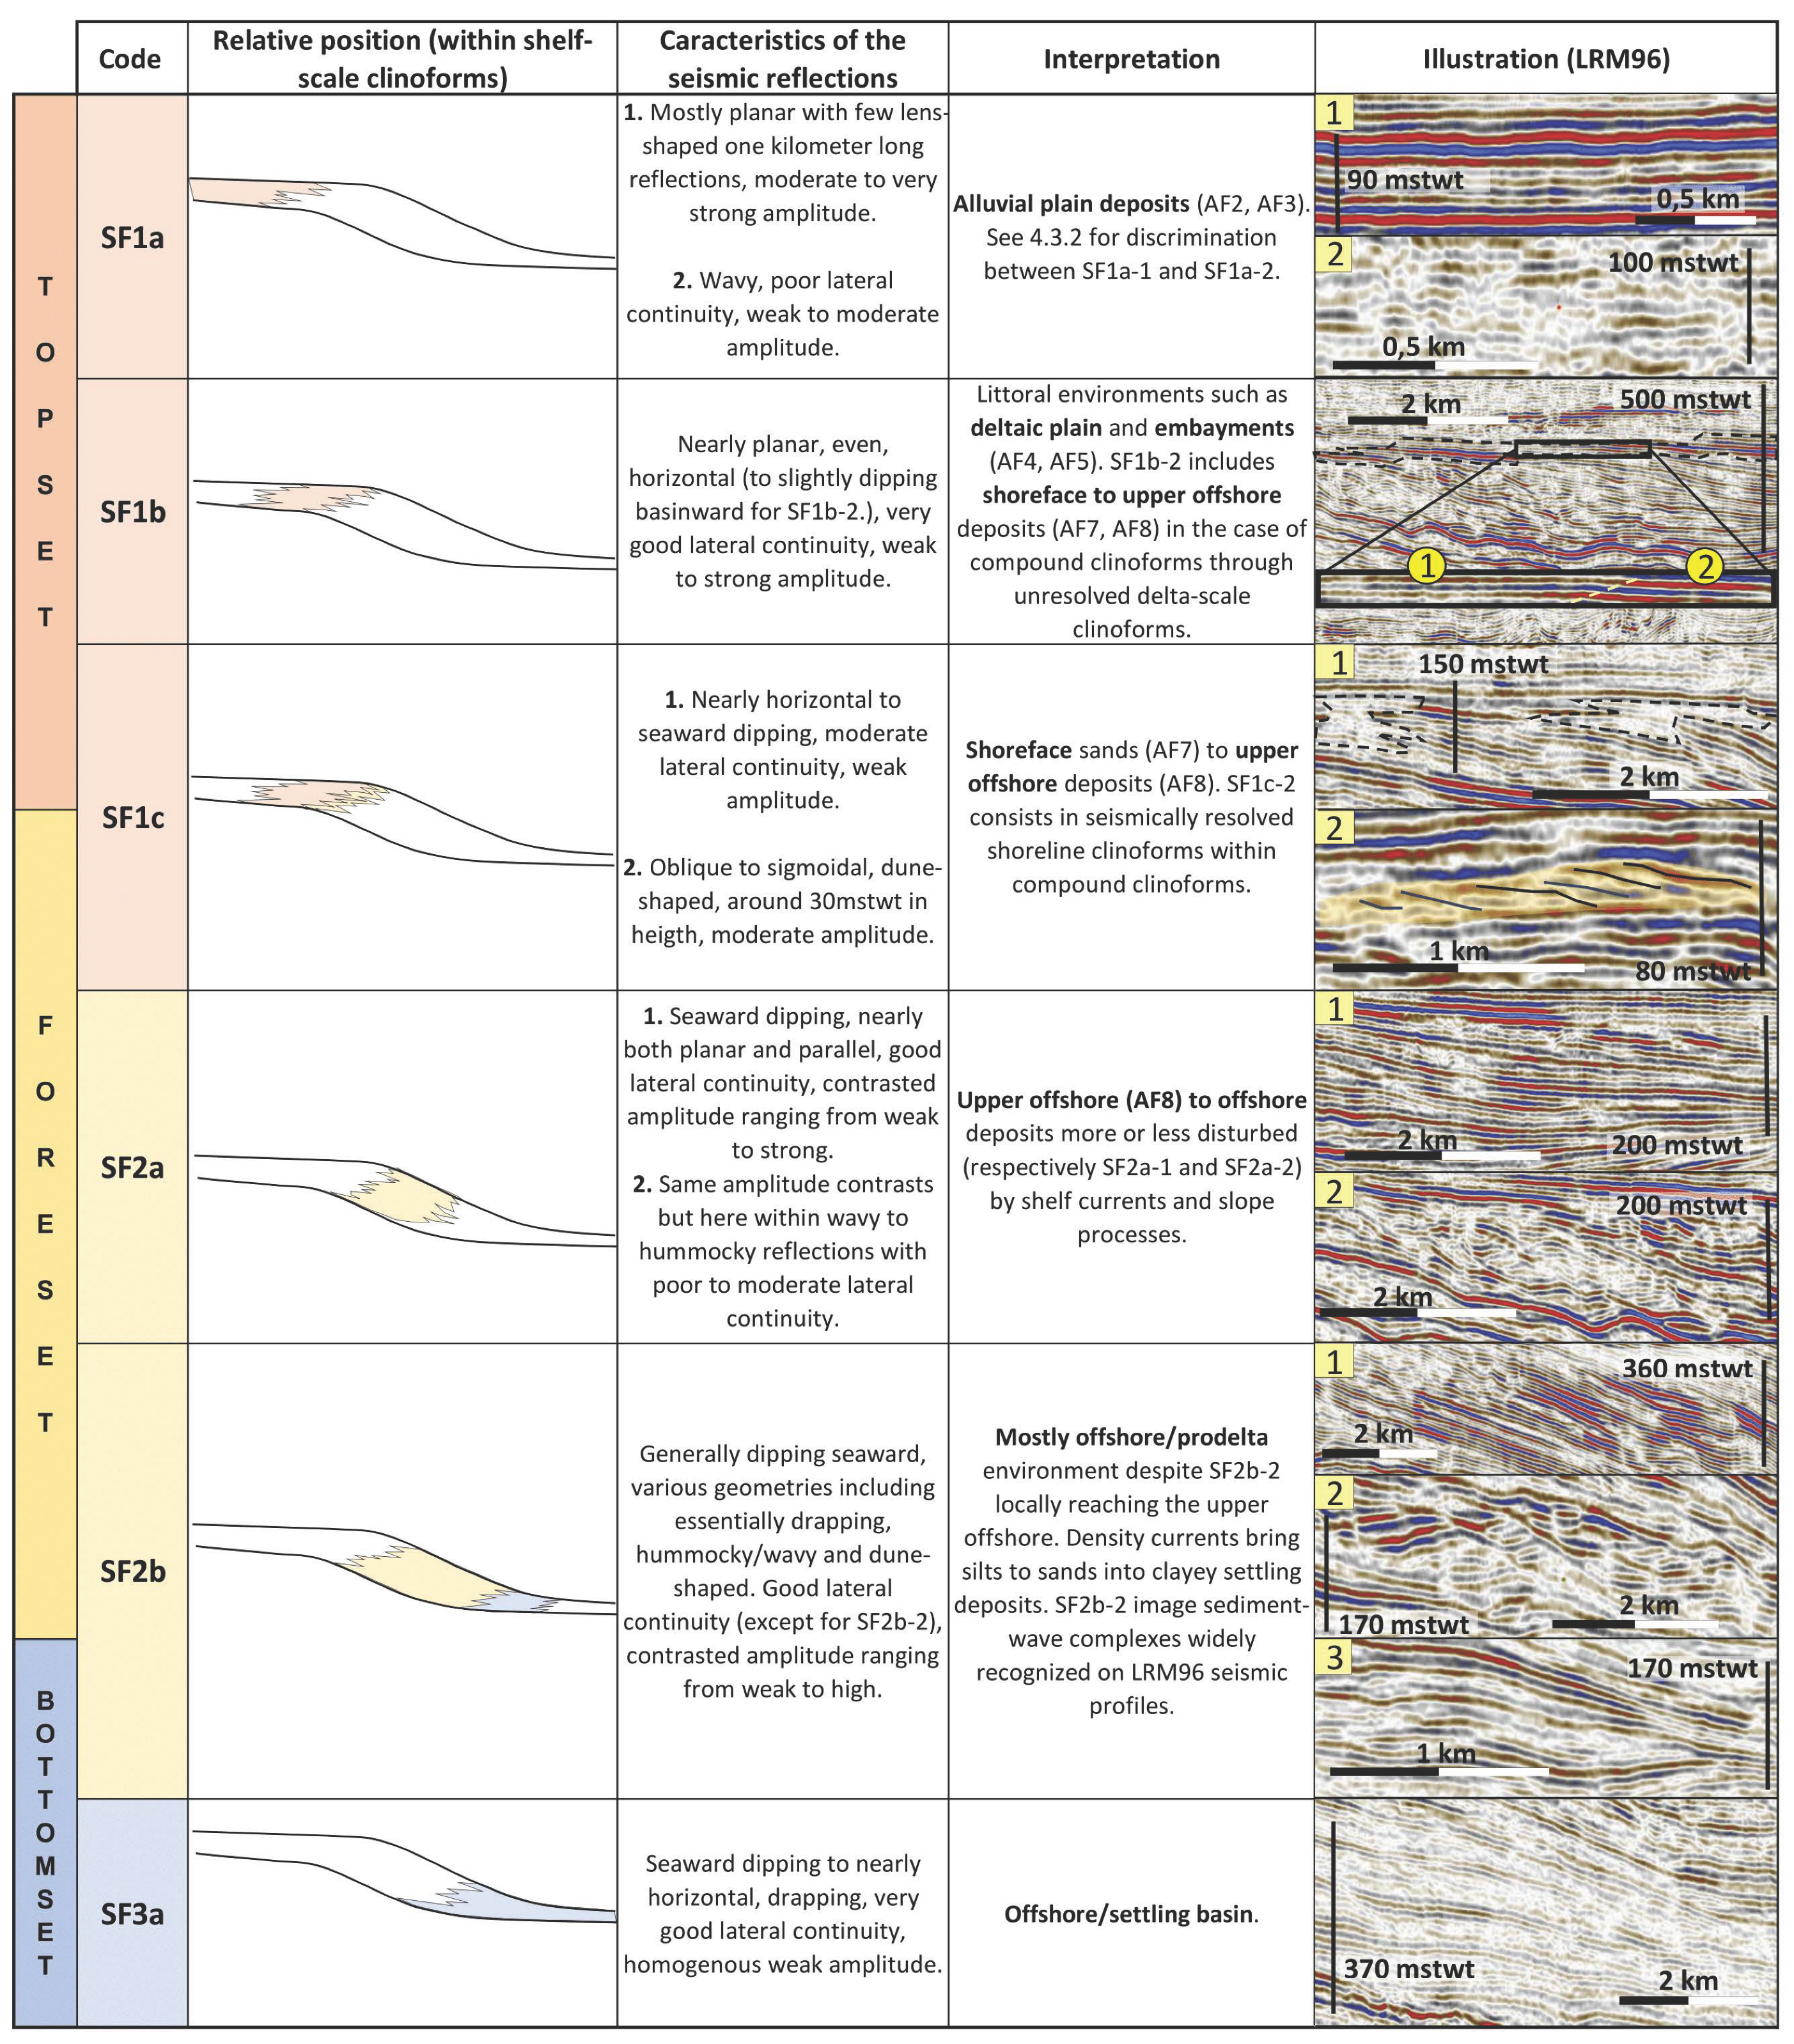
Six key seismic facies, labeled SF1a to SF3a (Figure 7), have been identified in the Pliocene offshore and are described below. As they belong to clinothems, a classification was first made regarding their relative position within clinoforms. Secondly, they were classified (distinguishing subfacies where needed) and interpreted based on the aspect of seismic reflections (i.e., amplitude, geometry, and continuity), the type of clinoform (e.g., shelf-scale, delta-scale, oblique, compound, sigmoidal, and hybrid), and, when required, based on the output of 2D synthetic seismic modeling.
Clinoforms were observed on two seismic datasets with different resolutions (see Section 3, Data and Methods). The observed clinoforms vary in size, dip angle, and shape. Most clinoforms exhibit a height of approximately 500 ms twt (~450 m), which qualifies them as shelf clinoforms. Small-scale clinoforms measuring 35 ms twt (~35 m) are locally observed and qualified as delta-scale clinoforms. Shelf clinoforms are mostly sigmoidal, while small-scale clinoforms appear dominantly oblique, although the vertical resolution is insufficient to properly image these geometries. Moreover, compound clinoforms (multiple rollovers per surface) are differentiated from hybrid clinoforms (a single rollover per surface).
Compound clinoforms are frequent in distal areas but absent in proximal parts of the seismic profiles. This pattern indicates a predominance of hybrid clinoforms over the Pliocene deposits, where marine-shelf deposits are either missing or unresolved in the topsets. In contrast, compound clinoforms likely include both continental and shelf deposits in their topsets. Without precise identification of rollover or delta-scale clinoforms, facies differentiation remains uncertain.
In deeper settings, wavy reflectors linked to sediment waves (k on Figure 7) may complicate rollover identification, thereby inducing uncertainties as well.
The following “Topset”, “Foreset”, and “Bottomset” sections refer to the shelf scale. Therefore, seismic facies related to shoreline clinoforms belong to the “Topset” section.

4.2.1. Topset

Two main seismic facies characterize the following topsets: SF1a and SF1b. A third facies, SF1c, is recognized locally.
SF1a
SF1a is mainly observed in proximal topsets (Figure 7) and consists essentially of sub-planar to wavy reflections with moderate continuity. Two subfacies are identified within SF1a. SF1a-1 displays high-amplitude, kilometer-long, and lens-shaped reflections and rare very-high-amplitude, pluri-kilometer-long, and flat reflections. SF1a-2 displays low-to-medium amplitude at an infra-kilometric scale in any direction (Figure 7).
Seismic facies SF1a is interpreted as reflecting a fluvial-related depositional environment. However, as observed onshore, we expect the occurrence of two distinct types of alluvial plain (confined and unconfined), which display major differences in sedimentary geometries and reservoir properties. We will, thus, perform synthetic modeling on those two types of alluvial plains to discriminate them in terms of seismic response (see Section 4.3) and refine our interpretation of SF1a.
SF1b
SF1b occurs in distal topsets (Figure 7) with uniform, nearly planar reflections showing good lateral continuity and slightly dipping basinward. Amplitude, ranging from medium to strong, tends to increase basinward. Two subfacies are identified within SF1b. SF1b-1 is the most common, characterized by planar reflections displaying low-to-medium amplitudes (Figure 7), either extending to the offlap break or passing laterally to SF1b-2 (Figure 7). The latter displays high-amplitude reflections, horizontal to slightly dipping and thickening basinward. The lateral transition from SF1a to SF1b is very progressive and both facies can be locally hard to distinguish. SF1b could image various depositional environments, from continental to marine domains depending on the clinoform type.
In the case of hybrid clinoforms, the shelf break is equivalent to the paleo-shoreline position meaning that topset part is composed of continental to littoral deposits. In that case, and given its distal position within topsets, SF1b might correspond to deltaic plain and/or embayments (AF4-AF5). Consequently, we performed synthetic modeling on AF4-5 for comparison with SF1b to test our interpretation.
In the case of compound clinoforms, the shelf break is situated below sea level. Therefore, marine deposits may occur within topsets. Delta-scale clinoforms (either subaerial or subaqueous) are expected within the shelf-scale topsets. They are 10s of meters high [10,12,89] and might, consequently, not be resolved in seismic data. In such cases, these deposits could account for the SF1b seismic facies, which would then correspond to marine-shelf deposits (AF7–8), ranging predominantly from shoreface sands to upper offshore clays.
SF1c
SF1c is subdivided into SF1c-1 and SF1c-2. SF1c-1 is usually found at the topset/foreset transition, spilling over onto upper foresets. It displays horizontal to seaward dipping reflections with an overall weak amplitude and varying lateral continuity due to disrupted reflections. Nevertheless, the amplitude locally becomes moderate to even strong in rare cases. Being located around the offlap break of hybrid shelf-scale clinoforms, i.e., the shoreline, SF1c-1 is interpreted as relatively shallow, open marine deposits. Furthermore, the dominance of low-amplitude reflection packages (SF1c-1, Figure 7) suggests relatively homogeneous sediments corresponding to shoreface wave-sorted sands accumulated above the fair-weather wave base (denoted as FWWB). This interpretation is also supported by the restrained vertical extension of SF1c-1 which is limited by the FWWB depth. Moderate-amplitude reflections of SF1c-1 are attributed to either coarser or less well-sorted material, belonging to mouth bars or tidal deposits. The rare high-amplitude reflections could be related to cemented shelly strata, as observed for the Dem’Mer cores (Figure 3). The disrupted reflections are coherent with spits, longshore bars, mouth bars, dunes, and other objects classically found in both wave- and fluvial-dominated delta.
SF1c-2 usually occurs in distal topsets within shelf-scale clinoforms and describes individualized bodies of around 30 ms twt in thickness and a few kilometers long on the dip axis (Figure 7). These bodies display characteristic oblique-to-sigmoidal, basinward dipping reflections, more or less resolved (Figure 8). SF1c-2 is interpreted as delta-scale clinoforms belonging to the (shelfal) topset part of compound clinoforms. Following this interpretation and considering the thickness of these bodies (around 30 m), they are likely composed of shoreface sands passing distally to upper-offshore, finer-grained deposits (AF7 to AF8). Such attribution could match in both size and composition with the sandy clinoforms described onshore for the Trouillas transect (Figure 2). Nonetheless, considering the limited vertical resolution of the seismic data, we question the seismic signature of these geometries and, thus, perform seismic modeling on these objects (see Section 4.3.1 and Section 4.3.3).
Locally on the seismic profiles, the shelf-break rollover is poorly defined or absent, making the topset/foreset transition unclear. A special attention must be given to delta-scale clinoforms observed in such a configuration, which could be subaqueous delta-scale clinoforms instead of shoreline ones. Such misinterpretation could lead to unreliable sedimentary facies predictions, as well as incorrect paleo-shoreline positioning and trajectory analysis.

4.2.2. Foreset

Four seismic facies characterize the shelf-scale foresets, labeled SF2a and SF2b, with the main discriminating characteristic being their location along clinoforms.
SF2a
SF2a is encountered in foresets and is divided into two subfacies, i.e., SF2a-1 and SF2a-2, both found at an intermediate position within shelf-scale foresets. Within both subfacies, reflections mostly dip basinward and their amplitude ranges from weak to strong. Despite SF2a-2 showing overall weaker amplitudes and less amplitude contrasts than SF2a-1, they mostly differ in terms of reflection geometry. While SF2a-1 displays well-bedded, regular, and subparallel reflections with good lateral continuity, SF2a-2 displays either hummocky or wavy geometries with moderate-to-poor lateral continuity (Figure 7).
SF2a is interpreted as reflecting open marine deposits along the shelf slope, corresponding mostly to offshore and prodeltaic environments (e.g., AF8). The amplitude contrasts are consistent with the sand/silt/clay alternations classically found between the FWWB and the storm-weather wave base (denoted as SWWB) and might locally be enhanced by either gravitational processes or cementation. The hummocky/wavy geometries observed in SF2a-2 are interpreted either as slumping and slope instabilities or sediment-waves induced by various currents affecting the shelf slope. Conversely, SF2a-1 is affected little to not at all by such processes.
SF2b
SF2b is found in middle foresets and farther down to the bottomsets compared to SF2a. It is divided into three subfacies. In SF2b, the seismic reflections are, generally, continuous and dipping basinward. The amplitude ranges from low to high, often alternating vertically. The reflections display various geometries ranging from planar (SF2b-1, Figure 7) to wavy (SF2b-2, Figure 7) or draping (SF2b-3, Figure 7). Dune-like geometries stacked in parallel and prograding upslope are observed, covering most of the foresets. These dune patterns, defining SF2b-2, commonly form complexes filling scours or localized in inflection areas.
This seismic facies is interpreted as indicative of middle-to-lower shelf slope environment influenced by density currents (their exact nature is beyond the objective of this paper). These currents bring silts and, possibly, sands in depositional environments situated below the SWWB, where clay deposition likely dominates through settling processes. This environment is referred to as a mixed-process prodelta environment (denoted as prodelta in figures and tables). Reflection geometries reveal the presence of various sedimentary structures and bodies, from sediment-waves of varying extension (previously interpreted as slumps [79]) to detrital lobes. The high amplitudes observed in SF2b can be attributed to clay-sand alternations and cemented strata associated with hiatuses.

4.2.3. Bottomset

SF3a
SF3a consists of very low-amplitude, continuous, draping reflections belonging to the bottomset (SF3a, Figure 7). This seismic facies corresponds to deep basin settings dominated by settling. Compared to SF2b (mixed-process prodelta), the environment described here appears more still, with rare to no density currents. Sands and silts are rarer, as well as sediment waves or other geometries linked to hydrodynamics. This environment is referred to as “settling basin”.
Large submarine canyons are found near the actual shelf edge [90,91]. They are not described in this study since they are only observed in the upper-Pliocene to (mainly) Quaternary.

4.3. Forward Seismic Modeling

Following the abovementioned uncertainties about depositional facies interpretation from seismic facies, we conducted 2D synthetic seismic modeling. We investigated the seismic responses of AF2, AF3, AF4, AF5, and AF7, with a particular focus on refining topsets interpretation. We did not model open-marine deep deposits, as we lack outcrop/borehole analogs for those facies.
For each sedimentary facies, the measured P-wave velocity and density values form distinct and consistent couples (Table 2). These differences produce systematic acoustic-impedance contrasts at facies boundaries in the geological models, which generate distinguishable seismic facies and allow the underlying sedimentary facies to be inferred.

4.3.1. Sensitivity Test

Vertical resolution plays an important role in downscaling the seismic signal. Most sedimentary bodies observed onshore are thinner than the vertical resolution of the seismic offshore (15 m, from LRM96 profiles). Therefore, we first assessed the influence of strata thickness (ranging from approximately 1 to 8 m) and spacing (from about 3 to 50 m) on the seismic signal by testing various configurations. This was achieved by taking an example of alluvial deposits containing low-velocity floodplain deposits (Fpo) and intercalated higher-velocity Ca beds (Figure 9). The results indicate that strata as thin as 1 m can produce detectable amplitude contrasts. Quantitatively, the reflection amplitude increases with strata thickness. A single stratum of a given thickness generates a higher-amplitude reflection compared to several thinner strata of equivalent cumulative thickness.
Sensitivity tests demonstrate that sedimentary objects with thicknesses below the seismic vertical resolution can produce a seismic signature characteristic of lithologies, thickness variations, impedance contrasts, or facies-stacking pattern. Therefore, upscaling from outcrop-scale bodies to conventional seismic data might be feasible through seismic modeling.

4.3.2. Modeling of Topset Facies (SF1a and SF1b)

Discriminating Between Alluvial and Littoral Deposits
In the topsets, seismic facies SF1a includes the following two subfacies: SF1a-1, with continuous, high-amplitude reflections, and SF1a-2, with discontinuous, medium-amplitude reflections (Figure 7). SF1a-1 is best explained by calcareous levels (calcrete beds, pedoturbated horizons, and lacustrine limestones) found in AF2–AF4, as they display the highest Vp/density values (potential highest impedance contrasts) and show good lateral continuity. Amalgamated channels in AF2 may also yield high contrasts but rarely generate planar, continuous reflections at the kilometric scale. Conversely, wide channel belts in AF3 can produce continuous reflections, though of lower amplitude due to weak density contrasts with the silty floodplain. Finally, coastal deposits (AF4-5) include diverse lithologies, some of which could also account for high amplitudes.
Discriminating Confined vs. Unconfined Alluvial Plain
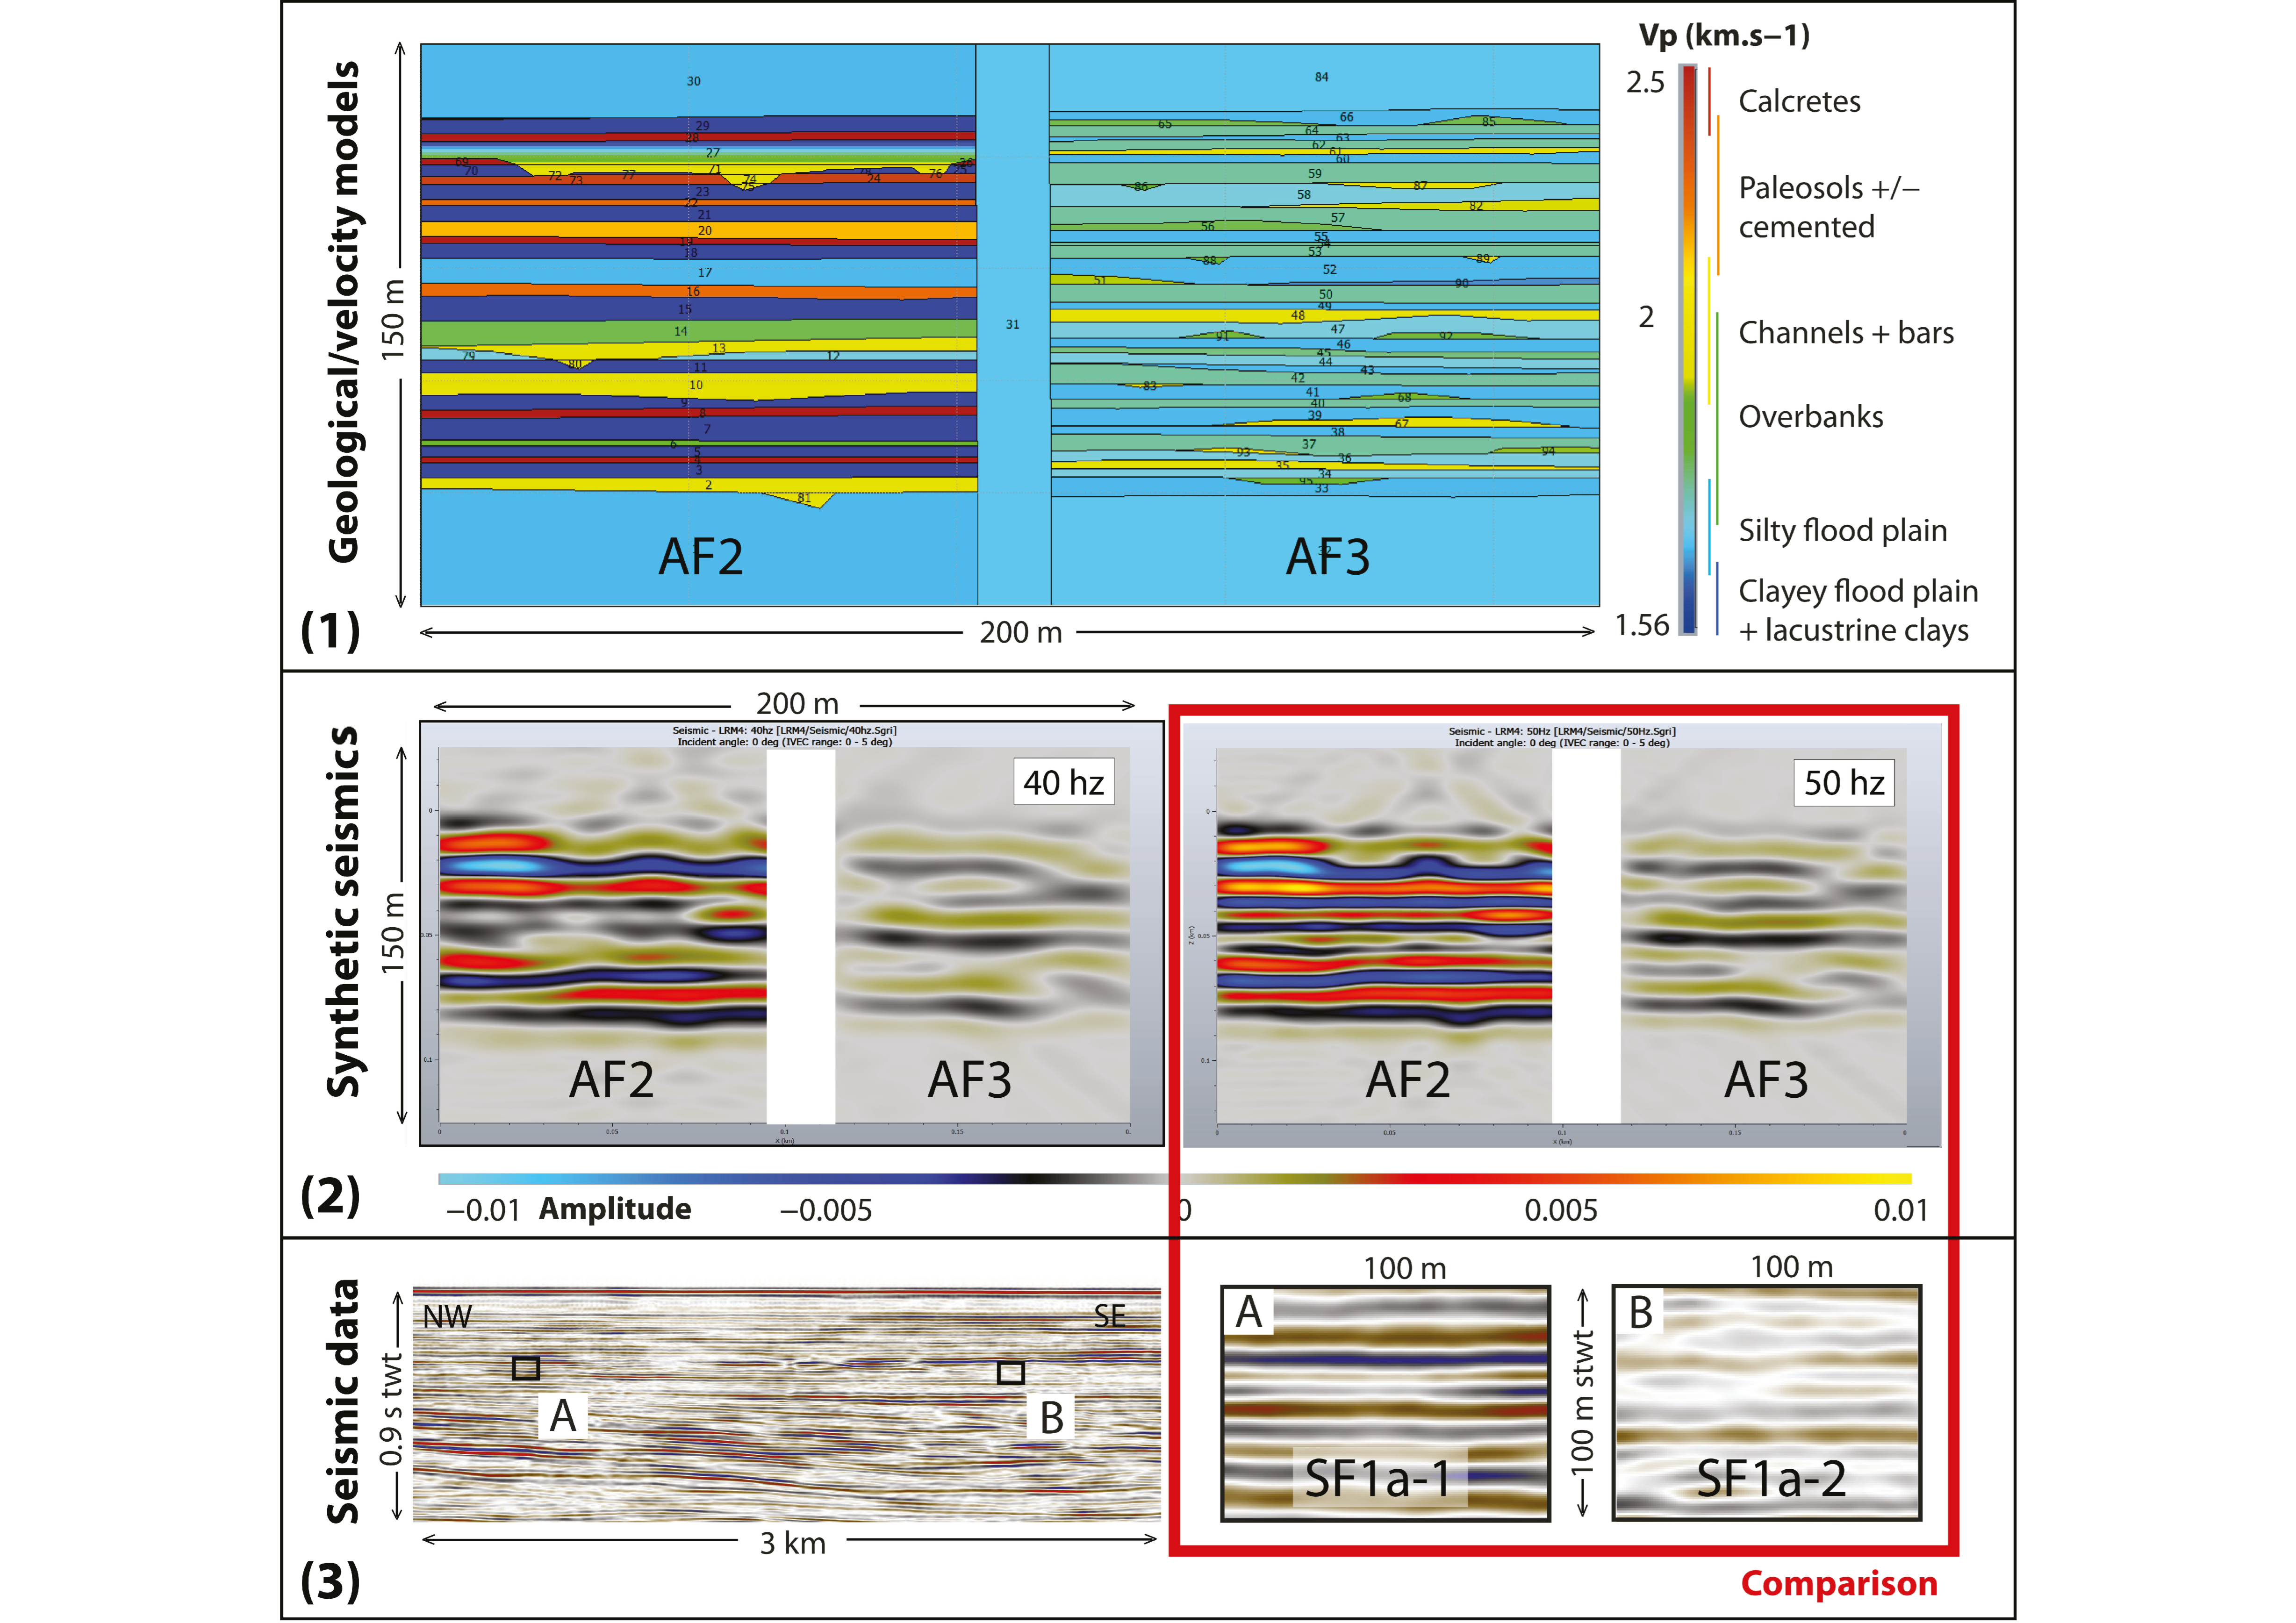
SF1a is the most abundant seismic facies found in the topsets, usually observed in proximal topsets. Forward modeling shows that SF1a could correspond to alluvial plain deposits and calcrete beds, as frequently encountered in AF2. Unconfined alluvial deposits (AF3) may, in turn, correspond to subfacies SF1a-2 (Figure 7). We performed additional modeling to test the seismic signatures of AF2 and AF3, as well as the possibility of discriminating them from each other (Figure 10). The geological model for AF2 (Figure 10—top left) contains floodplain deposits (FPo) alternating with calcrete beds (Ca) and channels. In contrast, the geological model of AF3 (Figure 10—top right) is dominated by overbank deposits (CS1-2-3) alternating with silty floodplain deposits (FPr).
As a result, AF2 generates very-high-amplitude reflections compared to AF3 (Figure 10(2)). This is attributed to the high impedance contrast between floodplain soft clays and hard calcrete beds. Indeed, limestone is the only lithology displaying high seismic velocities in our case study. Moreover, we observe a good agreement between the synthetic seismics and observed AF2/SF1a and AF3/SF1a-2, notably for a dominant frequency of 50 Hz (see red square on Figure 10). The wavy and disrupted reflections observed within SF1a-2 are interpreted as resulting from numerous small crevasse splay lobes and minor channel avulsions. A specific case concerns incised valley fills, which are likely composed of amalgamated sandy channels and bars, along with thin floodplain deposits. Due to the minimal velocity contrast between sand and clays (Table 1) and the absence of calcrete, this configuration mimics subfacies SF1a-2.
Seismic facies SF1b belongs to distal topsets, which, in the case of hybrid clinoforms, correspond to delta plain/embayments environments (AF4-AF5), landward of the shoreline. Comparing the synthetic seismic of AF4-AF5 with SF1b (see Figure 11) results in a good match. In the case of compound clinoforms, if situated between the shoreline and the shelf-break, SF1b is interpreted as shelf deposits (marine), represented by either AF7 or AF8 (see SF1b in Section 4.2.1).
Additionally, we performed synthetic modeling on AF2, including calcrete beds (Ca) in a floodplain (FPo), and AF4 (Figure 11) in order to question the possibility of discriminating alluvial facies from deltaic facies based on seismic facies. The outputs are compared and confirm that amplitude contrasts generated by a set of meter-thick calcretes are far superior to that generated by AF4-5. Although calcretes are not likely to be extensively developed in delta plain environments, lacustrine carbonates may occur and display the same type of contrast and response. They are, however, rare.

4.3.3. Modeling of Delta-Scale Clinoforms

In the seismic data, we locally observe 30 ms twt high sigmoidal reflections prograding basinward. These are interpreted as subaerial delta-scale or shoreline clinoforms. This interpretation is consistent with the dimensions of the shoreline clinoforms observed onshore (AF6 and AF7), which are ~25–30 m high. To test this attribution, we performed synthetic seismic modeling on a geological model displaying two superimposed sets of 30 m high, sandy, and prograding clinoforms with a gradual decrease in grain size toward the bottomsets (Figure 12). The model provides convincing results with similar geometries, amplitude contrasts, and phases between the synthetics and data. Such a reflection configuration is, thus, interpreted as shoreline clinoforms.
All established relationships between seismic facies and sedimentary facies associations are synthesized in Table 3.
Several studies in the Roussillon Basin have identified the onshore markers of the Messinian erosion surface and Zanclean reflooding, as well as the main sedimentary facies composing the Pliocene deposits of the Roussillon plain, e.g., [39,52,64,71]. However, a detailed sedimentological analysis of these facies has so far been lacking. This work allows us to perform the first comprehensive study of facies distribution over space and time in this area, providing new insights that significantly improve the prediction of reservoir distribution, particularly offshore through seismic facies analysis.

4.4. Revisited Interpretation of Offshore Seismic Profiles

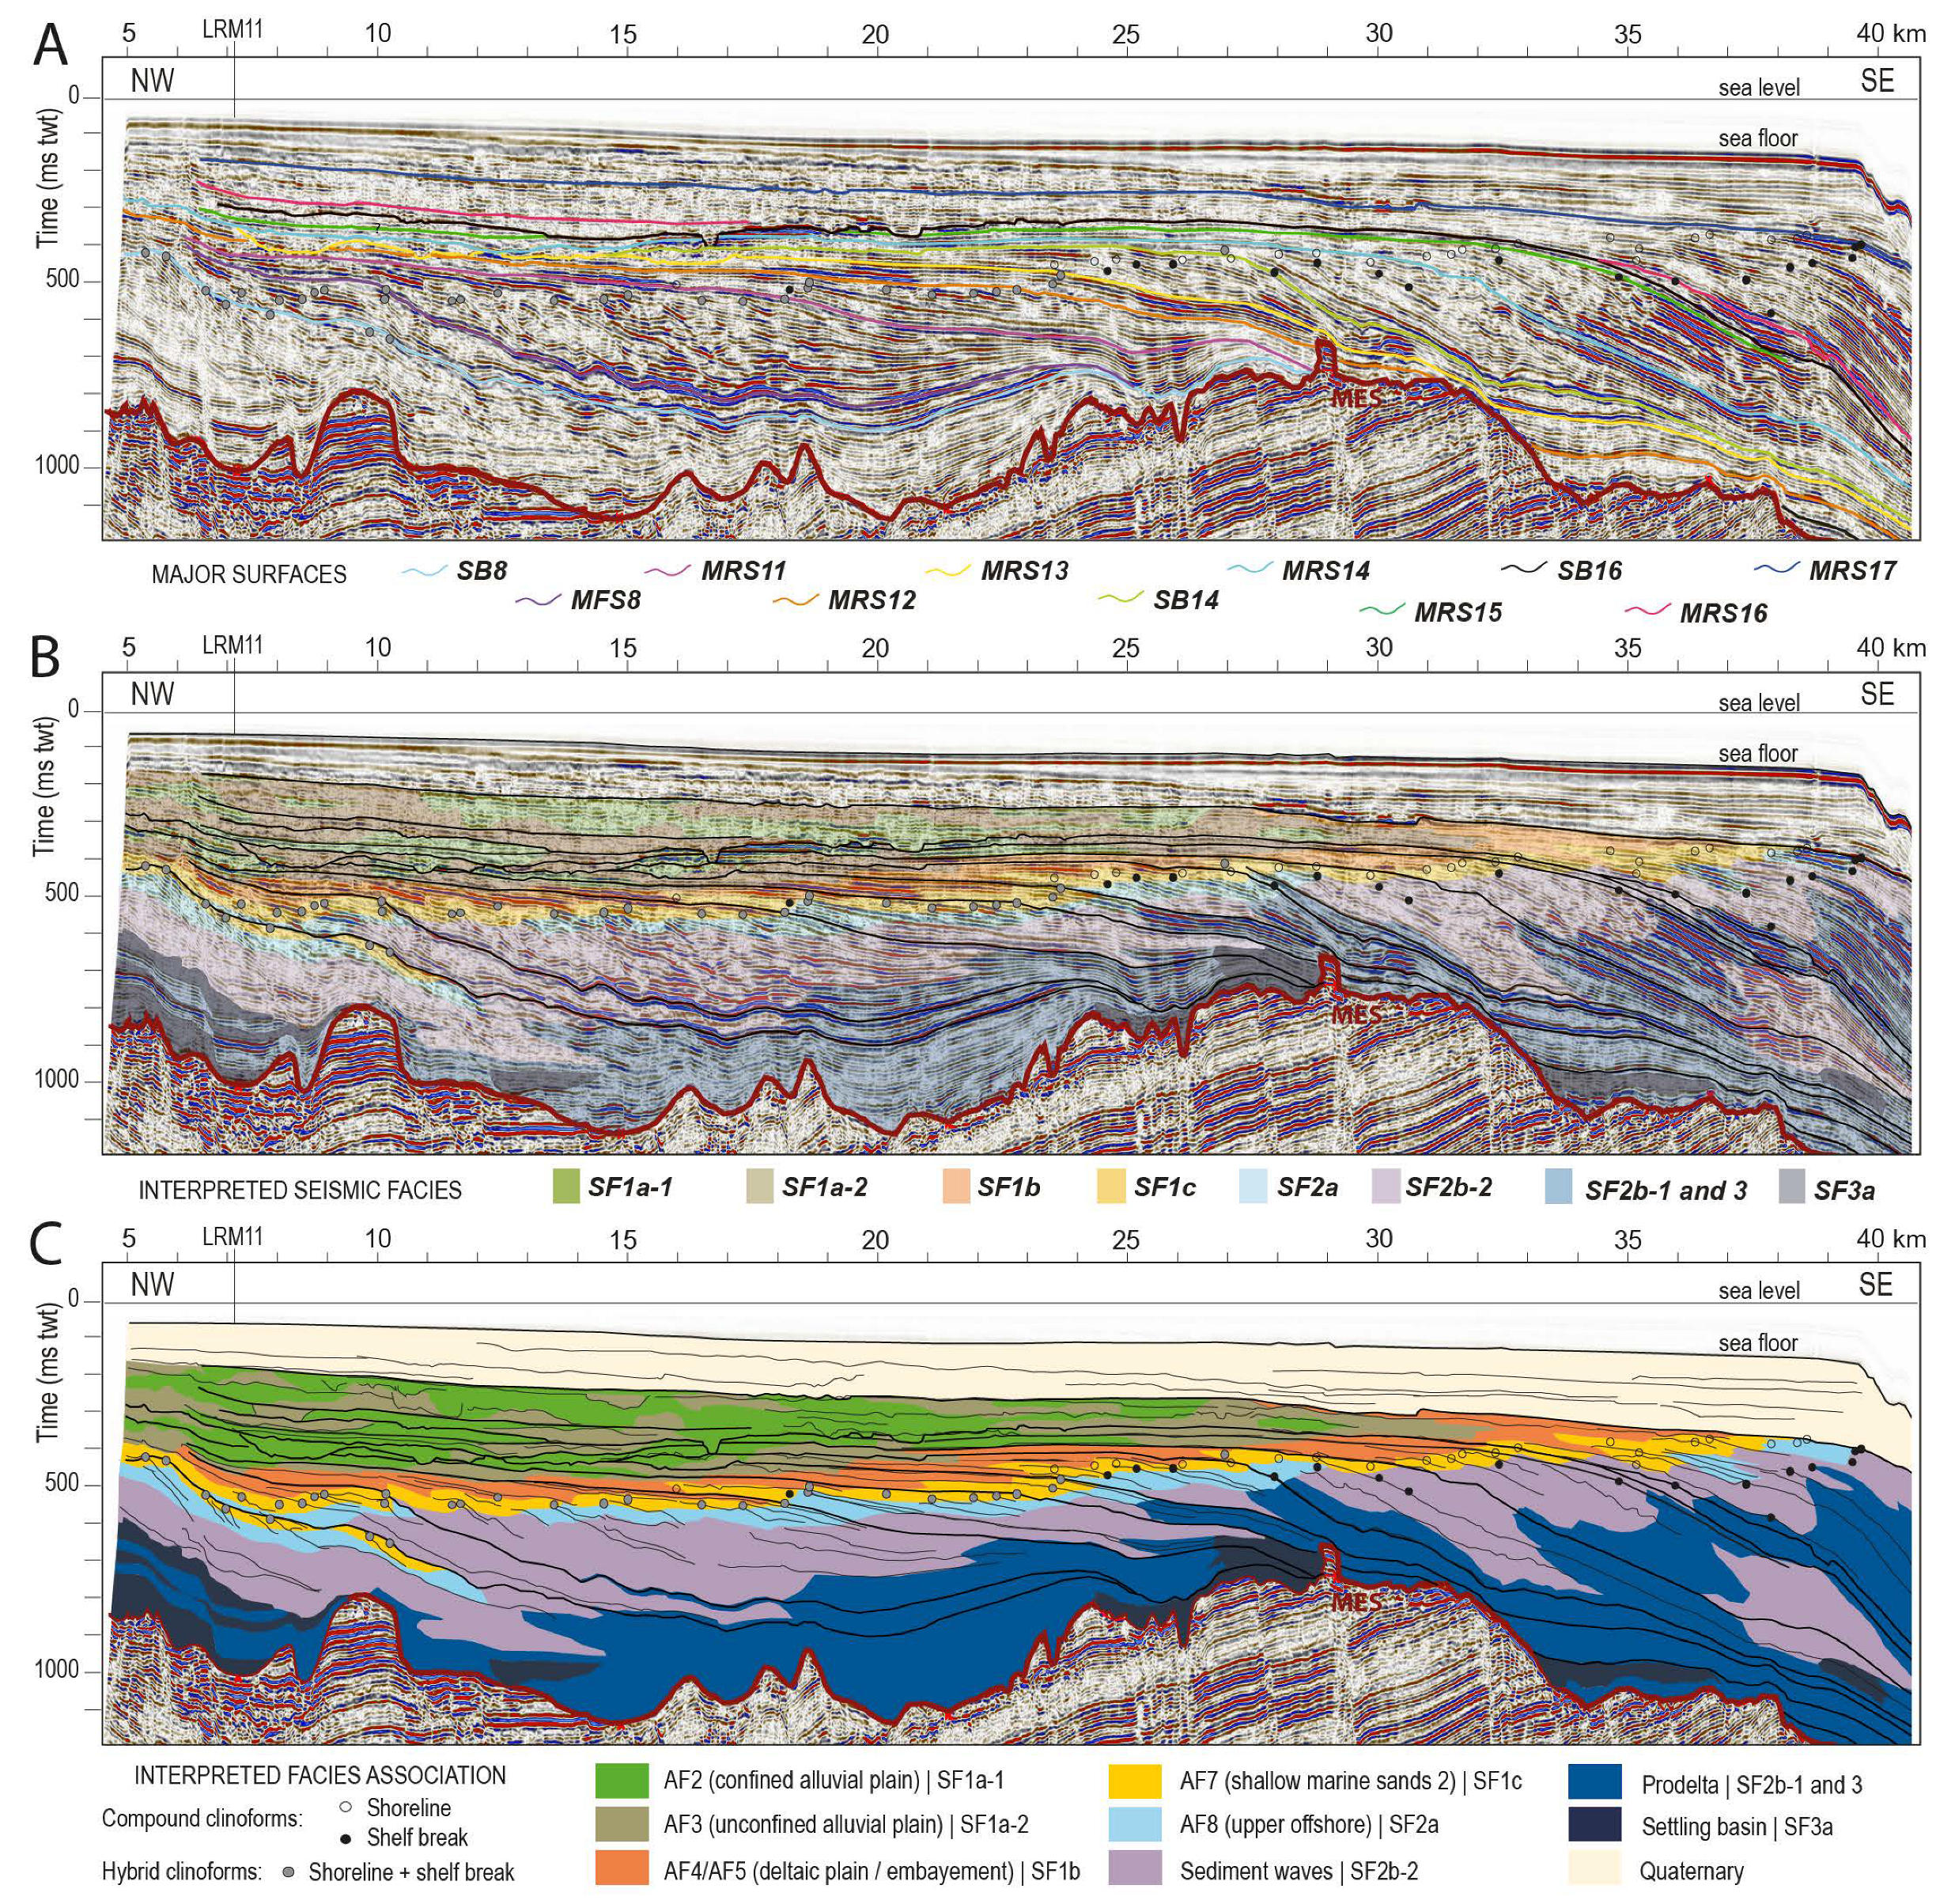
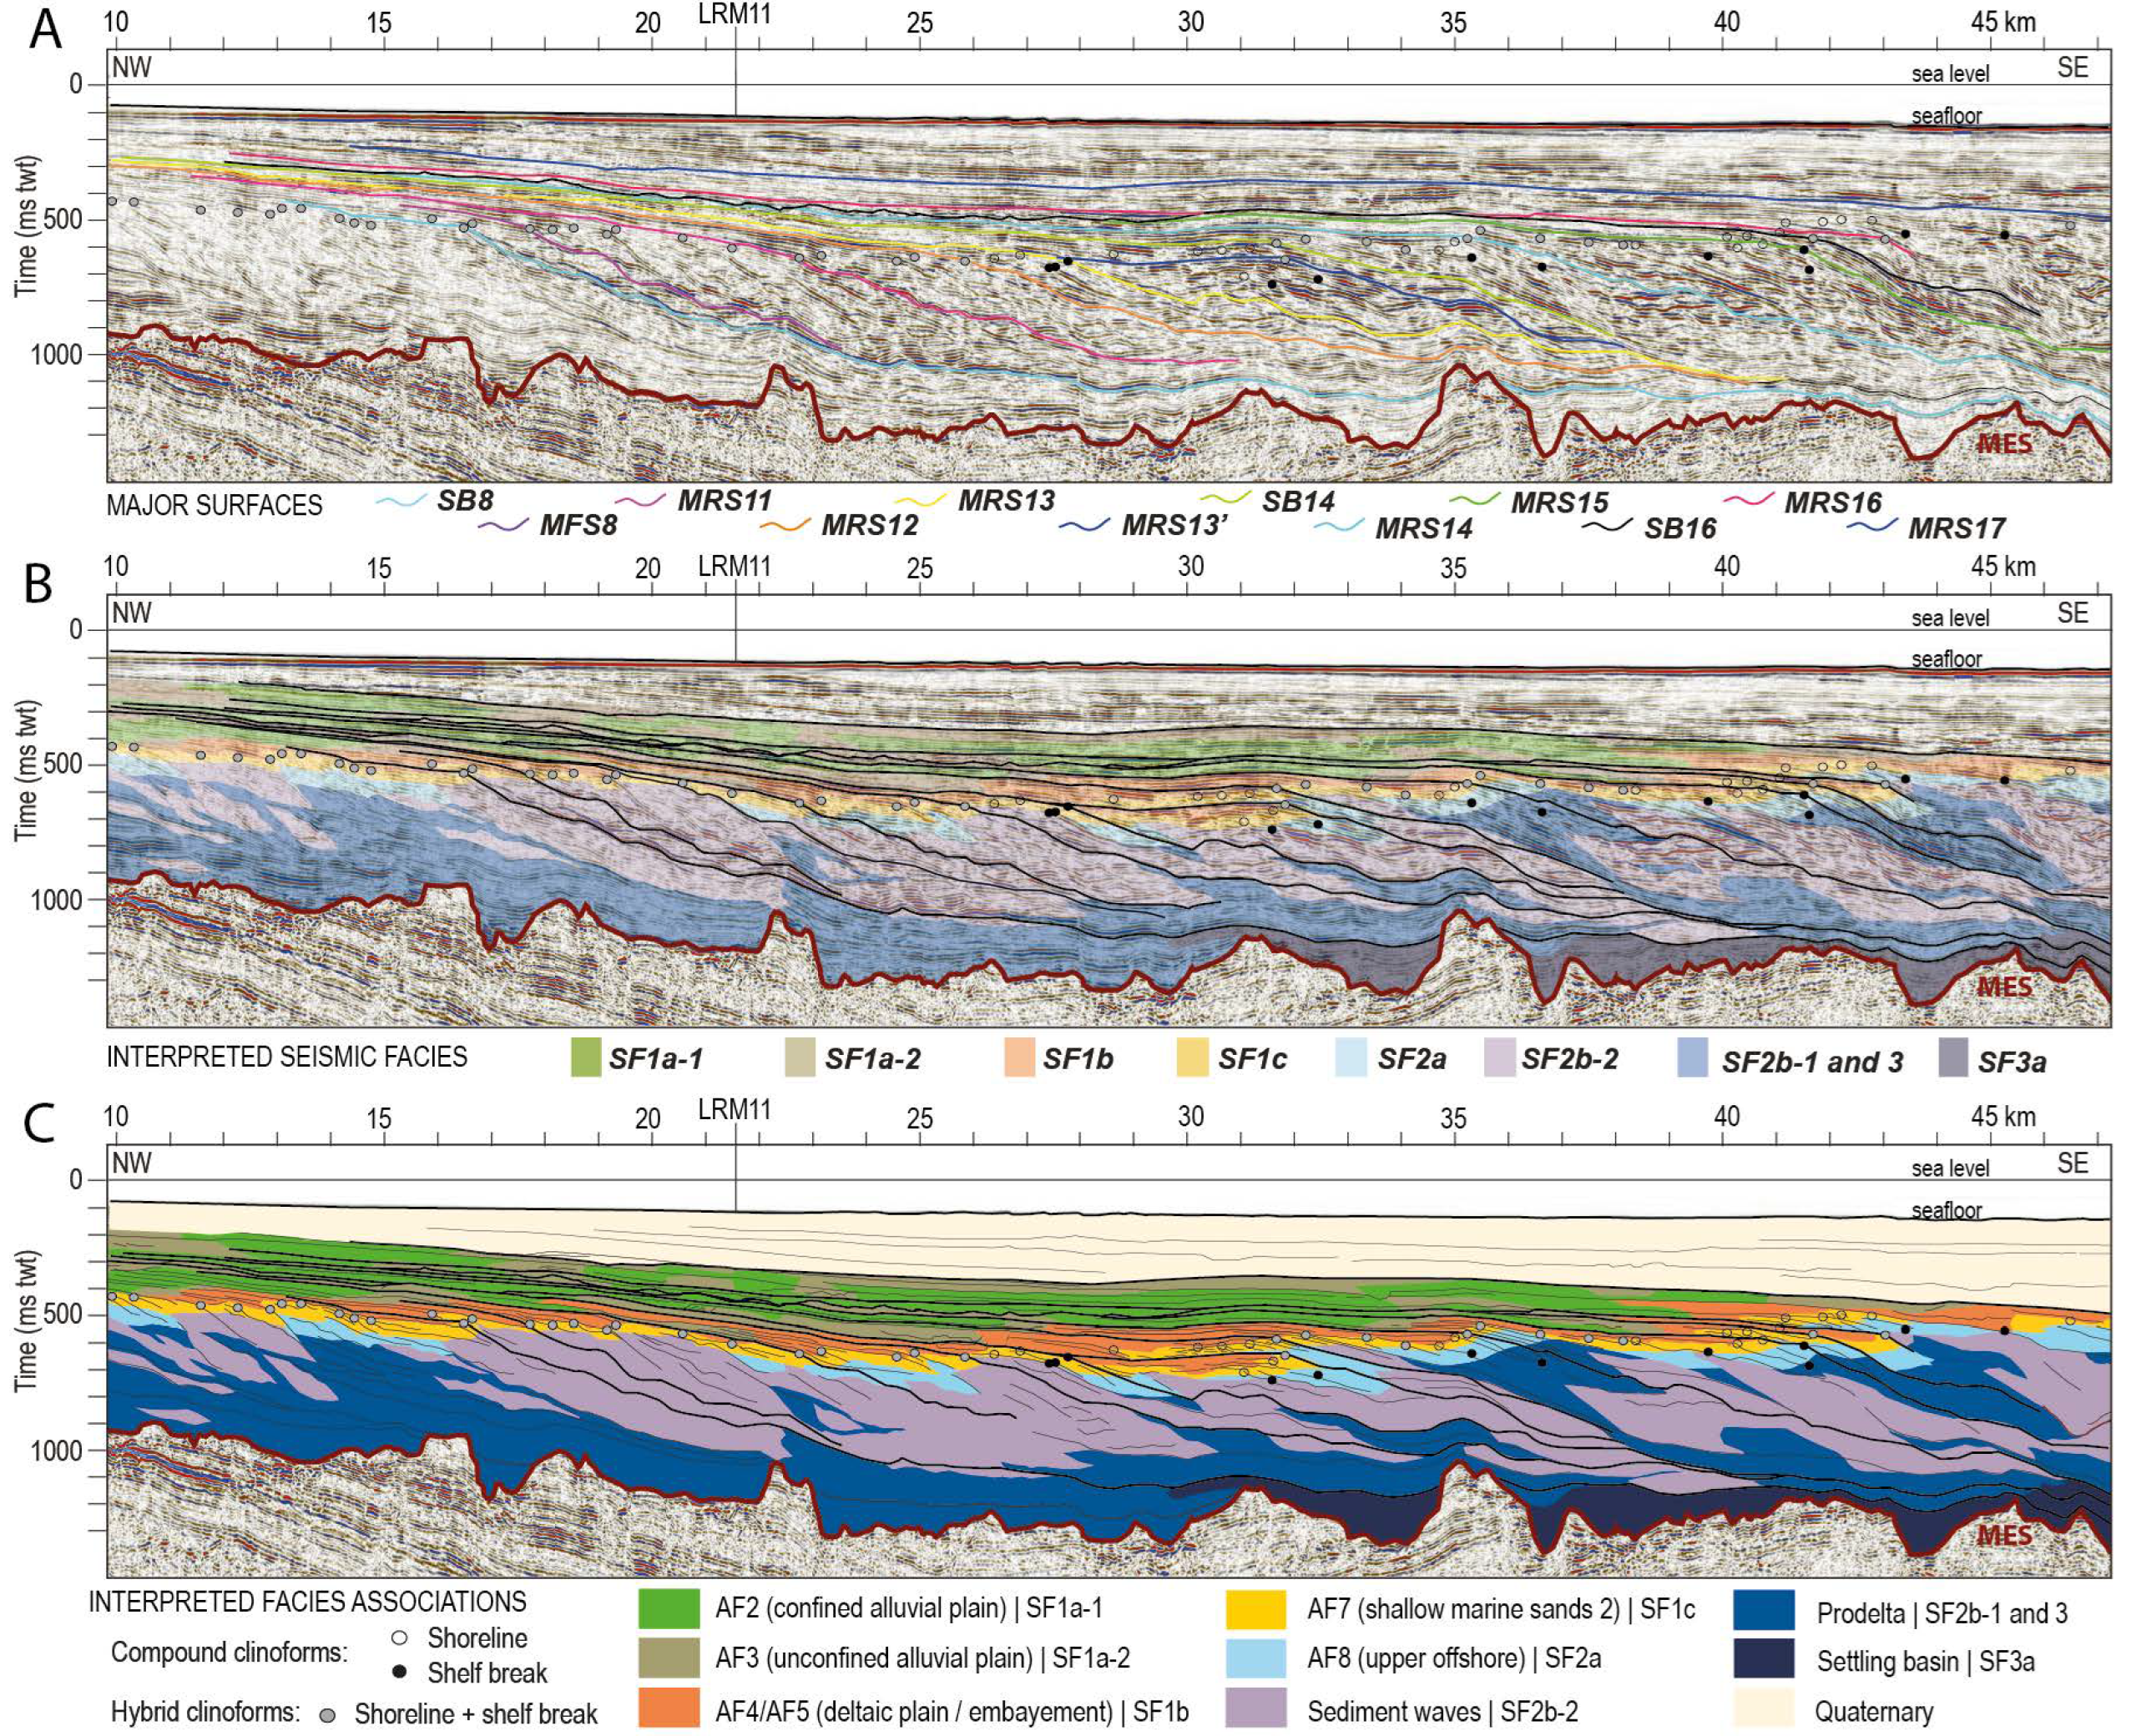
We interpreted three seismic profiles to evaluate the relevance of the proposed methodology and to recompose the spatial and temporal evolution of the Pliocene sedimentary wedge. Two dip-oriented profiles (LRM4 and LRM10, Figure 13 and Figure 14) and one strike-oriented (LRM11, Figure 15) were interpreted in terms of clinoform geometries, rollover trajectories, seismic facies, and corresponding sedimentary facies distribution. Although locally perturbed by the presence of sediment waves, the shelf-scale clinoforms observed in the seismic profiles can, generally, be traced seaward along their entire length. Those displaying a unique rollover are interpreted as hybrid clinoforms while those displaying multiple rollovers are considered as compound clinoforms. Most of the hybrid clinoforms are a few hundreds of meters tall, while large compound clinoforms that merge with the continental slope are close to 1 km (~800 m).
The two dip profiles LRM4 and LRM10 (Figure 13 and Figure 14) exhibit comparable patterns in rollover trajectories, which are discussed below together with the sedimentary facies interpretation. Despite local variations (described below), the facies distribution along the clinothems tends to follow a similar organization as on the LRM4, LRM10, and LRM11 profiles. Along the dip axis, it starts with SF1a (AF2-3) in proximal topsets position, passing laterally to SF1b (AF4-5) in distal topsets position. SF1a-1 (AF2) is often observed at the transition between SF1a-2 (AF3) and SF1b (AF4-5). SF1b transitions distally to SF1c (AF7), either as distal topset in compound clinoforms or as proximal foreset in hybrid clinoforms. Then, SF1c transitions to SF2a (AF8), mainly in proximal foreset position, followed by SF3a (settling basin/offshore deposits) from the lower foresets down to the whole bottomsets. SF2b (density-current-related deposits, including sediment waves and prodelta) is commonly intercalated between the former seismic facies across both proximal and distal foresets.

4.4.1. LRM4

The seismic profile LRM4 is divided in six clinoform packages reflecting different A/S ratio configurations (Figure 13). The distances used to delimit package boundaries refer to shelf-break positions. A generalized tilting of the Pliocene series is evidenced by the seaward dip of the topset geometries.
Figure 13. Interpretation of LRM4 seismic profile (dip orientation, see location in Figure 1) in terms of seismic facies and sedimentary facies associations. (A) Seismic profile with all major stratigraphic surfaces of the Pliocene as colored horizons (including Plio-Quaternary boundary); (B) Seismic profile with seismic facies interpretation, major stratigraphic surfaces as bold black horizons, and roll-overs with associated clinoform-type as circles; (C) Seismic profile with sedimentary facies interpretations, major stratigraphic surfaces as bold black horizons, minor stratigraphic surfaces as light black horizons, and roll-overs with associated clinoform-type as circles. Six shelf-scale clinoform packages are distinguished based essentially on rollover points trajectories and separated by major stratigraphic surfaces (SB8, MRS11, MRS12, MRS14, SB16, and MRS17). Sedimentation appears strongly influenced by the Messinian paleo-topography and, thus, differs in whether clinothems are confined in the paleo-valley between km 5 and 29 or extend beyond. MES: Messinian Erosion Surface.
Geosciences 15 00383 g013
Clinoform package 1 extends from km 5 to 10, bounded above by SB8 (blue, Figure 13A). Clinoform package 2 extends from km 5 to 18, bounded by SB8 and MRS11 (pink, Figure 13A). Clinoform package 3 extends from km 16 to 23, bounded by MRS11 and MRS12 (orange, Figure 13A). Clinoform package 4 extends from km 21 to 30, bounded by MRS12 and MRS14 (blue, Figure 13A). Clinoform package 5 extends from km 30 to 33, bounded by MRS14 and SB16 (black, Figure 13A). Finally, clinoform package 6 extends from km 33 to 39, bounded by SB16 and MRS17 (blue, Figure 13A).
In the very landward part of the LRM4 profile (km 5), the geometries are not well resolved. Moving seaward (km 6 to 10), descending progradation takes place along oblique clinoforms with no topset preservation and defines clinoform package 1, topped by the SB8 surface (light blue, Figure 13A). Due to the lack of accommodation-space creation, the shoreface sands (SF1c) appear relatively thin yet well connected laterally, except for areas where they have been dug out through erosive processes during progradation.
Following a pronounced backstepping (rollover retreating landward to km 5), an overall large-scale progradation is observed from km 5 to 18, defining clinoform package 2, which ends with MRS11. Within this overall large-scale progradation, periods of slight aggradation (ascending trajectory) allow for the preservation of a few topsets, essentially through deltaic plain deposits (SF1b).
Clinoform package 3 extends from km 16 to 23 and starts with a backstepping event above MRS11, which shifts the shoreline approximately two kilometers landward. Clinoform package 3 then displays an ascending shoreline trajectory followed by a strictly horizontal trajectory in its terminal part and no topset preservation. The toplap surface atop this package is named MRS12 (orange, Figure 13A) and marks the transition toward clinoform package 4. During the initial ascending trajectory, proximal topsets are well identified upstream and dominated by the deposition of SF1a-1, passing downstream to SF1a-2 and then SF1b closer to the shoreline.
Package 4 (km 21 to 30) starts with backstepping followed by ascending and then prograding shoreline trajectory. The aggradational component (ascending trajectories) becomes more pronounced compared to former packages, enabling the preservation of coastal series exceeding 100 ms twt in thickness. The laterally equivalent alluvial deposits situated upstream are partially eroded. Indeed, clinoform package 4 records the onset of Pliocene fluvial valley incision, mainly expressed along a sequence boundary merged with the MRS13 surface (yellow, Figure 13A). Topsets show alternating phases of valley incision and fill atop MRS13, reflecting A/S ratio fluctuations that create complex distributions of confined (AF2) and unconfined (AF3) alluvial-plain types. It is important to note that the MRS13 surface also corresponds to the generalized establishment of compound clinoforms, which were previously rare compared to hybrid clinoforms. Package 4 ends with MRS14 through pure progradation associated with renewed major incision of alluvial series upstream.
Beyond this point, clinoform architecture progressively evolves, making facies differentiation increasingly uncertain. While proximal rollovers (e.g., at km 24) may still suggest shoreline positions, the ambiguous distribution of facies hinders a clear distinction between shoreface deposits and more distal environments. Furthermore, the high-amplitude facies (SF1b-2), indicative of thick delta plain deposits in earlier clinoform packages, is no longer observed beyond km 26. While the development of compound clinoforms induces spatial drift between the shoreline and the shelf break, the distance between these two points rarely exceeds 2 km on LRM4, up to surface SB16 (onset of clinoform package 6), suggesting limited marine shelf extension.
The transition from package 4 to 5 corresponds to an almost linear ascending shoreline trajectory displayed across package 5 (km 30 to 33). This phase, starting with MRS14, is recorded upstream by thick alluvial deposits in topset position, though these deposits are again strongly incised by surface SB16 marking both the culmination and termination of fluvial valley incision. This event, through the deposition of SB16 surface (black, Figure 13A), concludes package 5.
Finally, package 6 extends from km 33 to 39, displaying overall progradational-ascending shoreline trajectory that fills the upstream fluvial valleys and pursue topset aggradation above. This package shows the development of compound clinoforms with increased distance between shoreline and shelf break (reaching 4 km versus <2 km in previous packages), promoting enhanced shoreline mobility that complicates the prediction of lateral facies distribution. Package 6 is capped by an erosional surface named MRS17, marking the top of the Pliocene series.

4.4.2. LRM10

Seismic profile LRM10 is divided in 6 clinoform packages (Figure 14). As in LRM4, a generalized seaward tilting of the Pliocene series is evidenced.
Figure 14. Interpretation of the LRM10 seismic profile (dip orientation, see location in Figure 1) in terms of seismic facies and sedimentary facies associations. (A) Seismic profile with all major stratigraphic surfaces of the Pliocene as colored horizons (including Plio-Quaternary boundary); (B) Seismic profile with seismic facies interpretation, major stratigraphic surfaces as bold black horizons, and roll-overs with associated clinoform-type as circles; (C) Seismic profile with sedimentary facies interpretations, major stratigraphic surfaces as bold black horizons, minor stratigraphic surfaces as light black horizons, and roll-overs with associated clinoform-type as circles. Six clinoform packages are distinguished based on the rollover points trajectories and separated by surfaces SB8, MRS11, MRS13′, MRS14, SB16, and MRS17. MES: Messinian Erosion Surface.
Geosciences 15 00383 g014
Clinoform package 1 extends from km 10 to 16, bounded by SB8 (blue, Figure 14A) above. Clinoform package 2 extends from km 16 to 23, bounded by SB8 and MRS11 (pink, Figure 14A). Clinoform package 3 extends from km 23 to 32, bounded by MRS11 and MRS13′ (dark blue, Figure 14A). Clinoform package 4 extends from km 28 to 35, bounded by MRS13′ and MRS14 (blue, Figure 14A). Clinoform package 5 extends from km 36 to 42, bounded by MRS14 and SB16 (black, Figure 14A). Finally, clinoform package 6 extends from km 42 onwards, bounded by SB16 and MRS17 (blue, Figure 14A).
Clinoform package 1 (km 10 to 16, Figure 14) is dominated by gently dipping, low-amplitude, transparent reflections. Oblique to sigmoidal clinoforms display almost pure progradation (S > A~0) as indicated by the straight trajectory of the rollover points, running parallel to the topsets. Though, a minor rise in rollover trajectory is identified at km 13. Such an aggrading episode, even though minor compared to the prograding trend, is enough to preserve some topsets. Indeed, clinoform package 1 displays AF4-5 deposits with a rather short upstream lateral extension (~2 km), grading westward into AF3 and then quickly into AF2. This creates a coherent facies succession along a distal-proximal profile, extending from the delta plain/embayment to successively unconfined and confined alluvial plains. The limited presence of AF3 is also expected as this facies association is likely to develop in more aggrading systems. Lateral substitution from AF2 to AF4 in the dip axis, indicates a progressive increase in accommodation space seaward. This pattern may be accentuated toward the margin due to its seaward tilting [20,51]. Clinoforms from package 1 (Figure 14) form a globally prograding prism in which only the very distal part of the topsets is sometimes preserved from erosion. Toplaps are however frequent (e.g., km 14) defining oblique clinoforms interpreted as subaerial clinoforms.
Clinoform package 2 (km 16 to 23, Figure 14) displays an ascending then horizontal to descending shoreline trajectory. It is rather similar to clinoform package 1, yet starting with a backstepping event causing a shoreline retreat about 1 km landward atop SB8. Topsets display similar thickness and are only preserved during the phase of ascending trajectory, reflecting accommodation creation before pure progradation.
The transition toward the package 3 is marked by a renewed aggradation past MRS11. Clinoform package 3 (km 23 to 32, Figure 14) displays a complex shoreline trajectory with 3 ascending phases (km 23, 26 and 31) separated by two strictly prograding phases (km 25 to 27 and 26 to 30). Accommodation here appears greater compared to former clinoform packages, AF4-5 is consequently thicker and more widespread. In a more proximal setting, AF3 is observed in higher proportions compared to clinoform package 1, both laterally and vertically. This might reflect a more important development of unconfined deposits during aggrading trends. MRS12 marks the transition from hybrid to compound clinoforms.
Packages 3 and 4 are separated by surface MRS13 above which a clear retrogradation of shallow marine deposits (AF7) takes place atop AF4-5, about 5 km landward. Conversely, on LRM4 packages 3 and 4 are separated by MRS12 (Figure 13), which is older. These differences will be later discussed in Section 5.2. Clinoform package 4 (28–35 km, Figure 14) displays a general prograding–aggrading trend, with an even stronger aggradation component compared to clinoform package 3. Then, the sedimentary system progrades back to the shelf-break in the form of well-defined shoreline clinoforms (km 28 to 31). Progradation continues onward to finally transition to a short yet pronounced ascending trajectory at km 35. Due to the overall high accommodation setting, clinoform package 4 shows the largest development of AF4-5 deposits. The topsets preservation decreases upstream due to both the progressive discordance linked with the margin tilt and the later-stage fluvial incision. The last clinothems of package 4 display several successive lateral alternations between AF2 and AF3. This observation is not congruent with an accommodation-driven facies distribution but could indicate the occurrence of distributary river cross-cutting LRM10 section.
Clinoform package 5 (km 36 to 42) displays a first ascending, then horizontal, and then slightly ascending shoreline trajectory. Shoreface sands (AF7) might be discontinuous at the transition between packages 4 and 5 (km 36) due to local descending trajectory. Within package 5, except for the slight ascending trends, accommodation-space creation is almost absent in this package and topsets are, thus, very thin. Nonetheless, the slightly ascending trajectory of around km 40 appears sufficient for the deposition of a continuous unit of AF4-5. We selected surface SB16, as it represents a significant marker, delineating farther landward a major incision that erodes the offshore Plio–Quaternary deposits. SB16 is also identified in LRM4, defining a major fluvial incision, of which that observed for LRM10 is believed to be the lateral equivalent. After a backstepping atop MRS15 (from km 42 to 40), progradation back to the shelf-break occurs in the form of shoreline clinoforms with very little topsets preservation and continues until surface SB16, reaching km 42.
Finally, clinoform package 6 (km 42 onward) marks the final aggradation of the Pliocene clinothems. The fluvial valley previously described is quickly filled as the system reaches a progradation maximum at km 43, marked by surface MRS16 (pink, Figure 14A). Following this, a second backstepping occurs causing the shoreline to migrate at least 2 km upstream reaching km 41. Here, again, shoreline clinoforms prograding back to the shelf break are well identified (km 41 to 42). Beyond km 42, both rollover identification and sedimentary facies distribution become challenging and are, thus, not detailed. Nonetheless, the MRS17 surface is well-identified and marks, as on LRM4 profile, the summit of clinoform package 6 and, more generally, of the Pliocene prism. This clinoform package displays topsets of an unprecedented thickness for a similar distance of progradation compared to former packages. This shows a remarkable increase in accommodation-space creation for which a dominance of unconfined alluvial plain deposits (AF3) would be expected in the topsets. However, our model is likely not reliable at this point and topsets might display unidentified shelf deposits.

4.4.3. LRM11

Compared to the two profiles previously described, LRM11 has a strike orientation (Figure 1). It has been acquired in the offshore Roussillon Basin and extends from the coastline toward the northeast, imaging the clinoform geometries across the inner/middle shelf (see Figure 1 for location). Clinoform geometries and rollover trajectories are identified exclusively in the western portion of the profile (between km 15 and 30), where clinoforms prograde north-eastward, extending the onshore infill. The eastern part of LRM11 likely records a different transport direction, more perpendicular to that of the western counterpart, which hinders clear identification of rollovers above MRS11.
Clinoform package 1 extends from km 15 to 23, ending at MRS11 (pink, Figure 15A). Clinoform package 2 extends from km 23 to 24 on MRS11 (pink, Figure 15A).
Figure 15. Interpretation of LRM11 seismic profile (strike orientation, see location in Figure 1) in terms of seismic facies and sedimentary facies associations. (A) Seismic profile with all major stratigraphic surfaces of the Pliocene as colored horizons (including Plio-Quaternary boundary); (B) Seismic profile with seismic facies interpretation, major stratigraphic surfaces as bold black horizons, and roll-overs with associated clinoform-type as circles; (C) Seismic profile with sedimentary facies interpretations, major stratigraphic surfaces as bold black horizons, minor stratigraphic surfaces as light black horizons, and roll-overs with associated clinoform-type as circles. Between kilometers 15 and 25, the rollovers are visible as the clinothems prograde toward the NE. Beyond kilometer 30, rollovers are no longer visible due to the clinothems prograding toward the southeast.
Geosciences 15 00383 g015
The clinoform package 1 (km 15 to 23) displays a descending trajectory reflecting a decrease in accommodation-space creation. Indeed, no topset preservation is observed. This trend reaches its maximum between km 21 and 22 where the fall in relative sea level causes shoreface sands (AF7) to be disconnected.
Passing to clinoform package 2 (km 23 to 24), this highly progradational trend rapidly shifts to aggradation, marked by a vertically ascending trajectory between kilometers 23 and 24. This is associated with good preservation of topsets including large amounts of AF4-5.
In the eastern part of the profile, past km 30, clinoforms migration changes from NW to SE. This change seems to occur around the MRS11 surface (pink on Figure 15). Nevertheless, the vertical stacking of the interpreted sedimentary facies allows us to identify two successive retrogradational phases between MRS11 and MRS12. It is well observed between km 35 and 47 on Figure 15, through the deposition of AF4-5 atop AF7, and/or AF8 atop AF7.
A backstepping event is also encountered on both profile LRM4 (km 17) and LRM10 (km 24) atop MRS11, which seem consistent with observations on LRM11. The change in progradation direction observed on LRM11 (between MRS11 and MRS12) do not seem to correspond to any remarkable evolution on LRM4 and LRM10.

5. Discussion

5.1. Coherence of the Model

Overall, the predictions of sedimentary facies distribution seem coherent from one interpreted seismic profile to another. Indeed, LRM11 intersects LRM10 with similar vertical facies successions, although both lines have been interpreted independently.
Within topsets, AF2, AF3, and AF4-5 were successfully distinguished based on the results of forward seismic modeling. In most cases, these facies associations define coherent facies successions along the progradation axis. Confined alluvial deposits (SF1a1/AF2) transition down dip to less confined deposits, i.e., unconfined alluvial plain (SF1a2/AF3), then delta plain deposits (SF1b/AF4-5), due to a decreasing river gradient. AF3 is almost always observed between AF2 and AF4-5 (except for the uppermost part of the Pliocene series) and dominates over AF2 for clinoform packages displaying ascending shoreline trajectory.
The distribution of interpreted sedimentary facies associations on the seismic profiles (Figure 13 and Figure 14) is in good agreement with the expected theoretical sedimentary architecture of a wave-dominated delta, alternating between periods of relatively pure progradation and periods of progradation–aggradation. Indeed, delta plains are absent to very thin when the accommodation is low (horizontal trajectories) and, conversely, more developed when the accommodation space is created, as evidenced by ascending trajectories [88].
During periods when A/S~0, AF7 shallow marine sands are of a limited vertical extent but show good lateral continuity, corresponding to straight shoreline trajectory subparallel to the topsets. Continental facies distribution is consistent with shoreline trajectories. Within pure progradational portions, topsets are very thin and AF4 delta plain facies are typically lacking. On the opposite, during periods of more ascending trajectories, thicker topsets develop and AF4-5 delta plain facies are preserved. More ascending trajectories in younger packages, mainly above MRS11, promote the development of these more complete depositional profiles, including delta plain deposition. Seaward tilting of the margin may accentuate this pattern distally [20,51]. The relative ratio of confined vs. unconfined alluvial plains could be linked to A/S variations as AF3 appears more developed when A/S ratio increases (LRM4), although this ratio can differ due to local variations in the catchment area. Other authors suggested that astronomical parameters may also influence this ratio, as well as paleosol formation, by impacting the frequency and intensity of flooding events through insolation [92,93].
The present seismic facies distinction allows to refine sedimentary architecture distribution within the already observed transition from prograding to aggrading clinoforms [20,21,51,94]. In this respect, our facies model enables the identification of most facies and supports a coherent, geologically meaningful sedimentary interpretation of both facies distribution and depositional architecture. The defined facies model applies for most of the Pliocene record but fails to recompose the uppermost part, where large compound clinoforms take place, evidencing the development of a relatively broad shelf, accompanied by thick topset preservation.
The clinoform type is closely related to facies distribution, particularly regarding the occurrence of marine facies within the topsets [14]. The seismic resolution might not allow to identify all shoreline clinoforms within topsets, and thus to recognize the compound nature of clinoforms. This may result in an overestimation in the ratio between continental and marine topsets. We therefore conclude that our seismic facies model might become increasingly uncertain once compound clinoforms progressively replace smaller hybrid clinoforms, i.e., above MRS12-13. It is worth noting that seismic facies SF1b-2 is no longer occurring in this part of the prism. From MRS15-SB16 onwards, our model is considered invalid. Indeed, the nature of distal topsets is less constrained and may contain a significant proportion of shelf (marine) deposits. Large-scale migration of the shoreline over the broad shelf (shelf-scale topsets), favored by higher-amplitude sea-level variations, might occur as evidenced in the recent Quaternary deposits. Sedimentary facies and architecture might here be more comparable to those described by [95] for the last 400 ky. However, our model seems coherent for the older landward part of the seismic profiles, enabling a convenable recomposition of the sedimentary architecture across a land–sea continuum.

5.2. Shoreline Trajectory Offshore, Evolution in Clinoform Configuration, and Forcing Factors

Clinoforms and sedimentary architectures evolved progressively during buildup of the Plio–Quaternary prism. Two endmembers characterize this evolution and rebuilt the margin: Gilbert-type deltas at the onset of infilling (Figure 6), and the large Quaternary continental margin clinoforms [94,96]. Between these poles, successive stages mark the gradual transition toward kilometer-scale continental margin clinoforms.
The early infill consists of small-scale clinoforms evolving from Gilbert deltas (tens of meters high, DP1) to hybrid clinoforms (hundreds of meters high, DP3) with thin, bypass-dominated topsets. Later, Plio–Quaternary clinoforms reach ~800 m, become compound, and eventually merge with the continental slope, marking the rebuilding of the margin. As in other Mediterranean basins, Gilbert deltas (DP1) filled drowned Messinian rias during the Zanclean reflooding. Their coarse-grained topsets (alluvial fans) and foresets dominated by avalanching gave way, as infilling progressed, to longer topsets with reduced river gradients. Gravels became restricted to the topsets and sandy foresets recorded enhanced wave processes (DP2). Further progradation lowered transport capacity, allowing fine-grained deposition in the topsets (alluvial and floodplain deposits, DP3), as the system became progressively more open marine. Sediment lateral dispersal at the shoreline produced extensive littoral complexes of coalescent deltas and beaches, representative of sandy shoreline clinoforms. DP3 represents most of the offshore wedge until the generalization of large, sigmoidal, and compound clinoforms beyond MRS12-13.
Early Pliocene progradation was marked offshore by steady, flat to slightly ascending rollover trajectories, reflecting sediment supply exceeding accommodation. This almost pure progradational trend lasted until our surface MRS12 in LRM4, corresponding to the P7 surface of ref. [71], summit of Pr6 of ref. [17], and surface U1a-b of ref. [51] (dated between 3.8 and 3.4 Ma; [71]). This supply-dominated margin [97] progressively infilled the inherited MES morphology, inducing restricted clinoform height and subsequent high progradation rates estimated around 29 to 36 km/Ma (base of the Zanclean reflooding to MRS12/P7 age). Persistent flux drove lateral dispersal and rapid basinward topset extension, producing hybrid geometries with steep foresets. Short ascending phases promoting AF3-4 preservation are attributable to high-frequency sea-level cycles (4th-3rd order), but no major retrogradation or lowstand wedges developed. On LRM4 and LRM10, this purely prograding stage filled the Roussillon sub-basin until MRS12 or MRS13, which are the first stratigraphic markers correlatable from the shelf to the upper slope [71], thus marking the onset of sediment export basinward.
Above MRS12/P7, clinoforms grew higher as bottomsets extended fully onto the margin slope (from <400 m to >800 m) and became of compound nature, where shoreline clinoforms define marine, shelf-scale, distal topsets. Sediment storage increased, progradation slowed, and trajectories became more ascending, with major implications on facies architecture. This phenomenon is amplified above SB16 (p11 of ref. [71]; U2 of ref. [51]), where the topsets-foresets transition displays low-angle reflectors hindering rollover identification. This architecture sets a broad, low-gradient shelf transitional to known Quaternary systems [24], above which large shoreline shifts likely took place, though thin shelf deposits may remain below seismic resolution. This evolution continues until the progressive establishment of proper continental margin-scale compound clinoforms.
Beyond SB16, steepened slopes and canyon development promoted mass-transport, where sediment export to the deep basin prevails [71,90]. Thick deep-marine deposits accumulated, while shelf sediments thinned, indicating dominant bypass [71]. During highstands, marine sediments were trapped in topsets, whereas fluvial systems extended close to the shelf edge during lowstands (shelf-edge delta) [94,96]. The resulting Plio–Quaternary prism now extends ~75 km seaward. From ~1 Ma (Q10 surface in ref. [71]), clinoforms became dominantly aggradational and slope position stabilized, suggesting steady-state morphology modulated by Quaternary glacio-eustatic cycles.
The transition from flat to strongly ascending shoreline trajectories (P11 to PXX in ref. [71]) is generally ascribed to A/S changes and allocyclic controls [75]. Past SB16, former authors suggested that either increased margin tilting due to sediment loading [24] or decrease in sediment supply [71] may have favored ascending trajectories. Such large-scale controls are congruent with the fact that most stratigraphic surfaces are correlatable across the south (this work) or even the entire Gulf of Lion [71]. Yet MES inheritance and internal autogenic processes might play a key role, as follows: increasing clinoform height boosted sediment storage, fostering aggradation similar to autoretreat processes described in deltaic settings [98]. In such case, the observed shift in shoreline trajectory may occur independently of external forcings. This autogenic/internal control may explain local differences between LRM4 and LRM10 (e.g., lack of backstepping at MRS13′ on LRM4, earlier compound clinoform development on LRM10, and differences in topsets preservation between MRS12 and MRS13; Figure 13 and Figure 14). Ultimately, progradation was limited once the system reached the inherited continental slope defining the maximum margin extent, as suggested by ref. [99].
Onshore, the same large-scale trend is observed in the Dem’Mer and Dem’Ter records. Initial pure progradation occurs in the form of quick transition from marine to fluvial deposits, followed by aggradational delta plain and embayment facies (AF4-5, 140 m, Dem’Mer, Figure 3) with no marine fauna, confirming the limited backstepping observed offshore. Overlying continental facies are vertically stacked, recording continued progradational–aggradational trends and enhanced preservation of continental topsets, consistent with ascending shoreline trajectory.

5.3. Implication for Coastal Aquifers

As already pointed out by previous authors, Pliocene fluvial sands (continental aquifer) and Pliocene shallow marine sands (marine aquifer) host most of the exploitable freshwater resources stored onshore in the Roussillon Basin [23,26,100]. Since AF7 consists mostly of shallow marine sands, mapping AF7 should provide a reliable approximation of associated offshore reservoir geometry. This may also be the case for AF2, AF3, and AF4, as they contain fluvial sands. However, because these sands occur as discontinuous bodies interbedded with other lithologies, mapping these AF alone is insufficient; additional investigations are needed to better predict aquifers associated with offshore continental deposits.
Concerning AF7, we expect that marine sands are well connected laterally across successive clinothems, as a result of several parameters. Firstly, the seaward tilting of the margin ensures consistent creation of accommodation space and prevents significant falls in rollover trajectory. Secondly, a consistent sediment supply from near uplifted reliefs ensures rapid compensation over relative sea-level rises, thus preventing major shoreline retreats through backstepping events. Finally, the dominant wave dynamics and associated longshore reworking guarantee a good lateral extension of the marine sands, perpendicular to the progradation axis. Onshore, these sands form well-known aquifers [28], which are also likely to occur offshore given the expected similarity in the depositional profiles (DP3). However, the transition from hybrid clinoforms of limited height to taller compound clinoforms implies a decrease in progradation rates. This phenomenon limits compensation over relative sea-level rises, potentially resulting in reservoir disconnections through backstepping events, as observed for the above surface MRS13 on the LRM10 profile (Figure 14). Nonetheless, reservoirs should be considered in 3D at the margin-scale, as various reservoirs may remain spatially interconnected. For example, within AF7, connectivity may occur via adjacent permeable facies (e.g., CS1, CS2, and Bh). Indeed, moderately permeable overbank deposits can connect reservoirs of greater permeability. Furthermore, erosive features may also locally connect marine and alluvial reservoirs such as at km 10 of LRM10 (Figure 14), where AF2 directly overlies AF7. Conversely, clay-rich bodies (floodplain deposits (FPo and FPr), lagoon clays (Lg), and lacustrine clays (Lk)) can form hydrological barriers, possibly causing reservoir disconnections. Such aquicludes are reported in several boreholes around the Gulf of Lion (e.g., Maguelone [31] and Barcarès [101]) where they are typically composed of O.M-rich, fine-grained sediments separating freshwater below from overlying salty waters. They may correspond to deep lagoon deposits (Lg), swamp environments or (to some variations) to coastal lakes, as found in AF4-5 (e.g., 59.50 m on Dem’Mer and 59 m on Dem’Ter; Figure 3). These deposits are likely to cover vast areas, especially during aggrading episodes, and may play a major role in disconnecting shallow marine sands, as observed at km 30 on LRM10 (Figure 14) or km 17 on LRM4 (Figure 13).
Oppositely to the marine aquifer, the continental aquifer is heterogeneous [101] with permeable fluvial sands hosted within finer deposits (e.g., floodplain) thus potentially acting as aquiclude or aquitard in 3D. This configuration is found in AF2, AF3, and AF4, which we identified offshore on seismic profiles. In terms of permeability and connectivity, AF2 presents the most favorable configuration, with clean confined fluvial sands laterally stacked along regressive surfaces, thus channeling groundwater flows. In AF3 and AF4, fluvial sands are unconfined, often observed in the form of overbanks displaying moderate sorting and subsequent lower aquifer quality. However, because unconfined alluvial plain deposits (AF3) are spatially widespread, we expect they ensure a good, large-scale, lateral hydraulic connectivity across the topsets, although their exact permeability remains unknown. This interpretation is supported by pumping tests conducted onshore in the coastal plain (pers. com. Caballero; [102]).
The underlying Messinian paleotopography has also indirectly influenced the development and location of Plio–Quaternary fluvial valleys, where AF2 sands tend to concentrate and form good aquifers. Therefore, the infill of these valleys represents a prime target for identifying permeable AF2 deposits, rather than interfluves. As identified above the SB16 surface (from km 5 to 22 on LRM4, Figure 13), they may serve as key pathways for groundwater flow. Three-dimensional mapping of these features would enhance understanding of groundwater distribution within the topsets.
Having a good knowledge of the AF distribution in 3D in the offshore domain thus appears crucial to properly address the offshore extent and permeability of this coastal aquifer. The importance of lithology distribution has already been demonstrated on the New Jersey shelf, which hosts, so far, one of the best-documented examples of offshore freshened groundwater [103].

6. Conclusions

This study aimed at recomposing the sedimentary architecture in the Roussillon Basin through a land–sea continuum. In the absence of continuous well-tied data, we combined facies sedimentology, facies models, forward seismic modeling, and seismic interpretation. We recomposed several stages of progradation following MSC that correspond to successive sedimentary architectures. Onshore, the integrated analysis of outcrops and new boreholes/cores allowed to recompose three successive depositional profiles, from Gilbert-type deltas (DP1) to a wave- and storm-reworked fan delta (DP2) and, ultimately, to a basin-wide, wave-dominated delta (DP3). Forward seismic modeling validated the proposed sedimentary–seismic facies equivalence and enabled high-resolution (15 m) offshore predictions of depositional architecture, with particular emphasis on topsets and despite the absence of well-tied data. This approach refines offshore interpretation, showing that the DP3 wave-dominated delta documented onshore extends basinward, consistent with shoreline trajectory analysis and vertical facies successions in cores. This progradational evolution is driven by several factors, among which the inherited MES paleomorphology plays a major role, as it conditions morphodynamical parameters, such as topset length, foreset angle, and exposure to hydrodynamic processes, thereby shaping depositional architecture and reservoir distribution. Finally, we think that inherited MES may be a primary control on clinoform trajectories. In addition, the identification of different types of clinoforms offshore emerges as a key for predicting reservoir architectures and connectivity, emphasizing the need for detailed seismic stratigraphy analysis. Indeed, our predictive model proves to be accurate until the establishment of compound clinoforms characterized by marine topsets, of which distinctive geometry remains challenging to identify with regard to the vertical resolution. Overall, this study establishes a new sedimentological framework for the Pliocene infill of the Roussillon Basin, providing a solid basis for land–sea correlations and future assessment of aquifer connectivity. Crucially, our workflow is readily applicable to a wide range of coastal deltas worldwide characterized by discontinuous land–sea datasets and no direct well tie.

Supplementary Materials

The following supporting information can be downloaded at: https://www.mdpi.com/article/10.3390/geosciences15100383/s1. Table S1: Sedimentary facies description. Figure S1: Illustrations of the sedimentary facies. All pictures and depths refer to the Dem’Mer borehole, except for Bh and PD which refer to Dem’Ter (see Figure 3).

Author Contributions

Conceptualization, T.W., E.L. and J.L.; Funding acquisition, E.L., J.L. and Y.C.; Investigation, T.W., E.L., J.L., S.B. and B.I.; Methodology, T.W., E.L., J.L., C.G. and Y.C.; Resources, P.-A.P., C.G., S.B., B.I. and Y.C.; Writing—original draft, T.W.; Correction and improvement: J.L., E.L., S.B., P.-A.P. and Y.C. All authors have read and agreed to the published version of the manuscript.

Funding

This work is part of a PhD supported by the Région Occitanie (50%) and the BRGM (50%).

Data Availability Statement

Restrictions apply to the availability of the seismic data used in this study. Requests to access the seismic datasets should be directed to Ifremer (MARION survey) and TotalEnergies (LRM96 survey).

Acknowledgments

We would like to thank Région Occitanie and the BRGM for funding the present research project, as well as NORSAR Innovations and Schlumberger for providing academic licenses for, respectively, the SeisRoX pro and Petrel software. We also thank all funders of the FEDER project Dem’Eaux Roussillon for the borehole acquisitions and coring, as well as the BRGM for providing core storage.

Conflicts of Interest

The authors declare no conflicts of interest.

References

  1. Mitchum, R.M.; Vail, P.R. Seismic Stratigraphy and Global Changes of Sea-Level: Part 7. Seismic Stratigraphic Interpretation Procedure: Section 2. Application of Seismic Reflection Configuration to Stratigraphic Interpretation; American Association of Petroleum Geologists: Tulsa, OK, USA, 1977; Volume 26. [Google Scholar]
  2. Vail, P.R.; Mitchum, R.M.; Thompson, S. Seismic Stratigraphy and Global Changes of Sea Level, Part 4: Global Cycles of Relative Changes of Sea Level; American Association Of Petroleum Geologists: Tulsa, OK, USA, 1977; Volume 26. [Google Scholar]
  3. Mora, D.; Castagna, J.; Meza, R.; Chen, S.; Jiang, R. Case study: Seismic resolution and reservoir characterization of thin sands using multiattribute analysis and bandwidth extension in the Daqing field, China. Interpretation 2020, 8, 89–102. [Google Scholar] [CrossRef]
  4. Sangree, J.B.; Widmier, J.M. Seismic Stratigraphy and Global Changes of Sea Level: Part 9. Seismic Interpretation of Clastic Depositional Facies: Section 2. Application of Seismic Reflection Configuration to Stratigraphic Interpretation; American Association of Petroleum Geologists: Tulsa, OK, USA, 1977; Volume 26. [Google Scholar]
  5. Sangree, J.B.; Widmier, J.M. Interpretation of depositional facies from seismic data. Geophysics 1979, 44, 131–160. [Google Scholar] [CrossRef]
  6. Xu, G.; Haq, B.U. Seismic facies analysis: Past, present and future. Earth-Sci. Rev. 2022, 224, 103876. [Google Scholar] [CrossRef]
  7. Van Wagoner, J.C.; Mitchum, R.M.; Campion, K.M.; Rahmanian, V.D. Siliciclastic Sequence Stratigraphy in Well Logs, Cores, and Outcrops: Concepts for High-Resolution Correlation of Time and Facies; American Association of Petroleum Geologists: Tulsa, OK, USA, 1990; Volume 7, 55p. [Google Scholar]
  8. Homewood, P.; Mauraud, P.; Lafont, F. Best practice in Sequence Stratigraphy for Explorationists and Reservoir Engineers—Elf EP Editions; Elf EP-Editions: Pau, France, 2000; Volume 25. [Google Scholar]
  9. Berg, O.R. Seismic detection and evaluation of delta and turbidite sequences: Their application to exploration for the subtle trap. AAPG Bull. 1982, 66, 9. [Google Scholar] [CrossRef]
  10. Patruno, S.; Helland-Hansen, W. Clinoforms and clinoform systems: Review and dynamic classification scheme for shorelines, subaqueous deltas, shelf edges and continental margins. Earth-Sci. Rev. 2018, 185, 202–233. [Google Scholar] [CrossRef]
  11. Rich, J.L. Three critical environments of deposition, and criteria for recognition of rocks deposited in each of them. Geol. Soc. Am. Bull. 1951, 62, 1–20. [Google Scholar] [CrossRef]
  12. Patruno, S.; Hampson, G.J.; Jackson, C.A.-L. Quantitative characterisation of deltaic and subaqueous clinoforms. Earth-Sci. Rev. 2015, 142, 79–119. [Google Scholar] [CrossRef]
  13. Pellegrini, C.; Patruno, S.; Helland-Hansen, W.; Steel, R.-J.; Trincardi, F. Clinoforms and clinothems: Fundamental elements of basin infill. Basin Res. 2020, 32, 187–205. [Google Scholar] [CrossRef]
  14. Steel, R.J.; Olariu, C.; Zhang, J.; Chen, S. What is the topset of a shelf-margin prism? Basin Res. 2020, 32, 263–278. [Google Scholar] [CrossRef]
  15. Gámez, D.; Simó, J.A.; Lobo, F.J.; Barnolas, A.; Carrera, J.; Vázquez-Suñé, E. Onshore–offshore correlation of the Llobregat deltaic system, Spain: Development of deltaic geometries under different relative sea-level and growth fault influences. Sediment. Geol. 2009, 217, 65–84. [Google Scholar] [CrossRef]
  16. Peng, Y.; Steel, R.J.; Olariu, C.; Li, S. Rapid subsidence and preservation of fluvial signals in an otherwise wave-reworked delta front succession: Early-mid Pliocene Orinoco continental-margin growth, SE Trinidad. Sediment. Geol. 2020, 395, 105555. [Google Scholar] [CrossRef]
  17. Monteverde, D.H.; Miller, K.G.; Mountain, G.S. Correlation of offshore seismic profiles with onshore New Jersey Miocene sediments. Sediment. Geol. 2000, 134, 111–127. [Google Scholar] [CrossRef]
  18. Custodio, E. Coastal aquifers of Europe: An overview. Hydrogeol. J. 2010, 18, 269–280. [Google Scholar] [CrossRef]
  19. Duvail, C.; Le Strat, P. Architecture et géométrie haute résolution des prismes sédimentaires plio-quaternaires au droit du Roussillon suivant un profil terre-mer. Report BRGM/RP-51972-FR 2002, 71. [Google Scholar]
  20. Duvail, C.; Gorini, C.; Lofi, J.; Le Strat, P.; Clauzon, G.; Dos Reis, A.T. Correlation between onshore and offshore Pliocene–Quaternary systems tracts below the Roussillon Basin (eastern Pyrenees, France). Mar. Pet. Geol. 2005, 22, 747–756. [Google Scholar] [CrossRef]
  21. Leroux, E.; Aslanian, D.; Rabineau, M.; Moulin, M.; Granjeon, D.; Gorini, C.; Droz, L. Sedimentary markers in the Provençal Basin (western Mediterranean): A window into deep geodynamic processes. Terra Nova 2015, 27, 122–129. [Google Scholar] [CrossRef]
  22. Clauzon, G.; Suc, J.-P.; Aguilar, J.-P.; Ambert, P.; Cappetta, H.; Cravatte, J.; Drivaliari, A.; Domenech, R.; Dubar, M.; Leroy, S.; et al. Pliocene geodynamic and climatic evolutions in the French Mediterranean region. Paleontol. Evol. 1990, 2, 132–186. [Google Scholar]
  23. Caballero, Y.; Balouin, Y.; Baudouy, L.; Berne, S.; Bouchette, F.; Bourgine, B.; Bourrin, F.; Brun, L.; Champollion, C.; Duvail, C.; et al. Caractérisation transdisciplinaire d’un aquifère côtier complexe, pour une exploitation maitrisée et durable de sa ressource en eau en contexte méditerranéen: Le Projet Dem’Eaux Roussillon. Rapport final. In Proceedings of the Colloque “La Gestion des eaux Souterraines au 21e Siècle”, BRGM/RP-71814-FR, Pessac, France, 15–17 February 2023; 73p. Available online: http://infoterre.brgm.fr/rapports//RP-71814-FR.pdf (accessed on 15 September 2025).
  24. Rabineau, M. Un Modèle Géométrique et Stratigraphique des Séquences de Dépôts Quaternaires sur la Marge du Golfe du Lion: Enregistrement des Cycles Climatiques de 100 000 Ans. Doctoral Dissertation, Université de Rennes 1, Rennes, France, 2001. [Google Scholar]
  25. Rabineau, M.; Leroux, E.; Aslanian, D.; Bache, F.; Gorini, C.; Moulin, M.; Molliex, S.; Droz, L.; Dos Reis, A.T.; Rubino, J.L.; et al. Quantifying subsidence and isostatic readjustment using sedimentary paleomarkers, example from the Gulf of Lion. Earth Planet. Sci. Lett. 2014, 388, 353–366. [Google Scholar] [CrossRef]
  26. Aunay, B.; Duvail, C.; Le Strat, P.; Dörfliger, N.; Lachassagne, P.; Pistre, S. Importance of a high resolution lithological and geometrical knowledge for Mediterranean coastal sedimentary aquifers management: Application to the Roussillon Basin, South of France. In Proceedings of the Groundwater and Saline Intrusion, 18th Salt Water Intrusion Meeting–IAH, IHP-UNESCO, IGME, Cartagena, Spain, 31 May–3 June 2004; Volume 15, pp. 259–271. [Google Scholar]
  27. Petelet-Giraud, E.; Négrel, P.; Guerrot, C.; Aunay, B.; Dörfliger, N. Origins and processes of salinization of a Plio-Quaternary coastal Mediterranean multilayer aquifer: The Roussillon Basin case study. Procedia Earth Planet. Sci. 2013, 7, 681–684. [Google Scholar] [CrossRef]
  28. Caballero, Y.; Ladouche, B. Impact of climate change on groundwater in a confined Mediterranean aquifer. Hydrol. Earth Syst. Sci. Discuss. 2015, 12, 10109–10156. [Google Scholar] [CrossRef]
  29. Schorpp, L.; Dall’Alba, V.; Renard, P.; Lanini, S.; Caballero, Y. Hydrogeological modeling of the Roussillon coastal aquifer (France): Stochastic inversion and analysis of future stresses. Environ. Earth Sci. 2023, 82, 201. [Google Scholar] [CrossRef]
  30. Micallef, A.; Person, M.; Berndt, C.; Bertoni, C.; Cohen, D.; Evans, R.; Haroon, A.; Hensen, C.; Jegen, M.; Key, K.; et al. Offshore freshened groundwater in continental margins. Rev. Geophys. 2021, 59, e2020RG000706. [Google Scholar] [CrossRef]
  31. Campo, B.; Pellegrini, C.; Sammartino, I.; Trincardi, F.; Amorosi, A. New perspectives on offshore groundwater exploration through integrated sequence-stratigraphy and source-to-sink analysis: Insights from the late Quaternary succession of the western Central Adriatic system, Italy. Earth-Sci. Rev. 2024, 256, 104880. [Google Scholar] [CrossRef]
  32. Bakke, K.; Petersen, S.; Martinsen, O.; Johansen, T.A.; Len, T.; Thurmond, J. Seismic modeling of outcrop analogues: Techniques and applications. GeoScienceWorld 2011. [Google Scholar]
  33. Mauffret, A.; de Grossouvre, B.D.; Dos Reis, A.T.; Gorini, C.; Nercessian, A. Structural geometry in the eastern Pyrenees and western Gulf of Lion (Western Mediterranean). J. Struct. Geol. 2001, 23, 1701–1726. [Google Scholar] [CrossRef]
  34. Séranne, M.; Couëffé, R.; Husson, E.; Baral, C.; Villard, J. The transition from Pyrenean shortening to Gulf of Lion rifting in Languedoc (South France)—A tectonic-sedimentation analysis. Bull. Société Géologique Fr. 2021, 192, 27. [Google Scholar] [CrossRef]
  35. Ternois, S.; Odlum, M.; Ford, M.; Pik, R.; Stockli, D.; Tibari, B.; Bernard, V. Thermochronological evidence of early orogenesis, eastern Pyrenees, France. Tectonics 2019, 38, 1308–1336. [Google Scholar] [CrossRef]
  36. Jolivet, L.; Romagny, A.; Gorini, C.; Maillard, A.; Thinon, I.; Couëffé, R.; Ducoux, M.; Séranne, M. Fast dismantling of a mountain belt by mantle flow: Late-orogenic evolution of Pyrenees and Liguro-Provençal rifting. Tectonophysics 2020, 776, 228–312. [Google Scholar] [CrossRef]
  37. Séranne, M. The Gulf of Lion continental margin (NW Mediterranean) revisited by IBS: An overview. Geol. Soc. Lond. Spec. Publ. 1999, 156, 15–36. [Google Scholar] [CrossRef]
  38. Jolivet, L.; Baudin, T.; Calassou, S.; Chevrot, S.; Ford, M.; Issautier, B.; Lasseur, E.; Masini, E.; Manatschal, G.; Mouthereau, F.; et al. Geodynamic evolution of a wide plate boundary in the Western Mediterranean, near-field versus far-field interactions. BSGF-Earth Sci. Bull. 2021, 192, 48. [Google Scholar] [CrossRef]
  39. Calvet, M. Morphogenèse d’Une Montagne Méditerranéenne, les Pyrénées Orientales. Doctoral Dissertation, Document du BRGM, University of Paris, Paris, France, 1996; 255p. [Google Scholar]
  40. Milesi, G.; Monié, P.; Soliva, R.; Münch, P.; Valla, P.G.; Brichau, S.; Bonno, M.; Martin, C.; Bellanger, M. Deciphering the Cenozoic Exhumation History of the Eastern Pyrenees Along a Crustal-Scale Normal Fault Using Low-Temperature Thermochronology. Tectonics 2022, 41. [Google Scholar] [CrossRef]
  41. Hsü, K.J.; Ryan, W.B.F.; Cita, M.B. Late Miocene desiccation of the Mediterranean. Nature 1973, 242, 240–244. [Google Scholar] [CrossRef]
  42. Roveri, M.; Flecker, R.; Krijgsman, W.; Lofi, J.; Lugli, S.; Manzi, V.; Sierro, F.J.; Bertini, A.; Camerlenghi, A.; de Lange, G.; et al. The Messinian Salinity Crisis: Past and future of a great challenge for marine sciences. Mar. Geol. 2014, 352, 25–58. [Google Scholar] [CrossRef]
  43. Heida, H.; Raad, F.; Garcia-Castellanos, D.; Jiménez-Munt, I.; Maillard, A.; Lofi, J. Flexural-isostatic reconstruction of the Western Mediterranean during the Messinian Salinity Crisis: Implications for water level and basin connectivity. Basin Res. 2022, 34, 50–80. [Google Scholar] [CrossRef]
  44. Lofi, J.; Gorini, C.; Berne, S.; Clauzon, G.; Dos Reis, A.T.; Ryan, W.B.F.; Steckler, M.S. Erosional processes and paleo-environmental changes in the Western Gulf of Lion (SW France) during the Messinian Salinity Crisis. Mar. Geol. 2005, 217, 1–30. [Google Scholar] [CrossRef]
  45. Lofi, J.; Deverchere, J.; Gaullier, V.; Gillet, H.; Gorini, C.; Guennoc, P.; Loncke, L.; Maillard, A.; Sage, F.; Thinon, I. Atlas of the “Messinian Salinity Crisis” seismic markers in the Mediterranean and Black seas. Comm. Geol. Map World Mémoires Société Géologique Fr. Nouv. Série 2011, 179, 72. [Google Scholar]
  46. Clauzon, G. The eustatic hypothesis and the pre-Pliocene cutting of the Rhône Valley. Initial. Rep. Deep. Sea Drill. Proj. XIII 1973, 13, 1251–1256. [Google Scholar]
  47. Guennoc, P.; Gorini, C.; Mauffret, A. Histoire géologique du golfe du Lion et cartographie du rift oligo-aquitanien et de la surface messinienne. Géologie Fr. 2000, 3, 67–97. [Google Scholar]
  48. Clauzon, G. Le canyon messinien de la Durance (Provence, France): Une preuve paléogéographique du bassin profond de dessiccation. Palaeogeogr. Palaeoclimatol. Palaeoecol. 1979, 29, 15–40. [Google Scholar] [CrossRef]
  49. Garcia-Castellanos, D.; Estrada, F.; Jiménez-Munt, I.; Gorini, C.; Fernandez, M.; Verges, J.; De Vicente, R. Catastrophic flood of the Mediterranean after the Messinian salinity crisis. Nature 2009, 462, 778–781. [Google Scholar] [CrossRef]
  50. Miller, K.G.; Browning, J.V.; Schmelz, W.J.; Kopp, R.E.; Mountain, G.S.; Wright, J.D. Cenozoic sea-level and cryospheric evolution from deep-sea geochemical and continental margin records. Sci. Adv. 2020, 6, eaaz1346. [Google Scholar] [CrossRef]
  51. Lofi, J.; Rabineau, M.; Gorini, C.; Berne, S.; Clauzon, G.; De Clarens, P.; Tadeu Dos Reis, A.; Mountain, G.S.; Ryan, W.B.F.; Steckler, M.S.; et al. Plio–Quaternary prograding clinoform wedges of the western Gulf of Lion continental margin (NW Mediterranean) after the Messinian Salinity Crisis. Mar. Geol. 2003, 198, 289–317. [Google Scholar] [CrossRef]
  52. Duvail, C. Expression des Facteurs Régionaux et Locaux dans l’Enregistrement Sédimentaire d’Une Marge Passive. Exemple de la Marge du Golfe du Lion, Étudiée Selon un Continuum Terre-Mer. Doctoral Dissertation, Université de Montpellier II, Montpellier, France, 2008. [Google Scholar]
  53. Leroux, E. Quantification des Flux Sédimentaires et de la Subsidence du Bassin Provençal. Doctoral Dissertation, Université de Brest, Brest, France, 2012. [Google Scholar]
  54. Leroux, E.; Rabineau, M.; Aslanian, D.; Granjeon, D.; Droz, L.; Gorini, C. Stratigraphic simulations of the shelf of the Gulf of Lions: Testing subsidence rates and sea-level curves during the Pliocene and Pleistocene. Terra Nova 2014, 26, 230–238. [Google Scholar] [CrossRef]
  55. Gorini, C.; Le Marrec, A.; Mauffret, A. Structural and sedimentary history of the Gulf of Lions (Western Mediterranean), from the ECORS profiles, seismic industrial lines and well data. Bull. Société Géologique Fr. 1993, 164, 353–363. [Google Scholar]
  56. Cravatte, J.; Dufaure, P.; Prim, M.; Rouaix, S. Les sondages du Golfe du Lion, stratigraphie, sédimentologie. Notes et mémoires. Cie. Française Pétroles 1974, 11, 209–274. [Google Scholar]
  57. Huyghe, D.; Mouthereau, F.; Segalen, L.; Furió, M. Long-term dynamic topographic support during post-orogenic crustal thinning revealed by stable isotope (δ18O) paleo-altimetry in eastern Pyrenees. Sci. Rep. 2020, 10, 2267. [Google Scholar] [CrossRef]
  58. Milesi, G.; Valla, P.G.; Münch, P.; Huyghe, D. Tectono-geomorphological evolution of the Eastern Pyrenees: Insights from thermo-kinematic modeling. Tectonophysics 2023, 866, 230057. [Google Scholar] [CrossRef]
  59. Clauzon, G.; Le Strat, P.; Duvail, C.; Do Couto, D.; Suc, J.-P.; Molliex, S.; Bache, F.; Besson, D.; Lindsay, E.H.; Opdyke, N.D.; et al. The Roussillon Basin (S. France): A case-study to distinguish local and regional events between 6 and 3 Ma. Mar. Pet. Geol. 2015, 66, 18–40. [Google Scholar] [CrossRef]
  60. Gilbert, G.K. The Topographic Features of Lake Shores; U.S. Geological Survey: Reston, VA, USA, 1885; Volume 5, pp. 75–123. [Google Scholar]
  61. Clauzon, G.; Aguilar, J.-P.; Michaux, J. Le bassin pliocène du Roussillon (Pyrénées orientales, France): Exemple d’évolution géodynamique d’une ria méditerranéenne consécutive à la crise de salinité messinienne. Comptes Rendus l’Académie Sci. 1987, 304, 585–590. [Google Scholar]
  62. Clauzon, G.; Rubino, J.-L. Les Gilbert-deltas pliocènes du Golfe du Lion et de Ligurie: Des constructions sédimentaires originales consécutives à la crise de salinité messinienne. Livret Guide l’Excursion ANDRA 1992. [Google Scholar]
  63. Breda, A.; Mellere, D.; Massari, F. Facies and processes in a Gilbert-delta-filled incised valley (Pliocene of Ventimiglia, NW Italy). Sediment. Geol. 2007, 200, 31–55. [Google Scholar] [CrossRef]
  64. Clauzon, G. Le détritisme néogène du bassin du Roussillon (Pyrénées-Orientales, France). Géologie Alp. 1987, 13, 427–441. [Google Scholar]
  65. Depéret, C. Description Géologique du Bassin Tertiaire du Roussillon; Masson: Paris, France, 1885; 274p. [Google Scholar]
  66. Berger, G.M.; Fonteilles, M.; Leblanc, D.; Clauzon, G.; Marchal, J.P.; Vautrelle, C. Rivesaltes. Carte géologique de la France à 1/50000 (No. 1090). BRGM 1993. [Google Scholar]
  67. Aunay, B. Apport de la Stratigraphie Séquentielle à la Gestion et à la Modélisation des Ressources en eau des Aquifères Côtiers. Doctoral Dissertation, Université de Montpellier II, Montpellier, France, 2007. [Google Scholar]
  68. Duvail, C.; Le Strat, P.; Bourgine, B. Atlas géologique des formations plio-quaternaires de la plaine du Roussillon (Pyrénées Orientales). Rapp. No RP-51197-FR BRGM 2001. [Google Scholar]
  69. Dall’Alba, V.; Renard, P.; Straubhaar, J.; Issautier, B.; Duvail, C.; Caballero, Y. 3D multiple-point statistics simulations of the Roussillon Continental Pliocene aquifer using DeeSse. Hydrol. Earth Syst. Sci. 2020, 24, 4997–5013. [Google Scholar] [CrossRef]
  70. Biju-Duval, B.; Letouzey, J.; Montadert, L.; Courrier, P.; Mugniot, J.F.; Sancho, J. Geology of the Mediterranean Sea basins. In The Geology of Continental Margins; Springer: Berlin/Heidelberg, Germany, 1974; pp. 695–721. [Google Scholar]
  71. Leroux, E.; Rabineau, M.; Aslanian, D.; Gorini, C.; Molliex, S.; Bache, F.; Robin, C.; Droz, L.; Moulin, M.; Poort, J.; et al. High-resolution evolution of terrigenous sediment yields in the Provence Basin during the last 6 Ma: Relation with climate and tectonics. Basin Res. 2017, 29, 305–339. [Google Scholar] [CrossRef]
  72. Delmas, M.; Calvet, M.; Gunnell, Y.; Voinchet, P.; Manel, C.; Braucher, R.; Tissoux, H.; Bahain, J.-J.; Perrenoud, C.; Saos, T. Terrestrial 10Be and electron spin resonance dating of fluvial terraces quantifies Quaternary tectonic uplift gradients in the eastern Pyrenees. Quat. Sci. Rev. 2018, 193, 188–211. [Google Scholar] [CrossRef]
  73. Pezard, P.A.; Lofi, J.; Le Ber, E.; Henry, G.; Brun, L.; Geeraert, M.; Hamel, C.; Gee, R.; Brillouet, N.; Neyens, D.; et al. Petrophysical characterisation of a clastic coastal aquifer with implications for saltwater intrusion and the evolution of groundwater resources. The GRAIN D’SEL and DEM’EAUX ROUSSILLON projects, Occitanie, France. In Proceedings of the IAHS-AISH XIth Scientific Assembly, Montpellier, France, 29 May–3 June 2022. [Google Scholar]
  74. Leroux, E.; Aslanian, D.; Rabineau, M.; Gorini, C.; Rubino, J.-L.; Poort, J.; Suc, J.P.; Bache, F.; Blanpied, C. Atlas of the Stratigraphic Markers in the Western Mediterranean with Focus on the Messinian, Pliocene and Pleistocene of the Gulf of Lion; CCGM-CGMW: Paris, France, 2019; ISBN 9782917310380. [Google Scholar]
  75. Helland-Hansen, W.; Hampson, G.J. Trajectory analysis: Concepts and applications. Basin Res. 2009, 21, 454–483. [Google Scholar] [CrossRef]
  76. Proust, J.N.; Pouderoux, H.; Ando, H.; Hesselbo, S.P.; Hodgson, D.M.; Lofi, J.; Rabineau, M.; Sugarman, P.J. Facies architecture of Miocene subaqueous clinothems of the New Jersey passive margin: Results from IODP-ICDP Expedition 313. Geosphere 2018, 14, 1564–1591. [Google Scholar] [CrossRef]
  77. Lecomte, I. Resolution and illumination analyses in PSDM: A ray-based approach. Lead. Edge 2008, 27, 650–663. [Google Scholar] [CrossRef]
  78. Lecomte, I.; Lavadera, P.L.; Botter, C.; Anell, I.; Buckley, S.J.; Eide, C.; Grippa, A.; Mascolo, V.; Kjoberg, S. 2(3)D convolution modelling of complex geological targets beyond–1D convolution. First Break 2016, 34, 99–107. [Google Scholar] [CrossRef]
  79. Lofi, J. La Crise de Salinité Messinienne: Incidences Directes et Différées sur l’Evolution Sédimentaire de la Marge du Golfe du Lion. PhD Thesis, University of Lille 1, Lille, France, 2002; 285p. [Google Scholar]
  80. Miller, K.G.; Browning, J.V.; Mountain, G.S.; Bassetti, M.A.; Monteverde, D.; Katz, M.; Inwood, J.; Lofi, J.; Proust, J.N. Sequence boundaries are impedance contrasts: Core-seismic-log integration of Oligocene–Miocene sequences, New Jersey shallow shelf. Geosphere 2013, 9, 1257–1285. [Google Scholar] [CrossRef]
  81. Wiggins, R.; Kenny, G.S.; McClure, C.D. A method for determining and displaying the shear-velocity reflectivities of a geologic formation. Eur. Pat. Appl. 1983, 113944. [Google Scholar] [CrossRef]
  82. Ber, L.; et al. Université de Montpellier: Montpellier, France; CNRS: Perpignan, France; manuscript in preparation.
  83. Reineck, H.E.; Singh, I.B. Depositional environments. In Depositional Sedimentary Environments: With Reference to TerrigenFous Clastics; Springer: Berlin/Heidelberg, Germany, 1980; pp. 5–7. [Google Scholar]
  84. Postma, G.; Roep, T.B. Resedimented conglomerates in the bottomsets of Gilbert-type gravel deltas. J. Sediment. Res. 1985, 55, 874–885. [Google Scholar] [CrossRef]
  85. Clauzon, G. Restitution de l’évolution géodynamique néogène du bassin du Roussillon et de l’unité adjacente des Corbières d’après les données écostratigraphiques et paléogéographiques. Paléobiologie Cont. 1990, 17, 125–155. [Google Scholar]
  86. Olsen, T.; Steel, R.; Hogseth, K.; Skar, T.; Roe, S. Sequential architecture in a fluvial succession: Sequence stratigraphy in the Upper Cretaceous Mesaverde Group, Price Canyon, Utah. J. Sediment. Res. 1995, 65, 265–280. [Google Scholar] [CrossRef]
  87. Clauzon, G.; Cravatte, J. Révision chronostratigraphique de la série marine pliocène traversée par le sondage Canet 1 (Pyrénées-Orientales, France): Apports à la connaissance du Néogène du Roussillon. Comptes Rendus l’Académie Sci. 1985, 301, 1351–1354. [Google Scholar]
  88. Boyd, R.; Dalrymple, R.; Zaitlin, B.A. Classification of clastic coastal depositional environments. Sediment. Geol. 1992, 80, 139–150. [Google Scholar] [CrossRef]
  89. Anell, I. The quintessential s-shape in sedimentology: A review on the formation and controls of clinoform shape. Earth-Sci. Rev. 2024, 254, 104821. [Google Scholar] [CrossRef]
  90. Berné, S.; Loubrieu, B.; l’équipe de Calmar embarquée. Canyons et processus sédimentaires récents sur la marge occidentale du Golfe du Lion. Premiers résultats de la campagne Calamar. Comptes Rendus l’Académie Sci. Paris 1999, 328, 471–477. [Google Scholar]
  91. Baztan, J.; Berne, S.; Olivet, J.L.; Rabineau, M.; Aslanian, D.; Gaudin, M.; Réhault, J.-P.; Canals, M. Axial incision: The key to understand submarine canyon evolution (in the western Gulf of Lion). Mar. Pet. Geol. 2005, 22, 805–826. [Google Scholar] [CrossRef]
  92. Abels, H.A.; Baars, T.; Wang, Y.; Alharbi, A.; Storms, J.; Martinius, A. Implementing orbital climate control on alluvial stratigraphy in subsurface predictive models. First Break 2020, 38, 1–5. [Google Scholar] [CrossRef]
  93. Aziz, H.A.; Hilgen, F.J.; Luijk, G.M.; Sluijs, A.; Kraus, M.J.; Parés, J.M.; Gingerich, P.D. Astronomical climate control on paleosol stacking patterns in the upper Paleocene–lower Eocene Willwood Formation, Bighorn Basin, Wyoming. Geology 2008, 36, 531–534. [Google Scholar] [CrossRef]
  94. Rabineau, M.; Berné, S.; Aslanian, D.; Olivet, J.-L.; Joseph, P.; Guillocheau, F.; Bourillet, J.-F.; Ledrezen, E.; Granjeon, D. Sedimentary sequences in the Gulf of Lions: A record of 100,000 years climatic cycles. Mar. Pet. Geol. 2005, 22, 775–804. [Google Scholar] [CrossRef]
  95. Rabineau, M.; Berné, S.; Olivet, J.L.; Aslanian, D.; Guillocheau, F.; Joseph, P. Paleo sea levels reconsidered from direct observation of paleoshoreline position during glacial maxima (for the last 500,000 yr). Earth Planet. Sci. Lett. 2006, 252, 119–137. [Google Scholar] [CrossRef]
  96. Tesson, M.; Posamentier, H.W.; Gensous, B. Stratigraphic organization of Late Pleistocene deposits of the western part of the Golfe du Lion Shelf (Languedoc Shelf), Western Mediterranean Sea, using high-resolution seismic and core data. AAPG Bull. 2000, 84, 119–150. [Google Scholar] [CrossRef]
  97. Carvajal, C.; Steel, R.; Petter, A. Sediment supply: The main driver of shelf-margin growth. Earth-Sci. Rev. 2009, 96, 221–248. [Google Scholar] [CrossRef]
  98. Muto, T.; Steel, R. Role of autoretreat and A/S changes in the understanding of deltaic shoreline trajectory: A semi-quantitative approach. Basin Res. 2002, 14, 303–318. [Google Scholar] [CrossRef]
  99. Burgess, P.; Steel, R.; Granjeon, D. Stratigraphic forward modeling of basin-margin clinoform systems: Implications for controls on topset and shelf width and timing of formation of shelf-edge deltas. In Recent Advances in Models of Siliciclastic Shallow-Marine Stratigraphy; SEPM Special Publication: Claremore, OK, USA, 2008; Volume 90, pp. 35–45. [Google Scholar]
  100. Caballero, Y.; Ladouche, B.; Dewandel, B. Modèle conceptuel du comportement des eaux souterraines de l’aquifère Plio-Quaternaire de la plaine du Roussillon, de 1960 à nos jours. In Production #23 du Projet Dem’Eaux Roussillon; BRGM/RP-71763-FR: Orléans, France, 2022; 111p; Available online: http://infoterre.brgm.fr/rapports//RP-71763-FR.pdf (accessed on 15 September 2025).
  101. Petelet-Giraud, E.; Négrel, P.; Aunay, B.; Ladouche, B.; Bailly-Comte, V.; Guerrot, C.; Flehoc, C.; Pezard, P.; Lofi, J.; Dörfliger, N. Coastal groundwater salinization: Focus on the vertical variability in a multi-layered aquifer through a multi-isotope fingerprinting (Roussillon Basin, France). Sci. Total Environ. 2016, 566–567, 398–415. [Google Scholar] [CrossRef]
  102. Dewandel, B.; Ladouche, B.; Caballero, Y. Synthèse et valorisation des données d’essais par pompage réalisés sur les sites Dem’Mer et Dem’Ter dans le cadre du projet Dem’Eaux Roussillon. In Production #22b du Projet Dem’Eaux Roussillon; BRGM/RP-71514-FR: Orléans, France, 2022; 99p. [Google Scholar]
  103. Lofi, J.; Inwood, J.; Proust, J.N.; Monteverde, D.H.; Loggia, D.; Basile, C.; Otsuka, H.; Hayashi, T.; Stadler, S.; Mottl, M.; et al. Fresh-water and salt-water distribution in passive margin sediments: Insights from Integrated Ocean Drilling Program Expedition 313 on the New Jersey Margin. Geosphere 2013, 9, 1009–1024. [Google Scholar] [CrossRef]
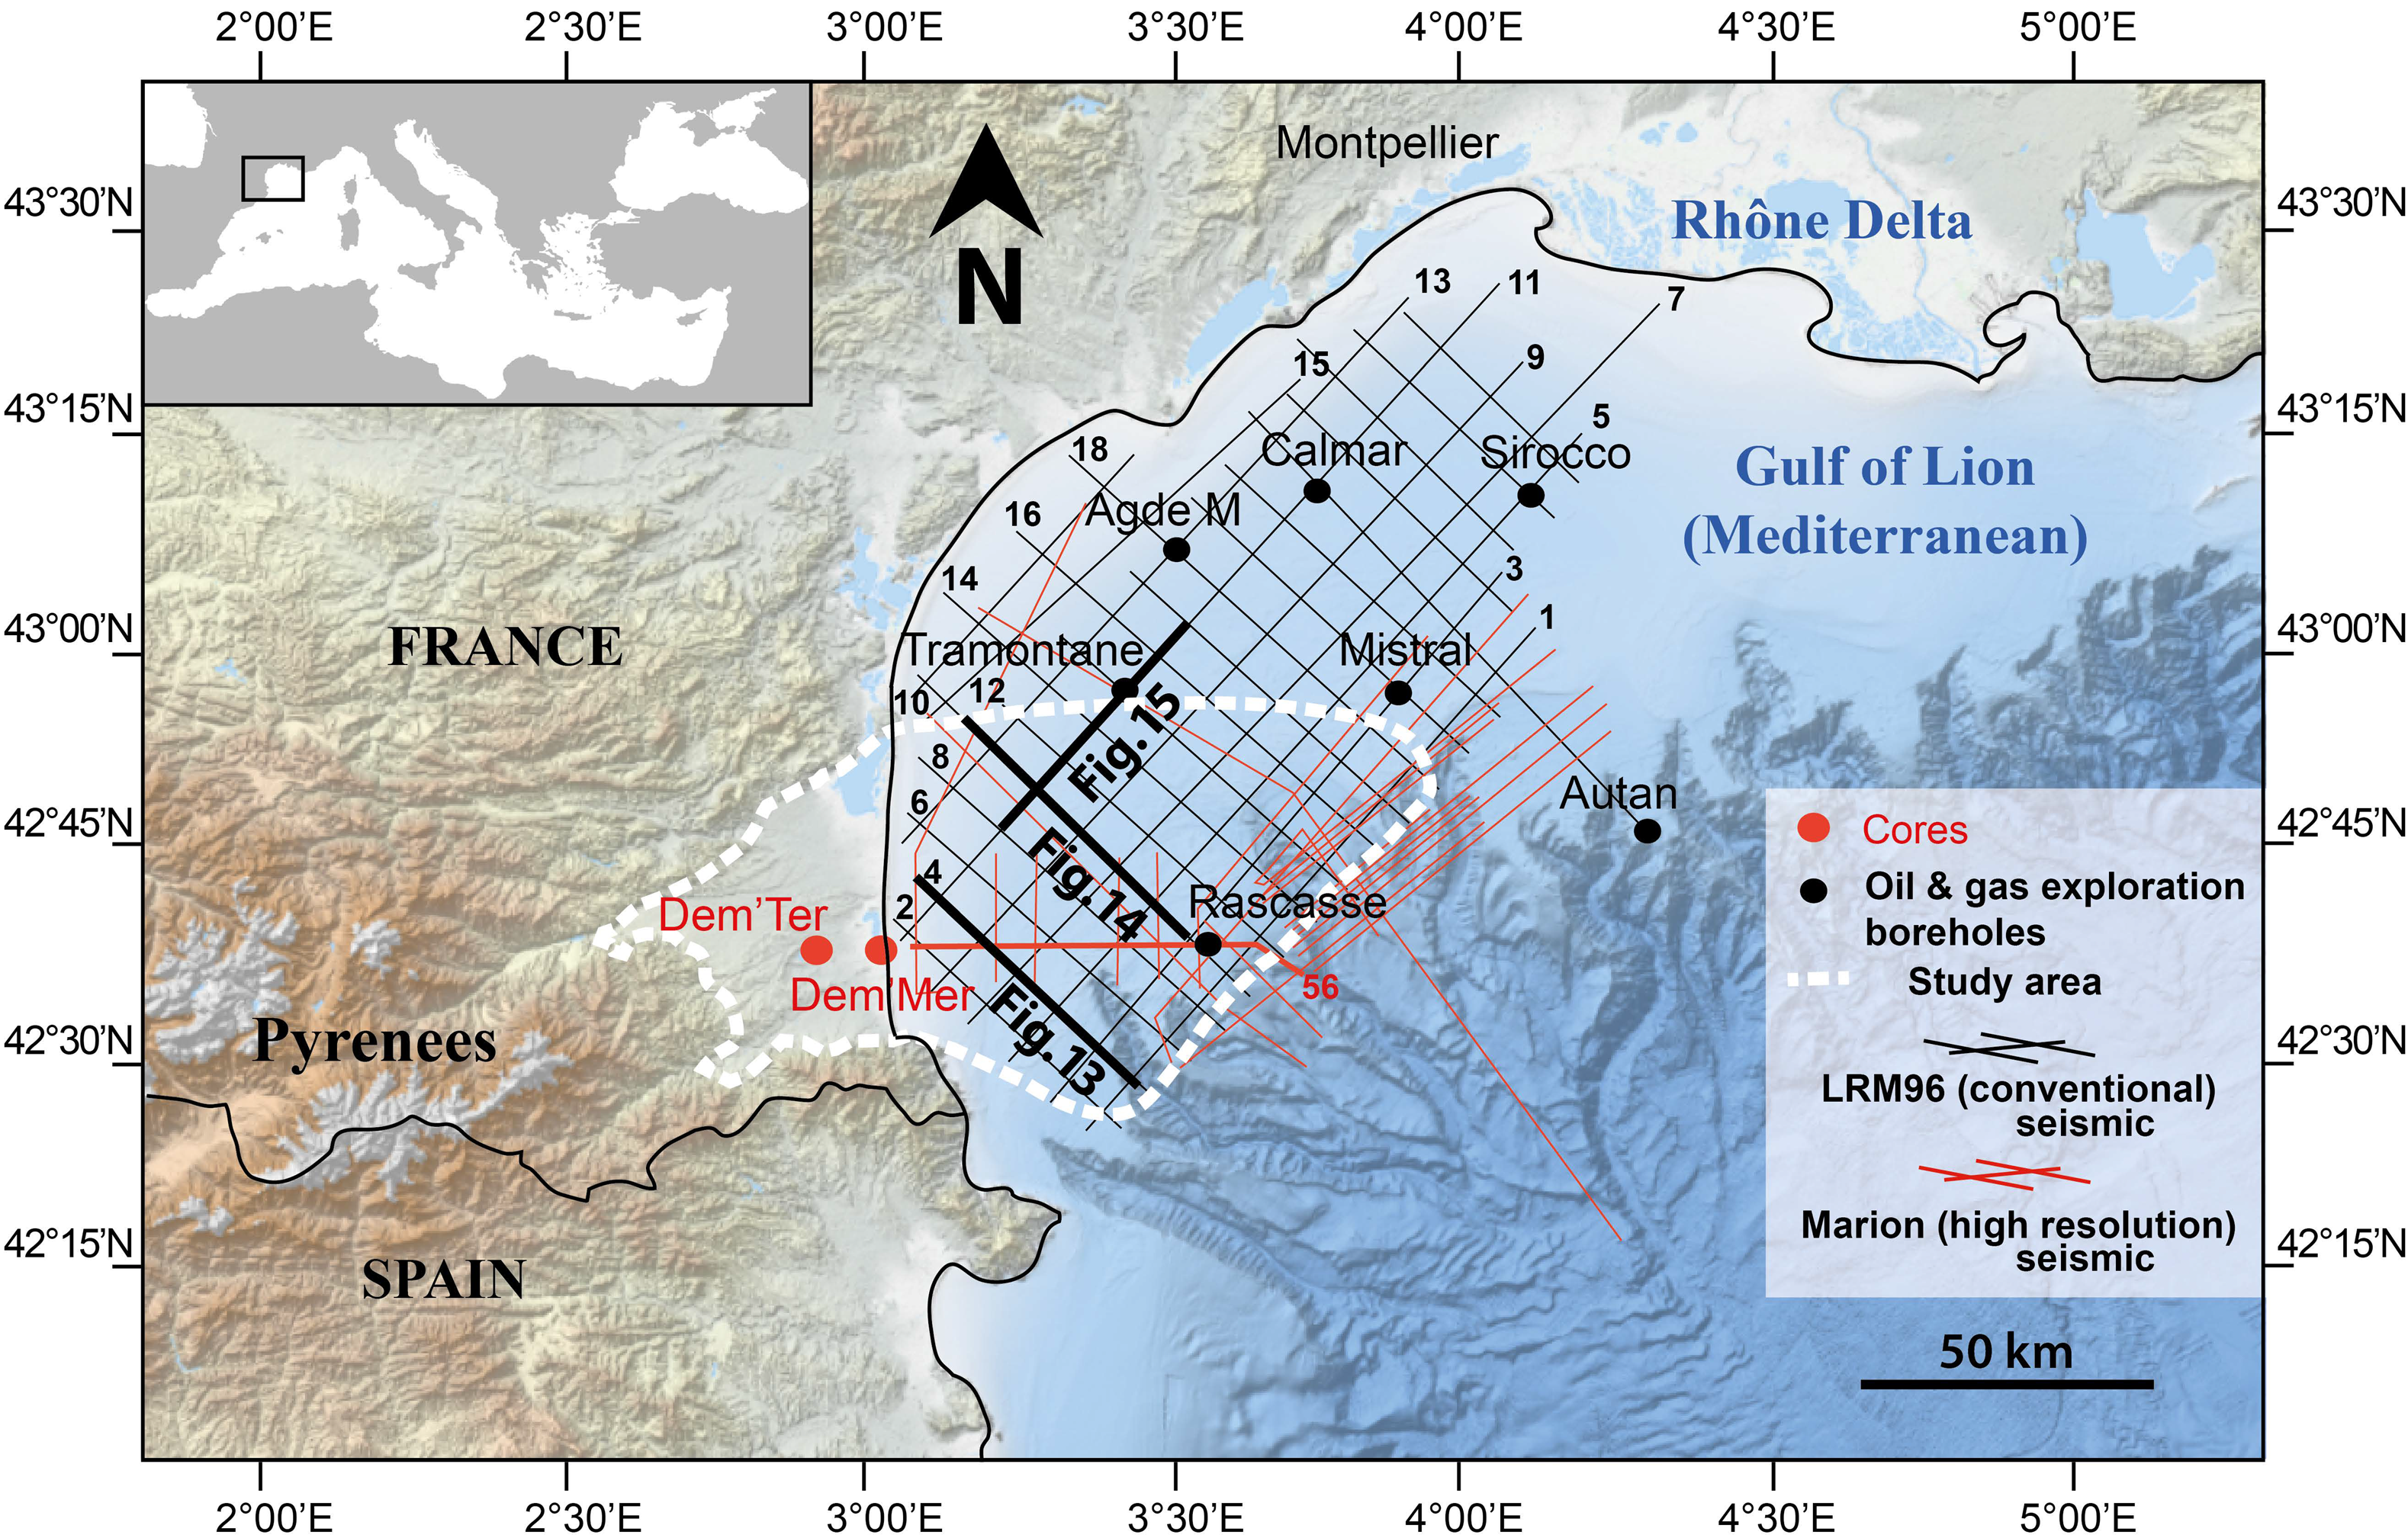
Figure 1. Location of the study area. It covers the Roussillon Basin onshore and extends offshore to the shelf on the western part of the Gulf of Lion margin. LRM96 and Marion are reflection seismic surveys. The elevation map in the background is from EMODnet. Circles show drillings.
Geosciences 15 00383 g001
Figure 4. Outcrop near St-Barbe vineyard (see Figure 2) illustrating AF2: meandering? channel (MC) incising floodplain deposits made of calcrete nodules (Ca) alternating with oxidized clay (FPo).
Geosciences 15 00383 g004
Figure 5. Outcrops displaying AF6: (A) SCS (yellow) expressing shoreface (Sh) environment eroding a set of sigmoidal dune (orange) belonging to a flood delta (FD); (B) ridge and runnel geometries truncating bioturbated levels (white dots) in a foreshore (Fs) environment; (C) fan delta (Fan) (red), alternating with 2-3D dunes, SCS, low-angle planar beddings, and gravel lags. These sedimentary structures are characteristic of shoreface/foreshore sands. The scraper, for scale, is 1.25 m long and 35 cm wide.
Geosciences 15 00383 g005
Figure 6. Schematic illustrations of the 3 depositional profiles recognized in the Pliocene filling of the Roussillon Basin, based on the identification of characteristic sedimentary facies and their lateral organization. These schemes are based on local observations (outcrops and boreholes (see Figure 2)) and should not be considered as precise paleogeographic maps. The 3 profiles evolve in time from a Gilbert delta (profile (1)) to a reworked fan delta (profile (2)) and, finally, a wave-dominated delta (profile (3)). Two configurations are distinguished in DP3, corresponding to regressive (3.a) and transgressive (3.b) shorelines. The alluvial plain in (3.a) depicts a confined river system with development of Pa/Ca in stable interfluve positions and with the domination of floodplain (FPo) over fluvial sands. This system corresponds to AF2 (see Section 4.1.1), which is prone to developing in a prograding system. Conversely, the alluvial plain of (3.b) shows wider fluvial belts due to frequent overbanks and channel migrations. Flood plain (FPo) is no longer dominant and Pa/Ca poorly represented, which corresponds to AF3 (see Section 4.1.1) and is coherent with an aggrading/transgressive trend.
Geosciences 15 00383 g006
Figure 7. Seismic facies descriptions, locations, and associated illustrations (snapshots from seismic profiles of LRM96). Vertical exaggeration is 10× in every snapshot, and the amplitude scale for the seismic reflections is also identical. Terms in the first column (Topsets, Foresets, and Bottomsets) refer to shelf-scale clinoforms. Note that ms twt stands for milliseconds two-way travel time.
Geosciences 15 00383 g007
Figure 8. Sections located on LRM10 (left) and LRM14 (right) seismic profiles (Figure 1), showing potential shoreline-scale clinoforms with poorly expressed geometries, as their dimensions are below the seismic resolution.
Geosciences 15 00383 g008
Figure 9. Sensitivity test on both strata thickness and spacing at fixed acoustic-impedance contrasts: (A) geological models to be tested consisting of alternations of calcrete beds (Ca) and floodplain deposits (FPo) with various geometries; (B) seismic synthetic models for a 40 Hz dominant frequency.
Geosciences 15 00383 g009
Figure 10. Comparison between synthetic seismic data derived from sedimentary facies associations AF2 (confined alluvial plain) and AF3 (unconfined alluvial plain), as well as seismic facies SF1a-1 and SF1a-2, observed in the Pliocene topsets offshore. (1) Geological model proposed for AF2 and AF3 (see Section 3). (2) Synthetic seismic models with two different dominant frequencies (40 Hz and 50 Hz). (3) Samples of seismic facies (SF1a-2 and SF1a-1) taken from the seismic profile LRM10. The red square highlights the comparison between synthetics and seismic data.
Geosciences 15 00383 g010
Figure 11. Comparison between synthetic seismic data derived from facies association AF4/AF5 (delta plain/embayment) and seismic facies SF1b observed in the Pliocene topsets offshore. The sedimentary facies populating the geological models are indicated on the Vp color scale in part (1). (1) Geological model proposed for Ca/FPo alternations in AF2 used as a comparative for amplitude contrasts and for AF4/AF5. (2) Synthetic seismic data generated with a dominant frequency of 40 Hz. (3) Samples of seismic facies (A and B) taken from the seismic profile LRM5: A is a subfacies within SF1a believed to image Ca/FPo alternation; B corresponds to seismic facies SF1b. The red square highlights a comparison between the synthetics and seismic data.
Geosciences 15 00383 g011
Figure 12. Comparison between synthetic seismic data derived from shoreline clinoforms and sigmoidal reflections observed in the Pliocene topsets offshore: (A) geological model proposed; (B) synthetic seismic models with four different dominant frequencies (30, 40, 50, and 60 Hz); (C) portion of the LRM7 seismic profile and a zoomed-in inset showing the sigmoidal reflections, interpreted here as prograding delta-scale clinoforms. A basinward tilt affects these series as a result of margin subsidence.
Geosciences 15 00383 g012
Table 1. Sedimentary facies composing sedimentary facies associations (AFs).
Sedimentary Facies Associations (AF)Sedimentary Facies
AF1GDt, GDf, GDb.
AF2FPo, MC, BC, Df, CS1, CS2, CS3, Lk, Lkl, Ca, Pa.
AF3FPo, MC, Df, CS1, CS2, CS3, Lk, Lkl, Ca, Pa.
AF4FPr, MC, Df, CS1, CS2, CS3, Lk, Lkl, Ca, Pa.
AF5Lg, Bh, Pa.
AF6Fan, FD, Fs, Sh.
AF7TF, Mb, DF, (Fs, Sh).
AF8PD.
Table 2. Petrophysical values used to populate the geological models (Vp = 2 Vs). P-wave velocity (Vp), S-wave velocity (Vs), and density (Mv).
Modeled Sedimentary FaciesVp (km·s−1)Vs (km·s−1)Mv (g·cm−3)
Channel (MC, BC)211.96
Overbank deposits (Df, CS1, CS2, CS3)1.8–1.850.9–0.932.04
Paleosols (Pa, Ca)2.2–2.51.1–1.252.25–2.35
Silty flood plain (FPo, FPr)1.7–1.720.85–0.862.11
Clays (FPo, FPr, Lg, Lk)1.560.782.11
Marine sands (FD, Mb, Fs, Sh, DF)2.311.1551.95
Offshore clays (PD)2.121.062.12
Table 3. Correlation between seismic facies and sedimentary facies associations proposed in this study. In italics, sedimentary facies are strictly based on seismic facies interpretations and have not been observed onshore. AF1 and AF6 are not observed on the seismic offshore. AF7 and AF8 have partially been modeled (Figure 12). The “Position” column refers to shelf-scale clinoforms. * SF1a-2 is interpreted as AF2 only in the specific configuration of fluvial valley fill.
PositionSeismic FaciesAFSedimentary Content/EnvironmentSeismic Modeling
--AF1Gilbert deltasNo
TopsetsSF1a-1AF2Confined alluvial plain with Ca/Pa developmentYes
SF1a-2AF3; AF2 *Overbank dominated alluvial plainYes
SF1bAF4; AF5Deltaic plain and embayments Yes
Topsets/ForesetsSF1cAF7Shallow marine sands including TF and MbYes
ForesetsSF2aAF8Upper offshore classic clay/silt/sand alternationsYes
Foresets/BottomsetsSF2b-Mixed-processes prodeltaNo
BottomsetsSF3a-Settling basinNo
Disclaimer/Publisher’s Note: The statements, opinions and data contained in all publications are solely those of the individual author(s) and contributor(s) and not of MDPI and/or the editor(s). MDPI and/or the editor(s) disclaim responsibility for any injury to people or property resulting from any ideas, methods, instructions or products referred to in the content.