Article

Groundwater Quality and Health Risk Assessment in Trenggalek Karst Springs and Underground Rivers as a Drinking Water Source

by
Aminuddin
1,
Nendaryono Madiutomo
2,
Zulfahmi
3,
Tedy Agung Cahyadi
4,
Ilham Firmansyah
4,
Rizka Maria
1,
Heri Nurohman
1 and
Nopri Dwi Siswanto
5,*
1
Research Center for Geological Resources, National Research and Innovation Agency, KST Samaun Samadikun, Bandung 40135, Indonesia
2
Research Center for Mining Technology, National Research and Innovation Agency, KST Samaun Samadikun, Bandung 40135, Indonesia
3
Research Center for Geological Disaster, National Research and Innovation Agency, KST Samaun Samadikun, Bandung 40135, Indonesia
4
Department of Mining Engineering, State Development University “Veteran”, Yogyakarta 55283, Special Region of Yogyakarta, Indonesia
5
Cendekia Leadership School, Jl. Ligar Taqwa No. 2, Kompleks Bukit Ligar, Jl. Ligar Melati, Cibeunying, Cimenyan, Bandung 40191, West Java, Indonesia
*
Author to whom correspondence should be addressed.
Geosciences 2025, 15(10), 381; https://doi.org/10.3390/geosciences15100381
Submission received: 2 July 2025 / Revised: 19 August 2025 / Accepted: 15 September 2025 / Published: 2 October 2025

Abstract

The karst landscape of Trenggalek Regency, located in several sub-districts including Dongko, Kampak, and Watulimo, is shaped by the Wonosari Formation and is characterized by springs and underground rivers. Due to water scarcity in the region, local communities heavily depend on these natural water sources. This study assesses the groundwater quality of 16 springs and 20 underground rivers to evaluate their suitability for consumption and associated health risks. Using the groundwater quality index (GWQI), human health risk assessment (HHRA), and statistical methods, various physicochemical parameters were analyzed, including pH, total dissolved solids (TDS), electrical conductivity (EC), and concentrations of iron (Fe2+), manganese (Mn2+), calcium carbonate (CaCO3), and sulfate (SO4). Water generally meets the World Health Organization standards for safe drinking. However, correlation analysis reveals notable mineral dissolution and possible anthropogenic influence. TDS strongly correlates with EC (r = 0.97), while Fe2+ shows significant relationships with Mn and TDS. Conversely, CaCO3 shows a negative correlation with EC and TDS, suggesting alternative sources beyond rock weathering. The HHRA indicates higher non-carcinogenic health risks from Fe2+ contamination in underground rivers compared to springs. The study’s novelty comes in its integrated assessment of groundwater quality and health hazards in Trenggalek’s karst region, which uses GWQI, HHRA, and statistical analysis to show geochemical interactions and highlight iron-related health issues in underground rivers.

1. Summary

The unique topography in Trenggalek Regency, which includes geological and hydrogeological characteristics, found springs and underground rivers which are typical of karst landscapes formed by karstification. This area faces urgent challenges in the form of water scarcity, which drives local communities to rely on springs as a vital source of daily water supply. This study aims to evaluate the groundwater quality of springs and underground rivers in the Trenggalek karst area. The main objective is to assess the health risks of water use in this area. This study uses several methodologies, including the groundwater quality index (GWQI), human health risk assessment (HHRA), and statistical analysis. To meet these objectives, this study involved the collection and analysis of groundwater samples from 16 karst springs and 20 underground rivers. The novelty of this study is the correlation analysis of physicochemical parameters and ion compound content in water in the karst area. Based on the World Health Organization (WHO) standards, groundwater in the Trenggalek karst area meets the criteria for safe drinking water in terms of its physicochemical properties. However, the correlation analysis shows an increase in rock mineral dissolution in groundwater. The results of the health risk assessment revealed that the non-carcinogenic health risks from consuming iron-contaminated water in underground rivers were significantly higher than those associated with springs. The correlation matrix showed that most of the water quality parameters had statistically significant relationships. Meanwhile, the negative correlation of calcite rocks implies that its presence is not only caused by rock weathering but can also be influenced by anthropogenic sources. This suggests that ongoing communication with local residents regarding the risks posed by inorganic contaminants to human health in the area is needed.

2. Introduction

The rapid growth of the global population will lead to significant challenges, particularly in meeting the demand for groundwater resources [1]. The demand for water resources, particularly surface and groundwater, is closely linked to the global population growth rate [2]. Groundwater is essential for daily life, serving as a crucial resource for drinking water, household use, agriculture, and industrial activities [3]. Groundwater quality, particularly in tropical regions, is influenced by geological and climatic conditions, as well as human activities [4]. Groundwater, which is commonly utilized for daily needs and agricultural purposes, serves as a readily accessible water source within our living environment [5]. Important water sources throughout the world can be obtained in karst areas, which can store large amounts of water [6]. Pollution in karst aquifers exhibits more complex behavior compared to other types of aquifers due to the rapid infiltration of surface water into the groundwater system, which facilitates the easy transport of contaminants. This process can lead to significant changes in water quality [7].
The hydrological system in karst morphology, which develops due to the dissolution of soluble rock, consists of a combination of conduits formed by dissolution processes and water movement through the spaces between particles, known as diffuse flow. The availability and quality of water resources in such environments are significantly affected by human activities and other life processes occurring in the surrounding area [8]. Karst areas exhibit a higher susceptibility to pollution compared to other natural landscapes due to the limited ability of the rock formations to filter contaminants from groundwater. The dissolution of limestone or dolomite leads to an elevated concentration of calcite in the water, distinguishing karst hydrogeochemical conditions from those found in other geological settings [9]. Total dissolved solids and ion content in aquatic conditions can be measured by TDS parameter values and electrical conductivity (EC) values [10].
The geographical characteristics of Trenggalek Regency indicate its vulnerability to drought, particularly during prolonged dry seasons. This phenomenon is attributed to the region’s geological composition, which predominantly consists of limestone lithology. Consequently, groundwater extraction through dug wells is not a viable option for meeting domestic water needs, unlike in areas with more suitable aquifer systems. The dug wells in this region function primarily as rainfed reservoirs, accumulating water during periods of high rainfall intensity and drying up when precipitation decreases. A significant portion of the population relies on the local water utility for their daily water requirements. However, during the dry season, the limited capacity of the water supply infrastructure prevents equitable distribution across all areas, necessitating a rotational allocation system. In light of these challenges, the utilization of springs emerges as a crucial strategy to enhance the availability of clean water for residents.
Despite significant efforts over the past decade to improve access to safe drinking water in Trenggalek, East Java, numerous small rural communities continue to depend on individual wells, natural springs, or informal local water distribution systems with uncertain or insufficiently monitored water quality. As a result, these communities face potential health risks due to the consumption of substandard drinking water. This study aims to assess the number of springs and underground river sources, as well as evaluate groundwater quality and associated health risks in the research area. Specifically, this study examines the physicochemical properties of water from 16 karst springs and 20 underground rivers in the Trenggalek karst region, alongside an assessment of the potential health risks for communities that rely on these water sources for drinking purposes. The research employs the groundwater quality index, health risk assessment, and statistical analysis as its primary methodologies. A key aspect of this study is its originality, as no comprehensive examination of the water chemistry in these springs and underground rivers has been conducted before.

Geology and Hydrogeological Setting of the Study Area

The study area in Trenggalek is the regency of East Java Province. Trenggalek Regency has an area of 1261.40 km2, with geographical conditions consisting of mountains and plains. The population is 680,929 people, with a population density of 540 people per square kilometer, (km2) and a population growth rate of 0.25%. Trenggalek has several types of soil: among them are Mediterranean MK, alluvial, and podzolic humid. The average rainfall is 1910 mm/year (Trenggalek Regency Statistics Agency, Trenggalek, Indonesia, 2022) (Figure 1). Springs and underground rivers are water sources used to meet the drinking water needs of the Trenggalek people.
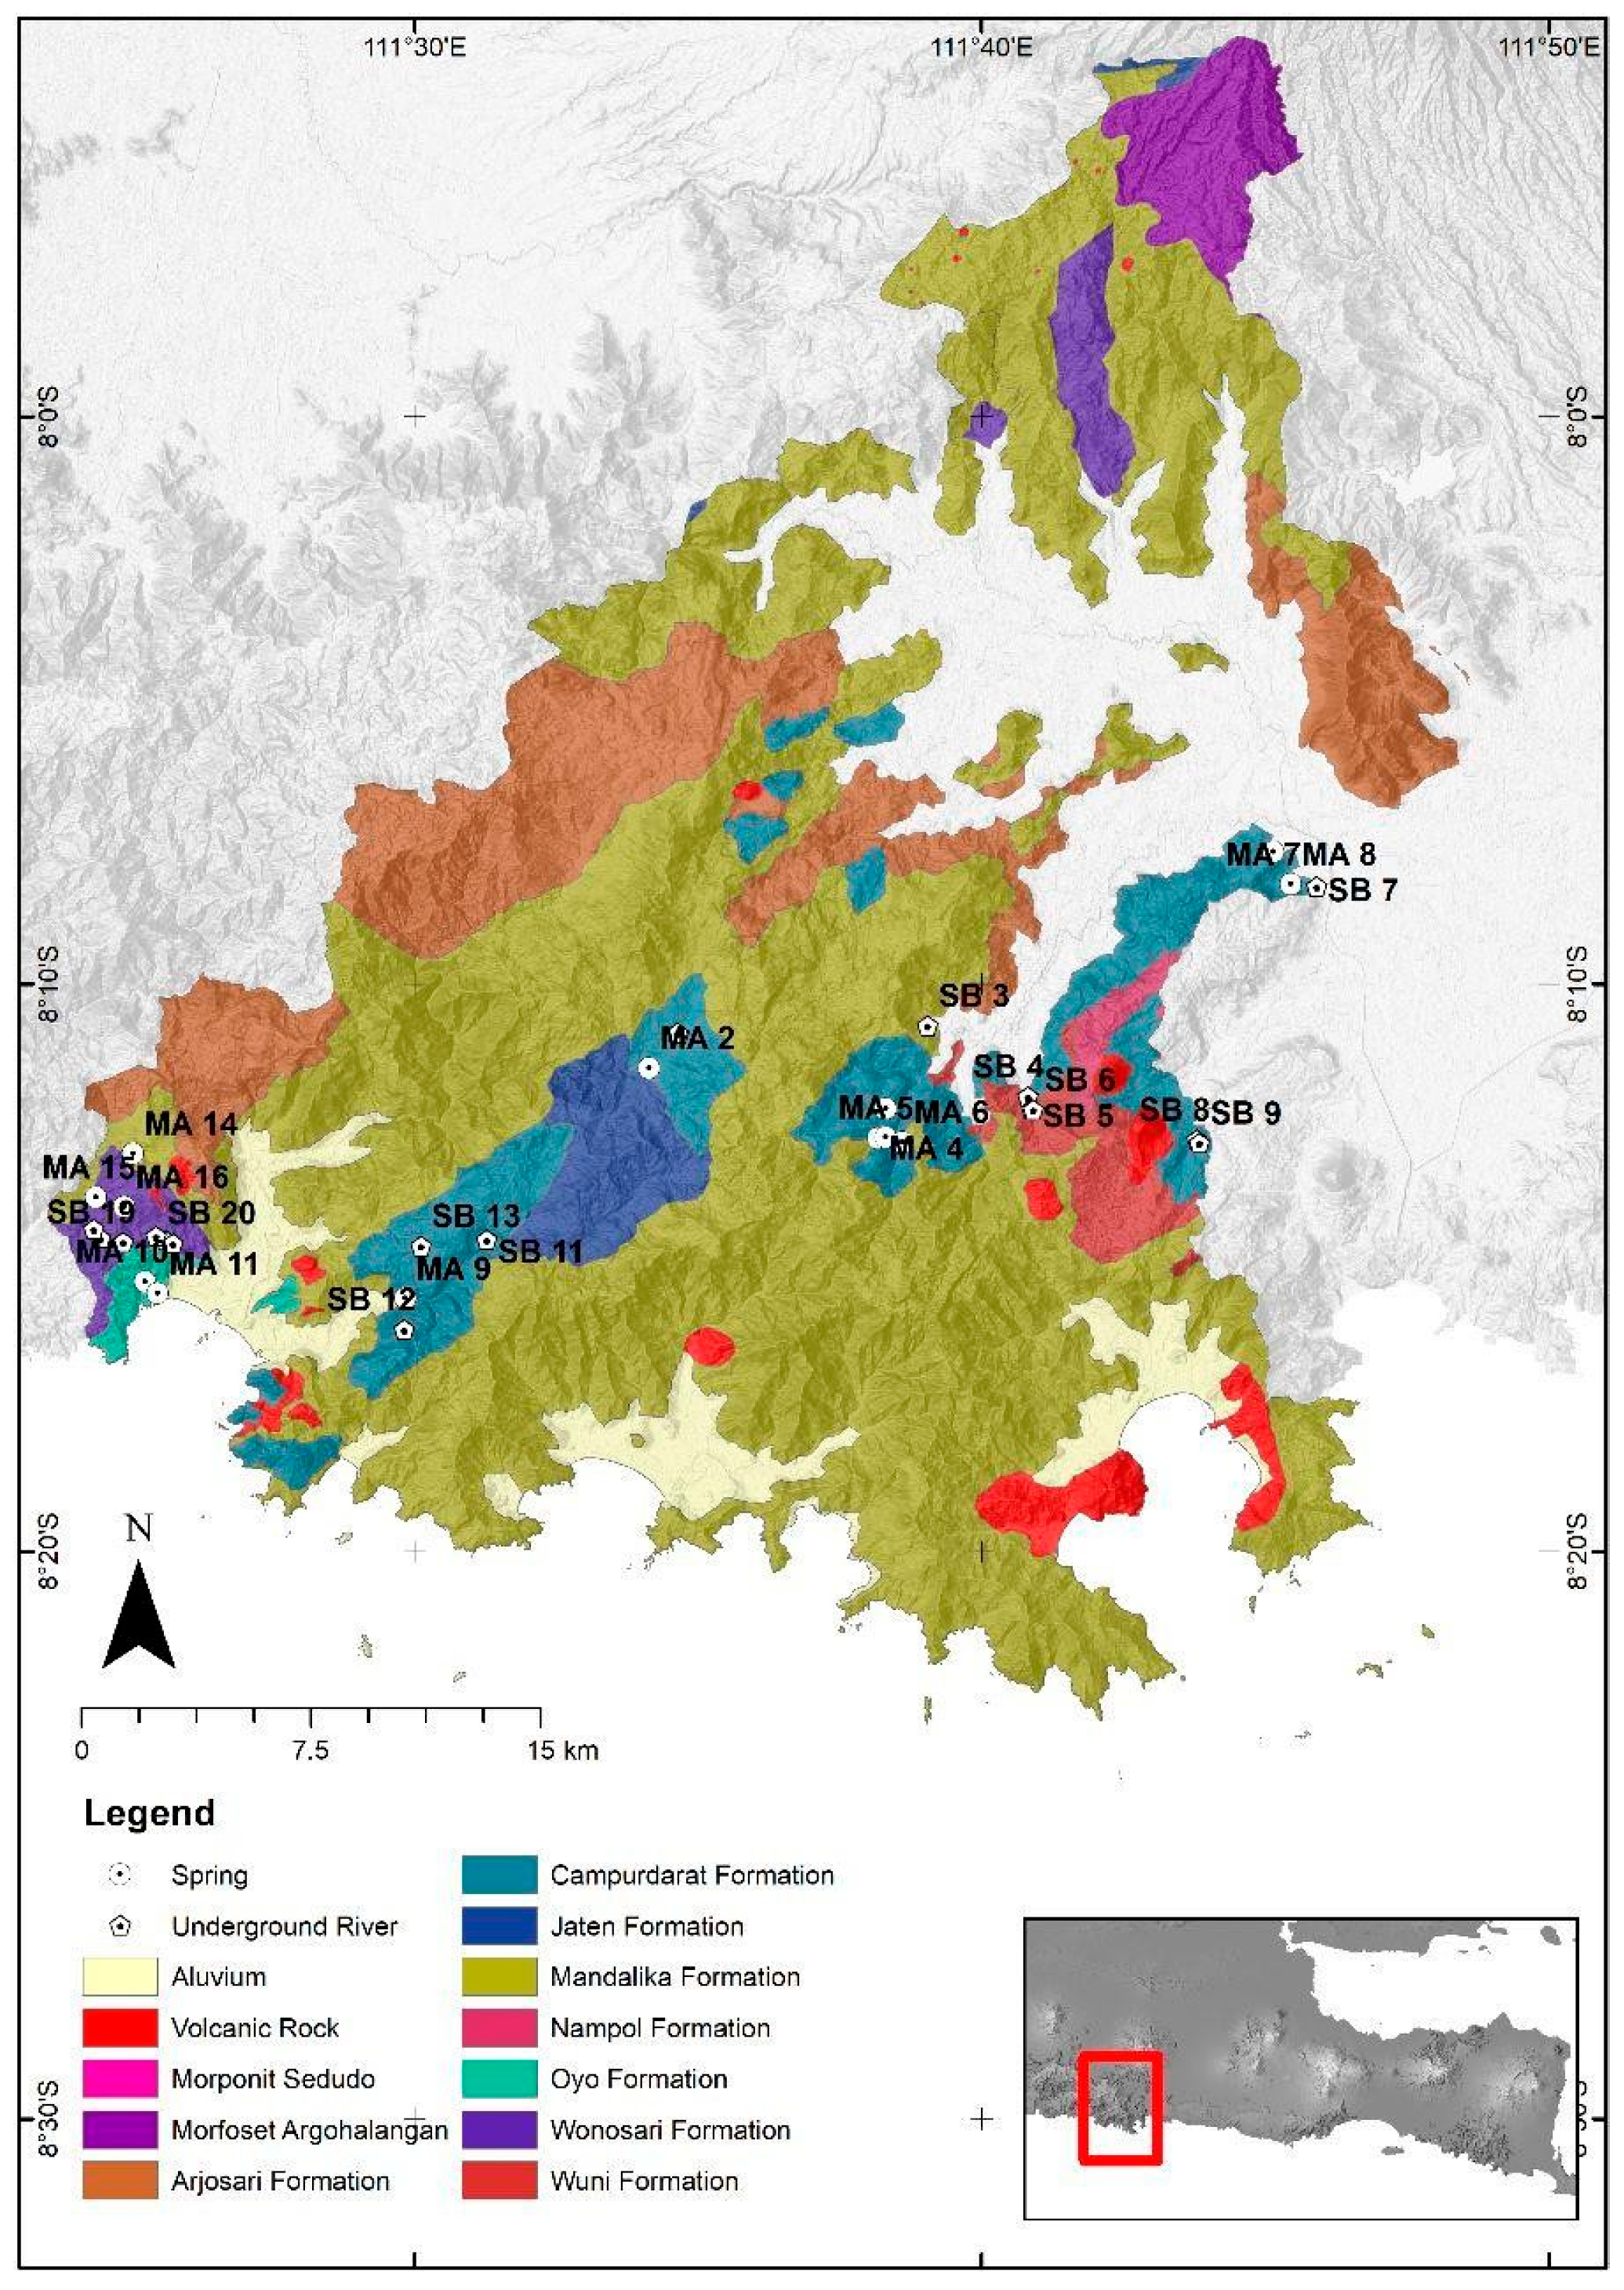
The geological conditions of the study area are described based on findings by Samodra and Gafoer, [11] as well as Hartono, Baharuddin, and Brata [12]. During the Tertiary period, various types of rocks were formed, including intrusion rocks (Tom); ancient volcanic rocks, including the Mandalika Formation (Tomm) and the Wuni Formation (Tmw); clastic sedimentary rocks such as the Arjosari Formation (Toma), Jaten Formation (Tmj), Nampol Formation (Tmn), and (Tmo); and limestone formations, including the Campurdarat Formation (Tmcl) and the Wonosari Formation (Tmwl) (see Figure 2). Additionally, young volcanic rocks (Qav) and alluvial deposits (Qa) were formed during the Quaternary (Cenozoic) era.
The old volcanic rocks (Tomm) exhibit the broadest lateral distribution, covering approximately 45% of the area. They are primarily composed of volcanic breccias, tuffs, and limestone intercalations. Clastic sedimentary rocks (Toma) follow with the subsequent widest distribution, encompassing around 20% of the area. These rocks consist of breccias of various materials, siltstone, conglomerate, and limestone intercalations. This study focuses on limestone formations, specifically the Campurdarat Formation (Tmcl), which comprises crystalline limestone with claystone intercalations containing carbonate (about 15%), and the Wonosari Formation (Tmwl), which is dominated by reef limestone, bedded limestone, and sandy limestone (approximately 3%). Alluvial deposits (Qa) constitute around 15% of the area and are primarily composed of gravel, sand, silt, clay, and silt. Other rock units have a relatively small distribution area, collectively accounting for about 2% of the total area of the Trenggalek Regency (see Figure 2).
The tertiary group of rock units—comprising intrusive rocks (Tom), old volcanic rocks (Tomm, Tmw), and clastic sedimentary rocks (Toma, Tmj, Tmn, Tmo)—exhibits low hydraulic permeability. Consequently, due to the reasons mentioned above, this region falls into the category of areas with non-exploitable groundwater, meaning that the potential for economically viable groundwater extraction is extremely limited. Groundwater is only found in limited quantities within the weathering zone in valleys and can be located within fissure and fracture aquifer systems. This geological condition covers approximately 65% of the total area of Trenggalek Regency.
In unconsolidated alluvial deposits, intergranular aquifer systems are predominantly composed of fine-grained materials such as clay and silt, with occasional sandy layers. These aquifers are generally characterized by moderate to low permeability, limited thickness, and low transmissivity. As a result, the construction of dug and driven wells in such areas typically produces a water yield of less than 5.0 L per second.
In limestone aquifer systems (Tmcl, Tmwl), groundwater flow is primarily controlled by fissures, fractured zones, and solution channels. The permeability of these aquifers ranges from moderate to high, depending on the degree of karstification. The Tmcl aquifer is characterized by moderate permeability, whereas the Tmwl aquifer exhibits high permeability. Aquifer productivity in the Tmcl region is considered moderate, with well and spring discharges varying across a wide range. Figure 3 presents the spatial distribution of groundwater sampling locations in the study area.
In contrast, the Tmwl area boasts high aquifer productivity, with good discharges exceeding 10 L per second. According to the Indonesian Groundwater Basin Map by Minister of Energy and Mineral Resources Decree (No. 2, 2017), the study area lies outside a potential groundwater basin or does not qualify as a groundwater basin. Consequently, groundwater management in this study area requires separate regulation through a ministerial decree by the authority responsible for groundwater resources.
Land use in Trenggalek Regency encompasses a variety of categories, including coppice, forest, secondary forest, secondary mangrove, agriculture, mining areas, housing, mixed agriculture, paddy fields, and fish ponds. Underground rivers and springs are primarily in agricultural, mixed agricultural, forested, and coppice areas. It is worth noting that activities related to land cover can have both positive and negative impacts on water resources [13,14]. On the other hand, changes in land cover can lead to significant variations in hydrochemistry and groundwater quality, a phenomenon well-documented in studies such as Das and Pal [15].

3. Materials and Methods

The groundwater object point was gathered during the dry season, with 36 water samples taken from 16 karst springs and 20 subsurface rivers in the Trenggalek karst area (Figure 1). The study has some limitations, one of which is that the survey was conducted solely during the dry season, which occurred between August and September of 2022. The collection of data pertinent to groundwater samples and the evaluation of the physicochemical properties of groundwater in the selected area comprised readings of pH, electrical conductivity (EC), and temperature. The Horiba U-10 was used to measure the water quality at both dug and drilled wells, as well as springs. A 500 mL plastic bottle, which had been washed with water before collection, was used to store the water samples.The local community relies on these water sources for drinking and daily household needs. All the springs and groundwater-fed rivers studied flow continuously throughout the year.
The chemical characteristics of water samples include CaCO3, SO42−, Fe2+, and Mn2+. Atomic absorption spectrometry (AAS) has been used with Shimadzu AA-7000 Atomic Absorption Spectrophotometer (Shimadzu Corporation, Kyoto, Japan)to estimate the quantities of Fe2+ and Mn2+, employing SNI 6989.84.2019 techniques. CaCO3 was estimated using wet analysis and titration according to SNI 06-6989.12:2004 procedures. Sulfate was measured using a Shimadzu UV-VIS 1700 spectrophotometer (Shimadzu Corporation, Kyoto, Japan) and ASTM D 4327 procedures. TDS values were quantified using gravimetric methods as per SNI 6898.27.2019. Total hardness (TH) was computed as equivalent to CaCO3. The measurements were conducted at the. Hydrogeology analyses were conducted in the Hydrogeology Laboratory at the Centre for Groundwater and Environmental Geology.

3.1. Groundwater Quality Index

The groundwater quality index (GWQI) serves as a comprehensive method for assessing overall groundwater quality in the study area by analyzing the concentrations of major cations, anions, and metal elements. The use of GWQI, which integrates an extensive dataset encompassing multiple sampling points and seasonal variations, provides a reliable framework for evaluating annual trends, spatial and temporal fluctuations, and broader patterns in groundwater quality dynamics [16,17].
The GWQI was determined through a systematic approach involving the following steps: (i) assigning weights (wi) to each water quality parameter according to its significance; (ii) computing the weighted values (Wi) and assessing the water quality rating (qi) using Equation (1); (iii) calculating the sub-index (SLi) for each parameter using Equations (2) and (3); (iv) deriving the final GWQI through Equation (4). The GWQI values were calculated using the following algorithmic procedures to ensure accurate and reliable assessment of groundwater quality [18,19,20]:
W i = w i i = 1 n . w i
q i = C i / S i × 100
S I i = W i × q i
G W Q I = S I i
where
  • Wi: weight of each indicator;
  • Wi: relative weight;
  • Qi: ranking for each parameter;
  • Wi: weight for each indicator was determined according to the value of water quality;
  • Ci: measured concentration;
  • Si: guideline value according to the drinking water quality guidelines [21].
The water quality parameter’s weight value (wi) was determined based on its importance to the overall quality of water acceptable for human consumption. The weighting for each parameter was determined using references based on an analysis of each parameter’s influence on human health (Table 1).
The values of the GWQI are put into categories and graded based on five different levels. To assist in deciding when groundwater is suitable for various applications, such as drinking and agricultural, the ground water quality index (GWQI) score is classified into five categories based on the quality of the ground water [24]. These different groups are determined by the quality of the ground water. This particular method was selected from among the several that are available for determining the current state of water quality (Table 2) [18]. For the purpose of calculating the GWQI, variables that were pertinent to both natural geological processes and probable anthropogenic impacts were utilized. A value of 5 was assigned to the pH scale. According to the pH scale, water can be classified as either acidic or alkaline, which has an effect on the solubility and toxicity of contaminants. The parameters EC, TDS, Fe, and Mn were given the most weight because of the enormous impact they have on water quality, particularly when it comes to drinking water. For example, the existence of pH, EC, TDS, Fe, and Mn accumulations in water can be an indication of either natural or man-made sources, which could possibly pose a threat to human health if they reach dangerous levels. Fe and Mn are the most crucial factors to take into account because both of these parameters are frequently discovered in karst regions, and an excessive amount of either one of them can have a substantial impact on the flavor, color, and health of the food [25]. Electrical conductivity (EC) is a measure of the capacity of water to carry electrical current, which is directly proportional to the amount of ions that are dissolved in the water. In groundwater, total dissolved solids (TDS) refers to the total amount of all inorganic and organic components. The purpose of these two metrics is to ensure that the carbonate and osmotic balances are preserved. According to [26]), SO2 is a way to determine the buffering capacity of water as well as the possible sources of contamination.

3.2. Human Health Risk Assessment

HHRA is a computational model designed to evaluate the extent to which contact with polluted water endangers human health [27]. The detrimental effects of groundwater contaminants on human health through oral consumption and skin contact have been examined in several earlier studies [28]. Non-carcinogenic risks from ingestion and skin contact were assessed for two age categories: children (0–21 years) and adults (21–72 years) [8]. The hazard quotient (HQ) for both oral and dermal exposure was determined using Equation (5), which relies on the average daily dose (ADD) calculated through Equations (6) and (7)). These are as follows:
H Q = A D D R f d
A D D   o r a l = C W × I R × E F × E D B W   x   A T
A D D   d e r m a l = C W × S A × K p × E T × E F × E D   10 4 B W   x   A T
where CW is the pollutant concentration in water [mg L−1], IR is consumption rate [L day−1], EF and ED are exposure frequency [days year−1] and duration [years], BW is body weight [kg], AT is the meantime [days], SA is the exposed skin area [cm2], Kp is the coefficient of skin permeability in water [cm h−1], and ET is the exposure time [h days−1].
The potential for non-carcinogenic effects is calculated by the number of HQ for each pollutant and is expressed as a hazard index (HI) (Equation (8)). The total hazard index (THI) is calculated according to Equation (9) [23]. HQ, HI, or THI values above 1.0 indicate a non-carcinogenic health risk [29]. The equations are as follows:
H I = H Q
T H I   =   H I   o r a l   ×   H I d e r m a l
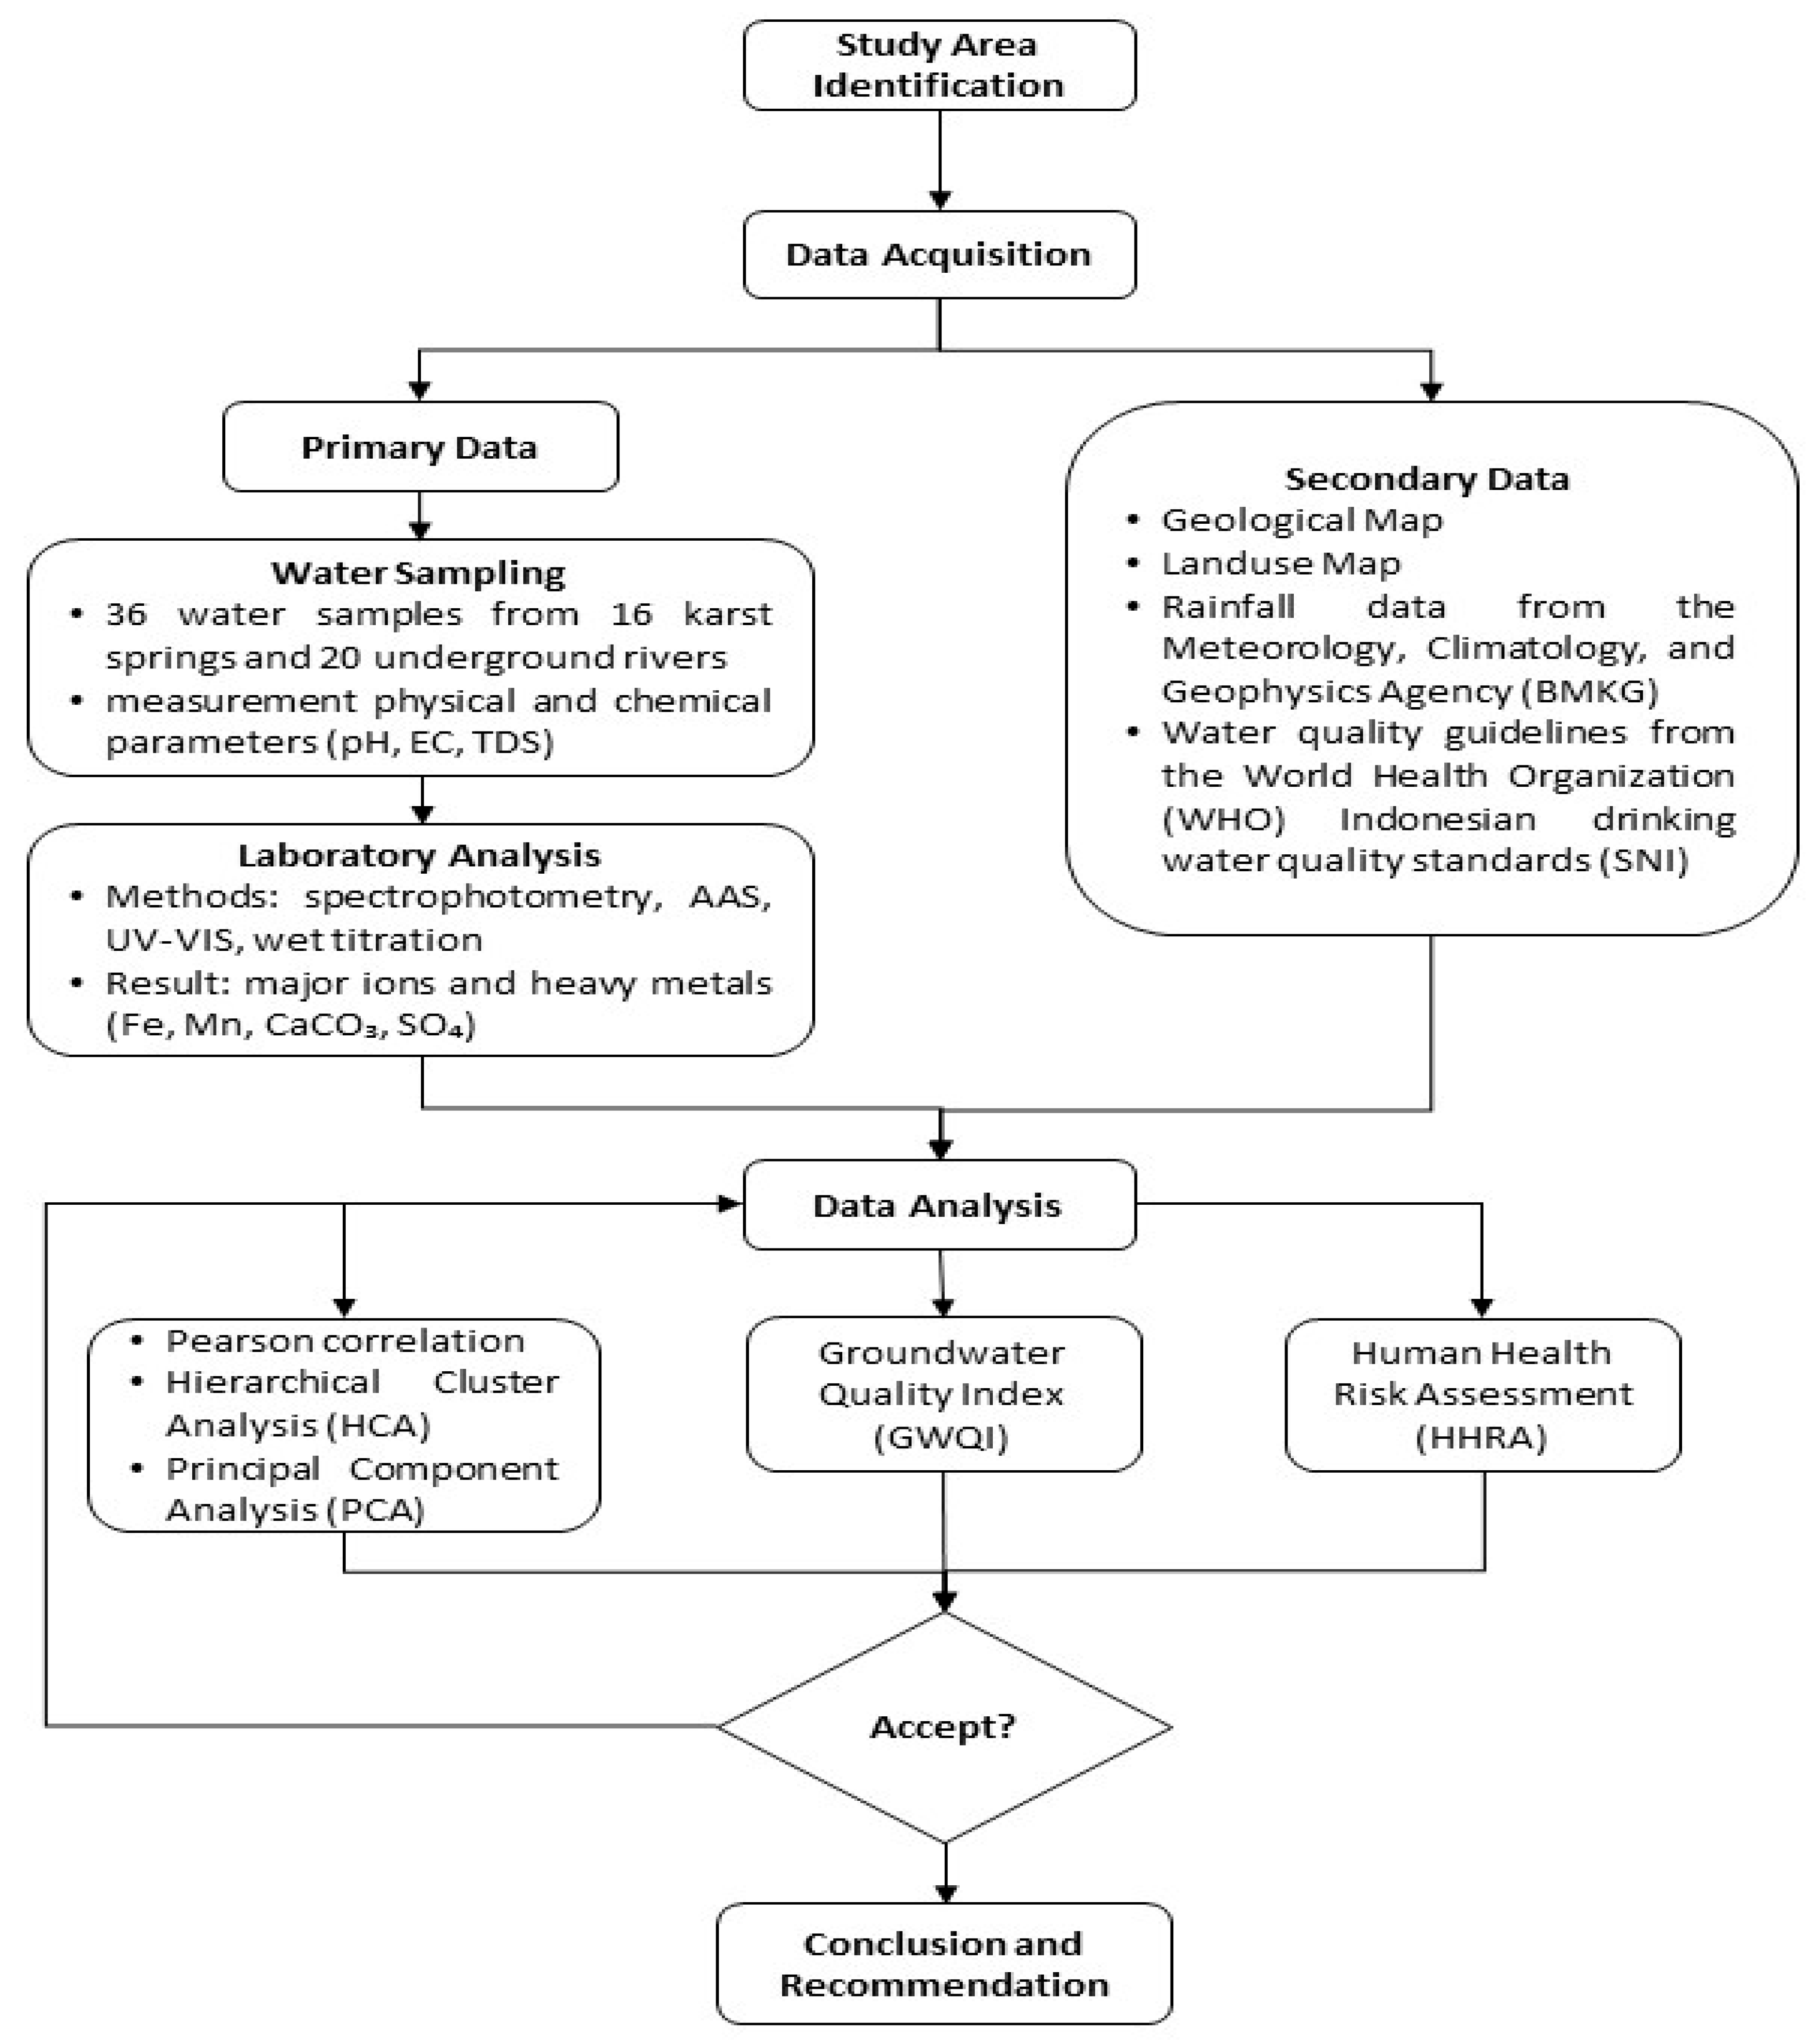
The distribution of major ions in the groundwater was examined using the hydrogeochemical method. The multivariate statistical analysis examined factors affecting the spatial distribution of CaCO3, SO42−, Fe2+, and Mn2+. All statistics among EC, TDS, pH, CaCO3, SO42−, Fe2+, and Mn2+ were conducted using Past 4.03 software. The methods used in this study are shown in Figure 4.

4. Results

The physicochemical parameters of the research area were compared with the guideline values recommended for drinking water and human consumption set by the World Health Organization. The water was neutral, with a pH between 6.14 and 7.51. pH influences the solubility of toxic metals that harm aquatic living organisms and human health [30]. The presence of dissolved minerals and organic substances in water can be seen from high levels of EC and TDS [31]. The WHO set the acceptable limit of TDS in drinking water at 1000 mg L−1. The EC ranged between 326.5 and 2216 µS/cm. The total dissolved solids (TDS) ranged between 234 and 1548 mgL−1, indicating the concentration of inorganic salts dissolved in water (see Table 2).
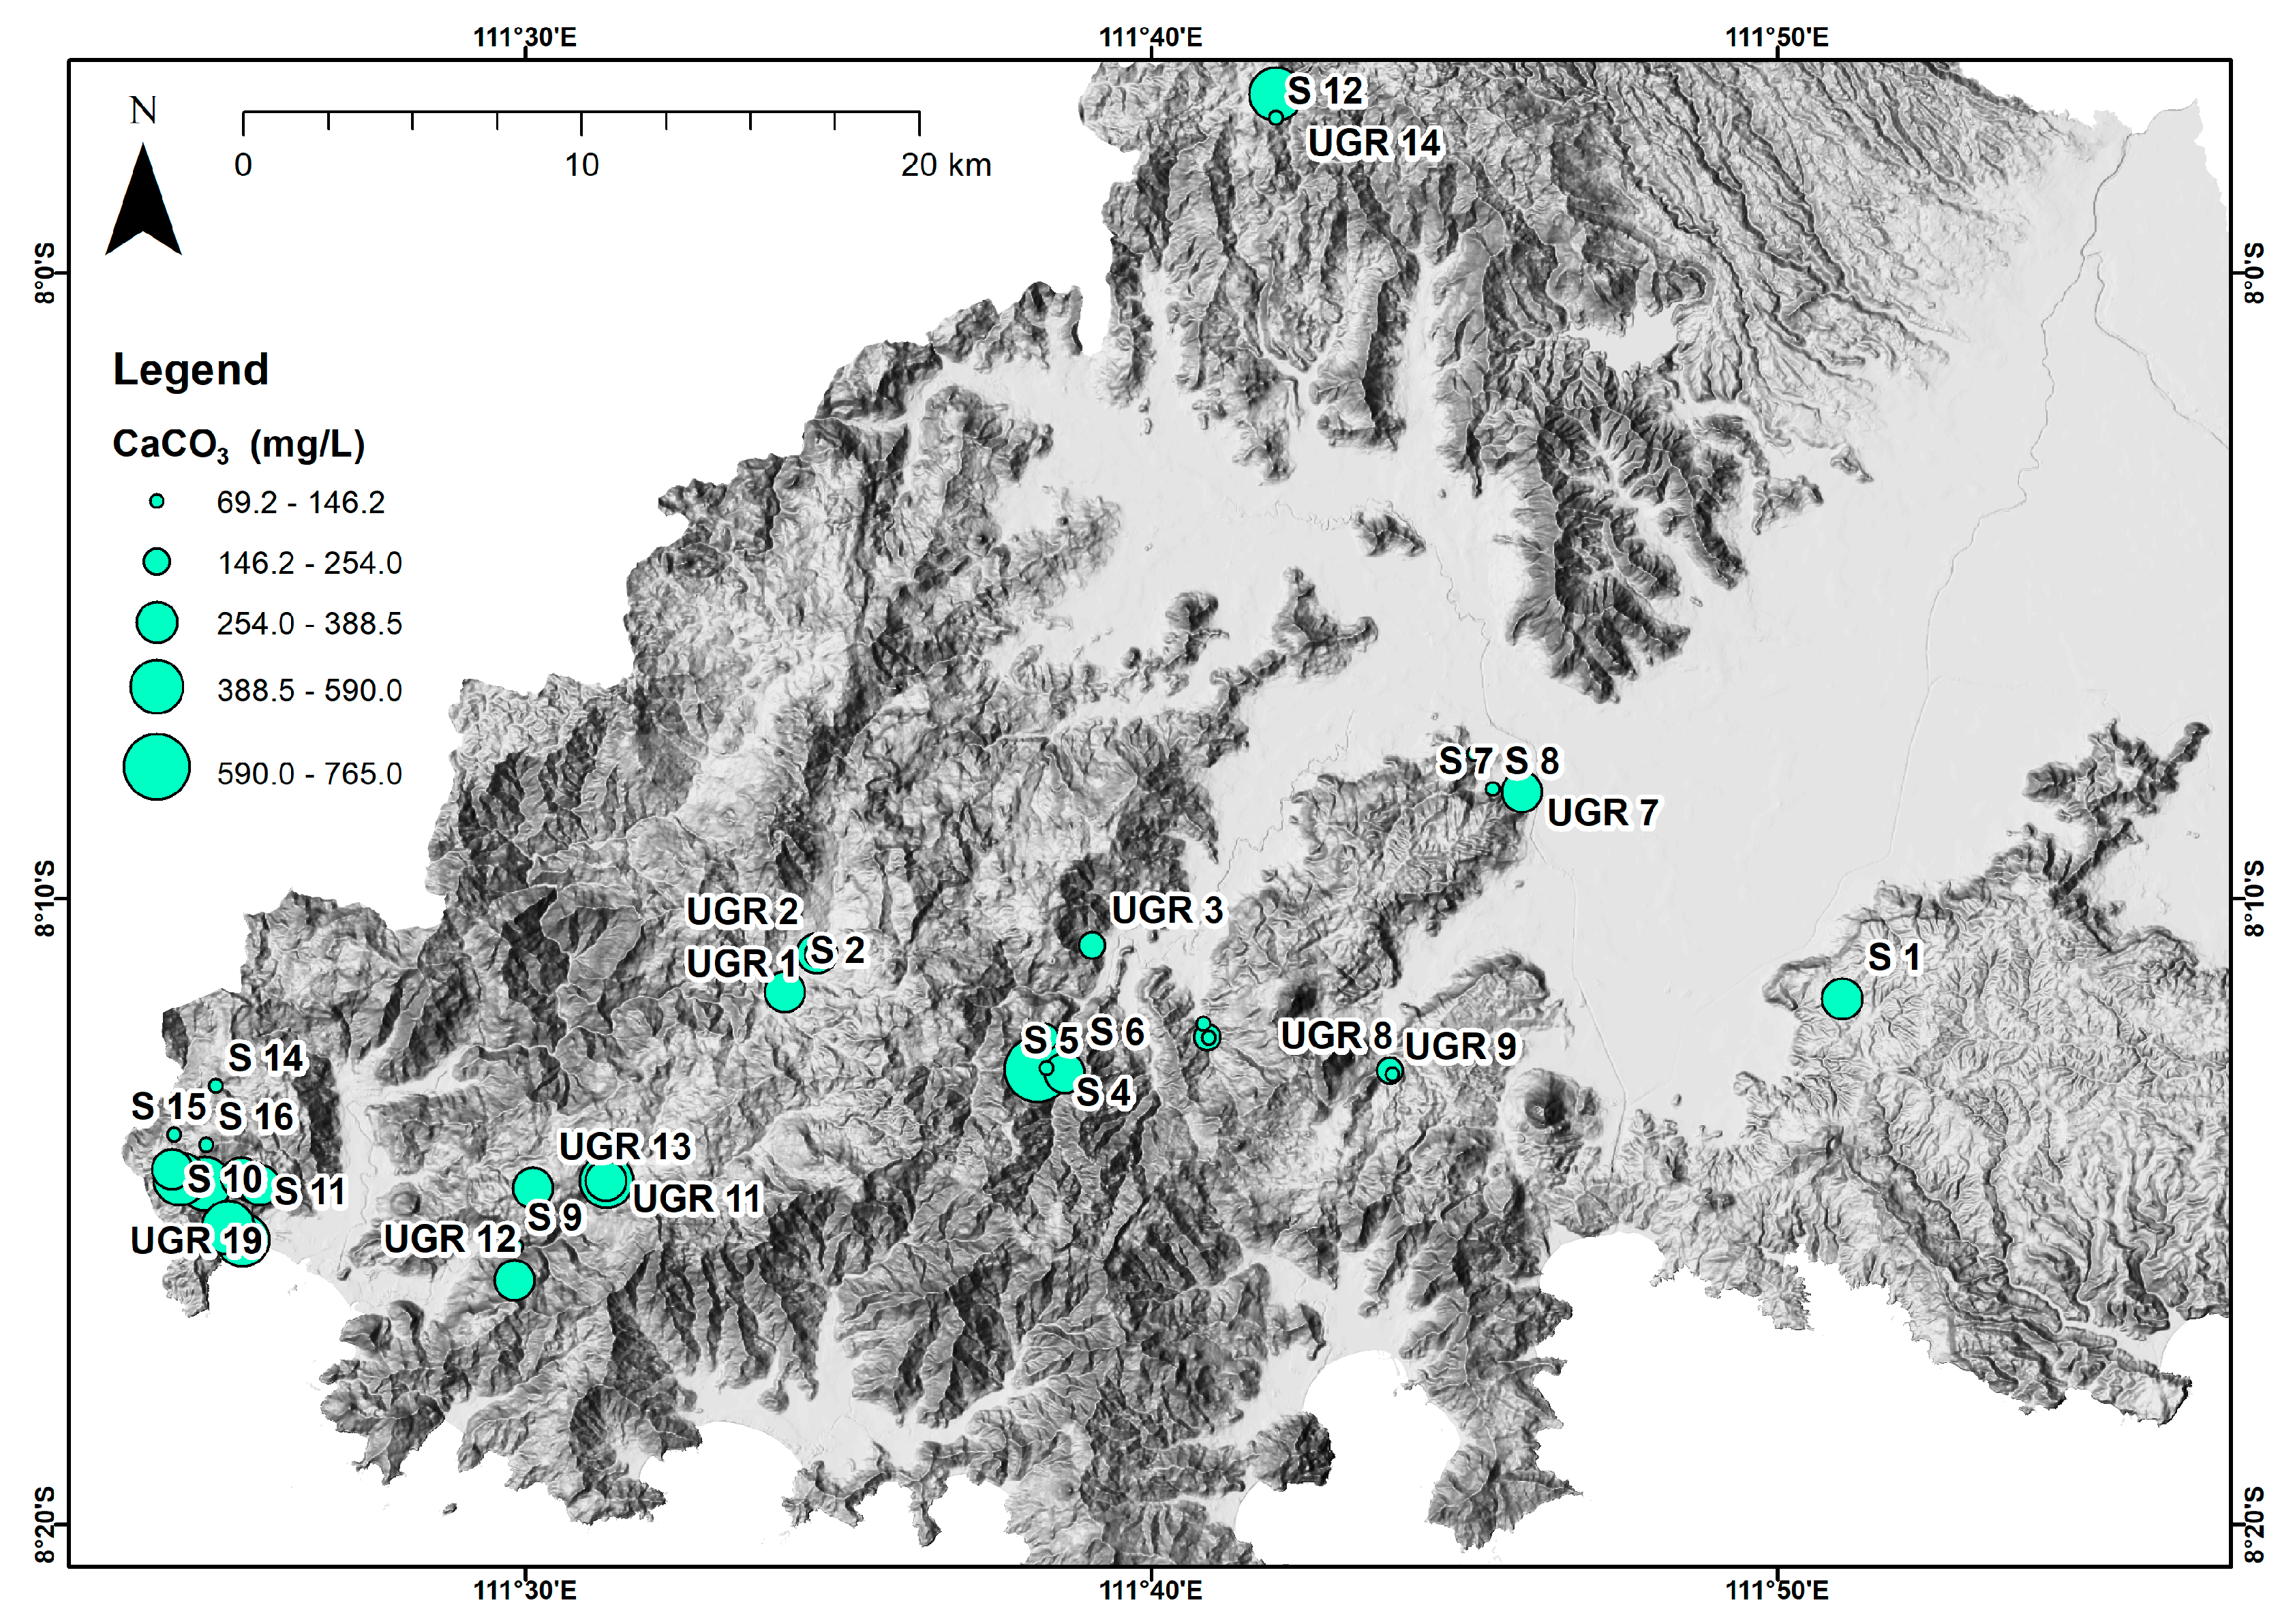
Total hardness (TH) is equivalent to calcium carbonate (CaCO3) expressed as the concentration of calcium and magnesium ions in water, indicating the natural process of metal ion dissolution (8). Ca and Mg are essential elements for human health, and there is no evidence of adverse health effects caused by water hardness. The CaCO3 is a crucial factor in the dissolving process of limestone [31]. Dissolved CaCO3 values are affected by carbonate rocks and spring discharge (10). Total hardness (TH) ranged between 96.2 and 765 mg L−1 (Figure 2). Carbon will be diluted at a large flow volume. In contrast, the concentration of carbon increases at low flow volumes, which enhances its aggressiveness when dissolved in water and accelerates the dissolution process.
Based on TH, water is classified as soft (TH < 17), slightly hard (17–60), moderately hard (60–120), hard (120–180), or very hard (>180). Based on the average TH values, the research area was classified as moderately hard, indicated by a blue to greenish color in the north from the hills to the central and eastern valleys; hard waters, represented by a green color, mostly in the central valley area; and very hard waters, marked in red, found in the southern part.The high concentration of CaCO3 in the southern part can be influenced by the Campurdarat and Wonosari Formations (Figure 2), which are dominated by limestone. The dissolution rate in each catchment area determines the difference in the amount of CaCO3. The concentration of sulfate (SO42−) ranged between 145 and 652 mg L−1 (Figure 3).
Sulfate (SO42−) is likely derived from human activities, such as the use of agricultural fertilizers (e.g., urea, ammonium sulfate), livestock waste, and the release of sewage. Sulfate may also have resulted from dissolving gypsum, anhydrite, and sulfide minerals. This can be seen on the (SO42−) distribution map, which tends to be present in the western region of the study location (Figure 5). At this location, land use is dominated by agriculture and mixed agriculture (Figure 3).
The spatial distribution of sulfate (SO42−) concentrations across the study area is illustrated in Figure 6, showing higher levels in agricultural zones likely influenced by fertilizer application.
The variation of dissolved iron (Fe2+) in groundwater is presented in Figure 7, indicating elevated concentrations in the southeastern part of the study area.
Iron (Fe2+) is a chemical element found in almost all places on Earth, including rock layers and bodies of water [32]. Iron in water is generally dissolved as Fe2+ and suspended as colloidal grains—high concentrations of Fe2+ cause rusting of metals, smelly water, and high hardness [33]. Iron (Fe2+) ranged between 0.06 and 0.55 mg L−1 (Figure 4). From a health standpoint, Fe2+ levels that exceed the threshold in the long term in drinking water will cause intestinal disorders and eye and skin irritation.
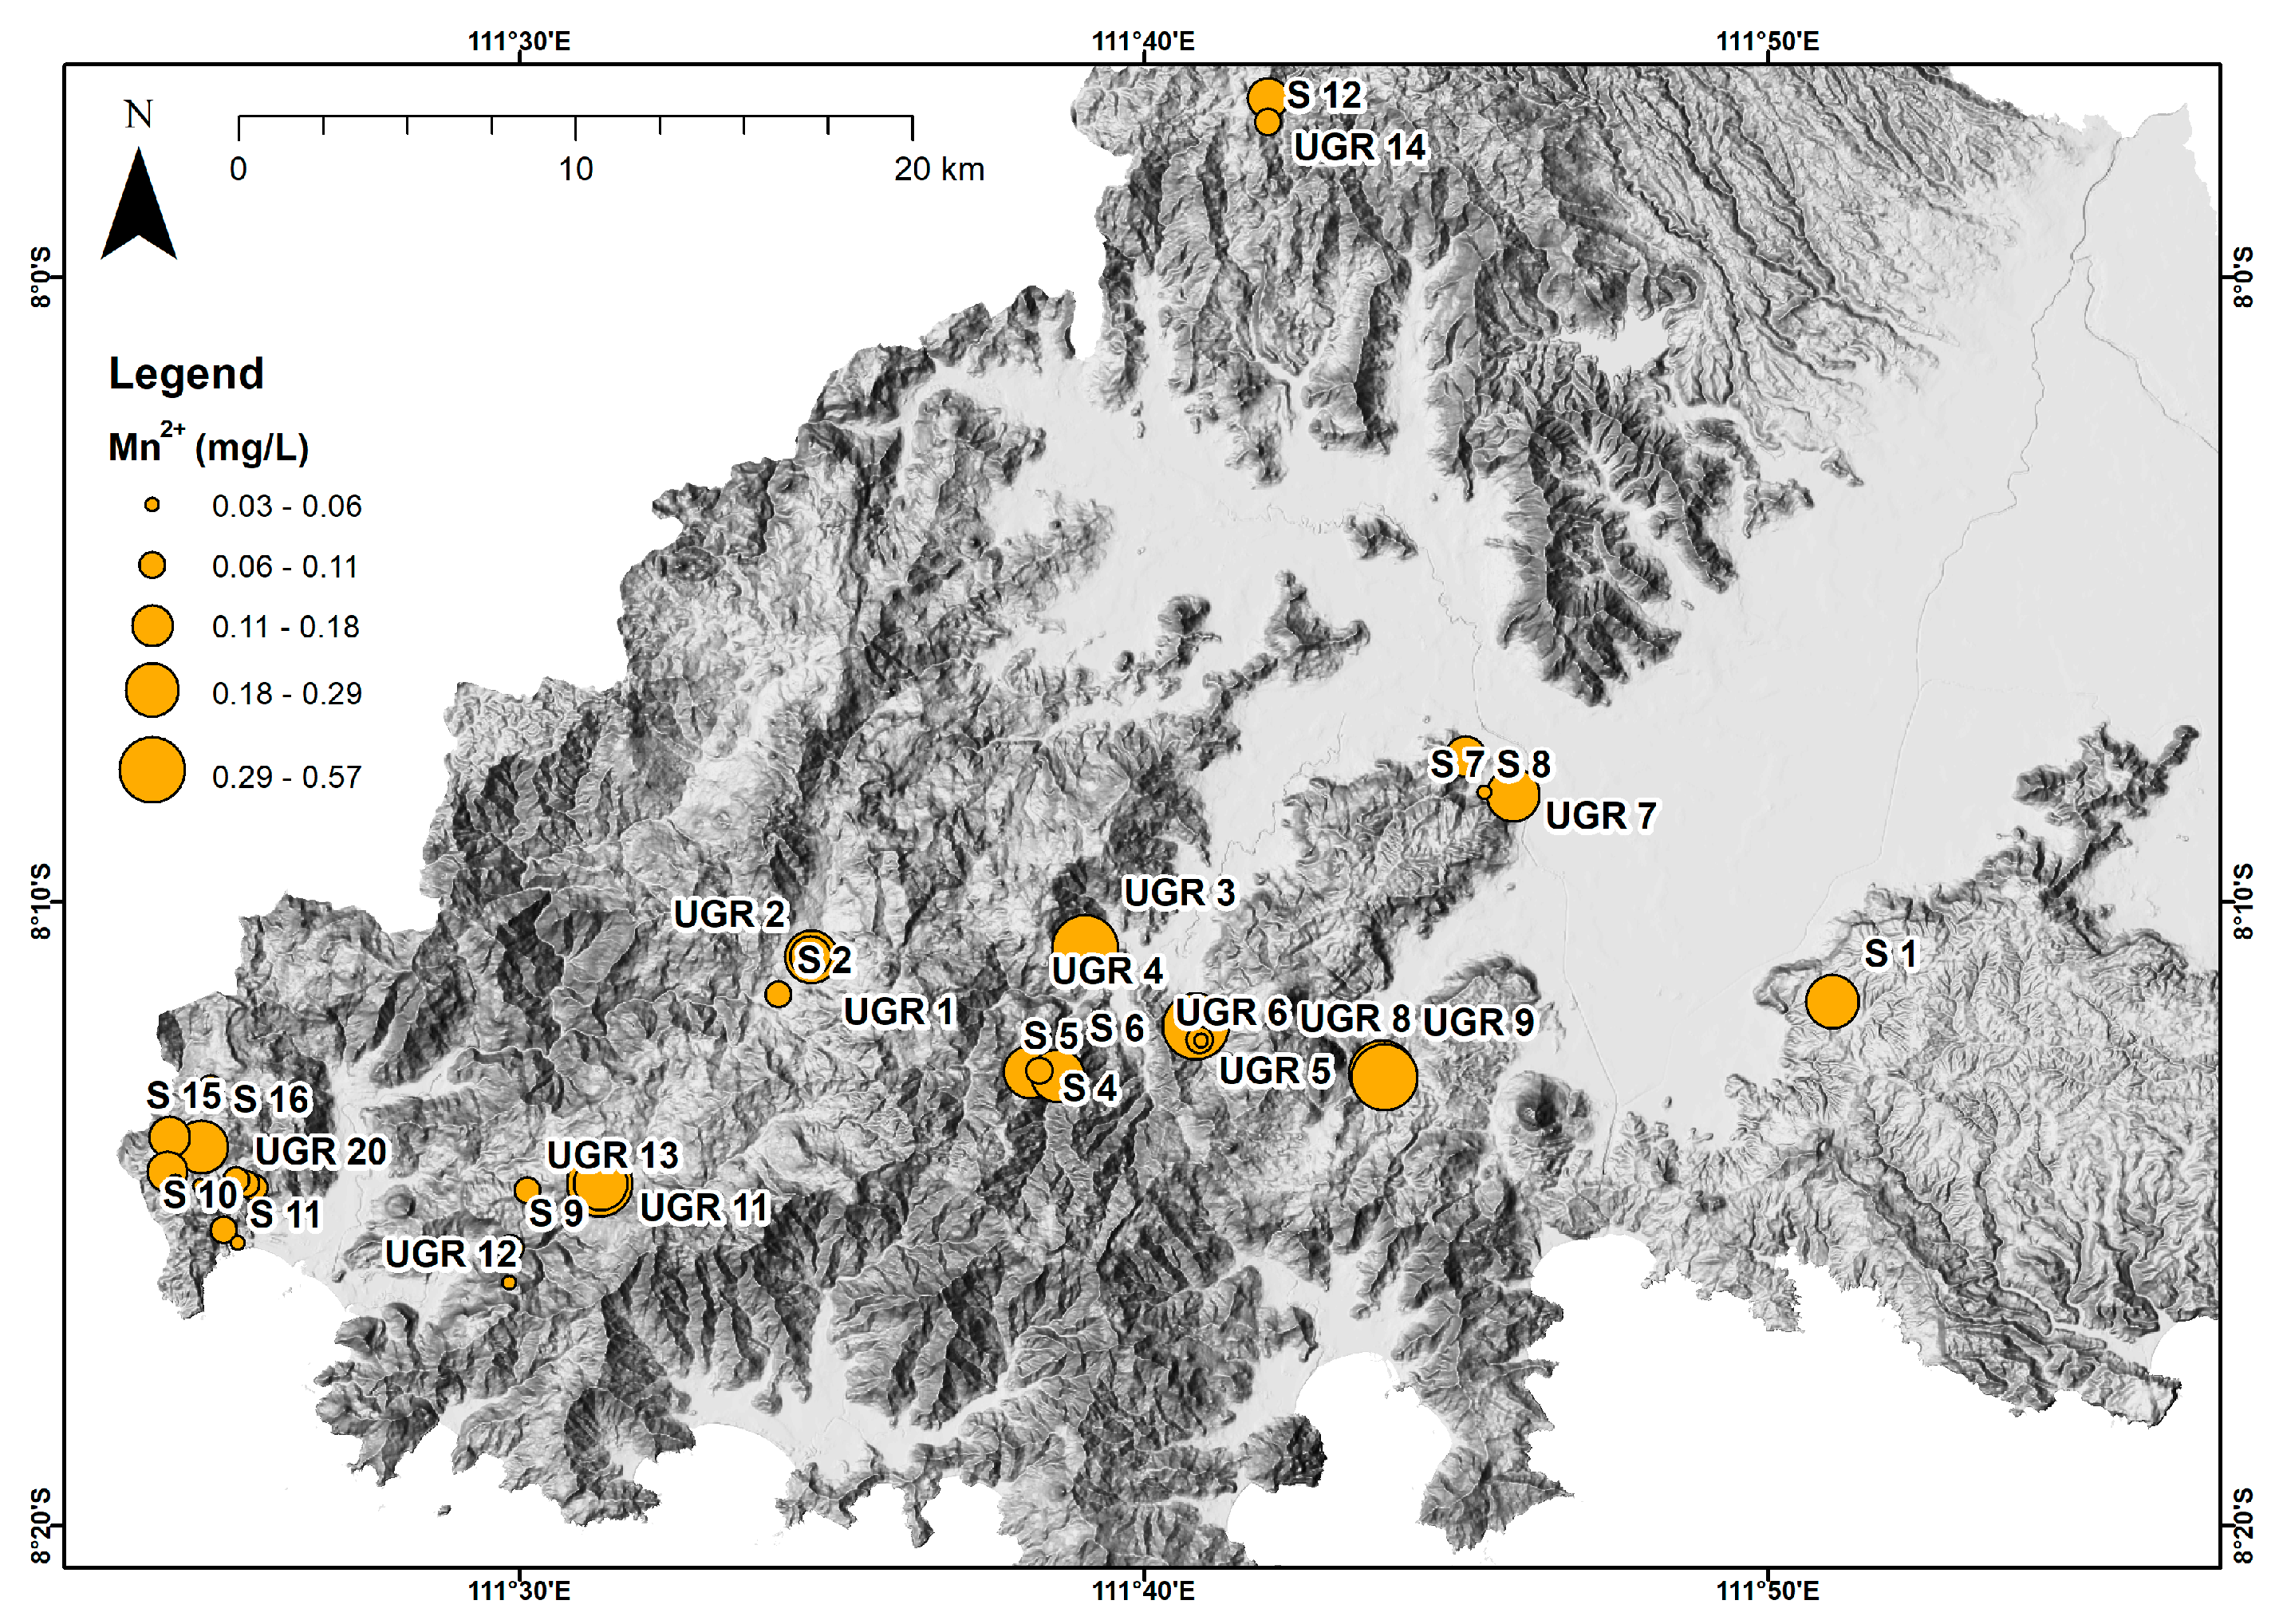
Iron (Fe2+) and manganese (Mn2+) are heavy metals generally found in groundwater [3]. Manganese (Mn2+) ranged between 0.03 and 0.57 mg L−1 (Figure 5). The presence of Fe2+ and Mn in groundwater can be linked to geological origins, derived from minerals such as pyroxene, amphibole, biotite, iron oxide (e.g., hematite), and hydroxide (e.g., goethite) found in sediments [34]. The distribution of Fe2+ and Mn2+ can be affected by various physicochemical factors. The distribution of Fe2+ and Mn2+ ions in water samples also has a similar distribution pattern, which tends to increase in the southeastern region of the study location. When viewed from the geological map (Figure 2), this location contains a Mandalika Formation which is a volcanic rock, and the volcanic rock itself may carry heavy metals from pyroclastic deposits [35]. In addition, at this location there is alluvium that can enrich the Fe2+ and Mn2+ content from sedimentation results.
Springs with low discharge are more easily contaminated by human impacts than springs with high discharge because low discharge can cause pollutants to stay longer in the karst network. In contrast, high discharges shorten the contact time between the water and the host rock and reduce the possibility of the leaching of pollutants into the water [36]. Based on the GWQI, the springs have a good water status, which is better than that of the underground rivers.
Detailed physicochemical parameters of all groundwater samples are presented in Appendix A, while the complete GWQI values and their classifications are provided in Appendix B to support these results.

5. Discussion

The Pearson correlations in Trenggalek karst area indicated the relationships among parameters within a specific season. Table 3 shows correlation matrices and all data had positive and negative correlations, representing a direct relationship with all hydrogeochemical data.
The Pearson correlation analysis indicates robust positive correlations among electrical conductivity (EC), total dissolved solids (TDS), and metal contents (Fe and Mn), implying a common geochemical source likely associated with mineralization. Electrical conductivity (EC) and total dissolved solids (TDS) have a near-perfect correlation (r = 0.974), signifying that dissolved ions predominantly influence conductivity. Iron (Fe) and manganese (Mn) exhibit a robust mutual connection (r = 0.808) and are significantly linked to electrical conductivity (EC) and total dissolved solids (TDS), indicating their contribution to the ionic load of the water. Conversely, pH demonstrates minor associations with all other parameters, indicating its independent variation from the concentrations of key ions and metals. Calcium carbonate (CaCO3) and sulfate (SO4) have a notable positive correlation (r = 0.428), perhaps indicative of carbonate–sulfate lithologies.; however, CaCO3 demonstrates negative correlations with electrical conductivity (EC) and total dissolved solids (TDS), implying that carbonate-rich waters may possess reduced ionic strength. The matrix delineates two primary geochemical clusters, one characterized by mineralization (EC, TDS, Fe, Mn) and the other by carbonate–sulfate chemistry (CaCO3, SO4), with pH functioning as an independent variable.
The Pearson correlation studies elucidated the interdependence of many physicochemical factors. The specific characteristics and compositions of the parameters present in the aqueous solution determined the correlation between TDS-EC and Fe2+–Mn2+. These findings indicate that the dissolving of rock minerals influenced the geochemistry of the groundwater. The correlation between parameters shows the interactions of groundwater with rock, dissolution, and mineral decomposition.
The study examined correlation matrices of different water quality measures and observed that a majority of the metrics exhibit statistically significant correlations, indicating a strong link among themselves (Table 4). TDS exhibits a highly significant positive correlation with EC (r = 0.97), but its links with Fe2+, Mn2+, CaCO3, and SO42− ions are quite weak. Fe2+ exhibits a significant link with Mn2+ and TDS, with correlation coefficients of 0.81 and 0.55, respectively. The negative correlations between CaCO3 and EC and TDS (r = −0.34 and −0.31) suggests that CaCO3 is not solely derived from weatheringbut that other anthropogenic sources may potentially be contributing to the presence of CaCO3 in groundwater. The alkalinity of a substance, usually CaCO3, is determined by the presence of several ionic species such as hydroxide, carbonates, bicarbonates, and organic acids. These elements are inherent sources of water and numerous natural processes occur at each given location.
Hierarchical cluster analysis (HCA) was applied, utilizing squared Euclidean distance for linkage to categorize the chemical parameters in the underground river and spring waters according to their similarities. Figure 8 identified the influence of two distinct sources on the spring water. In the figure, “Ma” refers to spring (code S), while “Sb” refers to underground river (code UGR).
The parameters of Cluster A are from both spring and underground river waters, primarily resulting from water–rock interactions The primary source of constituents in the spring waters and underground rivers within this cluster is the dissolution of carbonate minerals. Furthermore, the origin of this cluster can be attributed to rainfall, as well as the dissolution of chloride-bearing minerals and sedimentary rocks.
Cluster B represents an underground river characterized by poor water quality. The elements in this cluster stem from a combination of geogenic factors, including weathering, the dissolution of minerals, and anthropogenic sources. The anthropogenic contributors encompass domestic wastes, sewage systems, irrigation return flow, and the application of chemical fertilizers. Magnesium originates naturally from dolomite and magmatic minerals such as biotite, hornblende, and olivine, whereas its anthropogenic sources are primarily linked to fertilizers.
Principal Component Analysis using Varimax rotation was applied. The rotated loading factors and communalities influence the groundwater and its chemical parameters (Table 4). PC1 depicts mineralization and metal content, with significant positive loadings for Fe (0.80), Mn (0.74), TDS (0.89), and EC (0.88). The interpretation of PC1 signifies general mineralization and metal concentration in the water. Elevated electrical conductivity (EC) and total dissolved solids (TDS) indicate increased levels of dissolved solids, whereas iron (Fe) and manganese (Mn) are prevalent geogenic metals. The environmental implications suggest that this component may represent regions affected by geological formations rich in Fe and Mn, potentially ultramafic or mafic rocks. PC2 reflects carbonate and sulfate, with significant positive loadings for CaCO3 (0.68) and SO4 (0.68). The interpretation: PC2 encompasses carbonate and sulfate chemistry, potentially associated with sedimentary or evaporitic rock origins. Environmental implication: This axis may differentiate waters affected by limestone or gypsum-bearing deposits. PC3 indicates acidity or alkalinity. Strong positive correlation: pH (0.96). The interpretation of PC3 is mostly influenced by pH, signifying fluctuations in acidity or alkalinity irrespective of other chemical factors. The environmental implications of this component may indicate localized pH alterations resulting from biological activity, acid drainage, or buffering capacity.
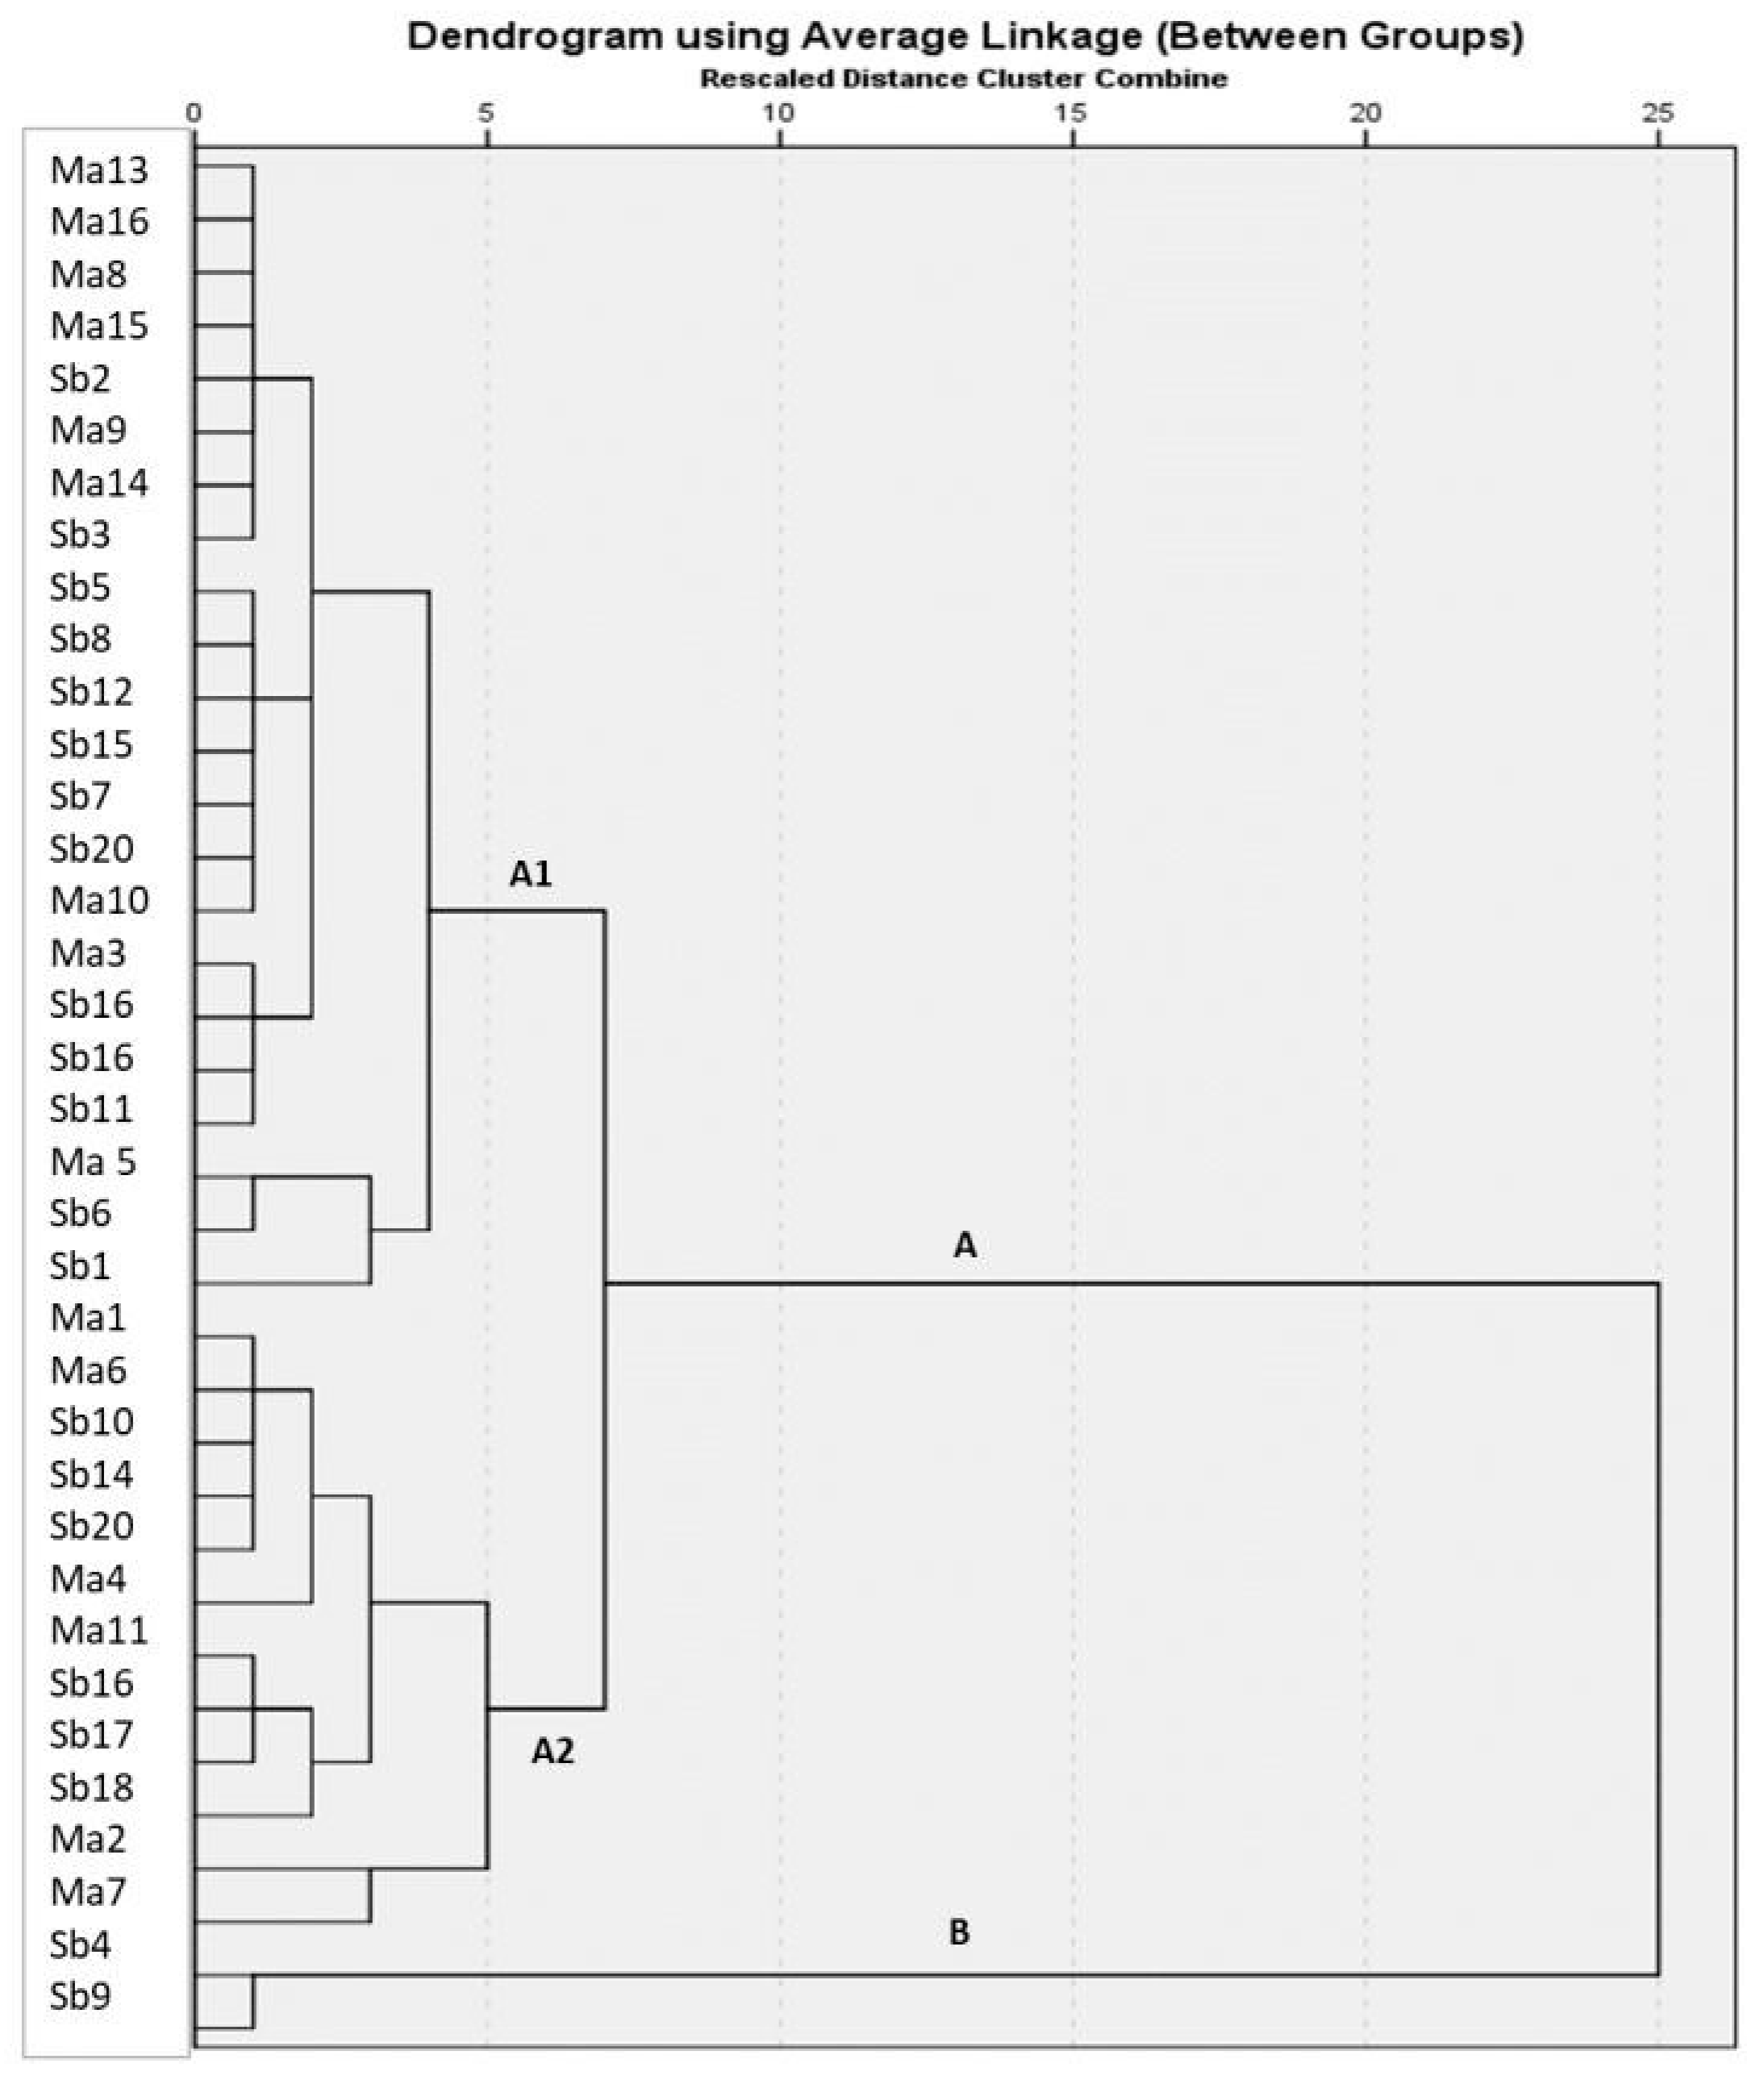
The dendrogram of groundwater samples based on hierarchical cluster analysis is shown in Figure 9, which classifies the samples into two main hydrochemical clusters.
The dendrogram analysis classified the groundwater samples into two main clusters, namely Cluster A and Cluster B. Cluster A is further divided into two sub-clusters (A1 and A2), which indicate closer similarities in hydrochemical characteristics among those sample groups. In contrast, Cluster B represents a distinct group with different water quality parameters. This clustering pattern highlights the hydrochemical heterogeneity within the study area.
The principal component analysis reveals that geogenic factors have a significant impact on the levels of EC, TDS, Fe2+, and Mn2+ in both groundwater and river water. The dissolution of carbonate rocks significantly impacts the quality of groundwater. Conversely, the dissolving of compounds that originate from agricultural and household residues also affects the total dissolved solids (TDS), iron (Fe2+), and manganese (Mn2+) levels.
The Trenggalek Regency is primarily characterized by its diversified agricultural practices. The application of fertilizers in large quantities is necessary for the preservation of open agricultural land and the enhancement of the quality of crop yield. The hydrochemical conditions of groundwater will inevitably be influenced by the utilization of fertilizers and the dissolved chemical leftovers that result after fertilization. There will be an impact on the hydrochemical conditions of groundwater and river water as a result of the growing relationship between the removal of agricultural land and plantations.
The principal component analysis shows that geogenic and anthropogenic influences have a considerable impact on both spring and underground river water. In contrast, the dissolution of chemicals originating from agricultural and household residues has a significant impact. The breakdown of carbonate rocks has a profound impact on groundwater quality. The Trenggalek Regency is chiefly distinguished by its diverse agricultural methods. Fertilizers must be used in significant quantities to preserve open agricultural land and improve crop yield. The use of fertilizers and the dissolved chemical leftovers that follow from fertilization will undoubtedly have an impact on the hydrochemical conditions of groundwater. As the relationship between agricultural land removal and plantations grows, the hydrochemical conditions of groundwater and river water will be impacted.

5.1. Groundwater Quality Index

The groundwater quality index (GWQI) in Trenggalek Regency exhibits a clear relationship with land cover conditions. Areas characterized by poor WQI scores often feature mixed agricultural land cover. Factors contributing to this degradation include the residues from organic fertilizers and erosion on agricultural land and plantations, which collectively affect the quality of groundwater sources. It is noteworthy that, on the whole, springs tend to have better WQI values compared to underground rivers. This difference can be attributed to the superior pollutant filtering capabilities of springs emerging from rock fractures. Conversely, wild streams and subterranean tributaries can serve as pathways for pollutants from the surface to enter underground rivers. Therefore, continuous monitoring and appropriate treatment measures are essential to mitigate contamination risks and ensure safe groundwater usage.
The groundwater in the area under study is utilized for a variety of reasons, including domestic use. The quality of groundwater is affected by a wide variety of causes, including geological conditions and conditions caused by human influences. It is necessary to treat it to reduce the amount of pollution, particularly the Fe and Mn contents. The significance level of the correlation coefficients and the values of the correlation coefficients will be of assistance in selecting the appropriate experimental procedures that will be employed for the treatment of water to reduce the contamination of underground rivers in the study region. To accomplish the objective of raising awareness among the general public about the need to preserve groundwater quality, the current study may prove to be helpful.This work has evaluated and mapped the geographic variability of groundwater quality.
The groundwater quality index (GWQI) in Trenggalek Regency exhibits a clear relationship with land cover conditions. Areas characterized by poor WQI scores often feature mixed agricultural land cover. Factors contributing to this degradation include the residues from organic fertilizers and erosion on agricultural land and plantations, which collectively affect the quality of groundwater sources. It is noteworthy that, on the whole, springs tend to have better WQI values compared to underground rivers. This difference can be attributed to the superior pollutant filtering capabilities of springs emerging from rock fractures. Conversely, wild streams and subterranean tributaries can serve as pathways for pollutants from the surface to enter underground rivers.

5.2. Human Health Risk Assessment

The human health risk assessment (HHRA) evaluates the potential adverse effects of iron (Fe2+) and manganese (Mn2+) exposure through groundwater consumption in the study area. The results indicate that iron concentrations in underground rivers pose a significant health risk, particularly for adults, with a risk characterization value exceeding the safe threshold. Long-term exposure to excessive iron levels may lead to health complications such as oxidative stress, organ damage, and increased susceptibility to chronic diseases. Conversely, manganese levels in groundwater sources generally remain within safe limits, with no substantial health concerns identified. However, continuous monitoring is essential to prevent any potential accumulation of contaminants over time. Given these findings, local authorities should prioritize water quality management strategies, including regular monitoring, public awareness campaigns, and the implementation of appropriate water treatment solutions to safeguard public health.
In this study, the health risk assessment considered the oral ingestion of iron and manganese through spring water and underground rivers, specifically for both adults and children. The health risk assessment (HQ) results for iron indicate an average value of 1.27, while the HQ value for children averages at 0.47. The HQ value for iron from underground rivers is notably higher for adults, suggesting a potential adverse health impact associated with unsafe consumption. Excessive iron intake is a concern due to its potential links to chronic diseases such as heart disease and diabetes.
For manganese the HQ values for adults exhibit a wide range (ranging from 0.019 to 2.459), with a median value of 0.348 and an interquartile range between 0.186 and 0.764. In contrast, the HQ value for manganese in children is 0.04. Notably, the HQ values for manganese from underground rivers indicate no adverse health effects, reflecting a safe status.
It is recommended that the results of the health risk assessment (HQ) value for iron be evaluated with greater caution than the results of the health risk assessment value for manganese in humans. Geographical considerations and the possibility of severe iron contamination in the vicinity of water sources need the local administration to pay serious attention to both of these factors.
The findings from the health risk assessment underscore that the non-carcinogenic health risks related to the consumption of iron-contaminated water are considerably higher in underground rivers compared to springs. Recognizing the potential threat that inorganic contaminants pose to human health, engaging with the local population consuming these elements in the research area is imperative. To address this issue, several steps are recommended, including conducting periodic tube well water quality tests, raising awareness about providing safe and affordable water sources, and developing low-cost household water treatment systems. These measures aim to mitigate health risks and ensure access to clean and safe drinking water for the affected communities.
The calculated groundwater quality index (GWQI) values for springs and underground rivers are summarized in Table 5, highlighting variations from good to poor categories.
The results of the health quality index assessment for Fe2+ and Mn2+ exposure are presented in Table 6, which shows that iron concentrations in underground rivers pose potential health risks.

6. Conclusions

This study confirms that geological and anthropogenic variables significantly impact the quality of spring water and underground river water, while the use of fertilizers and agricultural and domestic waste also influence the hydrochemical conditions of groundwater. Pearson’s correlation analysis reveals interdependence among various physicochemical factors, where the composition of parameters in the aqueous solution determines the correlation between TDS-EC and Fe2+–Mn2+. These findings indicate that the dissolution of rock minerals affects groundwater geochemistry, with interactions between groundwater and rock reflecting dissolution and mineral decomposition processes. Correlation matrices show that most water quality parameters exhibit statistically significant relationships, with TDS having a strong correlation with EC (r = 0.97) but a weaker correlation with Fe2+, Mn2+, CaCO3, and SO42−. Fe2+ shows significant correlations with Mn2+ and TDS (r = 0.81 and 0.55), while the negative correlations between CaCO3 and EC and TDS (r = −0.34 and −0.31) suggests that CaCO3 is not solely derived from rock weathering but may also originate from anthropogenic sources. Alkalinity, typically represented by CaCO3, is determined by the presence of hydroxide, carbonate, bicarbonate, and organic acid ions, which come from various natural processes.
The health risk assessment results reveal the presence of non-carcinogenic health risks due to high iron levels, particularly in underground rivers, with greater health threats compared to springs. Therefore, effective communication with communities is crucial, with measures such as regular tube well water quality testing, raising awareness about affordable and safe water provision, and developing cost-effective household water treatment systems. While sulfate levels were also analyzed their health impacts were found to be secondary compared to heavy metals (Fe and Mn), which constitute the main contributors to non-carcinogenic health risks in the study area. The novelty of this study resides in the fact that it uses GWQI, HHRA, and statistical analysis to conduct an integrated assessment of groundwater quality and health risks in the karst region of Trenggalek. This assessment reveals geochemical interactions and brings attention to health problems associated with iron in underground rivers.
Further research is needed to gain a deeper understanding of health risks associated with iron and manganese in drinking water sources to develop more effective water quality improvement and risk mitigation strategies. By implementing the recommended measures and continuing research efforts health risks can be minimized, ensuring the safety of water resources for communities in the study area.

Author Contributions

Conceptualization, A. and R.M.; methodology, R.M., A., Z., N.M., and T.A.C.; software and modeling, H.N., R.M., and A., and formal analysis, R.M., A., N.M., and Z.; investigation, A., N.M., Z., T.A.C., I.F., R.M., H.N., and N.D.S.; resources, R.M., T.A.C., A., and N.M.; data curation, R.M., A., I.F., Z., and N.D.S.; writing—original draft preparation, R.M., and A.; writing—review and editing, R.M., A., Z., and N.D.S.; visualization, H.N. and R.M.; supervision, R.M. and T.A.C.; project administration, R.M.; funding acquisition, A. All authors have read and agreed to the published version of the manuscript.

Funding

This research received no external funding.

Data Availability Statement

The data are not publicly available due to privacy or ethical restrictions involving community participation and location sensitivity.

Acknowledgments

The authors would like to express their sincere gratitude to the Government of Trenggalek Regency, particularly the Environmental Agency and the Public Works Department, for their administrative support and facilitation of access to karst springs and underground river sites during water sampling activities. The technical support provided by the Environmental Engineering Laboratory of the Center for Groundwater and Environmental Geology of the Bandung Geological Agency for the analysis of chemical and microbiological water quality is also greatly appreciated. Special thanks are extended to the local community for their participation and cooperation during the field survey, as well as to the Geological Agency for the donation of field equipment used in this study.

Conflicts of Interest

The authors declare no conflicts of interest. The funders had no role in the design of the study; in the collection, analyses, or interpretation of data; in the writing of the manuscript; or in the decision to publish the results.

Abbreviations

The following abbreviations are used in this manuscript:
WHOWorld Health Organization
TDSTotal Dissolved Solids
ECElectrical Conductivity
pHPotential of Hydrogen
NO3−Nitrate
Ca2+Calcium Ion
Mg2+Magnesium Ion
HRAHealth Risk Assessment
GISGeographic Information System
SDGsSustainable Development Goals
IRIntake Rate
HQHazard Quotient

Appendix A. Detailed Physicochemical Parameters of Groundwater Samples

This appendix provides the full physicochemical data from 36 water samples collected from karst springs and underground rivers in Trenggalek. The parameters include electrical conductivity (EC), total dissolved solids (TDS), pH, iron (Fe2+), manganese (Mn2+), calcium carbonate (CaCO3), and sulfate (SO42−).
Table A1. Physicochemical characteristics of groundwater samples in the Trenggalek karst area.
NoCodeTypeEC (µS/cm)TDS (mg/L)pHFe2+ (mg/L)Mn2+ (mg/L)CaCO3 (mg/L)SO42− (mg/L)
1S 1Spring915.5443.56.880.250.23322234.5
2S 2Spring732356.57.430.090.07344.5652
36UGR 20Ug-River1284887.56.550.090.07332237.5
(Note: Full table continues as seen in the main document.).

Appendix B. Groundwater Quality Index (GWQI) Values

This appendix presents the calculated GWQI values for each sampling point, based on physicochemical parameters and WHO standards.
Table A2. Groundwater quality index (GWQI) and classification of sampled locations.
NoCodeTypeGWQIWater Quality
1S1Spring97.43Good
2S2Spring72.94Good
36UGR 20Underground river81.54Good
(Note: Full table continues as provided in the manuscript.).

References

  1. Paternoster, M.; Buccione, R.; Canora, F.; Buttitta, D.; Panebianco, S.; Rizzo, G.; Sinisi, R.; Summa, V.; Mongelli, G. Hydrogeochemistry and Groundwater Quality Assessment in the High Agri Valley (Southern Italy). Geofluids 2021, 2021, 1–15. [Google Scholar] [CrossRef]
  2. Jia, X.; O’Connor, D.; Hou, D.; Jin, Y.; Li, G.; Zheng, C.; Ok, Y.S.; Tsang, D.C.W.; Luo, J. Groundwater depletion and contamination: Spatial distribution of groundwater resources sustainability in China. Sci. Total Environ. 2019, 672, 551–562. [Google Scholar] [CrossRef]
  3. Rahman, M.A.; Islam, M.R.; Kumar, S.; Al-Reza, S.M. Drinking water quality, exposure and health risk assessment for the school-going children at school time in the southwest coastal of Bangladesh. J. Water Sanit. Hyg. Dev. 2021, 11, 612–628. [Google Scholar] [CrossRef]
  4. Maria, R.; Iskandarsyah, T.Y.W.M.; Suganda, B.R.; Rusydi, A.F.; Hendarmawan, H. Impact of natural conditions and anthropogenic activities on groundwater quality in Puntang volcanic area, West Java, Indonesia. IOP Conf. Ser. Earth Environ. Sci. 2022, 1047, 012037. [Google Scholar] [CrossRef]
  5. Grönwall, J.; Danert, K. Regarding Groundwater and Drinking Water Access through A Human Rights Lens: Self-Supply as A Norm. Water 2020, 12, 419. [Google Scholar] [CrossRef]
  6. Van Geldern, R.; Schulte, P.; Mader, M.; Baier, A.; Barth, J.A.C.; Juhlke, T.R.; Lee, K. Insights into agricultural influences and weathering processes from major ion patterns. Hydrol. Process. 2018, 32, 891–903. [Google Scholar] [CrossRef]
  7. Hoaghia, M.-A.; Moldovan, A.; Kovacs, E.; Mirea, I.; Kenesz, M.; Brad, T.; Cadar, O.; Micle, V.; Levei, E.; Moldovan, O. Water Quality and Hydrogeochemical Characteristics of Some Karst Water Sources in Apuseni Mountains, Romania. Water 2021, 13, 857. [Google Scholar] [CrossRef]
  8. Moldovan, A.; Török, A.I.; Mirea, I.C.; Micle, V.; Moldovan, O.T.; Levei, E.A. Health Risk Assessment in Southern Carpathians Small Rural Communities Using Karst Springs as a Drinking Water Source. Int. J. Environ. Res. Public Health 2021, 19, 234. [Google Scholar] [CrossRef] [PubMed]
  9. Setiawan, T.; Syah Alam, B.Y.C.S.S.; Haryono, E.; Hendarmawan, H. Spatio-temporal variation of karst spring parameters for characterizing of the aquifer system of Watuputih Area, Indonesia. J. Water Land. Dev. 2020, 143–156. [Google Scholar] [CrossRef]
  10. Dwiputra, D.S.; Adji, T.N.; Pratama, A.D.; Haryono, E. Estimation of atmospheric carbon sequestration rate through carbonate rock dissolution in Karst Jonggrangan, Java Island, Indonesia (case study: The underground river of Anjani Cave). IOP Conf. Ser. Earth Environ. Sci. 2020, 451, 012057. [Google Scholar] [CrossRef]
  11. Samodra, H.; Gafoer, S. Geological Map of the Tulungagung Quadrangle; Geological Research and Development Centre: Bandung, Indonesia, 1992. [Google Scholar]
  12. Baharuddin; Brata, K.; Hartono, U. Peta Geologi Lembar Madiun, Jawa. Geological Map of the Madiun Quadrangle, Jawa; Geological Research and Development Centre: Bandung, Indonesia, 1992. [Google Scholar]
  13. Adeola Fashae, O.; Abiola Ayorinde, H.; Oludapo Olusola, A.; Oluseyi Obateru, R. Landuse and surface water quality in an emerging urban city. Appl. Water Sci. 2019, 9, 25. [Google Scholar] [CrossRef]
  14. Maria, R.; Purwoarminta, A.; Lubis, R.F. Hidrokimia Mata Air Karst untuk Irigasi Studi Kasus Desa Ligarmukti, Kabupaten Bogor. J. Irig. 2019, 13, 1. [Google Scholar] [CrossRef]
  15. Das, B.; Pal, S.C. Assessment of groundwater recharge and its potential zone identification in groundwater-stressed Goghat-I block of Hugli District, West Bengal, India. Environ. Dev. Sustain. 2020, 22, 5905–5923. [Google Scholar] [CrossRef]
  16. Brown, R.M.; McClelland, N.I.; Deininger, R.A.; O’Connor, M.F. A Water Quality Index—Crashing the Psychological Barrier. In Indicators of Environmental Quality; Thomas, W.A., Ed.; Springer: Boston, MA, USA, 1972; pp. 173–182. ISBN 978-1-4684-2858-2. [Google Scholar]
  17. Bora, M.; Goswami, D.C. Water quality assessment in terms of water quality index (WQI): Case study of the Kolong River, Assam, India. Appl. Water Sci. 2017, 7, 3125–3135. [Google Scholar] [CrossRef]
  18. Nguyen, T.G.; Huynh, N.T.H. Characterization of Groundwater Quality and Human Health Risk Assessment. Civ. Eng. J. 2023, 9, 618–628. [Google Scholar] [CrossRef]
  19. Brown, R.; McClelland, N.; Deininger, R.; O’Connor, M. A water quality index—Crashing the physiological barrier. Indic. Environ. Qual. 1972, 1, 173–182. [Google Scholar]
  20. Chidiac, S.; El Najjar, P.; Ouaini, N.; El Rayess, Y.; El Azzi, D. A Comprehensive Review of Water Quality Indices (WQIs): History, Models, Attempts and Perspectives; Springer: Amsterdam, The Netherlands, 2023; Volume 22, ISBN 0123456789. [Google Scholar]
  21. WHO. Guidelines for Drinking-Water Quality, No. Fourth Edition Incorporating the First and Second Addenda; WHO: Geneva, Switzerland, 2022. [Google Scholar] [CrossRef]
  22. Herschy, R.W. Water Quality for Drinking: WHO Guidelines. In Encyclopedia of Lakes and Reservoirs; Bengtsson, L., Herschy, R.W., Fairbridge, R.W., Eds.; Encyclopedia of Earth Sciences Series; Springer: Dordrecht, The Netherlands, 2012; pp. 876–883. ISBN 978-1-4020-5616-1. [Google Scholar]
  23. Sener, S.; Sener, S.; Davraz, A. ‘Evaluation of water quality index (WQI) method and GIS in Aksu River (SW-Turkey). Sci. Total Environ. 2017, 584–585, 131–144. [Google Scholar] [CrossRef] [PubMed]
  24. Kate, S.; Kumbhar, S.; Jamale, P. Water quality analysis of Urun-Islampur City, Maharashtra, India. Appl. Water Sci. 2020, 10, 95. [Google Scholar] [CrossRef]
  25. Bibi, M.H.; Ahmed, F.; Ishiga, H. Assessment of metal concentrations in lake sediments of southwest Japan based on sediment quality guidelines. Environ. Geol. 2007, 52, 625–639. [Google Scholar] [CrossRef]
  26. Kawo, N.S.; Karuppannan, S. Groundwater quality assessment using water quality index and GIS technique in Modjo River Basin, central Ethiopia. J. Afr. Earth Sci. 2018, 147, 300–311. [Google Scholar] [CrossRef]
  27. Kom, K.P.; Gurugnanam, B.; Bairavi, S. Non-carcinogenic health risk assessment of nitrate and fluoride contamination in the groundwater of Noyyal basin, India. Geod. Geodyn. 2022, 13, 619–631. [Google Scholar] [CrossRef]
  28. Ghosh, G.C.; Khan, M.J.H.; Chakraborty, T.K.; Zaman, S.; Kabir, A.H.M.E.; Tanaka, H. Human health risk assessment of elevated and variable iron and manganese intake with arsenic-safe groundwater in Jashore, Bangladesh. Sci. Rep. 2020, 10, 5206. [Google Scholar] [CrossRef] [PubMed]
  29. Tong, S.; Li, H.; Tudi, M.; Yuan, X.; Yang, L. Comparison of characteristics, water quality and health risk assessment of trace elements in surface water and groundwater in China. Ecotoxicol. Environ. Saf. 2021, 219, 112283. [Google Scholar] [CrossRef]
  30. Jaishankar, M.; Tseten, T.; Anbalagan, N.; Mathew, B.B.; Beeregowda, K.N. Toxicity, mechanism and health effects of some heavy metals. Interdiscip. Toxicol. 2014, 7, 60–72. [Google Scholar] [CrossRef]
  31. Mandindi, W.Z.; Nyaba, L.; Mketo, N.; Nomngongo, P.N. Seasonal Variation of Drinking Water Quality and Human Health Risk Assessment: A Case Study in Rural Village of the Eastern Cape, South Africa. Water 2022, 14, 2013. [Google Scholar] [CrossRef]
  32. Idoko, O.M. Seasonal Variation in Iron in Rural Groundwater of Benue State, Middle Belt, Nigeria. Pak. J. Nutr. 2010, 9, 892–895. [Google Scholar] [CrossRef]
  33. Kirana, K.H.; Novala, G.C.; Fitriani, D.; Agustine, E.; Rahmaputri, M.D.; Fathurrohman, F.; Rizkita, N.R.; Andrianto, N.; Juniarti, N.; Zaenudinna, R.A.; et al. Identifikasi Kualitas Air Sungai Citarum Hulu Melalui Analisa Parameter Hidrologi Dan Kandungan Logam Berat (Studi Kasus: Sungai Citarum Sektor 7). Wahana Fis. 2019, 4, 120–128. [Google Scholar] [CrossRef]
  34. Hu, M.; Zhou, P.; Chen, C. Spatial and temporal distribution and affecting factors of iron and manganese in the groundwater in the middle area of the Yangtze River Basin, China. Environ. Sci. Pollut. Res. 2022, 29, 61204–61221. [Google Scholar] [CrossRef]
  35. Waskita, R.S.A.; Wijayanti, H.D. Studi Provenance dan Analisis Granulometri Endapan Pasir di Daerah Tambakrom, Ponjong, Gunung Kidul, Daerah Istimewa Yogyakarta. Geoda 2020, 1, 35–49. [Google Scholar]
  36. He, X.; Wu, J.; Guo, W. Karst Spring Protection for the Sustainable and Healthy Living: The Examples of Niangziguan Spring and Shuishentang Spring in Shanxi, China. Expo. Health 2019, 11, 153–165. [Google Scholar] [CrossRef]
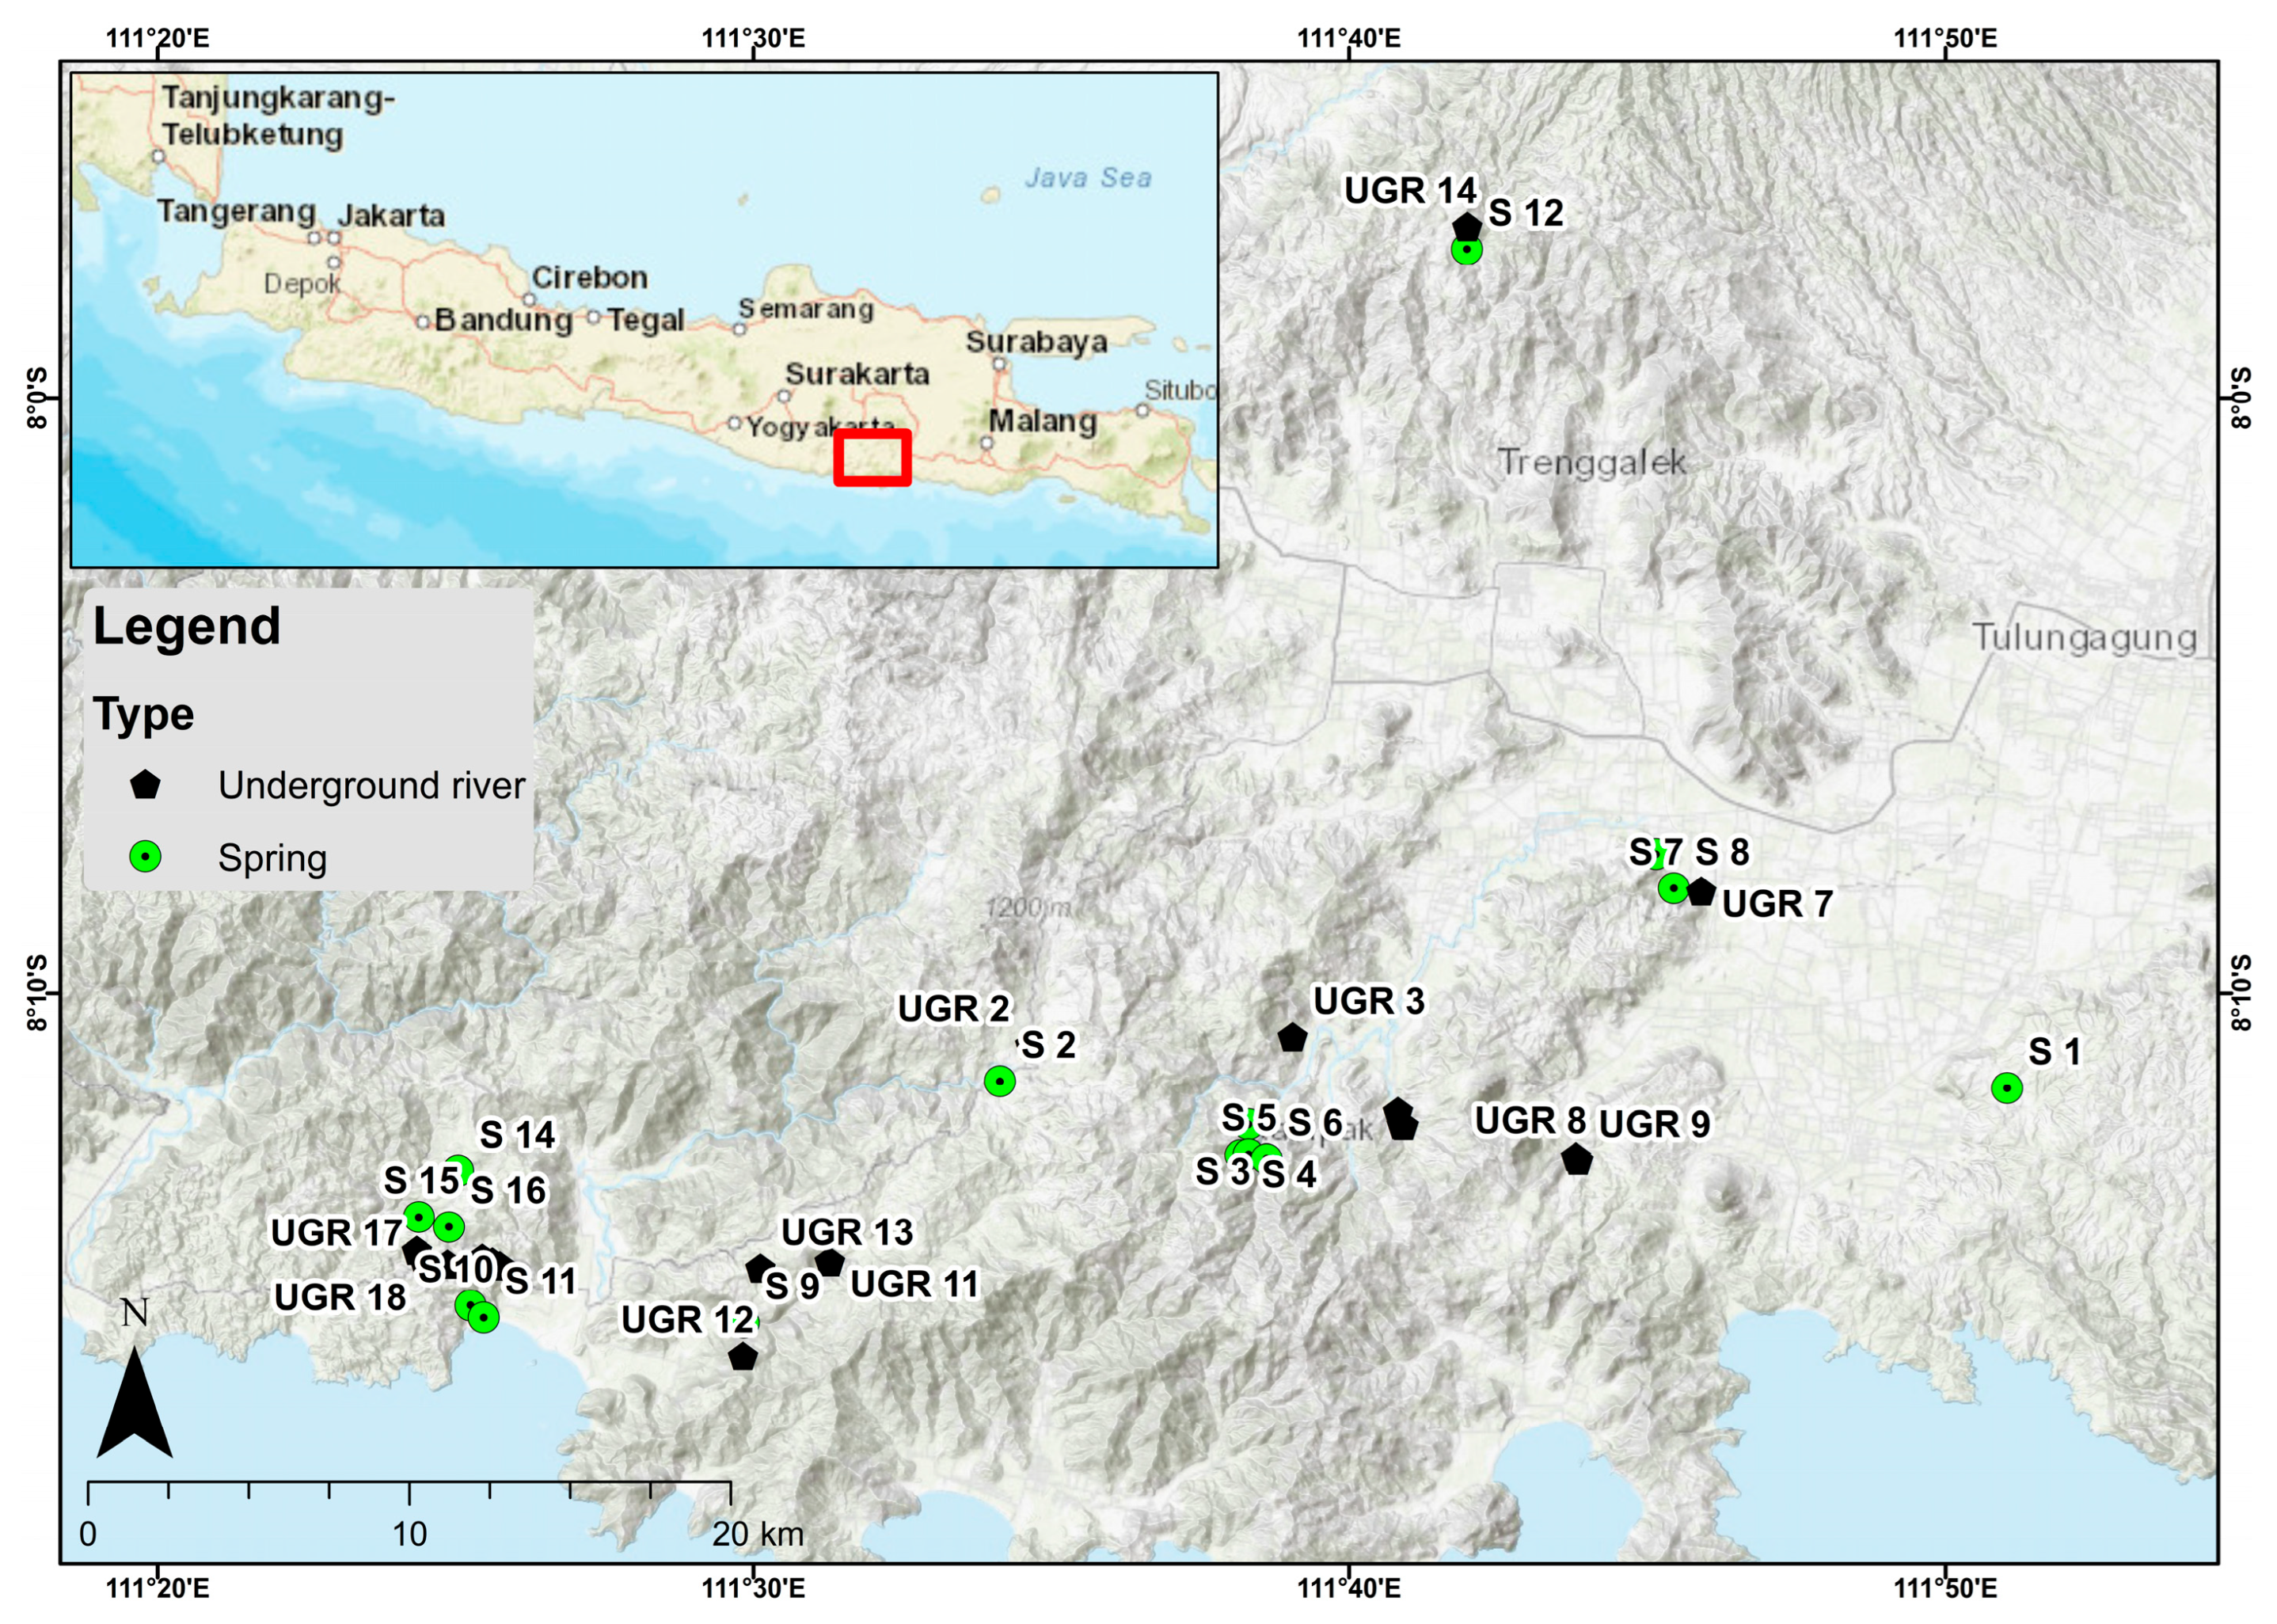
Figure 1. Research location showing sampling points of springs and wells. The red box in the inset map indicates the location of Trenggalek Regency, East Java, Indonesia, as the study area.
Geosciences 15 00381 g001
Figure 2. Geological condition. The red box in the inset map indicates the study area location.
Geosciences 15 00381 g002
Figure 3. Land use condition in the study area. The red box in the inset map indicates the location of the study area.
Geosciences 15 00381 g003
Figure 4. Flowchart of the methodology used in this research.
Geosciences 15 00381 g004
Figure 5. Spatial variation of calcium carbonate (CaCO3).
Geosciences 15 00381 g005
Figure 6. Spatial variation of sulfate (SO42−).
Geosciences 15 00381 g006
Figure 7. Spatial variation of Iron (Fe2+).
Geosciences 15 00381 g007
Figure 8. Spatial variation of manganese (Mn2+).
Geosciences 15 00381 g008
Figure 9. Dendrogram of groundwater samples showing cluster groups. A1 and A2 represent sub-clusters within Cluster A, while A and B indicate the two main cluster groups of groundwater samples.
Geosciences 15 00381 g009
Table 1. Chemical parameters calculation of the water quality index.
ParameterUnitWeight (wi)Relative Weights (Wi)Si *
pH 50.238.5
ECμS/cm40.18500
TDSmg/L40.18500
Fe2+mg/L30.140.3
Mn2+mg/L30.140.1
CaCO3mg/L20.09300
SO42−mg/L10.05250
* Si guideline value according to the World Health Organization Guidelines for Drinking Water Quality [22]. Weight of each parameters according to [23].
Table 2. Physicochemical properties of analyzed groundwater samples.
NoCodeTypeEC
(µS/cm)
TDS
(mg L−1)
pHFe2+
(mg L−1)
Mn2+
(mg L−1)
CaCO3 (mg L−1)SO42− (mg L−1)
1S 1Spring915.5443.56.880.250.23322234.5
2S 2Spring732356.57.430.090.07344.5652
3S 3Spring1137.5739.3756.440.190.11223445
4S 4Spring886.5576.2256.740.220.24765356.5
5S 5Spring1451912.57.220.080.08112.3145
6S 6Spring883573.957.110.160.21321243
7S 7Spring326.52346.350.190.0589.4164
8S 8Spring115450.17.230.120.0487.3157
9S 9Spring987661.57.510.090.0769.2321
10S 10Spring12767796.440.180.09443228
11S 11Spring665432.257.050.080.05590398.5
12S 12Spring7344217.110.070.0778.4149
13S 13Spring1115.5725.0756.630.250.14146.2187.5
14S 14Spring9986346.440.180.09115342
15S 15Spring1187771.557.230.210.1889.2221
16S 16Spring1099.5714.676.140.190.22117.3167.5
17UGR 1Underground river1766.51148.26.230.440.25187226.5
18UGR 2Underground river987769.56.670.290.17298.5199
19UGR 3Underground river945614.257.180.340.36177.5334
20UGR 4Underground river211713667.230.380.3987.43187
21UGR 5Underground river1284784.57.180.450.07254186
22UGR 6Underground river1469.5835.56.210.140.0374.22211
23UGR 7Underground river1287836.557.060.330.29338332
24UGR 8Underground river1349876.857.250.480.57218167
25UGR 9Underground river221615486.440.550.43123204
26UGR 10Underground river966627.96.50.330.22498.5312
27UGR 11Underground river1087886.56.880.420.37338446.5
28UGR 12Underground river12898996.660.080.06366347.5
29UGR 13Underground river11877746.820.060.08388.5555
30UGR 14Underground river1011657.156.220.260.16442.5346.5
31UGR 15Underground river1341871.657.110.150.09366334.5
32UGR 16Underground river1094711.17.050.200.10288.5333
33UGR 17Underground river663.5431.286.220.080.05522240
34UGR 18Underground river554360.16.750.190.14345.5332
35UGR 19Underground river889547.56.880.080.05544239
36UGR 20Underground river1284887.56.550.090.07332237.5
Table 3. Pearson’s correlation in the research area.
ECTDSpHFeMnCaCO3SO4
EC1
TDS0.974 **1
pH−0.022−0.0501
Fe0.510 **0.551 **−0.0631
Mn0.441 **0.486 **0.1030.808 **1
CaCO3−0.335 *−0.307−0.125−0.161−0.0951
SO4−0.244−0.2250.134−0.211−0.1150.428 **1
** Correlation is significant at the 0.01 level (2-tailed). * Correlation is significant at the 0.05 level (2-tailed).
Table 4. Principal component analysis in the research area.
Parameter123
EC0.88−0.04−0.02
TDS0.890.01−0.06
pH−0.020.120.96
Fe2+0.800.34−0.09
Mn2+0.740.460.09
CaCO3−0.440.68−0.33
SO42−−0.410.680.15
% of Variance44.4518.2915.46
Cumulative %44.4562.7378.19
Table 5. Groundwater quality index (QWQI) of the studied karst water.
NoCodeTypeGWQIWater Quality
1S 1Spring97.43Good
2S 2Spring72.94Good
3S 3Spring88.39Good
4S 4Spring109.33Poor
5S 5Spring81.93Good
6S 6Spring92.97Good
7S 7Spring48.03Good
8S 8Spring69.75Good
9S 9Spring71.66Good
10S 10Spring87.95Good
11S 11Spring68.15Good
12S 12Spring57.49Good
13S 13Spring88.72Good
14S 14Spring76.71Good
15S 15Spring95.84Good
16S 16Spring94.40Good
17UGR 1Underground river132.75Poor
18UGR 2Underground river96.35Good
19UGR 3Underground river123.64Poor
20UGR 4Underground river159.90Poor
21UGR 5Underground river95.75Good
22UGR 6Underground river74.58Good
23UGR 7Underground river126.05Poor
24UGR 8Underground river169.15Poor
25UGR 9Underground river177.34Poor
26UGR 10Underground river107.69Poor
27UGR 11Underground river140.55Poor
28UGR 12Underground river83.08Good
29UGR 13Underground river85.85Good
30UGR 14Underground river96.29Poor
31UGR 15Underground river91.94Poor
32UGR 16Underground river86.75Good
33UGR 17Underground river61.47Good
34UGR 18Underground river76.04Good
35UGR 19Underground river69.78Good
36UGR 20Underground river81.54Good
Table 6. Health quality index.
No. Fe2+ = 0.3Mn2+ = 0.4
1Average Concentration (mg/L)0.220.220.160.16
2OldChildrenAdultsChildrenAdults
3R (liter)1212
4Fe2+ (day/year)350350350350
5Dt (year)630630
6Wb (kg)15551555
7t avg (day)10,95010,95010,95010,950
8RFd (mg/kg.day)0.0060.0060.140.14
appe9CDI (mg/kg.day)0.000.010.000.01
10Risk Characterization 0.471.270.010.04
11StatusUnsafeUnsafeSafeSafe
12Safe Concentration (mg/L)0.470.170.010.02
Disclaimer/Publisher’s Note: The statements, opinions and data contained in all publications are solely those of the individual author(s) and contributor(s) and not of MDPI and/or the editor(s). MDPI and/or the editor(s) disclaim responsibility for any injury to people or property resulting from any ideas, methods, instructions or products referred to in the content.