Article

Spatial Distribution of Geochemical Anomalies in Soils of River Basins of the Northeastern Caucasus

1
Laboratory of Landscape Ecology and Geomatics, A.O. Kovalevsky Institute of Biology of the Southern Seas of RAS, 299011 Sevastopol, Russia
2
Department of Ecology and Environmental Management, Millionshchikov Grozny State Oil Technical University, 364024 Grozny, Russia
3
Research Institute of Geoecology and Nature Management, Millionshchikov Grozny State Oil Technical University, 364024 Grozny, Russia
4
T.I. Vyazemsky Karadag Scientific Station—Nature Reserve of RAS—Branch of A.O. Kovalevsky Institute of Biology of the Southern Seas of RAS, 298188 Feodosia, Russia
*
Author to whom correspondence should be addressed.
Geosciences 2025, 15(10), 380; https://doi.org/10.3390/geosciences15100380
Submission received: 7 August 2025 / Revised: 23 September 2025 / Accepted: 26 September 2025 / Published: 1 October 2025
(This article belongs to the Special Issue Soil Geochemistry)

Abstract

The aim of this study is to determine the spatial distribution of geochemical anomalies of selected potential toxic elements in the soils of the river basins in the Northeastern Caucasus—specifically the Ulluchay, Sulak, and Sunzha Rivers. A concentration of 25 chemical elements was measured using inductively coupled plasma mass spectrometry (ICP-MS). Petrogenic elements commonly found in the Earth’s crust (Al, Na, Ca, Fe, Mg) showed high concentrations (Na up to 306,600.70 mg/kg). Conversely, concentrations of Ag, Cd, Sn, Sb, and Te at many sampling sites were extremely low, falling below the detection limits of analytical instruments. The geochemical indicators Cf (contamination factor) and Igeo (geoaccumulation index) indicate that the regional characteristics of the territory, such as lithological conditions, hydrochemical schedules, and the history of geological development of the territory, affect the concentration of elements. Anomalous concentrations were found for seven elements (Ba, Na, Zn, Ag, Li, Sc, As), whereas no anomalies were identified for Be, Mg, Al, Mn, Fe, Co, Ni, Cu, Pb, Te, and Cs. For the most part (8 of 10), the sampling sites with anomalous chemical element content are located in the basin of the Sunzha River. Two sites with anomalous chemical element content have been identified in the Sulak River Basin. Anomalous values in the Sulak River Basin are noted for two chemical elements—Ba and Na. Natural features such as geological structure, parent rock composition, vertical climatic zonation, and landscape diversity play a major role in forming geochemical anomalies. The role of anthropogenic factors increases in localized areas near settlements, industrial facilities, and roads. The spatial distribution of geochemical anomalies must be considered in agricultural management, the use of water sources for drinking supply, the development of tourist routes, and comprehensive spatial planning.

1. Introduction

The study of chemical element concentrations in soils has been the focus of many scientific publications [1,2,3]. A significant emphasis is placed on anthropogenic soil pollution and its impact on human health [4,5,6,7]. Despite some general distribution trends, element concentrations vary significantly across regions and are strongly affected by local conditions [8,9]. The formation of soil chemical composition is a complex process involving both natural and anthropogenic factors [10,11,12,13,14,15].
River basins function as unified landscape–geochemical systems, with matter and energy flows directed from uplands to lowlands. This provides the rationale for using the basin approach to study chemical element transport and accumulation [16,17,18].
The geoecological state of river basin landscapes and soils directly influences water quality. Excessive concentrations of any given elements in the soil create geochemical anomalies [19,20,21]. Therefore, gaining new insights into soil chemistry and the driving natural and human factors is especially important [22].
While most research on soil contamination in river basins focuses on urban, industrial, or agricultural settings [23,24], mountainous regions—especially those with complex geochemical backgrounds—have received far less attention.
The Caucasus is a major physiographic region stretching 1200 km NW to SE, noted for its geological complexity, climatic diversity, and rich ecosystems. The study area lies within the Scythian–Turanian platform and Alpine fold belt, with rivers (Terek, Sulak, Samur, Sunzha) draining into the Caspian Sea and significantly influencing its water quality [25].
Previous geochemical studies of soils in the Northeastern Caucasus have focused primarily on anthropogenic impacts in agricultural areas and their links to public health [26,27,28,29,30]. In Dagestan, localized assessments have evaluated the influence of economic activities and individual enterprises on heavy metal concentrations in soils [31]. In the lowland part of Dagestan, agricultural fields have been investigated for Zn, Cu, Mn, Co, and Pb, revealing spatial patterns characterized by a decrease in Zn and Cu and an increase in Pb [28]. In hydromorphic soils of the Dagestan lowlands, very high concentrations of Cr (162 mg/kg) and Ni (118 mg/kg) have been reported [32]. In the soils of the foothill zone of Dagestan, Cr concentrations reach 210 mg/kg, Ni concentrations reach 192 mg/kg, and Pb concentrations reach 49 mg/kg [33].
Geochemical anomalies are better documented in the central and western parts of the North Caucasus due to plans for economic development, including mineral exploration and extraction, as well as the expansion of tourism zones. There are indications of anomalies in Cu, Zn, Pb, Ba, Co, Mn, and Al, but without specifying their exact locations [34].
Elevated concentrations of certain chemical elements in the Central Caucasus contribute to the contamination of natural waters and restrict their use for domestic water supply [35,36]. In the high-altitude area of Mount Elbrus, natural water sources contain elevated concentrations of Al, As, Cu, Li, Mo, Mg, Na, and Cl [37]. Such high levels of chemical elements act as a limiting factor for tourism development, as water quality directly influences the suitability of the environment for recreational activities.
A considerable body of research has focused on natural and anthropogenic geochemical anomalies in areas of mineral extraction. For example, soils in the Unal Depression (Central Caucasus), within the Ardon River Basin (a tributary of the Terek River), are enriched in Zn, Pb, Cu, and Cd [38]. A tailing repository, where wastes from lead–zinc ore processing are stored, is located approximately 12–15 km downstream [39]. The highest metal concentrations (Pb up to 1708 mg/kg, Zn up to 3636 mg/kg) occur primarily in the upper soil horizons [40,41]. Long-term monitoring over a ten-year period has demonstrated an increase in the levels of potentially toxic elements, with elevated concentrations also observed in forage plants [42,43]. Near the Tyrnyauz tungsten–molybdenum deposit (Central Caucasus), Mo, W, Cu, and Re exhibit elevated concentrations [44,45]. In the Central Caucasus Fore Range, geochemical anomalies were identified based on their exceedance of regional background levels. Anomalies (V, Mo, Cu, Pb, Ag, Mn, Zn) located within mineralization halos of ore deposits are classified as natural [46].
Natural geochemical anomalies act as limiting factors for regional development, necessitating measures such as purification of drinking water from pollutants, control of air pollution levels, and the construction of engineering protection systems. In the absence of such measures, morbidity rates among the population increase. Similar zones have been identified in the lowland and foothill regions of Dagestan. In the lowland areas, elevated Pb concentrations combined with low Mg, K, Ca, and Zn levels have been associated with a higher incidence of essential arterial hypertension in children [39]. The prevalence of goiter in the lowland population increases with higher Mn and Pb concentrations and lower Zn, Co, and Cu levels in soils [47]. Furthermore, the incidence of diabetes in lowland Dagestan has been shown to rise under conditions of low Zn and Cu and elevated Pb concentrations in soils [28].
Despite these findings, research on the Northeastern Caucasus (Dagestan and Chechnya) remains insufficient, even though this region hosts one of the highest population densities in Russia—over 4.5 million people, with up to 85 inhabitants per square kilometer. Element accumulation, dispersion patterns, and spatial variability, especially in mountainous soils of the region, remain insufficiently studied [48].
The aim of this study is to determine the spatial distribution of geochemical anomalies of selected potential toxic elements in the soils of the river basins in the Northeastern Caucasus—specifically the Ulluchay, Sulak, and Sunzha Rivers.

2. Materials and Methods

2.1. Study Area

The Northeastern Caucasus represents the easternmost part of the Greater Caucasus within the Russian Federation. The region includes the marginal zones of the Scythian, Turanian, and Transcaucasian epi-Hercynian plates, characterized by the development of rock ranging from the Proterozoic to the Holocene. The complex geodynamic history of the territory (subduction, rifting, collision, post-collision extension, compression) has resulted in a diverse lithological composition and rich mineral resource potential.
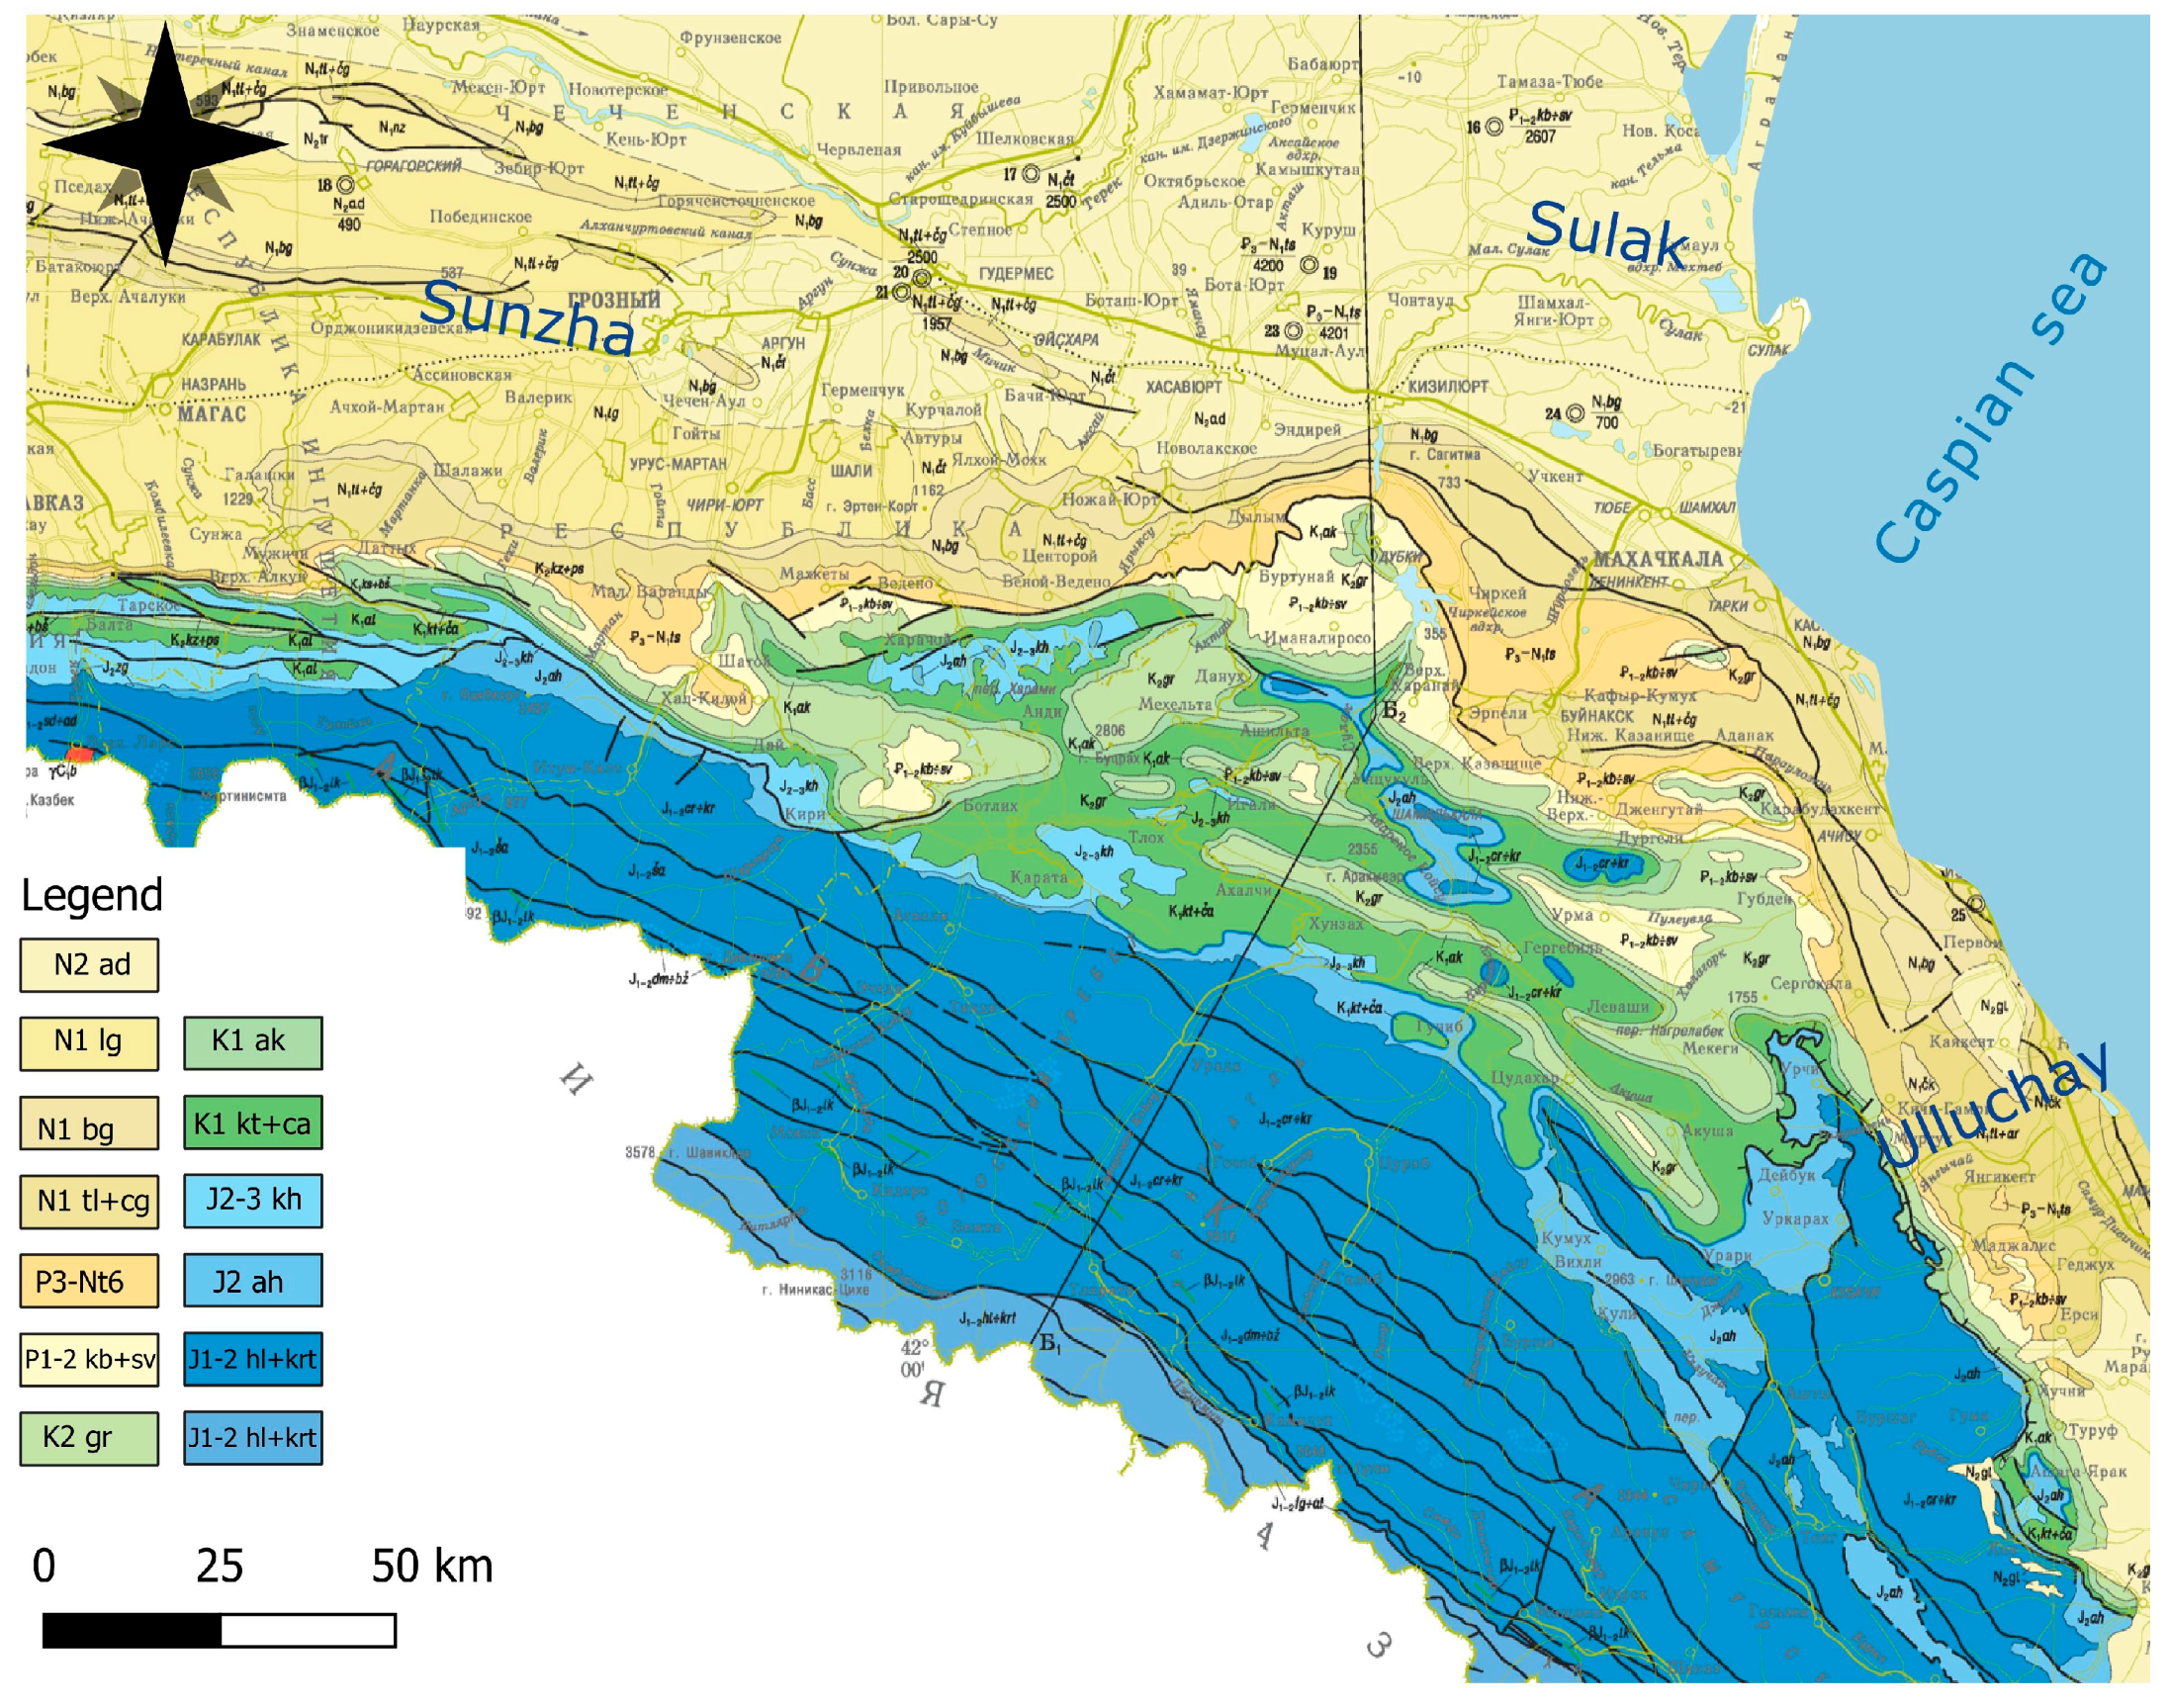
The Terek–Sulak and coastal lowlands are located in the eastern part of the Terek–Caspian foredeep of the Greater Caucasus. They are composed of Oligocene–Neogene molasse deposits reaching a thickness of up to 10–12 km (Figure 1). Exposed at the surface are green marls and clays (P1–2 kb + sv); sandy calcareous clays interbedded with sandstones and occasional marl layers (N1 tl + cg); sands, sandstones, and detrital limestones (N1 lg); clays with interbeds of sands, sandstones, and coquina limestones, overlain in the upper part by small-pebble conglomerates (N1 bg); alternations of conglomerates, sandstones, and clays of subcontinental facies, containing pebbles of black shales and highly weathered granites and diabases in the east (N1 lg); as well as coarse-grained sandstones, sands, and clays with interbeds of pebble beds, gravels, and coquinal limestones (N2 ad).
The foothills, or Dagestan limestone, represent the northeastern slope of the Greater Caucasus. They are composed of shelf terrigenous–carbonate deposits of the Upper Jurassic–Eocene folded into a series of structures. Exposed here are sandstones with interbeds of limestones, clays, and marls (K1 kt + ca; K1 ak) and light gray thin-bedded clayey limestones, containing interbeds of dark gray marls in the lower part and layers (up to 0.2 m) of calcareous sandstones and horizons (up to 4 m) of olistostromes (K2 gr) in the upper part.
High-mountain Dagestan and Chechnya are situated in the axial zone of the lateral and main ranges of the Greater Caucasus. In this area, a black shale formation of the Lower and Middle Jurassic is widespread. At the surface, alternating sequences of mudstones, siltstones, and sandstones are exposed, along with mudstones containing siderite concretions and lenses of biogenic limestones (J1–2 hl+krt), sandstones with rounded pebbles of the same composition, mudstones and siltstones with sandstone interbeds, layers and concretions of clayey siderites, marl lenses, calcareous nodules, and lenses of cherty limestones (J2 ah) [49].
Figure 1. Geological structure of the study area [50].
Geosciences 15 00380 g001
The main geomorphological units are represented by the high and mid-mountain ridges of the Central and Eastern Caucasus, low mountain chains, intermontane depressions, and the Tersko-Kumskaya and Dagestanskaya lowlands. According to geo-morphological zoning, elevations below 1000 m a.s.l. occupy 39.7% of the territory, while mid-mountain elevations (1000–2000 m) comprise 27.1%, and areas above 2000 m and 3000 m account for 25.9% and 7.2%, respectively [51,52].
The foothills occupy 35% of the total area of the Northeastern Caucasus [53,54]. At the same time, heights up to 1000 m account for 17,848 km2 (39.7%), 1000–2000 m (midlands) accounts for 12,192 km2 (27.1%), 2000–3000 m accounts for 11,625 km2 (25.9%), and above 3000 m accounts for 3223 km2 (7.2%). Geomorphologically, the low mountains and highlands are more widely represented in the Northeastern Caucasus, while the middle mountains occupy a slightly smaller area. The largest area in the low mountains is occupied by elevations of 200–400 and 400–600 m, which include the advanced ridges (Tersky and Sunzhensky). As for the average categories, the distribution of the territory is quite uniform [55]. The highest parts of the mountain structure occupy a somewhat insignificant piece of the territory [51].
The soils of the studied region show pronounced altitudinal zonation. In the foothill areas and lower mountain belts, brown mountain–forest soils predominate; above the forest boundary, mountain–meadow soils dominate; on the arid southern slopes, mountain–steppe soils are widespread. The plains are characterized by chestnut, meadow–chestnut, meadow, and solonchak soils.
Vegetation is also highly differentiated. Shrub formations are widespread in foothill and low mountain regions, along with xerophytic herbaceous steppe communities. The mountain–forest belt is represented by oak, beech, pine, and birch forests. Subalpine and alpine meadows dominate at altitudes above 1800–2000 m [56].
The research area includes soils from the basins of three large rivers in the Northeastern Caucasus: the Ulluchay, Sulak, and Sunzha. The Ulluchay and Sulak rivers flow through the territory of the Republic of Dagestan, and the Sunzha River flows through the territory of the Chechen Republic and the Republic of Ingushetia. The studied rivers cut through mountainous terrain, forming deep gorges and canyons. They are full-flowing, fed by snow and groundwater, and subject to seasonal floods in spring and early summer.
The Sulak River (169 km) has its source from the highlands of the Greater Caucasus Range, crossing the Gimri and Alatau ranges. It flows into the Caspian Sea north of Makhachkala, adjacent to the village of the same name near the Agrakhan Peninsula.
The Sunzha River (278 km) flows north to the Sulak River. It has its origin on the northern slope of the Greater Caucasus Range; runs along the Sunzhensky range, forming a wide valley; and flows into the Terek River [57].
The Ulluchay River (111 km) is much smaller in size, has its source on the eastern slope of the Kokmadag range, and flows into the Caspian Sea north of Derbent in the Morskoy region (Figure 2).

2.2. Sampling Procedures

The main criteria for sample selection were as follows: topographic position, geological structure, and type of land use. Soil sampling was carried out along the longitudinal profile of each river—from the upper reaches, through the middle, to the lower course—and transversely, considering exposure and slope position (Figure 3). Thus, the samples were collected along a soil–landscape catena, extending from the watershed divide down to the base level of erosion. Additional sampling was conducted along the main river channel and its largest tributaries, in accordance with standard methodological guidelines [58].
The selection of sampling sites took into account the proximity to potential natural (lithological) and anthropogenic sources of element accumulation. According to the geological map, the sites are located within the coastal zone of marine sedimentary deposits, the zone of foreland sedimentary deposits, and the high mountain zone of igneous rocks [50]. Most of the samples were collected in areas unaffected by direct anthropogenic impact. In anthropogenically transformed areas, samples were taken from agricultural lands, pastures, near roads, and in the vicinity of settlements.
In total, 100 composite soil samples were collected in the summer of 2024.
At each site, a soil pit was excavated, and the full soil profile, underlying parent material, and landscape conditions were described. Soil samples were taken from the topsoil (humus horizon) following standard soil sampling protocols. Approximately 1 kg of soil was collected from the upper horizon of the profile using a clean plastic trowel. The depth of the topsoil horizon ranged from 5 to 12 cm, depending on soil type. At each site, GPS coordinates and elevation were recorded using a Garmin GPSMAP 64 receiver (Garmin International, Inc., Olathe, KS, USA). The samples were placed in paper bags, air-dried at room temperature, and subsequently transported to the laboratory. All samples were collected under uniform conditions to ensure consistency and reliability in the comparative analysis of spatial variations in element concentrations.

2.3. Laboratory Analyses

Twenty-five chemical elements were detected in the collected samples. The list includes Li, Be, Na, Mg, Al, Ca, Sc, V, Cr, Mn, Fe, Co, Ni, Cu, Zn, As, Br, Mo, Ag, Cd, Sn, Sb, Te, Cs, and Ba.
In the laboratory, each sample was dried at 105 °C in a drying oven, spread on a table, and divided into four parts, from which approximately 200 g of soil was randomly selected. The soil was ground in an agate mortar, sieved through a 0.25 mm mesh, and stored in labeled containers.
A 0.1 g (±0.0001) subsample of the sieved material was placed into a heat-resistant beaker. Ten milliliters of concentrated nitric acid was added, and the beaker was covered with a watch glass. The prepared samples were placed on laboratory hotplates, brought to a boil, and boiled for 20 min. Subsequently, 5–10 mL of concentrated hydrogen peroxide was added dropwise under stirring, and the solution was boiled for an additional 30 min until complete dissolution of the sample. After cooling to room temperature, the solution was transferred into a 50 mL volumetric flask and brought to volume with bidistilled water. If necessary, the solution was filtered through a “blue ribbon” paper filter.
Elemental concentrations were measured using inductively coupled plasma mass spectrometry (ICP-MS) on a PlasmaQuant MS Elite (S/N: 11-6000ST043) device (Analytik Jena GmbH, Jena, Germany). Analyses were conducted at the Analytical Center for Geochemistry and Environmental Monitoring, in accordance with the certified method PND F 16.2.2:2.3.71-2011 “Determination of chemical elements in environmental objects by ICP-MS” [59].
Calibration was performed using multi-element Inorganic Ventures standards:
  • IV-ICPMS-71A-125ML—10 ppm 43 Element ICP Calibration/Quality Control Standard;
  • IV-ICPMS-71B-125ML—10 ppm Refractory Element ICP Calibration/Quality Control Standard;
  • IV-ICPMS-71C-125ML—10 ppm Precious Metal (Osmium) ICP Calibration/Quality Control Standard;
  • IV-ICPMS-71D-125ML—10 ppm 6 Element ICP-MS Internal Standard.
Analytical results for calibration curve and percentage recovery (% R), limit of detection (LOD) and limit of quantification (LOQ), calibration correlation coefficients (Rc), and relative percentage differences for replicate samples (RPD) for the analyzed elements are shown in Table 1.
Limits of detection of chemical elements are shown in Table 2.
The concentration of a metal in the sample solution (X, mg/dm3) was calculated according to Equation (1):
X = A × V1/V
where
A denotes the concentration of the metal in the analyzed solution, determined using the calibration curve (mg/dm3).
V1 denotes the volume of the volumetric flask used for dilution (cm3).
V denotes the volume of the sample taken for dilution (cm3).
The mass fraction of a metal in the air-dry sample (Xa/s, mg/kg) was calculated according to Equation (2):
Xa/s = (X × V)/M
where
X denotes the concentration of the metal in the analyzed solution (mg/dm3).
V denotes the volume of the prepared solution (cm3).
M denotes the weight of the air-dry subsample (g).
Soil pH was determined in accordance with GOST 26423-85 “Soils. Methods for the determination of specific electrical conductivity, pH, and the solid residue of water extracts.” [60].

2.4. Data Processing

2.4.1. Geochemical Indices

Primary statistical data processing included calculating descriptive statistics (mean, median, minimum, maximum, standard deviation, coefficient of variation) and frequency distribution histograms for each element. The normality of the distribution was checked using the Shapiro–Wilk test. Logarithmic transformation was applied to variables with non-normal distribution. To assess the degree of accumulation and potential ecological hazard, the following geochemical indices were calculated:
Concentration coefficient (Kk) and distribution coefficient (Kp) (3):
Kk = Ci/K          Kp = K/Ci
where Ci is the metal concentration in samples in the studied geochemical system (soil), and K is the Clarke of the element in the Earth’s crust.
Clarke is the average content of chemical elements in the Earth’s crust. Clarke’s values of chemical elements in the Earth’s crust are given according to [16,61].
Contamination factor (Cf) is calculated according to the following Formula (4) [62]:
C f = C i B i
Modified contamination factor (mCf) is calculated according to Formula (5):
m C f = n i = 1 C f / n
where Ci is the metal concentration in samples, Bi is the background concentration in samples, and n is the number of analyzed trace elements.
The modified contamination factor is considered on the following scale:
  • mCf < 1.5—unpolluted.
  • 1.5 ≤ mCf < 2—low degree of contamination.
  • 2 ≤ mCf < 4—moderate degree of contamination.
  • 4 ≤ mCf < 8—high degree of contamination.
  • 8 ≤ mCf < 16—very high degree of contamination.
  • 16 ≤ mCf < 32—extremely high degree of contamination.
  • mCf ≥ 32—ultra-high degree of contamination.
Geoaccumulation index (Igeo) is calculated according to the following Formula (6) [63]:
Igeo = log 2 C i 1.5 B i
Igeo has the next classification:
  • Igeo ≤ 0—unpolluted.
  • 0 < Igeo < 1—unpolluted to moderately polluted.
  • 1 < Igeo < 2—moderately polluted.
  • 2 < Igeo < 3—moderately to strongly polluted.
  • 3 < Igeo < 4—strongly polluted.
  • 4 < Igeo < 5—strongly to extremely polluted.
  • Igeo > 5—extremely highly polluted.
The enrichment factor (EF) for each analyzed chemical element is calculated according to the following Formula (7) [64]:
E F = C i / C   A l B i / B   A l
where Ci is the metal concentration in samples, C Al is the concentration of the reference element Al, Bi is the background in samples, and B Al is the background of the reference element Al.
Al, as the least variable chemical element, was chosen as a reference chemical element. To interpret the obtained enrichment coefficient values, the following scale was adopted:
  • EF < 2—deficiency to minimal enrichment.
  • 2 ≤ EF < 5—moderate enrichment.
  • 5 ≤ EF < 20—significant enrichment.
  • 20 ≤ EF < 40—very high enrichment.
  • EF ≥ 40—extremely high enrichment.
Pollution load index (PLI) is calculated according to Formula (8):
P L I = ( C f 1 × n C f 2 × × C f n
  • PLI < 1—not polluted.
  • 1 < PLI ≤ 2—moderate contamination/polluted.
  • PLI > 2—strong contamination/polluted.
The total pollution index Zc [65] was used as an integral criterion to identify elevated values of chemical element content. The total pollution index is equal to the sum of concentration coefficients of chemical elements exceeding the Clarke minus the number of analyzed elements minus 1, and is expressed by Formula (9):
Zc = Σ (Kki + … + Kkn) − (n − 1)
where Kki denotes the concentration factor of i-th chemical element, and n denotes the number of determined summarizable substances with Kki > 1.
An assessment of the danger level of the soil contamination via the Zc indicator was carried out according to the evaluation scale based on the methodology [66]. Pollution level of Zc = 0–16 is considered low, Zc = 16–32 is considered medium (moderately dangerous), Zc = 32–128 corresponds to high (dangerous) levels, and Zc >128 is considered very high (extremely dangerous) [67].
Potential Ecological Risk (PERI) is calculated according to Formula (10):
PERI   =   Cfi × Ti
where
  • Cf is the contamination factor.
  • Ti is the toxic response factor.
  • Toxic response factor values of toxic metals by Hakanson [62,68] are as follows: Cd—30; As—10; Pb, Cu, and Ni—5; Co, V, and Cr—2; and Zn—1.
  • PERI < 90 denotes low ecological risk.
  • 90 ≤ PERI < 180 denotes moderate ecological risk.
  • 180 ≤ PERI < 360 denotes strong ecological risk.
  • 360 ≤ PERI < 720 denotes very strong ecological risk.
  • PERI ≥ 720 denotes highly strong.

2.4.2. Regional Background

To determine the regional background concentrations of elements in the upper soil horizon, the following statistical parameters were calculated: arithmetic mean (X, mg/kg) or geometric mean (Xg, mg/kg) for lognormally distributed data, standard deviation (σ, mg/kg), and confidence interval (P, mg/kg) [69]. The primary concentration data were corrected for outliers using the Z-score method: values with standardized scores exceeding ±3 were considered outliers and excluded from the analysis. The regional background level, derived with the confidence interval, is presented as X ± P, mg/kg, with a 95% confidence level for data following normal and lognormal distributions.
The results obtained through laboratory studies were processed by methods of mathematical statistics in the software programs STATISTICA 12 and Excel 2021, using the programming language Python.

2.4.3. Geochemical Regional Anomalies

To identify geochemical anomalies in the areas studied (regional anomalies), the law of data distribution in the sample is identified for each chemical element [70,71,72,73]. According to the normal (Gaussian) law of data distribution, anomalous values of concentrations were calculated as follows (11):
Ca = Cb ± 2 σ
  • Ca is an abnormal concentration of the chemical element.
  • Cb is a background concentration of the element.
  • σ is a standard deviation, which characterizes the measure of dispersion of the contents of the studied element.
Essentially, the Ca variant reflects the value of the baseline geochemical line, which should correspond to a statistically significant deviation from the mean (background) value, exceeding twice the standard deviation from the mean for each studied element or substance [74].
Geochemical anomalies were determined in the study area and evaluated according to their likely origin, distinguishing between natural factors and anthropogenic or environmental influences. There is also an even higher criterion for anomalies (12):
Ca = Cb ± 3 σ
Ca is an abnormal concentration of a chemical element, Cb is a background concentration of the element, and σ is a standard deviation, which characterizes the measure of dispersion of the contents of the studied element.
Such anomalies of element content are naturally geochemical, reflecting the processes of redistribution and concentration of elements, including during the formation of ore and nonmetallic deposits, or formation in areas with abrupt changes in their geochemical environments.
In the present study, the anomalous content of an element in the upper soil horizon was determined by its value exceeding the standard deviation relative to the background by a factor of 2 [29].

2.4.4. Analyses Using a Geographic Information System (GIS)

The spatial distribution of element contamination in the soil was mapped using a Geographic Information System (GIS).
To assess the impact of human activities on chemical element concentrations in the topsoil, maps of major roads, pollution sources, and land use were produced. Pollution sources included thermal power plants, heating plants, and medium- to large-scale industrial enterprises. The land use map was based on ESRI Land Cover data, which comprises nine classes (vegetation types, bare ground, water bodies, croplands, and built-up areas). The dataset has a spatial resolution of 10 m and is available for the period 2017–2024 [75].

3. Results

3.1. Analysis of the Content of the Chemical Elements

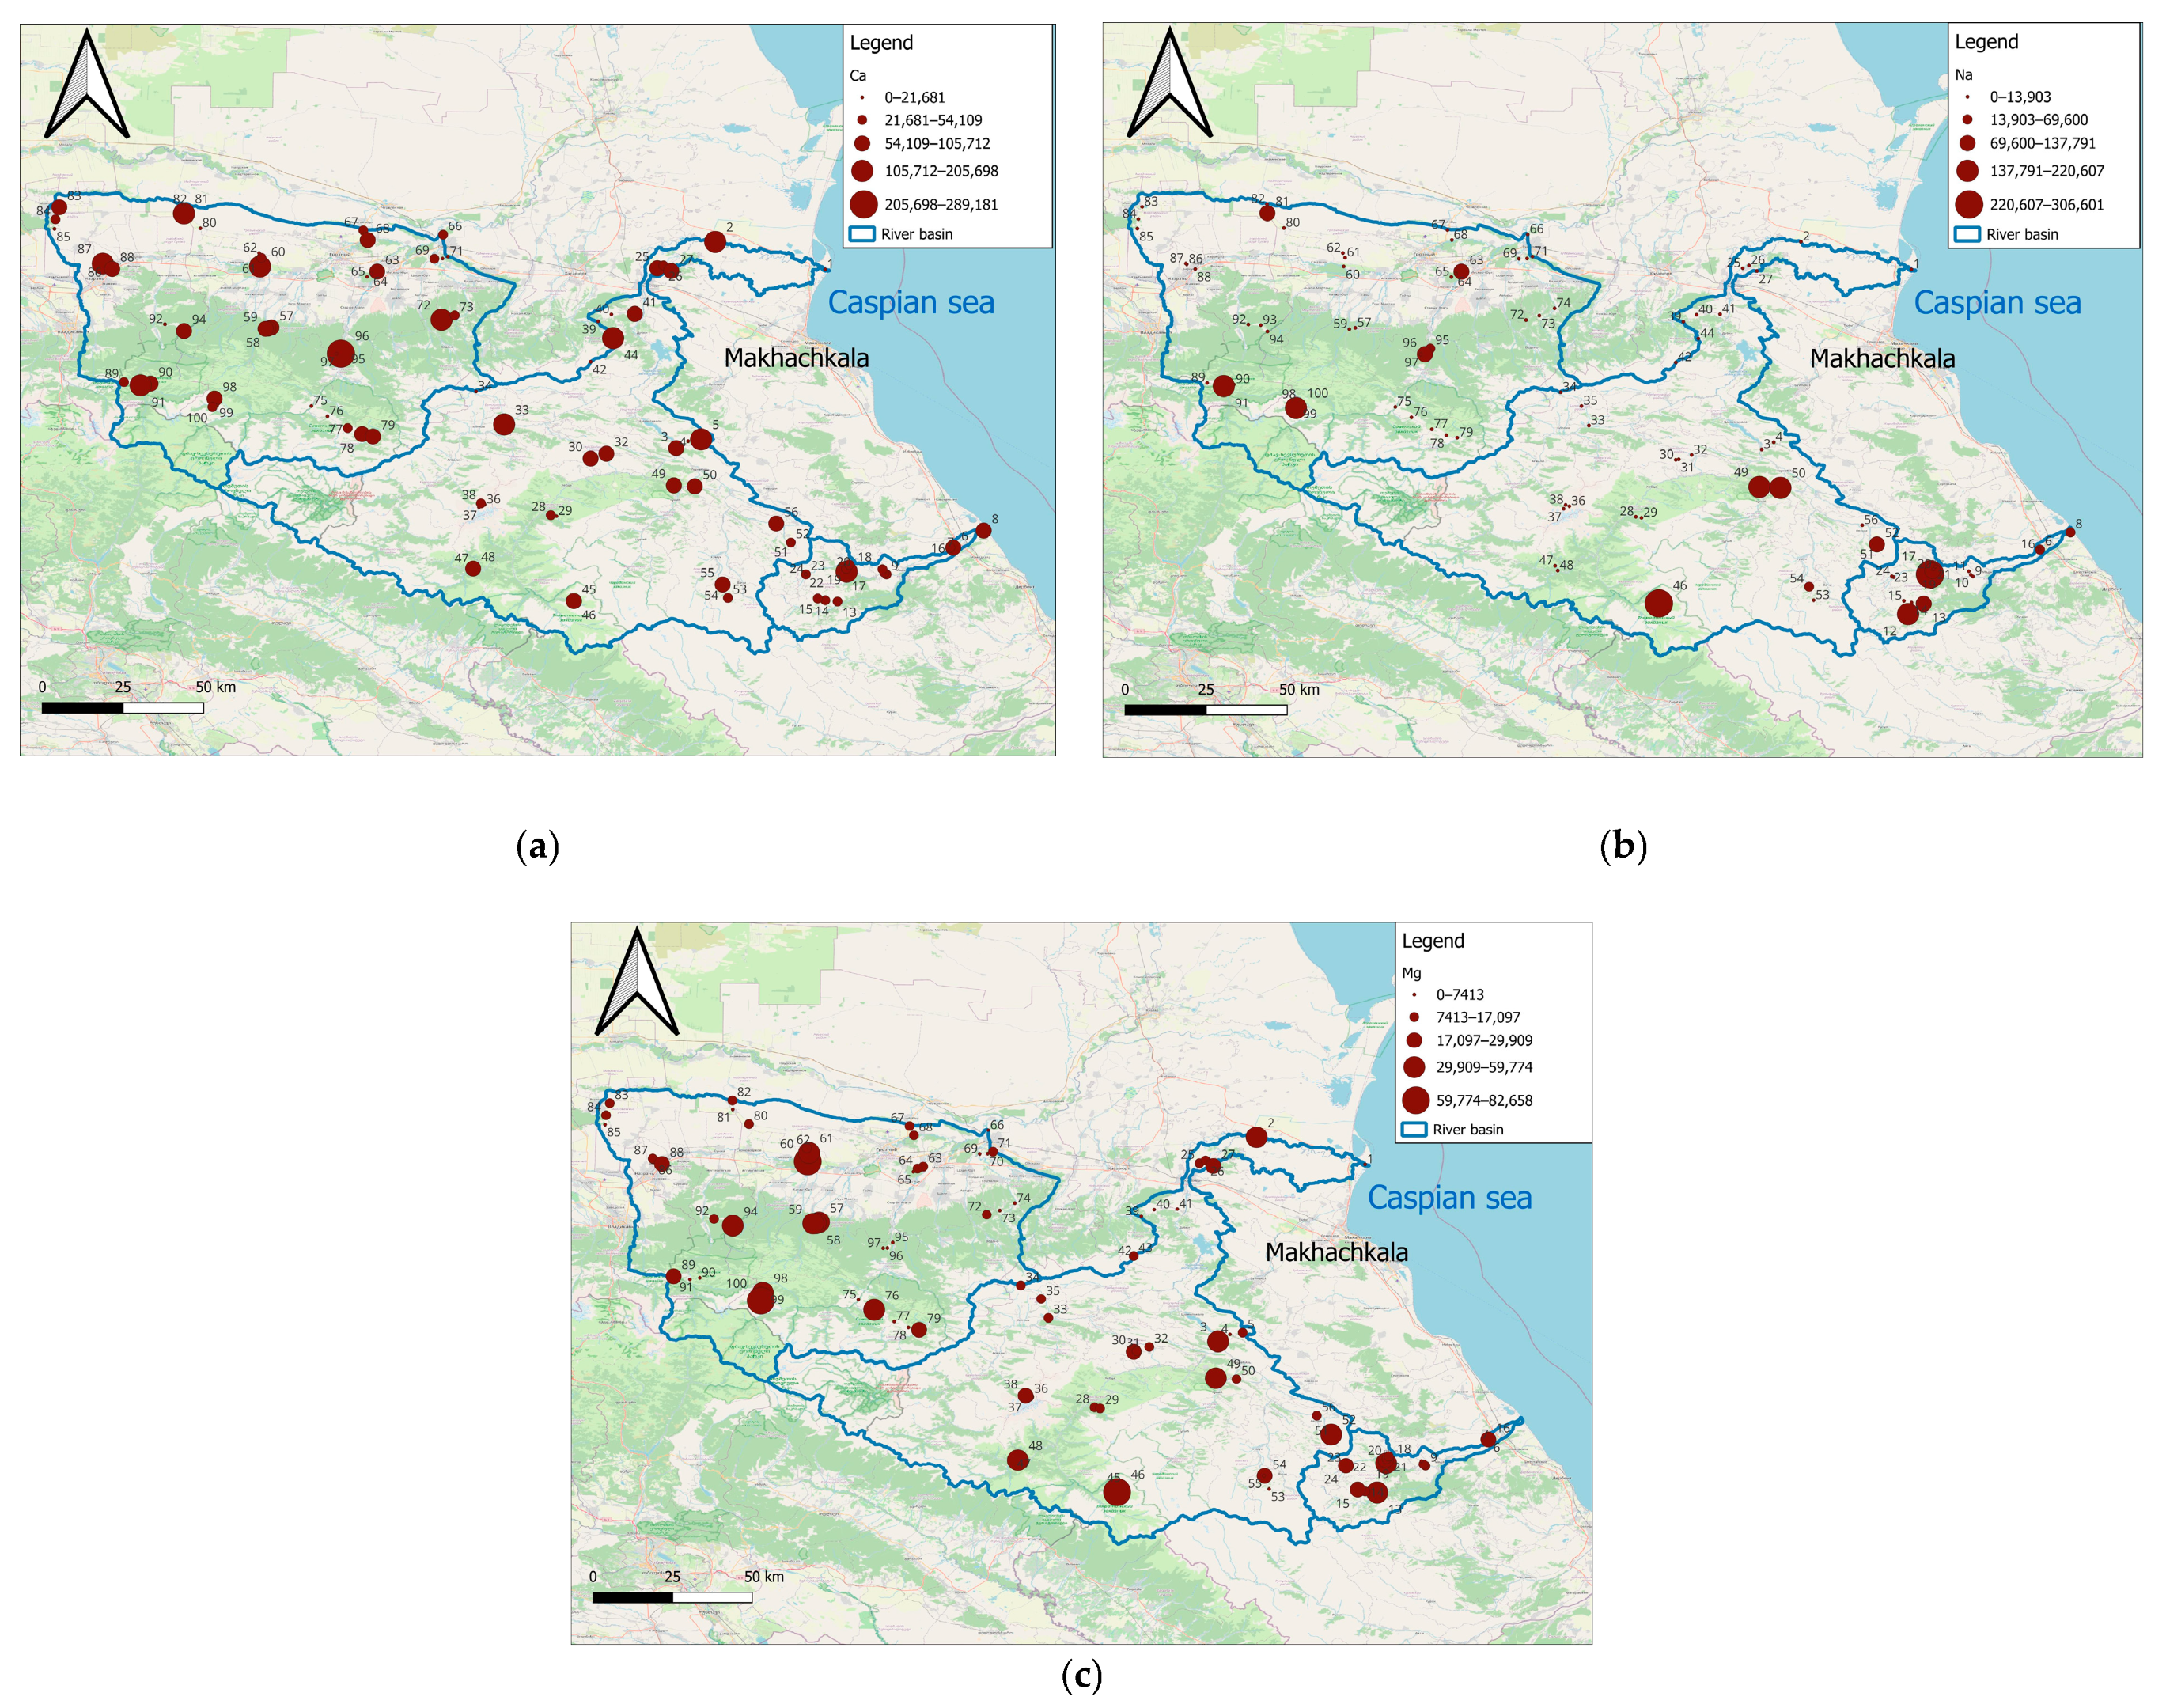
The concentration of the considered chemical elements in soils of the river basins of the Northeastern Caucasus varies widely. Values of Al concentrations at separate points reach 205,729.7 mg/kg, while Na reaches 306,600.70 mg/kg, Ca reaches 289,181.00 mg/kg, Fe reaches 99,382.7 mg/kg, and Mg reaches 82,658.31 mg/kg (Table 3).
The listed chemical elements with high content are among the elements common in the Earth’s crust, which reflects the general patterns of their distribution. Na, Ca, and Mg have similar migration properties—they are mobile elements with a constant valence, forming cations. Simultaneously, the concentration values of Ag, Cd, Sn, Sb, and Te are extremely low at many sites and are below the sensitivity threshold of chemical–analytical equipment. The geochemical sequence of elements by their total content in the upper soil horizon is as follows: Ca > Fe > Al > Na> Mg > Mn > Zn > Cr > Ba > Ni > Cu > V > Pb > Li > Co > As > Mo > Sc > Cs > Sn > Cd > Ag > Be > Sb > Te.
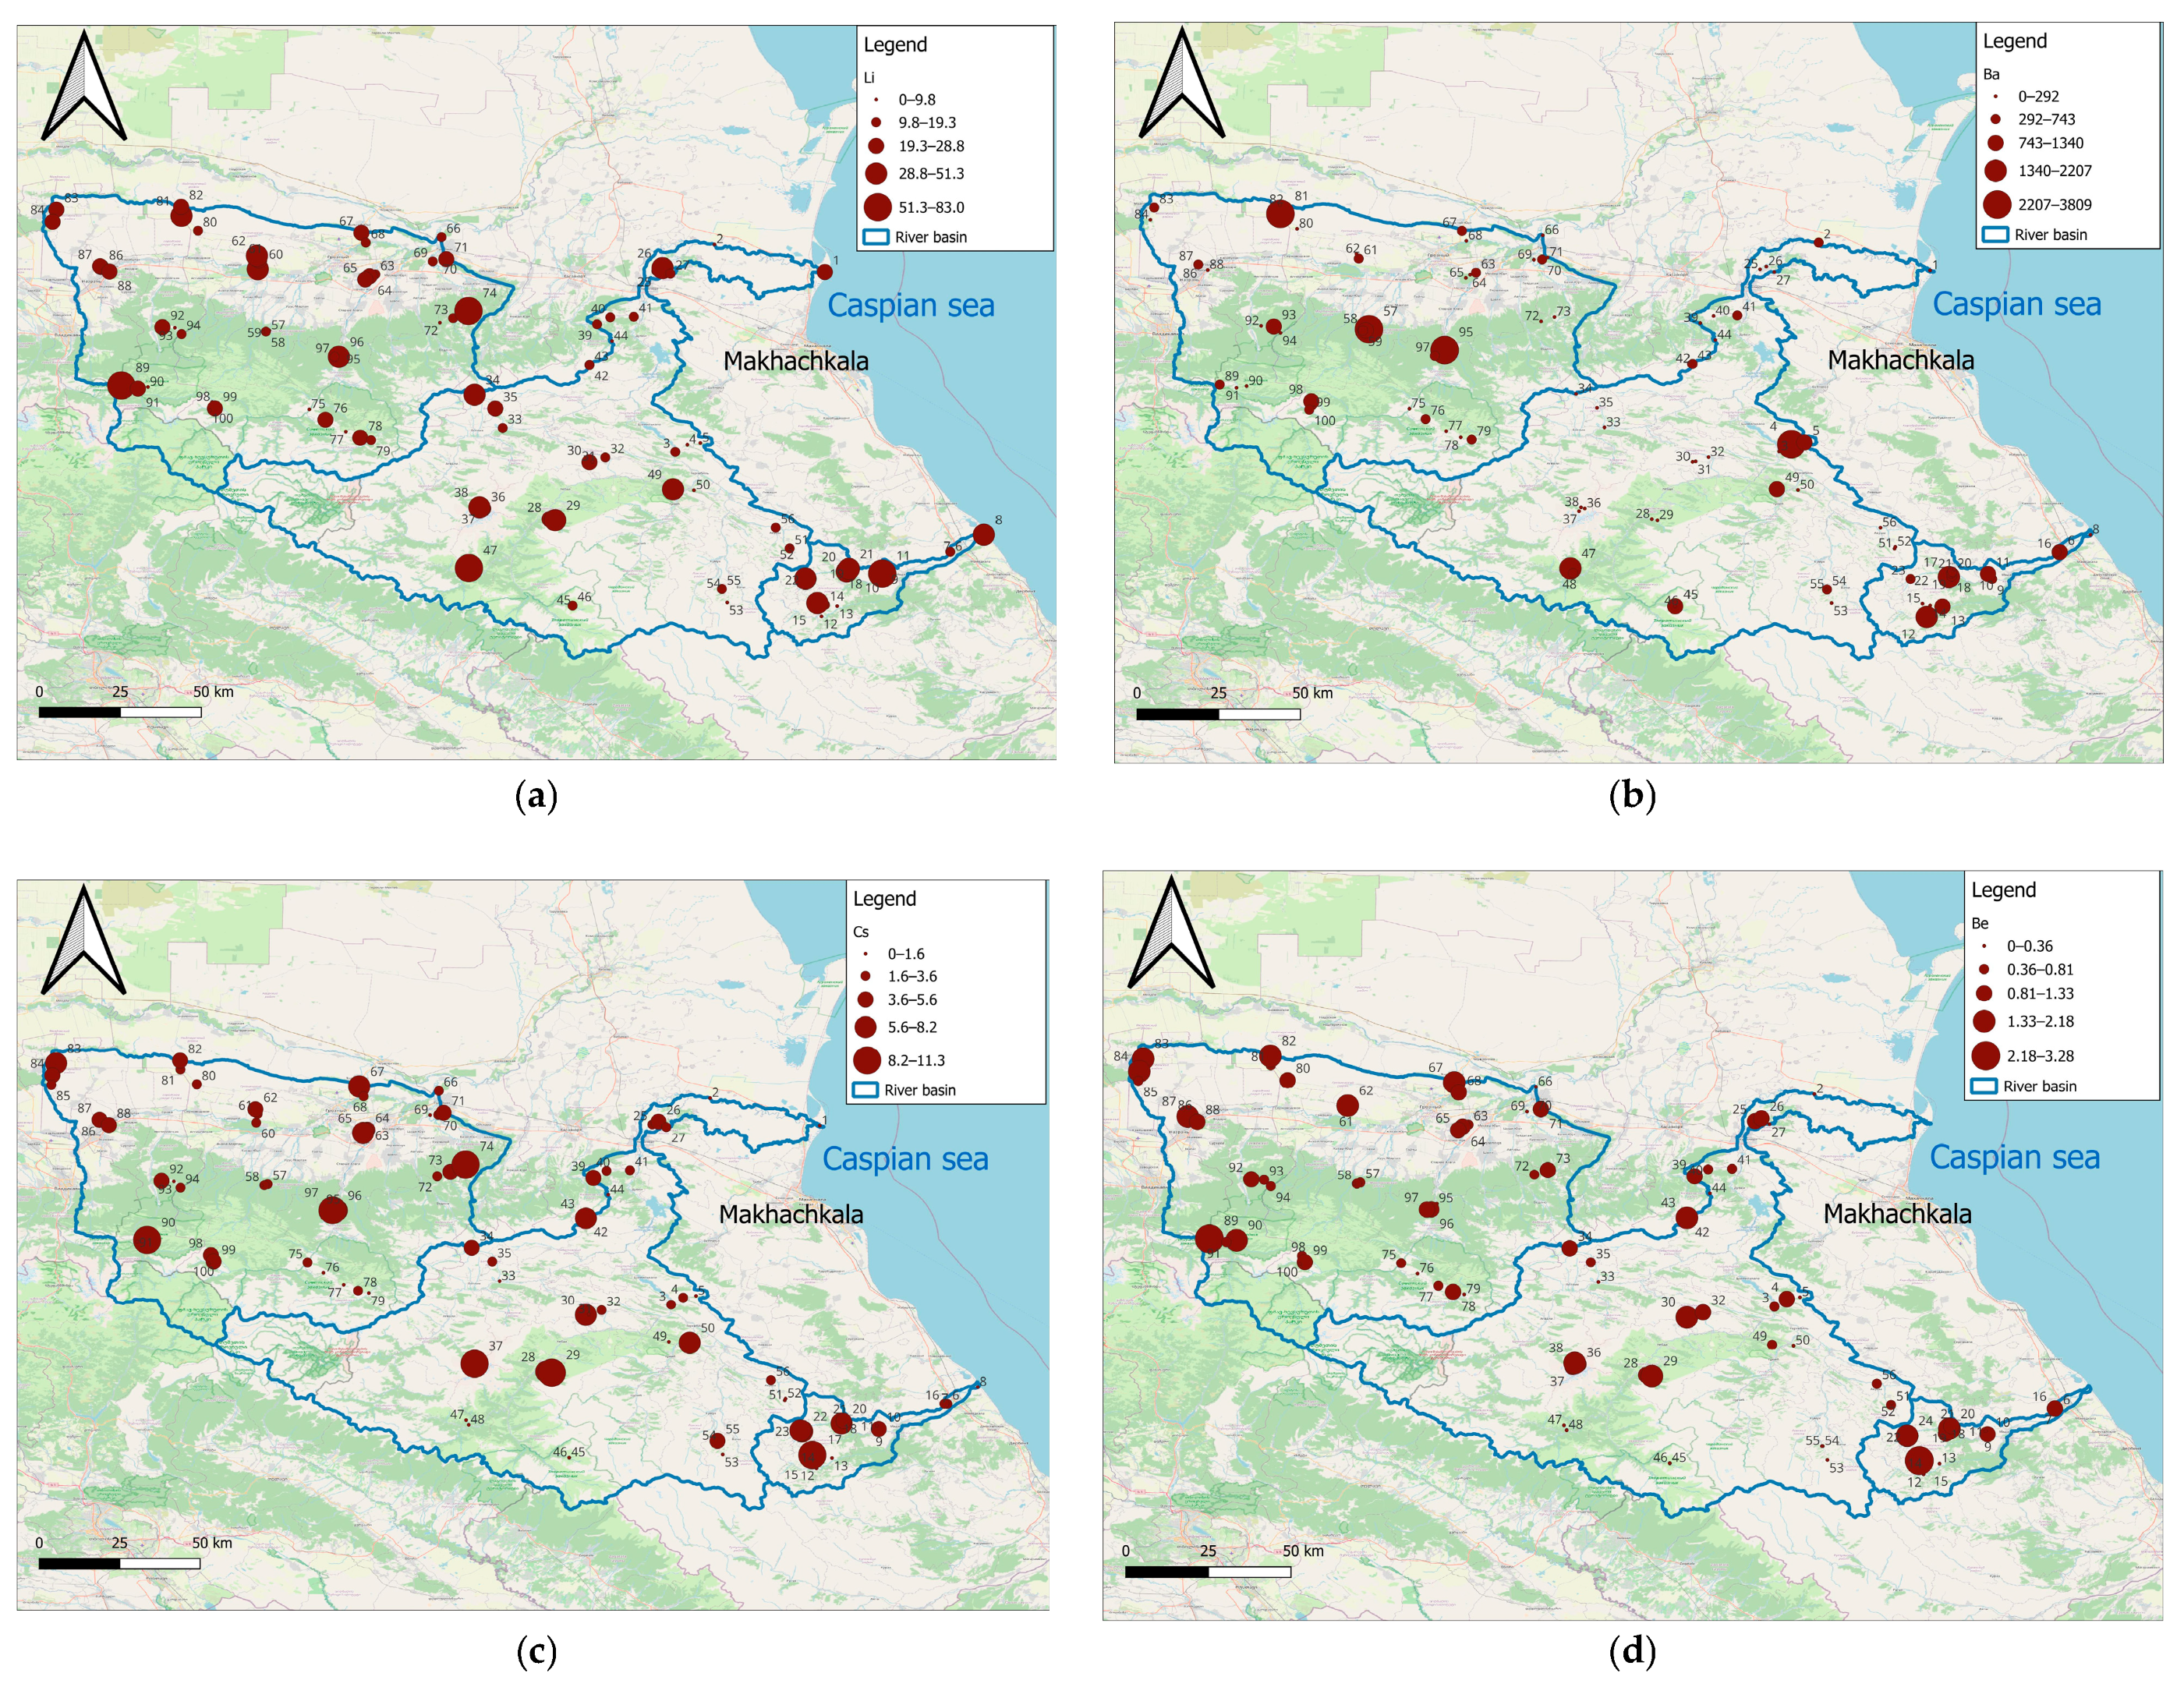
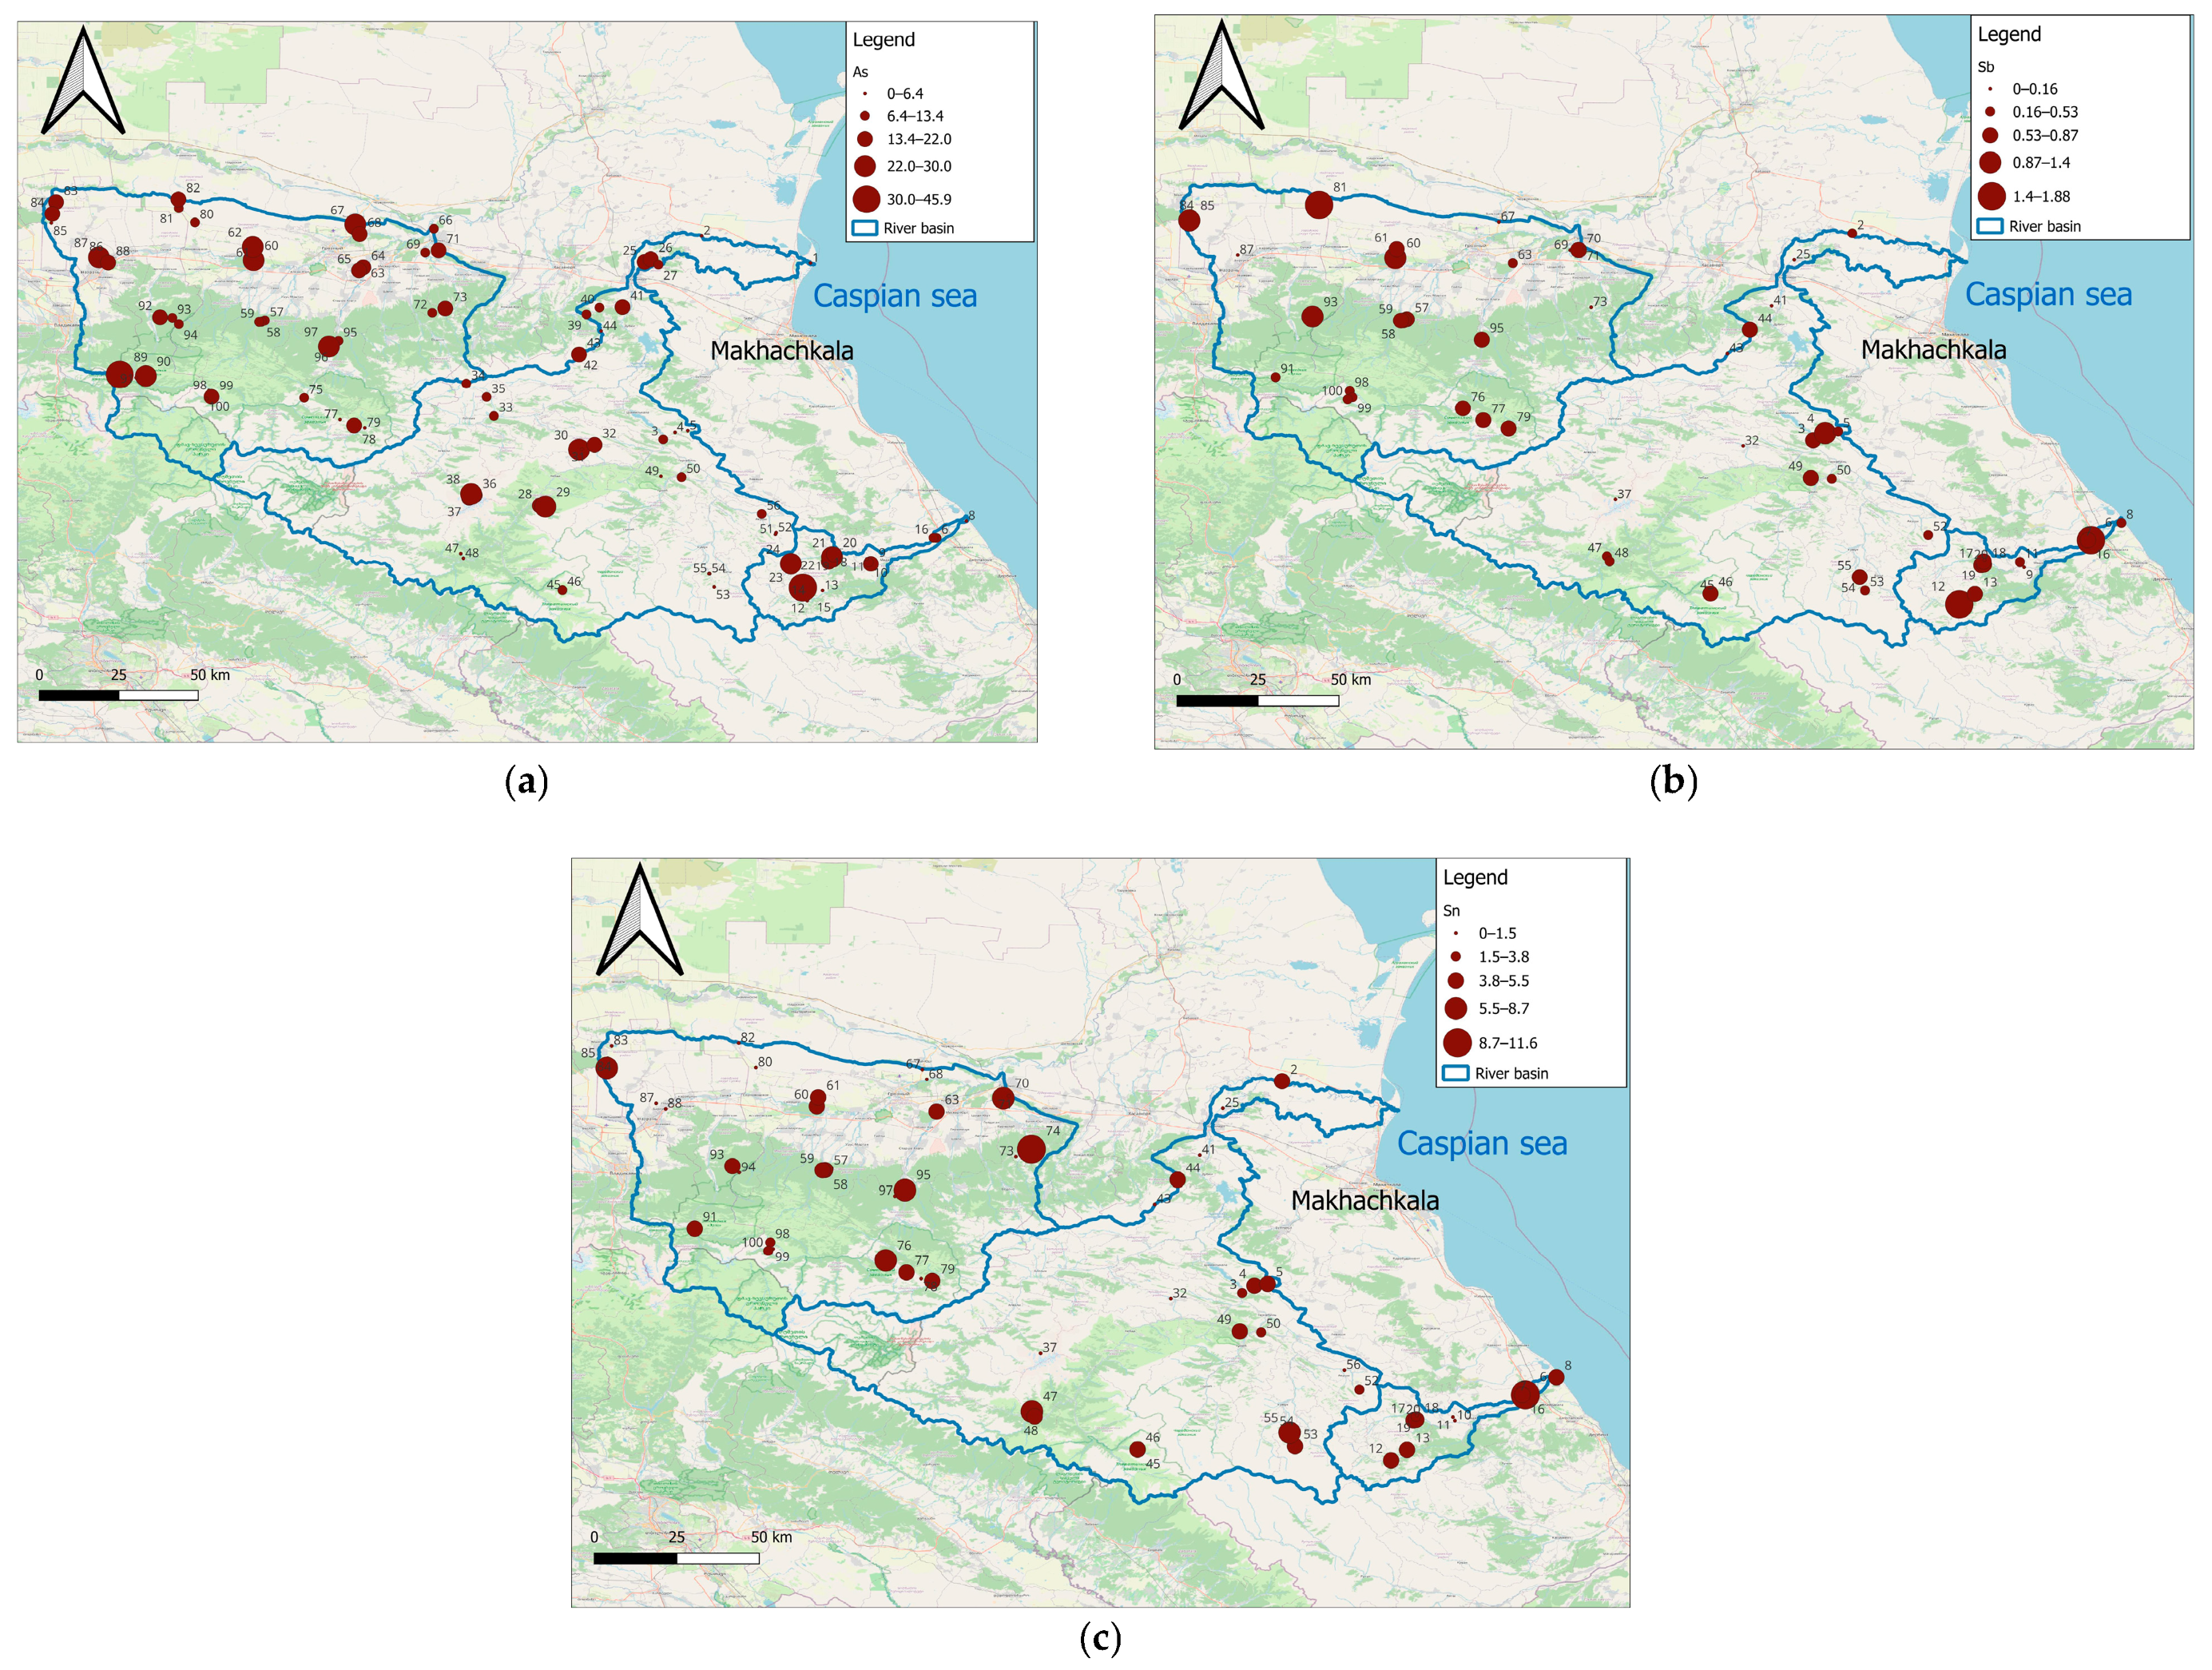
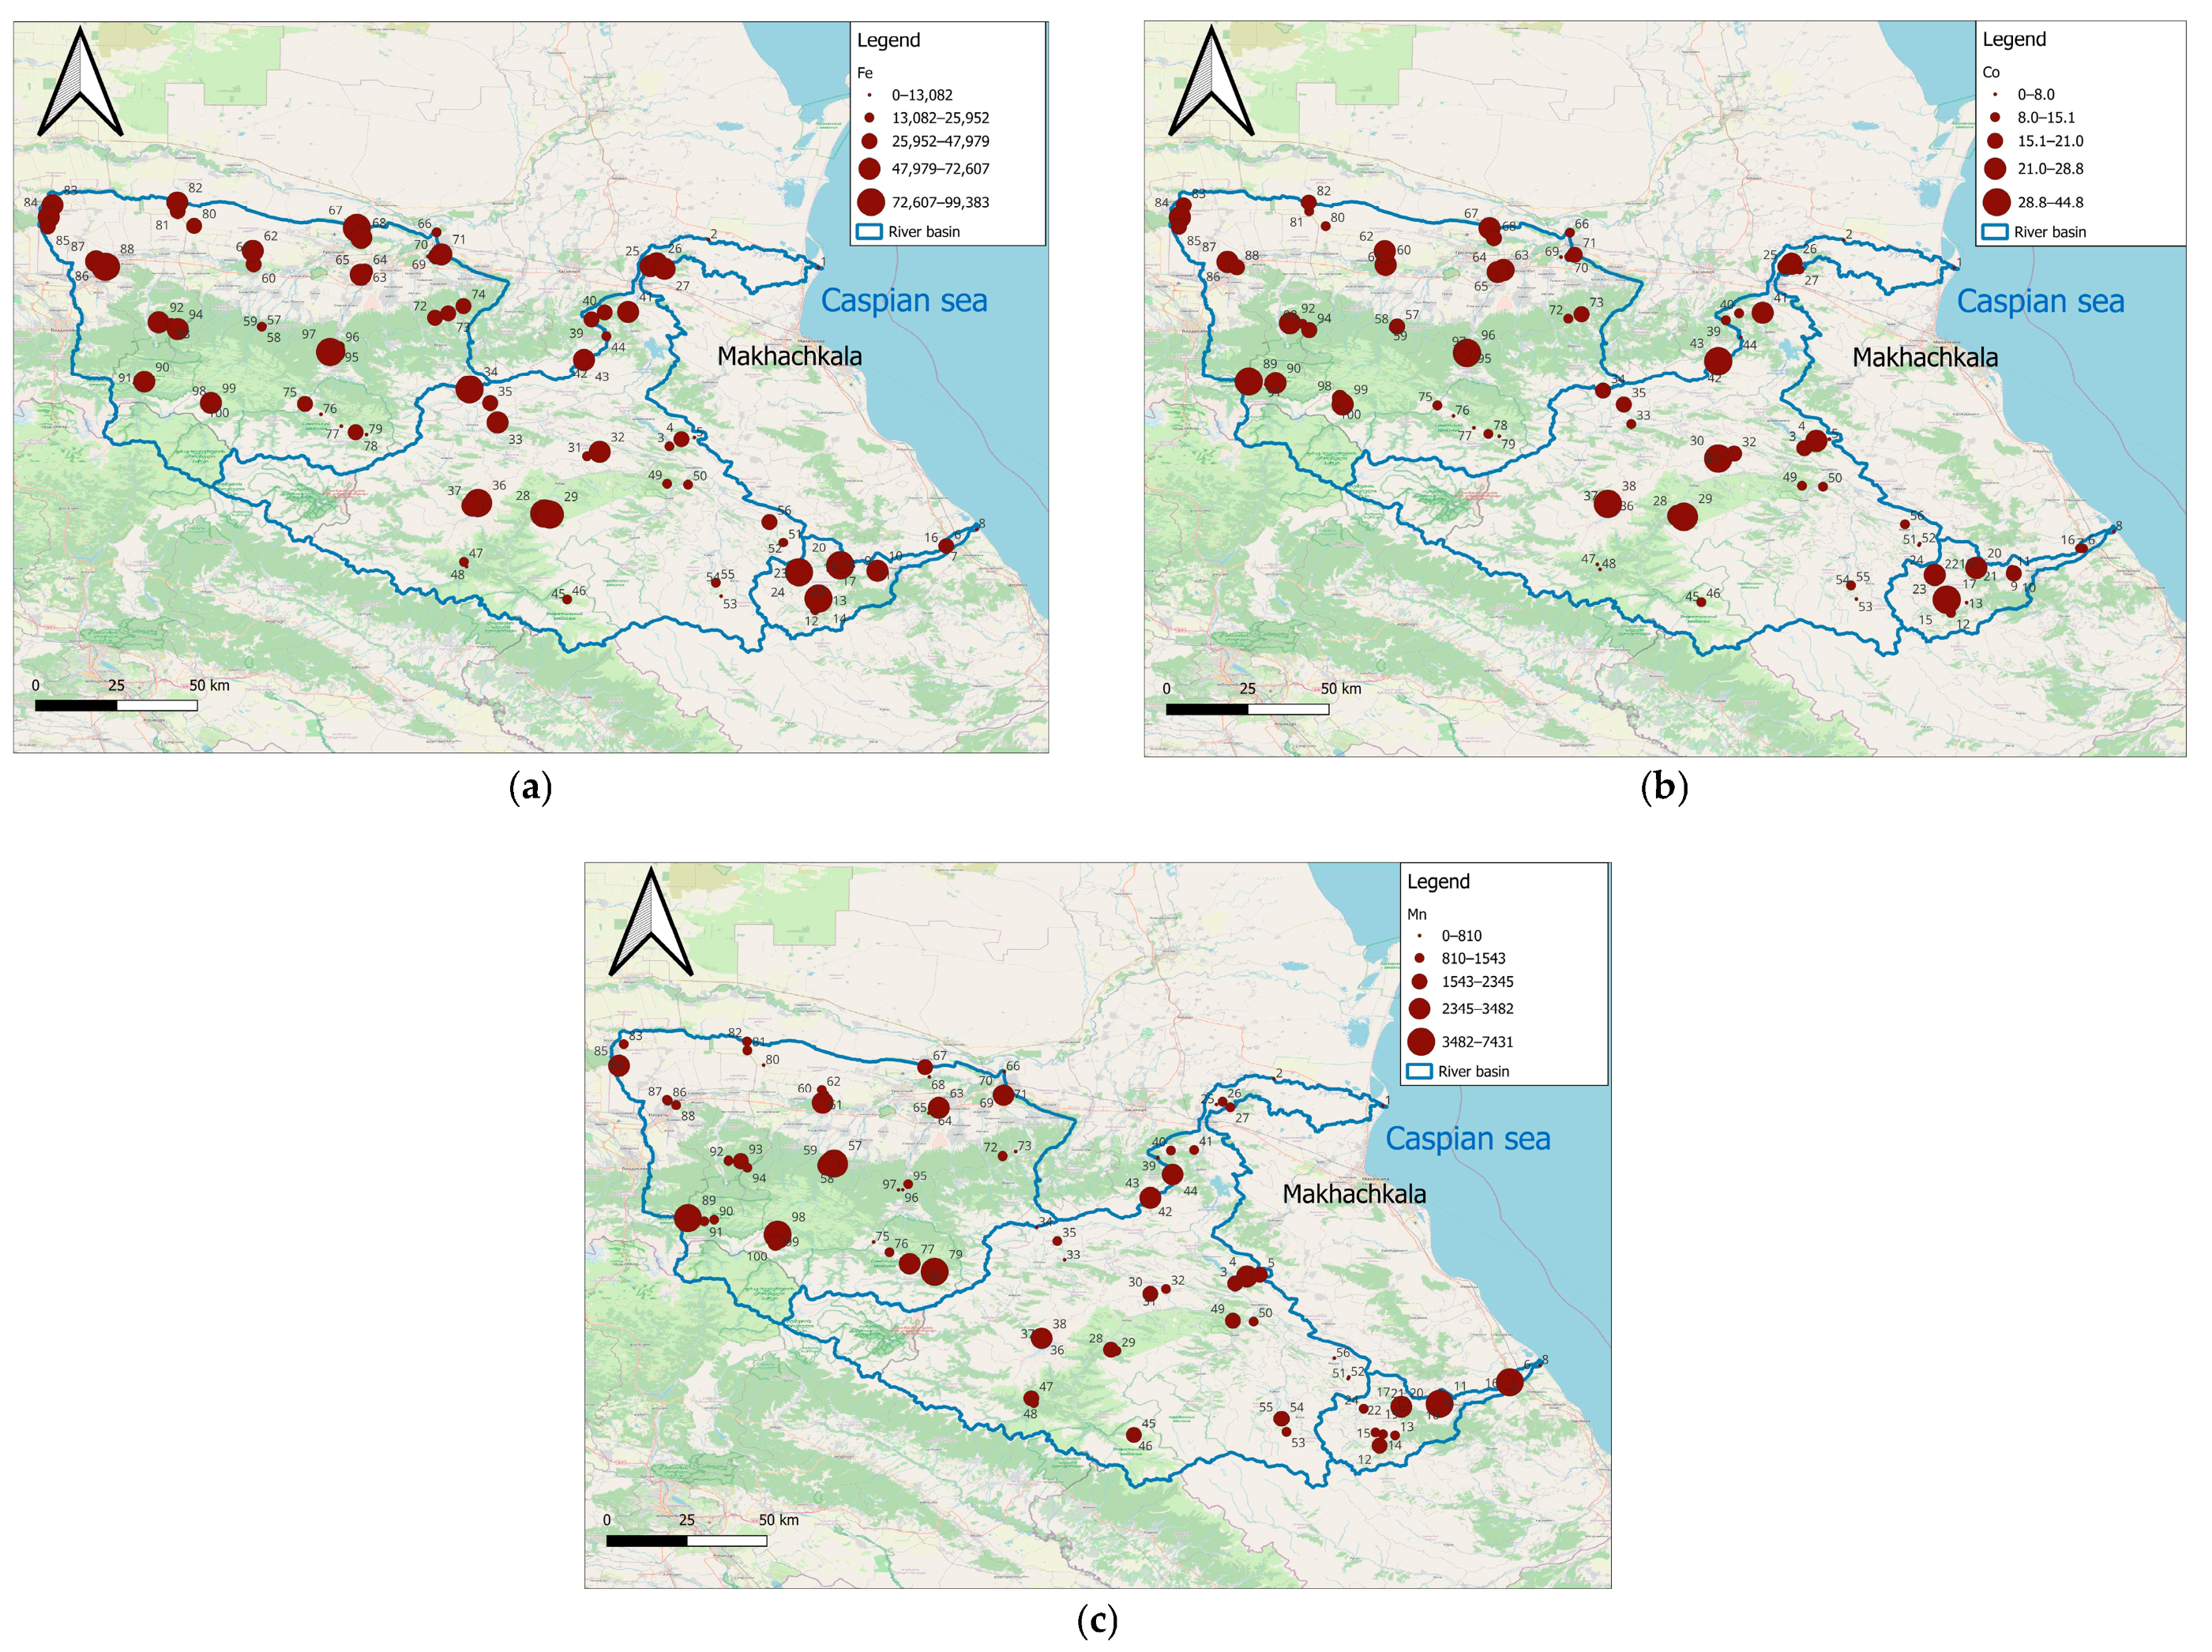
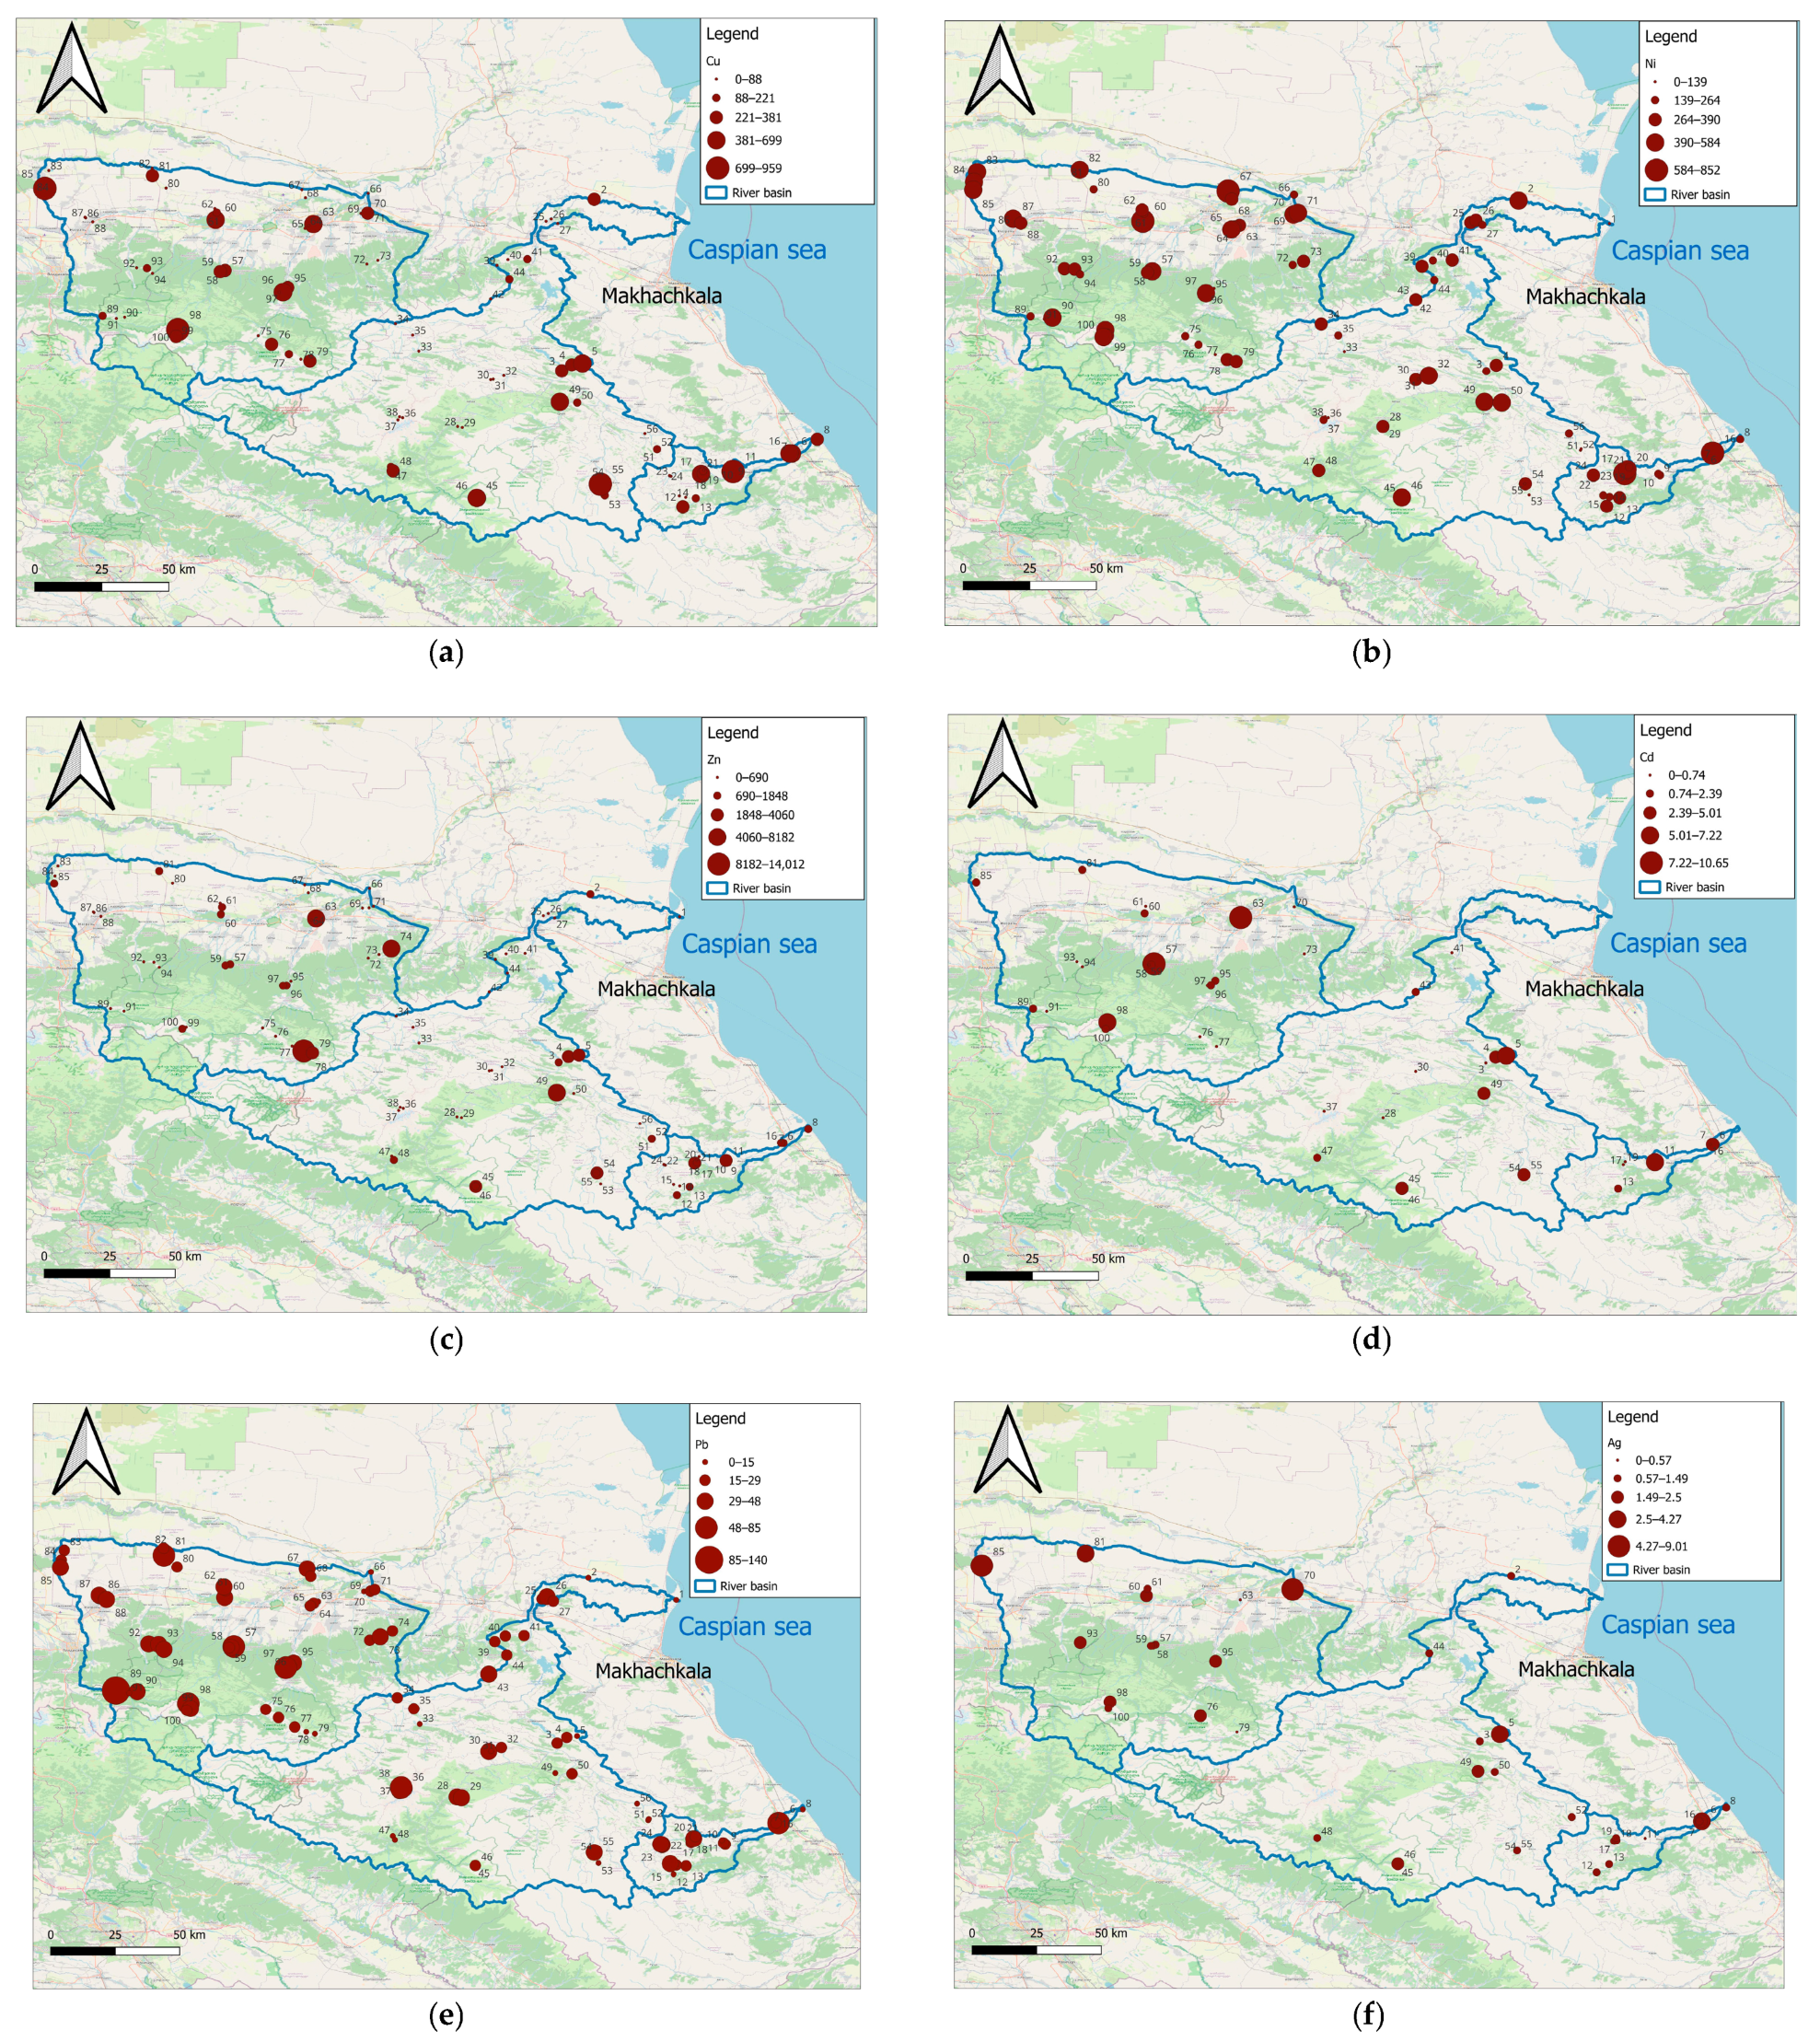
Ca content (100,000–290,000 mg/kg) is noticeably higher in the plain and foothill parts of river basins, which are composed of sedimentary rocks with a high proportion of calcium minerals. In the highlands, which are composed of igneous rocks, the Ca content in the upper soil horizons decreases (750–25,000 mg/kg) (Appendix A, Figure A1). The sampling sites with elevated Ca concentrations are more prevalent in the Sunzha River Basin and in the middle section of the Sulak River Basin. The content of Na and Mg increases (Na: 100,000–285,000 mg/kg; Mg: 15,000–82,000 mg/kg) in the upper reaches of the Ulluchay River, but their concentration has no shared characteristics in other areas. For the group of cationic lithophilic elements (Ba, Li, Cs, and Be), a commonality is a slight increase in the content in the Sunzha River Basin (Ba: 2000–3800 mg/kg; Li: 50–82 mg/kg; Cs: 5–11 mg/kg; Be: 2–3 mg/kg) (Appendix A, Figure A2). The content of anionic lithophilic elements As, Sb, and Sn decreases in the upper basin of the Sulak River in areas of magmatic and metamorphic rock outcrops (As: 1.74–4 mg/kg; Sb: 0.007–0.5 mg/kg; Sn: 0.11–2 mg/kg) (Appendix A, Figure A3). The content of Fe, Co, and Mn also decreases in the upper reaches of the Sulak River (Fe: 369–20,000 mg/kg; Co: 1.57–10 mg/kg; Mn: 6–700 mg/kg). The content of Co and Mn increases in the coastal conditions of the Caspian Sea (Co 32–44 mg/kg, Mn 3000–5000 mg/kg) (Appendix A, Figure A4). The content of the chalcophilic and siderophilic elements Mo and V is relatively evenly distributed in the basins of the rivers. The content of V increases (V 100–180 mg/kg) in coastal conditions (Appendix A, Figure A5). The group of metals with similar migration properties, including Cu, Ni, Zn, Cd, Pb, and Ag, has few similarities in spatial distribution. A general decrease in their concentrations in the highlands of the Sulak River can be noted, but there are multidirectional trends in the basin of the Ulluchay River: increased concentrations of Cu, Ni, and Pb (Cu: 100–958 mg/kg; Ni: 100–300 mg/kg; Pb: 40–70 mg/kg) and decreased concentrations of Zn, Cd, and Ag (Zn: 6–50 mg/kg; Cd: 0.05–0.1 mg/kg; Ag: 0.3–0.9 mg/kg) (Appendix A, Figure A6). Al, Cr, Sc, and Te are characterized by low mobility and relatively uniform spatial distribution. The content of Cr and Te decreases insignificantly in the middle reaches of the Sulak River (Cr: 1.47–30 mg/kg; Te: 0.015–0.1 mg/kg) (Appendix A, Figure A7).
According to this study, several key features of the concentrations and spatial distribution of heavy metals and trace elements in the soils of different river basins can be distinguished:
The Ulluchay River Basin:
  • Increased concentrations of Cu, Ni, and Pb;
  • Decreased concentrations of Zn, Cd, and Ag;
  • Elevated Na and Mg concentrations in the headwaters;
  • Higher Co and Mn concentrations in coastal conditions near the river mouth.
The Sulak River Basin:
  • Decreased concentrations of As, Sb, Sn, Fe, Co, and Mn in the headwaters;
  • Increased Co and Mn concentrations in coastal conditions near the river mouth;
  • Reduced concentrations of Cu, Ni, Zn, Cd, Pb, and Ag in high mountain areas;
  • Slightly decreased Cr and Te concentrations in the middle course.
The Sunzha River Basin:
  • Elevated concentrations of Ba, Li, Cs, and Be;
  • A relatively uniform spatial distribution of Al, Cr, Sc, and Te.

3.2. Concentration Coefficient (Kk) Analysis

Analysis of the concentration of chemical elements relative to their Clarke values in the Earth’s crust allows for their ranking by their degree of redistribution.
The first group comprises chemical elements whose maximum content does not exceed the Clarke of the Earth’s crust at more than 85% of sites. Such elements include Al, Be, V, and Sb (Appendix B, Figure A8). The listed elements can be referred to as dispersed elements. For these chemical elements, at least active redistribution is noted.
Except for a few individual «hot points», the concentration coefficient of these chemical elements is below average in the lithospheric zone.
The second group is made up of chemical elements that are characterized by active redistribution and accumulation over the territory. Here, two categories are highlighted: The first is elements that, at most sites, have a concentration coefficient value in the range of 1–10. Such elements include Pb, Ca, Cr, Cr, Mn, Fe, Ni, Cu, Zn, As, Mo, and Te. They are actively redistributed and accumulated over the These elements make up the main rock-forming minerals—calcite, dolomite, and marl.
Another category may include chemical elements for which neither trend is discerned. This group includes Sc, Cs, Li, Na, Mg, Fe, Co, Ag, Cd, Sn, and Ba. These elements can both accumulate and disperse at different geochemical stops.
In estimating the accumulation and dispersion of elements relative to the crustal Clarke, the following sequences were compiled for the entirety of the territory under consideration (13):
K K = T e 10.7 >   Z n 5.70 >   N i 5.40 >   A g 4.00 >   C r 3.91 >   C u 2.75 > C d 2.00 >   A s 1.79 >   M n 1.58 >   M o 1.51 >   C a 1.41 >   P b 1.19 K p = C o 1.10 >   F e 1.34 > L i 1.35 >   S c 1.37 >   M g 1.51 >   B r 1.89 >   C s 2.12 >   V 2.62 >   A l 3.33 >   C r 3.91 >   B e 4.34 > S n 5.32 >   S b 8.10 > N a 9.27

3.3. Spatial Analysis of the Concentration Coefficient (Kk) Distribution

Analysis of potential toxic and trace element distribution in the territory of the river basins of the Northeastern Caucasus showed that Ni, Cr, Zn, Cu, Pb, Ca, Mn, As, Mo, and Te accumulation is observed in most of the studied river basins. Elevated concentration (Kk > 1) of Ni was observed at 100 sites, while Cr was observed at 93, Zn was observed at 86, and Cu was observed at 76 (Table 4).
A majority of the considered chemical elements display a tendency for accumulation, which may be associated with the complex geological composition of the territory, low rates of biological migration, and the predominance of mechanized transport.
Spatial analysis shows that concentrations of many chemical elements decrease in the sites numbering from 20–21 to 43–44, as well as from 65–66 to 73. There is a decrease in the concentration of the following chemical elements: Na, Mg, Ba, Sb, Sn, Mo, Cu, Cu, Zn, Cd, Ag, Cr, and Te. Even so, an accumulation of Fe and Cs is recorded.
The specified range of sampling sites has special geographical boundaries: the upper basin of the Ulluchay River and the southeastern part of the Sulak River Basin.
As a result, it was found that the regional landscape conditions of the studied Caucasus territory differ from the global Clarke values for the Earth’s crust. An enrichment of Te, Zn, Ni, Ag, Cr, Cu, Cd, As, Mn, Mo, and Ca and a depletion of Fe, Li, Sc, Mg, Br, Cs, V, Al, Be, Sn, Sb, and Na were identified. The concentrations of Pb and Co are close to the Clarke values.

3.4. Regional Geochemical Background

According to Yu.E. Saet [65], the geochemical background is an average value of natural variation in the content of chemical elements and is established on the territory, where “the absence of natural or anthropogenic sources of chemical elements” can be assumed with a high level of reliability.
Based on the definition, it is necessary to use natural areas for background detection. In this study, sampling was conducted at conditional natural sites, i.e., outside the sphere of local anthropogenic impact. These conditions allow for the calculation of the regional geochemical background for the territory of the Northeastern Caucasus according to the methodology described in RD 52.18.885-2019 [69]. But according to the international standard ISO 19258:2018 [58], the background concentration is determined in the most accurate format for the current study. Background concentration refers to the regional concentration of an element or substance in soils formed under the influence of natural and anthropogenic diffuse sources.
The regional background content of the investigated series of elements in the soils of the Northeastern Caucasus was revealed as a result of research and calculations and is presented in Table 5.
Based on the obtained values of the background concentrations of chemical elements in the soil, it is noteworthy that elements such as Mo, Cd, and Ag do not permit the identification of certain background values that can be taken into account in ecological and geochemical studies due to the high heterogeneity in the distribution of concentrations in the territory under consideration (when taking into account the indicators CV and Q).

3.5. Contamination Factor (Cf) Analysis

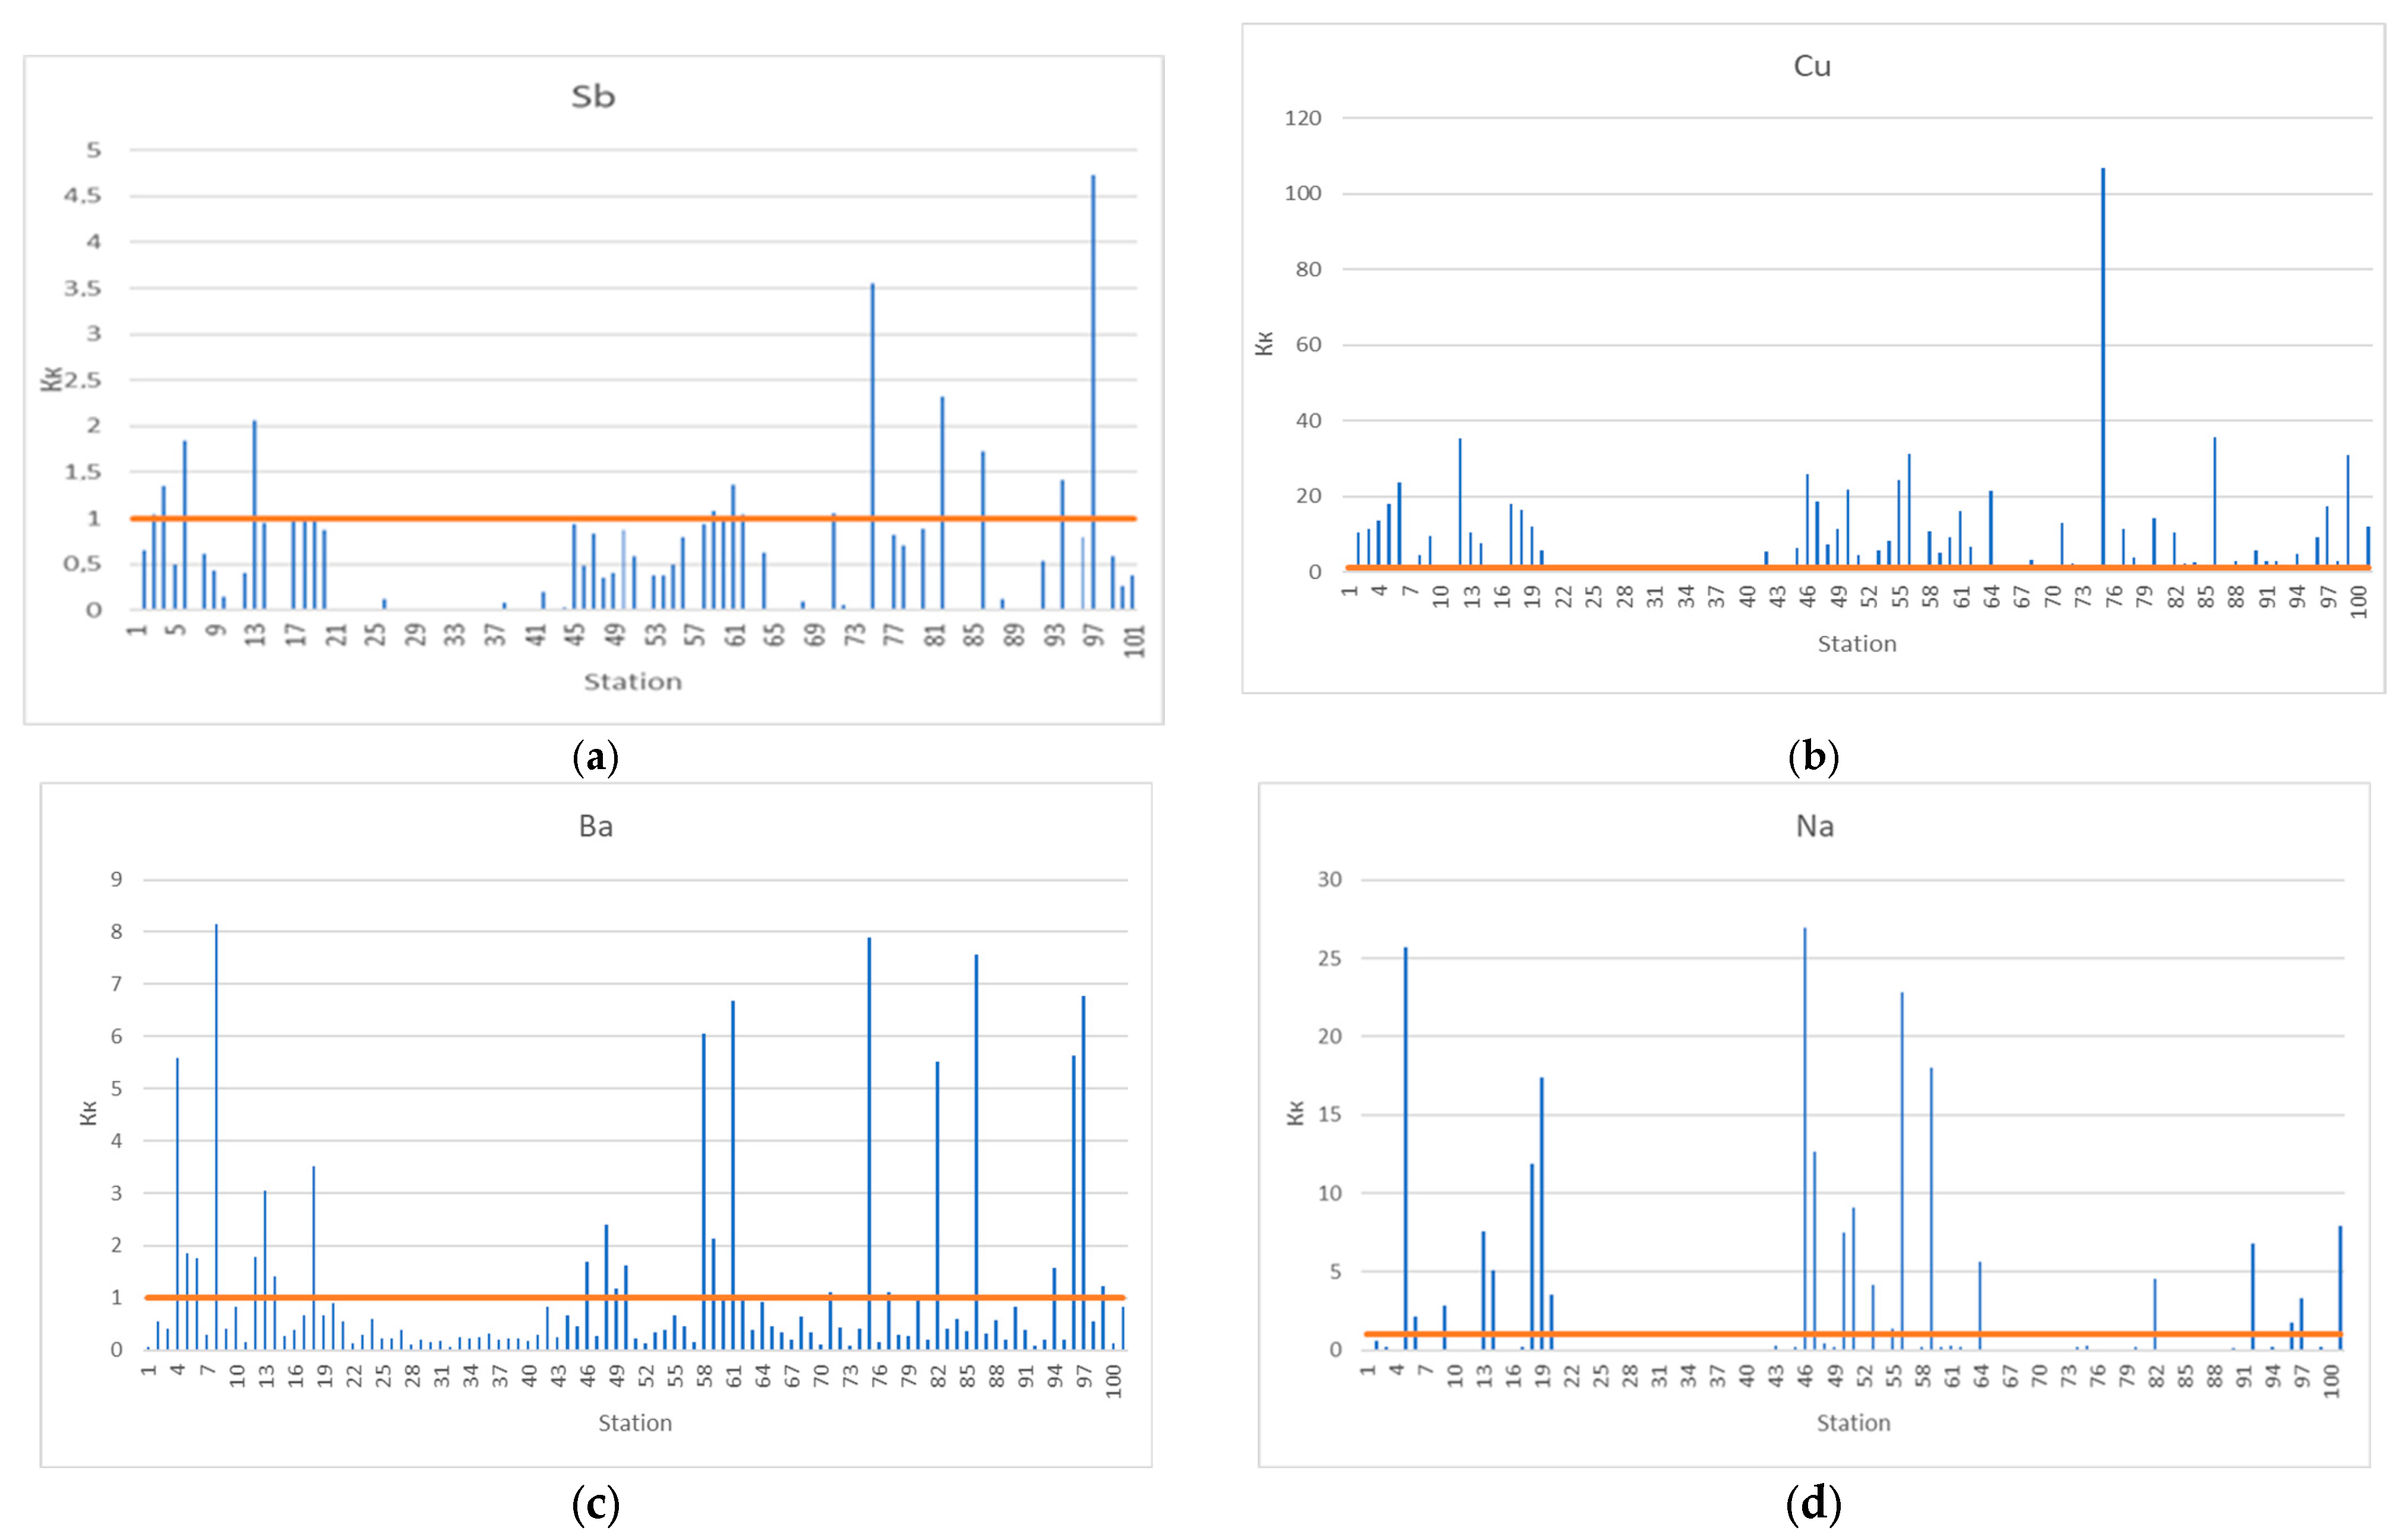
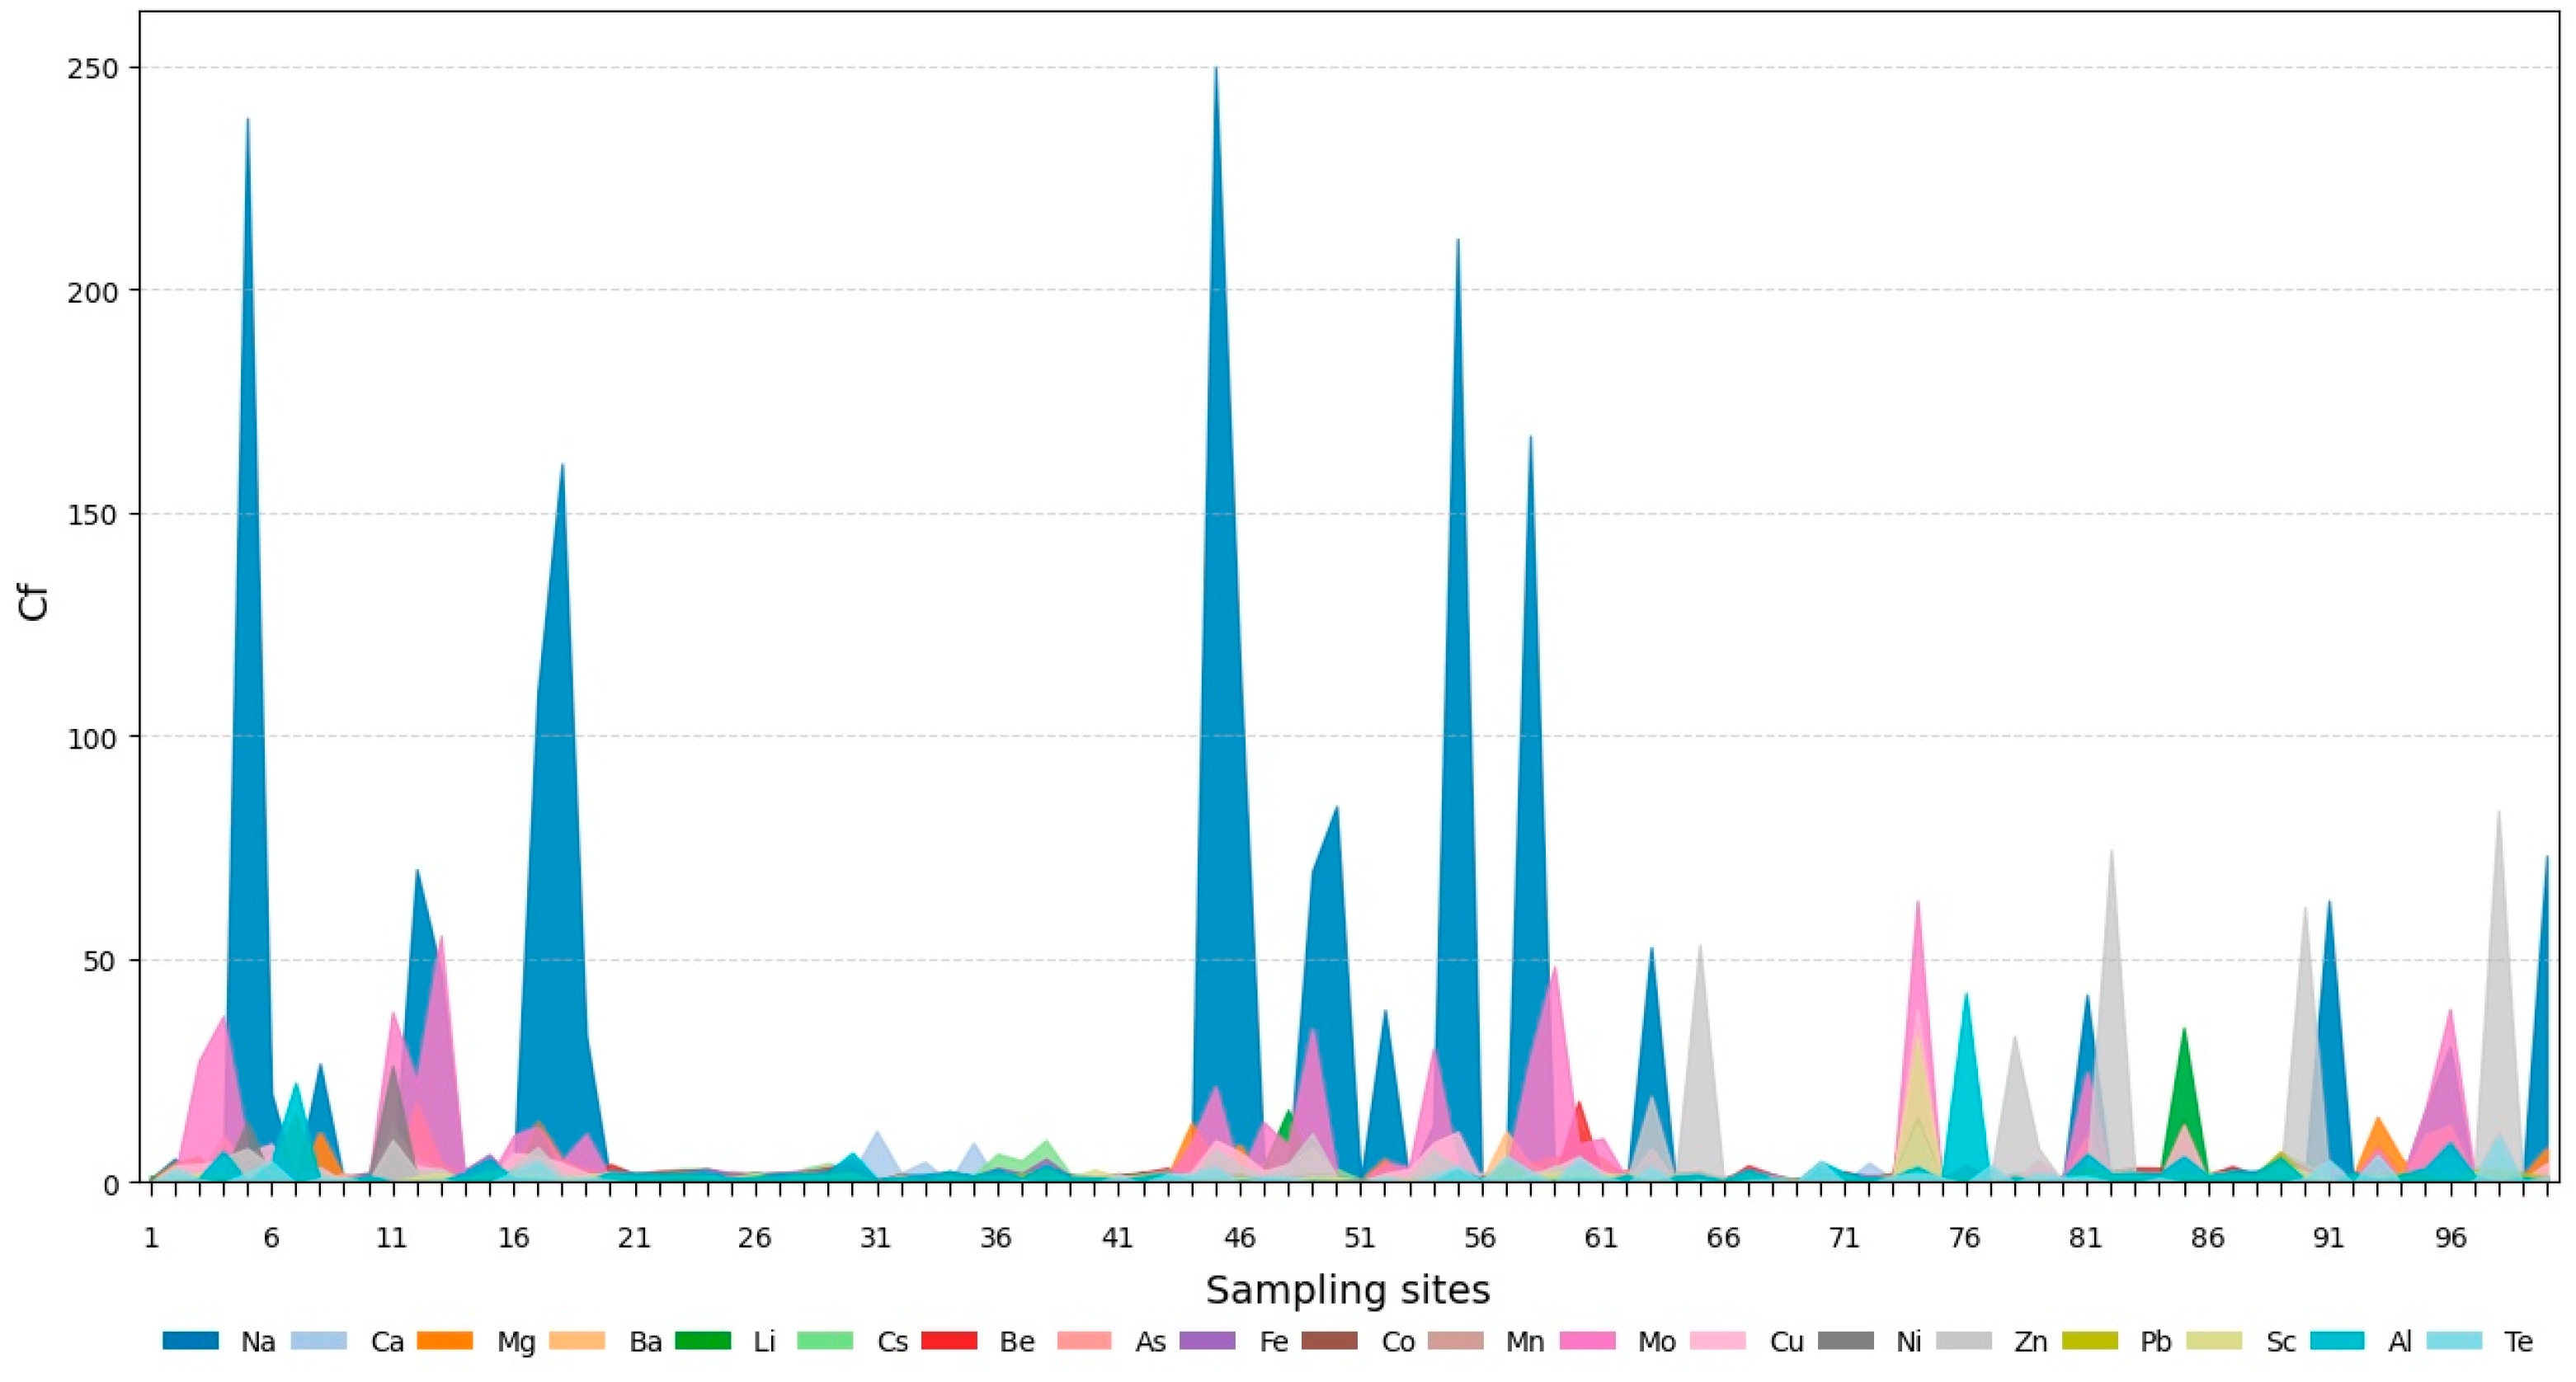
The contamination factor is a close indicator of the concentration factor but reflects the peculiarities of accumulation and dispersion of chemical elements relative to their background values in a certain territory. When considering the distribution of chemical elements in relation to regional geochemical conditions, greater homogeneity is noticeable, in contrast to their comparison to Clarke contents. About one-third of the samples for each element show an accumulation of the element, and another third indicate dispersion. Relative to the regional background, accumulation trends are noted for Na, Ca, Mg, Be, Cs, Fe, Mn, Ni, Pb, Sc, and Al. The tendencies toward dispersion relative to the regional background are shown by Ba and Cu (Figure 4).
The graph shows that the zones of accumulation and the zones of dispersion of the investigated chemical elements stand out. Two stable zones of chemical element accumulation are allocated from 1 to 19 and from 44 to 65 sampling sites. The area from 20 to 43 and from 66 to 73 sampling sites belongs to the zone of chemical element dispersion. On the sampling sites from 74 to 100, most elements are accumulated, but less intensively.
The calculated concentration factors reflect accumulation trends in the upper soil horizons of the Northeastern Caucasus river basins for most of the analyzed chemical elements (Na, Mg, Ni, Zn, Cu, Cr, As, Ca, Te, Mo, Ag, Cd, Mn) and the dispersion of elements such as Al, Be, Sc, V, Sb, Li, Co, Fe, and Cs. Low values of the accumulation factor Cf show that the accumulation of chemical elements is due to regional natural processes. High and extremely high levels of geoaccumulation are noted for Na, Mo, and Zn.

3.6. Enrichment Factor (EF) Analysis

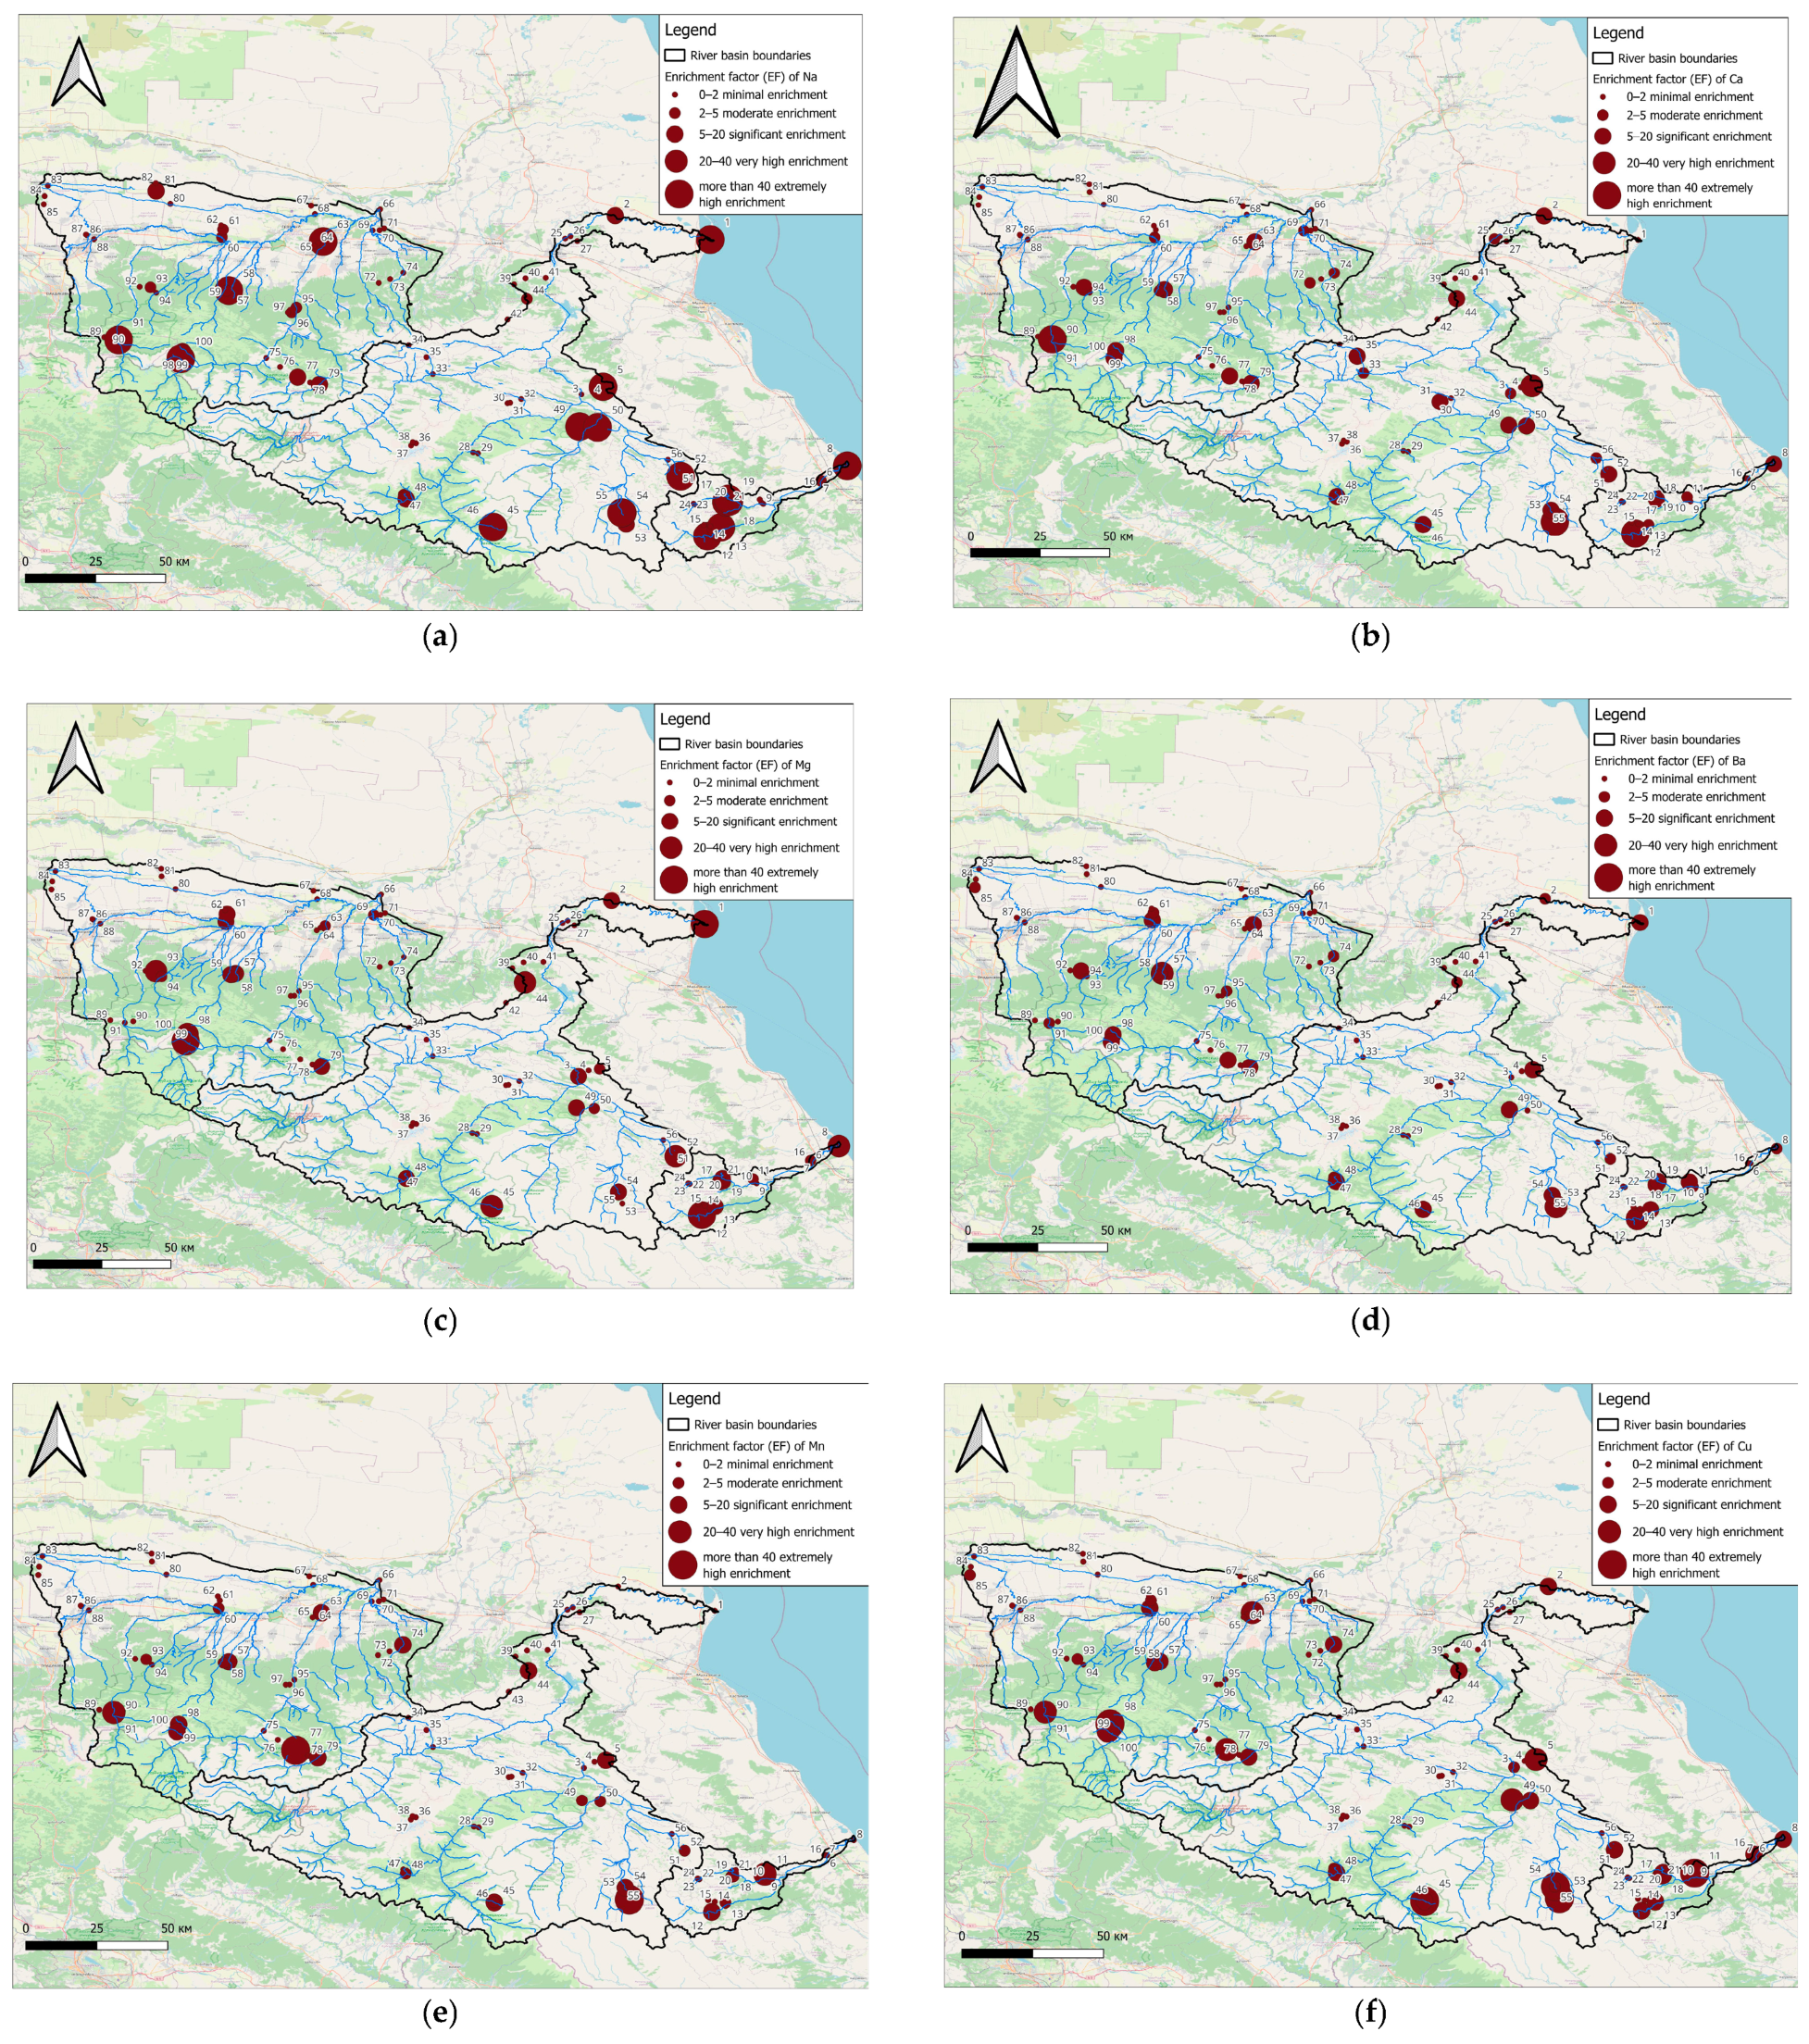
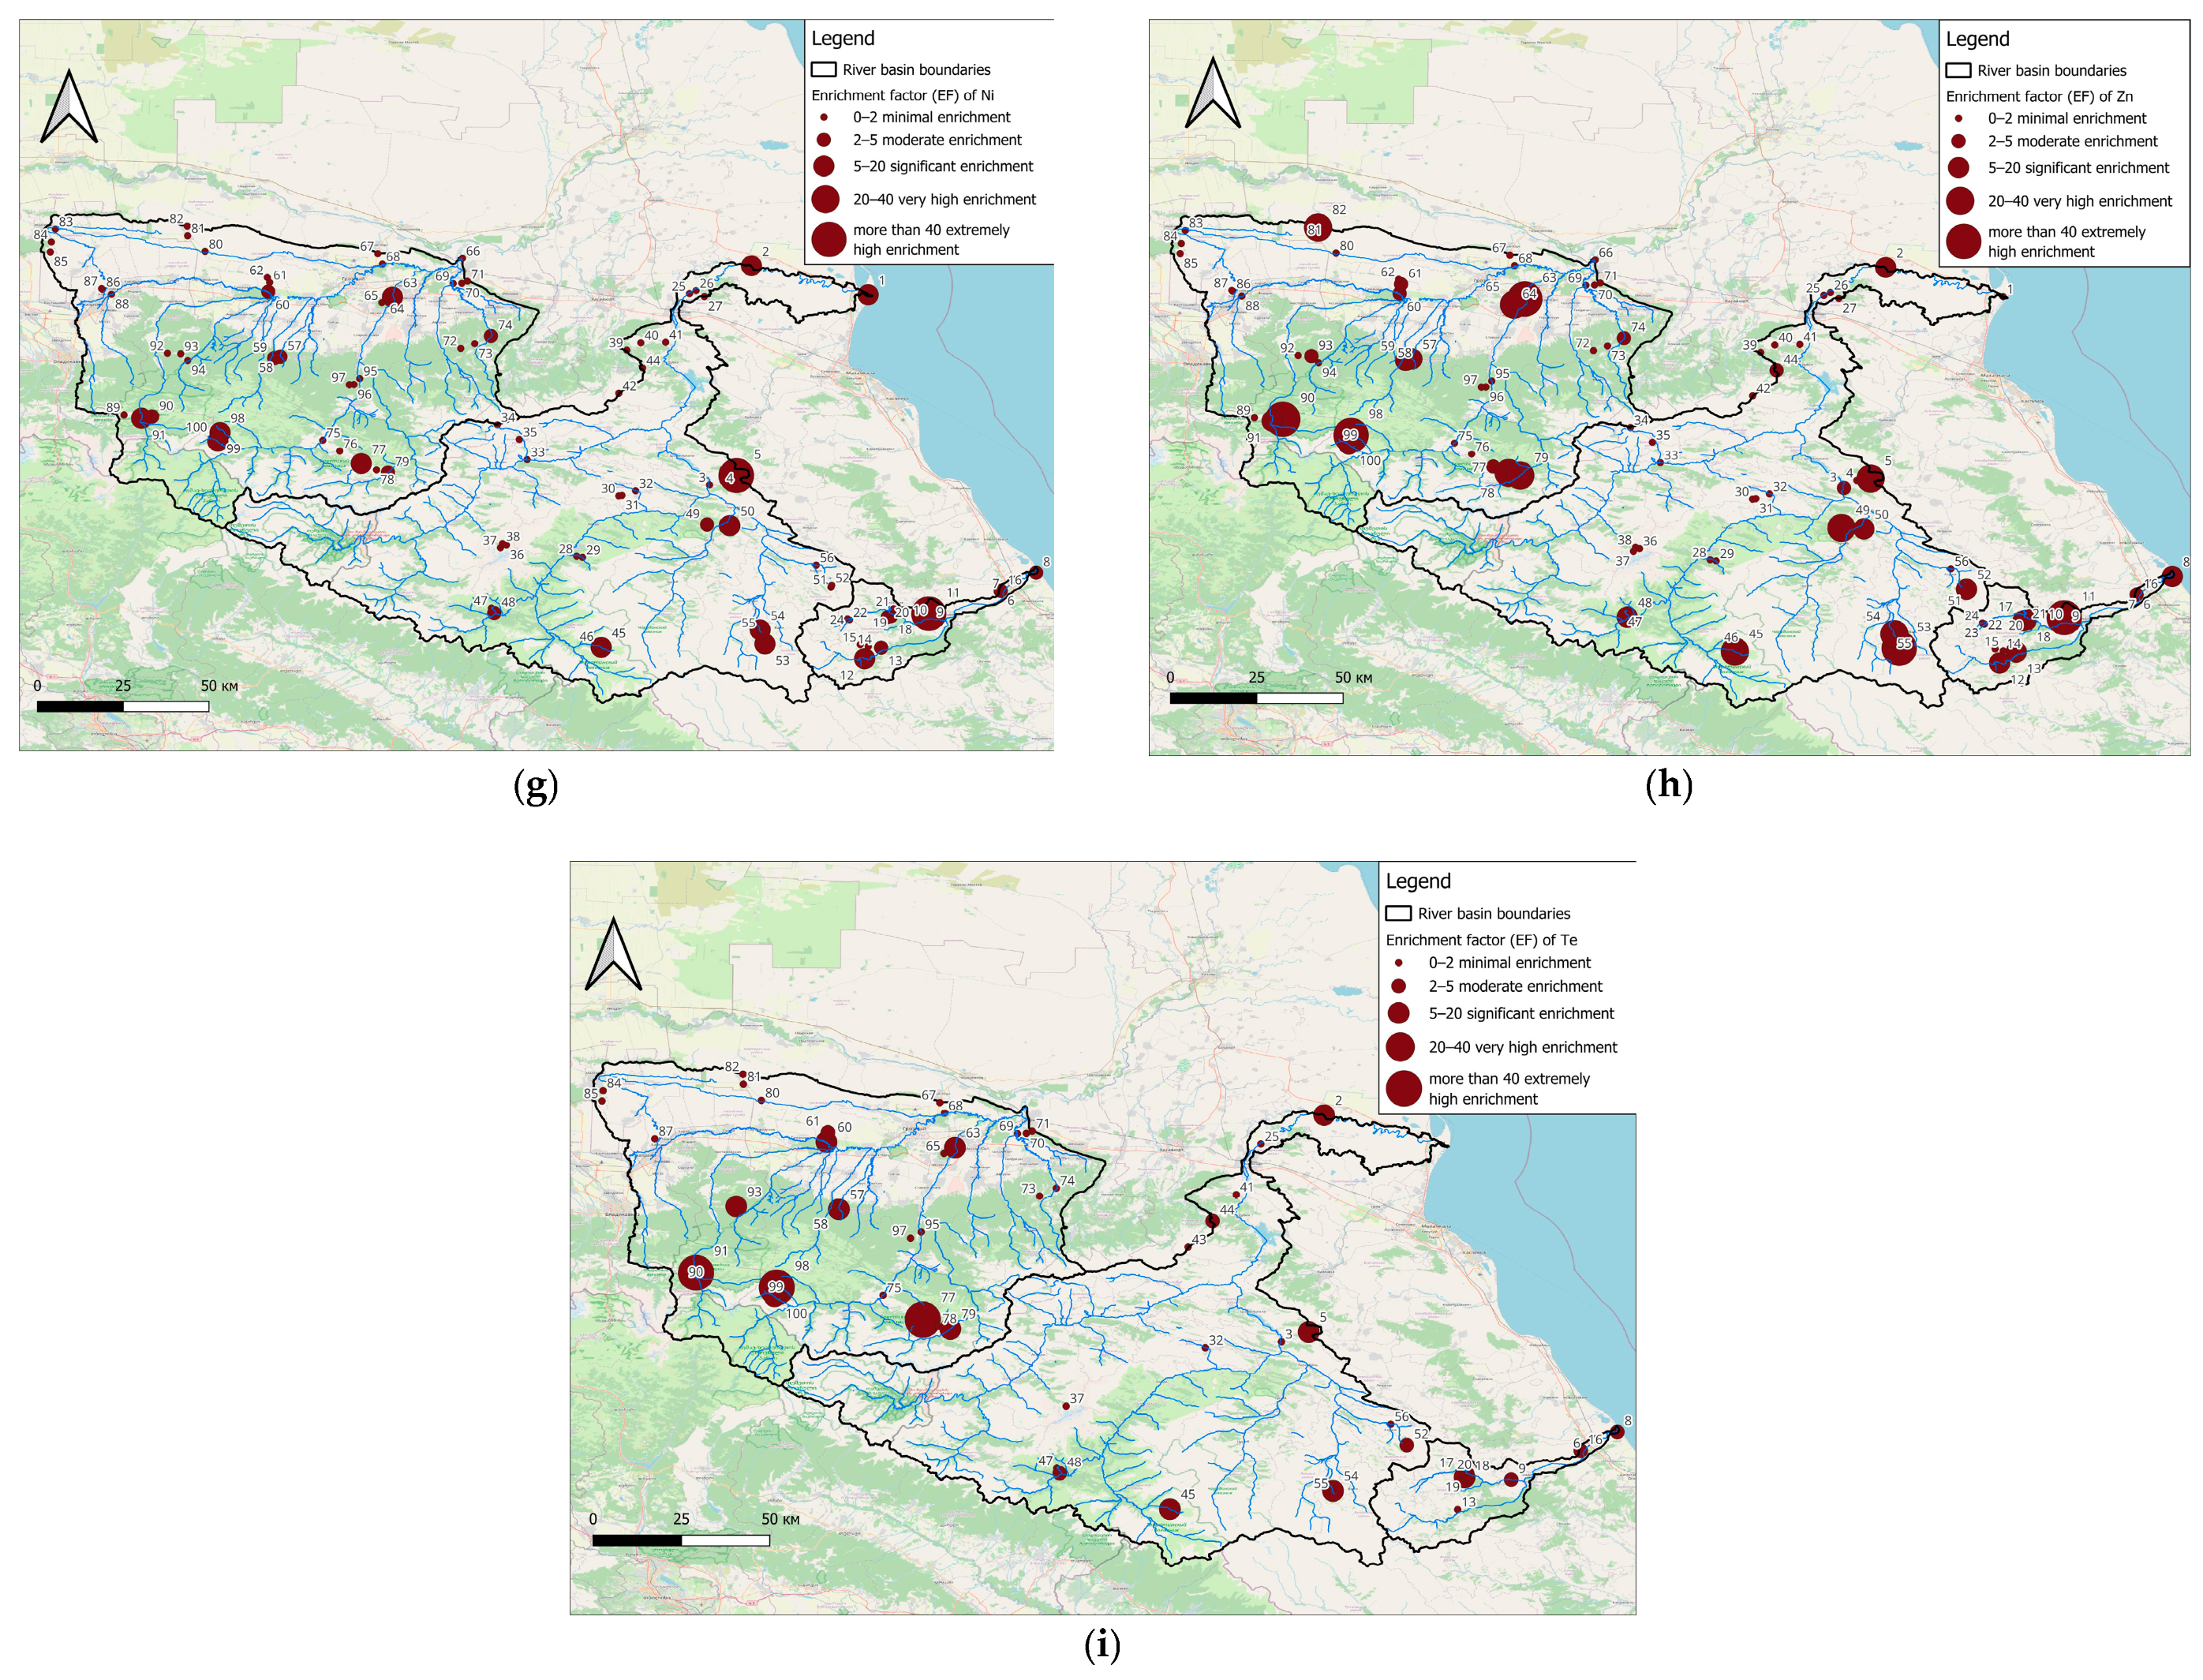
The results of the enrichment factor calculation indicate the total accumulation of Na, Ca, Mg, Ba, Mn, Cu, Ni, Zn, and Te (Figure 5). The highest accumulation rates are noted for Na, the accumulation of which reaches a factor of more than 1500. Na is a part of many rocks of sedimentary origin.
Accumulation processes prevail in the coastal plain part of the Northeastern Caucasus, in the upper part of the Ulluchay River, in the eastern part of the Sulak River Basin, and in the upper part of the Sunzha River Basin. Accumulation peculiarities are noted for each chemical element (Appendix C, Figure A9). The accumulation of Na and Mg in the coastal, periodically flooded zone is related to the high content of these elements in sea salt. Ca accumulates more in sedimentary rocks of the foothills, and Mn, Mo, Cu, Ni, Zn, and Te accumulate more in igneous rocks of the highlands.

3.7. Geoaccumulation Index (Igeo) Analysis

The most sensitive indicator, the geoaccumulation index, indicates an extremely low level of anthropogenic contribution of chemical elements. More than two-thirds of the samples are categorized as uncontaminated and at moderate levels. High and extremely high levels of geoaccumulation were noted for Na and Zn, with a significant accumulation of Na (Figure 6).

3.8. Modified Contamination Factor (mCf) Analysis

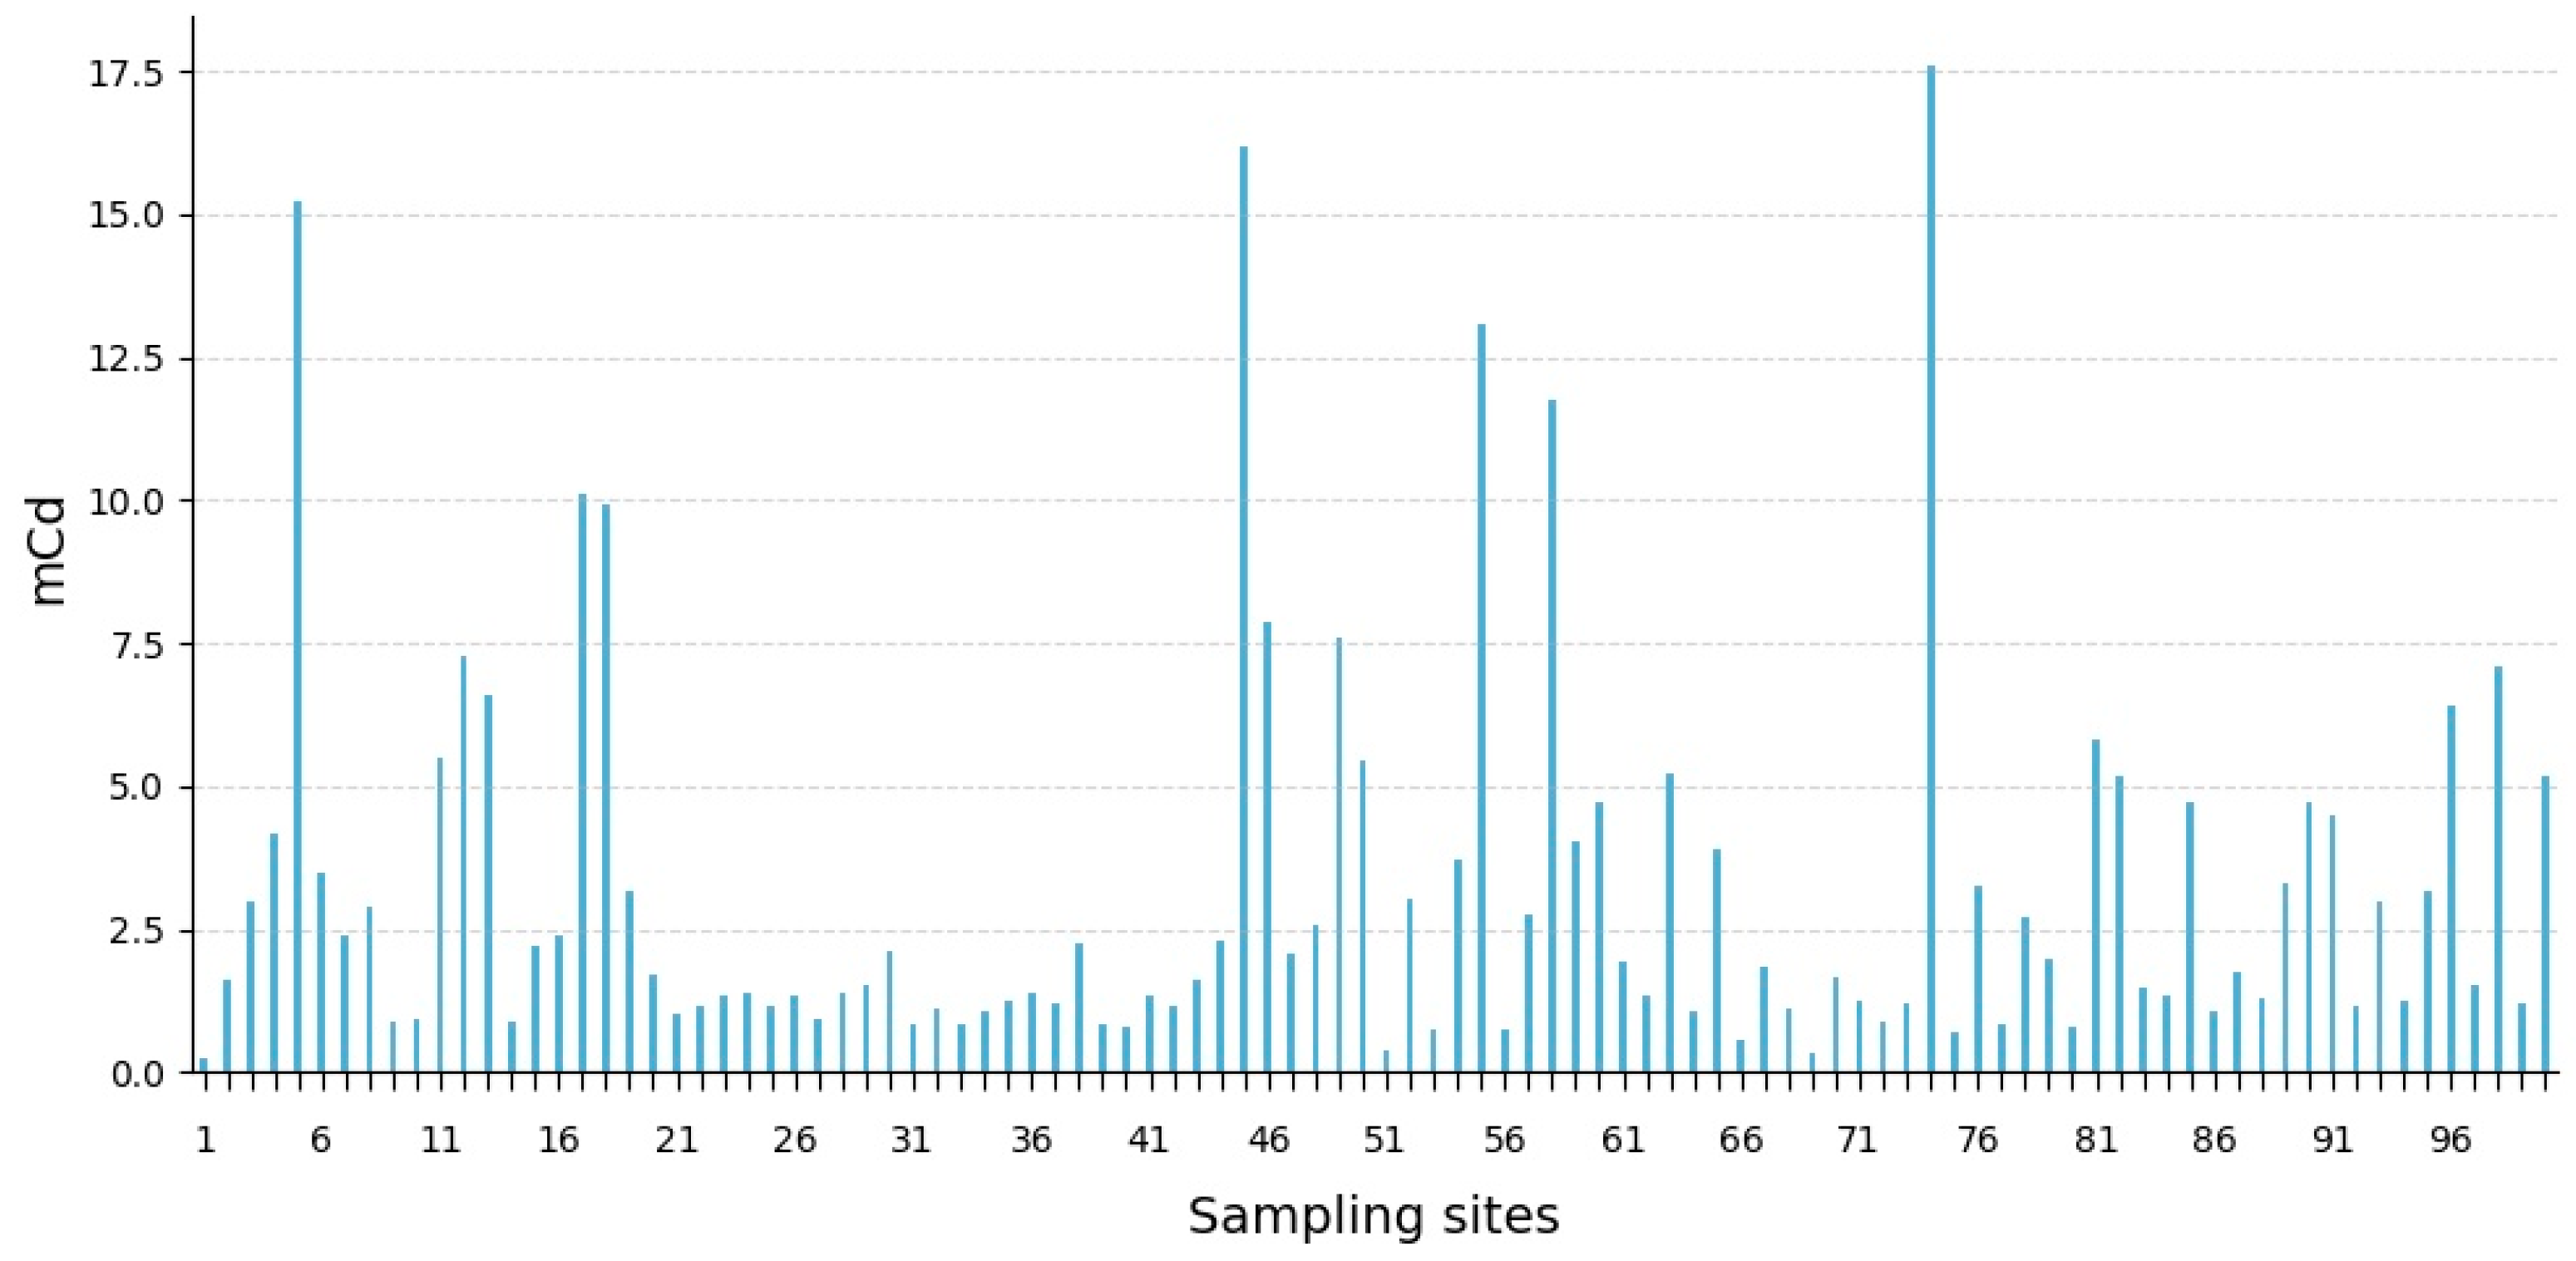
The modified accumulation factor is an integral indicator displaying the general processes of accumulation and dispersion in separate points of space. The dispersion zones from 20 to 43 and from 66 to 73 points are also clearly distinguished by the totality of chemical elements considered. The accumulation zones cover the areas from 3 to 19 and from 44 to 59 (Figure 7).
From 20 to 44 points, the dispersion and drift of chemical elements prevail. Territorially, areas with low mCf values are confined to the basins of Sulak River tributaries—Avar Koisu and Andi Koisu.
The modified accumulation factor showed areas with a high content of chemical elements: the lower reaches of the Ulluchay River, the eastern part of the Sulak River Basin, and the basin of the Sunzha River.
Extremely high accumulation was noted at two sites: the first site is on the slope of the Sunzha River Basin at the boundary of three geological formations (№ 74), which determines the diversity of lithological conditions. The second site (№ 46) is located on the slope of the Budlushtser Ridge in the valley of the Pedjiasab River in the Tlyaratinsk reserve at the head of the Avar Koisu River. The underlying rocks are mudstones characterized by high sorption properties.
Low aggregate chemical content is recorded in the middle reaches of the Sulak River and its inflow basins—Avar Koisu and Andi Koisu.

3.9. Pollution Load Index (PLI) Analysis

The pollution load index shows the average and low content of chemical elements in the upper soil horizons of the study area (Figure 8).
Only seven points can be classified as strongly polluted areas (PLI > 2): one in the basin of the Ulluchay River, one in the basin of the Sulak River, and five in the basin of the Sunzha River. A moderate pollution index was found for more than half of the samples collected at the Sunzha River Basin. The Sunzha River Basin is characterized by intensive historical and modern economic development. The Ulluchay River Basin is also developed, which dictates the high and very high levels of chemical elements in its lower and middle reaches. In the Sulak River Basin, high and very high levels of chemical element content are recorded in its middle reaches, including near highways and populated areas.

3.10. Total Pollution Index (Zc) Analysis

For 26 out of 100 sampled sites, no exceedances of the total pollution index were detected (Zc < 16) (Table 6). At 20 sites, the chemical element content was at the average level. At 26 sites, the concentration of chemical elements can be defined as high. A very high concentration of chemical elements was noted at 29 sites (Figure 9).
The Sunzha River Basin is characterized by high values of the total pollution index: high and very high values were recorded for more than half of the samples taken. The Sunzha River Basin is characterized by intensive historical and modern economic development—there are settlements, a dense network of highways, and agricultural developments in relatively elevated areas of the valley.
The river basin of the Ulluchay is also developed, which determines the high and very high levels of chemical element content in its lower and middle reaches.
On the territory of the Sulak River Basin, high and very high indicators of chemical elements content were recorded in the middle reaches, including near highways and settlements.
At the same time, all river basins are characterized by complex geological structures and active processes of material transport.

3.11. Identification of Geochemical Regional Anomalies

When distinguishing anomalies from the standpoint of exceeding the mean value by the size of two standard deviations, the number of areas with very high values is reduced in comparison with the use of the total pollution factor. The difference in values indicates a general increase in the content of chemical elements in natural conditions.
Lognormal distribution of values was revealed for 10 chemical elements—Li, Be, Na, Mg, Al, Ca, Sc, Mn, Fe, Co, Ni, Cu, Zn, As, Pb, Te, Cs, and Ba—of which, anomalous values were noted for seven chemical elements (Ba, Na, Zn, Ag, Li, Sc, As) (Figure 10). For such chemical elements as Be, Mg, Al, Mn, Fe, Co, Ni, Cu, Pb, Te, and Cs, anomalous soil content was not found.
Sodium (Na). A sodium (Na) anomaly in soils was identified in the area of the Arkani River, a right tributary of the Sulak. This area is located in the upper part of the basin, indicating a low likelihood of anthropogenic Na input.
Barium (Ba). Ba is characterized by high anomalies, with values above two standard deviations in four areas. Anomalous concentrations of Ba were in the vicinity of the Arakani village in the basin of the Sulak River (a tributary of the Kara-Koisu River), as well as in the foothill areas of the Sunzha River Basin. Ba anomalies are associated with its low mobility in alkaline environments (Table 5).
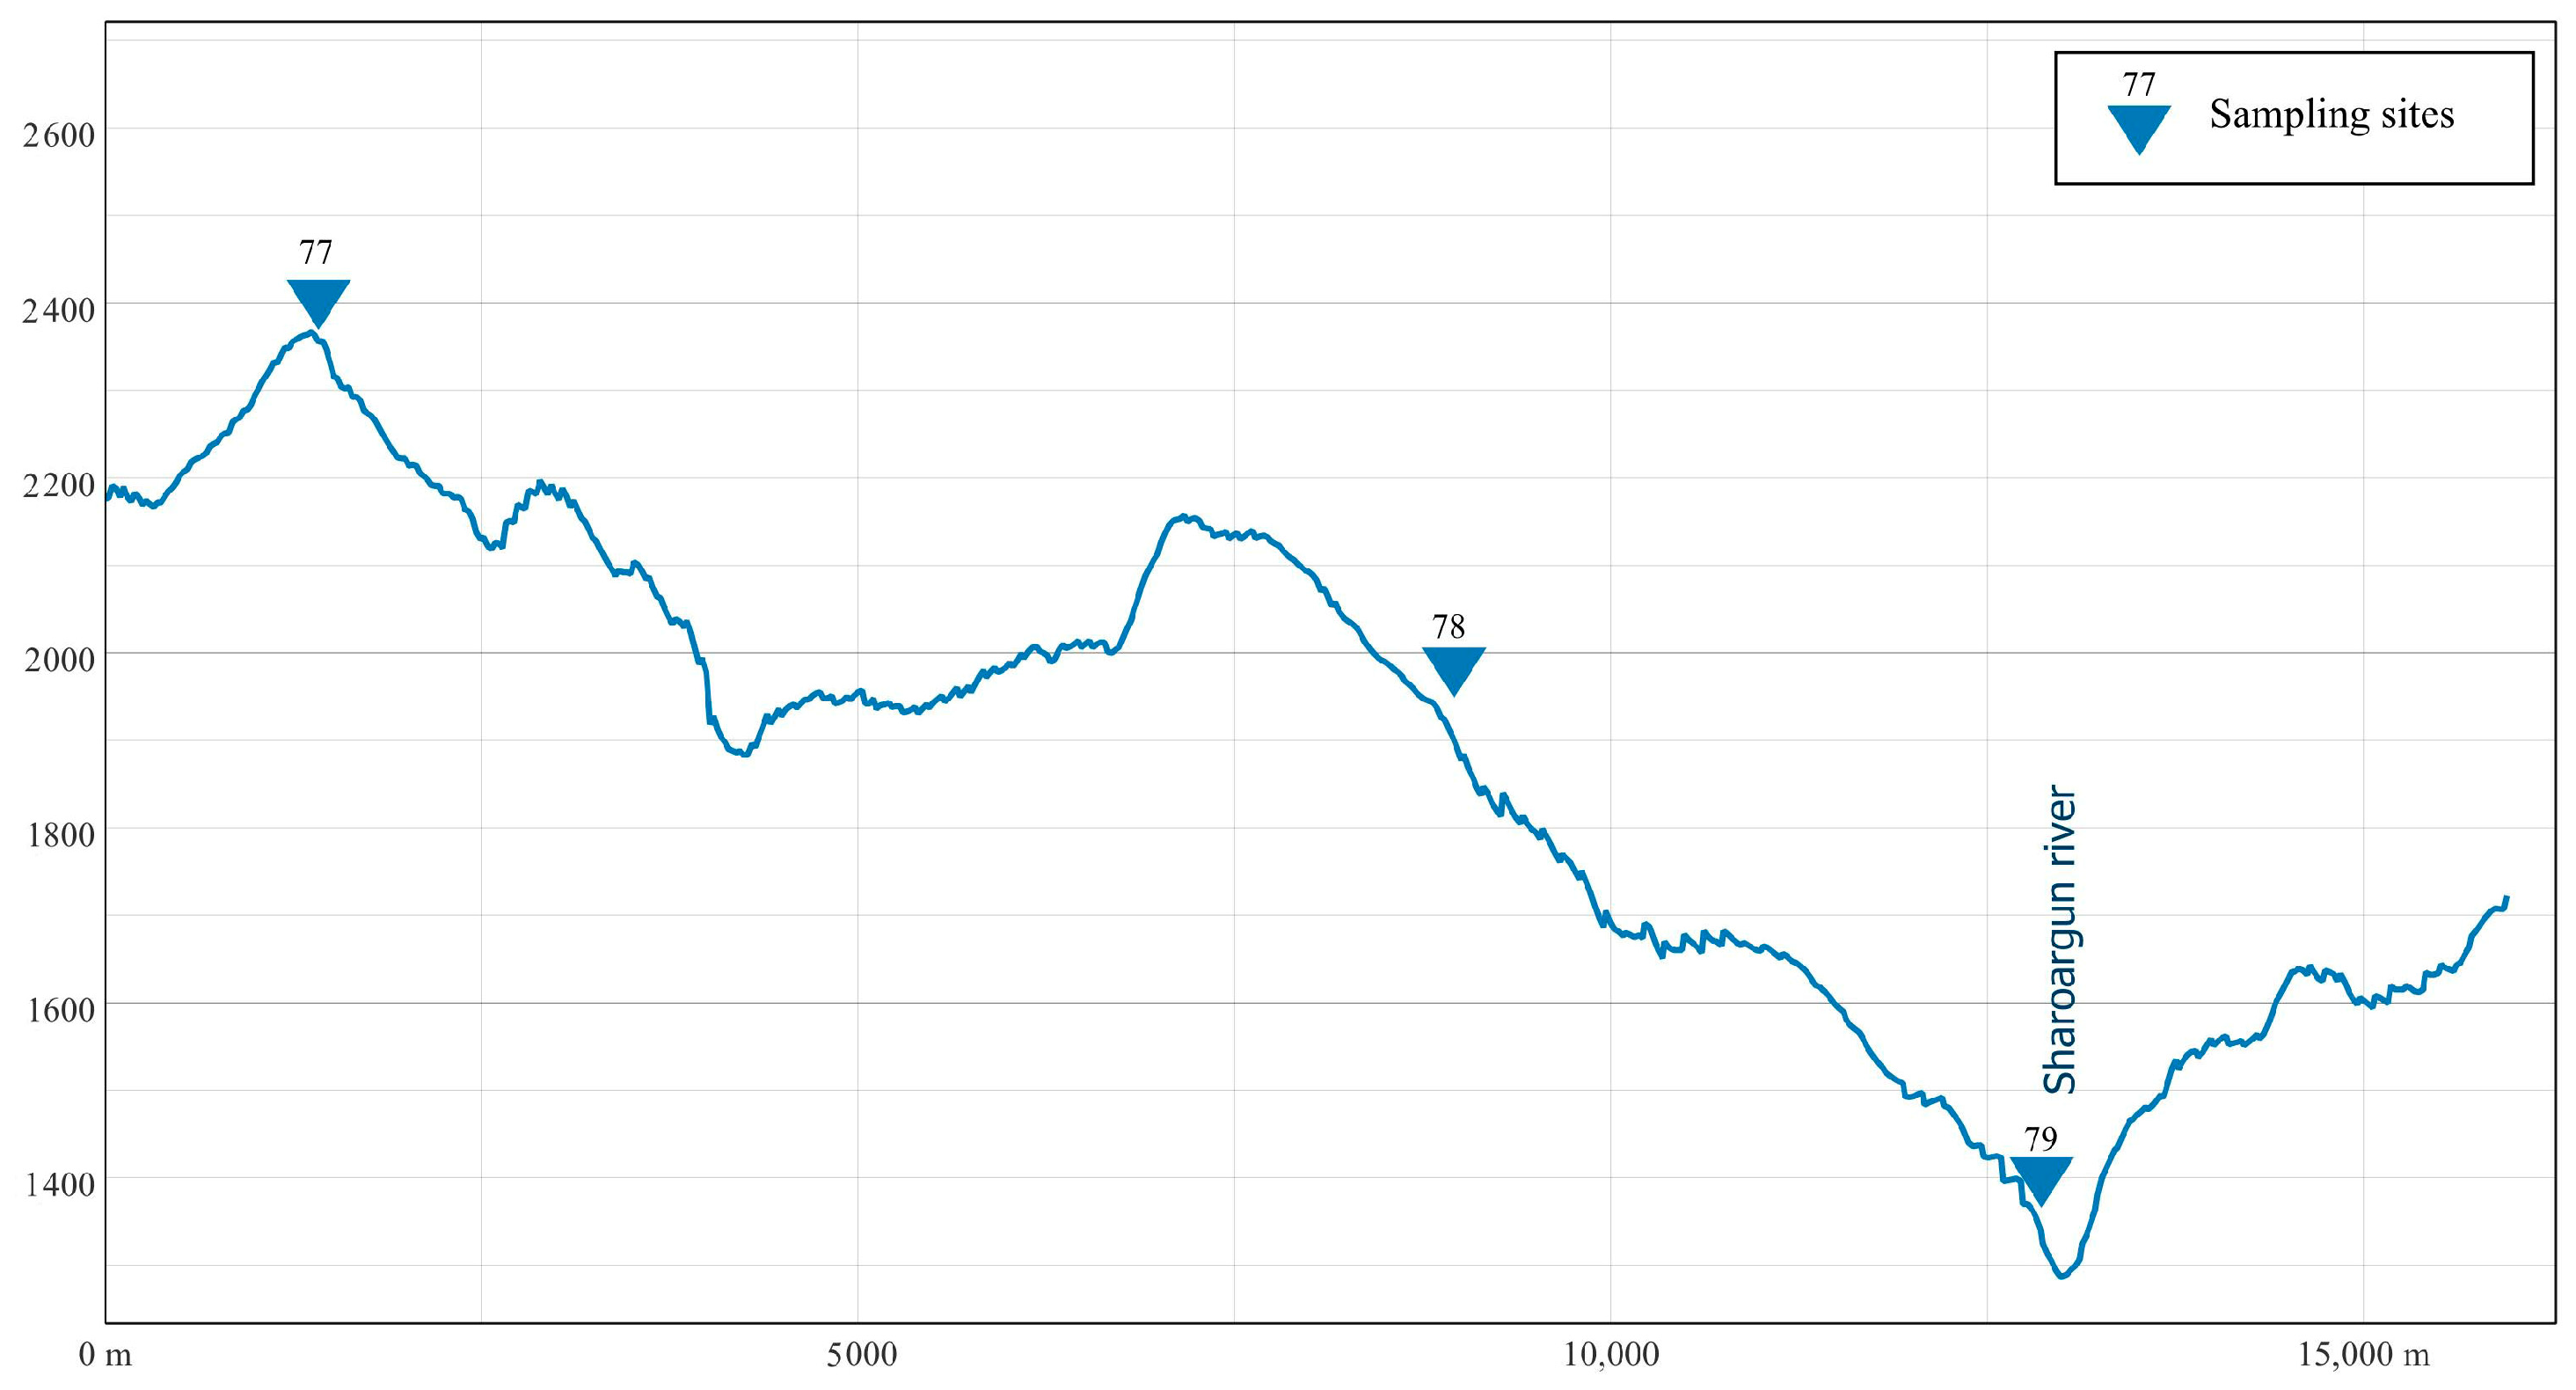
Zinc (Zn). Zn anomalies were identified at two sites within the Sunzha River Basin: in the upper reaches along the Sharoargun tributary and in the lower basin near the city of Grozny (population ~400,000). Zinc is considered a priority pollutant for Grozny, primarily due to the development of oil and gas deposits and the operation of oil refineries [76,77]. In the Sharoargun valley, deposits of galena and sphalerite of industrial importance are known [49,78]. Elevated Zn concentrations in soils are therefore associated with mineral deposits.
Silver (Ag). Ag anomalies were observed in the lower reaches of the Sunzha River in the lowland part of the valley. Lead deposits adjacent to the Sunzha River Basin contain varying amounts of Ag [50].
Lithium (Li), arsenic (As), and scandium (Sc) show anomalous values at one site, which is located in the Sunzha River Basins in the upper part of the river valley. The area is characterized by a heterogeneous lithological structure of Jurassic age: mudstones, siltstones, and sandstones, containing siderite concretions and lenses of biogenic limestones (J1–2 cr–kr); sandstones with rounded pebbles; mudstones and siltstones with sandstone interbeds; concretions of clayey siderites; marl; calcareous nodules; and cherty limestones (J2 ah). Geochemical barriers are associated with the change of lithologic conditions [50].

3.12. Spatial Analysis of Anomalies

The spatial analysis showed that anomalous content of one to two chemical elements was detected in soils at 10 sites (Table 7). When considering the anomalies of different chemical elements together, it is possible to identify river basins with a high element content.
A total of 8 of 10 the sites with anomalous chemical element content are located in the basin of the Sunzha River, which coincides with the analysis of the distribution of the total pollution index (Zc) and the modified contamination factor (mCf). Anomalous values in the Sunzha River Basin are noted for seven chemical elements.
Sulak River Basin. Two sites with anomalous chemical element concentrations were identified within the Sulak River Basin. Elevated levels were observed for two elements there.

3.13. Comparative Analysis of Different Geochemical Indices

The use of various geochemical indices highlights different aspects of the formation of geochemical anomalies in the river basins of the Northeastern Caucasus.
The concentration coefficient (Kk) revealed general trends in the accumulation and dispersion of elements relative to global background levels. In the river basins of the Northeastern Caucasus, Pb, Ca, Cr, Mn, Fe, Ni, Cu, Zn, As, Mo, and Te were found to have accumulated. Based on the contamination factor (Cf) calculated relative to the regional background, accumulation trends were identified for Na, Ca, Mg, Be, Cs, Fe, Mn, Ni, Pb, Sc, and Al. The contamination factor (Cf) corroborates the results of the concentration coefficient (Kk) for five elements: Pb, Ca, Mn, Fe, and Ni. However, both Cf and Kk provide only a partial representation of regional geochemical anomalies, as they capture only three out of eight elements exhibiting anomalous concentrations (Table 5).
The enrichment factor (EF) and the more sensitive geoaccumulation index (Igeo) enabled the differentiation between natural and anthropogenic contributions and facilitated the identification of anthropogenic inputs of chemical elements into soils. EF calculations indicate the accumulation of Na, Ca, Mg, Ba, Mn, Cu, Ni, Zn, and Te in the river basins of the Northeastern Caucasus. Low Igeo values indicate a limited influence of anthropogenic activities on elemental accumulation, although Igeo highlights anthropogenic enrichment of Na and Zn.
Areas dominated by accumulation and dispersion processes of the combined elements were identified using the modified contamination factor (mCf). For example, clear dispersion zones are observed in the lower reaches of the Ulluchay and Sulak rivers, as well as in the basins of the Sulak River tributaries—the Avar Koisu and the Andi Koisu.
Trends revealed by mCf are similar to those of Zc, but mCf only weakly reflects geochemical anomalies of individual elements.
The integrated indices PLI and Zc capture the cumulative effect of contamination by all analyzed chemical elements. The results of both indices are closely aligned, showing a high correlation (r = 0.7).
Thus, the applied indices complement each other in the analysis of soil geochemical characteristics. For the identification of geochemical anomalies in the river basins of the Northeastern Caucasus, composite indices are more appropriate, particularly the modified contamination factor (closely corresponding to Zc) and PLI. In contrast, indices reflecting the accumulation and distribution of individual elements offer only a limited indication of soil geochemical anomalies. Their applicability in the region is restricted, although they remain feasible for Pb, Ni, and Mn.

4. Discussion

4.1. Analysis of Element Contents and Their Anomalies

There is a very high variation in the chemical element content in the upper soil horizons of the river basins of the Northeastern Caucasus.
Na, Ca, and Mg belong to mobile cationic elements, lithophilic water migrants with constant valence.
Na and Mg are salt-forming elements, the distribution of which is influenced by climatic factors and hydrogeochemical processes [79]. The elements are accumulated in water in the arid conditions of the Dagestan plain as a result of evaporative concentration and the accumulation of salt and gypsum.
Mg and Na contents relative to Clarke values and regional background show similar trends: increased concentrations in the lower parts of the Ulluchay and Sulak rivers, the middle reaches of the Sulak River between Kizilyurt and Urus-Martan, and the highlands of the Sunzha River Basin. In the upper reaches of the Ulluchay River and the northeastern part of the Sulak River, concentrations of Na and Mg relative to the Clarke and regional background decrease sharply. In the coastal strip of the Caspian Sea, the increased content of Na and Mg is caused by the influence of sea salt. The salinization of soils formed on terrigenous–carbonate deposits of the Dagestan plain increases when moving from upper hypsometric levels to lower ones along the landscape–geochemical catena with increasing salinization [48,80]. This trend is consistent with studies of geochemical patterns in the soil profile above mineralized bedrock, where it is shown that Na and Mg concentrations decrease with increasing distance from the source, reflecting the migration of elements through the soil [81,82]. At high values of the enrichment factor (EF), their content is within the regional background, which is also confirmed by low values of the contamination factor (Cf).
In the anomalous zone, Na concentrations in the topsoil horizon are an order of magnitude higher than in the underlying soil horizons: 306,600.70 mg/kg (Ad 0–5 cm), 38,919.15 mg/kg (AC 5–17 cm), and 6423.01 mg/kg (C 17–42 cm). This distribution may reflect local anthropogenic contamination. Approximately 100 m upslope are currently cultivated areas, including pastures and abandoned agricultural terraces. The elevated Na concentrations may be linked to the prolonged application of fertilizers, such as sodium nitrate.
Ca is present in landscapes with a living substance in elevated concentrations in waters with a calcium composition. It accumulates in arid landscapes, and it is rich in the soils of steppes and deserts. In most of the studied territory, the Ca content is higher than its Clarke value in the lithosphere and higher than the regional background. High concentrations of Ca are due to the historical formation of the area—an accumulation of sediment of marine origin with a high content of calcium carbonate.
The weak cationic elements of lithophilic water migrants are Ba, Li, Cs, and Be.
Ba is unevenly distributed across the territory, with accumulation zones in the south-eastern part of the Sulak River Basin and the upper part of the Ulluchay River Basin, and dispersion in the middle reaches of the Sulak River. For the area of the Sunzha River Basin, the general distribution patterns of Ba are not noted. However, Ba forms four regions with abnormal concentration. All Ba anomalies are confined to mountainous areas: the slopes of the Lesisty, Sunzhensky, and Gimrinsky Ridges. On the slope of the Gimrinsky Ridge, Ba accumulates in alluvial meadow carbonate light loamy soils, whose profiles are enriched in this element. The soil-forming material is weathered calcareous deluvium. In the Sunzha River Basin, all Ba anomalies were recorded in soils developed on carbonate bedrock (limestones).
Anomalies of Ba are associated with alkaline conditions and pH values above 7.5. Ba activity is higher in humid landscapes with hydrocarbonate waters compared to arid conditions with sulphate waters. It accumulates with living matter and settles on sorption and sulphate barriers. Ba precipitates on carbonates under acidic and mildly acidic water conditions. High Ba concentrations coincide with gypsum–carbonate horizons, which serve as geochemical barriers for barium [83]. Elevated Ba content is associated with soil salinity in trans-accumulative positions and the sulfate content of soil solutions, promoting its precipitation as barite [48].
The sources of Li in the landscape can be very diverse. For example, research in Guizhou Province has revealed significant lithium enrichment in the clay rocks of the Lianshan Formation. Li2O content reached 0.3%, which is related to the weathering of the limestone in warm and humid climates, as well as to the accumulation of kaolinite (up to 93%) in deposits. Additional study in the region confirmed that lithium enrichment is associated with the dolomites of the Lowhangguan Formation and that lithium is associated with clay minerals [66]. In the Mufushan (South China) area, Li anomalies are associated with the granite inductions of the Mufushan complex [84,85]. In the salt plain of Olaro (Central Andes, Argentina), Li concentrates due to the evaporation of brine, and sources of lithium are the weathering of volcanic rocks and hydrothermal activity [86,87]. The diversity of lithology and complexity of the history of geological development of the territory determine the possibility of finding Li in the basins of rivers of the Northeast Caucasus of different origin: in argillaceous rocks of the foothills, in deposits of the highlands, and in the evaporation of salt deposits on the plains. Li forms one anomaly, which is represented in the Sunzha River Basin.
Cs content does not have a general trend—areas with Clarke exceedance and significant reduction of concentration compared to the average content in the lithosphere are identified. Cs refers to scattered elements of the lithosphere. Anomalies of Cs content have not been detected, but an area of elevated concentrations (up to 4.5 from the Clarke, 21.8 mg/kg) has been identified in the basins of the tributaries of the Sulak River—the Avar Koisu and the Andi Koisu. Sorption and accumulation of Cs may be related to the dispersal of clay minerals across the territory. The soil-forming rocks of Dagestan limestone are enriched in Cs. The limited influence of biogenic processes on the formation of loose deposits increases the role of mechanical weathering of rocks and their subsequent migration [48]. The Cs scattering zone is located in the lower Sulak and Ulluchay Rivers.
Be is scattered relative to the Clarke in the studied territory, but it exceeds the regional background content several times over. The element is widely found in soil, but at a low level [88,89]. A study of the behavior of Be under different environmental conditions showed that sorption and desorption of Be depend on pH, temperature, and the presence of competing ions [90]. Very high Be anomalies are due to geogenic sources and volcanic activity, shown by example in the Campania region (Italy), where Be concentrations reach 80 mg/kg [88,91]. In the study area, sampling sites with Be concentrations of up to 18.76 mg/kg were observed, which does not represent an exceptionally high concentration. It should be noted that the high Be contamination coincides with the Ba anomalies. Solubility and mobility of Be are increased in an alkaline medium at a higher pH due to the formation of soluble complexes with hydroxide ions [92]. Be refers to the elements of soda migration. From aqueous solutions, the element is precipitated by the sorption of clays and iron hydroxides.
As, Sb, and Sn are characterized as weak-moving anionic elements, lithophilic water migrants.
The content of As in soils is often higher than the Clarke and higher than the regional background, which is related to its ability to be absorbed by silts, clays, and organic matter. However, As concentrations in the soils of the Northeastern Caucasus are lower than the global average, which is 19.1 mg/kg [93]. The element often settles on carbonate geochemical barriers. There is a slightly reduced (to Cf = 0.5) content of As in the coastal zone in the basin of the inflow of the Sulak River—the river Kara-Koisu. Geologically, the zone is composed of dense Upper and Middle Jurassic igneous rocks. Anthropogenic sources of As include agriculture and forestry, where arsenic compounds are applied as pesticides.
Sb and Sn are distinguished by their very low presence, often below the sensitivity level of chemical–analytical equipment.
The low content of Sn is due to the predominance of sediments, mainly limestone, rock, and depleted tin. The Sn content increases with an increase in the influence of rock-forming elements under the conditions of a decrease in the role of biogeochemical processes and a decrease in the capacity of the biogeochemical cycle. Such areas include areas that are practically devoid of vegetation cover—scree, cliffs, and semi-deserts [48].
Sb refers to scattered elements of the lithosphere, the concentration ratio of which also rarely exceeds a Clarke in the basins of the rivers of the Northeastern Caucasus. The content of Sb increases in the Sunzha River Basin at individual points between 3.5 and 4.5 from the Clarke. The oblique lakes are found in the lower basins of the Sulak and the Ulluchay Rivers and in the eastern part of the Sulak Basin (the Kara-Koisu River).
Fe, Co, and Mn are halophilic and siderophilic cationogenic water migrants whose mobility is related to the aquatic environment.
Fe has a high Clarke in the lithosphere, and its content in the upper soil horizons of the Northeastern Caucasus is close to the Clarke. The mobility of Fe is closely related to oxidative-reducing conditions: in alkaline conditions, the content of the element is close to the Clarke; in acidic and slightly acidic conditions, its accumulation is observed. It often settles on oxygen geochemical barriers.
Co concentration in the upper soil horizons is close to its Clarke in the lithosphere, which may be due to its low mobility, weak accumulation by vegetation, and sedimentation on sorption barriers. The content of Co is often associated with the proliferation of magmatic rocks, in particular basalts and gabbros, as shown by the example of western Andalusia (Spain). Co is also associated with volcanic and volcanic–sedimentary thickets [94].
Mn is characterized by polyvalence, high biodiversity, and high biogenic accumulation in soils, which determines the exceedance of its content in the upper soil horizons of the Northeastern Caucasus above the Clarke in the lithosphere. The Mn content is slightly higher in the basin of the Sunzha River compared to the basins of the Sulak and Ulluchay Rivers.
Mo and V—halophilic and siderophilic anionogenic water migrants, whose mobility is related to oxidative environments.
The Mo content in the upper soil horizons of the Northeastern Caucasus varies from very low to more than 50 times the Clarke. The high range of values is related to the element’s polyvalence, which determines its mobility, as well as its accumulation in acidic igneous and organogenic sedimentary rocks [48]. The accumulation of Mo in arid conditions is related to its evaporative concentration. Mo shows an extremely high level of geoaccumulation.
The content of V in the studied areas is close to its Clarke in the lithosphere. The distribution of the element is characterized by low contrast. Under reducing conditions, it can be sorbed into peat, coal, and oil. Under arid conditions, it can accumulate on alkaline and evaporative barriers.
Cu, Ni, Zn, Cd, Pb, and Ag belong to chalcophile and siderophilic water migrants that mobilize in oxidizing and gelling environments.
Zn is characterized by high biodiversity, mobility, and the ability to settle on various barriers depending on the oxidative-restorative environment. The upper soil horizons in the Northeastern Caucasus are often enriched with Zn, where it is sorbed by an organic substance. Its concentration reaches 1010.29 mg/kg, which is higher than in many parts of the world [93]. The concentration ratio and accumulation factor of Zn contrast sharply in the river basins—high values in the Ulluchay and Sulak River Basins that increase to extremely high levels by 7–8 times in the Sunzha River Basin. In the basins of the tributaries of the Sulak River—the Avar Koisu and the Andi Koisu—the Zn content is minimal.
The Sunzha River Basin is adjacent to a major lead–zinc mining region. Within the basin, Zn deposits are also present. Prolonged mining and smelting of Zn in Vladikavkaz (approximately 10 km from the river basin) has led to widespread Zn contamination. Thus, Zn anomalies may be associated with both natural and anthropogenic sources. The anomaly near the city of Grozny exhibits high Zn concentrations throughout the soil profile, suggesting a natural source. In contrast, a second Zn anomaly is enriched only in the topsoil horizon, indicating an anthropogenic input.
Cu concentration coefficients are close to those of Zn, with a slightly lower content in the middle reaches of the Sulak River. The accumulation of Cu is related to the formation of geochemical barriers in reducing conditions. Accumulation of Cu relative to the regional background is also similar to that of Zn, with increased concentrations in the Sunzha River Basin. The concentrations of the element reach 800–900 mg/kg, which is higher than in many parts of the world [95].
The concentration of Ni is characterized by almost universal accumulation, which may be due to its high content in rocks, as well as sorption of clays, silts, iron hydroxides, and manganese. However, the accumulation of Ni is not very high compared to the regional background (2–3 times) and Clarke (5–10 times), which reflects regional characteristics. Ni concentrations in hydromorphic soils of the lower reaches of the Sulak River are close to textual data [50,96,97].
The content of Cd in the upper soil horizons of the Northeastern Caucasus varies considerably due to its high technophilic properties, as well as its deposition on alkaline and sorption barriers. Cd is widely used in agriculture, which is an additional source of its input into the soil. Its concentration reaches 102 mg/kg, which is higher than in many parts of the world [93,95]. The distribution patterns and areas of elevated concentrations of Cd coincide with many others, indicating the natural character of the element’s high contents.
The Pb content at many sites exceeds the Clarke lithosphere and regional background, but by small amounts (1–2 times, rarely 4–8 times). It is characterized by high technophilicity and acts as a topomorphic element for pollution by motor vehicles, which can explain its increased content in the upper soil horizons. The Pb content reaches 63.88 mg/kg, which is higher than in many parts of the world but does not exceed the concentration in contaminated industrial areas [95,96,97]. The accumulation of Pb in the upper soil horizon is due to humus adsorption. The obtained Pb concentrations in the foothills of Dagestan are comparable with published data [89,98,99]. Compared to textual data [32], the concentration of Pb in hydromorphic soils of the lower reaches of the Sulak River is three times lower.
For Ag, areas with high and low concentrations are distinguishable. Low concentrations are noted in the valley of the Sunzha River and Sulak River, while high concentrations are in the lower reaches of the Ulluchay River, which may be associated with biogenic accumulation, Ag concentration on clays, and precipitation during evaporative concentration.
Two Ag anomalies were identified within the Sunzha River Basin near the urbanized areas of Grozny, Gudermes, and Argun and on the slope of the Sunzhensky Ridge. In the urbanized area, Ag concentrations in the topsoil horizon are several times higher than in the underlying horizons: 7.939 mg/kg (A 3–41 cm), 1.535 mg/kg (B 41–70 cm), and 1.136 mg/kg (C 70–82 cm).
Al and Cr are common chemical elements belonging to the group of halophilic and hydrophilous migrants, which are mobile in oxidizing and gelling environments. Sc is less common in the lithosphere but has geochemical similarities with Al and Cr.
Al content in the upper soil horizons of the Northeastern Caucasus is near or below its Clarke in the lithosphere. Al content relative to Clarke and the regional background is poorly differentiated. The element is related to rock forming, migrates in organic complexes in acidic environments, and disintegrates poorly from compounds.
The high Cr content at many sampling sites may be due to the composition of the rocks, as well as the high role of mechanical migration in the distribution of the element throughout the landscape. It often significantly exceeds the content of the Clarke in the lithosphere with well-defined accumulation areas: the lower reaches of the Ulluchay and Sulak River Basins, and in the high, mountainous part of the tributaries of the Sulak River. Concentrations of Cr drop sharply in the northwestern part of the Ulluchay Basin and in the Andi Koisu and Avar Koisu Basins. Compared with material data [32], concentrations of Cr in hydromorphic soils of the Sulak River lowlands are much lower. The obtained Cr concentrations in the foothills of Dagestan are comparable with published data [33,100,101].
Sc is characterized by low concentrations and significant dispersion in landscapes. It focuses weakly on geochemical barriers. The concentration coefficient in the Northeastern Caucasus river basins is lower than the Clarke almost everywhere. When compared with the regional background, the accumulation of the element up to Cf = 3–4 is discernible. One Sc anomaly was identified in the mountainous part of the Sunzha River Basin. High Sc concentrations were observed throughout the entire soil profile.
Te refers to poorly studied lithophilic and siderophilic water migrants whose migration is noted in strong alkaline soda waters. In the upper soil horizons of the Northeastern Caucasus, there is a significant variation in its content—from very low to exceeding the Clarke by 68 times. The distribution of the element reflects regional characteristics—the accumulation factor Cf does not exceed 10, and in most points, it is 1, i.e., which corresponds to the regional background.
Te accumulates in the Sunzha Basin. This is indicated by the very high values of the enrichment factor. The high concentrations of Te are confined to the watershed surface of the Sloisty Ridge, which is composed of clay shales and located in the Sunzha River Basin. The second place is located on the southern slope of the Lesisty Ridge, which is composed of Upper Paleogenic (Oligocene) and Lower Miocene clays with layers of sandstones and siltstones.

4.2. Correlation Analysis

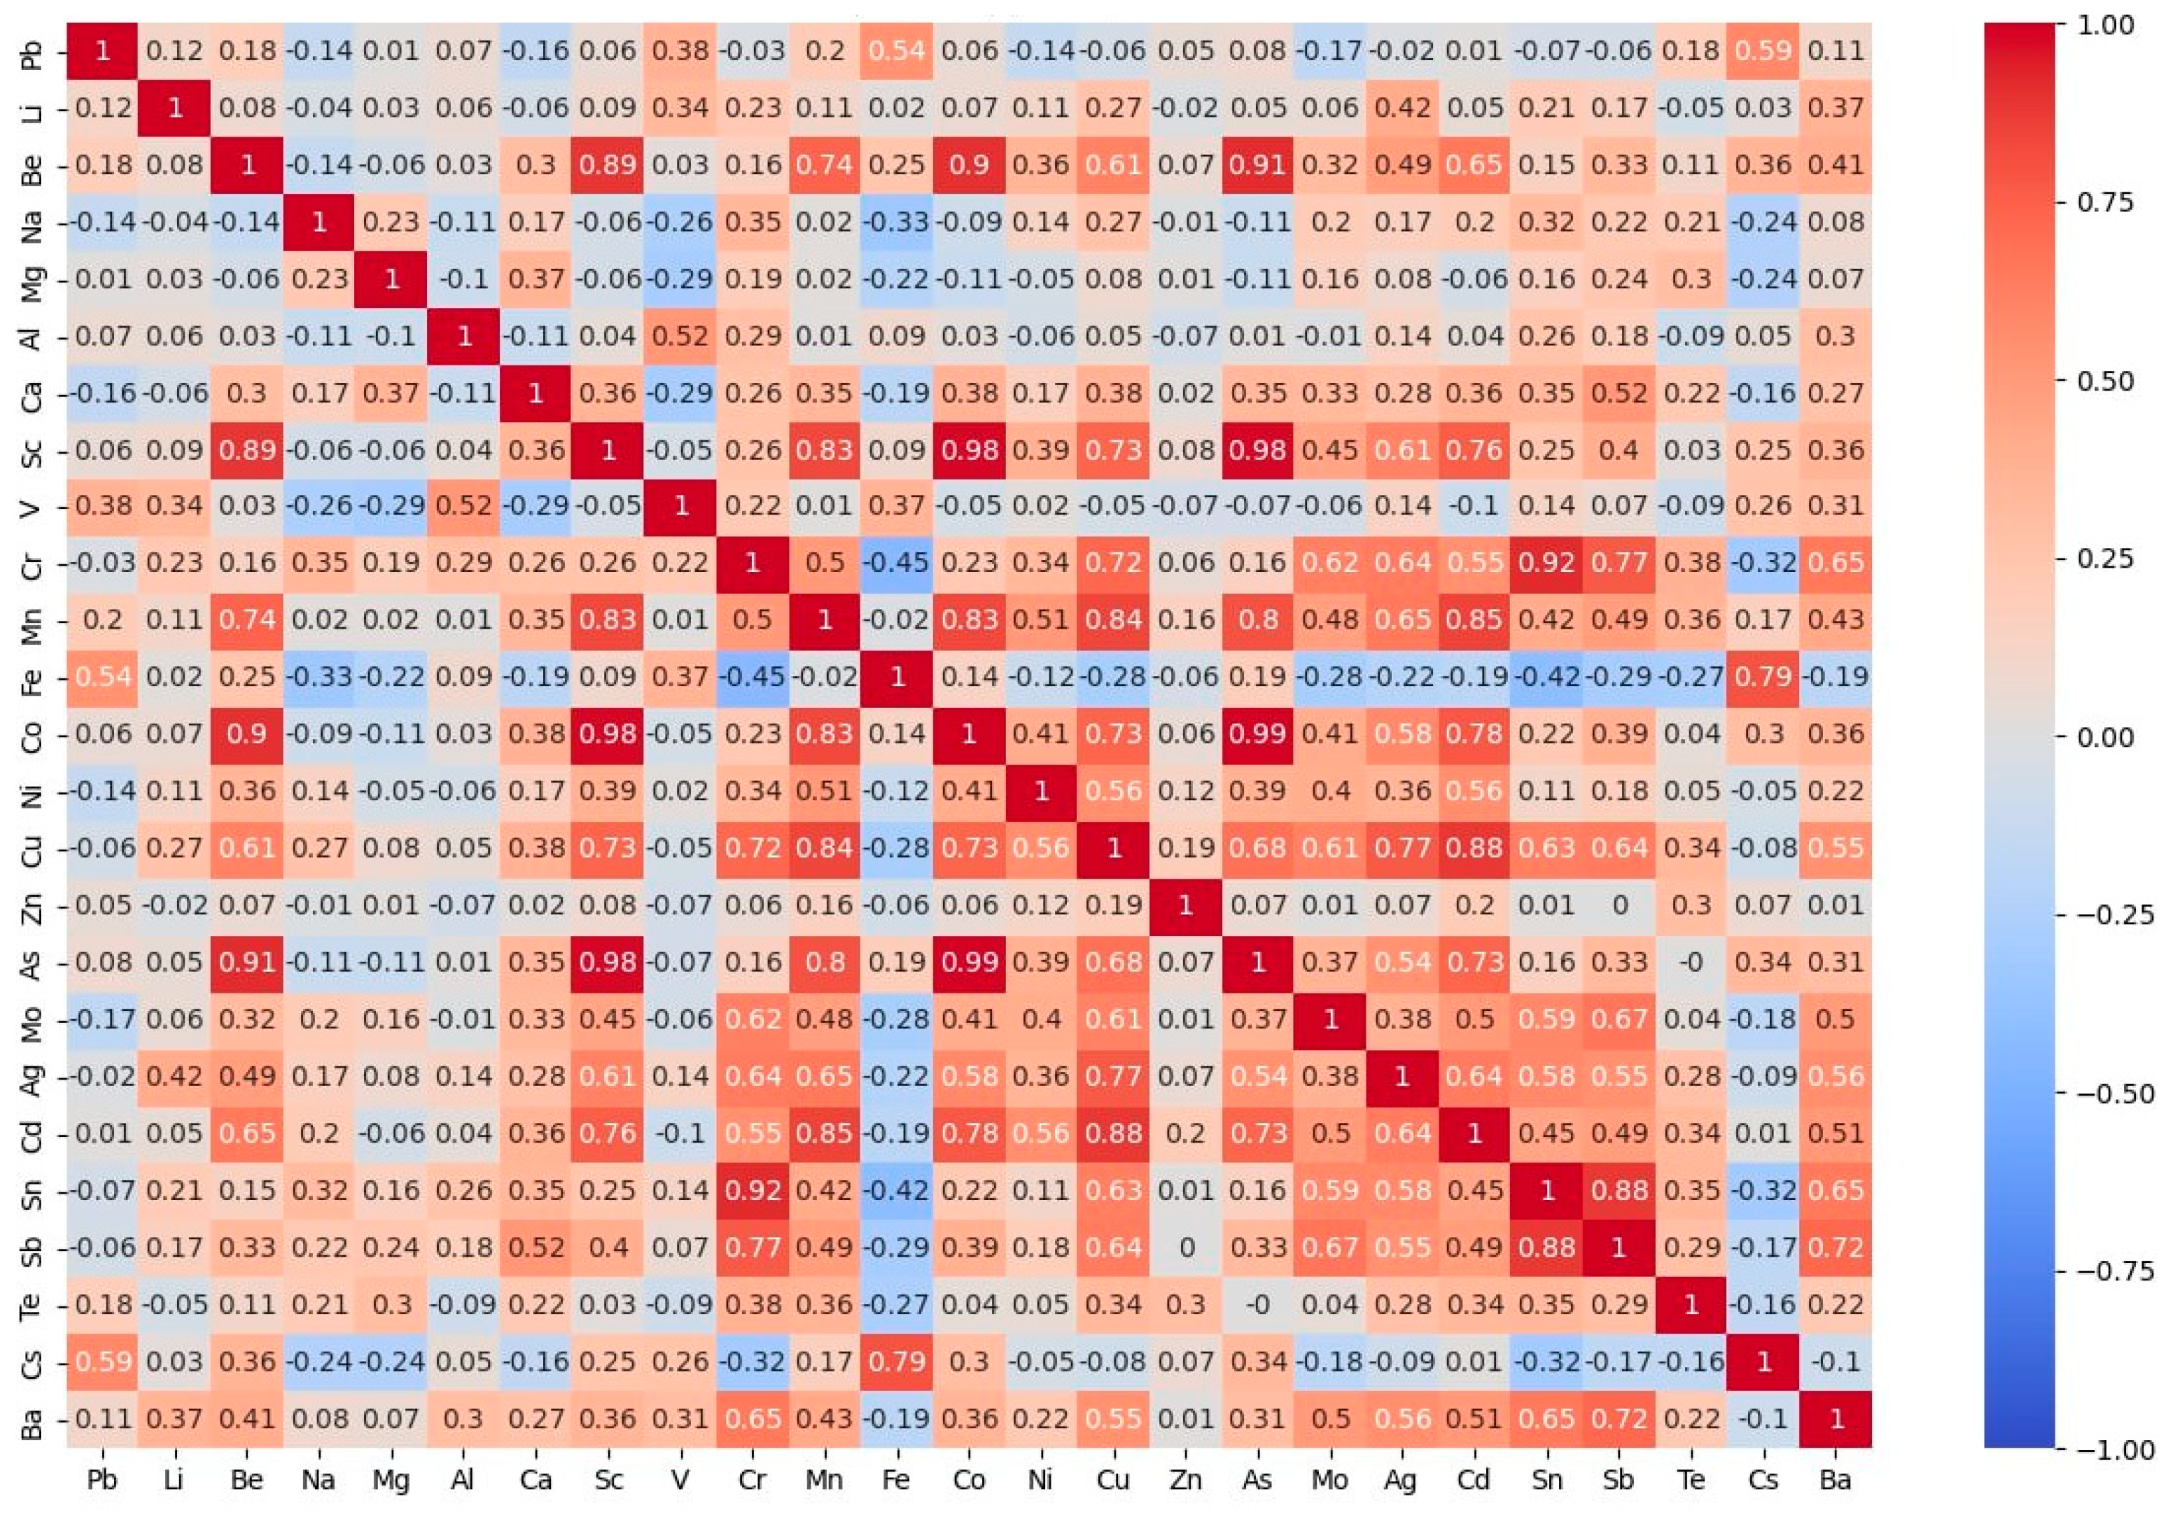
Correlations between chemical elements indicate the types of chemical processes associated with enrichment, dispersion, or formation of geochemical anomalies [102,103]. This study showed strong correlations between chemical elements (Figure 11): As-Co (0.99), As-Sc (0.98), Sc-Co (0.98), Sc-Cr (0.92), As-Be (0.91), Be-Co (0.90), Cu-Cd (0.88), Cu-Mn (0.85), Cd-Mn (0.84), Co-Mn (0.83), As-Mn (0.80), Fe-Cs (0.79), Cu-Ag (0.77), Cr-Sb (0.77), and Mn-Be (0.74).
The studied soils did not reveal an anthropogenic signature for Cu-Zn-Cd-Pb [95], indicating a predominance of external sources of chemical elements.
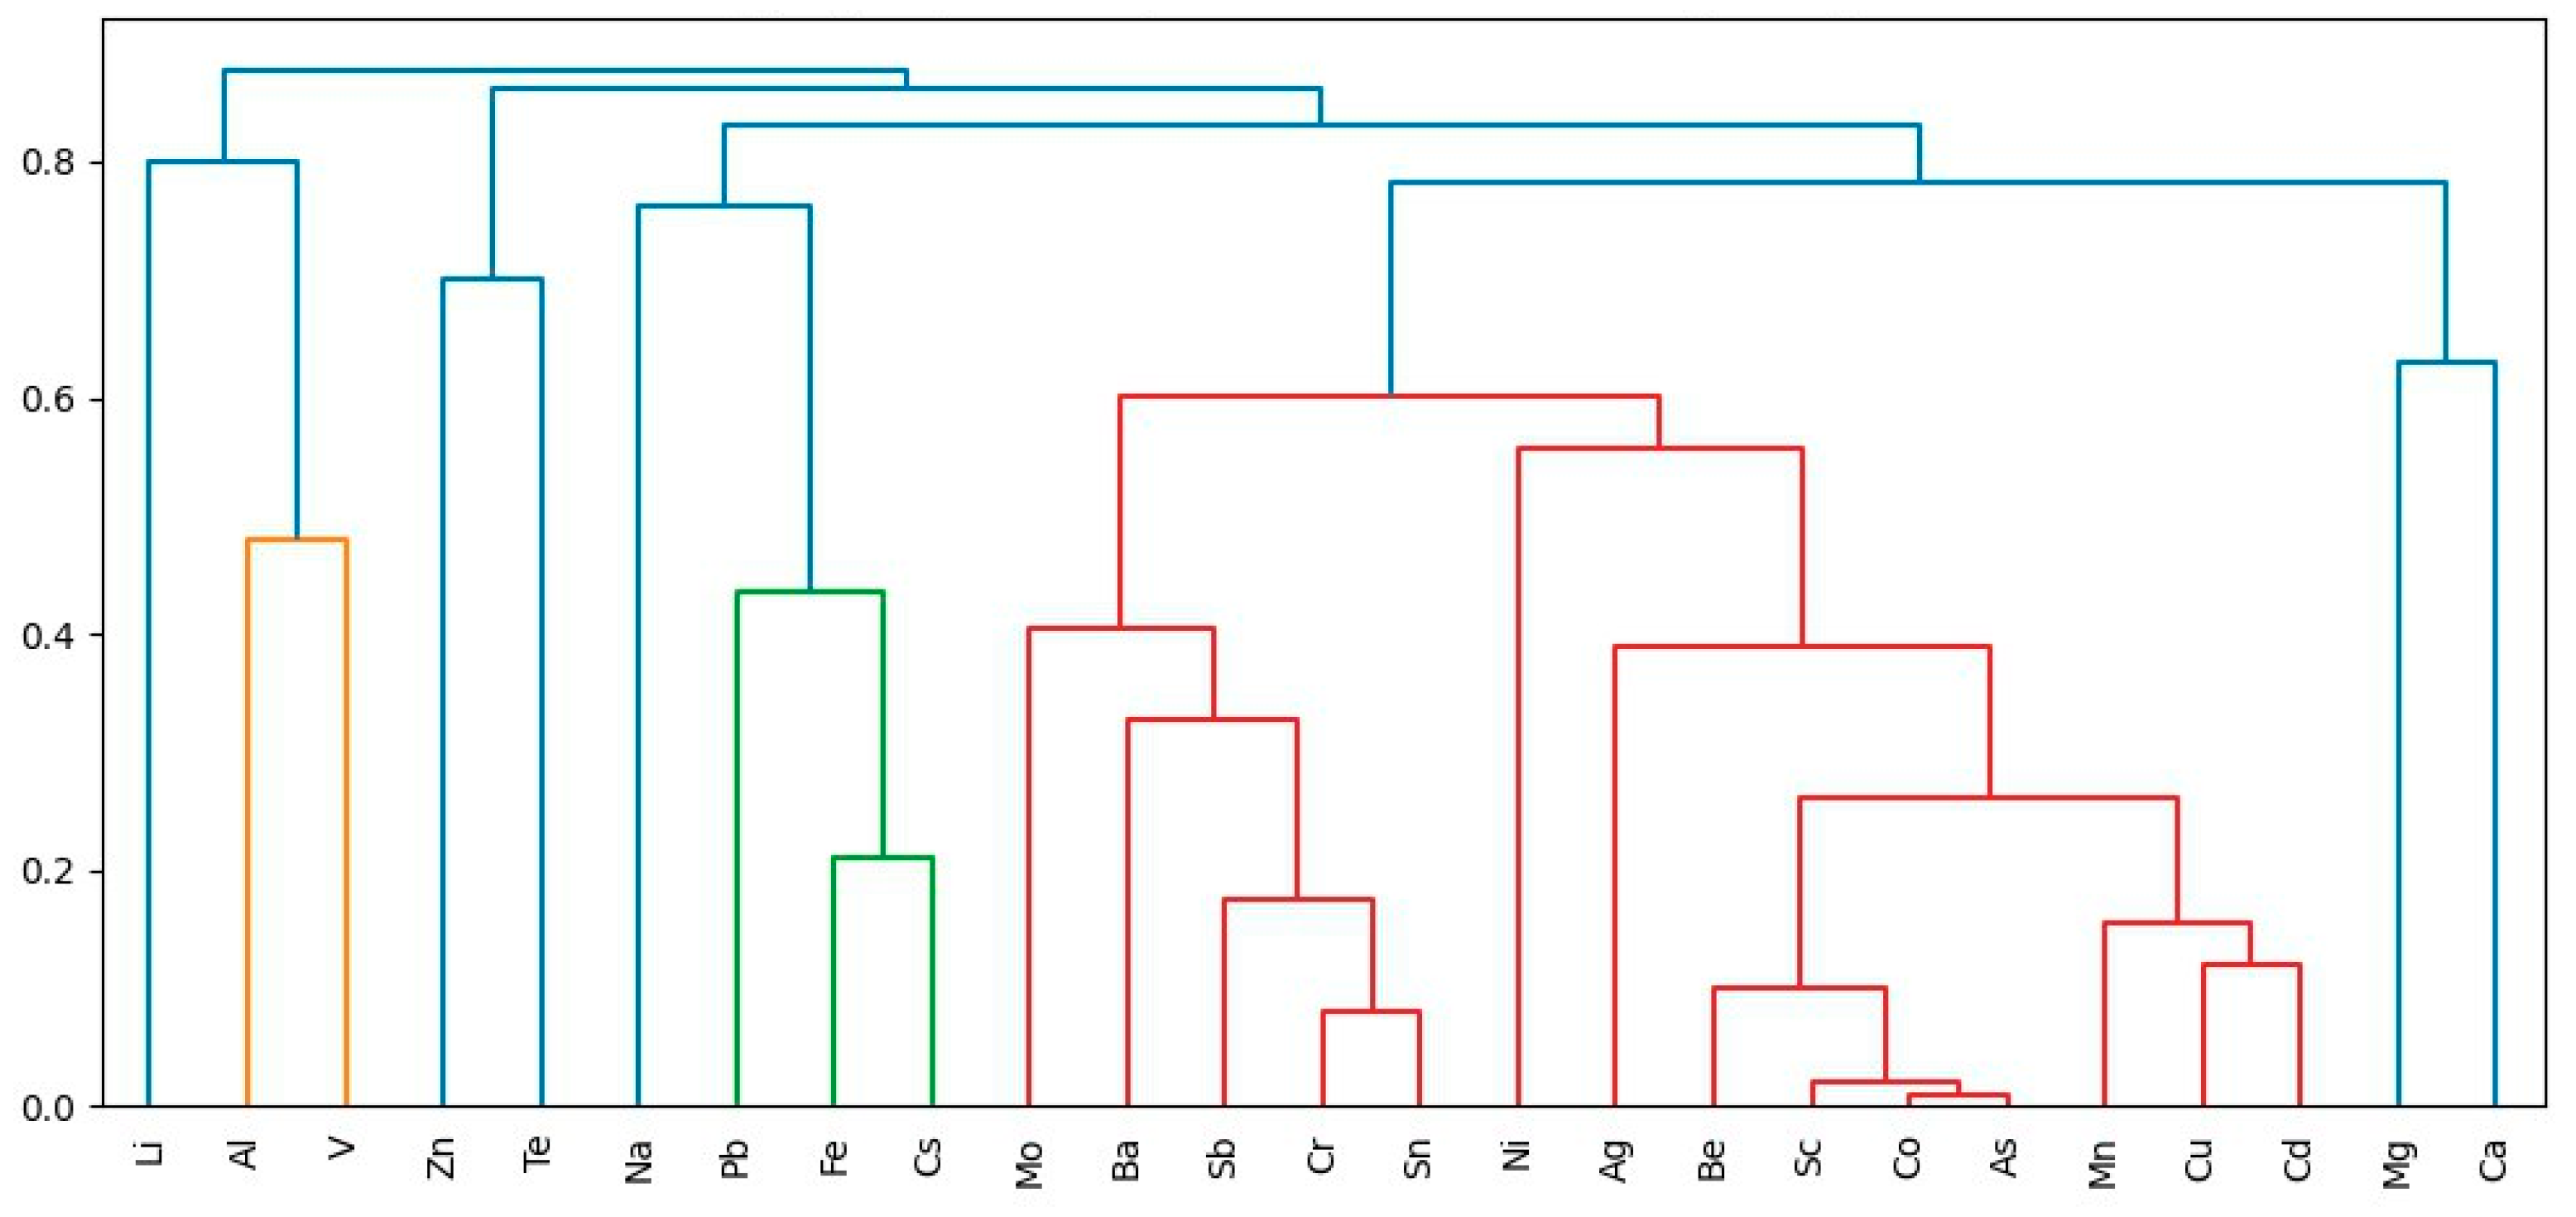
Nonetheless, in mountain landscapes, geogenic processes occupy an important place in the distribution of elements—volcanism, introduction of intrusions, and sediment accumulation in marine and continental conditions. Stable correlation of the geochemical elements As-Co-Sc-Cr-Be-Cu-Cd-Mn is noted (Figure 12).
Ca shows similar trends with Mg, which puts them in a separate cluster. The geogenic elements are clustered in a separate branch, thus manifesting a close association of these metals, which might share common sources. Close accumulation and scattering trends are noted for Zn and Te.

4.3. Assessment of Anthropogenic and Natural Contributions to Contamination Hotspots

One of the important aspects of the present study is the source apportionment of the metals in soils. According to Kaiser’s criterion, six factors were identified as having the strongest influence on the distribution of chemical elements (Figure 13). Three of these factors account for 77% of the explained variance.
Factor 1 was dominated by Co (98.00%), As (97.40%), Sc (95.60%), Be (85.40%), Mn (82.20%), Cd (97.90%), and Cu (74.60%), which accounted for 37.20% of the total variance. The similar distribution patterns of these chemical elements are confirmed by their mutual clustering in correlation analysis. These metals are likely to be contributed by lithogenic processes such as soil erosion and rock weathering.
Factor 2 accounted for 25.10% of the source contribution and was predominated by Sn (90.20%), Cr (87.30%), Sb (84.60%), and Ba (70.20%), which were supported by their shared cluster.
The occurrence of these chemical elements in soils may be associated with the distribution of volcanic rocks, particularly in high mountain areas. Volcanic-derived elements can enter soils through the weathering of parent rocks and their subsequent fluvial transport along river channels. In the cold climate of high mountain regions, rock disintegration is intensified by frost cracking, water erosion, and leaching under acidic landscape conditions (pH down to 4.7) [37,48].
Factor 3 accounted for 14.60% of the source contribution and was dominated by Fe (79.00%), Pb (77.30%), and Cs (76.10%). In the upper soil horizon, Pb often indicates an anthropogenic origin; however, natural deposits of this element also occur in the Caucasus Mountains.
To evaluate the anthropogenic and natural contributions to the formation of contamination hotspots and elevated element concentrations, patterns of variation in the enrichment factor (EF) and pollution indices of Zc and PLI were analyzed.
The enrichment factor indicates the accumulation of Na, Ca, Mg, Ba, Mn, Cu, Ni, Zn, and Te in soils, which may reflect their anthropogenic origin.
Correlation analysis between the accumulation indices (EF) of individual elements and the pollution indices Zc and PLI did not reveal significant relationships. A moderate positive correlation (r = 0.56) was observed between Zn and the total pollution coefficient (Zc). Approximately 50 km from the study area lies a historically significant lead–zinc mining region, the Sadonsky Lead–Zinc Complex, and a plant for smelting zinc, cadmium, and zinc–aluminum alloys, Electrozinc. These facilities operated from the late 19th century to the early 21st century and were major sources of environmental contamination.
To assess the influence of road traffic, a road network map was constructed, and the distance from each sampling site was calculated. The resulting dataset was correlated with the integrated indices Zc, PLI, and mCf. No significant correlations were identified, indicating that road traffic has little effect on the accumulation of chemical elements in the upper soil horizon.
Among the potential sources of atmospheric pollution, thermal power plants and industrial enterprises distributed across the North Caucasus region were mapped. Distances from each sampling site to the nearest emission source were calculated as well. The correlation analysis revealed no significant relationships between Zc, PLI, or mCf and the influence of emission sources.

4.4. Ecological Risk Assessment

The Zc index indicates that, at 55 sampling sites, concentrations of chemical elements are classified as hazardous or highly hazardous, posing a potential health risk. In the Ulluchay River Basin, residents in the lower and middle reaches, where population density is highest, face a particularly elevated risk. Soils in this area accumulate Pb, Cr, Mn, Cu, Zn, Mo, Ag, Cd, Sn, and Te.
In the Sulak River Basin, soils with extremely hazardous contamination are concentrated in the eastern part, along the right tributary of the main river—the Kara-Koisu River. Here, soils are contaminated with Cr, Cu, Zn, Mo, Ag, Te, Cd, Na, and Ni. These elements are highly toxic and exert adverse effects on human health.
Elevated concentrations of Mn and Pb in the lower reaches of the Sulak and Ulluchay basins contribute to the incidence of goiter and essential hypertension among the local population [30]. Moreover, increasing Pb levels in soils of the lowland parts of these basins increase the risk of diabetes mellitus [28].
In the Sunzha River Basin, 19 zones with extremely hazardous contamination have been identified. Some of these zones are located in high mountain areas without settlements; however, toxic elements are transported downstream via sediment fluxes. High concentrations of Ni, Cu, Zn, Cr, and Te were detected at nearly all sampling sites. Additionally, Pb, Mg, Mo, Ag, Cd, and Sn concentrations were elevated in the upper reaches of the basin within the high mountain zone.
The Potential Ecological Risk Index (PERI), calculated for the most toxic chemical elements (As, Cd, Pb), indicates consistently high levels of ecological risk, with values ranging from 48.88 to 619.61. Only 7% of sampling sites fall into the low ecological risk category, while 18% fall into the moderate ecological risk category. The majority of the study area (75% of sampling sites) is classified as high or very high ecological risk, indicating hazardous conditions for biota and human populations.
The calculation of the Potential Ecological Risk Index (PERI) for nine metals (As, Co, V, Cu, Ni, Zn, Cd, Pb, and Cr) revealed areas characterized by very strong (360 ≤ PERI < 720) and extremely high ecological risk (PERI ≥ 720) across the study region.
4.5. Recommendations for Mitigating the Negative Impact of Geochemical Anomalies

To reduce the transfer of chemical elements along trophic chains and ultimately into the human body, the cultivation of crops on contaminated soils should be avoided. It is further recommended to conduct biogeochemical investigations of element uptake in crops. Such studies would allow the identification of crops with low element accumulation, thereby minimizing their transfer into food chains and human intake.
Geochemical anomalies also affect the quality of natural freshwater resources. The use of these waters for drinking purposes requires continuous monitoring or treatment. If treatment of contaminated water is not feasible, alternative sources of uncontaminated water should be supplied.
The spatial distribution of geochemical anomalies must be considered when planning tourist routes, as inhalation of fine particles containing toxic elements may pose health risks. Restrictions should be applied in areas with high exposure potential.
Thus, the obtained data can be used for spatial planning of the region’s socio-economic development and for introducing land use restrictions in areas with anomalously high concentrations of chemical elements in soils.
This study also demonstrated that effective environmental management requires differentiation of the territory based on topography and geological structure: lowland areas may be depleted or enriched in specific elements, whereas other areas may exhibit contrasting geochemical patterns.

5. Conclusions

In the soils of the river basins of the Northeastern Caucasus, the high concentrations (up to 306,600.70 mg/kg) are typical for elements (Al, Na, Ca, Fe, Mg) common in the Earth’s crust. At the same time, concentrations of Ag, Cd, Sn, Sb, and Te are extremely low at many points and are below the sensitivity threshold of chemical analytical equipment.
The geochemical indicators Cf (contamination factor) and Igeo (geoaccumulation index) indicate that the regional characteristics of the territory, such as lithological conditions, hydrochemical schedules, and the history of geological development of the territory, affect the concentration of elements.
Out of the 25 elements analyzed, geochemical anomalies were detected for seven (Ba, Na, Zn, Ag, Li, Sc, and As), with Zn and As identified as the most toxic. The spatial distribution of these anomalies in soils of the Northeastern Caucasus river basins was notably concentrated in the Sunzha River Basin, where 8 of 10 sites exhibited elevated levels.
Such geochemical anomalies represent substantial ecological and public health risks. Consequently, delineating and characterizing these anomalous zones is crucial for informing targeted environmental management and risk mitigation strategies in the region.
In the formation of geochemical anomalies in the soils of river basins of the Northeastern Caucasus, natural features are of primary importance—the geological structure of the territory and chemical composition of mountain rocks, the climatic altitude differentiation of the landscapes, and the high diversity of landscape conditions. The role of anthropogenic factors in the formation of geochemical anomalies is increasing in local areas near settlements and agricultural facilities.

Author Contributions

Conceptualization, E.K. and R.G.; data curation, E.K., I.K., and P.D.; formal analysis, T.G. and P.D.; investigation, T.G., A.N., A.D., A.K., C.N.P. and N.B.; methodology, R.G., T.G., and P.D.; project administration, R.G. and I.K.; resources, R.G.; software, E.C.; supervision, R.G. and I.K.; validation, R.G., I.K. and T.G.; visualization, E.K., P.D., E.C. and N.L.; writing—original draft, E.K., T.G., E.C., A.N., N.L., A.D., A.K., C.N.P. and N.B.; writing—review and editing, E.K., R.G., I.K., P.D. and E.C. All authors have read and agreed to the published version of the manuscript.

Funding

This work was carried out within the framework of a large scientific project, “Dynamics of the geoecological state of the mountain river basins of the North-Eastern Caucasus, Azerbaijan and Iran under conditions of climate change and growing anthropogenic load” (Agreement of the Ministry of Science and Higher Education of the Russian Federation № 075-15-2024-644).

Data Availability Statement

The data presented in this study are available on request from the corresponding author.

Conflicts of Interest

The authors declare no conflicts of interest. The funders had no role in the design of the study; in the collection, analyses, or interpretation of data; in the writing of the manuscript; or in the decision to publish the results.

Abbreviations

The following abbreviations are used in this manuscript:
ICP-MSInductively coupled plasma mass spectrometry
CRMCertified reference materials
PLIPollution load index
PERIPotential Ecological Risk Index

Appendix A

Figure A1. Ca (a), Na (b), and Mg (c) content in the upper soil horizons of the Ulluchay, Sulak, and Sunzha River Basins.
Geosciences 15 00380 g0a1
Figure A2. The content of Li (a), Ba (b), Cs (c), and Be (d) in the upper soil horizons of the Ulluchay, Sulak, and Sunzha River Basins.
Geosciences 15 00380 g0a2
Figure A3. As (a), Sb (b), and Sn (c) content in the upper soil horizons in the Ulluchay, Sulak, and Sunzha River Basins.
Geosciences 15 00380 g0a3
Figure A4. Content of Fe (a), Co (b), and Mn (c) in the upper soil horizons of the Ulluchay, Sulak, and Sunzha River Basins.
Geosciences 15 00380 g0a4
Figure A5. Mo (a) and V (b) content in the upper soil horizons in the Ulluchay, Sulak, and Sunzha River Basins.
Geosciences 15 00380 g0a5
Figure A6. Content of Cu (a), Ni (b), Zn (c), Cd (d), Pb (e), and Ag (f) in the upper soil horizons in the Ulluchay, Sulak, and Sunzha River Basins.
Geosciences 15 00380 g0a6
Figure A7. Content of Al (a), Sc (b), Cr (c), and Te (d) in the upper soil horizons in the Ulluchay, Sulak, and Sunzha River Basins.
Geosciences 15 00380 g0a7

Appendix B

Figure A8. Concentration coefficient. Chemical elements whose maximum content does not exceed the crustal Clarke at more than 85% of sites: Sb (a). Chemical elements with active accumulation: Cu (b). Some chemical elements showing accumulation and dispersion trends in different geochemical settings: Ba (c) and Na (d).
Geosciences 15 00380 g0a8

Appendix C

Figure A9. Spatial distribution of element enrichment factor of accumulation: (a) Enrichment factor of Na. (b) Enrichment factor of Ca. (c) Enrichment factor of Mg. (d) Enrichment factor of Ba. (e) Enrichment factor of Mn. (f) Enrichment factor of Cu. (g) Enrichment factor of Ni. (h) Enrichment factor of Zn. (i) Enrichment factor of Te.
Geosciences 15 00380 g0a9aGeosciences 15 00380 g0a9b

References

  1. Abrahams, P.W. Soils: Their implications to human health. Sci. Total Environ. 2002, 291, 1–32. [Google Scholar] [CrossRef] [PubMed]
  2. Zwolak, A.; Sarzyńska, M.; Szpyrka, E.; Stawarczyk, K. Sources of soil pollution by heavy metals and their accumulation in vegetables: A review. Water Air Soil Pollut. 2019, 230, 164. [Google Scholar] [CrossRef]
  3. Wołejko, E.; Jabłońska-Trypuć, A.; Wydro, U.; Butarewicz, A.; Łozowicka, B. Soil biological activity as an indicator of soil pollution with pesticides—A review. Appl. Soil Ecol. 2020, 147, 103356. [Google Scholar] [CrossRef]
  4. Riffaldi, R.; Levi-Minzi, R.; Cardelli, R.; Palumbo, S.; Saviozzi, A. Soil biological activities in monitoring the bioremediation of diesel oil-contaminated soil. Water Air Soil Pollut. 2006, 170, 3–15. [Google Scholar] [CrossRef]
  5. Fei, Y.H.; Zhao, D.; Liu, Y.; Zhang, W.; Tang, Y.Y.; Huang, X.; Liu, C. Feasibility of sewage sludge derived hydrochars for agricultural application: Nutrients (N, P, K) and potentially toxic elements (Zn, Cu, Pb, Ni, Cd). Chemosphere 2019, 236, 124841. [Google Scholar] [CrossRef]
  6. Tkalec, M.; Stefani, P.P.; Cvjetko, P.; Siki, S.; Pavlica, M.; Balen, B. The effects of cadmium-zinc interactions on biochemical responses in tobacco seedlings and adult plants. PLoS ONE 2014, 9, e87582. [Google Scholar] [CrossRef]
  7. Ruby, M.V.; Lowney, Y.W. Selective soil particle adherence to hands: Implications for understanding oral exposure to soil contaminants. Environ. Sci. Technol. 2012, 46, 12759–12771. [Google Scholar] [CrossRef]
  8. Wang, C.; Hu, J.; Zhang, Y.; Di, Y.; Wu, X. Spatial distribution characteristic, source apportionment, and risk assessment of heavy metals in the soil of an urban riparian zone. Ecotoxicol. Environ. Saf. 2025, 298, 118271. [Google Scholar] [CrossRef]
  9. Hoque, M.M.; Islam, A.; Islam, A.R.M.T.; Pal, S.C.; Mahammad, S.; Alam, E. Assessment of soil heavy metal pollution and associated ecological risk of agriculture dominated mid-channel bars in a subtropical river basin. Sci. Rep. 2023, 13, 38058. [Google Scholar] [CrossRef]
  10. Selinus, O.; Alloway, B.; Centeno, J.A.; Finkelman, R.B.; Fuge, R.; Lindh, U.; Smedley, P. Essentials of Medical Geology: Impacts of the Natural Environment on Public Health; Academic Press: Burlington, MA, USA, 2005; pp. 890–891. [Google Scholar]
  11. Mirsal, I.A. Soil Pollution: Origin, Monitoring & Remediation; Springer: Berlin/Heidelberg, Germany, 2008. [Google Scholar] [CrossRef]
  12. Wang, Y.L.; Tsou, M.C.; Liao, H.T.; Hseu, Z.Y.; Dang, W.; Hsi, H.C.; Chien, L.C. Influence of soil properties on the bioaccessibility of Cr and Ni in geologic serpentine and anthropogenically contaminated non-serpentine soils in Taiwan. Sci. Total Environ. 2020, 714, 136761. [Google Scholar] [CrossRef]
  13. Zhang, L.; Duan, X.; Li, R.; Wu, W.; Gao, F.; Cheng, H.; Wang, B. Source, Bioaccessibility and Oral Exposure Risk Assessment of Rare Earth Elements in Soils with Typical Land-Use Types. J. Environ. Sci. 2025, in press. [CrossRef]
  14. Ribeiro, P.G.; de Oliveira, C.; Guerra, M.B.B.; de Carvalho, T.S.; Martins, G.C.; Pereira, W.V.S.; Ramos, S.J.; Guilherme, L.R.G. Rare earths as emerging trace element contaminants in the soil. Curr. Pollut. Rep. 2024, 10, 443–458. [Google Scholar] [CrossRef]
  15. Tao, Y.; Shen, L.; Feng, C.; Yang, R.Y.; Qu, J.H.; Ju, H.X.; Zhang, Y. Distribution of rare earth elements (REEs) and their roles in plant growth: A review. Environ. Pollut. 2022, 298, 11840. [Google Scholar] [CrossRef]
  16. Khan, K.; Mohsin, A.; Sharif, H.M.A.; Maryam, A.; Ali, J.; Li, X.; Ibrahim, S.M.; Ayaz, M.; Zhou, Y.; Younas, M. Heavy metal pollution in the soil of a riverine basin: Distribution, source, and potential hazards. Environ. Monit. Assess. 2022, 194, 618. [Google Scholar] [CrossRef]
  17. Liu, X.; Yang, Z.; Deng, C. Identification of natural and anthropogenic factors in the spatial pattern of Pb in the surface soil of the Nanliu River Basin. Ecotoxicol. Environ. Saf. 2025, 290, 117601. [Google Scholar] [CrossRef]
  18. Li, Y.; Ma, L.; Abuduwaili, J. Unveiling mercury’s hidden threat: An integrated methodology for soil mercury risk assessment in Syr Darya River Basin, Central Asia. J. Hazard. Mater. 2025, 483, 136690. [Google Scholar] [CrossRef]
  19. Zhang, S.; Song, J. Geochemical cadmium anomaly and bioaccumulation of cadmium and lead by rapeseed (Brassica napus L.) from noncalcareous soils in the Guizhou Plateau. Sci. Total Environ. 2018, 644, 624–634. [Google Scholar] [CrossRef]
  20. Matschullat, J.; Ottenstein, R.; Reimann, C. Geochemical background–can we calculate it? Environ. Geol. 2000, 39, 990–1000. [Google Scholar] [CrossRef]
  21. Ander, E.L.; Johnson, C.C.; Cave, M.R.; Palumbo-Roe, B.; Nathanail, C.P.; Lark, R.M. Methodology for the determination of normal background concentrations of contaminants in English soil. Sci. Total Environ. 2013, 454–455, 604–618. [Google Scholar] [CrossRef]
  22. Opekunova, M.G.; Opekunov, A.Y.; Somov, V.V.; Kukushkin, S.Y.; Arestova, I.Y.; Lisenkov, S.A.; Nikulina, A.R. Natural and Anthropogenic Factors of the Chemical Composition of Soils of Shikotan Island (Kuril Islands). Pochvovedenie 2022, 55, 1891–1908. [Google Scholar] [CrossRef]
  23. Kasimov, N.S.; Vasil’chuk, J.Y.; Tereshina, M.A.; Chalov, S.R.; Erina, O.N.; Kosheleva, N.E.; Shinkareva, G.; Sokolov, D.I.; Vlasov, D.; Konoplev, A.V. Metals and metalloids pollution levels, partitioning, and sources in the environmental compartments of a small urban catchment in Moscow megacity. Environ. Pollut. 2025, 367, 125552. [Google Scholar] [CrossRef] [PubMed]
  24. Marrugo-Negrete, J.J.L.; Pinedo-Hernández, J.; Díez, S. Assessment of heavy metal pollution, spatial distribution and origin in agricultural soils along the Sinú River Basin, Colombia. Environ. Res. 2017, 154, 380–388. [Google Scholar] [CrossRef] [PubMed]
  25. Korshenko, A.N. (Ed.) The Quality of Marine Waters According to Hydrochemical Indicators. Yearbook 2023; Nauka: Moscow, Russia, 2025; 283p. (In Russian) [Google Scholar]
  26. Magomedaliev, Z.G.; Yakhiaev, M.A.; Magomedaliev, A.Z. Zinc Level in Pasture Vegetation of the Plain Province of Dagestan. Bull. Dagestan Sci. Cent. RAS 2009, 34, 29–32. (In Russian) [Google Scholar]
  27. Magomedaliev, Z.G.; Salikhov, S.K.; Magomedaliev, A.Z.; Yakhiaev, M.A. Heavy Metal Content in Soils and Plants of Mountain Ecosystems of Dagestan. Probl. Mod. Sci. 2014, 11, 10–17. (In Russian) [Google Scholar]
  28. Abdulagatov, I.M.; Yakhiaev, M.A.; Salikhov, S.K.; Karaeva, A.F. Heavy Metals in Soils of the Republic of Dagestan and Assessment of Human Health Risk. Hyg. Sanit. 2023, 102, 113–120. [Google Scholar] [CrossRef]
  29. Karaeva, A.F.; Ovchinnikova, M.A.; Minatulaeva, A.T.; Azbalaeva, M.S.; Salikhov, S.K.; Yahiyaev, M.A. Geochemical Prerequisites for the Formation of Endemic Goiter in the Population of the Republic of Dagestan. Endocr. Surg. 2023, 17, 22. (In Russian) [Google Scholar] [CrossRef]
  30. Salikhov, S.K.; Alieva, D.Z.; Magomedova, U.A.; AbdulKadyrova, S.O.; Surkhaeva, Z.Z.; Agaeva, E.N.; Tagirova, Z.G.; Ataev, M.G.; Yakhiaev, M.A.; Adilova, M.A. Prevalence of Essential Arterial Hypertension in Children and Adolescents Living in Dagestan, and Soil and Water Content of Mg, K, Ca, Zn, Pb. Pediatr. Named GN Speransky 2021, 100, 203–208. (In Russian) [Google Scholar] [CrossRef]
  31. Abakarova, A.M.; Gitinova, P.S.; Yakhiaev, M.A. Fluoride Compounds and Heavy Metals in Soils and Plants of the Sulak Delta Plain. Ural. Med. J. 2020, 10, 188–192. (In Russian) [Google Scholar]
  32. Salikhov, S.K.; Magomedaliev, A.Z.; Bashirov, R.R. Ni, Cr, Pb in Hydromorphic Soils of the Tersko-Sulak Sub-Province of Dagestan. Multithemed Netw. Electron. J. Kuban State Agrar. Univ. 2012, 76, 226–235. (In Russian) [Google Scholar]
  33. Salikhov, S.K.; Bashirov, R.R.; Magomedaliev, A.Z. Distribution Patterns of Heavy Metals (Ni, Cr, Pb) in Main Soil Types of Foothill Dagestan. Multithemed Netw. Electron. J. Kuban State Agrar. Univ. 2012, 78, 116–125. (In Russian) [Google Scholar]
  34. Onoprienko, M.G. Ecological and chemical anomalies of the Greater Caucasus and the Azov-Kuban lowland. Ecol. Bull. North Cauc. 2015, 11, 21–26. [Google Scholar]
  35. Reutova, N.V.; Reutova, T.V.; Dreeva, F.R. Comparative characteristics of aluminum and arsenic content in the surface waters of the Elbrus and Kazbek volcanic centers. Geol. Geophys. Russ. South 2024, 14, 231–243. (In Russian) [Google Scholar] [CrossRef]
  36. Reutova, N.V.; Reutova, T.V.; Dreeva, F.R. Natural and anthropogenic microelement pollution of the upper reaches of the Ardon River basin. Geol. Geophys. Russ. South 2025, 15, 219–230. (In Russian) [Google Scholar] [CrossRef]
  37. Reutova, T.V.; Reutova, N.V.; Dreyeva, F.R.; Khutuev, A.M.; Kerimov, A.A. Hydrochemical Anomalies in the Water Objects of the Prielbrusye National Park. Izv. Kabard.-Balkar. Sci. Cent. Russ. Acad. Sci. 2022, 6, 144–157. (In Russian) [Google Scholar] [CrossRef]
  38. Chigoeva, D.N.; Kamanina, I.Z.; Kaplina, S.P. Concentration of heavy metals in water flows in the area of Unalsky tailing dump and Ardon river. South Russ. Ecol. Dev. 2018, 13, 113–122. (In Russian) [Google Scholar] [CrossRef]
  39. Gurbanov, A.G.; Lolaev, A.B.; Leksin, A.B.; Dzeboev, S.O.; Gazeyev, V.M.; Dokuchaev, A.Y.; Tsukanova, L.E.; Oganesyan, A.K.; Gurbanova, O.A.; Ilaev, V.E. The main sources of pollution of the waters of the Ardon River, its degree and scale of manifestation, estimated by the results of a geochemical study of water samples from control points (RSO-A). Bull. Vladikavkaz Sci. Cent. 2018, 18, 40–50. [Google Scholar]
  40. Ermakov, V.V.; Tyutikov, S.F.; Degtyarev, A.P.; Gulyaeva, U.A.; Danilova, V.N. Features of metal accumulation by plants and activity of soil enzymes in metallogenic regions of the North Caucasus. Geochemistry 2022, 67, 766–772. [Google Scholar]
  41. Makovozova, Z.E.; Sokolov, A.A.; Fomenko, V.A.; Sarbaeva, M.T. Influence of hydrogeology at Unal tailings pond on ecosystem pollution with heavy metals. MIAB. Min. Inf. Anal. Bull. 2023, 6, 126–138. (In Russian) [Google Scholar] [CrossRef]
  42. Ermakov, V.V.; Tyutikov, S.F.; Danilova, V.N. Ecological monitoring of the Unal depression, Northern Ossetiya–Alania, using techniques of biogeochemical indication. Geochem. Int. 2020, 58, 332–341. [Google Scholar] [CrossRef]
  43. Ermakov, V.V.; Korobova, E.M.; Degtyarev, A.P.; Tyutikov, S.F.; Karpova, E.A.; Petrunina, N.S. Impact of natural and man-made factors on migration of heavy metals in the Ardon River basin (North Ossetia). J. Soils Sediments 2016, 16, 1253–1266. [Google Scholar] [CrossRef]
  44. Ermakov, V.V.; Tyutikov, S.F.; Degtyarev, A.P.; Danilova, V.N.; Gulyaeva, U.A.; Dogadkin, D.N. Formation of Biogeochemical Anomalies in the Baksan River Basin. Geochemistry 2020, 65, 955–968. (In Russian) [Google Scholar] [CrossRef]
  45. Gedgafova, F.V.; Uligova, T.S. Heavy metals in natural and technogenic ecosystems of the Central Caucasus. Russ. J. Ecol. 2007, 38, 295–298. [Google Scholar] [CrossRef]
  46. Chagarova, L.A. Natural and Technogenic Geochemical Anomalies of the Leading Ridge of the North Caucasus: Predictive and Ecological Aspects. Geogr. Bull. 2017, 3, 109–115. [Google Scholar] [CrossRef]
  47. Luganova, S.G.; Yakhyaev, M.A.; Salikhov, S.K.; Gamzaeva, A.U. The effect of a number of trace elements in the soils and natural waters of Dagestan on public health. Trace Elem. Med. 2018, 19, 41–48. (In Russian) [Google Scholar] [CrossRef]
  48. Dyachenko, V.V. Geochemistry, Systematics and Assessment of the State of Landscapes of the North Caucasus; Kompleks: Rostov-on-Don, Russia, 2004; 268p. (In Russian) [Google Scholar]
  49. Lavrishchev, V.A.; Sheikov, A.A.; Andreev, V.M.; Semenov, V.M.; Ermakov, V.A. State Geological Map of the Russian Federation; Scale 1:1,000,000 (Third Generation); Series Scythian; Sheet K37 (Sochi), K38 (Makhachkala), K39. Explanatory note; VSEGEI Cartographic Factory: St. Petersburg, Russia, 2011; 431p. (In Russian) [Google Scholar]
  50. Geological Map K 37 (Sochi); K 38 (Makhachkala); K 39. State Geological Map of the Russian Federation, 3rd ed., Scythian Series, Scale 1:1,000,000. Compiled by GNC FGUGP Yuzhmorgeologia, FGUGP Kavkazgeols’emka; Edited by N.I. Prutskii, V.M. Yubko. 2009. (Electronic Map). Available online: https://www.geokniga.org/maps/7028 (accessed on 20 April 2025). (In Russian).
  51. Ataev, Z.V. Morphometric and Morphological Features of Ridges of Highland Dagestan. Proc. Geogr. Soc. Repub. Dagestan 2006, 34, 48–53. (In Russian) [Google Scholar]
  52. Bratkov, V.V.; Salpagarov, D.S. Landscapes of the North Western and North Eastern Caucasus; Ilexa: Moscow, Russia, 2001; 256p. (In Russian) [Google Scholar]
  53. Ataev, Z.V. Landscapes of Pre Caucasian Dagestan and Their Agro-Economic Optimization. Ph.D. Thesis, Southern Federal University, Rostov-on-Don, Russia, 2002; 27p. (In Russian). [Google Scholar]
  54. Ataev, Z.V. Landscape Analysis of the Low-Mountain Foothill Zone of the North-Eastern Caucasus. Proc. Dagestan State Pedagog. Univ. Nat. Exact Sci. 2008, 1, 59–67. (In Russian) [Google Scholar]
  55. Ataev, Z.V. Distribution of Landscapes of the North-Eastern Caucasus by Altitudinal Levels and Slope Steepness. Curr. Issues Humanit. Nat. Sci. 2012, 6. Available online: https://cyberleninka.ru/article/n/raspredelenie-landshaftov-severo-vostochnogo-kavkaza-po-vysotnym-otmetkam-i-krutizne-sklonov (accessed on 15 April 2025). (In Russian).
  56. Manafova, E.K. Ecodiagnostic Indicators of Characteristic Soil Types of the North Eastern Slope of the Greater Caucasus: Shabran Region, Azerbaijan. Bull. Sci. Pract. 2019, 5, 109–116. [Google Scholar] [CrossRef]
  57. Daukaev, A.A.; Abumuslimov, A.A.; Daukaev, A.A.; Abumuslimova, I.A. Small Rivers of the South Eastern Part of the Chechen Republic. Bull. Acad. Sci. Chechen Repub. 2014, 3, 74–78. (In Russian) [Google Scholar]
  58. ISO 19258:2018; Soil Quality—Guidance on the Determination of Background Values. International Organization for Standardization (ISO): Geneva, Switzerland, 2018.
  59. PND F 16.2.2 2.3.71. Methodology for Determining Mass Fractions of Metals in Wastewater Sediments, Bottom Deposits, and Plant-Origin Samples by Spectral Methods; Technical Report; Federal Center for Analysis and Assessment of Man-Made Impacts: Moscow, Russia, 2011; 45p. (In Russian)
  60. GOST 26423-85 Soils; Methods for the Determination of Specific Electrical Conductivity, pH, and the Solid Residue of Water Extracts. STANDARDINFORM: Moscow, Russia, 2011. Available online: https://ohranatruda.ru/upload/iblock/0ca/4294828015.pdf (accessed on 1 September 2025). (In Russian)
  61. Wedepohl, K.H. The composition of the continental crust. Geochim. Cosmochim. Acta 1995, 59, 1217–1232. [Google Scholar] [CrossRef]
  62. Hakanson, L. An ecological risk index for aquatic pollution control: A sedimentological approach. Water Res. 1980, 14, 975–1001. [Google Scholar] [CrossRef]
  63. Muller, G. Index of geoaccumulation in sediments of the Rhine River. Geojournal 1969, 2, 108–118. [Google Scholar]
  64. Barbieri, M. The Importance of Enrichment Factor (EF) and Geoaccumulation Index (Igeo) to Evaluate the Soil Contamination. J. Geol. Geophys. 2016, 5, 237. [Google Scholar] [CrossRef]
  65. Saet, Y.E.; Revich, B.A.; Yanin, E.P.; Smirnova, R.S.; Basharkevich, I.L.; Onishchenko, T.L.; Pavlova, L.N.; Trefilova, N.Y.; Achkasov, A.I.; Sarkisyan, S.S. Geochemistry of the Environment; Nedra: Moscow, Russia, 1990; 335p. (In Russian) [Google Scholar]
  66. Methodological Guidelines 2.1.7.730-99. Hygienicevaluation of Soil in Residential Areas. Moscow, Federal Center for State Sanitary and Epidemiological Surveillance Ministry of Health of Russia. 1999. Available online: https://www.chemanalytica.ru/f/mu_217730-99_gigiyenicheskaya_otsenka_kachestva_pochvy_naselen.pdf (accessed on 15 April 2025). (In Russian).
  67. Methodological Guidelines for Determining Heavy Metals in Agricultural Soils and Crop Products; Central Institute of Agrochemical Support for Agriculture: Moscow, Russia, 1992; 62p. (In Russian)
  68. Saha, A.; Gupta, B.S.; Patidar, S.; Martínez-Villegas, N. Evaluation of Potential Ecological Risk Index of Toxic Metals Contamination in the Soils. Chem. Proc. 2022, 10, 59. [Google Scholar] [CrossRef]
  69. Guidance Document 52.18.885. Determination of Regional Background Concentrations of Organic Pollutants in Soils; IPGG SB RAS: Obninsk, Russia, 2019. (In Russian)
  70. Trofimov, V.T.; Ziling, D.G. Technogenic Geochemical Fields and Anomalies. In Geochemical Environmental Function of the Lithosphere; eco geo.space. 2020. Available online: https://eco-geo.space/geohimicheskaja-jekologicheskaja-funkcija-litosfery/tehnogennye-geohimicheskie-polja-i-anomalii.html?utm_source=chatgpt.com (accessed on 10 January 2025). (In Russian).
  71. Nesgovorova, N.P.; Savelyev, V.G.; Neumyvakina, N.A.; Gladkikh, T.N. The quality of urban soils as an indicator of the intensity of nature management. Geogr. Bull. 2017, 3, 99–109. [Google Scholar] [CrossRef]
  72. Shabanov, M.V.; Marichev, M.S. Geochemical Anomalies of Heavy Metals in Soils of Natural and Anthropogenic Landscapes. Izv. Tomsk. Polytech. Univ. Eng. Geo Resour. 2022, 333, 230–239. (In Russian) [Google Scholar]
  73. Galushka, A.; Migashevski, Z.; Duchmal Czernikiewicz, A.; Dołęgowska, S. Geochemical Background of Potentially Toxic Microelements in Reclaimed Soils of an Abandoned Pyrite Uranium Mine (South Central Poland). Int. J. Environ. Sci. Technol. 2016, 13, 2649–2662. [Google Scholar] [CrossRef]
  74. Darnley, A.G.; Björklund, A.; Bølviken, B.; Gustavsson, N.; Koval, P.V.; Plant, J.A.; Steenfelt, A.; Tauchid, M.; Xie, X.-J.; Garrett, R.G.; et al. Global Geochemical Database for Environmental and Resources Management: Recommendations for International Geochemical Mapping; Final Report of IGCP Project 259; UNESCO: Paris, France, 1995; 122p. [Google Scholar]
  75. Karra, K.; Kontgis, C.; Statman-Weil, Z.; Mazzariello, J.C.; Mathis, M.; Brumby, S.P. Global Land Use/Land Cover with Sentinel 2 and Deep Learning; IEEE: Manhattan, NY, USA, 2021; pp. 4704–4707. [Google Scholar]
  76. Gayrabekov, U.T. Geoecological Aspects of Oil and Gas Field Development in Mountainous and Foothill Regions (on the Example of the Chechen Republic). Sustain. Dev. Mt. Territ. 2016, 8, 312–322. (In Russian) [Google Scholar] [CrossRef]
  77. Dzhantayeva, M.B. Ecological Assessment of Anthropogenic Modification of Soils in Urbanized Areas (on the Example of Grozny). In Proceedings of the Conference of the Faculty of Education Dedicated to the 80th Anniversary of the Chechen State University, Grozny, Russia, 30 March 2018; Chechen State University: Grozny, Russia, 2018; pp. 181–185. (In Russian). [Google Scholar]
  78. Maksimovich, G.A. Mineral Resources of the Eastern Part of the Chechen-Ingush Autonomous Soviet Socialist Republic. Exploration of Subsoil Resources. Available online: https://maksimovich.info/upload/iblock/6be/l3dk3mxu91jkccubggivrqv9eib4xkhz/P-GAM-1937-Poleznye_iskopaemye_vostochnoj.pdf (accessed on 1 September 2025). (In Russian).
  79. Zhao, H.; Miao, W.; Zhang, X.; Li, W. Geochemical behaviour and influencing factors of salt-forming elements in lithium-rich salt lake region: A case study from the Nalenggele River Basin, Qaidam Basin. Aquat. Geochem. 2024, 30, 179–199. [Google Scholar] [CrossRef]
  80. Alekseenko, V.A.; Alekseenko, A.V. Chemical Elements in Geochemical Studies: Soil Clarks of Settlement Landscapes; Southern Federal University Press: Rostov-on-Don, Russia, 2013; 388p. [Google Scholar]
  81. Yang, J.; Yuan, Z.; Grunsky, E.; Cheng, Q.; Zhou, S. Analysis of geochemical patterns in a soil profile over mineralized bedrock. Geochem. Explor. Environ. Anal. 2022, 22, geochem2021-088. [Google Scholar] [CrossRef]
  82. Dietrich, F.; Diaz, N.; Deschamps, P.; Sebag, D.; Verrecchia, E.P. Calcium transfer and mass balance associated with soil carbonate in a semi-arid silicate watershed (North Cameroon): An overlooked geochemical cascade? Depos. Rec. 2021, 7, 93–110. [Google Scholar] [CrossRef]
  83. Kholdarov, D.; Kholdarova, M.; Isagaliyev, M.; Turaliyev, A. Agrogeochemistry of Barium in Desert Soils. Agrar. Bull. Ural. 2013, 3, 13–15. (In Russian) [Google Scholar]
  84. Gong, Y.; Liu, C.Y. Lithium-rich deposits in the Liangshan Formation during the Permian in the Upper Yangtze Plate, China. Minerals 2024, 14, 735. [Google Scholar] [CrossRef]
  85. Li, P.; Gong, Q.; Chen, S.; Li, P.; Li, J.; Wu, X.; Li, X.; Wang, X.; Liu, N. Regional geochemical characteristics of lithium in the Mufushan Area, South China. Appl. Sci. 2024, 14, 1978. [Google Scholar] [CrossRef]
  86. Li, J.; Li, X.; Zang, F. Pollution characteristics and probabilistic risk assessment of heavy metal(loid)s in agricultural soils across the Yellow River Basin, China. Ecol. Indic. 2024, 167, 112676. [Google Scholar] [CrossRef]
  87. Garcia, M.G.; Borda, L.G.; Godfrey, L.V.; Steinmetz, R.L.L.; Losada-Calderon, A. Characterization of lithium cycling in the Salar De Olaroz, Central Andes, using a geochemical and isotopic approach. Chem. Geol. 2020, 531, 119324. [Google Scholar] [CrossRef]
  88. Armiento, G.; Bellatreccia, F.; Cremisini, C.; Della Ventura, G.; Nardi, E.; Pacifico, R.; Petrini, E. Unusually high concentrations of beryllium background values in volcanic rocks of Lazio: Geochemistry and mineralogy. Environ. Geochem. Health 2011, 33, 91–102. [Google Scholar]
  89. Kabata-Pendias, A. Trace Elements in Soils and Plants, 4th ed.; CRC Press: Boca Raton, FL, USA, 2010. [Google Scholar]
  90. Islam, M.R.; Sanderson, P.; Johansen, M.P.; Payne, T.E.; Naidu, R. Environmental chemistry response of beryllium to diverse soil-solution conditions at a waste disposal site. Environ. Sci. Process. Impacts 2023, 25, 94–109. [Google Scholar] [CrossRef]
  91. Zuzolo, D.; Cicchella, D.; Lima, A.; Guagliardi, I.; Cerino, P.; Pizzolante, A.; Thiombane, M.; De Vivo, B.; Albanese, S. Potentially toxic elements in soils of Campania region (Southern Italy): Combining raw and compositional data. J. Geochem. Explor. 2020, 213, 106524. [Google Scholar] [CrossRef]
  92. Boschi, V.; Willenbring, J.K. Beryllium desorption from minerals and organic ligands over time. Chem. Geol. 2016, 439, 52–58. [Google Scholar] [CrossRef]
  93. Han, J.; Mammadov, Z.; Kim, M.; Mammadov, E.; Lee, S.; Park, J.; Mammadov, G.; Elovsat, G.; Ro, H.M. Spatial distribution of salinity and heavy metals in surface soils on the Mugan Plain, the Republic of Azerbaijan. Environ. Monit. Assess. 2021, 193, 95. [Google Scholar] [CrossRef]
  94. Fernández-Caliani, J.C.; Romero-Baena, A.; González, I.; Galán, E. Geochemical anomalies of critical elements (Be, Co, Hf, Sb, Sc, Ta, V, W, Y and REE) in soils of western Andalusia (Spain). Appl. Clay Sci. 2020, 191, 105610. [Google Scholar] [CrossRef]
  95. Khan, S.; Naushad, M.; Lima, E.C.; Zhang, S.; Shaheen, S.M.; Rinklebe, J. Global soil pollution by toxic elements: Current status and future perspectives on the risk assessment and remediation strategies—A review. J. Hazard. Mater. 2021, 417, 126039. [Google Scholar] [CrossRef] [PubMed]
  96. Barsova, N.; Yakimenko, O.; Tolpeshta, I.; Motuzova, G. Current State and Dynamics of Heavy Metal Soil Pollution in Russian Federation—A Review. Environ. Pollut. 2019, 249, 200–207. [Google Scholar] [CrossRef] [PubMed]
  97. Fu, T.; Rakova, O.; Simakhina, V. Rare-earth elements in the topsoils of a Russian industrial city: Sources and human health risk assessment. Chemosphere 2024, 357, 142059. [Google Scholar] [CrossRef] [PubMed]
  98. Yahyaev, M.A.; Salikhov, S.K.; Kurbanova, Z.V.; Abusueva, B.A.; Luganova, S.G. Environmental lead concentrations and incidence of hypertension in the Kizilyurt district, Dagestan. Ekol. Cheloveka (Hum. Ecol.) 2020, 27, 4–10. [Google Scholar] [CrossRef]
  99. Magomedova, M.A.; Adzhieva, A.I.; Yakhiaev, M.A.; Magomedaliev, Z.G. Biological productivity and heavy metal content in the soils of mountain landscapes in Dagestan. Vestn. Dagest. Gos. Univ. 2012, 1, 171–175. (In Russian) [Google Scholar]
  100. Bashirov, R.R.; Magomedaliev, Z.G. Content and distribution of lead in the soils of foothill Dagestan. Vestn. Dagest. Nauch. Tsentr. 2013, 51, 56–61. (In Russian) [Google Scholar]
  101. Hong, Y.; Chen, S.; Zhang, Y.; Chen, Y.; Yu, L.; Liu, Y.; Liu, Y.; Cheng, H.; Liu, Y. Rapid identification of soil organic matter level via visible and near-infrared spectroscopy: Effects of two-dimensional correlation coefficient and extreme learning machine. Sci. Total Environ. 2018, 644, 1232–1243. [Google Scholar] [CrossRef]
  102. Zhou, W.; Yang, H.; Xie, L.; Li, H.; Huang, L.; Zhao, Y.; Yue, T. Hyperspectral inversion of soil heavy metals in Three-River Source Region based on random forest model. Catena 2021, 202, 105222. [Google Scholar] [CrossRef]
  103. Jeong, H.; Ryu, J.-S.; Ra, K. Characteristics of potentially toxic elements and multi-isotope signatures (Cu, Zn, Pb) in non-exhaust traffic emission sources. Environ. Pollut. 2022, 292, 118339. [Google Scholar] [CrossRef]
Figure 2. Geographic location of the research area: (A) river network diagram; (B) location of sampling points on the topographic map
Geosciences 15 00380 g002
Figure 3. Location and position of the sampling site in the longitudinal profile of the Sharoargun River (the Sunzha Basin).
Geosciences 15 00380 g003
Figure 4. Distribution of the contamination factor (Cf) values.
Geosciences 15 00380 g004
Figure 5. Distribution of the enrichment factor values.
Geosciences 15 00380 g005
Figure 6. Spatial distribution of the geoaccumulation index of (a) Na and (b) Zn.
Geosciences 15 00380 g006
Figure 7. Distribution of values of the modified contamination factor (mCf).
Geosciences 15 00380 g007
Figure 8. Distribution of pollution index (PLI) values.
Geosciences 15 00380 g008
Figure 9. Value of the total pollution index (Zc) in the basins of the Ulluchay, Sulak, and Sunzha Rivers.
Geosciences 15 00380 g009
Figure 10. Geochemical anomalies in the basins of the Ulluchay, Sulak, and Sunzha Rivers.
Geosciences 15 00380 g010
Figure 11. Chemical element correlation matrix.
Geosciences 15 00380 g011
Figure 12. Dendrogram based on correlation.
Geosciences 15 00380 g012
Figure 13. Factor loading of the potential toxic elements in the basins of the Ulluchay, Sulak, and Sunzha Rivers.
Geosciences 15 00380 g013
Table 1. Analytical results for calibration curve and percentage recovery (% R), limit of detection (LOD) and limit of quantification (LOQ), calibration correlation coefficients (Rc), and relative percentage differences for replicate samples (RPD) for the analyzed elements.
Chemical Element% RLODLOQRcRPD, %
Li84.20.01277.33740.99963.7
Be99.50.00120.35101.02.6
Na96.724.3847199.76050.99994.1
Mg98.10.16926.96700.99993.6
Al98.917.172369.78670.99993.6
Ca99.25.773950.64670.99993.3
Sc96.40.01032.57010.99994.6
V93.40.09072.34490.99995.5
Cr83.40.30073.07970.99964.1
Mn99.90.01171.27411.03.8
Fe98.715.910767.00710.99993.6
Co99.70.00260.35531.03.2
Ni86.30.06630.22120.99972.7
Cu96.90.20096.19470.99992.6
Zn92.80.35447.61210.99997.4
As98.80.16860.56210.99996.9
Pb97.40.023590.78620.999914.7
Mo93.00.00992.17350.99996.7
Ag97.10.00440.80240.99999.1
Cd95.60.01021.90040.99995.0
Sn96.70.02501.06840.99995.9
Sb98.90.00290.70760.99998.0
Te97.60.00970.30390.99998.4
Cs98.50.00140.34260.99997.9
Ba93.90.02093.27500.99995.1
Table 2. Limits of detection of chemical elements.
Chemical ElementDetection Limit, mg/LCorrelation Coefficient
Li0.01270.999990
Be0.00120.999996
Na24.38470.999992
Mg0.16920.999938
Al17.17230.999956
Ca5.77390.999933
Sc0.01030.999967
V0.09070.999997
Cr0.30070.999967
Mn0.01170.999990
Fe15.91070.999993
Co0.00261.000000
Ni0.06630.999720
Cu0.20091.000000
Zn0.35441.000000
As0.16860.999998
Pb0.23590.999990
Mo0.00990.999997
Ag0.00440.999995
Cd0.01020.999995
Sn0.02500.999997
Sb0.00290.999997
Te0.00971.000000
Cs0.00140.999989
Ba0.02090.999977
Table 3. Concentrations of potential toxic elements («heavy metals») and trace elements in the landscapes of the Ulluchay, Sulak, and Sunzha River Basins.
Chemical ElementChemical Element Content, mg/kgCoefficient of Variation
MeanMAXMINCV, %Clarke
Na26,609.11306,600.707.3023624,260
Ca55,108.49289,181.00747.799425,660
Mg18,570.8682,658.311.3210114,950
Ba526.163808.8132.34144628
Li20.2282.961.207822
Cs3.4011.290.04784.9
Be0.843.280.01762.30
As13.3245.91.74665.60
Sb0.571.880.01750.81
Sn2.3911.600.01852.5
Fe39,395.7599,382.7368.706740,600
Co15.8144.831.575715
Mn1642.57431.185.6685770
Mo9.0564.330.011761.1
V55.45181.661.4769106
Cu184.06958.70.7912427
Ni298.8851.5241.125650
Zn1010.2914,012.16.0518675
Cd2.2810.650.051190.09
Pb24.770.800.2955817
Ag1.879.010.31960.05
Al37,646.43205,729.7239.1910476,100
Sc6.8220.920.01507
Cr648.22337.7019.7210092
Te0.57 1.970.015940.01
Table 4. Number of sites with an accumulation of chemical elements (Kk > 1).
More Than Half26–50 Sites11–25 SitesLess Than 10 Sites
Ni, Cr, Zn, Cu, Pb, Ca, Mn, As, Mo, TeLi, Mg, Sc, Fe, Co, Ag, Cd, Sn, CsBa, Al, Na, V, SbBe
Table 5. Regional background content of investigated elements in soils for natural areas of the Northeastern Caucasus.
Chemical ElementX ± P (mg/kg) *Indicator
CV (%) *Q *
Pb19.55 ± 2.84580.73
Zn367.9 ± 375.11854.52
Cu78.6 ± 45.31241.69
Li14.87 ± 3.14781.8
Be0.55 ± 0.13761.11
Na1988.1 ± 12,627.122362.82
Mg8615.36 ± 3776.151011.57
Ca32,373.52 ± 10,384.6941.72
Al21,292.56 ± 7761.91041.99
Sc6.0 ± 0.68500.99
Mn1184.75 ± 274.95852.13
Fe28,040.16 ± 5290.36670.32
Co13.16 ± 1.77570.81
Ni247.7 ± 33.3560.77
As10.52 ± 1.75660.93
Mo2.19 ± 23.291762.25
Te0.34 ± 0.14941.24
Cs2.17 ± 0.53780.90
Ba290.7 ± 152.11443.05
Sb0.35 ± 0.11750.93
Sn1.46 ± 0.7850.69
V41.2 ± 7.64691.17
Cd0.97 ± 0.831191.53
Ag1.44 ± 0.58962.98
Cr357.0 ± 127.91001.01
Te0.34 ± 0.14941.24
* Note: X—arithmetic mean value (mg/kg); P—confidence interval (mg/kg); CV—coefficient of variation (%); Q—coefficient of asymmetry.
Table 6. Distribution of exceedance of the total pollution index by the Ulluchay, Sulak, and Sunzha River Basins.
River Basin1 (Zc < 16)2 (Zc 16–32)3 (Zc 32–128)4 (Zc > 128)
Ulluchay River6256
Sulak River12997
Sunzha River791116
Table 7. Confinement of geochemical anomalies to the basins of the Ulluchay, Sulak, and Sunzha Rivers.
№ of SitesChemical ElementRiver BasinpHTopography and LandformGeological BackgroundLand Use Type
4BaSulak8.05Steep slope (1000 m)LimestoneMountain pasture
46NaSulak6.67Gentle slope, highlands (2009 m)Colluvium of sandstones and claysHaymaking, mountain pasture
57BaSunzha7.57Floodplain, leveled surface (464 m)Limestone alluviumMountain pasture
63ZnSunzha7.99Gentle slope (149 m)Clays with sandstones and siltstonesMountain pasture
70AgSunzha6.75Gentle slope (195 m)ClayMountain pasture
78ZnSunzha5.55Steep slope, highlands (2028 m)Clay shalesMountain pasture
81BaSunzha8.74Gentle slope (336 m)ClayMountain pasture
85AgSunzha7.60Watershed, top of the ridge (829 m)ClayHaymaking, mountain pasture
89Li, Sc, AsSunzha6.05Gentle slope (1816 m)Clay shales and limestone Mountain pasture
95BaSunzha8.14Above-floodplain terrace, leveled surface
(430 m)
Marl and limestone alluviumMountain pasture
Disclaimer/Publisher’s Note: The statements, opinions and data contained in all publications are solely those of the individual author(s) and contributor(s) and not of MDPI and/or the editor(s). MDPI and/or the editor(s) disclaim responsibility for any injury to people or property resulting from any ideas, methods, instructions or products referred to in the content.