Article

Effective Elastic Moduli at Reservoir Scale: A Case Study of the Soultz-sous-Forêts Fractured Reservoir

by
Dariush Javani
*,
Jean Schmittbuhl
and
François H. Cornet
ITES/EOST, University of Strasbourg/CNRS, 5 rue Réné Descartes, 67084 Strasbourg Cedex, France
*
Author to whom correspondence should be addressed.
Passed away on 23 May 2020.
Geosciences 2025, 15(10), 371; https://doi.org/10.3390/geosciences15100371
Submission received: 10 August 2025 / Revised: 8 September 2025 / Accepted: 17 September 2025 / Published: 24 September 2025
(This article belongs to the Section Geomechanics)

Abstract

The presence of discontinuities in fractured reservoirs, their mechanical and physical characteristics, and fluid flow through them are important factors influencing their effective large-scale properties. In this paper, the variation of elastic moduli in a block measuring 100 × 100 × 100 m3 that hosts a discrete fracture network (DFN) is evaluated using the discrete element method (DEM). Fractures are characterised by (1) constant, (2) interlocked, and (3) mismatched stiffness properties. First, three uniaxial verification tests were performed on a block (1 × 1 × 2 m3) containing a circular finite fracture (diameter = 0.5 m) to validate the developed numerical algorithm that implements the three fracture stiffnesses mentioned above. The validated algorithms were generalised to fractures in a DFN embedded in a 100 × 100 × 100 m3 rock block that reproduces in situ conditions at various depths (4.7 km, 2.3 km, and 0.5 km) of the Soultz-sous-Forêts geothermal site. The effective elastic moduli of this large-scale rock mass were then numerically evaluated through a triaxial loading scenario by comparing to the numerically evaluated stress field using the DFN, with the stress field computed using an effective homogeneous elastic block. Based on the results obtained, we evaluate the influence of fracture interaction and stress perturbation around fractures on the effective elastic moduli and subsequently on the large-scale P-wave velocity. The numerical results differ from the elastic moduli of the rock matrix at higher fracture densities, unlike the other methods. Additionally, the effect of nonlinear fracture stiffness is reduced by increasing the depth or stress level in both the numerical and semi-analytical methods.

1. Introduction

Rock masses contain discontinuities on multiple scales, which play a crucial role in supporting externally imposed stresses [1]. These discontinuities are of significant engineering importance due to their strong influence on the mechanical and hydraulic behaviour of rock masses [2,3,4,5,6,7,8,9,10,11]. Compared to the rock matrix, jointed rock masses are weaker, more deformable, and highly anisotropic and heterogeneous [12]. Therefore, constitutive modelling of jointed rock masses has been an active area of research, and numerous models have been developed to simulate their mechanical response. In general, these models can be classified into two categories: discrete models and continuum models. In discrete models, joints are explicitly represented, which often results in very large and computationally demanding problems when the jointing is pervasive and closely spaced. On the contrary, continuum models treat the joined rock mass as an equivalent continuum material characterised by effective properties or elastic moduli that capture the influence of joints [12].
Simmons and Brace [2] and Walsh [3] were among the first to demonstrate the influence of microcracks on the effective elastic moduli of the rock matrix. Since then, numerous studies have sought to characterize these effects, often by introducing simplifying assumptions, such as reducing the problem to a single frictionless, ellipsoid-shaped fracture embedded in a homogeneous elastic matrix (e.g., [13,14,15,16,17]) or by neglecting/simplifying stress interactions within a network of frictionless cracks of limited size range [18,19,20,21,22,23]. The role of friction in crack faces in constitutive relationships and geomechanical parameters has also been recognised as critical—for example, normal and shear fracture stiffness, which relate stresses to displacements along fracture walls [24,25,26,27], and the Coulomb criterion, which defines the transition between elastic stick and slip behaviour [28].
However, investigations of fractured rock deformability often rely on simplifications, especially the assumption of constant fracture stiffness independent of normal and shear stresses (e.g., [29,30,31,32,33,34,35]), with only a few exceptions [36,37]. Davy et al. [37] recently proposed an analytical approach to estimate the elastic properties of fractured rock masses, taking into account fracture frictional behaviour and a power law size distribution. However, this method does not incorporate fracture interactions or resulting stress perturbations in the vicinity of fractures.
To overcome this limitation, the present study investigates the effective elastic moduli of fractured rock masses by explicitly incorporating the stress-dependent fracture stiffness model proposed by Bandis et al. [24] within the framework of the discrete element method (DEM). Numerical simulations were performed using the 3DEC software package version 5.2 (Itasca Consulting Group), which is particularly suited to analysing the hydro-mechanical behaviour of discontinuous media governed by nonlinear fracture mechanics.

2. Materials and Methods

2.1. Discrete Fracture Network (DFN)

The geometric characterisation of discontinuities is defined by their spatial position or density, orientation (dip and dip direction), size, and thickness, or hydraulic aperture. Fracture and fault systems can be described using either deterministic or stochastic approaches. In the deterministic approach, each fracture or fault is represented explicitly as a plane with defined characteristics, including dip, dip direction, size, position, and hydraulic aperture. In contrast, the stochastic approach, which has been a major focus of research over the past five decades, statistically represents fractures and faults as ensembles of planes, with their properties governed by probability distribution models such as lognormal, gamma, or power law.
Bonnet et al. [38] provided a comprehensive overview of these models, noting that the lognormal distribution is particularly suitable for fracture length distributions [39,40], the exponential distribution is commonly applied to characterise discontinuity sizes [41,42,43,44,45,46], and the gamma distribution is widely used in fault and earthquake statistics, as well as seismic hazard assessments [47,48,49]. Numerous investigations across different scales and tectonic settings indicate that while some fracture systems are well described by scale-limited laws such as lognormal or exponential distributions, it is increasingly recognised that power-law and fractal geometries provide more robust and widely applicable frameworks for characterising fracture networks [38]. The principal implication of power law and fractal scaling lies in the absence of a characteristic length scale in fracture growth processes, subject only to upper and lower bounds [38].
Davy et al. [50] proposed a first-order dual-power-law model that links the fractal spatial patterns of fractures to power-law distributions of fracture length and fracture centres as follows:
n l , L d l = α L D M l a d l ,           l l m i n , l m a x
where n l , L d l is the number of fractures having a length between l and l + d l in a box of size L , D M is the mass dimension of fracture barycenter, a is the exponent of the frequency distribution of fracture lengths, and α is a fracture density term which is not essentially equal to the common fracture density values such as P10 or P32 but is, in fact, the number of fractures, traces or fracture lengths, or intersections that is required to cover the fractal box or surface or line [38]. In the model, it is assumed that the length distribution of fractures follows a power law, but Equation (1) is valid regardless of D M value, even for a non-fractal distribution of elements in a plane ( D M = 2 ), or in a volume ( D M = 3 ) [51].

2.2. Fracture Deformation

Discontinuities may exhibit a wide range of morphologies, from rough and undulating to planar and smooth, and may be filled with soft inclusions, healed with hard minerals, tightly interlocked, or open. Consequently, when subjected to compression or shear loading, they exhibit markedly different mechanical behaviours [52]. These characteristics prevent opposing joint surfaces from achieving full contact, thus creating aperture spaces. Under compressive loading, contact occurs progressively at distant asperities on the fracture walls, leading to an increase in normal stiffness ([53] and references therein). This process results in normal strong non-linearity in fracture displacement and, consequently, in normal stiffness [24,53]. Similarly, the shear stiffness of fractures has been shown to depend on both normal and shear stresses and likewise exhibits non-linear behaviour [54].
The stiffness matrix influences the normal and shear displacement in a known stress regime. This matrix has two diagonal components (knn and kss) and two non-diagonal components (kns and ksn), where the latter components are commonly assumed to be zero [1].
σ n τ = k n n k n s k s n k s s d n d s
where σ n is normal stress, τ is shear stress, and d n and d s are normal and shear displacements of joint, respectively.
Bandis et al. [24] conducted a series of experiments on fresh and weathered joints of five different rock types under normal and shear loading conditions and subsequently fitted empirical curves to the experimental observations. Normal deformability was investigated through loading–unloading cycles and repeated load cycle tests performed on intact rock samples, as well as on fractured samples with interlocked or mismatched joints. To create mismatched joints, the halves of interlocked samples were deliberately displaced relative to each other by 0.5–1.0 mm. The fracture closure, illustrated schematically in Figure 1, was then determined by subtracting the displacement of the intact rock specimen (dr) from the total displacement of the fractured specimen (dt) [24], as
d n = d t d r
In both interlocked and mismatched joints, the relationship between sample deformability and applied stress exhibited non-linear behaviour, regardless of rock type. The normal stress–closure response of interlocked joints is well described by a hyperbolic equation, expressed as
σ n = k n i d n d n m d n m d n
For mismatched joints, a semi-logarithmic function provided the best fit [55], expressed as
log ( σ n ) = p + q d n
In Equation (4),   k n i is normal stiffness of the fracture at initial state or under in situ stress state, and d n m is maximum closure of the joint. p in Equation (5) is logarithm of initial normal stress ( σ n i ) value at which closure measurements take place (0.15 MPa in the tests carried out in [24]), and q, which is called “stiffness characteristics” [56,57], represents the slope of log ( σ n ) versus d n curve. p and q depend on the type of rock and joint properties. The value of normal stiffness at any level of normal stress can be found from the derivative of Equations (4) and (5) for interlocked and mismatched joints, respectively:
k n = k n i 1 σ n d n m k n i + σ n 2
k n = q · σ n 0.4343
Bandis et al. [24] investigated the shear deformability of fresh and weathered joint types by performing direct shear tests under varying normal stresses up to the mobilisation of peak shear strength. The resulting shear stress–shear displacement curves exhibited non-linear behaviour, which was well represented by hyperbolic functions, including the formulation introduced by Kulhawy [58], expressed as
τ = d s m + n d s
where d s is shear displacement at a level of shear stress τ , and m and n are constants of hyperbola represented as inverse of the initial shear stiffness, 1 / k s i , and the reciprocal of the horizontal asymptote, 1 / τ u l t , to the hyperbolic of shear stress–shear displacement. This parameter depends on the condition of the sample during the direct shear test, particularly in cases where the residual shear strength has not yet been reached and additional displacement is required. Consequently, the ultimate shear strength is greater than the residual shear strength but less than the peak shear strength (Barton, personal communication). The shear stiffness of the fracture can then be derived from the development of Equation (8), expressed as
k s = k j σ n n j 1 τ · R f τ p 2
which is the tangent shear stiffness of a joint at any level of shear and normal stresses. In (9), k j is stiffness number, n j is stiffness exponent, R f is failure ratio, which is defined as τ / τ u l t , and τ p is peak shear strength of the fracture, which can be explained as
τ p = C + μ · σ n
where C is the cohesive strength of the fracture, and μ is the friction coefficient [1].
In this study, the distinct element method (DEM) was used to evaluate the effective elastic moduli of fractured rock masses, considering the fracture stiffness governed by the empirical models of Bandis et al. [24], as expressed in Equations (6), (7) and (9). The DEM software used, 3DEC, inherently assumes constant fracture stiffness components; therefore, it was necessary to develop and implement a numerical algorithm to account for the stress-dependent fracture stiffness described by Bandis et al. [24]. Validation tests were first carried out on a 1 × 1 × 2 m3 block containing a circular finite fracture with a diameter of 0.5 m, to verify the numerical algorithm against the empirical models. Subsequently, the algorithm was generalised to the fractures within a discrete fracture network (DFN) applied to an intact 100 × 100 × 100 m3 rock block to evaluate the effective elastic moduli of the resulting fractured rock mass. The numerical results were then compared to the effective elastic moduli obtained for a rock mass containing fractures with constant stiffness.

2.3. Numerical Scheme

3DEC (ITASCA Consulting Group, Inc., Minneapolis, MN, USA) [59] is a distinct element numerical tool based on a dynamic (time domain) algorithm that solves the equations of motion of the block system by an explicit finite-difference method. At each timestep, the law of motion and constitutive equations are applied. For blocks, subcontact force–displacement relations are prescribed. The integration of the law of motion provides the new block positions and, therefore, the contact–displacement increments (or velocities). The subcontact force–displacement law is then used to obtain the new subcontact forces, which are to be applied to the blocks in the next timestep.
F n = k n d n A c
F s = k s d s A c
where d n and d s are relative normal and shear displacement increments at each time step, and Ac is the area of the subcontact. Total normal force and shear force vectors are then updated for the subcontact as follows:
F n : = F n + F n
F s : = F s + F s
The constant normal stiffness of a fracture ( k n ) means the existence of a linear relation between effective normal stress ( σ n ) and joint displacement ( d n ) [60], as in
σ n = K n d n
The same applies to shear joint stiffness as well.
Here, the normal stiffness required for calculation of the increase in normal force using Equation (11) is obtained from Equations (6) and (7), depending on the type of joint under consideration (for interlocked and mismatched joints, respectively). The shear stiffness to be used in Equation (12) is also obtained from Equation (9). At each time step, the normal and shear stiffness values obtained from previous time step are used to calculate the increment of normal and shear forces and, consequently, the total normal and shear force values at current time step. For example, Equations (16)–(18) describe calculation of the total normal force at time step i +1 for an interlocked joint. Generalisation of these equations for mismatched joints and for shear force calculations is straightforward.
k n i = k n i 1 σ n i V m k n i + σ n i 2
F n i + 1 = k n i d n i + 1 A c i + 1
F n i + 1 = F n i + F n i + 1
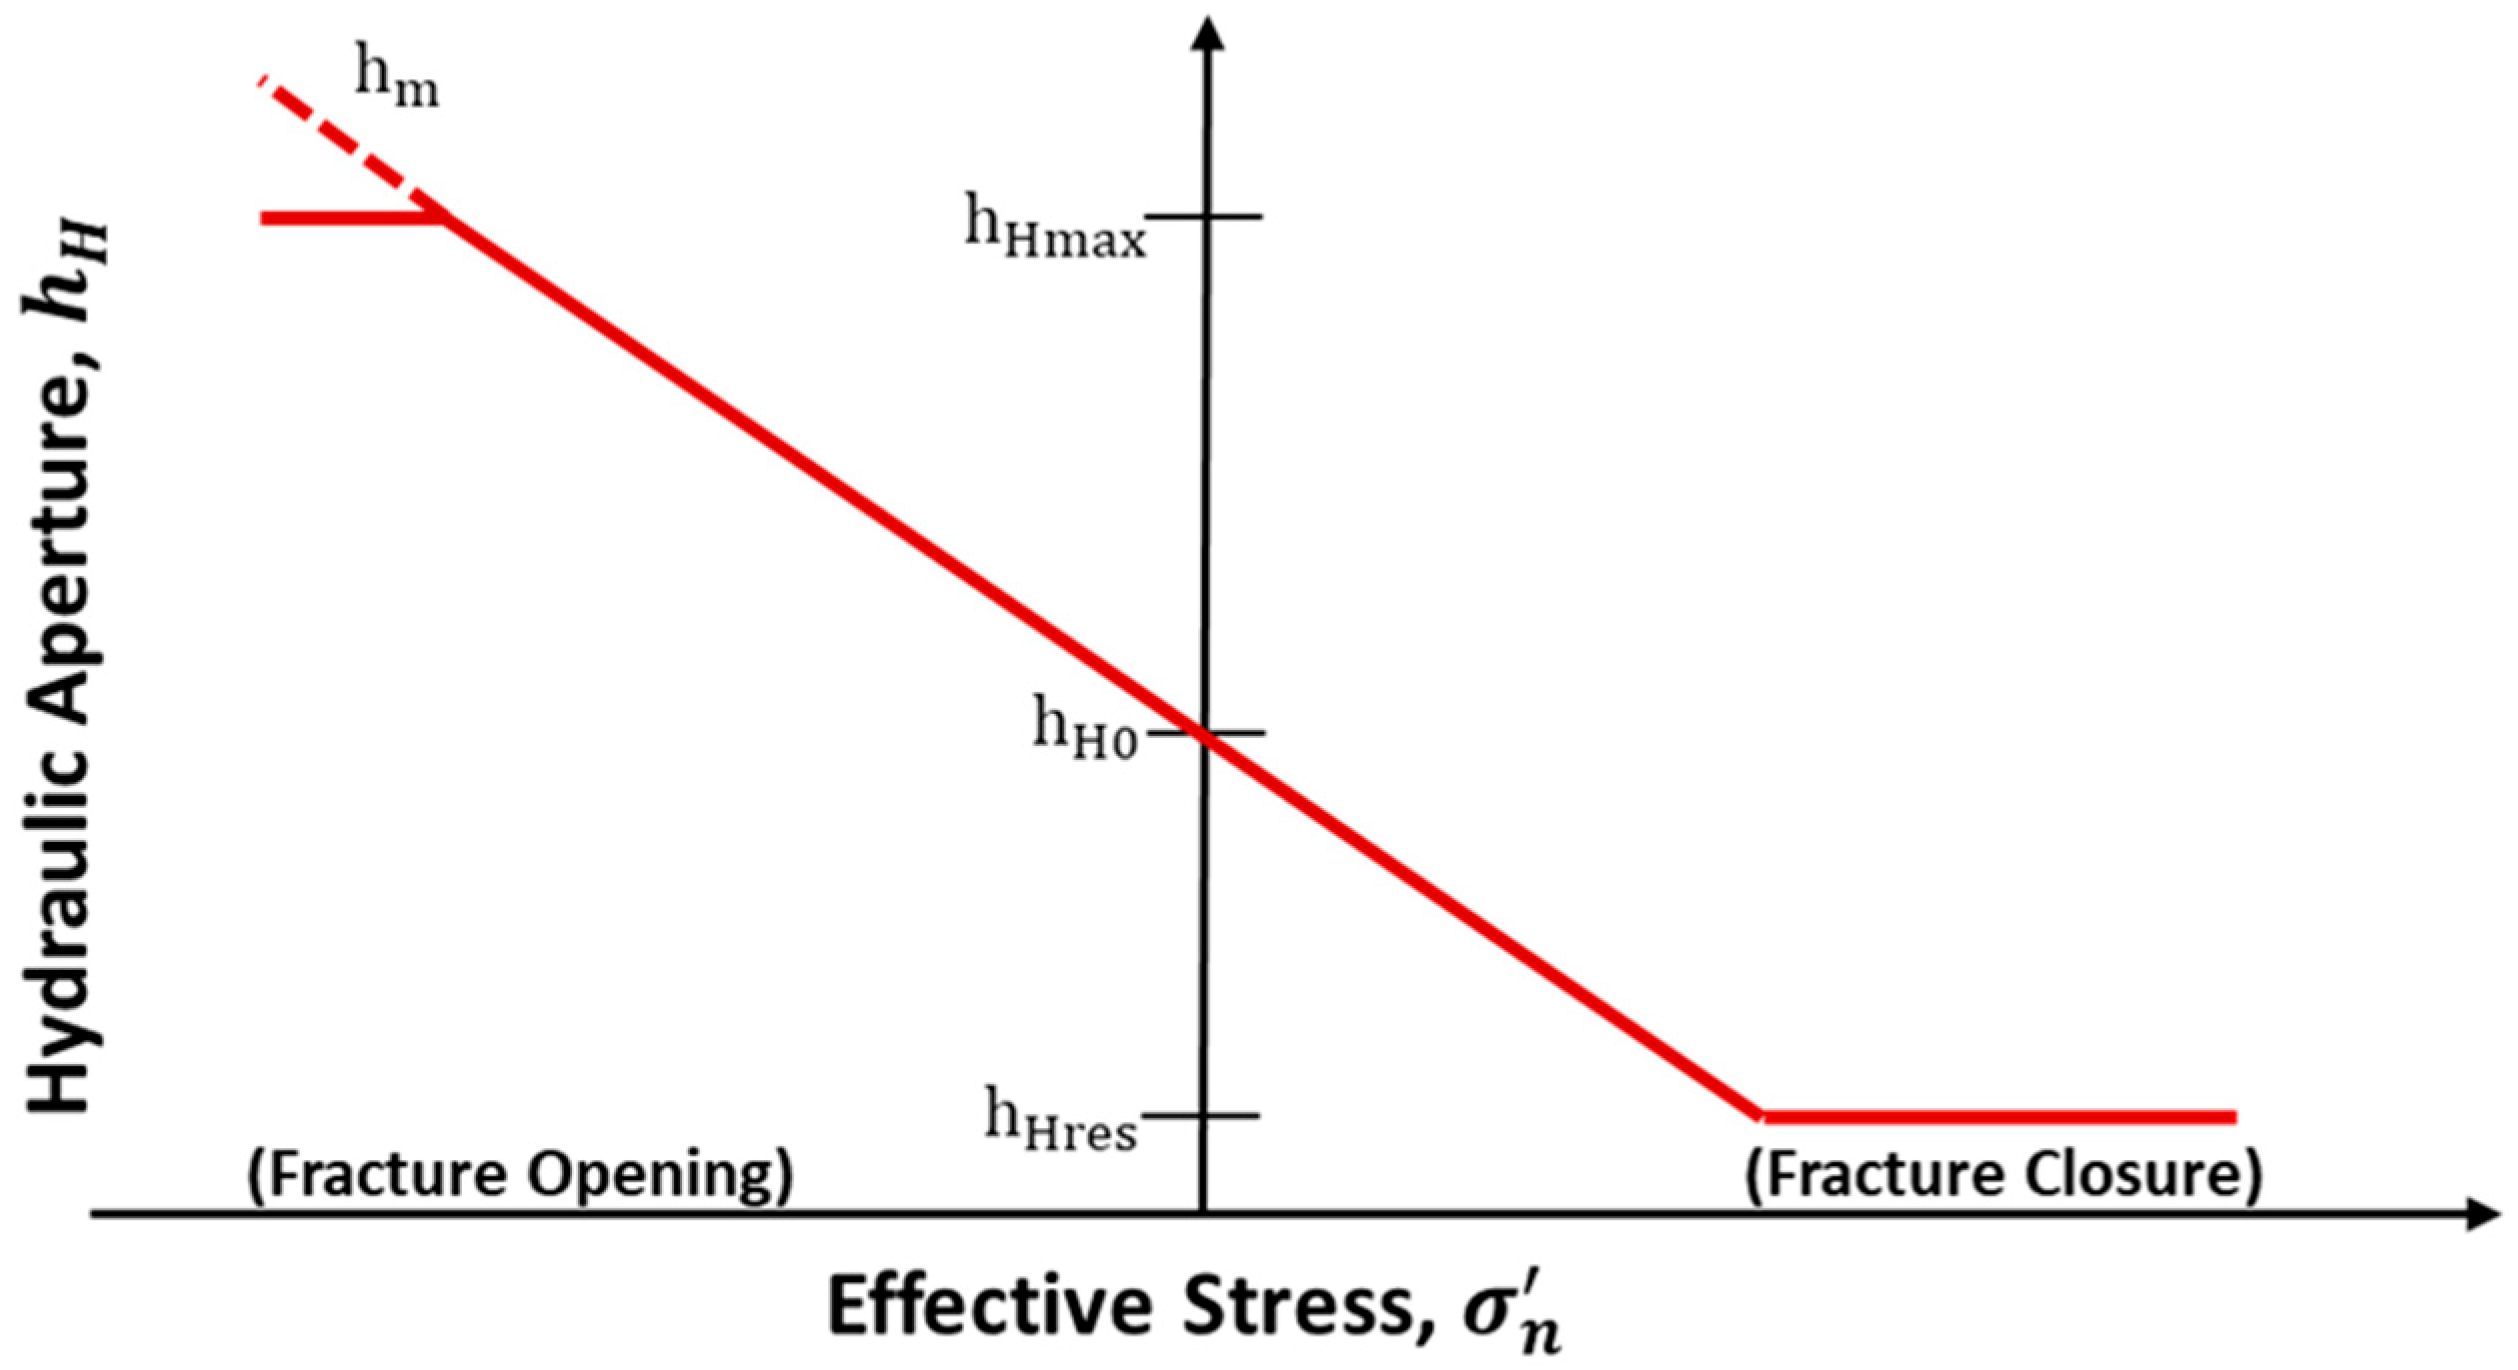
In 3DEC, a linear relationship is assumed between the aperture and the normal effective stress (Figure 2), leading to a constant normal joint stiffness, which is the default behaviour in 3DEC. The relation between hydraulic aperture ( h H and effective normal stress is a linear curve, as in
h H = h H 0 + d n
where h H 0 is the joint aperture at zero normal stress or initial hydraulic aperture.

3. Verification Models

Applying loads to intact rock or fractured rock mass specimens in laboratory experiments is mainly carried out by two methods of strain (displacement) and stress (load) control [61], among other existing methods (e.g., [62,63]). Here, we used a FISH (a programming language used by Itasca numerical tools) algorithm provided by Itasca [59] to impose strain-controlled loading boundary condition. Loading velocity in this algorithm is controlled by maximum unbalanced force to avoid inertial shocks to the model. This algorithm was utilised through a set of uniaxial compression tests carried out on an elastic, homogeneous, isotropic block hosting a circular finite size fracture. Properties of rock matrix and fracture used in the test were adapted from the literature about Soultz-sous-Forêts geothermal reservoir. In Table 1, all parameters assigned to the surrounding rock matrix and the fracture are listed.
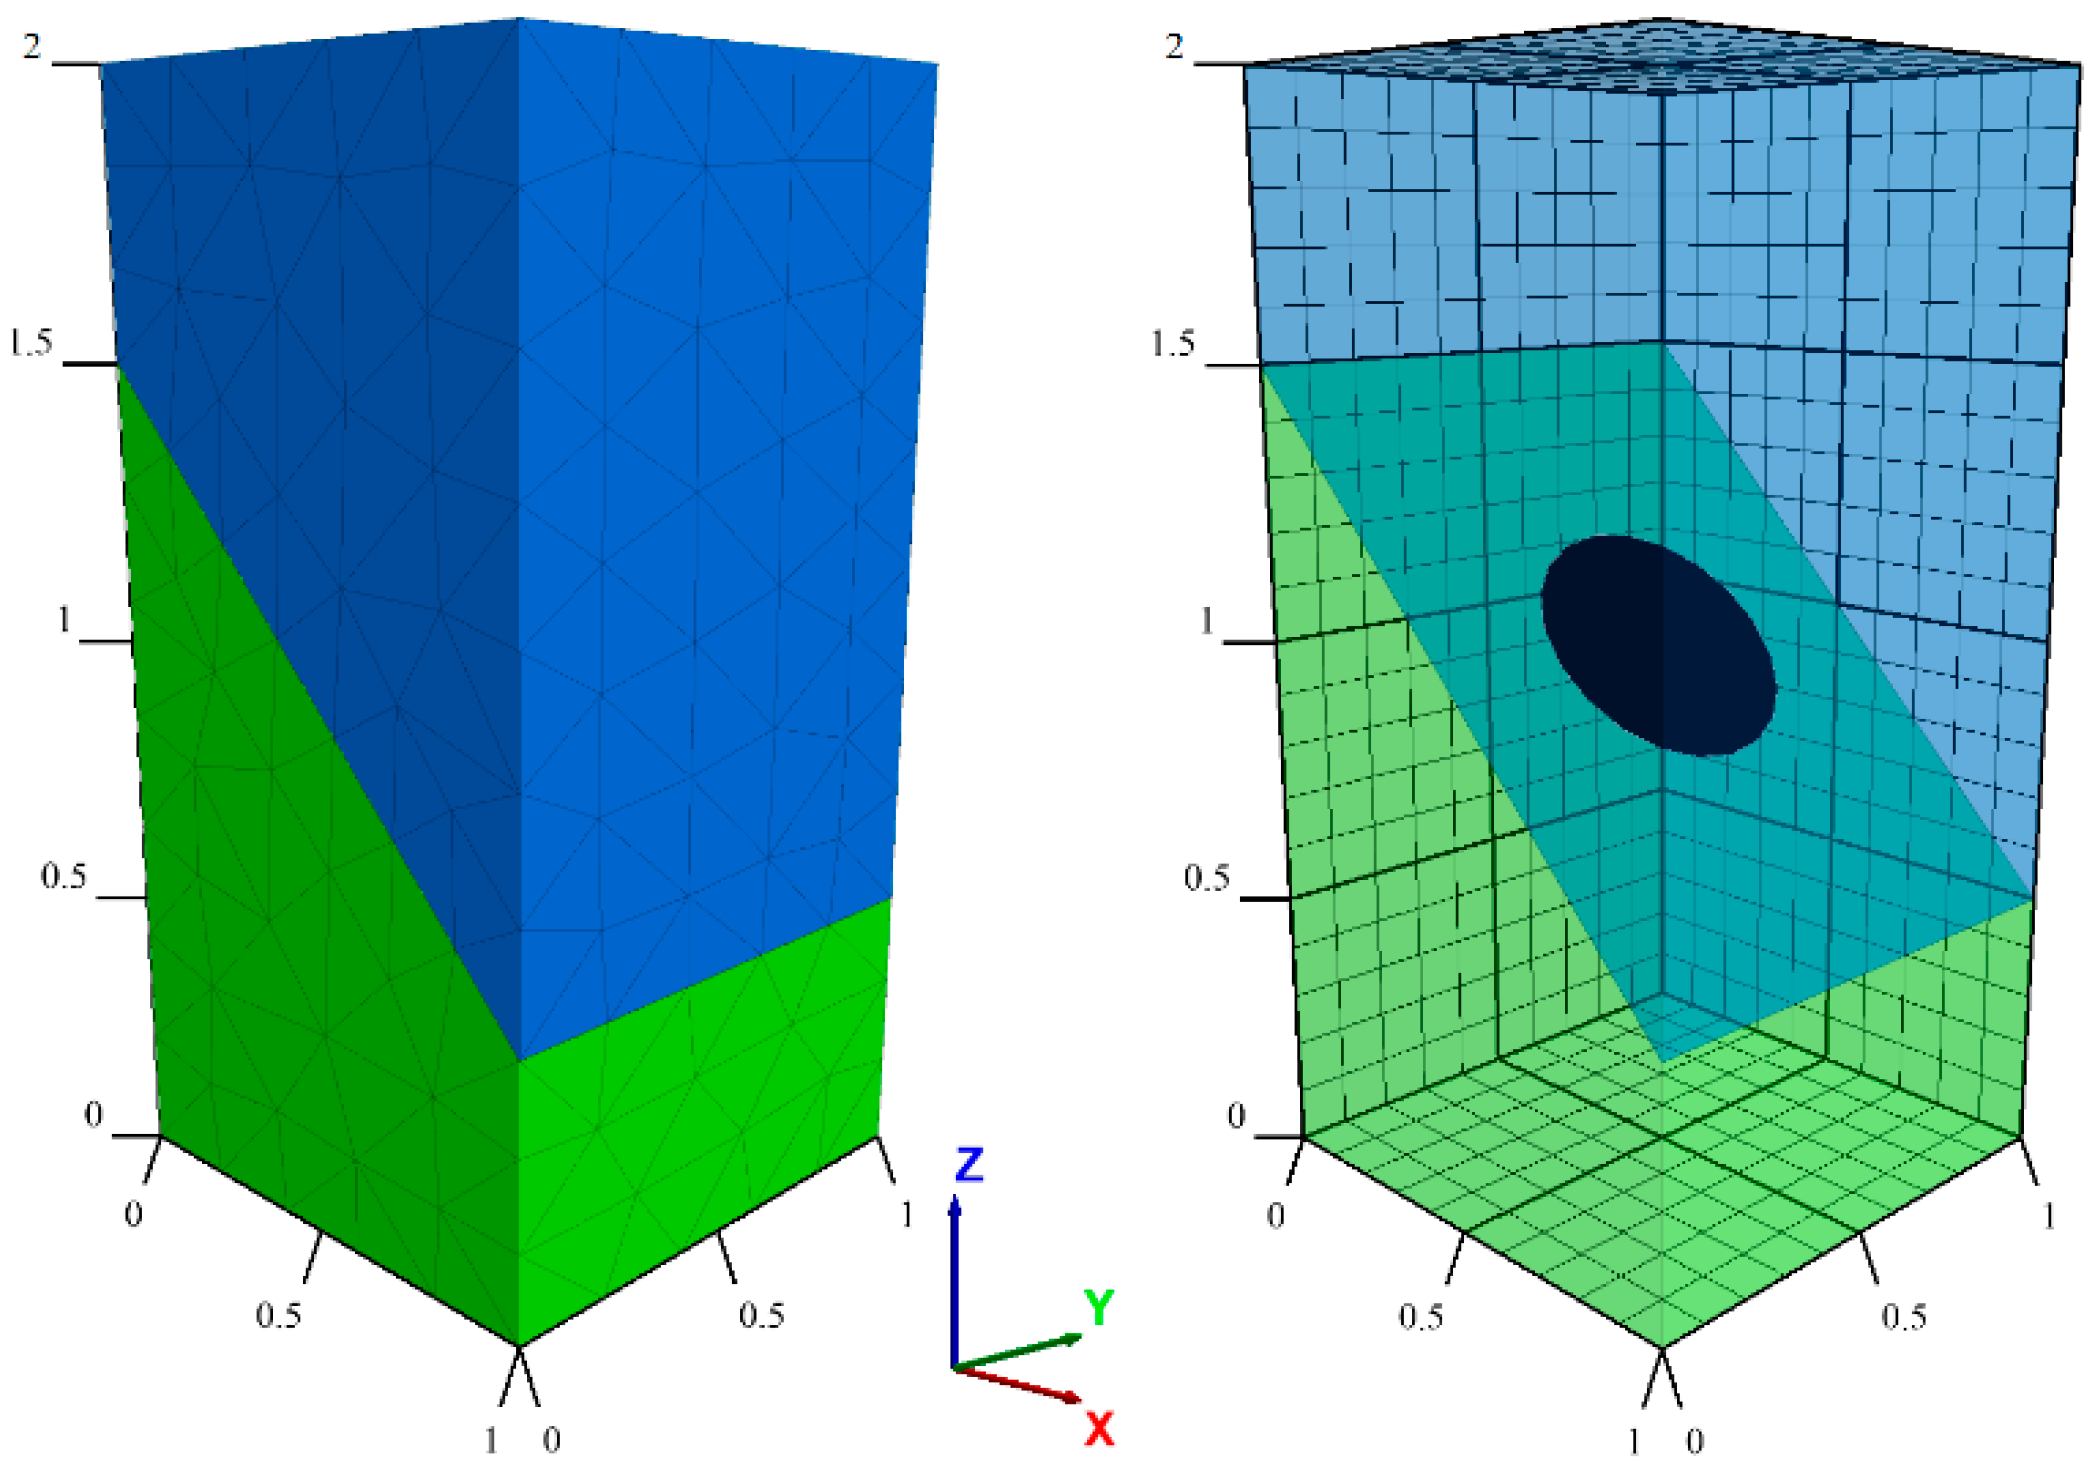
Figure 3 illustrates the model used for the verification tests. A constant downward velocity boundary condition of 0.1 mm/s was applied vertically at the top of the block to impose stress, while the bottom surface was fixed with a zero-velocity boundary condition. The lateral sides of the block were left free to move by applying zero-stress boundary conditions. The tests were terminated when the vertical displacement at the top of the block reached 0.5 mm. During the loading process, the magnitudes of normal and shear stresses, as well as displacement components on the circular fracture plane, were recorded. The results were then plotted and compared to empirical values obtained from Equations (4), (5) and (8).
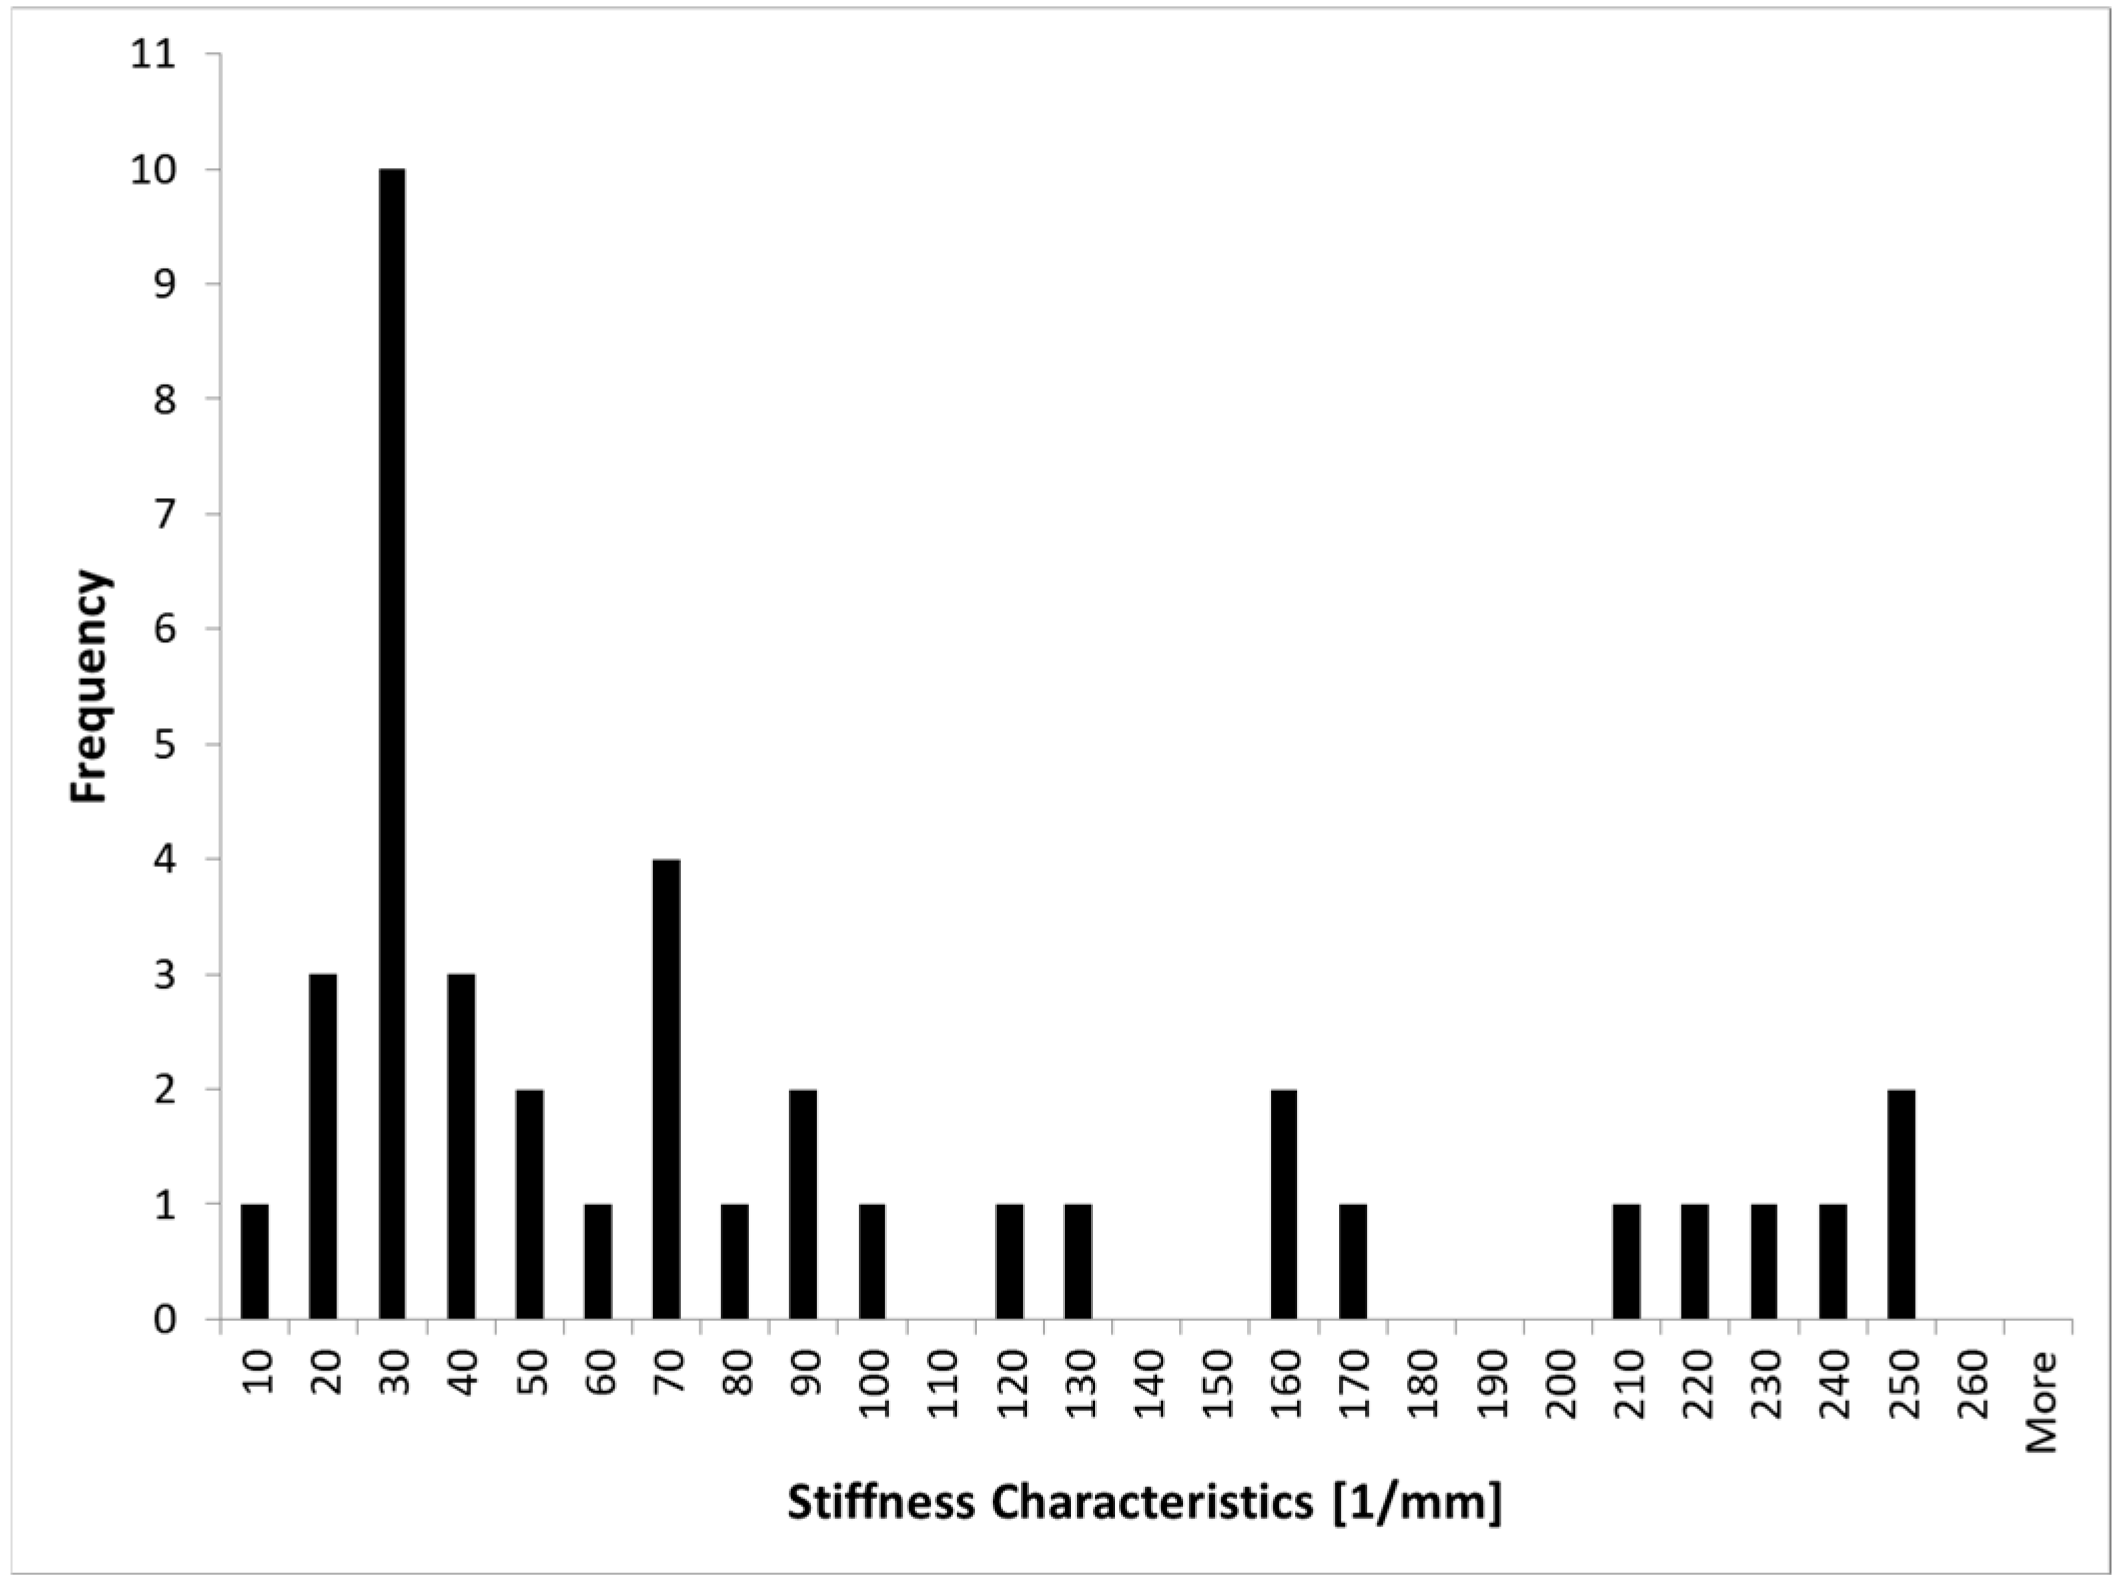
For both empirical and numerical computations in the present study, dnm in Equations (4) and (6) was taken as the difference between the initial and residual hydraulic apertures, equal to 7 × 10⁻⁵ m. The parameter q in Equations (5) and (7) was entitled “stiffness characteristics” by Zangerl et al. [57]; it is the slope of logarithm of normal stress versus fracture closure curve for mismatched joints. Physically, it indicates how fast a fracture stiffens as normal stress increases and was determined by [57] based on a compilation of 115 normal closure experiments performed on natural and artificial fractures in granite. Stiffness characteristics were found to range from 720 mm−1 for well-mated laboratory fractures to 3 mm−1 for in situ tests on induced or reactivated hydro-fractures isolated in boreholes. In the case of granite, in the compilation of stiffness characteristics for the first loading path of natural fractures in granitic samples [57], q ranges from 5 to 244 mm−1, as shown in Figure 4, with a complex distribution. Without specific measurements of the fractures of the granite massif, we chose the average value in the paper by Zangerl et al. [57], q = 88 mm−1, as a proxy of the stiffness characteristics for our simulation. It is important to note that this parameter can be influenced by the fracture formation mechanism (tensile, shear, or mixed mode), as well as by the mineralogical composition of the granite. Therefore, whenever possible, it is strongly recommended to use the stiffness parameters determined for the specific rock sample in the computational analyses.
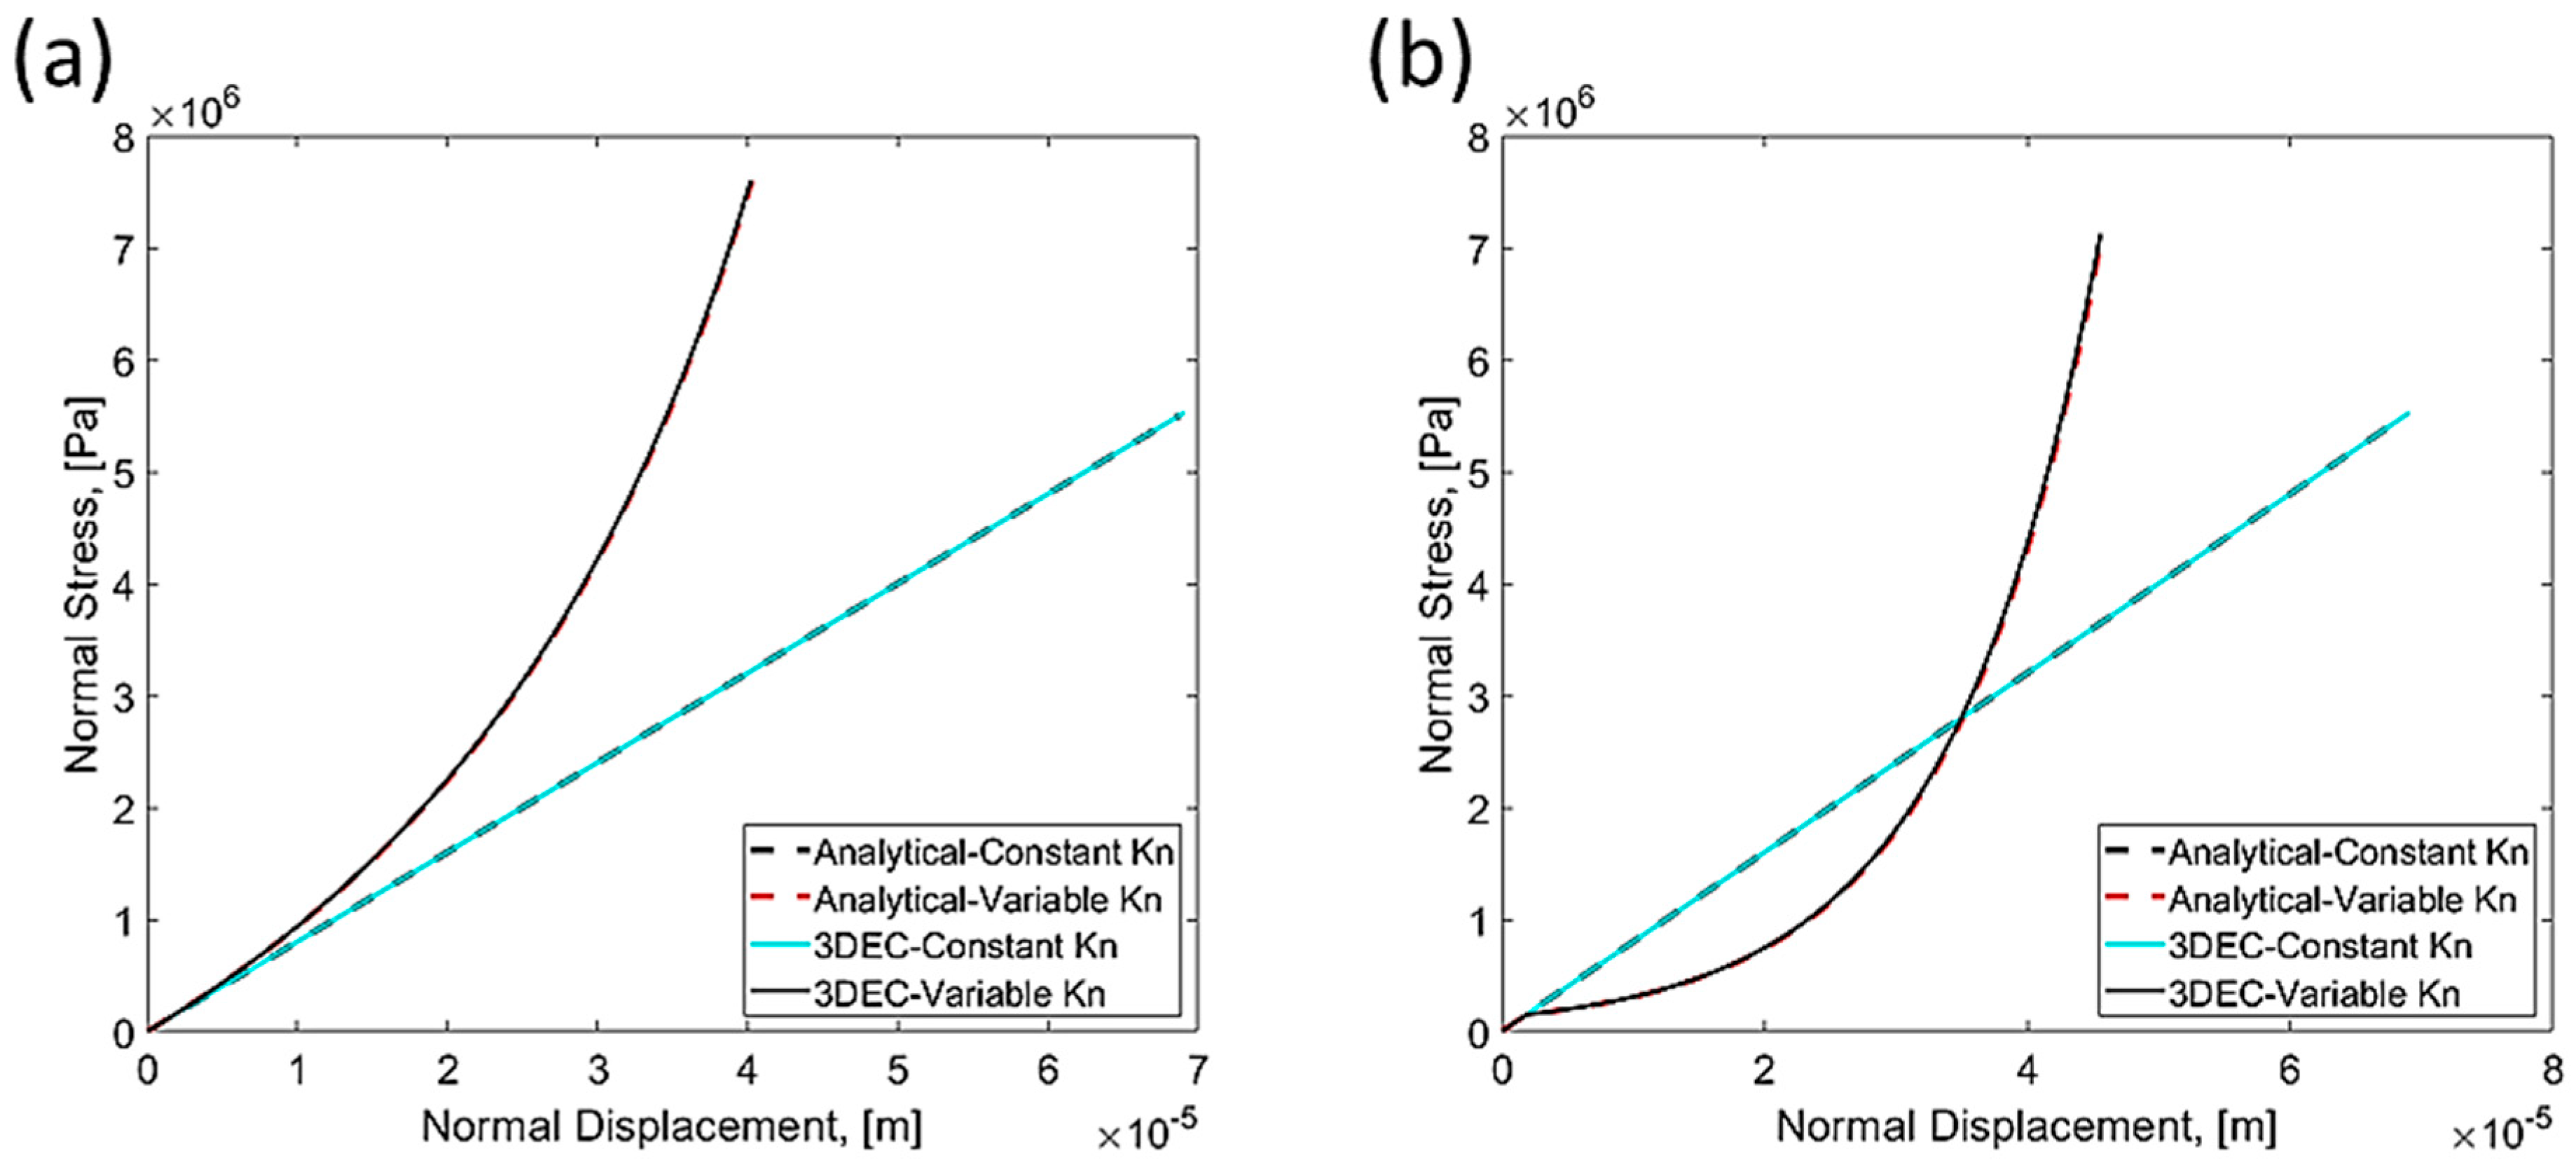
In the present simulation, the average stiffness characteristic of 88 mm−1 was used. For kj, nj, and Rf, the values reported for dolerite samples by Bandis et al. [24] were adopted. Figure 5 and Figure 6 present the comparison between numerical and empirical stress–displacement curves, illustrating, respectively, the normal components of interlocked and mismatched joints and the shear increments of interlocked joints. The numerical shear displacement for a given shear stress exhibits a slight deviation from the empirical results. This discrepancy may arise from the fact that τult in Equation (8) depends on the condition of the sample during the direct shear test, particularly when residual shear strength has not yet been reached and additional displacement is required. Accordingly, the ultimate shear strength is greater than the residual shear strength but lower than the peak shear strength, and is unique for each test and sample (Barton, personal communication). In this study, τult was assumed to be equal to the product of the dynamic friction coefficient and the normal stress.

4. Results and Discussion

4.1. Elastic Moduli

An elastic, isotropic, and homogeneous block measuring 100 × 100 × 100 m3, characterised by the same properties as the rock matrix used in the verification tests, was generated in 3DEC and embedded with a discrete fracture network (DFN) composed of 418 fractures, designed to replicate the characteristics of the deep fracture system in Soultz-sous-Forêts. The DFN comprises four sets of fractures, classified by orientation according to the methodology described in [68,69,70,71]. Within each set, the fractures are uniformly distributed in both spatial location and orientation. Each fracture is modelled as a finite-sized circular plane, with diameters following an exponential distribution ranging from 10 to 3000 m, with a scaling factor of a = 3.0. A detailed review of these parameters, along with the underlying processes that lead to such DFN characteristics, can be found in [72].
A demonstration of the discrete fracture network (DFN) generated by 3DEC, consisting of 418 fractures, together with the resulting fractured rock mass, is shown in Figure 7 and Figure 8. The fractures were assigned the following stiffness properties:
(i) constant normal and shear stiffness (Table 1);
(ii) interlocked normal stiffness (Equation (6)) and shear stiffness (Equation (9));
(iii) mismatched normal stiffness (Equation (7)) and shear stiffness (Equation (9)).
The in situ stress magnitudes of the Soultz-sous-Forêts EGS reservoir, as reported by [66,67], in Table 2, were applied to the block boundaries at three depths:
  • 500 m;
  • 2.3 km;
  • 4.7 km.
These depths correspond to stress levels 1 (10% of the stress values at 4.7 km), 2 (50% of the stress values at 4.7 km), and 3 (100% of the stress values at 4.7 km), respectively. The bottom of the block was constrained to prevent movement. The relationship between the vertical stress and the maximum horizontal stress in Table 2 indicates that the stress regime in the Soultz-sous-Forêts is normal to strike-slip according to the faulting regime classification of Anderson [73]. Here, it is assumed that the faulting regime is normal with a ratio of maximum horizontal stress to vertical stress of 0.95. According to [66], the maximum horizontal stress has a direction of N170° E ± 10°. The model orientation is set to be aligned with in situ observations: the x-axis along the north, the y-axis along the east, and the z-axis along the depth.
After equilibrium at each stress level (initial state), four stress perturbation modes (secondary state) were applied. In three of these modes, the models were subjected to the initial stress state and then, after achieving equilibrium, to the following:
  • 10% of principal stress values;
  • 1% of principal stress values;
  • 1 MPa of isotropic stress.
The fourth perturbation mode consisted of applying 1 MPa of isotropic stress to models that were first subjected to isotropic stress equal to S1 at each stress level. These perturbation modes are summarised in Table 3.
At the convergence of each loading step, including both initial and secondary loadings, the average stress and strain components were measured over the zones of the block. The differences between the secondary state and initial state components were then used to determine the effective Young’s modulus and the Poisson’s ratio of the rock mass for each simulation.
The objective of this study was to estimate the effective elastic moduli of a homogenised fractured rock mass in order to evaluate the variations in P-wave velocity within the fractured medium. To achieve this, a grid search algorithm was developed to calculate the optimal elastic moduli that minimise the difference between the components of the numerically computed stress tensors using 3DEC and the analytically computed stress tensors using the effective elastic moduli of a homogenised fractured rock mass. The goal was to minimize function F, defined as
F = ( σ i j a n a l y t i c a l σ i j n u m e r i c a l ) 2 ,         i , j = 1,2 , 3
The six components of the computed stress tensor were obtained by substituting of numerical strain tensor components on Hooke’s law equation introduced for isotropic material subjected to triaxial loading and performing a grid search on Lame’s coefficients (λ and) so as to find the optimum λ and G for which the analytically computed stress component was closest to the numerically obtained stress using 3DEC. Optimum λ and G were then utilised to calculate the effective Young’s modulus and Poisson ratio.
σ i j = ( λ + 2 G ) ε i j δ i j + λ ε i j δ i j + λ ε i j δ i j = λ ε v + 2 G ε i j ,         i , j = 1,2 , 3
σ i j = 2 G ε i j ,         i , j = 1,2 , 3   &   i j
ε v = ε i j δ i j   ,         i , j = 1,2 , 3
at which σ and ε are average stress and strain values, respectively. The G, λ, ν, and E are the shear modulus, lambda, Poisson ratio, and Young’s modulus of fractured rock mass, respectively. δ i j is the Kronecker delta, which is zero when i ≠ j and is 1 when i = j. ε v is the volumetric strain.
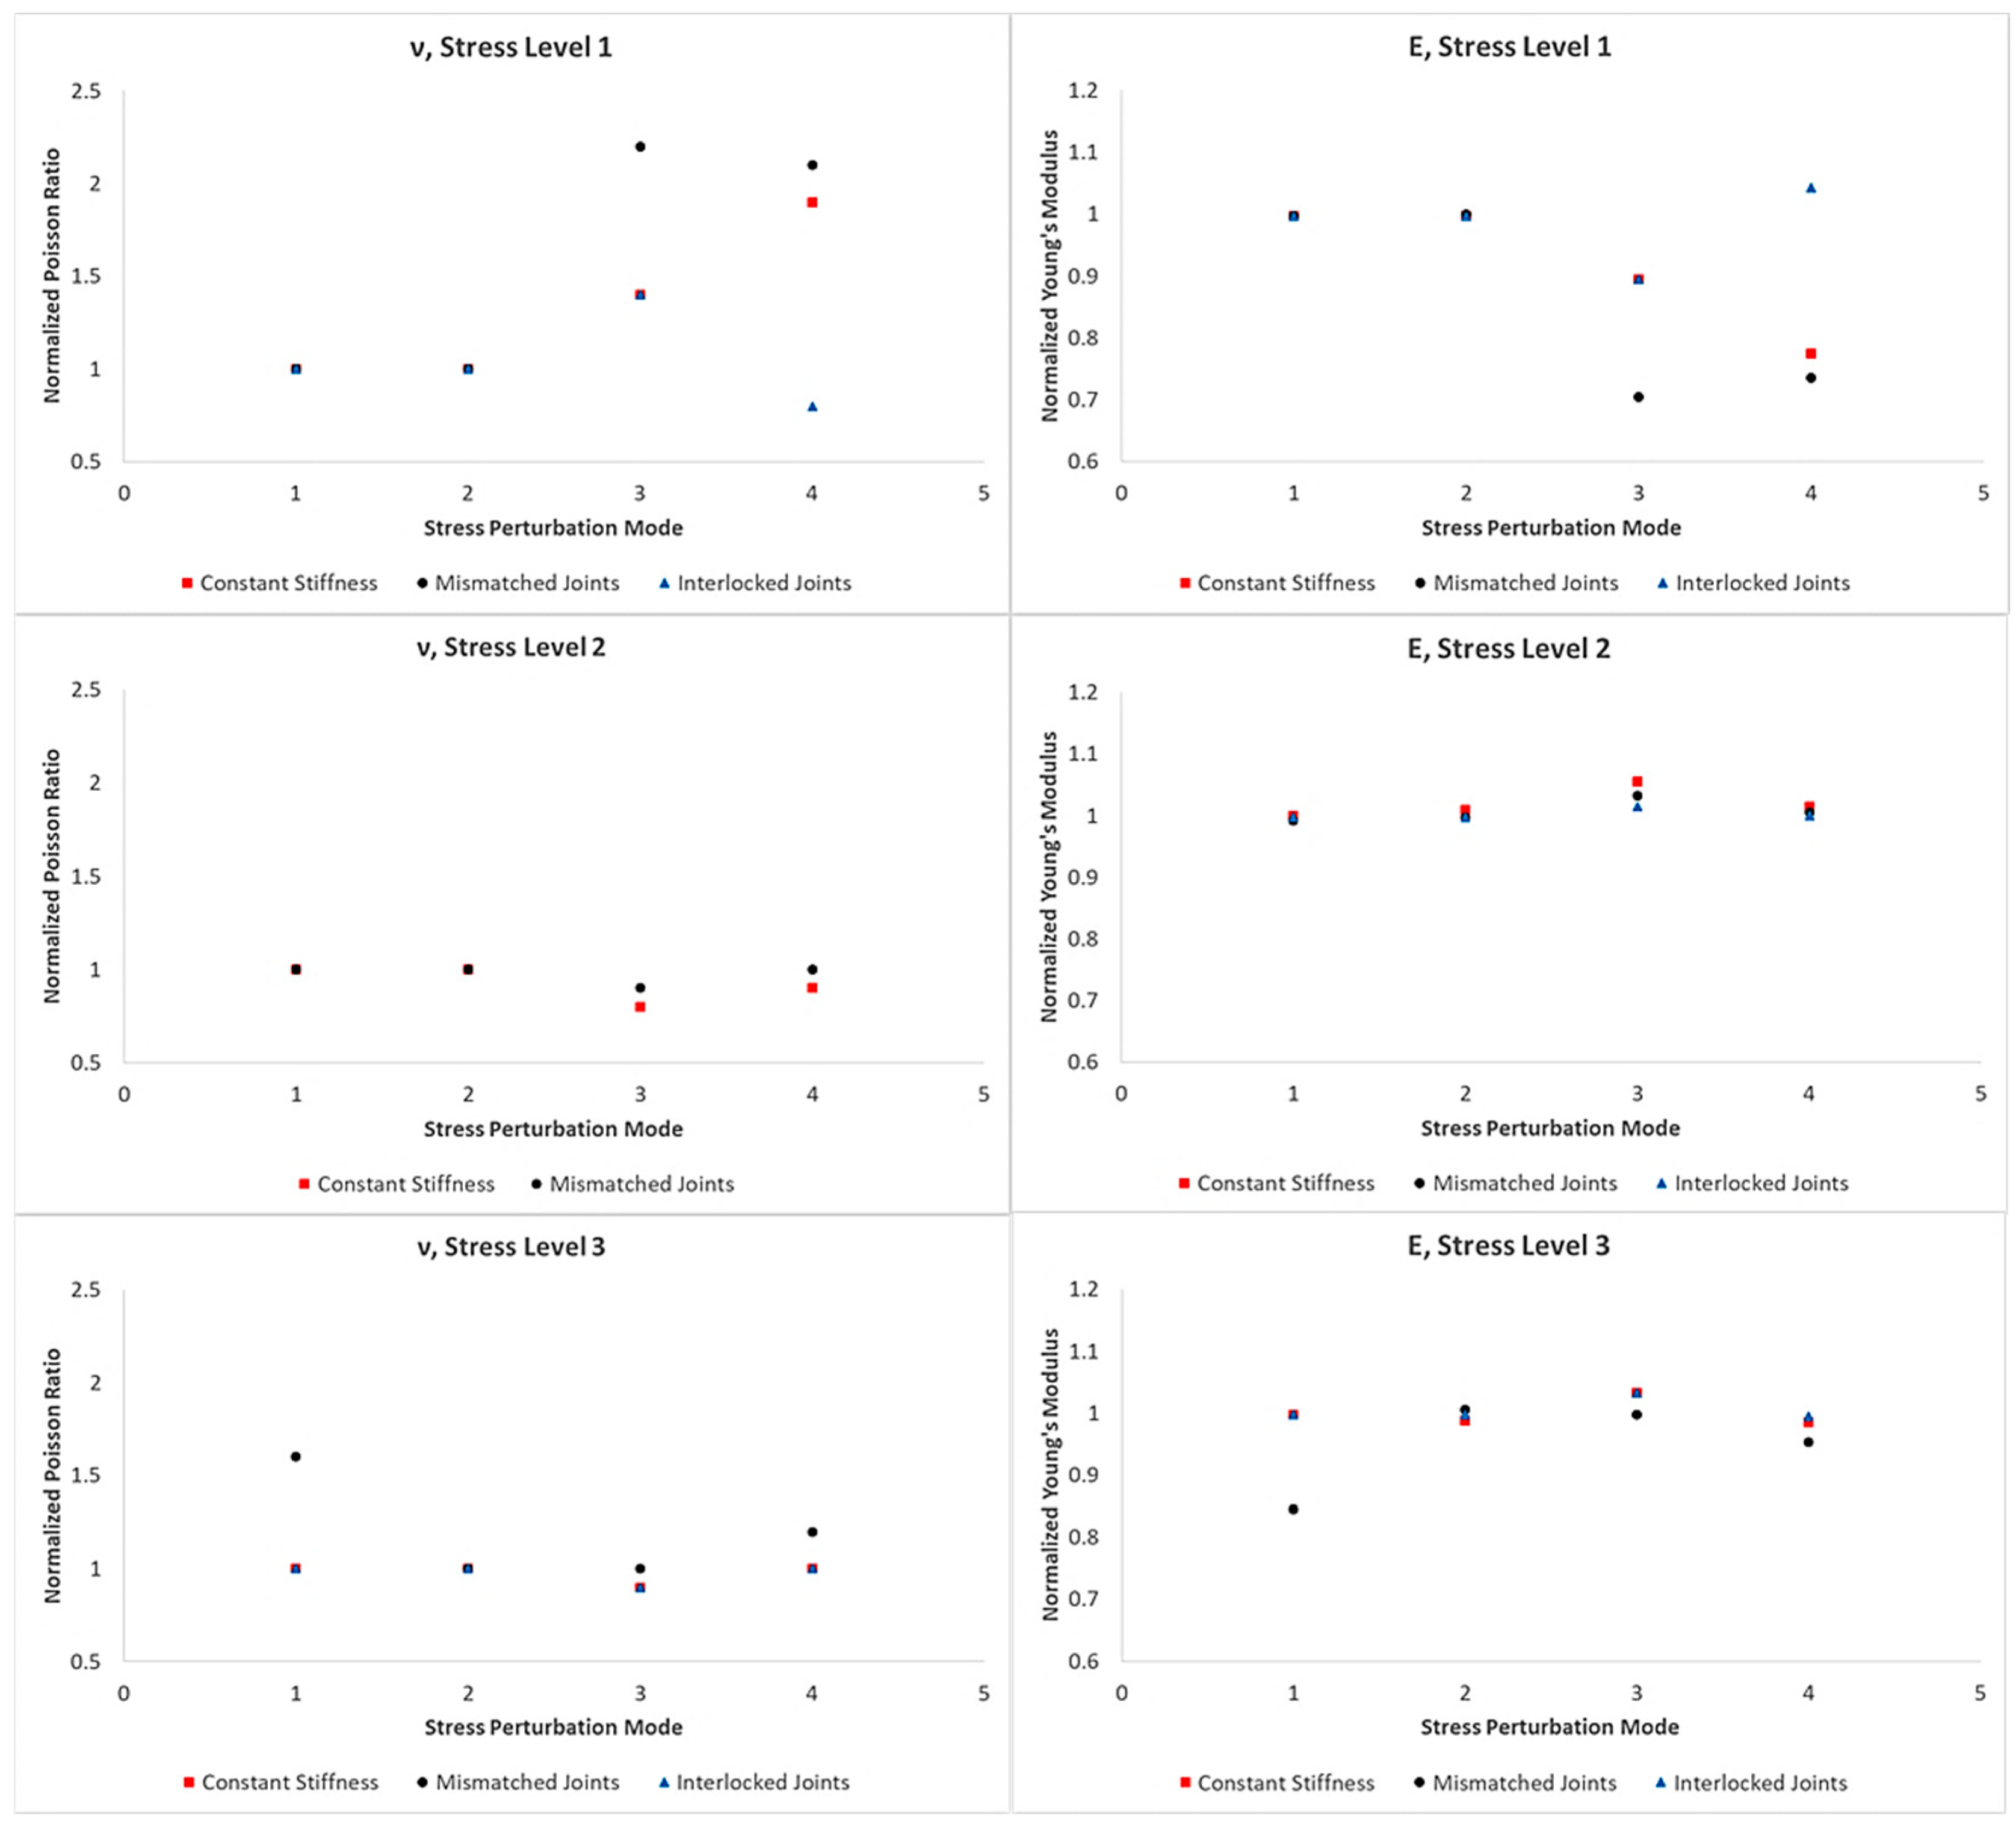
The resulting effective elastic moduli of the fractured rock were obtained with a typical error of ±5% and normalised by the elastic moduli of the rock matrix (Ei = 40 GPa, νi = 0.1 [64]). A total of 72 simulations were performed, from which 36 effective values of Young’s modulus and Poisson’s ratio were obtained, as shown in Figure 9.
As illustrated in Figure 9, the effective elastic moduli of the fractured rock mass are, in most cases, not significantly different from those of the rock matrix. This observation may be attributed to the relatively low fracture density in the models, which is insufficient to substantially alter the mechanical behaviour of the rock mass. Assuming this interpretation is valid, a closer examination of the graphs in Figure 9 indicates that the results corresponding to the second stress perturbation mode are consistent across all stress levels.
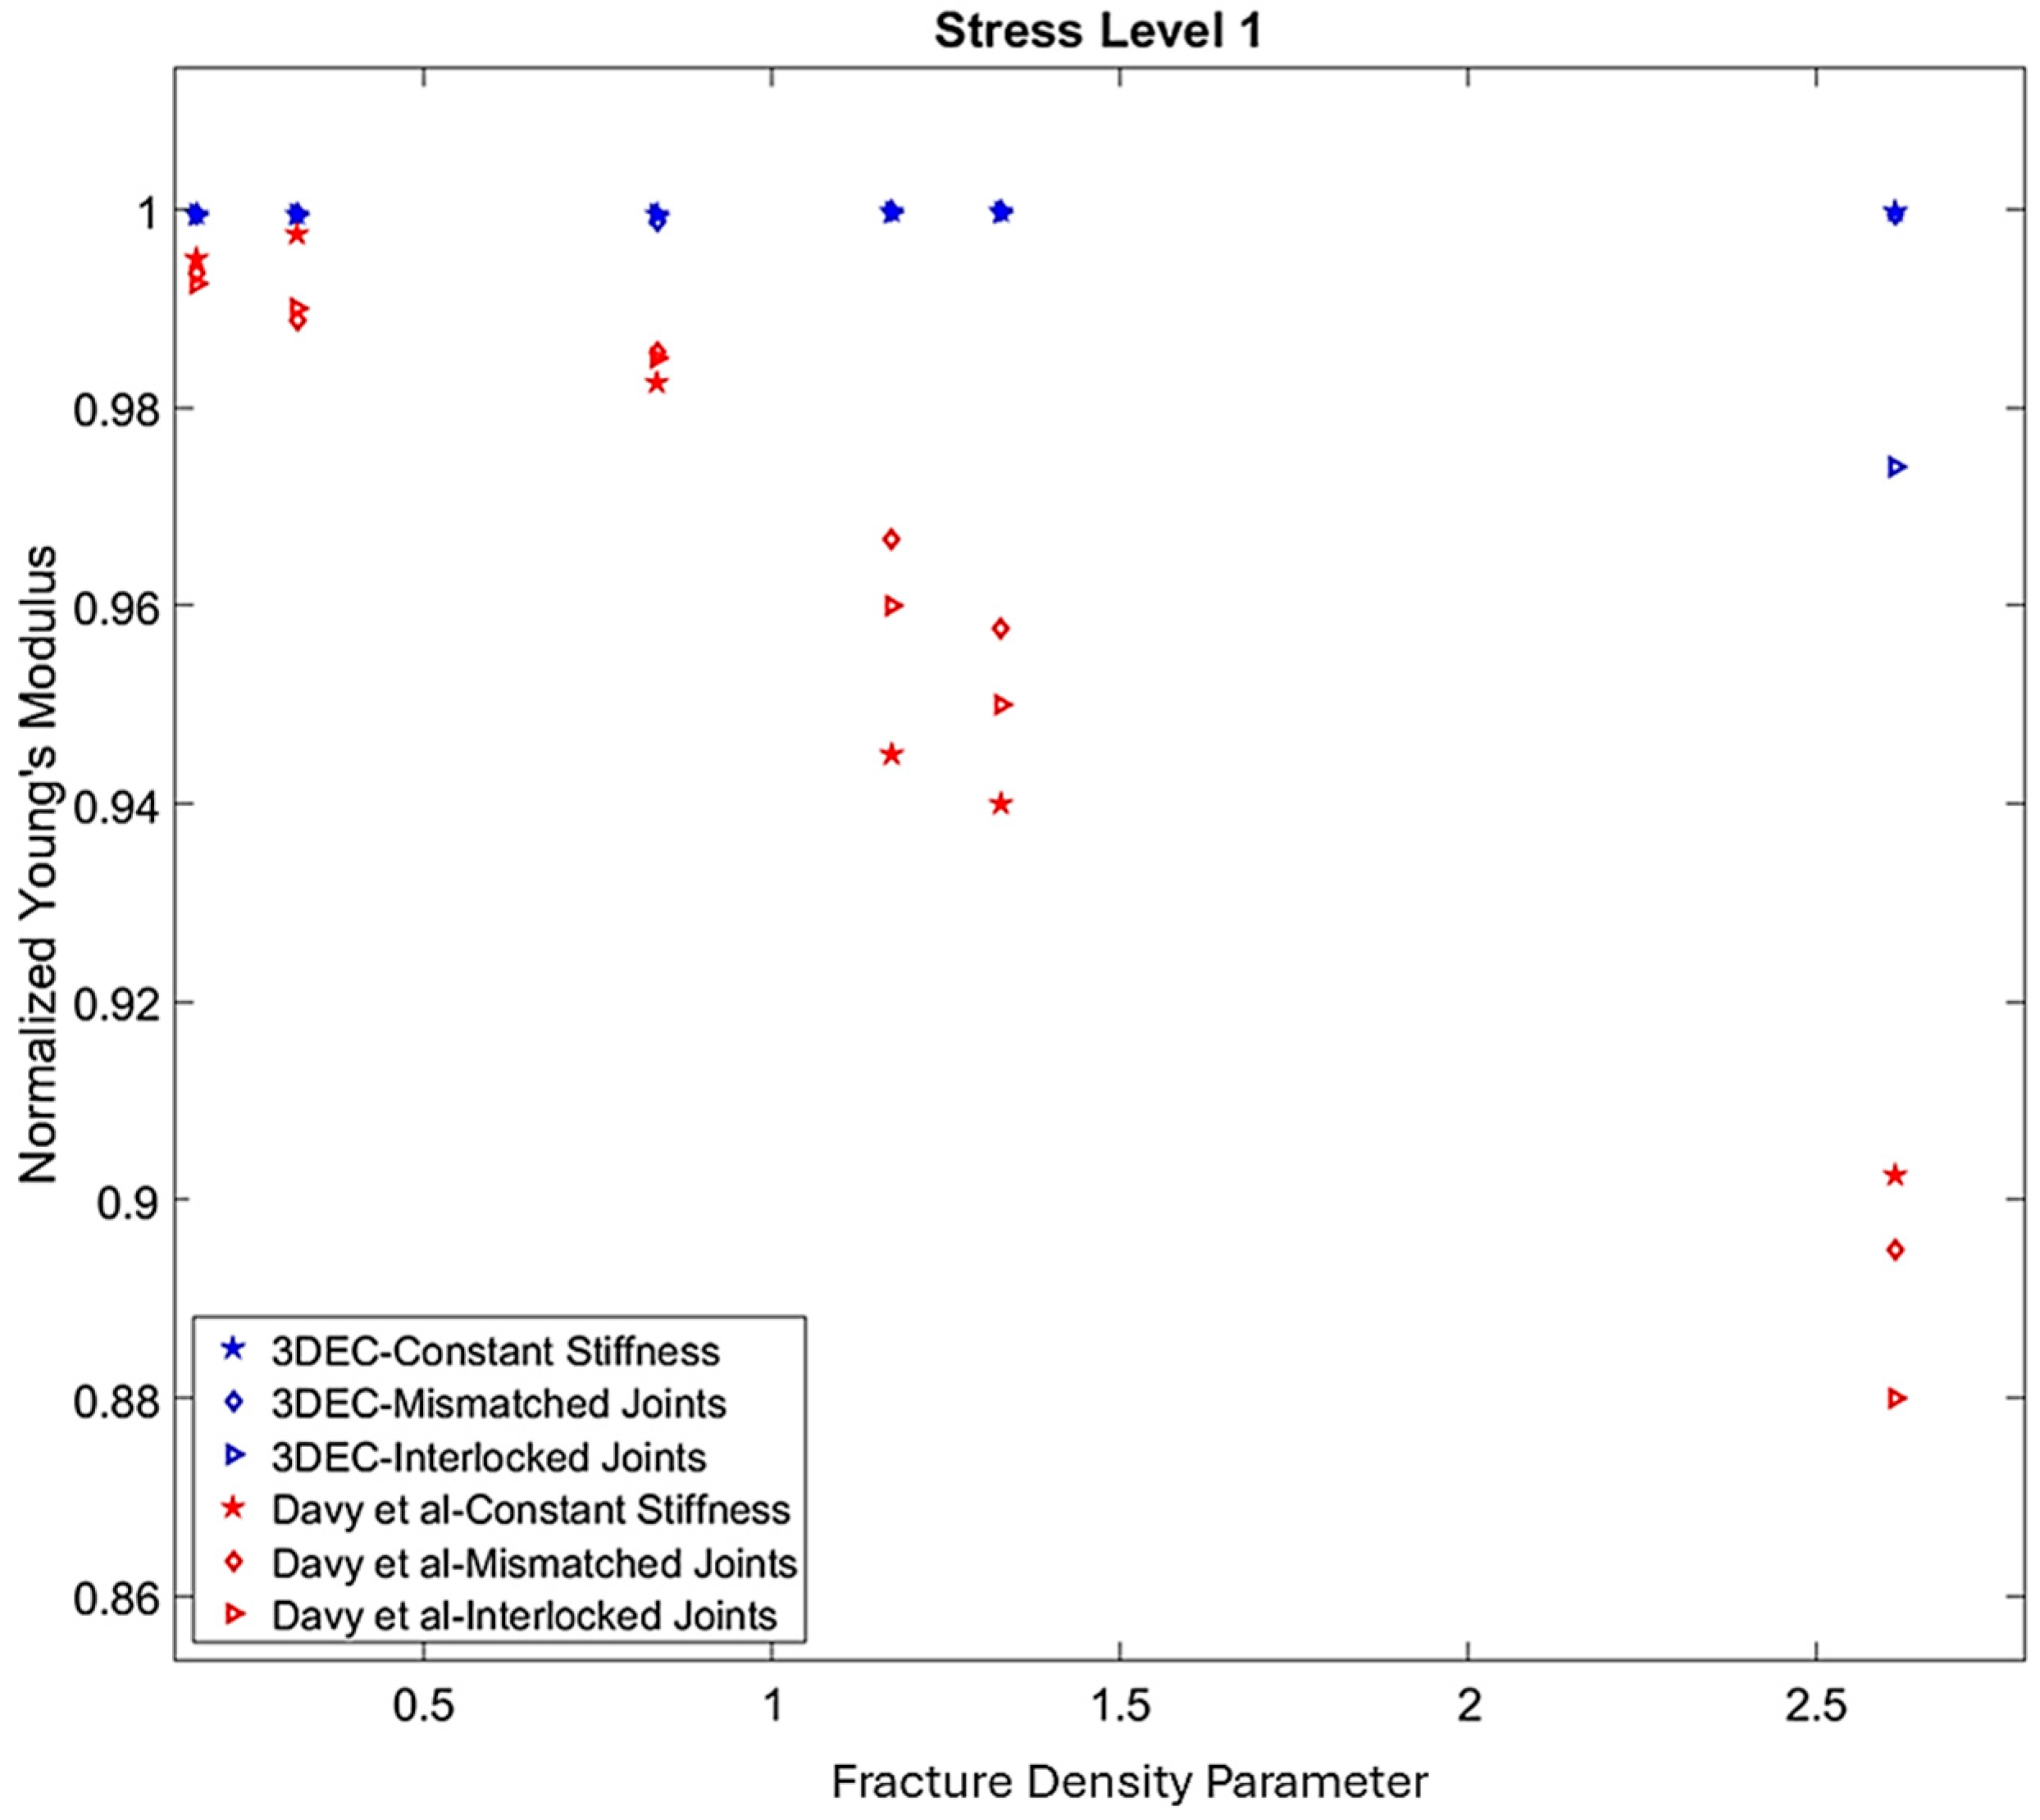
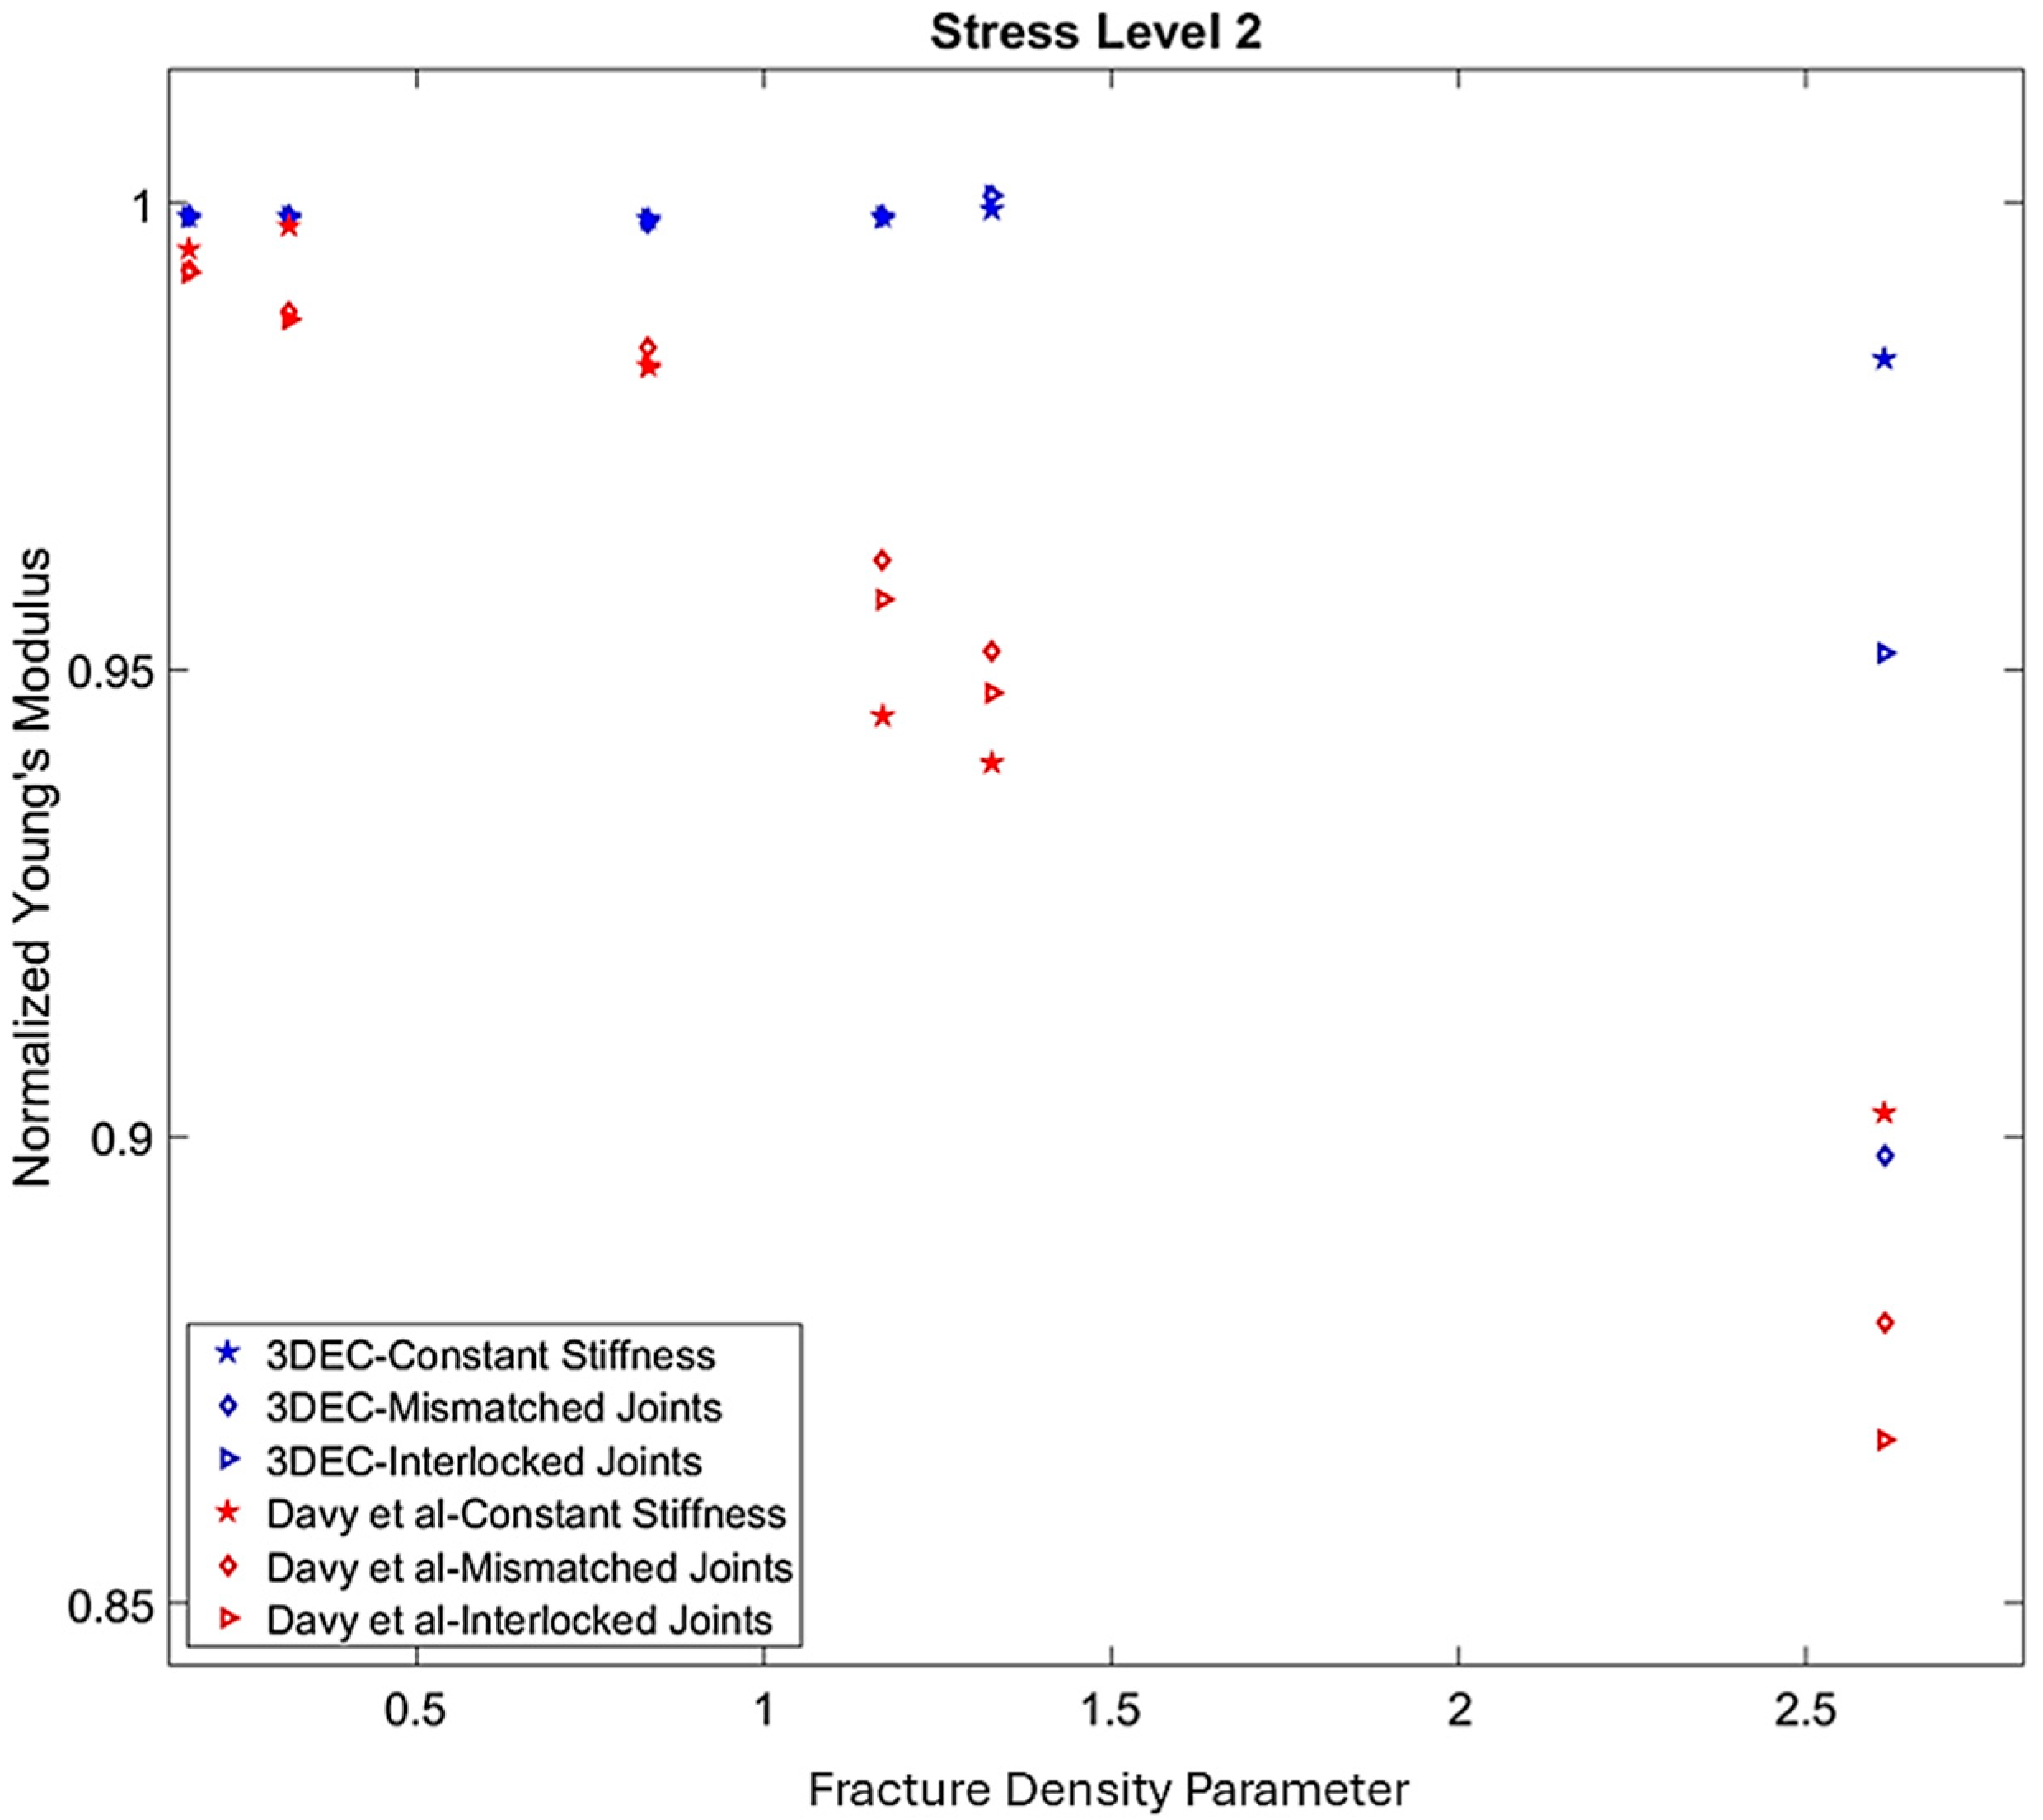
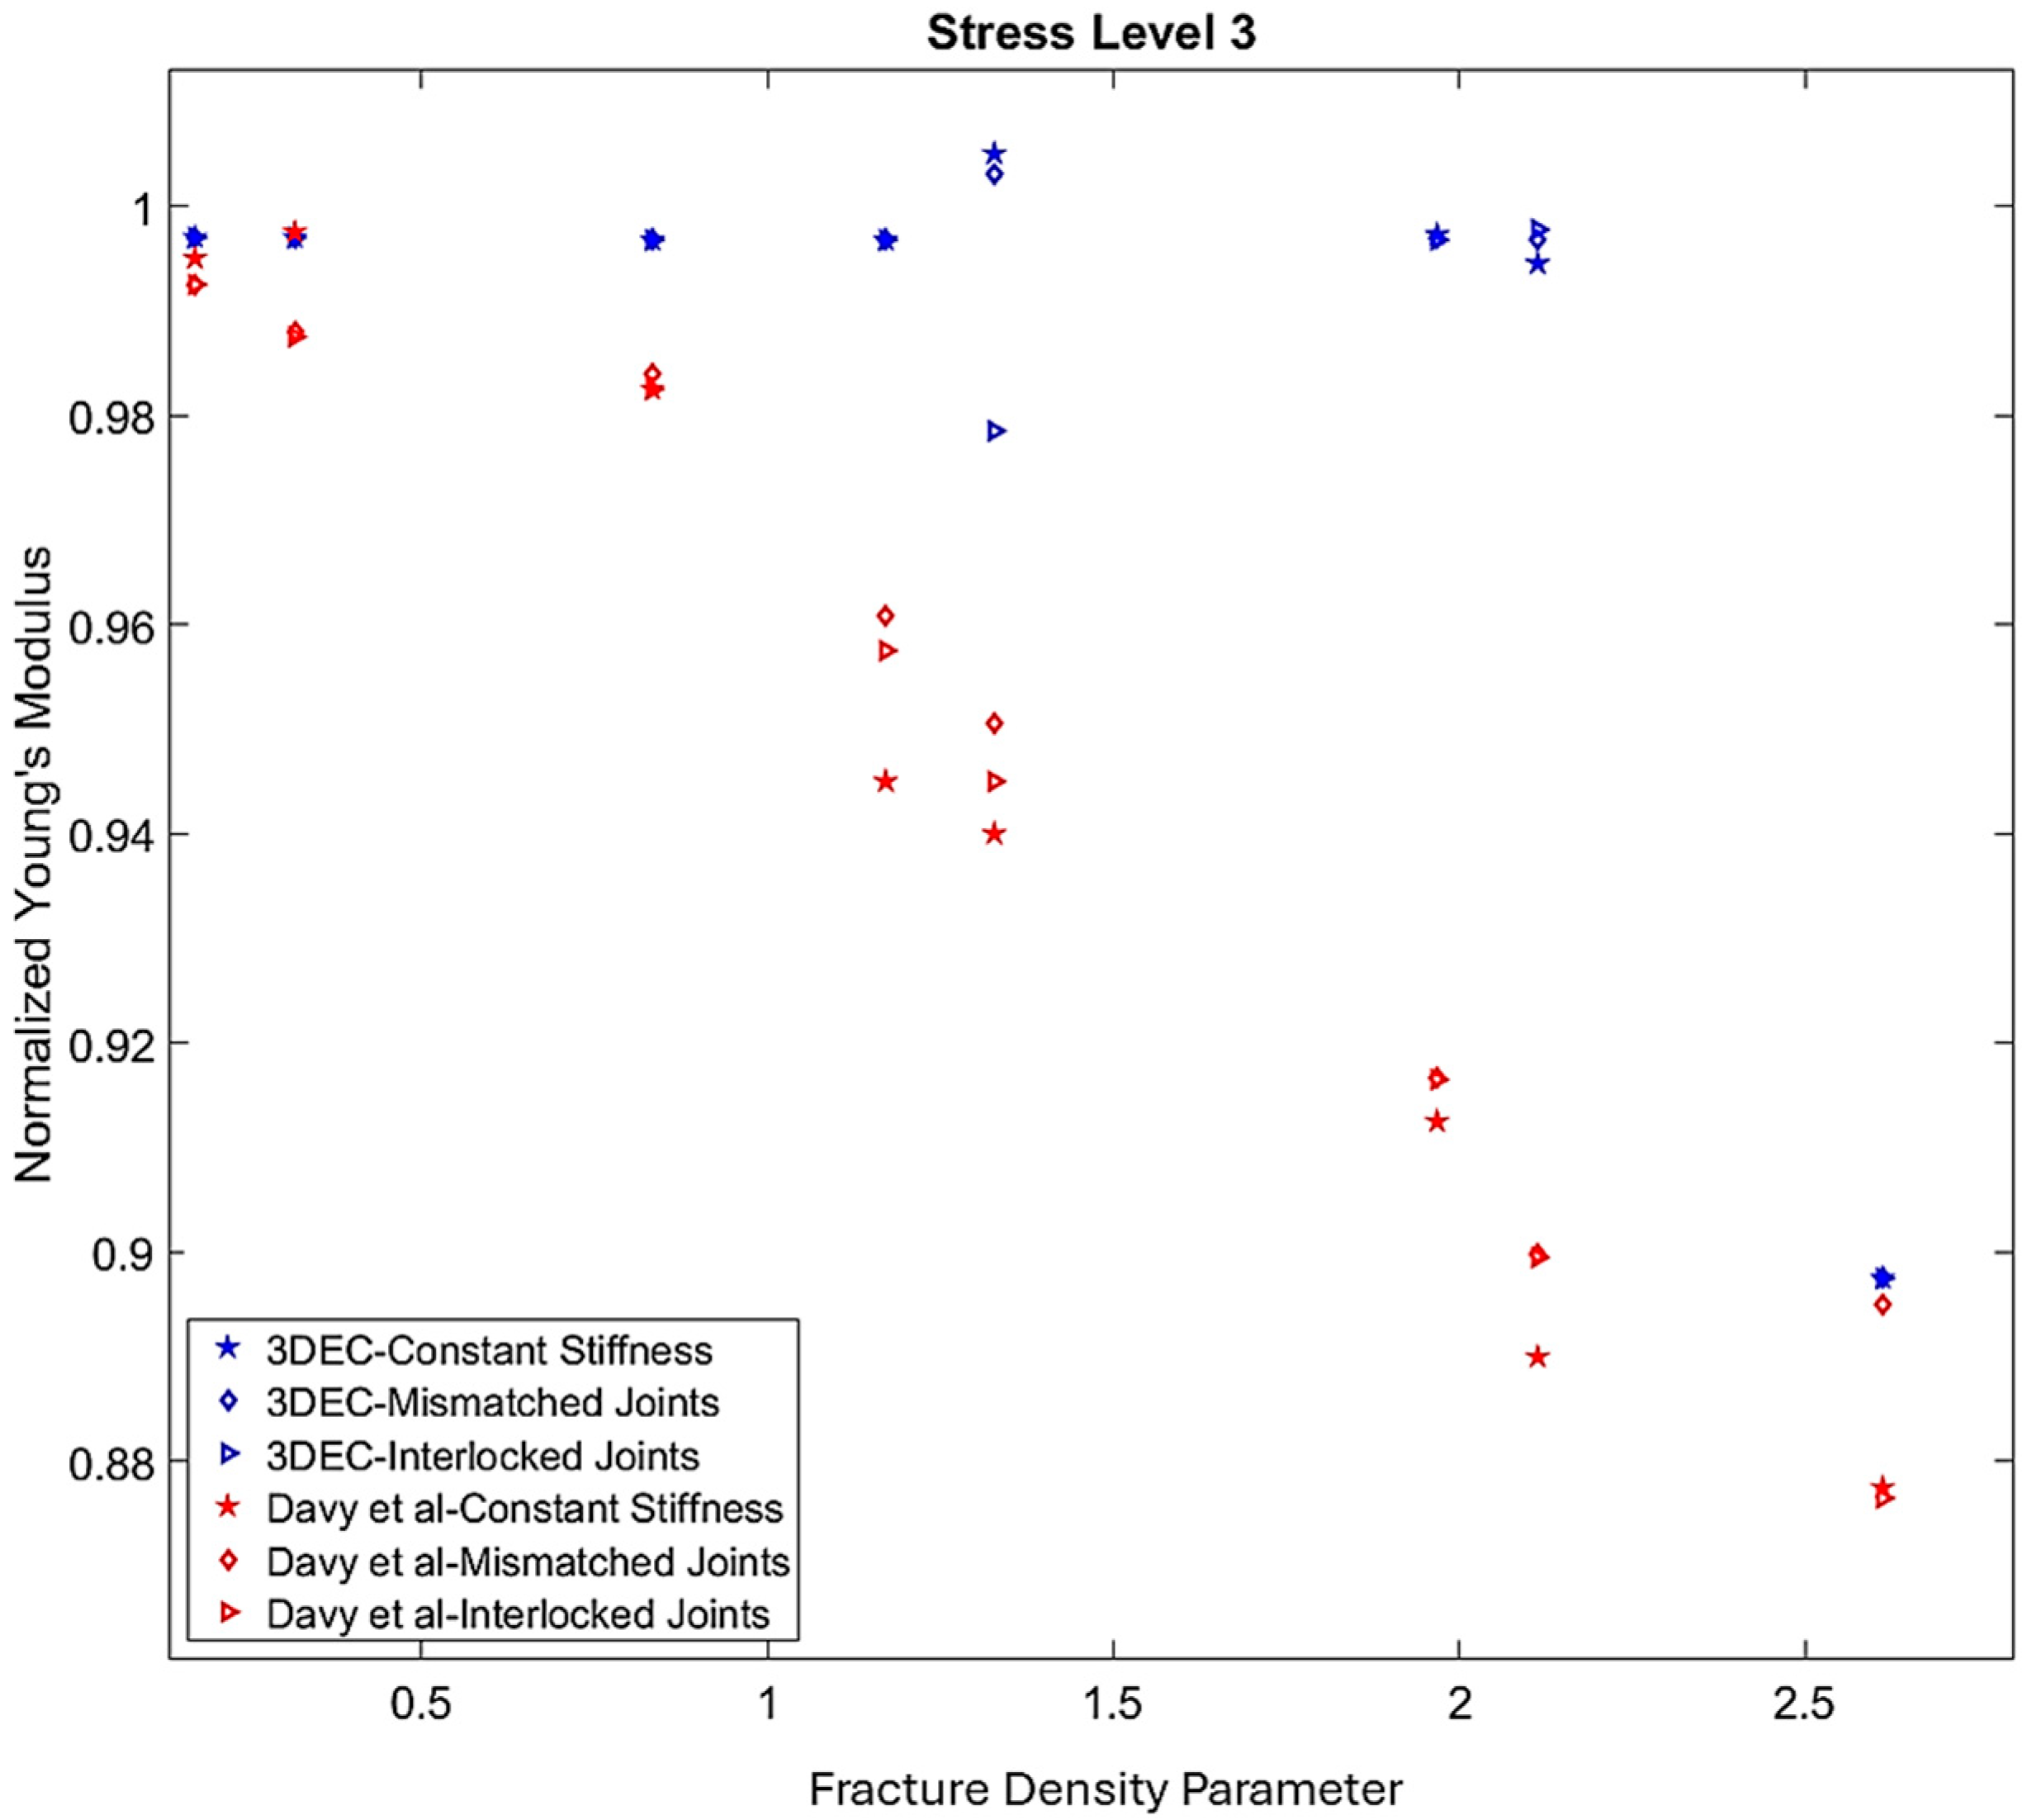
To investigate the influence of fracture density on the estimated effective elastic moduli, five additional DFN realisations, consisting of 50, 100, 200, 418, 500, and 1000 fractures, were embedded in the modelled rock block and subjected to stress perturbation mode 2 at all three stress levels, considering all three variations of fracture stiffness. The results were then compared with those obtained using the method introduced by Davy et al. [37]. These comparisons are presented in Figure 10, Figure 11 and Figure 12 for the three stress levels. In these plots, the X-axis represents the fracture density parameter, defined as ρ = ∑a3/V [17], where a is the fracture radius, and V is the model volume. The Y-axis represents the Young’s modulus calculated using the aforementioned method and normalised by the Young’s modulus of the rock matrix.
As shown in Figure 10, Figure 11 and Figure 12, the results obtained using the method of Davy et al. [37] are generally close to those of the 3DEC simulations, with slight discrepancies. This can be attributed to the fact that while the Davy et al. method accounts for the remote stress field, fracture orientation relative to the applied stress, and fracture stiffness parameters, it does not consider stress perturbations arising from fracture interactions. Consequently, this omission leads to an early-stage reduction in the effective elastic moduli compared to the 3DEC results.
Figure 10, Figure 11 and Figure 12 indicate that, for all three stress levels, deviations from the elastic moduli of the rock matrix in the 3DEC simulations occur at a fracture density parameter of 2.6. In contrast, for the interlocked joints model, this deviation is observed only at the first stress level, whereas for all three models, constant stiffness, mismatched joints, and interlocked joints appear at the second and third stress levels.
At the third stress level, for the rock mass containing fractures whose normal stiffness is defined by the interlocked joint relation (Equation (6)), the effective elastic moduli deviate from those of the rock matrix at a fracture density of 1.3. For the remaining two cases, fractures with constant and mismatched stiffness values, effective moduli were evaluated for fracture densities between 1.3 and 2.6 to determine the density at which deviations in elastic modulus occur. It was found that for fracture densities of approximately 1.9 and 2.2, no significant deviation in Young’s modulus was observed.
A closer examination of the results obtained using the method of Davy et al. [37] in Figure 10, Figure 11 and Figure 12 indicates that as the stress level increases, the influence of stress-dependent fracture stiffness decreases. Consequently, the effective moduli calculated using the method introduced in [37] are nearly identical at stress levels 2 and 3, in contrast to stress level 1. In the numerical results, this convergence is observed only at stress level 3.
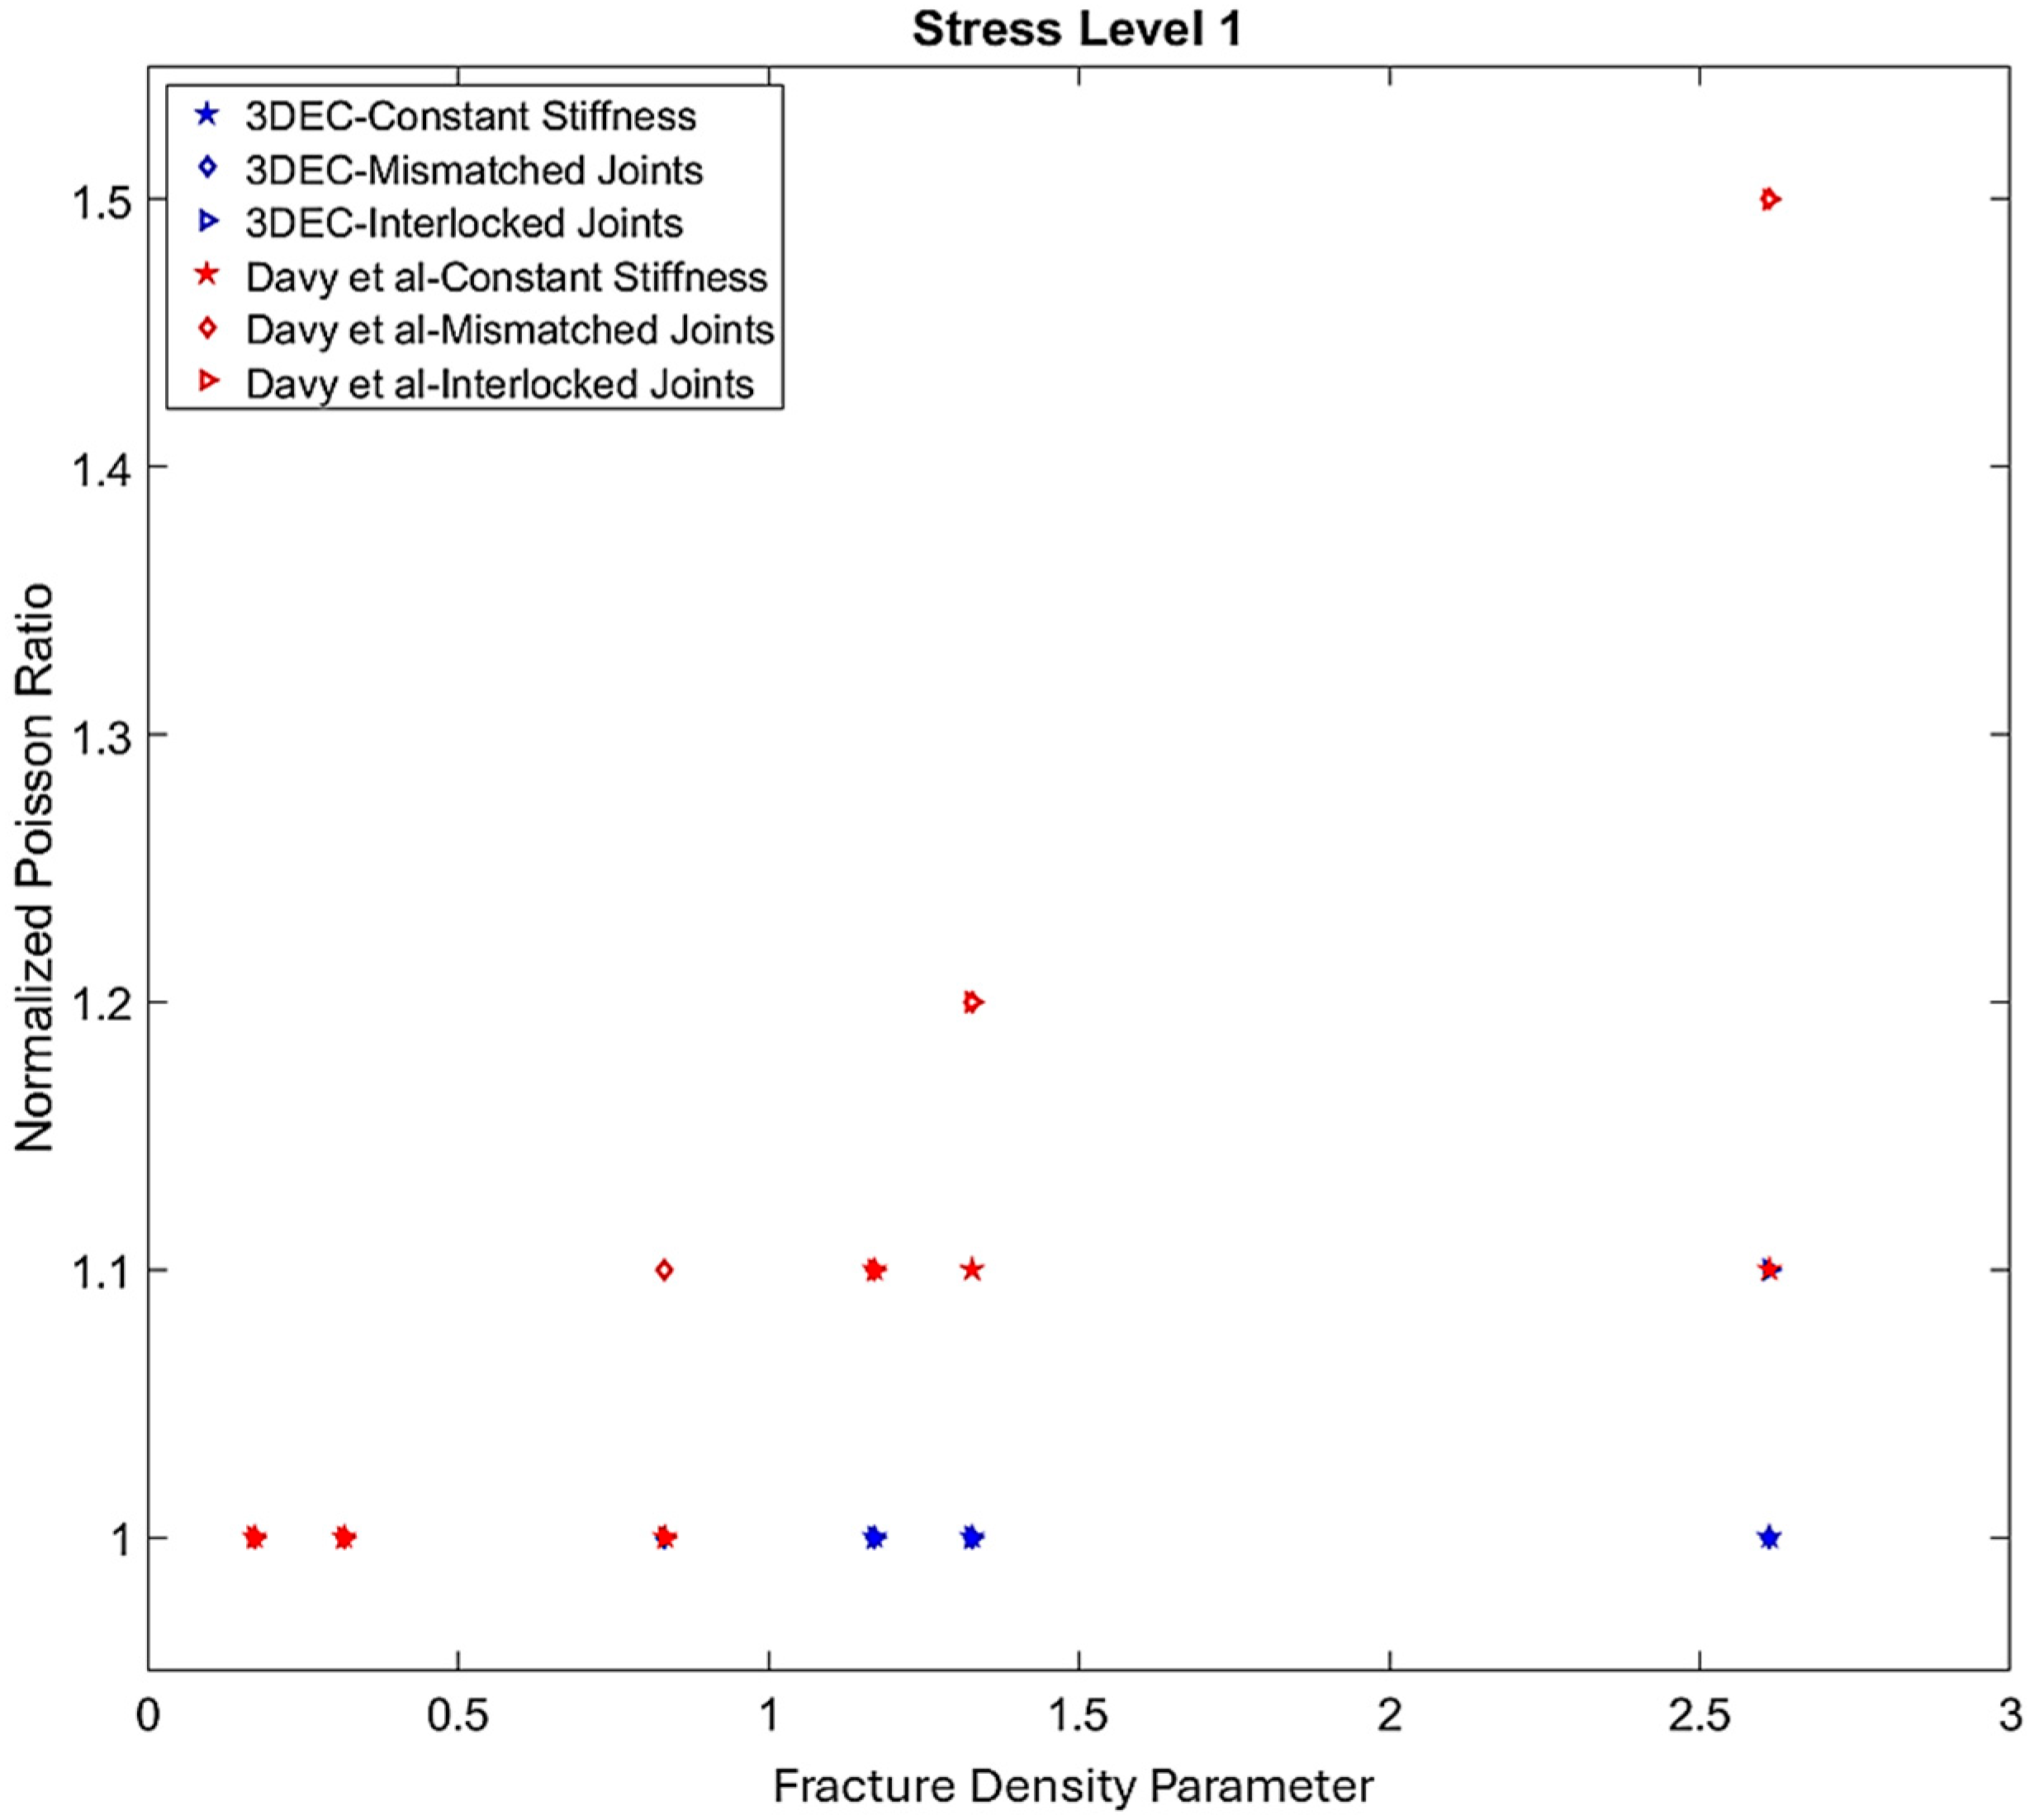
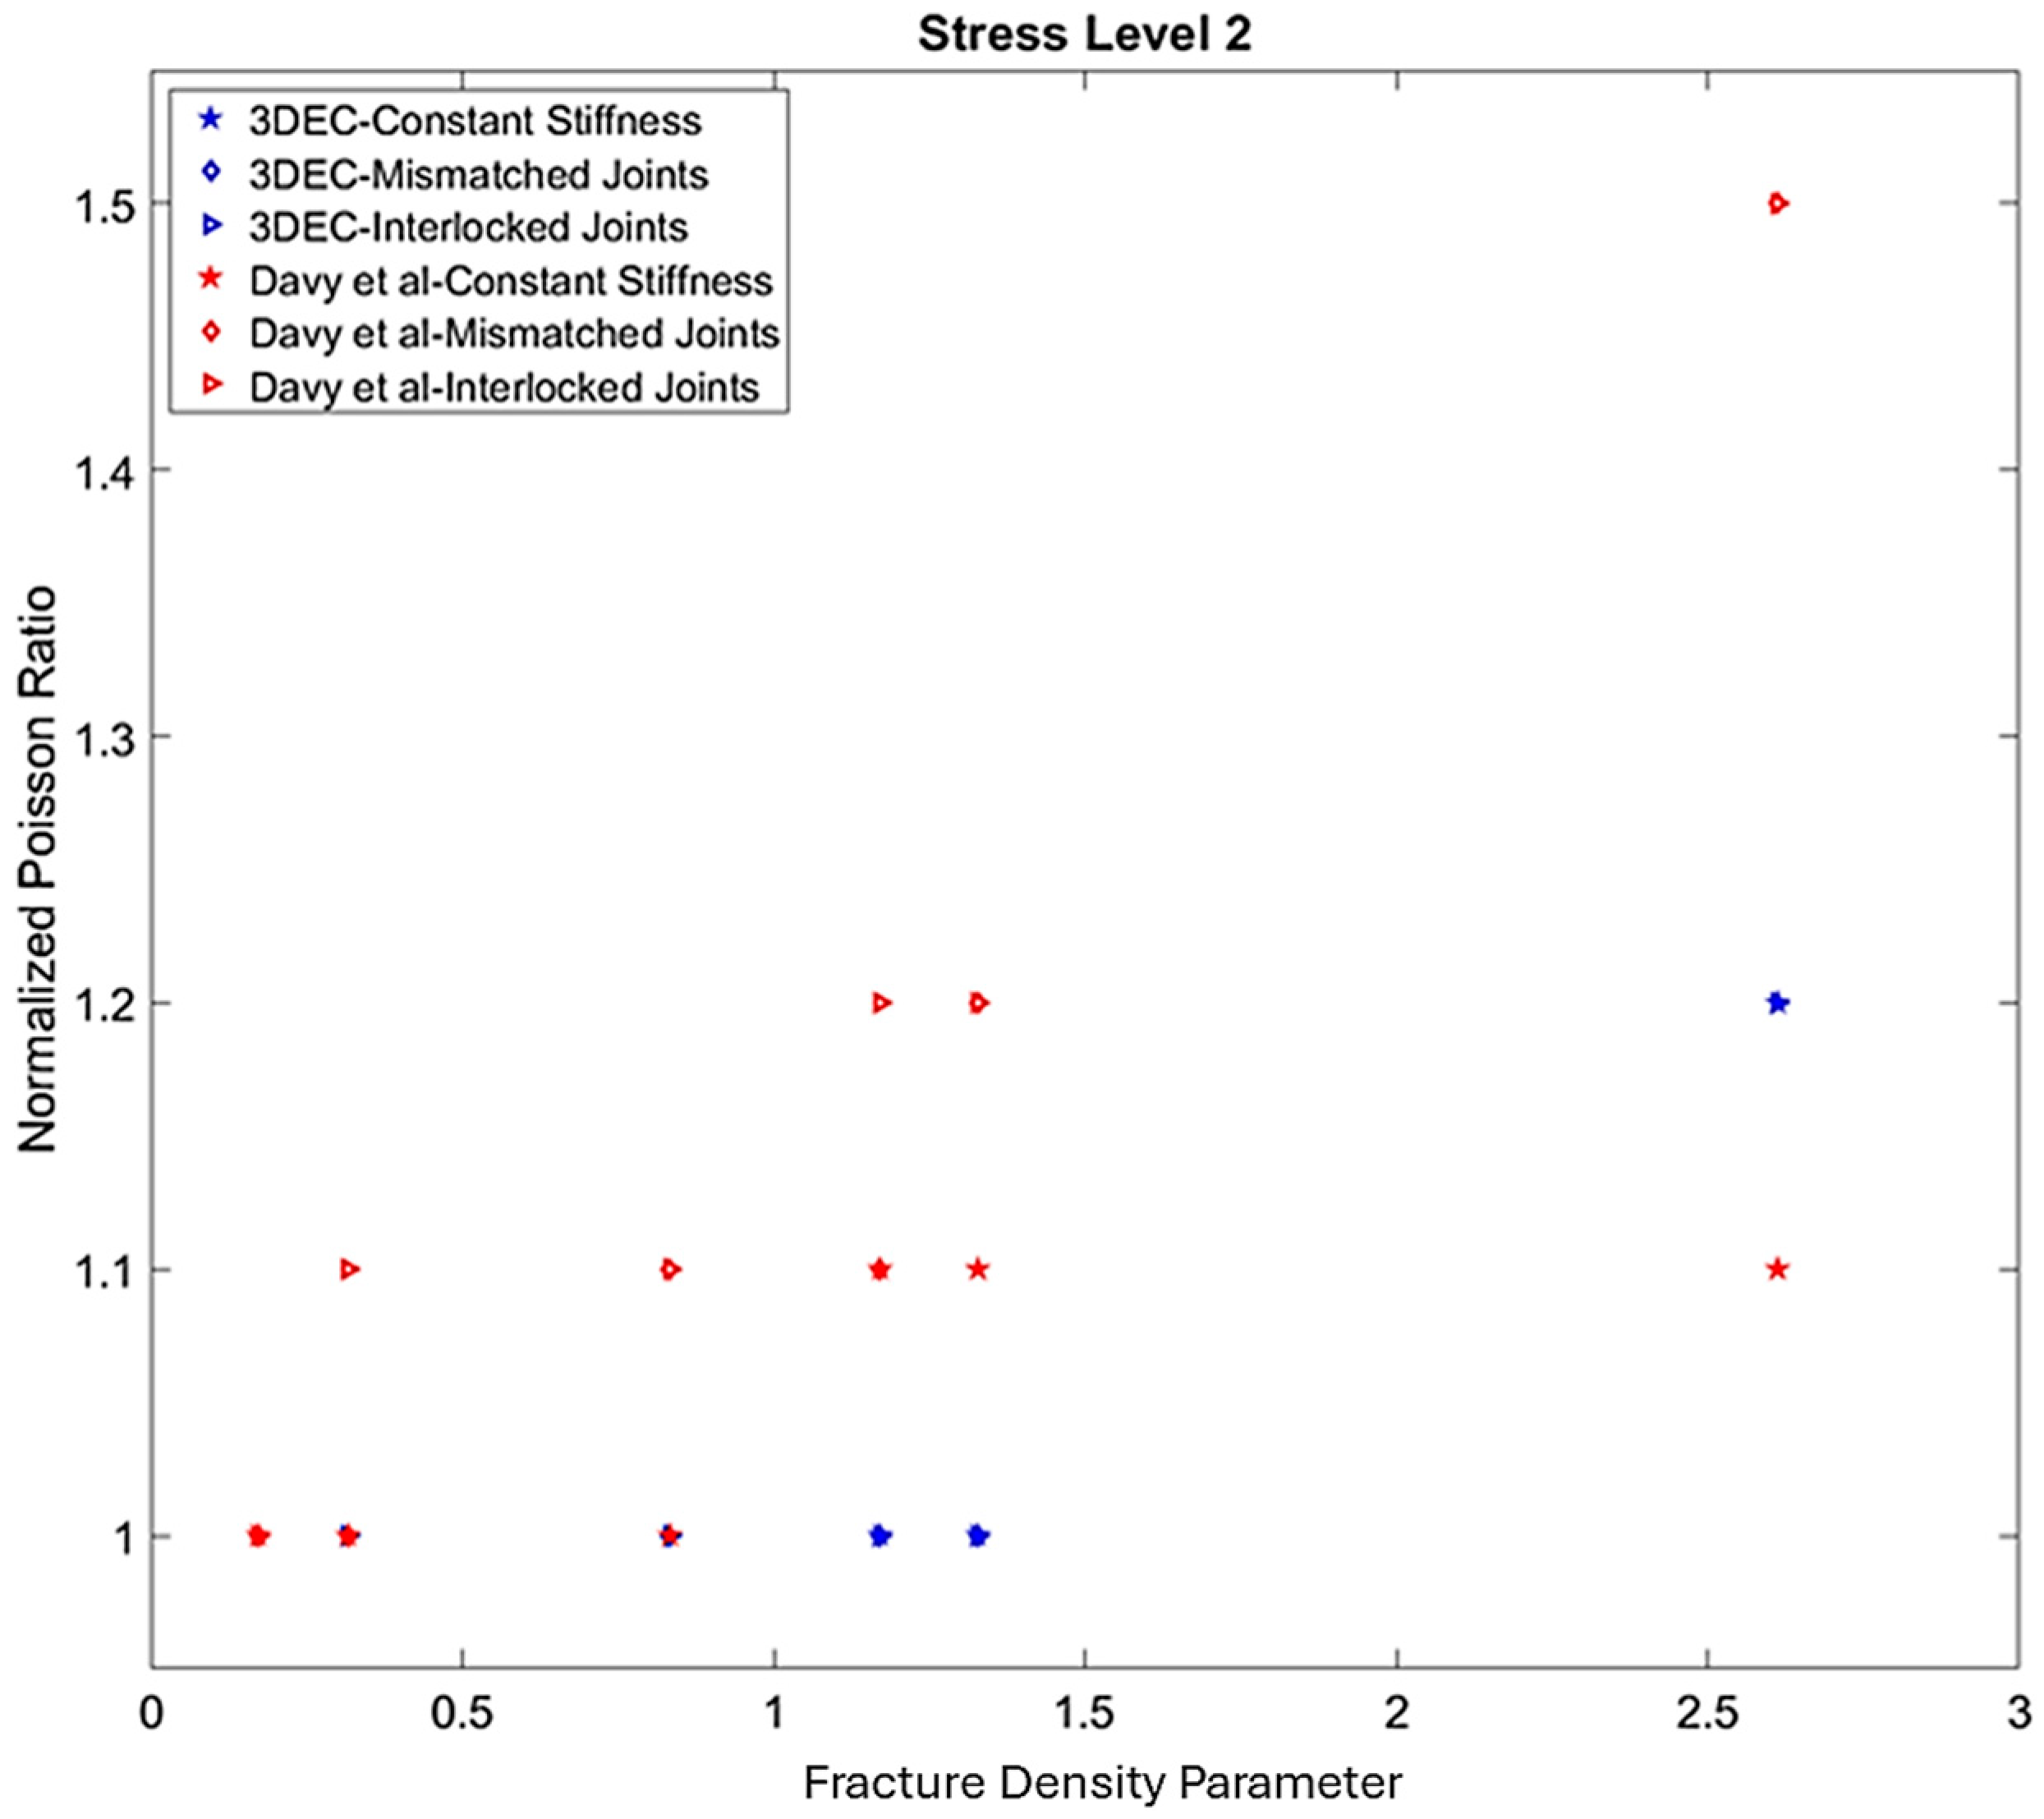
Variations in the Poisson ratio for the numerically modelled fractured rock masses were also compared with those obtained using the analytical method in [37]. Figure 13, Figure 14 and Figure 15 present the normalised Poisson’s ratio as a function of the fracture density parameter for stress levels 1, 2, and 3, respectively. Similarly to the effective Young’s modulus, deviations in the numerical Poisson’s ratio values occur only at a fracture density parameter of 2.6.

4.2. P-Wave Velocity

The assumption that rocks are at rest under in situ stresses implies that the problems in rock mechanics are static. However, in some situations, such as natural earthquakes or man-made seismicity, the stress perturbations generated are dynamic and their propagation must be considered as waves [74]. In such examples, the dynamic theory of linear elasticity can be used to analyse stresses and the resulting displacements; and the generated waves, which are governed by the laws of linear elasticity and propagate through the medium, are known as seismic waves [74]. Three types of waves are body waves, surface waves, and free vibrations [75]. Body waves are of two types: compressional (P-wave) and shear (S-wave) [1,75]. The propagation of seismic waves depends on the mechanical properties of the medium through which they travel [1]. The velocity of this propagation in an isotropic, homogeneous, and linearly elastic medium for P-waves is
V P = E 1 ν 1 + ν 1 2 ν ρ
where ρ is the bulk density of the fractured medium. Therefore, the elastic moduli of the medium (ν and E) are used to evaluate the P-wave velocity in the medium of interest. These values for the synthetic fractured media generated in the current study were previously estimated using the grid search algorithm developed in Section 4.1 and were used here to evaluate the P-wave velocity through the models. The bulk density of the rock matrix was already selected from the literature as 2680 kg/m3, but for the synthetic fractured media of this project, the bulk density varied depending on the fracture density. One solution was to estimate the bulk density of the rock by multiplying the total area per unit volume (often referred to as p 32 [76]) by the initial hydraulic aperture of the fractures (h0) to obtain the void volume of the entire rock block. The void volume was then multiplied by the bulk density of the rock matrix to obtain the mass corresponding to the calculated void volume. This mass had to be subtracted from the total mass of the rock matrix block (that is, 2680 × 1003 = 2.68⋅109 kg) to obtain the solid mass of the block. The resulting mass was then divided by the volume of the block (that is, 100 × 100 × 100 m3) to obtain the bulk density of the fractured rock mass. This can be summarised by Equation (25):
ρ = ρ i ( 1 p 32 h 0 )
where ρ i is bulk density of rock matrix. The bulk density obtained from Equation (25), ρ , was substituted into Equation (24) to evaluate the P-wave velocity in the fractured medium. By substituting the elastic moduli of the rock matrix and its bulk density into Equation (24), a P-wave velocity of 3.9 km/s was obtained for the rock matrix. This value is considerably lower than the P-wave velocities measured in the Soultz-sous-Forêts fractured reservoir, which range from approximately 5.5 to 5.8 km/s according to the literature [77,78,79,80,81]. It is important to note the distinction between static and dynamic elastic moduli. The elastic stiffness derived from elastic wave velocities in combination with density is commonly referred to as dynamic moduli. In contrast, static moduli describe the elastic stiffness, corresponding to the slope of the stress–strain curve, that relates deformation to applied stress under quasi-static loading conditions [82].
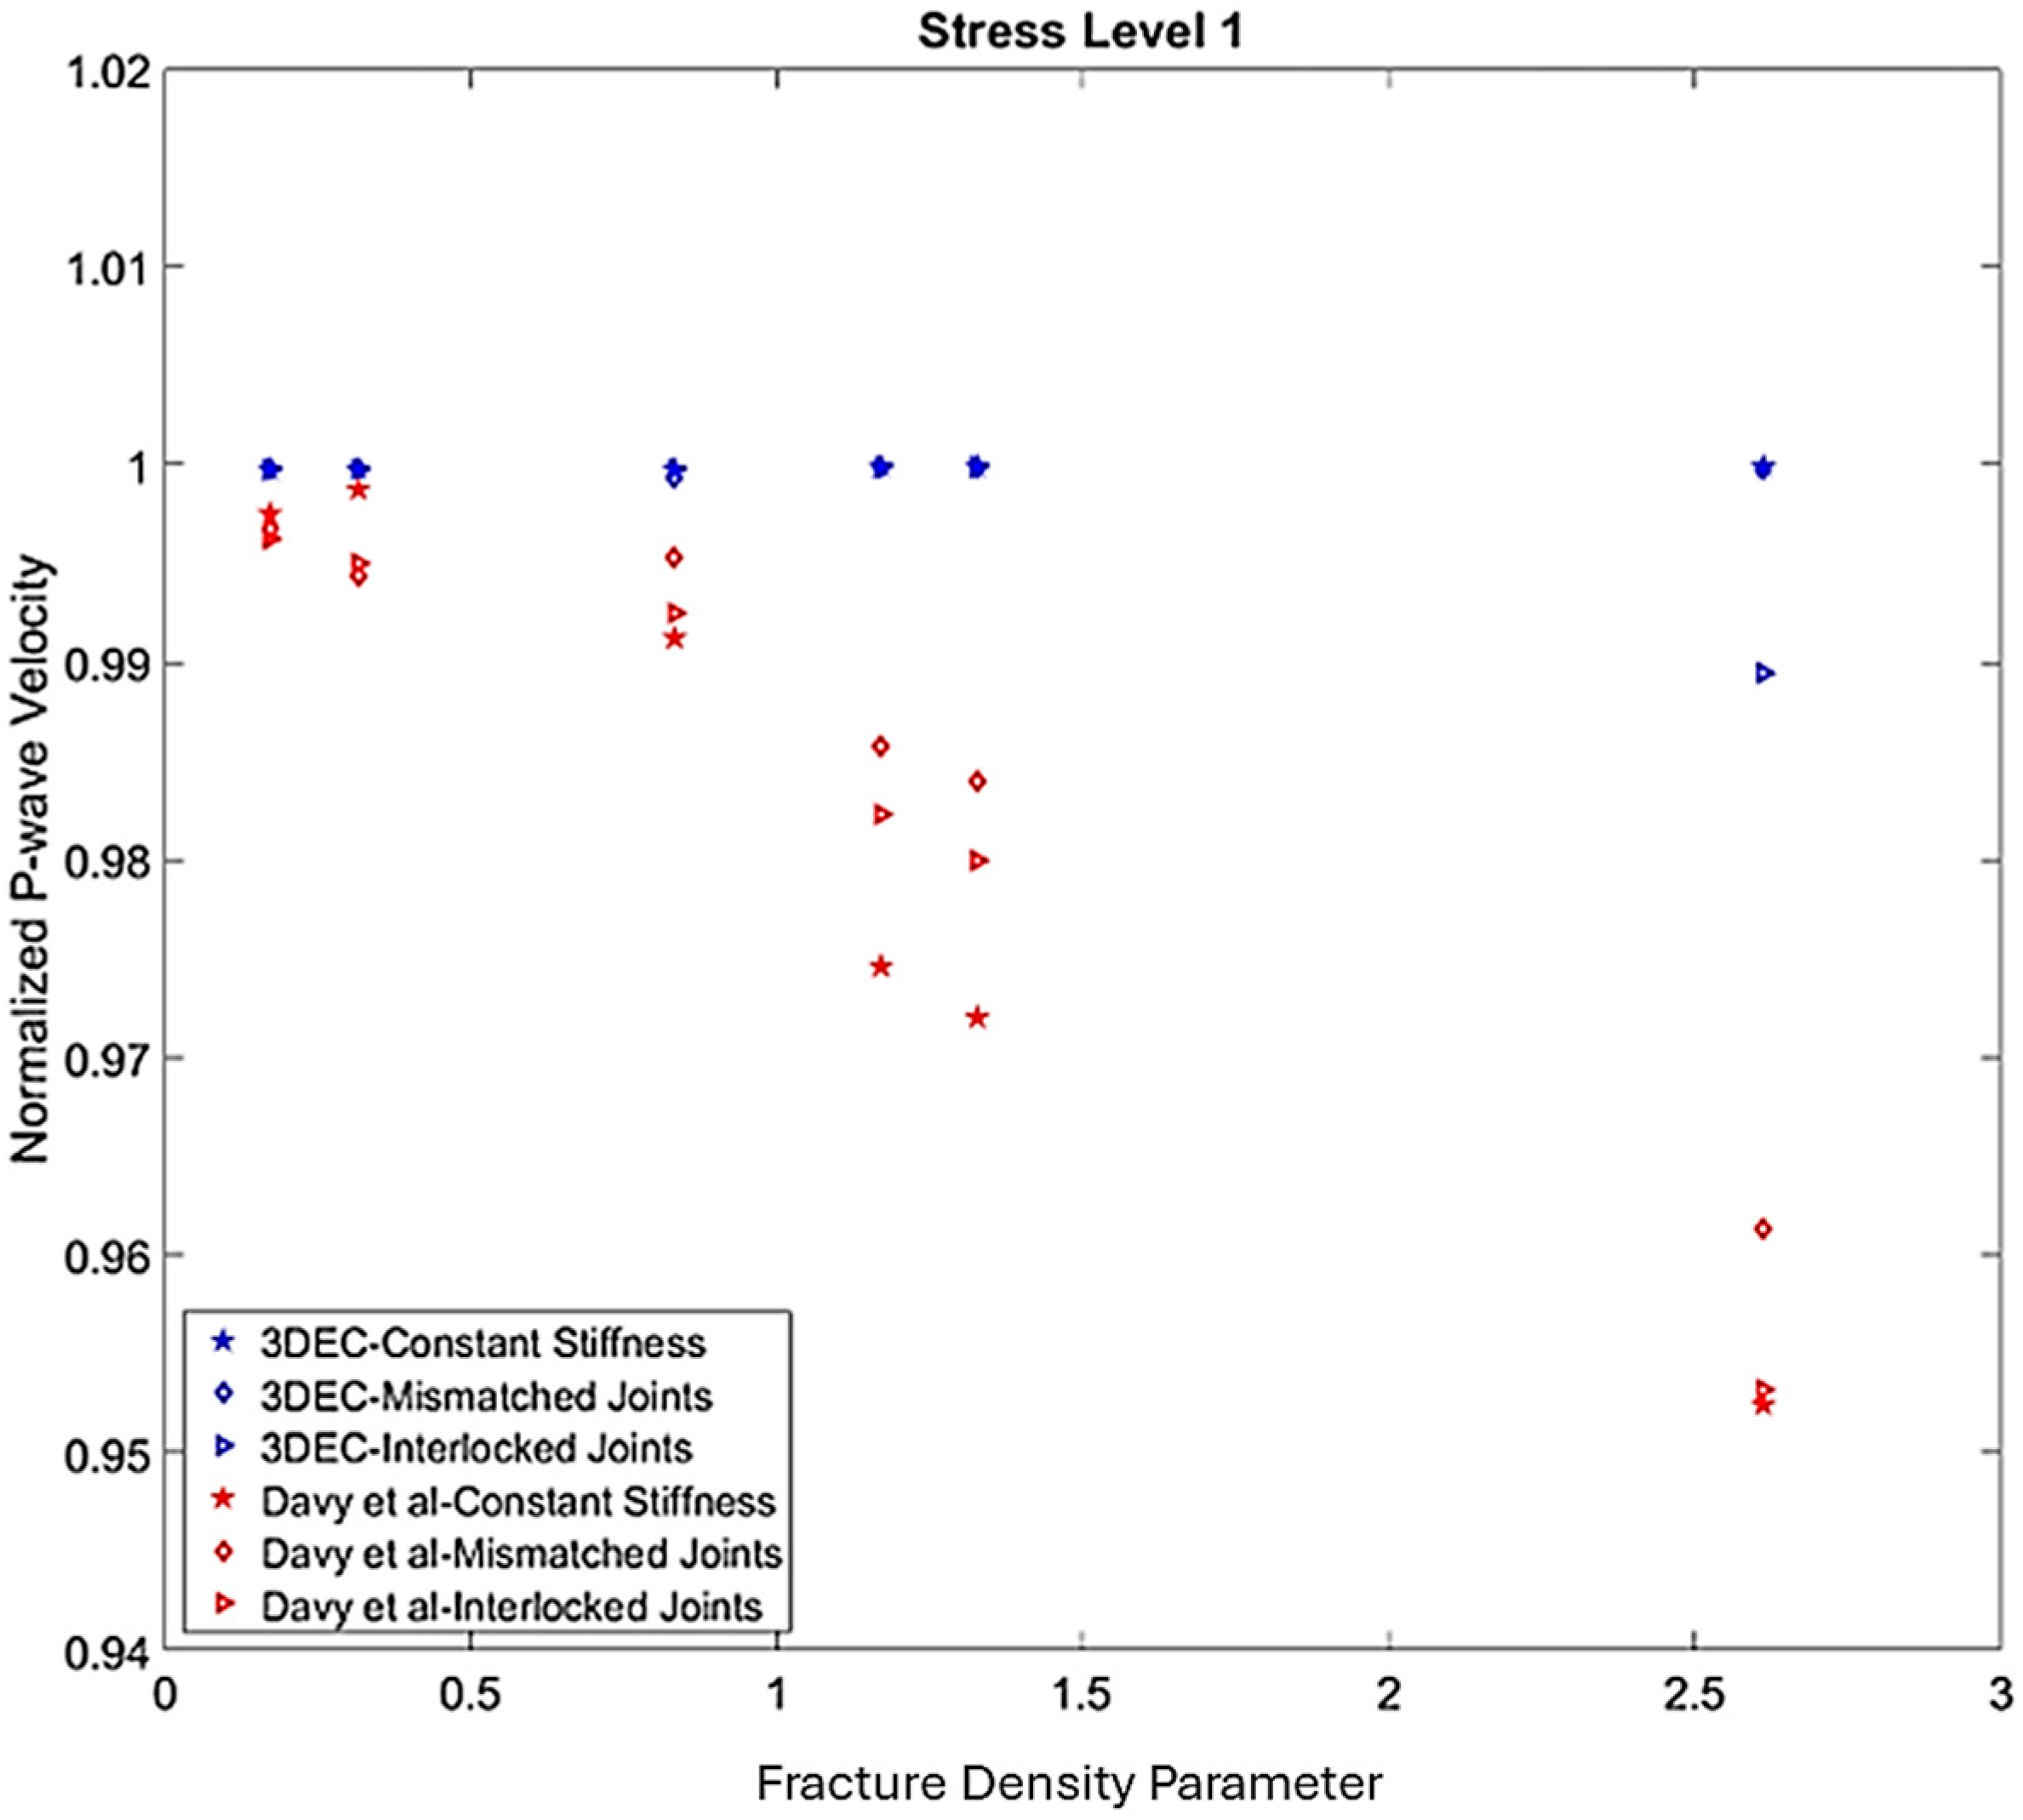
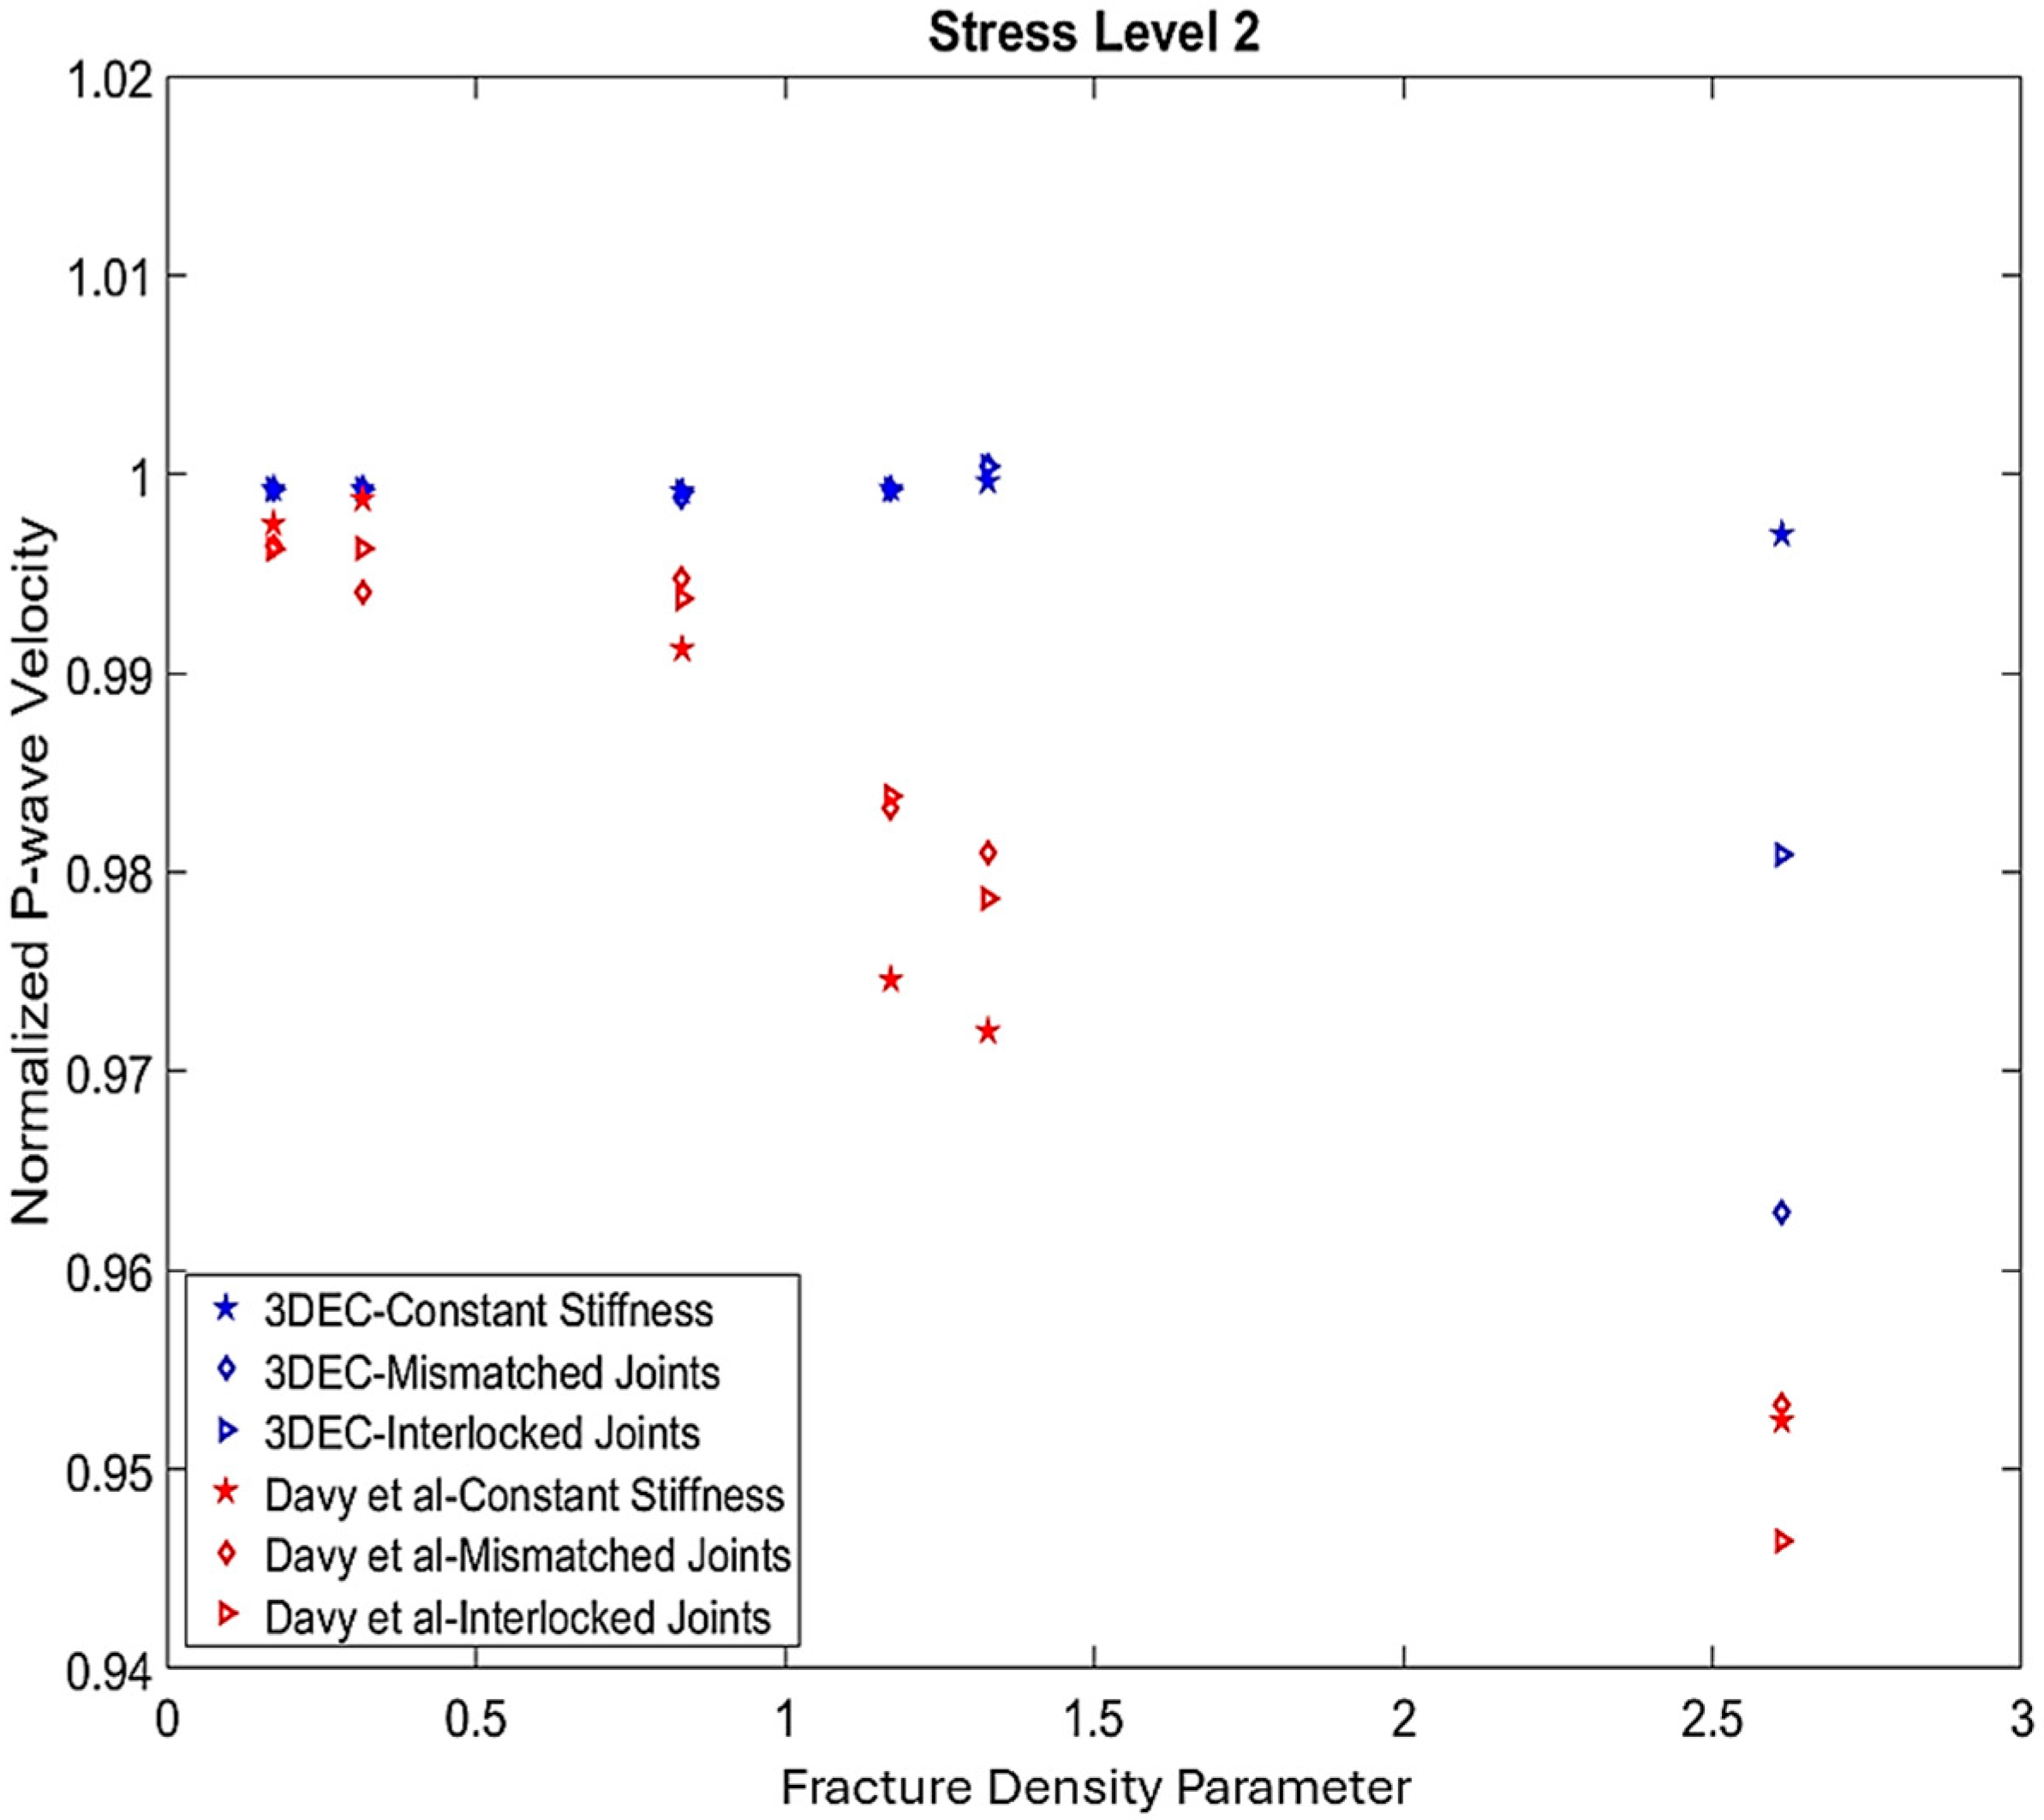
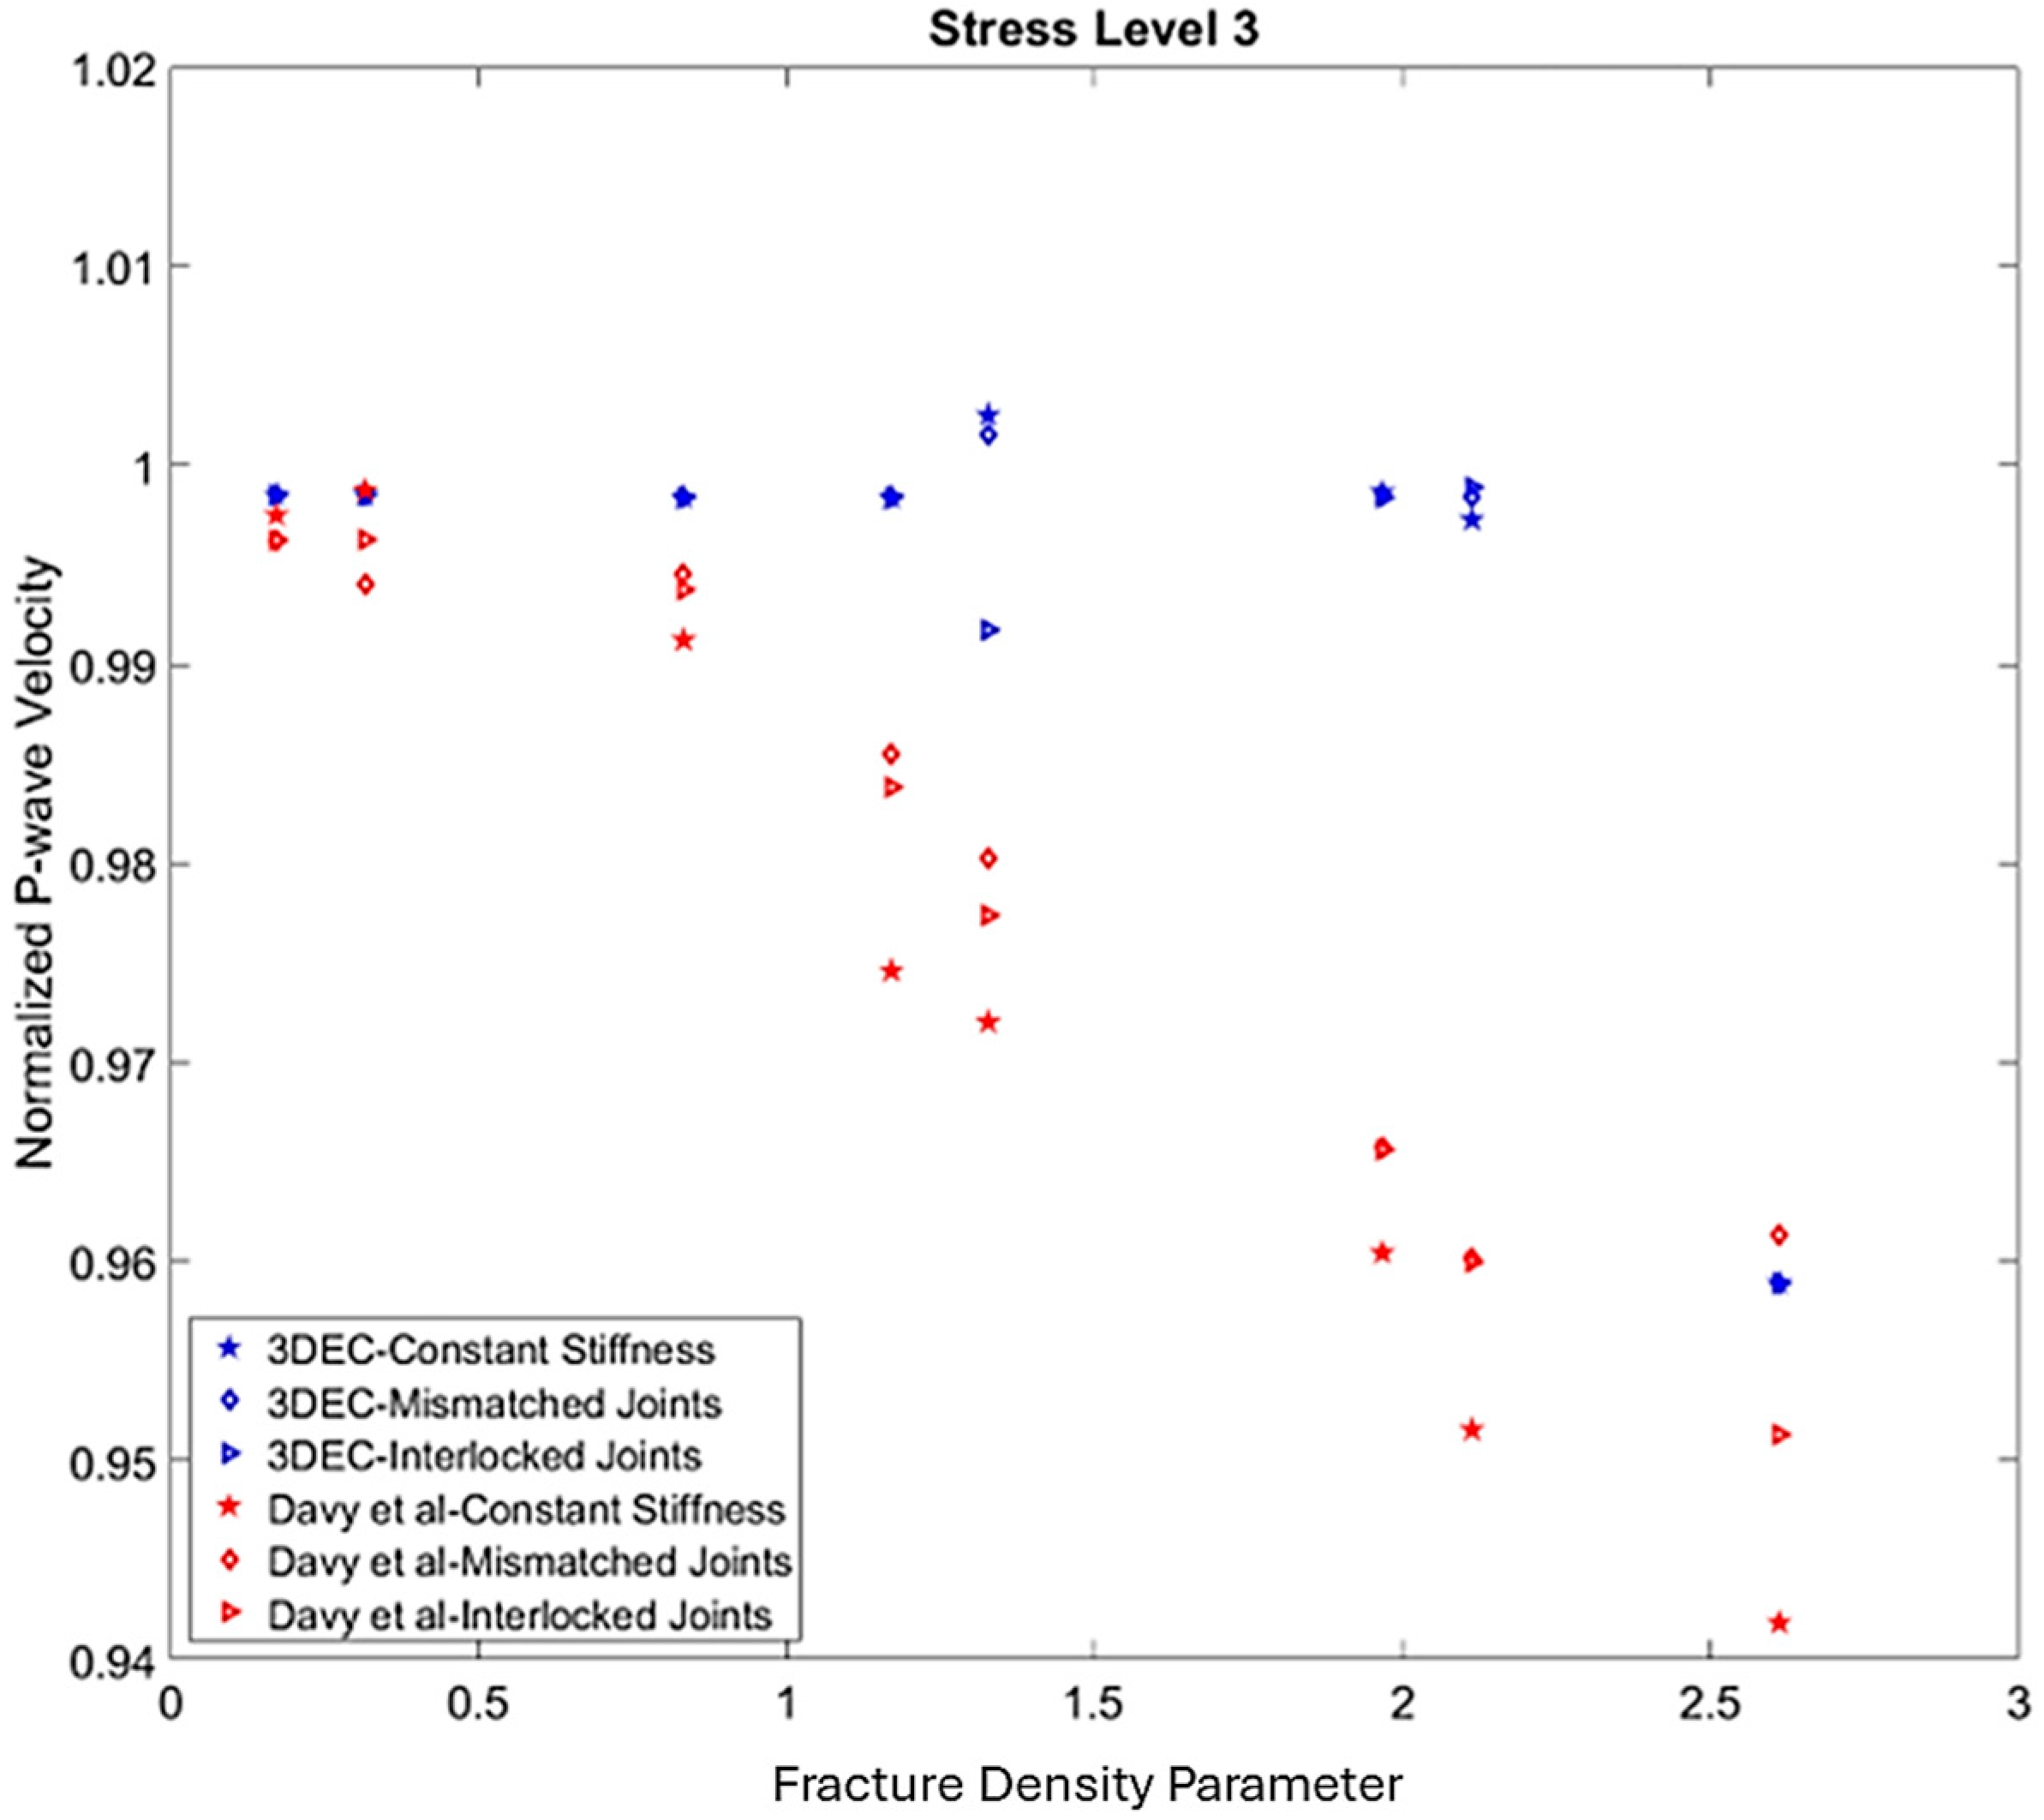
The P-wave velocities obtained from the fractured rock models were normalised by the P-wave velocity of the rock matrix and plotted against the fracture density parameter, as shown in Figure 16, Figure 17 and Figure 18 for the three stress levels. These figures indicate that, for all stress levels, the velocity exhibits the same trends as the effective Young’s moduli presented in Figure 10, Figure 11 and Figure 12. Assuming that a variation of 0.01 in the normalised P-wave velocity (1 ± 0.01) is negligible, it can be concluded that, at stress level 1, the numerical results are independent of the fracture density parameter, in contrast to the results obtained using the analytical method in [37]. At stress levels 2 and 3, however, some deviations in the P-wave velocity are observed at a fracture density parameter of 2.6. Similarly to the evolution of Young’s modulus with stress level, the differences in the normalised P-wave velocity among the three fracture stiffness models, constant, mismatched, and interlocked, diminish with increasing stress level in both numerical and analytical approaches.

5. Conclusions

In this study, the scaling of the Soultz-sous-Forêts fracture network [68,69,70,71] was adopted to generate a stochastic discrete fracture network (DFN) using 3DEC. The DFN consisted of 418 fractures with diameters ranging from 10 to 3000 m, following a power-law length distribution with an exponent of 3.0. Fractures were uniformly distributed in space and orientation in four sets within a cubic domain of 100 × 100 × 100 m3 to reproduce in situ observations. This DFN was then embedded into a homogeneous, isotropic, elastic rock block of the same size to construct a fractured massif model.
Three distinct fractured massif models were developed by varying the assignment of normal and shear stiffness to fractures: (i) constant normal and shear stiffness, (ii) interlocked normal stiffness with stress-dependent shear stiffness, and (iii) mismatched normal stiffness with stress-dependent shear stiffness. Each model was subjected to three in situ stress levels (stress levels 1, 2, and 3) and four stress perturbation modes (modes 1–4) to evaluate the corresponding effective elastic moduli and P-wave velocity variations. Among the perturbation modes, mode 2 provided the most consistent results.
To further assess the effect of fracture density on effective moduli, additional DFN models with 50, 100, 200, 418, 500, and 1000 fractures were generated. For each case, the three stiffness models were applied, and the blocks were subjected to the second stress perturbation mode under all three stress levels. Numerical simulations revealed that deviations in the effective moduli from the rock matrix values occurred only when the DFN contained 1000 fractures (fracture density parameter = 2.6). By contrast, the analytical approach of Davy et al. [37] predicted deviations at lower fracture density values.
The P-wave velocities of the fractured massif models were calculated from the elastic moduli, normalised to the rock matrix velocity, and analysed as a function of fracture density. The results showed a consistent trend with the effective modulus: in the numerical simulations, deviations appeared only at a fracture density parameter of 2.6, while in the analytical model, they occurred at lower densities. Furthermore, both methods showed that the differences among the three stiffness models (constant, mismatched, interlocked) decrease with increasing stress level. However, this convergence occurred at stress levels 2 and 3 in the analytical method, but only at stress level 3 in the numerical scheme.
The observed discrepancies between the analytical and numerical results can be attributed to fracture interactions and associated stress perturbations, which are explicitly captured in 3DEC simulations but neglected in the analytical formulation.

Author Contributions

Conceptualization, J.S. and F.H.C.; methodology, D.J.; software, D.J.; validation, D.J. and J.S.; formal analysis, D.J.; investigation, J.S. and F.H.C.; resources, J.S.; data curation, D.J.; writing—original draft preparation, D.J.; writing—review and editing, J.S.; visualization, D.J.; supervision, J.S. and F.H.C.; project administration, J.S.; funding acquisition, J.S. and F.H.C. All authors have read and agreed to the published version of the manuscript.

Funding

This work of the Interdisciplinary Thematic Institute GeoT, as part of the ITI 2021–2028 program of the University of Strasbourg, CNRS and Inserm, was supported by IdEx Unistra (ANR-10-IDEX-0002), and by SFRI-STRAT’US project (ANR20-SFRI-001) under the framework of the French Investments for the Future Program, and by Total Energies (Grant #FR00038306).

Data Availability Statement

The data sets used and/or analysed in the current study are available from the corresponding author upon reasonable request.

Acknowledgments

We would also like to thank Julie Maury, Thibault Candel, Guido Blöcher, and Christophe Fond for their constructive comments. We also thank Hamid Pourpak from Total Energies, and Rima Ghazal and Jim Hazzard of Itasca S.A.S. and Itasca C.G., respectively, for their technical assistance and fruitful discussions. This work is dedicated to the memory of François Henri Cornet.

Conflicts of Interest

The authors declare no conflicts of interest. The funders had no role in the design of the study; in the collection, analyses, or interpretation of data; in the writing of the manuscript; or in the decision to publish the results.

Abbreviations

The following abbreviations are used in this manuscript:
DFNDiscrete Fracture Network
DEMDistinct Element Method
HMHydro-Mechanical

References

  1. Cornet, F.H. Elements of Crustal Geomechanics; Cambridge University Press: Cambridge, UK, 2015. [Google Scholar] [CrossRef][Green Version]
  2. Simmons, G.; Brace, W. Comparison of static and dynamic measurements of compressibility of rocks. J. Geophys. Res. 1965, 70, 5649–5656. [Google Scholar] [CrossRef]
  3. Walsh, J.B. The effect of cracks on the compressibility of rock. J. Geophys. Res. 1965, 70, 5249–5257. [Google Scholar] [CrossRef]
  4. Singh, B. Continuum characterization of jointed rock masses: Part I—The constitutive equations. Int. J. Rock Mech. Min. Sci. 1973, 10, 311–335. [Google Scholar] [CrossRef]
  5. Bieniawski, Z. Engineering classification of jointed rock masses. Civ. Eng. S. Afr. 1973, 15, 335–344. [Google Scholar]
  6. Bieniawski, Z. Determining rock mass deformability: Experience from case histories. Int. J. Rock Mech. Min. Sci. Geomech. Abstr. 1978, 15, 237–247. [Google Scholar] [CrossRef]
  7. Barton, N.R.; Lien, R.; Lunde, J. Engineering classification of rock masses for the design of tunnel support. Rock Mech. 1974, 6, 189–236. [Google Scholar] [CrossRef]
  8. Amadei, B.; Goodman, R. A 3-D constitutive relation for fractured rock masses. In Proceedings of the International Symposium on Mechanical Behavior of Rock Structured Media—Part B, Ottawa, ON, Canada, 18–21 May 1981; pp. 249–268. [Google Scholar]
  9. Hoek, E. Strength of rock and rock masses. ISRM News J. 1994, 2, 4–16. [Google Scholar]
  10. Hoek, E.; Kaiser, P.K.; Bawden, W.F. Support of Underground Excavations in Hard Rock; CRC Press: Boca Raton, FL, USA, 1995. [Google Scholar]
  11. Hoek, E.; Diederichs, M.S. Empirical estimation of rock mass modulus. Int. J. Rock Mech. Min. Sci. 2006, 43, 203–215. [Google Scholar] [CrossRef]
  12. Cai, M.; Horii, H. A Constitutive Model and FEM Analysis of Jointed Rock Masses. Int. J. Rock Mech. Min. Sci. Geomech. Abstr. 1993, 30, 351–359. [Google Scholar] [CrossRef]
  13. Sneddon, I.N.; Lowengrub, M. Crack Problems in the Classical Theory of Elasticity; Wiley and Sons: New York, NY, USA, 1969. [Google Scholar]
  14. Atkinson, B.K. Fracture Mechanics of Rock, Geology; Academic Press: London, UK, 1987. [Google Scholar] [CrossRef]
  15. Fabrikant, V.I. Complete solutions to some mixed boundary value problems in elasticity. Eng. Frac. Mech. 1988, 27, 153–223. [Google Scholar] [CrossRef]
  16. Zimmerman, R.W. The effect of microcracks on the elastic moduli of brittle materials. J. Mater. Sci. Let. 1985, 4, 1457–1460. [Google Scholar] [CrossRef]
  17. Budianski, R.; O’Connell, R.J. Elastic Moduli of cracked solid. Int. J. Solids Struct. 1976, 12, 81–97. [Google Scholar] [CrossRef]
  18. Kachanov, M. Elastic solids with many cracks and related problems. Adv. Appl. Mech. 1993, 30, 259–445. [Google Scholar] [CrossRef]
  19. Sayers, C.M.; Kachanov, M. A simple technique for finding effective elastic constants of cracked solids for arbitrary crack orientation statistics. Int. J. Soli. Struc. 1991, 27, 671–680. [Google Scholar] [CrossRef]
  20. Sayers, C.M.; Kachanov, M. Microcrack-induced elastic wave anisotropy of brittle rocks. J. Geophys. Res. 1995, 100, 4149–4156. [Google Scholar] [CrossRef]
  21. Schoenberg, M.; Sayers, C.M. Seismic anisotropy of fractured rock. Geophysics 1995, 60, 204–211. [Google Scholar] [CrossRef]
  22. Grechka, V.; Kachanov, M. Effective elasticity of fractured rocks: A snapshot of the work in progress. Geophysics 2006, 71, W45–W58. [Google Scholar] [CrossRef]
  23. Guéguen, Y.; Kachanov, M. Effective elastic properties of cracked rocks—An overview. In Mechanics of Crustal Rocks; Leroy, Y., Lehner, F., Eds.; Springer: Vienna, Austria, 2011; pp. 73–125. [Google Scholar] [CrossRef]
  24. Bandis, S.C.; Lumsden, A.C.; Barton, N.R. Fundamentals of Rock Joint Deformation. Int. J. Rock Mech. 1983, 20, 249–268. [Google Scholar] [CrossRef]
  25. Goodman, R.E.; Taylor, R.L.; Brekke, T.L. A model for the mechanics of jointed rocks. J. Soil Mech. Found. Div. 1968, 94, 637–660. [Google Scholar] [CrossRef]
  26. Yoshioka, N.; Scholz, C.H. Elastic properties of contacting surfaces under normal and shear loads: 1. Theory. J. Geophys. Res. 1989, 94, 17681–17690. [Google Scholar] [CrossRef]
  27. Yoshioka, N.; Scholz, C.H. Elastic properties of contacting surfaces under normal and shear loads: 2. Comparison of theory with experiment. J. Geophys. Res. 1989, 94, 17691–17700. [Google Scholar] [CrossRef]
  28. Byerlee, J.D.; Brace, W.F. Stick slip, stable sliding, and earthquakes—Effect of rock type, pressure, strain rate, and stiffness. J. Geophys. Res. 1968, 73, 6031–6037. [Google Scholar] [CrossRef]
  29. Min, K.; Jing, L.; Stephanson, O. Determining the equivalent permeability tensor for fractured rock masses using a stochastic REV approach: Method and application to the field data from Sellafield, UK. Hydrogeol. J. 2004, 12, 497–510. [Google Scholar] [CrossRef]
  30. Darcel, C.; Le Goc, R.; Doolaeghe, D.; Ghazal, R.; Davy, P. Rock Mass Effective Properties from a DFN Approach Phase 1—Elastic Properties; No. R-20-05; SKB: Solna, Sweden, 2021. [Google Scholar]
  31. Kulatilake, P.H.S.W. Effects of finite-size joints on the deformability of jointed rock in three dimensions. Int. J. Rock Mech. Min. Sci. Geomech. Abst. 1993, 30, 479–501. [Google Scholar] [CrossRef]
  32. Pouya, A.; Ghoreychi, M. Determination of rock mass strength properties by homogenization. Int. J. Num. Ana. Meth. Geomech. 2001, 25, 1285–1303. [Google Scholar] [CrossRef]
  33. Min, K.; Jing, L. Numerical determination of the equivalent elastic compliance tensor for fractured rock masses using the distinct element method. Int. J. Rock Mech. Min. Sci. 2003, 40, 796–816. [Google Scholar] [CrossRef]
  34. Esmaieli, K.; Hadjigeorgiou, J.; Grenon, M. Estimating geometrical and mechanical REV based on synthetic rock mass models at Brunswick mine. Int. J. Rock Mech. Min. Sci. 2010, 47, 915–926. [Google Scholar] [CrossRef]
  35. Wu, Q.; Kulatilake, P.H.S.W. REV and its properties on fracture system and mechanical properties, and an orthotropic constitutive model for a jointed rock mass in a dam site in China. Comput. Geotech. 2012, 43, 124–142. [Google Scholar] [CrossRef]
  36. Khani, A.; Baghbanan, A.; Norouzi, S.; Hashemolhosseini, H. Effects of fracture geometry and stress on the strength of a fractured rock mass. Int. J. Rock Mech. Min. Sci. 2013, 60, 345–352. [Google Scholar] [CrossRef]
  37. Davy, P.; Darcel, C.; Le Goc, R.; Mas Ivras, D. Elastic Properties of Fractured Rock Masses with Frictional Properties and Power Law Fracture Size Distributions. J. Geophys. Res. Solid Earth 2018, 123, 6521–6539. [Google Scholar] [CrossRef]
  38. Bonnet, E.; Bour, O.; Odling, N.E.; Davy, P.; Main, I.; Cowie, P.; Berkowitz, B. Scaling of fracture system in geological media. Rev. Geophys. 2001, 39, 347–383. [Google Scholar] [CrossRef]
  39. Priest, S.D.; Hudson, J.A. Estimation of discontinuity spacing and trace length using scanline survey. Int. J. Rock Mech. Min. Sci. Geomech. Abstr. 1981, 18, 183–197. [Google Scholar] [CrossRef]
  40. Rouleau, A.; Gale, J.E. Statistical characterization of the fracture system in the Stripa granite, Sweden. Int. J. Rock Mech. Min. Sci. Geomech. Abstr. 1985, 22, 353–367. [Google Scholar] [CrossRef]
  41. Cruden, D.M. Describing the size of discontinuitie. Int. J. Rock Mech. Min. Sci. Geomech. Abstr. 1977, 14, 133–137. [Google Scholar] [CrossRef]
  42. Hudson, J.A.; Priest, S.D. Discontinuities and rock mass geometry. Int. J. Rock Mech. Min. Sci. Geomech. Abstr. 1979, 16, 339–362. [Google Scholar] [CrossRef]
  43. Hudson, J.A.; Priest, S.D. Discontinuity frequency in rock masses. Int. J. Rock Mech. Min. Sci. Geomech. Abstr. 1983, 20, 73–89. [Google Scholar] [CrossRef]
  44. Nur, A. The origin of tensile fracture lineament. J. Struct. Geol. 1982, 4, 31–40. [Google Scholar] [CrossRef]
  45. Carbotte, S.M.; Mc Donald, K.C. Comparison of seafloor tectonic fabric at intermediate, fast, and super-fast spreading ridges’ Influence of spreading rate, plate motions, and ridge segmentation on fault patterns. J. Geophys. Res. 1994, 99, 13609–13631. [Google Scholar] [CrossRef]
  46. Cowie, P.A.; Vanneste, C.; Sornette, A. Statistical physics model for the spatiotemporal evolution of faults. J. Geophys. Res. 1993, 98, 21809–21822. [Google Scholar] [CrossRef]
  47. Davy, P. On the frequency-length distribution of the San Andreas fault system. J. Geophys. Res. 1993, 98, 12141–12151. [Google Scholar] [CrossRef]
  48. Kagan, Y.Y. Seismic moment-frequency relation for shallow earthquakes: Regional comparison. J. Geophys. Res. 1997, 102, 2835–2852. [Google Scholar] [CrossRef]
  49. Sornette, D.; Sornette, A. General theory of the modified Gutenberg-Richter law for large seismic moments. Bull. Seismol. Soc. Am. 1999, 89, 1121–1130. [Google Scholar] [CrossRef]
  50. Davy, P.; Sornette, A.; Sornette, D. Some consequences of a proposed fractal nature of continental faulting. Nature 1990, 348, 56–58. [Google Scholar] [CrossRef]
  51. Bour, O.; Davy, P.; Darcel, C.; Odling, N.E. A statistical scaling model for fracture network geometry, with validation on a multiscale mapping of a joint network (Hornelen Basin, Norway). J. Geophys. Res. 2002, 107, ETG-4-1–ETG-4-12. [Google Scholar] [CrossRef]
  52. Barton, N.R.; Bandis, S.C. Characterization and modelling of the shear strength, stiffness and hydraulic behavior of rock joints for engineering purposes. In Rock Mechanics and Engineering; CRC Press: Boca Raton, FL, USA, 2017; p. 38. [Google Scholar]
  53. Lei, Q.; Barton, N.R. On the selection of joint constitutive models for geomechanics simulation of fractured rocks. Comp. Geothech. 2022, 145, 104707. [Google Scholar] [CrossRef]
  54. Bandis, S.C.; Lumsden, A.C.; Barton, N.R. Experimental Studies of Scale Effects on the Shear Behaviour of Rock Joints. Int. J. Rock Mech. Min. Sci. Geomech. Abstr. 1981, 18, 1–21. [Google Scholar] [CrossRef]
  55. Deng, Q.; Schmittbuhl, J.; Cacace, M.; Blöcher, G. Mechanical stiffness and permeability of a reservoir-scale rough fracture during closure. J. Geophys. Res. Solid Earth 2024, 129, e2024JB029001. [Google Scholar] [CrossRef]
  56. Evans, K.F.; Kohl, T.; Rybach, L.; Hopkirk, R.J. The effects of fracture normal compliance on the long-term circulation behaviour of a hot dry rock reservoir: A parameter study using the new fully coupled code fracture. GRC Trans. 1992, 16, 449–456. [Google Scholar]
  57. Zangerl, C.; Evans, K.F.; Eberhardt, E.; Loew, S. Normal stiffness of fractures in granitic rock: A compilation of laboratory and in-situ experiments. Int. J. Rock Mech. Min. Sci. 2008, 45, 1500–1507. [Google Scholar] [CrossRef]
  58. Kulhaway, F.H. Stress-deformation properties of rock and rock discontinuities. Eng. Geol. 1975, 8, 327–350. [Google Scholar] [CrossRef]
  59. 3DEC Software User Manual; Itasca Consulting Group, Inc.: Minneapolis, MN, USA, 2016.
  60. Hart, R.D. An introduction to Distinct Element Modeling for Rock Engineering; Pergamon Press: Oxford, UK, 1993. [Google Scholar]
  61. Alshkane, Y.M.; Marshall, M.A.; Stace, L.R. Prediction of strength and deformability of an interlocked blocky rock mass using UDEC. J. Rock. Mech. Geothec. Eng. 2017, 9, 531–542. [Google Scholar] [CrossRef]
  62. Pan, P.Z.; Feng, X.T.; Hudson, J.A. Numerical simulations of Class I and Class II uniaxial compression curves using an elasto-plastic cellular automaton and a linear combination of stress and strain as the control method. Int. J. Rock Mech. Min. Sci. 2006, 43, 1109–1117. [Google Scholar] [CrossRef]
  63. Shimizu, H.; Koyama, T.; Ishida, T.; Chijimatsu, M.; Fujita, T.; Nakama, S. Distinct element analysis for Class II behavior of rocks under uniaxial compression. Int. J. Rock Mech. Min. Sci. 2010, 47, 323–333. [Google Scholar] [CrossRef]
  64. Villeneuve, M.C.; Heap, M.J.; Kushnir, A.R.; Qin, T.; Baud, P.; Zhou, G.; Xu, T. Estimating in situ rock mass strength and elastic modulus of granite from the Soultz-sous-Forêts geothermal reservoir (France). Geotherm. Energy 2018, 6, 11. [Google Scholar] [CrossRef]
  65. Gentier, S.; Rachez, X.; Dezayes, C.; Blaisonneau, A.; Genter, A. How to Understand the Effect of the Hydraulic Stimulation in Terms of Hydro-Mechanical Behavior at Soultz-sous-Forêts (France). GRC Trans. 2005, 29, 159–166. [Google Scholar]
  66. Cornet, F.H.; Bérard, T.; Bourouis, S. How close to failure is a granite rock mass at a 5km depth? Int. J. Rock Mech. Min. Sci. 2007, 44, 47–66. [Google Scholar] [CrossRef]
  67. Valley, B.; Evans, K.F. Stress state at Soultz-sous-Forêts to 5 km depth from wellbore failure and hydraulic observations. In Proceedings of the Workshop on Geothermal Reservoir Engineering, Stanford, CA, USA, 22–24 January 2007; Stanford University: Stanford, CA, USA, 2007. [Google Scholar]
  68. Valley, B. The Relation Between Natural Fracturing and Stress Heterogeneities in Deep-Seated Crystalline Rocks at Soultz-sousForêts (France); ETH Zurich: Zurich, Switzerland, 2007. [Google Scholar]
  69. Massart, B.; Paillet, M.; Henrion, V.; Sausse, J.; Dezayes, C.; Genter, A.; Bisset, A. Fracture Characterization and Stochastic Modeling of the Granitic Basement in the HDR Soultz Project (France). In Proceedings of the World Geothermal Congress, International Geothermal Association, Bali, Indonesia, 25–30 April 2010. [Google Scholar]
  70. Afshari Moein, M.J.; Valley, B.; Evans, K.F. Scaling of Fracture Patterns in Three Deep Boreholes and Implications for Constraining Fractal Discrete Fracture Network Models. Rock Mech. Rock Eng. 2019, 52, 1723–1743. [Google Scholar] [CrossRef]
  71. Afshari Moein, M.J.; Bar, K.; Valley, B.; Genter, A.; Sass, I. Depth-Dependent Scaling of Fracture Patterns Inferred from Borehole Images in GPK3 and GPK4 Wells at Soultz-sous-Forêts Geothermal Site. In Proceedings of the World Geothermal Congress 2020+1, Reykjavik, Iceland, 24–27 October 2021. [Google Scholar]
  72. Javani, D. Modélisation des Variations de Vitesse des Ondes P Liées au Glissement Asismique dans un Réservoir Fracturé. Ph.D. Thesis, ITES/EOST, University of Strasbourg, Strasbourg, France, 2023. Available online: https://theses.hal.science/tel-04573885v1 (accessed on 5 September 2025).
  73. Anderson, E.W. The dynamics of faulting. Trans. Edinb. Geol. Soc. 1905, 8, 387–402. [Google Scholar] [CrossRef]
  74. Jaeger, J.C.; Cook, N.G.W.; Zimmerman, R.W. Fundamentals of Rock Mechanics, 4th ed.; Blackwell: Oxford, UK, 2007. [Google Scholar]
  75. Stacey, F.D.; Davis, P.M. Physics of the Earth, 4th ed.; Cambridge University Press: Cambridge, UK, 2008. [Google Scholar]
  76. Dershowitz, W.S.; Herda, H.H. Interpretation of fracture spacing and intensity. In Proceedings of the 33rd U.S. Symposium on Rock Mechanics (USRMS), ARMA-92-0757. Santa Fe, NM, USA, 8–10 June 1992. [Google Scholar]
  77. Place, J.; Diraison, M.; Naville, C.; Geraud, Y.; Schaming, M.; Dezayes, C. Decoupling of deformation in the Upper Rhine Graben sediments. Seismic reflection and diffraction on 3-component Vertical Seismic Profiling (Soultz-sous-Forêts area). Comptes Rendus Geosci. 2010, 342, 575–586. [Google Scholar] [CrossRef]
  78. Calò, M.; Dorbath, C.; Cornet, F.H.; Cuenot, N. Large-scale aseismic motion identified through 4-D P-wave tomography. Geophys. J. Int. 2011, 186, 1295–1314. [Google Scholar] [CrossRef]
  79. Cornet, F.H. The relationship between seismic and aseismic motions induced by forced fluid injections. Hydrogeo. J. 2012, 20, 1463–1466. [Google Scholar] [CrossRef]
  80. Calò, M.; Dorbath, C. Different behaviours of the seismic velocity field at Soultz-sous-Forêts revealed by 4-D seismic tomography: Case study of GPK3 and GPK2 injection tests. Geophys. J. Int. 2013, 194, 1119–1137. [Google Scholar] [CrossRef]
  81. Cauchie, L.; Lengline, O.; Schmittbuhl, J. Seismic asperity size evolution during fluid injection: Case study of the 1993 Soultz-sous-Forêts injection. Geophys. J. Int. 2020, 221, 968–980. [Google Scholar] [CrossRef]
  82. Fjaer, E. Relations between Static and Dynamic Moduli of Sedimentary Rocks. Geophys. Prospect. 2019, 67, 128–139. [Google Scholar] [CrossRef]
Figure 1. Schematic illustration of the fracture normal closure, based on the experiments of Bandis et al. [24]. Arrows refer to the loading path.
Geosciences 15 00371 g001
Figure 2. Modelled relationship between hydraulic aperture and effective normal stress for a rock joint (reproduced after [59]).
Geosciences 15 00371 g002
Figure 3. Geometry of the block (left) used through verification tests, on which the circular finite size circular fracture is distinguished in black (right).
Geosciences 15 00371 g003
Figure 4. Histogram of stiffness characteristic values for natural fractures in granite compiled from [57].
Geosciences 15 00371 g004
Figure 5. Comparison of numerical and empirical normal stress–normal displacement curves for (a) interlocked joints (Equation (6)) and (b) mismatched joints (Equation (7)). Good agreement is observed between the numerical and empirical curves for both variable and constant fracture normal stiffness.
Geosciences 15 00371 g005
Figure 6. Comparison of numerical and empirical shear stress–shear displacement curves for a mismatched joint (Equation (9)). Good agreement is observed between the numerical and empirical curves for the normal stiffness constant of the fracture. However, for the case of variable fracture shear stiffness, there are some discrepancies, which may be attributed to uncertainties in the estimation of the ultimate shear stiffness in the analytical calculations.
Geosciences 15 00371 g006
Figure 7. DFN sample composed of 418 fractures with diameters ranging from 10 to 3000 m.
Geosciences 15 00371 g007
Figure 8. Sides of rock block measuring 100 × 100 × 100 m3 that include the DFN in Figure 7.
Geosciences 15 00371 g008
Figure 9. Normalised Poisson’s ratio and Young’s modulus for the fractured model shown in Figure 7, which were distinguished using three fracture stiffness parameters and evaluated under four stress perturbation modes across three stress levels.
Geosciences 15 00371 g009
Figure 10. Evolution of the normalised numerical and analytical effective Young’s modulus as a function of the fracture density parameter for the three fractured models under the first stress level and the second stress perturbation mode. ‘3DEC’ refers to results from 3DEC computations and ‘Davy et al’ refers to [37].
Geosciences 15 00371 g010
Figure 11. Evolution of the ratio of numerical to analytical effective Young’s modulus as a function of the fracture density parameter for the three fractured models under the second stress level and the second stress perturbation mode. ‘3DEC’ refers to results from 3DEC computations and ‘Davy et al’ refers to [37].
Geosciences 15 00371 g011
Figure 12. Evolution of the ratio of numerical to analytical effective Young’s modulus as a function of the fracture density parameter for the three fractured models under the third stress level and the second stress perturbation mode. ‘3DEC’ refers to results from 3DEC computations and ‘Davy et al’ refers to [37].
Geosciences 15 00371 g012
Figure 13. Evolution of the normalised numerical and analytical effective Poisson’s ratio as a function of the fracture density parameter for the three fractured models under the first stress level and the second stress perturbation mode. ‘3DEC’ refers to results from 3DEC computations and ‘Davy et al’ refers to [37].
Geosciences 15 00371 g013
Figure 14. Evolution of the normalised numerical and analytical effective Poisson’s ratio as a function of the fracture density parameter for the three fractured models under the second stress level and the second stress perturbation mode. ‘3DEC’ refers to results from 3DEC computations and ‘Davy et al’ refers to [37].
Geosciences 15 00371 g014
Figure 15. Evolution of the normalised numerical and analytical effective Poisson’s ratio as a function of the fracture density parameter for the three fractured models under the third stress level and the second stress perturbation mode. ‘3DEC’ refers to results from 3DEC computations and ‘Davy et al’ refers to [37].
Geosciences 15 00371 g015
Figure 16. Normalised P-wave velocity variation versus fracture density parameter in the three fractured models that underwent the first stress level and the second stress perturbation mode. ‘3DEC’ refers to results from 3DEC computations and ‘Davy et al’ refers to [37].
Geosciences 15 00371 g016
Figure 17. Normalised P-wave velocity variation versus fracture density parameter in the three fractured models that underwent the second stress level and the second stress perturbation mode. ‘3DEC’ refers to results from 3DEC computations and ‘Davy et al’ refers to [37].
Geosciences 15 00371 g017
Figure 18. Normalised P-wave velocity variation versus fracture density parameter in the three fractured models that underwent the third stress level and the second stress perturbation mode. ‘3DEC’ refers to results from 3DEC computations and ‘Davy et al’ refers to [37].
Geosciences 15 00371 g018
Table 1. Physical and mechanical properties of rock matrix and fracture.
ElementPropertySymbolValueUnitReference
Rock MatrixYoung’s ModulusEi40GPa[64]
Poisson’s Ratioυi0.1-[64]
Bulk Densityρi2680kg/m3[65]
HeightH2m-
LengthL1m-
WidthW1m-
FractureInitial Shear Stiffnessksi20GPa/m[65]
Initial Normal Stiffnesskni80GPa/m[65]
Friction Angleφ39°[66]
CohesionS06.5MPa[67]
RadiusR0.25m-
DipD45°-
Dip DirectionDD90°-
Initial Apertureh014 · 10−5m[65]
Residual Aperturehres7 · 10−5m[65]
Maximum Aperturehmax12 · 10−3m[65]
Table 2. In situ stress state at Soultz-sous-Forêts geothermal reservoir; Z is depth in “m” and all stresses are in MPa [66,67].
S V = 33.8 + 0.0255 ( Z 1377 )
S h m i n S V = 0.54
0.95 < S h m a x S V < 1.1
P p = 0.9 + 0.0098 Z
Table 3. Summary of simulation scenarios.
Stress LevelFracture StiffnessInitial LoadingSecondary Loading
10% of in situ stress field at 4.7 km
50% of in situ stress field at 4.7 km
100% of in situ stress field at 4.7 km
Constant stiffness
Stress-Dependent Stiffness (Interlocked Joints)
Stress-Dependent Stiffness (Mismatched Joints)
In situ stress field10% of in situ stress field
In situ stress field1% of in situ stress field
In situ stress field1 MPa of isotropic triaxial stress
Isotropic triaxial S11 MPa of isotropic triaxial stress
Disclaimer/Publisher’s Note: The statements, opinions and data contained in all publications are solely those of the individual author(s) and contributor(s) and not of MDPI and/or the editor(s). MDPI and/or the editor(s) disclaim responsibility for any injury to people or property resulting from any ideas, methods, instructions or products referred to in the content.