Article

Geomorphological Observations and Physical Hypotheses About Martian Dune Gullies

Istituto Nazionale di Geofisica e Vulcanologia (INGV), Roma 1, Via di Vigna Murata 605, 00143 Roma, Italy
*
Author to whom correspondence should be addressed.
Geosciences 2025, 15(1), 29; https://doi.org/10.3390/geosciences15010029
Submission received: 19 November 2024 / Revised: 2 January 2025 / Accepted: 11 January 2025 / Published: 16 January 2025

Abstract

:
We propose the hypothesis that dune gullies and seasonal “meteorological” appearances observed on the same dunes (e.g., frosting) may have a common origin. These gullies are difficult to explain through the action of liquid flow. The occurrence of a spring flowing from the crest of a dune seems impossible to explain. However, these phenomena could originate from the impact of wind on the profiles of some large Martian dunes. This aerodynamic effect could seasonally generate all the meteorological phenomena we observe on these dunes (bodies of ice, frost, moisture trails, and vapor clouds) and as a result, produce gullies with a peculiar morphology different from the standard. Thus, dune gullies could originate from meteorological liquids, but through a process unlike those known on Earth. Evidence from the Kaiser, Russell, and Korolev Craters supports the possibility of a partial water cycle (a half-cycle), potentially the remnant of a complete ancient cycle.

1. Introduction

The first Martian gullies were discovered by analyzing the Mars Orbiter Camera (MOC) images of the Mars Global Surveyor (MGS) mission. Their existence was first reported in 2000 by Malin and Edgett [1]; most of the phenomena are observed in the southern hemisphere [2,3], mainly on the slopes of craters and canyons. In this work, we will refer to the morphology of this typical alcove–channel–apron pattern as ACA. Figure 1 presents a profile and plan view. In both Martian hemispheres, most ACA gullies are situated within a 30°–60° latitude window (the preferred orientation for low-latitude gullies is poleward facing; for high-latitude gullies, it is equatorward) [3]. At even higher latitudes, Martian gullies do not have a preferred orientation, as shown on the Harrison map [3]. The typical morphology of Martian gullies [1] shows erosion (alcove, channel incision) and slope deposition (apron) but the agent operating these actions is not evident. Furthermore, terrestrial examples often show little analogy with Martian morphology [3].
Different models have been proposed to explain the formation of ACA gullies. These include the following: the release of water or liquid brine from shallow [1] or deep [4,5] aquifers; liquid CO2 release [6]; melting of ice [7,8,9] or snow [10,11,12,13] either exposed or buried immediately below the surface; or “dry” [14,15] granular flows possibly fluidified by CO2 sublimation [16,17]. In an attempt to find a theory that satisfies all the morphological and geographical features and constraints of the ACA gullies, we recently proposed an alternative hypothesis. It implies a sporadic and brief melting of the permafrost strongly conditioned by environmental and meteorological constraints [18]. However, there remains a minority of cases where it is difficult to attribute an endogenous origin to the erosive agent.
The gullies appearing on Martian dunes are a particular type of Martian gullies. These gullies originate immediately below the dune crest and often do not show the ACA structure. Because they mainly appear in a series of parallel grooves, they are also called “linear gullies”. They do not necessarily show the expected orientation in Harrison’s belt (see [2,3]). These gullies have never been observed on terrestrial dunes. Martian dunal gullies were first observed in 2002 and are hypothetically associated with water [7]. In the same work, however, it was noted that gullies originating from isolated peaks and dune crests are incompatible with a purely geological origin. In another 2002 paper, the Russel crater’s dunal gullies were considered incompatible with CO2-driven flows [19]. Subsequently, a phenomenon caused by water several million years ago was hypothesized [20]. However, dunal gullies appear to be recent or current phenomena [21]. In the absence of water circulation in the current Martian environment, alternative solutions have been proposed, such as CO2 blocks in sublimation [22]. Pasquon et al. [23] presented a systematic investigation of dunal gullies, highlighting their recent changes in the current environment and suggesting an association with CO2 gas escape from the subsurface. We will address this hypothesis later, proposing atmospheric H2O as an alternative.
It has been recently suggested that Mars may host, at least in solid or gaseous form, more water than previously believed [24,25,26]. Data provided by the Mars Odyssey Neutron Spectrometer, High Energy Neutron Detector, and Gamma Ray instruments [27,28] as well as SHARAD radar observations [29] on the Mars Reconnaissance Orbiter and, more recently, MARSIS radar of the Mars Express mission [24], support the hypothesis that Mars still conserves water stored in the ground in the form of permafrost. Moreover, Orosei et al. [24] used MARSIS radar measurements from the Mars Express spacecraft to search for liquid water in the southern ice cap of Mars and detected a 20-km-wide lake of liquid water underneath solid ice in the Planum Australe region. The Phoenix Rover observed water ice immediately beneath a thin layer of regolith and also appears to have detected the condensation of liquid H2O [30].
In Ref. [18], we proposed an endogenous geological origin for the ACA gullies, even if strongly influenced by exposure to the sun and weather. Here, we hypothesize an exogenous origin which is totally linked to the Martian weather, in order to find a geological coherence for the peculiar morphology and position of all non-ACA gullies and dunal gullies.

2. Methods

Unlike the ACA gullies, where the agent is never visible, dunal gullies often appear associated with complex atmospheric phenomena. We will address this scenario, starting from a geomorphological point of view, and then move on to physical hypotheses. We will do this gradually, breaking down the global phenomenon into its key points through three case studies. These sites are distributed across progressively higher latitudes: Kaiser (lat. 47°), Russell (lat. 54°), and Korolev (lat. 73°). This distribution allowed us to test our hypotheses to the limits of the model. In order to carry out effective investigations, we believe that long-term monitoring and precise time reference in relation to seasonal cycles are necessary. In this study, we rank and express Martian time using the IMD dating code [31], which was specifically designed for this purpose. Therefore, we adopt 11 April 1955 (Ls = 0°) as the beginning of Martian year 1, according to The Planetary Society statement. Starting from the reference date of the satellite images, the IMD computation and coding allows us to easily visualize the Martian year, the current season, and its elapsed fraction (in %). The same algorithm also provides us with the number of Martian days (sol) that have passed since the beginning of the Martian solar year. The images used in the present study were acquired by the High-Resolution Imaging Science Experiment (HiRISE) installed on board the Mars Reconnaissance Orbiter (MRO) and can resolve 24.1 cm per pixel. To study the dune in the Russell Crater, we selected 110 HiRISE images monitoring a period of over 8 Martian years (16 Earth years) from the year 28.4 to 36.9 (Appendix A). We designed and implemented a selection procedure to obtain stereoscopic and quasi-stereoscopic pairs to better highlight the morphological features of the slopes and gullies. Specifically, we selected HiRISE images of the following type: JP2; black and white; and map-projected.
The stereoscopic technique involves the use of images of a given area taken from two different angles. In our approach, this is achieved by using two images taken during two different passages of the orbiter. The stereoscopic effect is provided by different angles, where a given surface detail is observed during two different orbital flybys. The stereoscopic pair can be visualized in different ways (in our case, by means of active glasses synchronized with the screen so that each eye only perceives the proper image). Few HiRISE images are already provided as stereo pairs. All other images have been paired by us, also through an appropriate graphical process to match one image’s resolution to the other. This process naturally implies a loss of overall resolution and has been applied only to high-resolution sources (i.e., 25 to 50 cm/pixel). Figure 2 shows the temporal distance relationship between the 110 images in Appendix A. The statistic was processed using the IMD algorithm [31]. Only eight photographs were separated by a distance of at least 5 days (in this case, precisely five). These images can be paired to obtain a 3D view. Other images were separated by longer time intervals. For example, 19 photographs were separated by a period of between 16 and 20 days.
We noted that, given the seasonality of the observed phenomena, the pairing of photos taken at different times is useful in two different ways. Images close in time facilitate the three-dimensional study of the geomorphology of the surface of Mars. Images distant in time instead highlight a defect in the three-dimensional view where a surface detail is found to have shifted or changed. This can help to emphasize transient phenomena or mutations of the surface (e.g., channels that have changed their path). All 110 images, whether paired or not, were investigated by means of a geomorphological analysis. Seven categories of transient phenomena have been classified by systematically cataloging their presence or absence over time (Appendix A). Classification and nomenclature refer to the observations in Section 4 and the graphs in Section 4.1.
We used a GIS (geographic information system) application for digital topographic processing. The digital elevation model (DEM) derived from the Mars Orbiter Laser Altimeter (MOLA) data installed on board the Mars Global Surveyor (MGS), had a resolution of about 400 m. A DEM with a resolution of almost 200 m is now available (MOLA + HRSC, see “Data availability”). We developed a color scale with double the resolution of the MOLA for the elevations and a topographic map with contour lines interpolated at 100 m.
Thanks to the IMD time scale, it was possible to highlight the specific recurrence of transient phenomena and to hypothesize the predictions of their repeatability. Finally, local pressure and temperature variations were compared on an annual time scale thanks to a dataset taken from Reiss and Jaumann [21], and referred to the Thermal Emission Spectrometer (TES), also installed on board the MGS.

3. Observations and Discussion: Water on Dunes

Although uncommon, sometimes ACA gullies can be found on dunes. Inside the Kaiser Crater, there is a barchan dune field characterized by the presence of apparently ACA gullies. The Kaiser is a 201.67 km diameter impact crater located in the Noachis Terra area (Figure 3A). Debris flows attributed to the possible action of liquid water have been observed here since 2003 [20,21]. We focus on the megadune in Figure 3B (46.7° S; 20.1° E) and Figure 4B, more than 200 m high, with a maximum extension of about 3 km in the W-E direction and 6 km in the N-S direction. Considering the classic features of the ACA model [2,3,18], we observe that the gullies on this dune raise new questions: (1) they are not polarly oriented as described by Harrison [2,3] and (2) the hypothetical source of the fluid originates from the crest of a dune. A dune is a dynamic landform continuously evolving. The hypothesis of a classical spring requires at least the presence of permafrost upstream of the gully, which is not possible on a dune crest.
We should note that, on dunes, gullies are always located on the downwind side (e.g., Figure 4), regardless of insolation. Figure 4A is a zoom-in of the box in Figure 4B. Here, it is clear that the erosion of the alcoves is not symmetrical, as in the ACA model, but more accentuated on the poleward side. The other side of the alcoves is smooth. This is possibly due to the reshaping of the sand resulting from direct erosion on the opposite side of the alcove. This photo was taken in late autumn. The box in Figure 4B represents the same gullies in a photo taken in mid-winter of the same year (Figure 4C). Here, a frost-like phenomenon appears only on the eroded slopes of the alcoves, with spots resembling moisture appearing along the channels. In addition to the pole direction, and considering an additional constraint on wind direction, these observations are compatible with the interpretative framework of the ACA model (see also Ref. [18]). These gullies only form downwind, likely by condensation or freezing from the air. However, if we consider the ACA interpretation by Nardi and Piersanti [18], ice can form only in the direction of the pole and the water must sublimate as it moves away from its melting point, which seems to be what is observed in Figure 4. We will refer to these dunal gullies, which do not fully comply with ACA morphology, as “quasi-ACA” types.

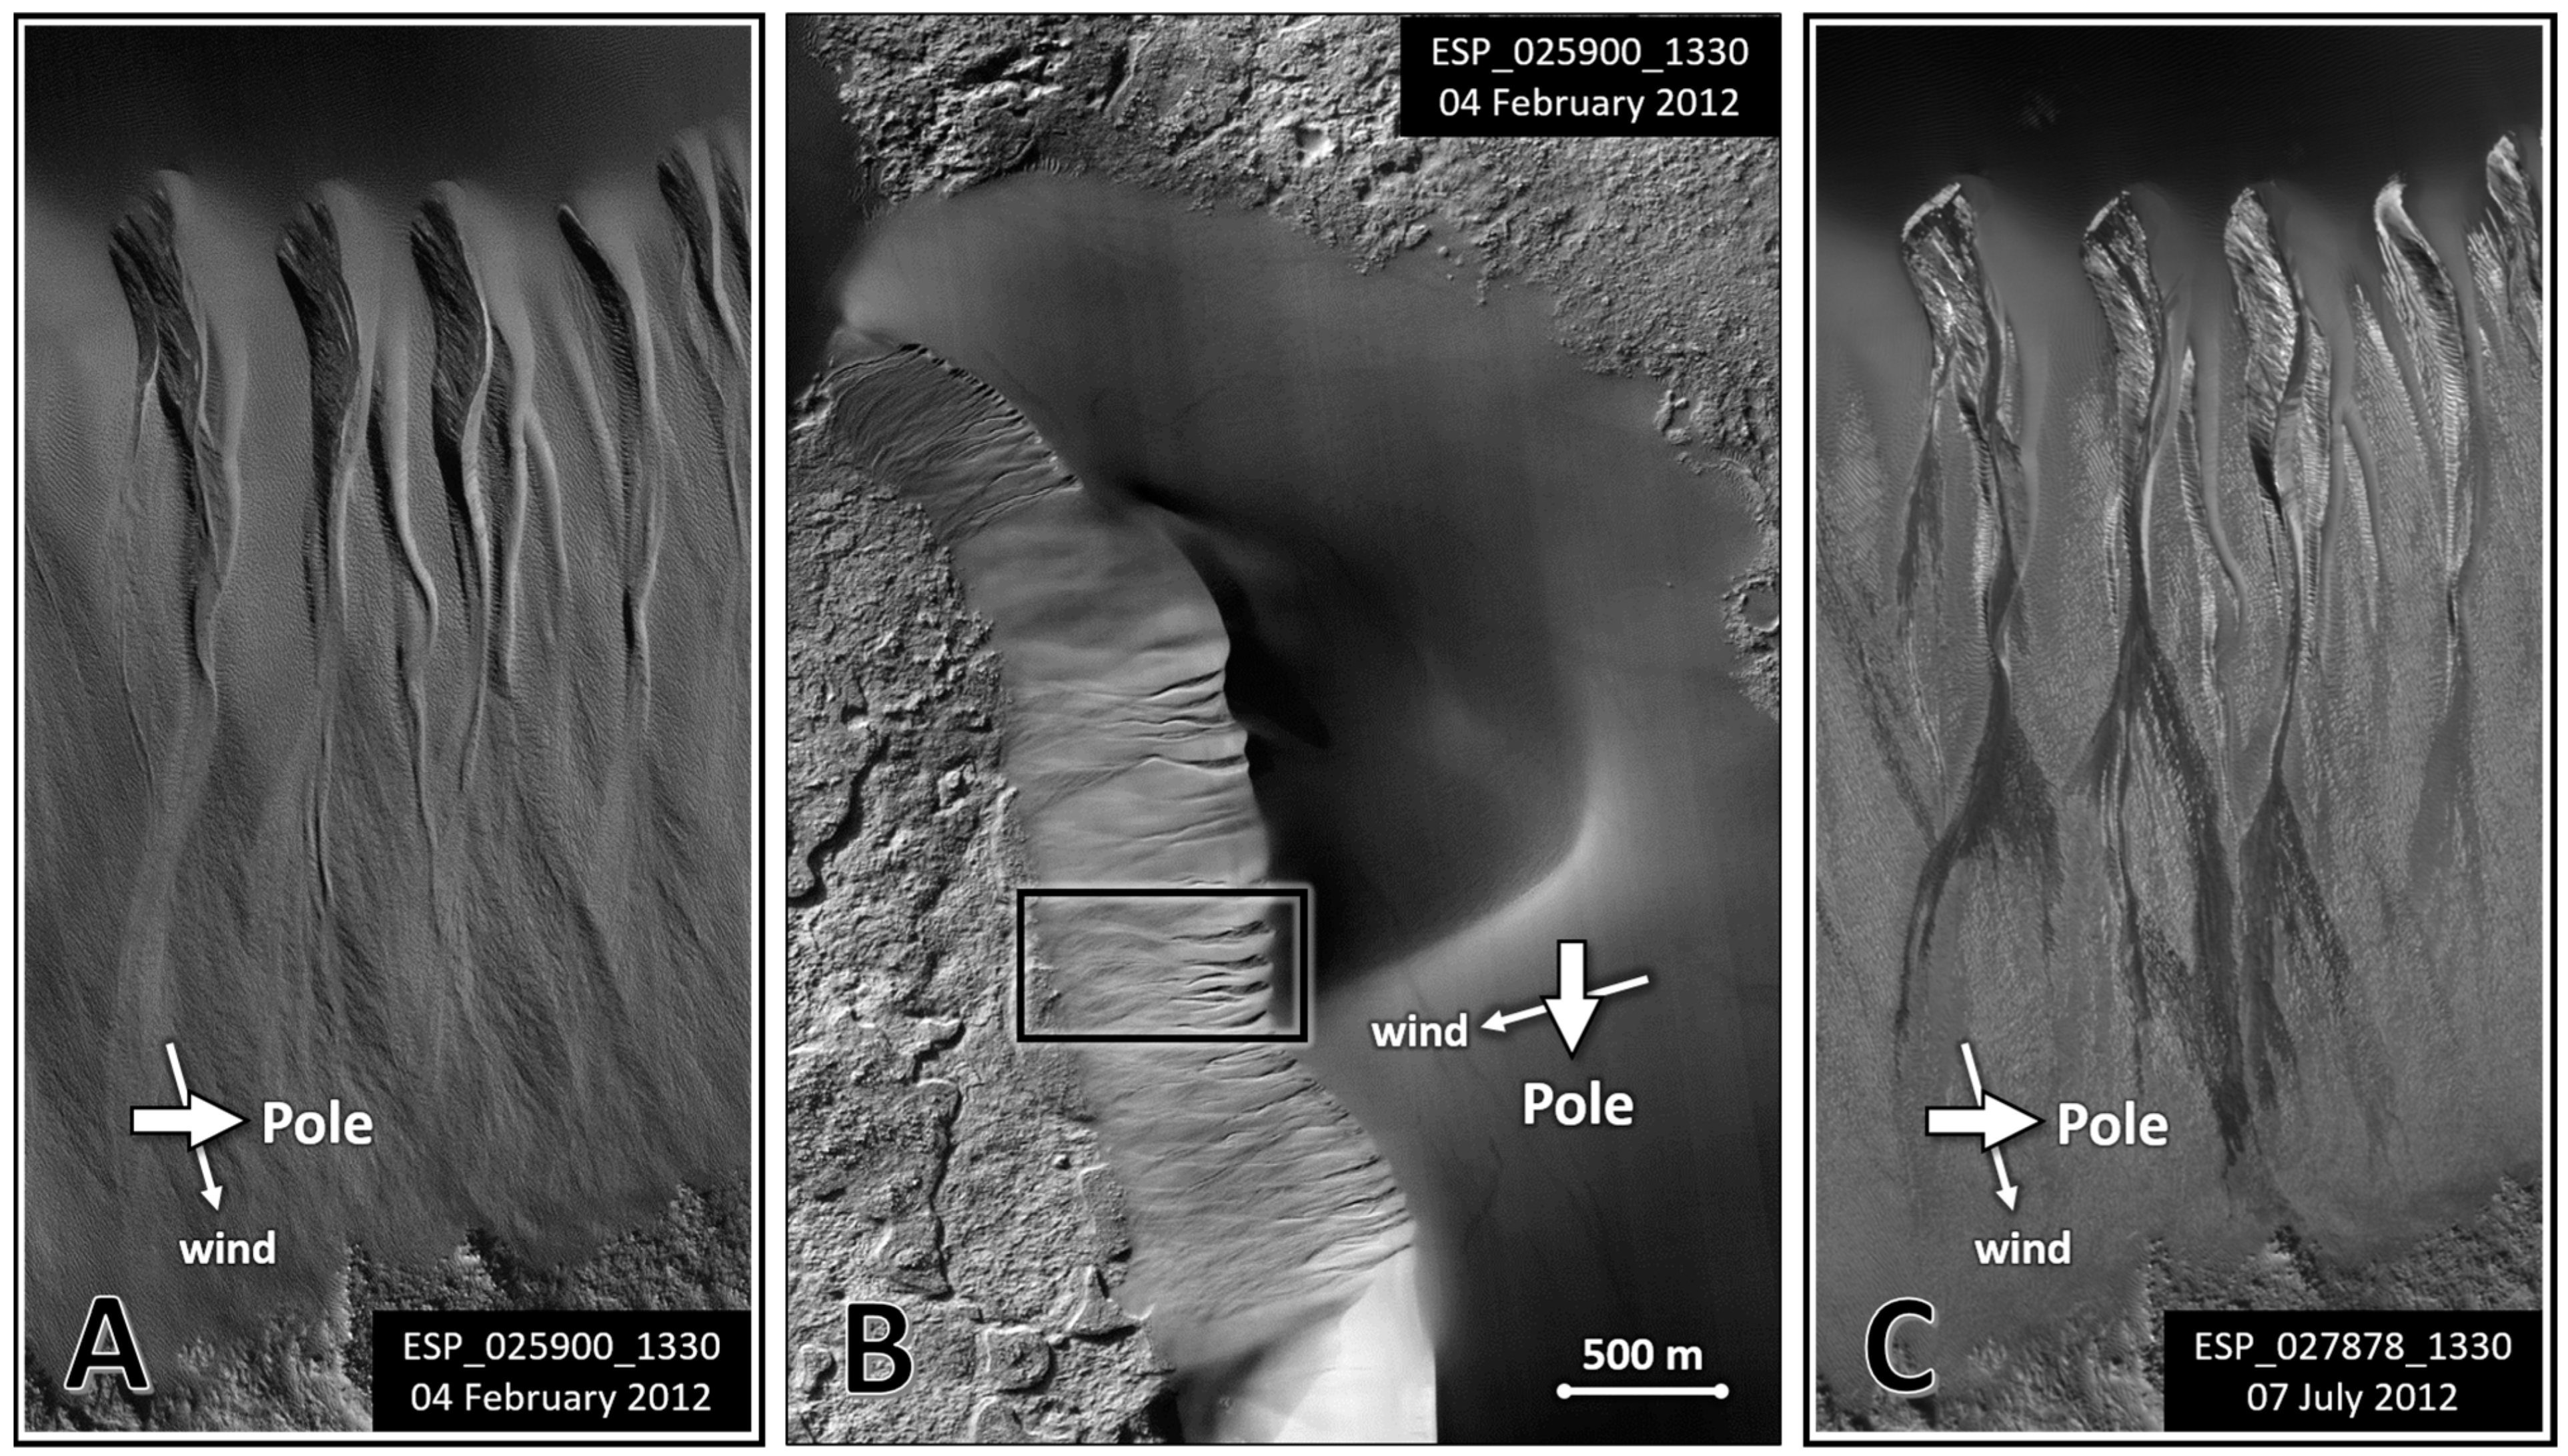
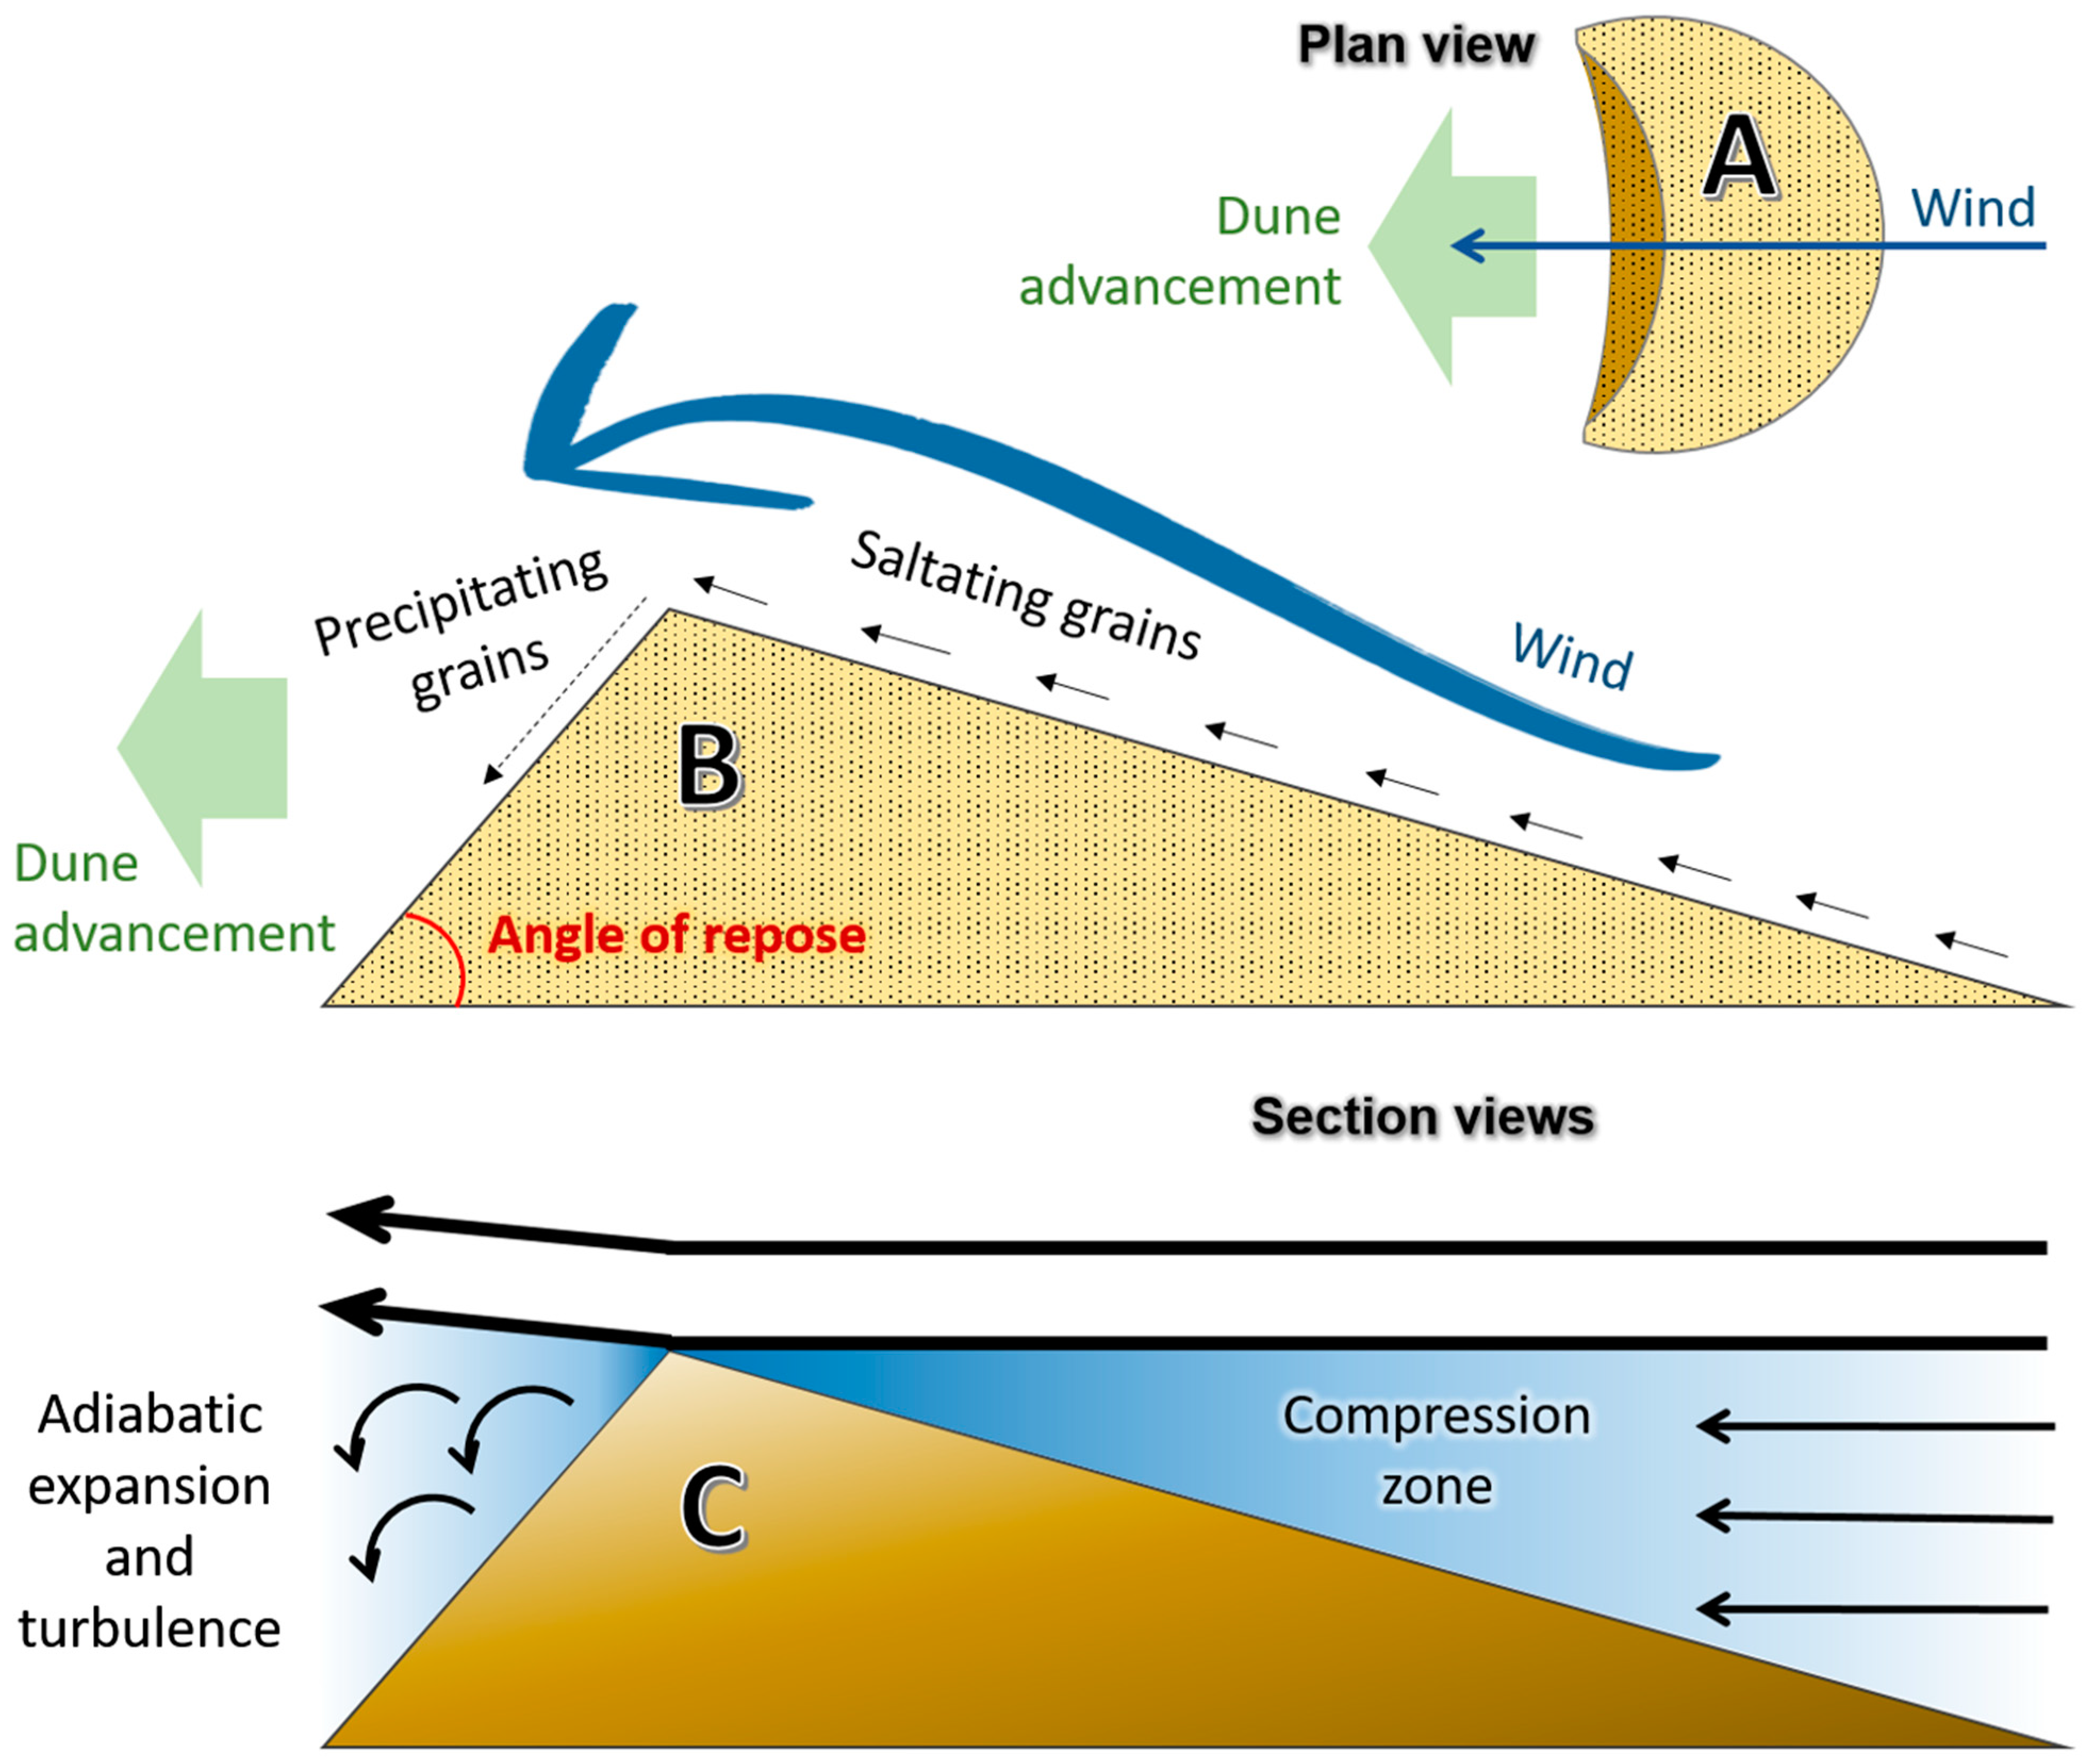
Discussion: Barchan Dune and Aerodynamic Contrails

The plan projection of a barchan dune is characterized by a “half-moon” shape with the convex side exposed to the wind (Figure 5A); this is the result of wind-driven dynamics (Figure 5B). Sand grains on the upwind side ascend the slope along the dune’s displacement direction; the downwind side will be shorter and steeper than the upwind side (Earth: [32]; Mars: [33]; Earth and Mars: [34]). Let us consider the action of the wind on the dune as an already-formed geometric object, independent of the well-known action originating the dune itself. We note that the aerodynamic shape of the dune resembles an airfoil, where the leading edge is opposite to a wing. In contrast to a real wing, there is no laminar flow regime in this case, and the “Venturi paradox” does not occur effectively (Bernoulli’s equation applies only to steady, non-turbulent flow). There could be an increase in pressure followed by expansion. Continuing the comparison with a real wing, a stalled one should be considered, characterized by a loss of lift and the production of undesirable vortices just after the crest. The air flux on the dune undergoes a slow compression moving along the upwind side (Figure 5C); the generated heat is at least partially dissipated due to the relatively slow process. Upon passing the dune crest, the air will be subject to faster expansion with respect to the previous compression phase, and the resulting cooling of the air flux is potentially able to condense atmospheric vapor. In this case, the pressure drop would be accompanied by a drop in temperature, and although the local dew point within the vortices would still be lower than in the surrounding environment, water vapor may still condense if the local temperature falls below the new local dew point. Moreover, here, even a hypothetical laminar flow would break away from the profile, forming vortices below the crest. Similar phenomena in terrestrial environments include the aerodynamic contrails visible under particular conditions on aircraft and racing car wings and wingtips, where atmospheric condensation produces vapor trails that highlight visible unwanted vortices [35]. Some estimations based on reversible adiabatic transformation law
T 2 γ P 2 1 γ = T 1 γ P 1 1 γ ; γ = c p c V
show that—on a typical aircraft wing where the pressure increase is a known parameter, 50 Pa—a decrease in temperature, 14 K, at the cruise altitude can be estimated. An almost instantaneous temperature drop such as this can trigger condensation even on relatively dry air (e.g., Ref. [36]). We do not know the pressure increase associated with the wind flowing on a barchan dune; it is likely smaller than that associated with vehicle wings (the analogy is not straightforward since the involved velocities are much smaller but the dune profile is likely to be steeper than wings). Moreover, the bottom line here is that, on Mars, water can be often (i.e., in a wide range of geographical and environmental conditions) quite near to its triple point; consequently, even a small pressure increase could trigger condensation. This point will be discussed in more detail in Section 4.2. We speculate as to whether a similar effect could be the cause of the frost recently observed on the Tharsis region volcanoes peaks [37] as well as of the orographic cloud that the wind seasonally produces behind the Arsia Mons volcano [38,39].
We hypothesize that, in environmental conditions close to the triple point, unstable water condensation in the turbulent area right under the dune crest can induce ACA-like erosive phenomena on the downwind side, leading to the formation of an alcove. We speculate that the presence of some pre-existing incision on the dune crest could locally trigger and further enhance this phenomenon. The alcoves produced in this way will be right near the crest (actually, a part of the crest itself) and downwind-exposed, as shown in Figure 4. Once past the alcove, unstable liquid water will rapidly vanish, depositing dry debris as in the ACA model, like what Nardi and Piersanti observed [18]. In the Kaiser Crater (Figure 4), in the presence of favorable conditions, an ACA pattern is likely to take place. However, in this case, the erosive agent is drawn directly from the air. Indeed we believe that, in this case, the needed humidity could come directly from standard ACA gullies, actually present in the basin, inside recent impact craters (e.g., ESP_067531_1325 (https://www.uahirise.org/ESP_067531_1325, accessed on 10 January 2025), ESP_073743_1335 (https://www.uahirise.org/ESP_073743_1335, accessed on 10 January 2025)). The Kaiser Crater area has many signs of eroded old craters and alluvial events (e.g., HiRISE image ESP_024410_1325 (https://www.uahirise.org/ESP_024410_1325, accessed on 10 January 2025)), indicating the possibility that this basin could actually be an ancient lake. As a consequence, we may also consider the possibility of permafrost sublimation and microenvironmental features within the Kaiser Basin. The fusion of hypogean permafrost on crater sides likely transfers water vapor to the atmosphere. This vapor may condense or frost on the dunes inside the crater again, producing ACA-like structures. This would be a phenomenon where the source is not endogenous, yet the erosion, transport, and sedimentation processes are similar to those expected by Nardi and Piersanti [18] for the ACA morphologies of endogenous origin.

4. Observations and Discussion: Ice on Dunes

There is another type of gully that appears on dunes with non-polar exposure, showing a morphology distinct from the ACA type. This is also called a “linear gully”. Although rare in absolute terms, at sites where it is present, this type is quite widespread. A significant example can be found on the mega dunes (54.2° S; 12.9° E) bordering the Russell Crater dune field to the NE (Figure 3C). The Russell Crater has a diameter of 135 km. According to Ref. [20], many of these dunes have elevations exceeding 500 m, with the largest dune spanning a length of 2.5 km and featuring approximately 300 gullies. These channels typically measure less than 20 m in width and range from 1 to 2 km in length [19].
We verified the altimetry of the Russell Crater. In Figure 6A, the crater is reproduced with a color scale modified from Figure 3. An interval of about 200 m around zero elevation is colored white. The palette then proceeds with shades of brown for positive elevations and green for negative elevations. Looking at the downwind (NE) side of the dune, it is evident that it rests at zero elevation. It is important to remember that elevation 0 on Mars is, by definition, the elevation characterized by an average atmospheric pressure corresponding to the triple point of water. From the same DEM, we also derived a contour map with an extrapolated resolution of 100 m. Again, in Figure 6, area B was processed with contour lines superimposed to the same color scale, with the addition of slight shading to enhance the polarity of the relief. We can observe that the dune reaches a maximum height of 500 m above the zero elevation. In the Russell dune, just like the Kaiser, the entire downwind slope is affected by gullies. The red circle highlights the area analyzed in the following lines.
Russell dune gullies do not show the typical decreasing depth of erosion down their slope (typical of ACA channels) and never exhibit an apron at the bottom, as shown in Figure 7. They also often do not show deep erosion in the alcove. These are no longer ACA-type gullies. On the other side, we must note the consistency of some new morphological characteristics also observable on other dunes. We will refer to these dunal gullies as non-ACA types.
Characterization of Russell gullies:
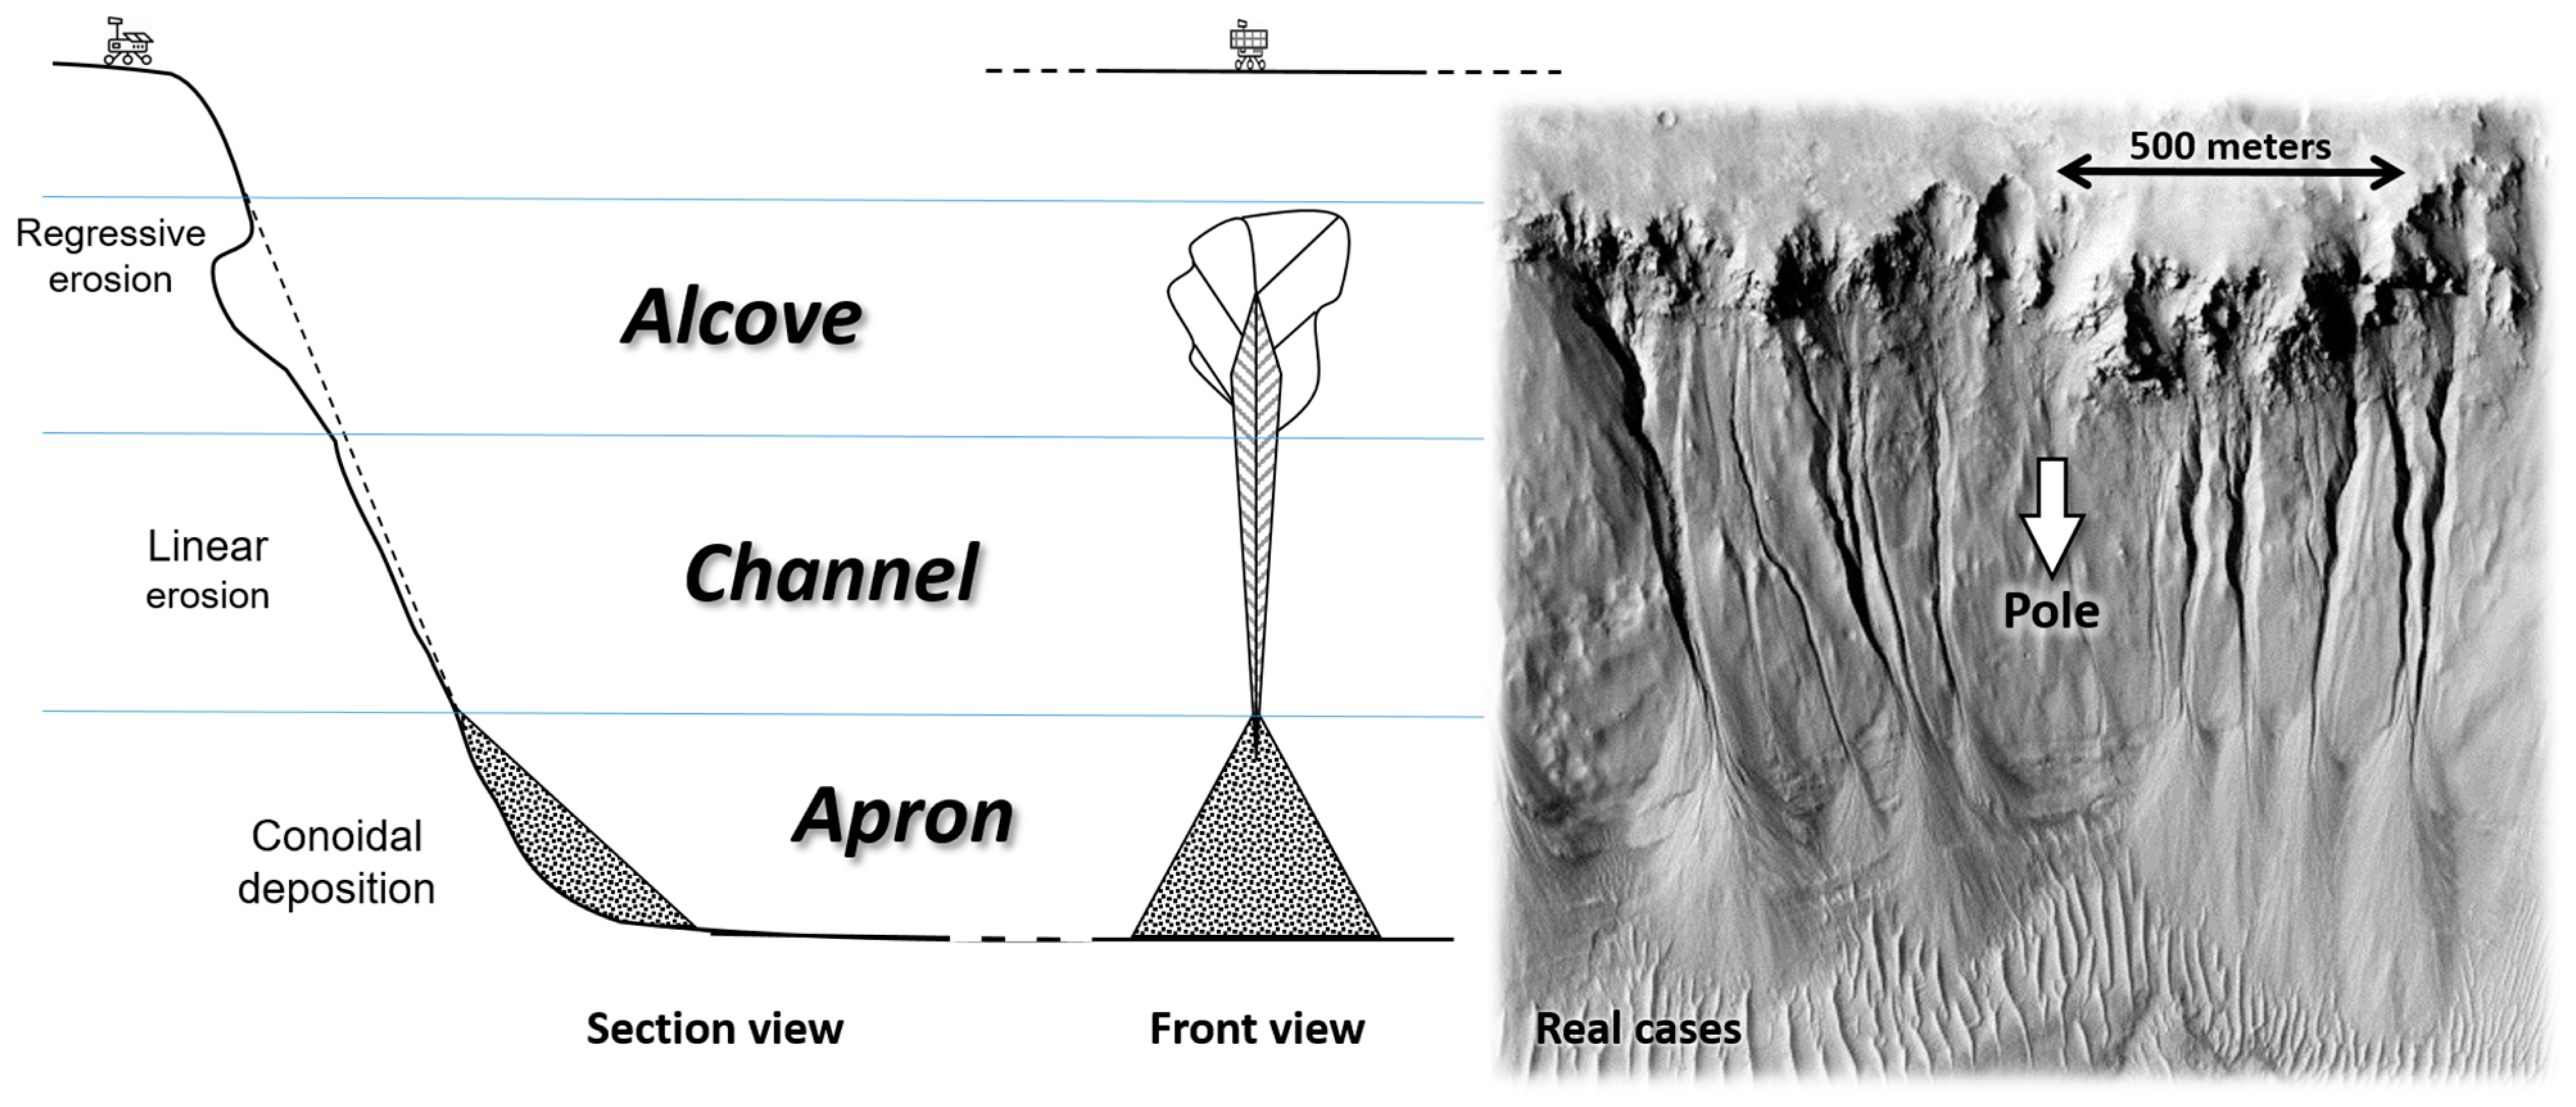
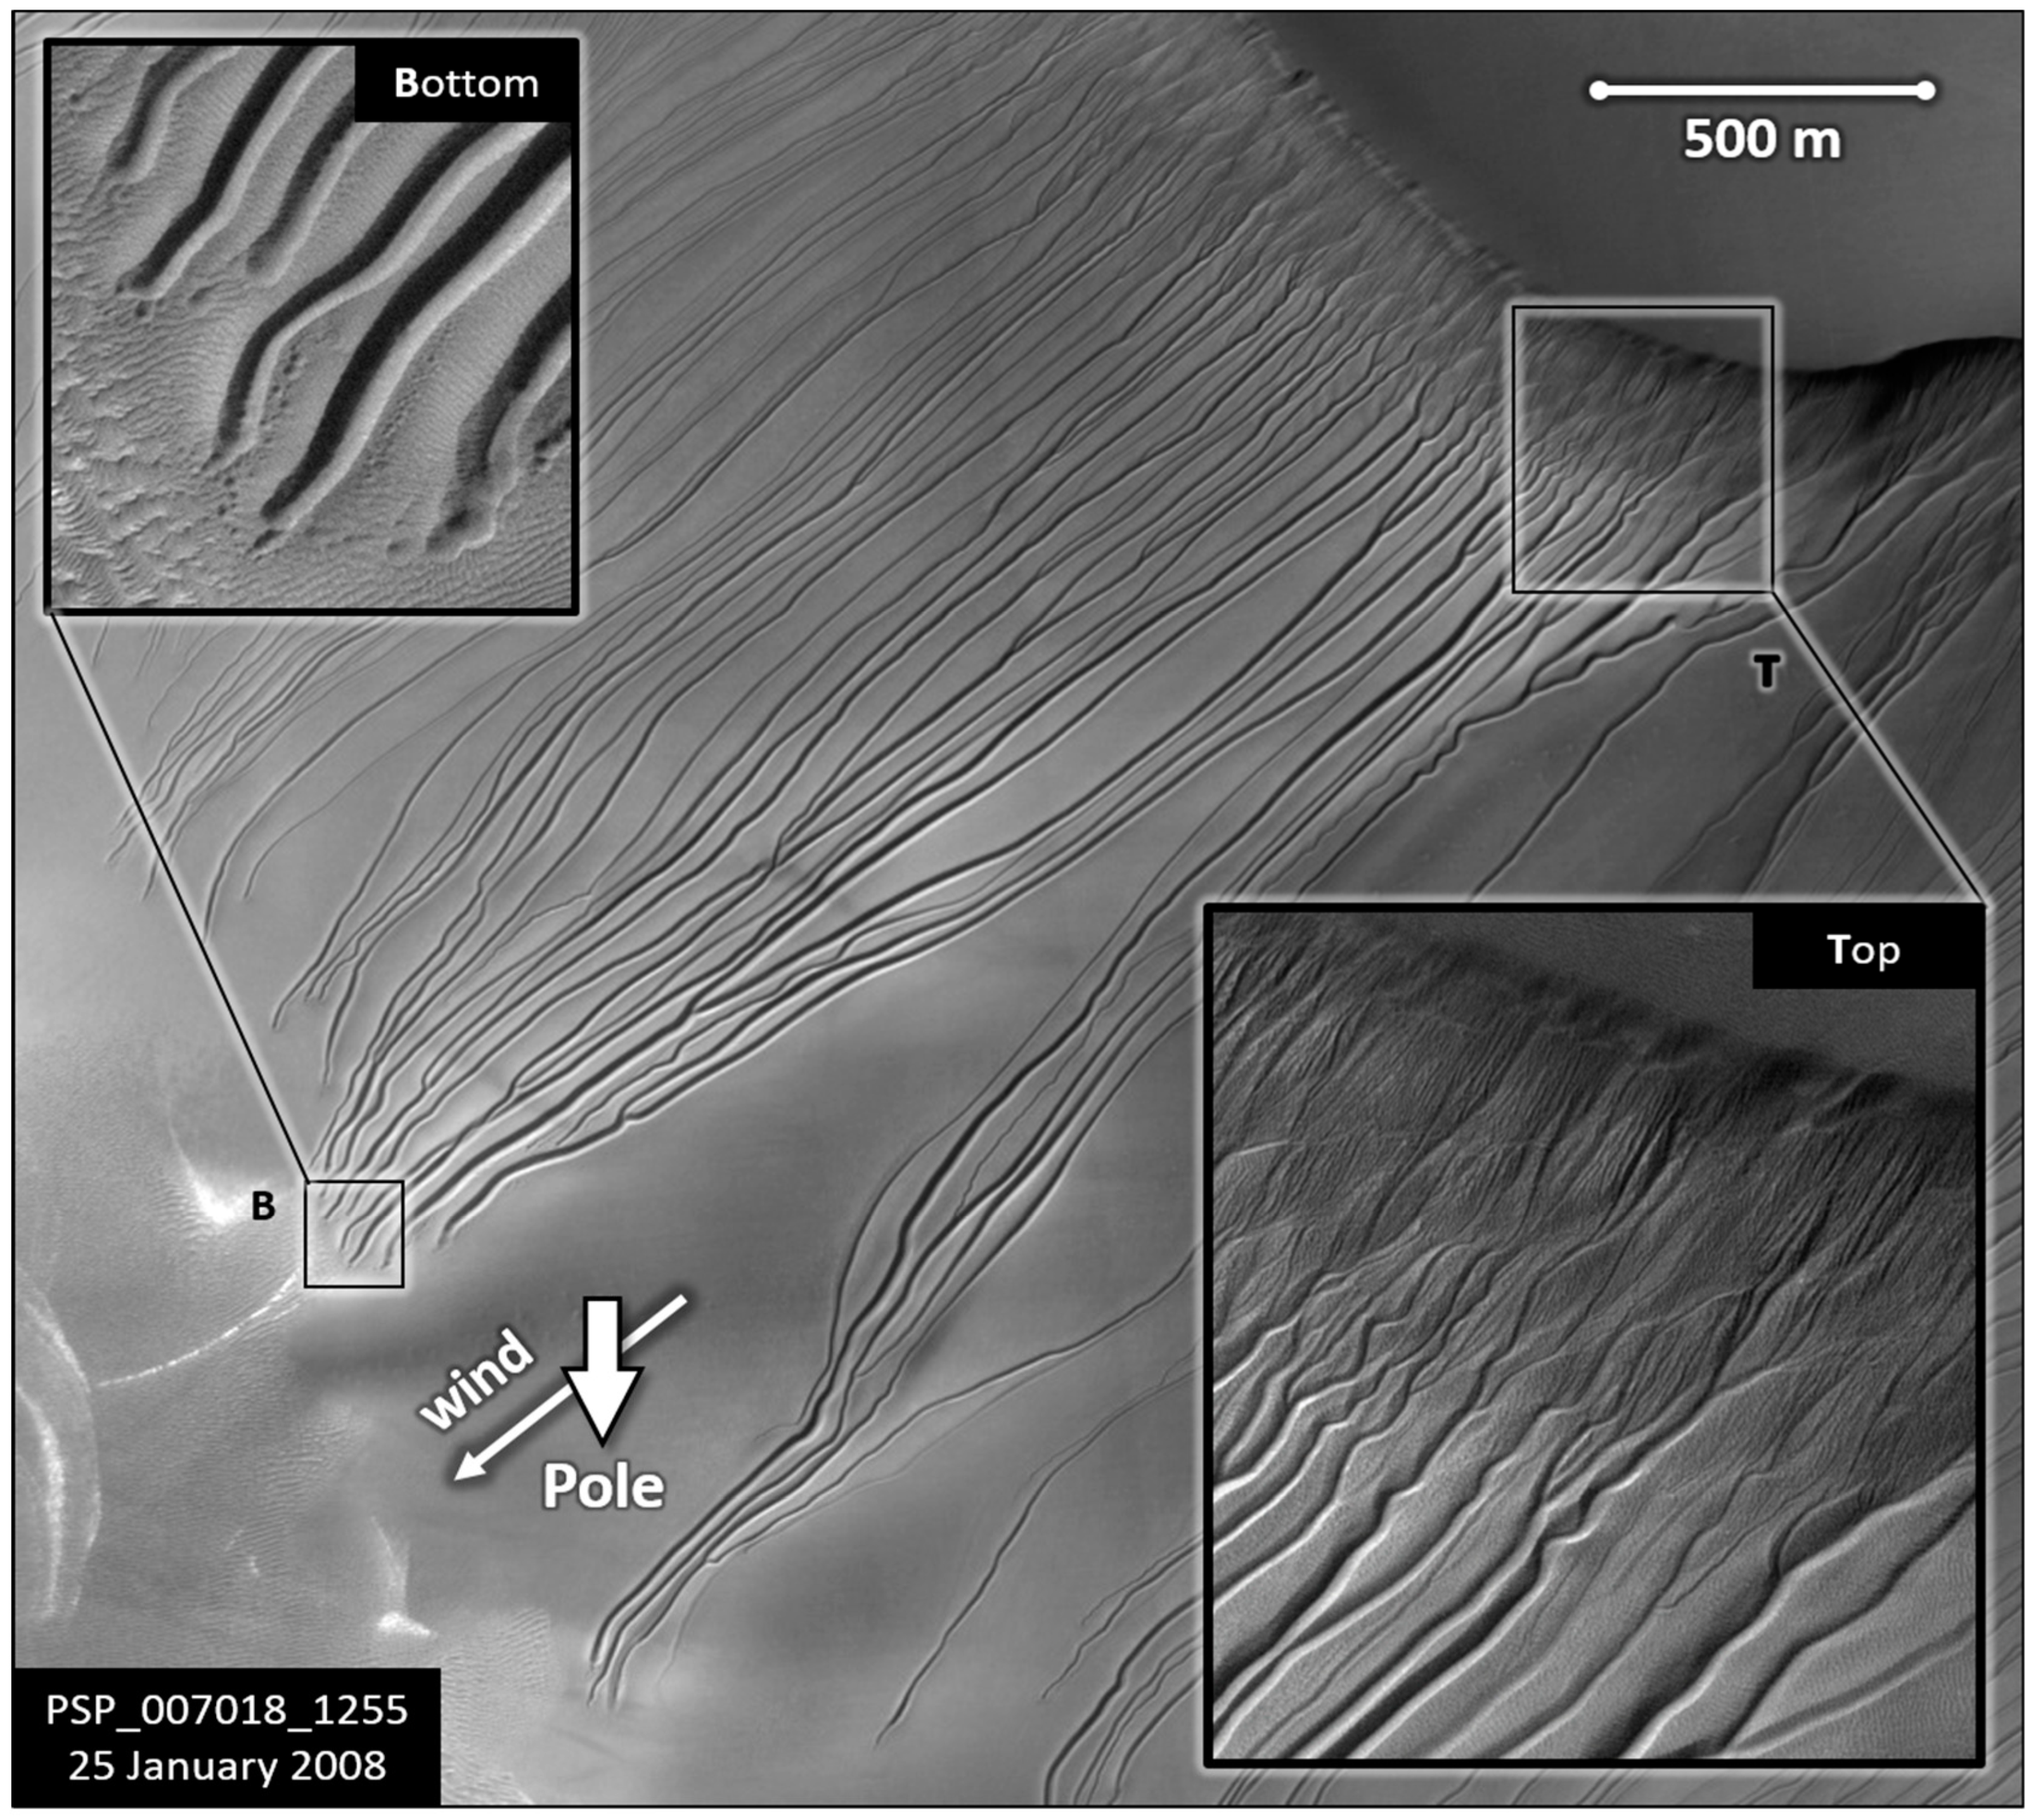
  • The downwind initial part of the slope exhibits a steep slope (Figure 7) that is best seen on stereoscopic pairs. This feature is not typical of a dune, suggesting two possible implications: strong erosion immediately below the ridge and the possibility that the sand, at least in this area, is moist enough to support a slope greater than the downwind dune slope. This area has a series of small alcoves from which the channels originate.
  • The channels find their origin immediately below the ridge, just within the high-slope area described in (1). We can see a dense, narrow torrential network similar to an inverted delta converging in the last collector, right at the end of the high gradient area (box “Top” in Figure 7).
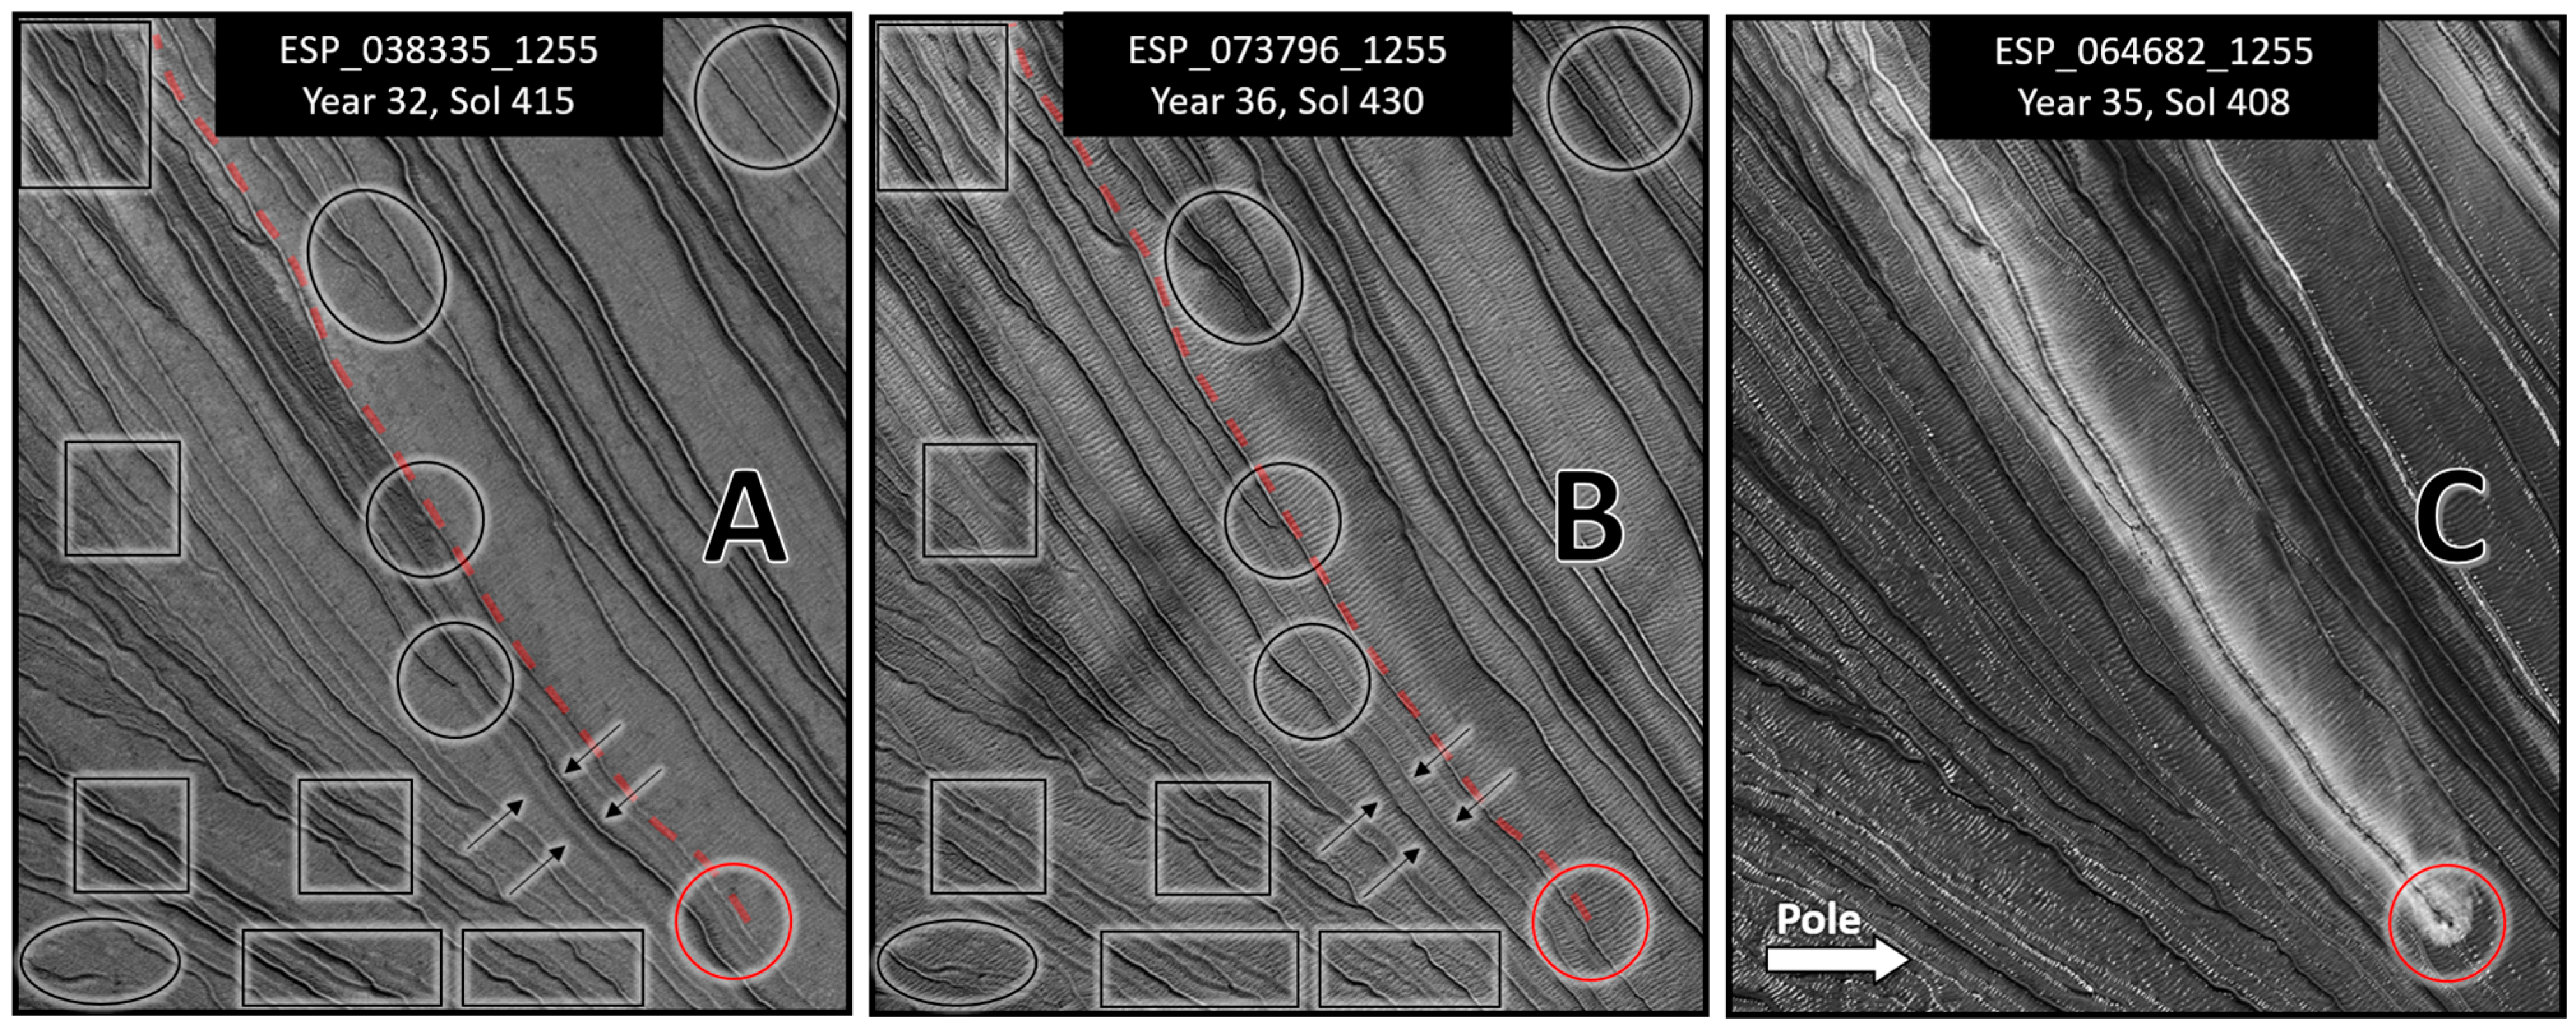
  • The collector is the summit part of the channel. It is an incision that follows the line of maximum slope, without degradation, as in the ACA model. The downwind slope of the dune thus appears as a field of parallel (occasionally sinuous or converging) tracks. Sometimes a channel may deviate to another parallel trajectory, even bypassing an intermediate channel. Examples of this can be seen in Figure 7.
  • The terminal part of the channels never crosses the plain. The most extended channels terminate right at the end of the downwind slope (“bottom” panel of Figure 7). Channels reaching this extreme limit typically show a “U” profile and a semicircular termination often characterized by a raised edge (various examples in Figure 8). We will call this termination “spoon-shaped”. The few channels that end prematurely, around the middle of the slope, typically end with degrading incision or with deltaic branching. These are the ones often displaying dark halos that we will later call “humidity”.
  • There is never an apron or any trace of deposition of the eroded material.
  • Stereoscopic pairs show more clearly that the section of the gullies is typically “V”-shaped in the upper part (streams and collectors) while it is typically “U”-shaped in the lower part of the channels, ending right at the bottom. The central body of the gully incision passes from one section to the other, often with the presence of superimposed and degrading “V” incisions within the “U” valley. From stereoscopy, it is also clear that channels often have raised edges, forming flat-bottomed or even convex valleys in the spaces between one channel and another. The “relief” of these edges gradually increases toward the bottom [40].
In the megadune of the Russell Crater, the upwind slope occasionally features transverse crests (Figure 9 Left), where gullies can be observed immediately below these crests, characterized by a smaller extent and simpler morphology than the main leeward type. ACA-type gullies feature a main characteristic (apparently paradoxical), that is, the channels do not feed into a fluid basin but disappear almost at the apex of the apron. Russell gullies have the additional challenge of not showing any detrital deposits, suggesting that they may not produce significant erosion. The parallel incision pattern is typical of a steep slope, which is precisely the downwind slope of the dune, where the totality of these gullies appears. However, the summit pattern (point 2 and Figure 7 ‘T’ box) does not match the characteristics of a steeper slope. This suggests the slow melting of a layer of ice or snow. Indeed, the persistence of such a steep sand slope (1) suggests that the sand, at least in this top area, remains permanently soaked or frozen within its internal interstices. The lack of a distinct deposit body of the eroded material suggests that the sand remains dry below the top band and it is normally distributed on the slope by the constant action of the wind. This implies that the erosive traces are currently active, as we have observed by comparing stereoscopic pairs and confirmed in Refs. [23,41]. After all, anomalous features on a dune cannot remain inactive for long on any of its sides. For these reasons, the first half of the Russell gullies, approximately from the crest to halfway down the slope, is likely to be produced by the action of some fluid. If we assume liquid water, like in ACA gullies, the fluid can flow for part of the slope as long as its transient stability allows it. This liquid, like in Kaiser gullies, could be produced by ice or frost that accumulates under the crest by aerodynamic effects. In fact, the few gullies that do not reach the sloping end only present the V-section; they can end with a decreasing depth of incision or with ramifications that often present “halos of humidity” (we will discuss this later). The problem with the interpretative model of Russell gullies is in the logical connection between the upstream and downstream parts. The terminal part (point 4 and Figure 7 “B” box) of the longest channels always presents a U-section. Somehow, halfway, there is a transition from one to the other. Sometimes the V-erosion can be clearly observed fading into the bed of the U-section. The U-section also has more pronounced raised edges than the V-sections (see also the measurements of Jouannic et al. [40]. Finally, the U-section presents a counter-slope termination (points 4 and 5), as if the trace had been created not by an erosive agent but by the passage of a solid object. In essence, it seems to be a simple lateral displacement of the sand (hence, the raised edges). This hypothesis has already been presented in different ways in other works; however, the origin of the object is not yet clear (see Refs. [23,42,43]). The relationship between the two sections (U and V) and the two parts (upper and lower) of each gully is not clear either. Based on the erosive action, we observe that a liquid affects the upper part, while a solid influences the lower part. It is also known [43] that, occasionally, bodies with very high albedo properties are present in the “spoons” similar to blocks of ice. Figure 8 was taken on sol 410 of the year 33, that is, in early spring. The second bottom frame shows one of the channels observed without ice in Figure 7, “Bottom”, which was taken on Sol 47 of the year 29, that is, in early autumn. Let us now examine the complete seasonal phenomenology in order to try and give an interpretation in favor of some kind of ice type and enlighten the possible dynamics of Russell gullies.
By analyzing HiRISE images acquired between 16 November 2006 and 23 October 2022, we monitored a section of the megadune over a period of 8.5 Martian years (16 Earth years), spanning from 28.4 to 36.6. We selected 110 useful images (Appendix A) allowing us to classify 7 types of transient events, which we will define indicatively under the following names:
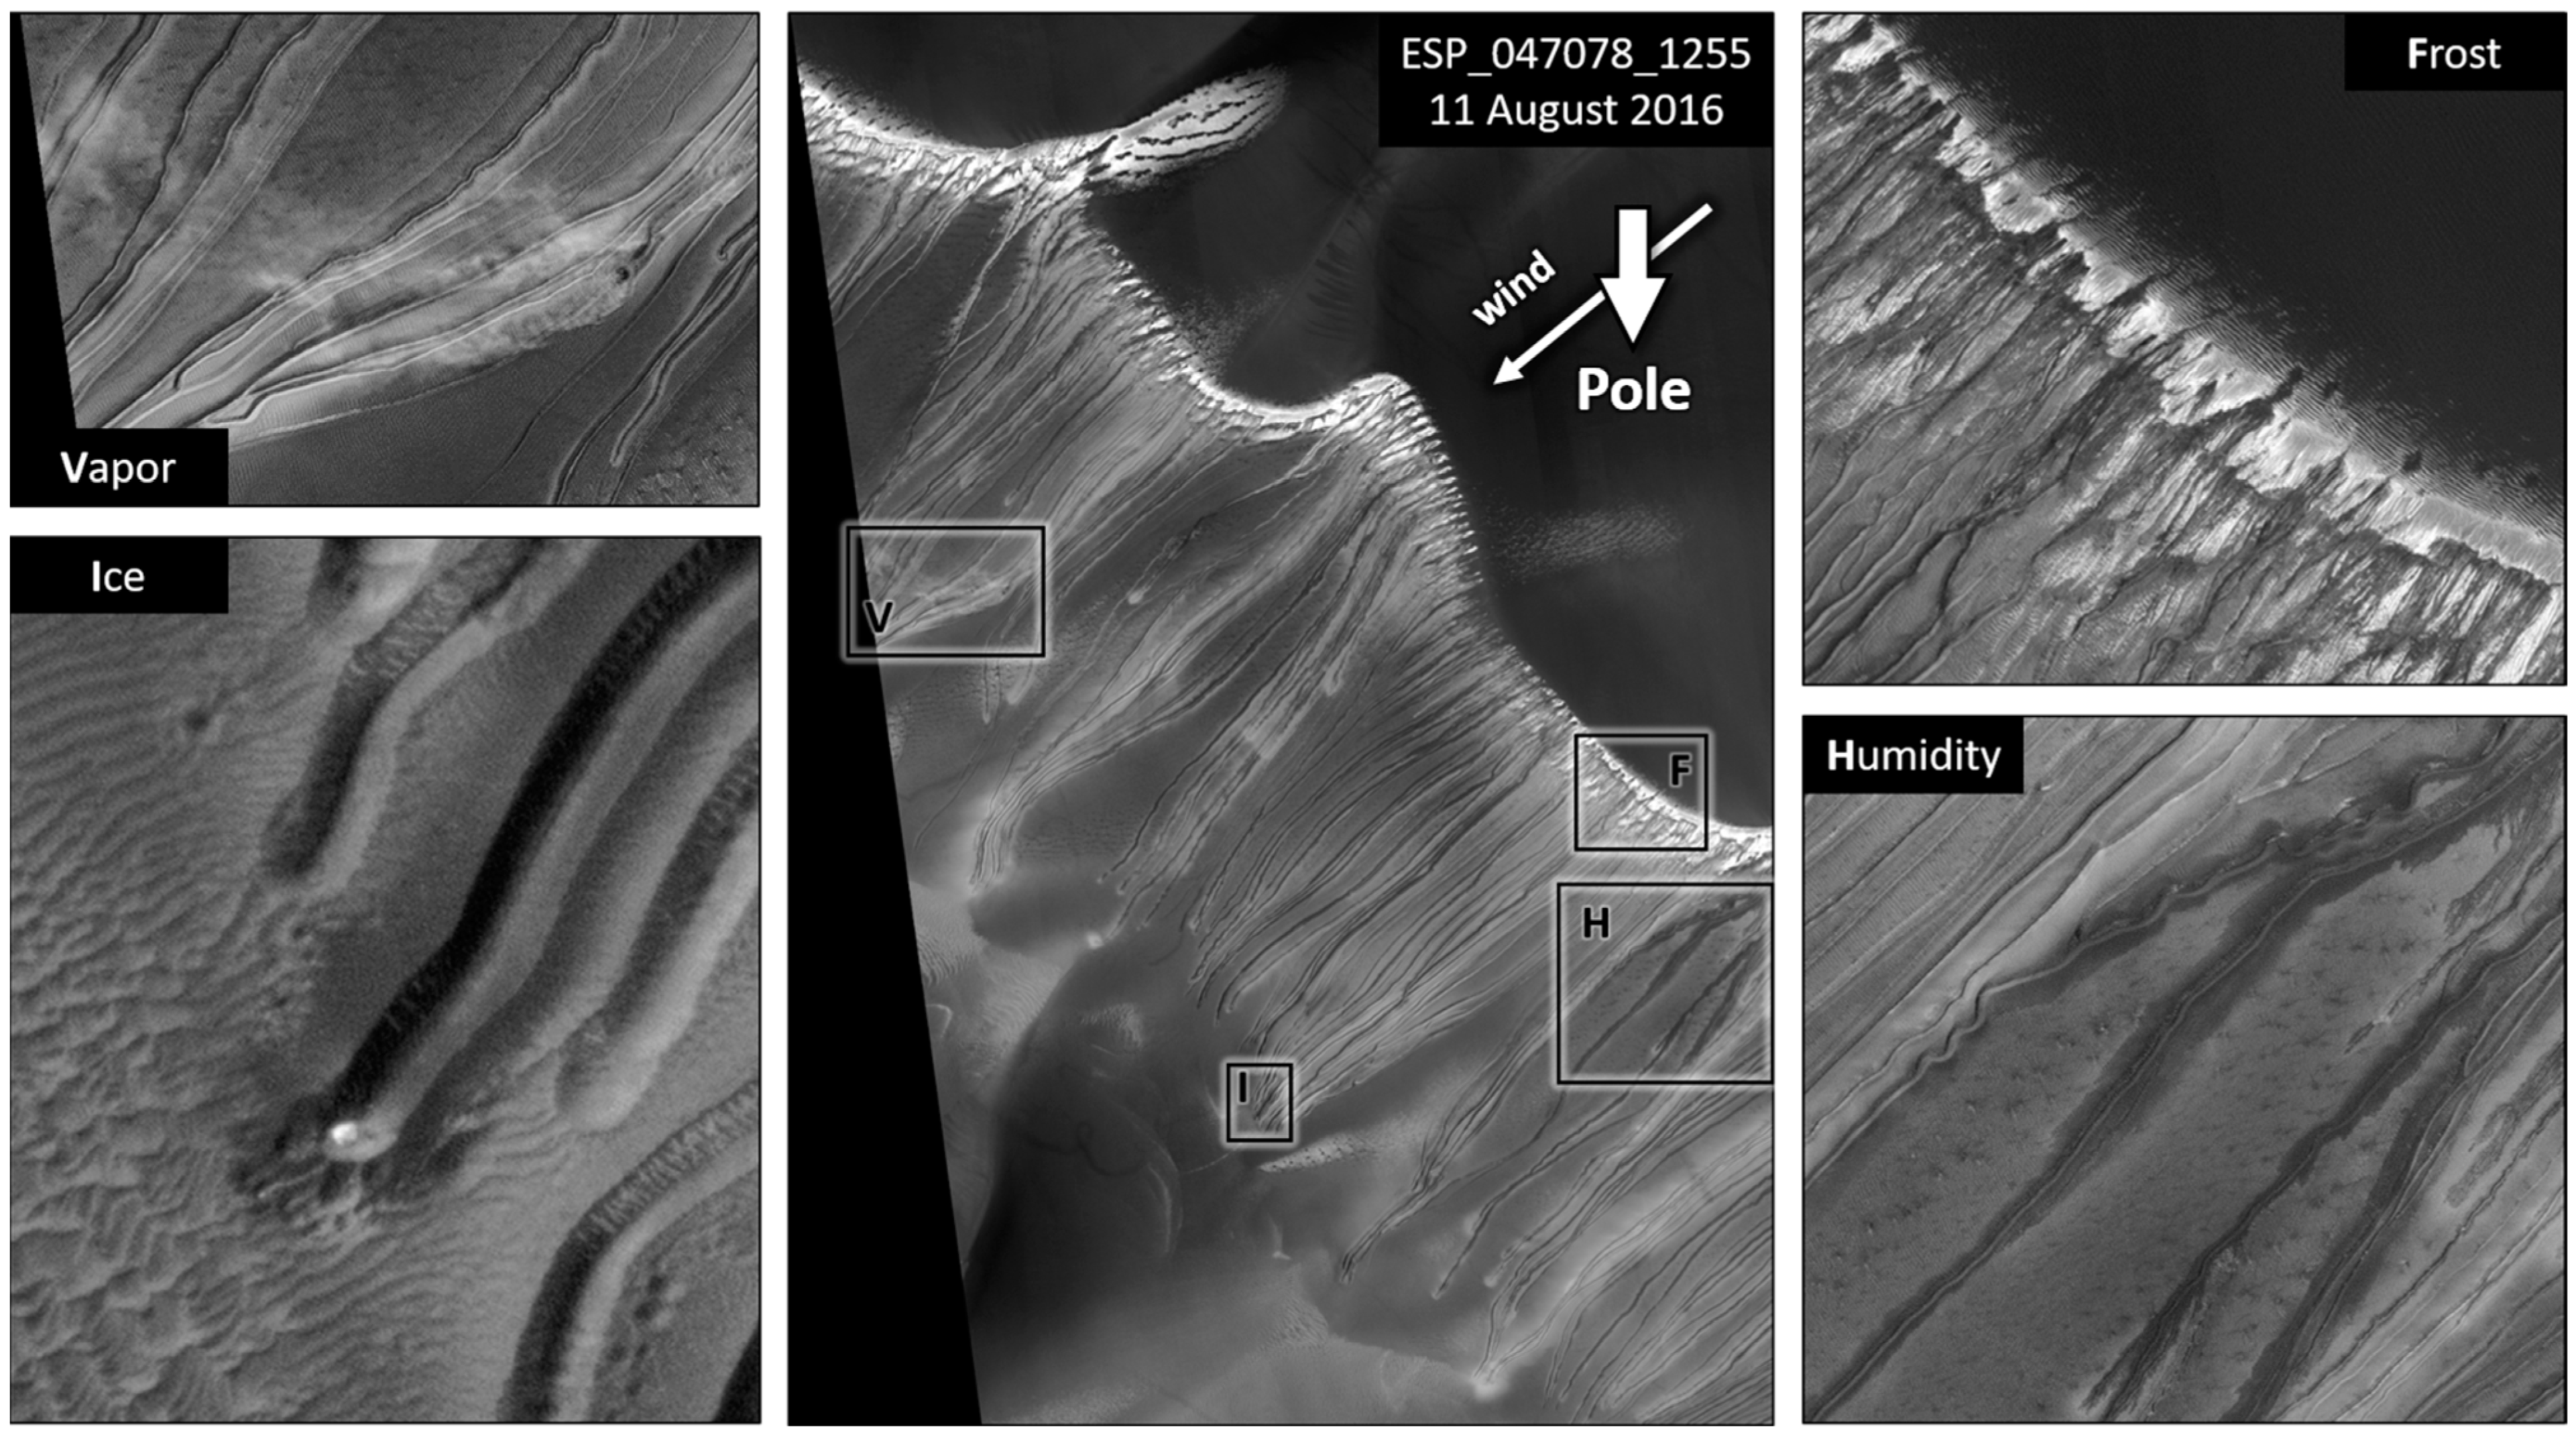
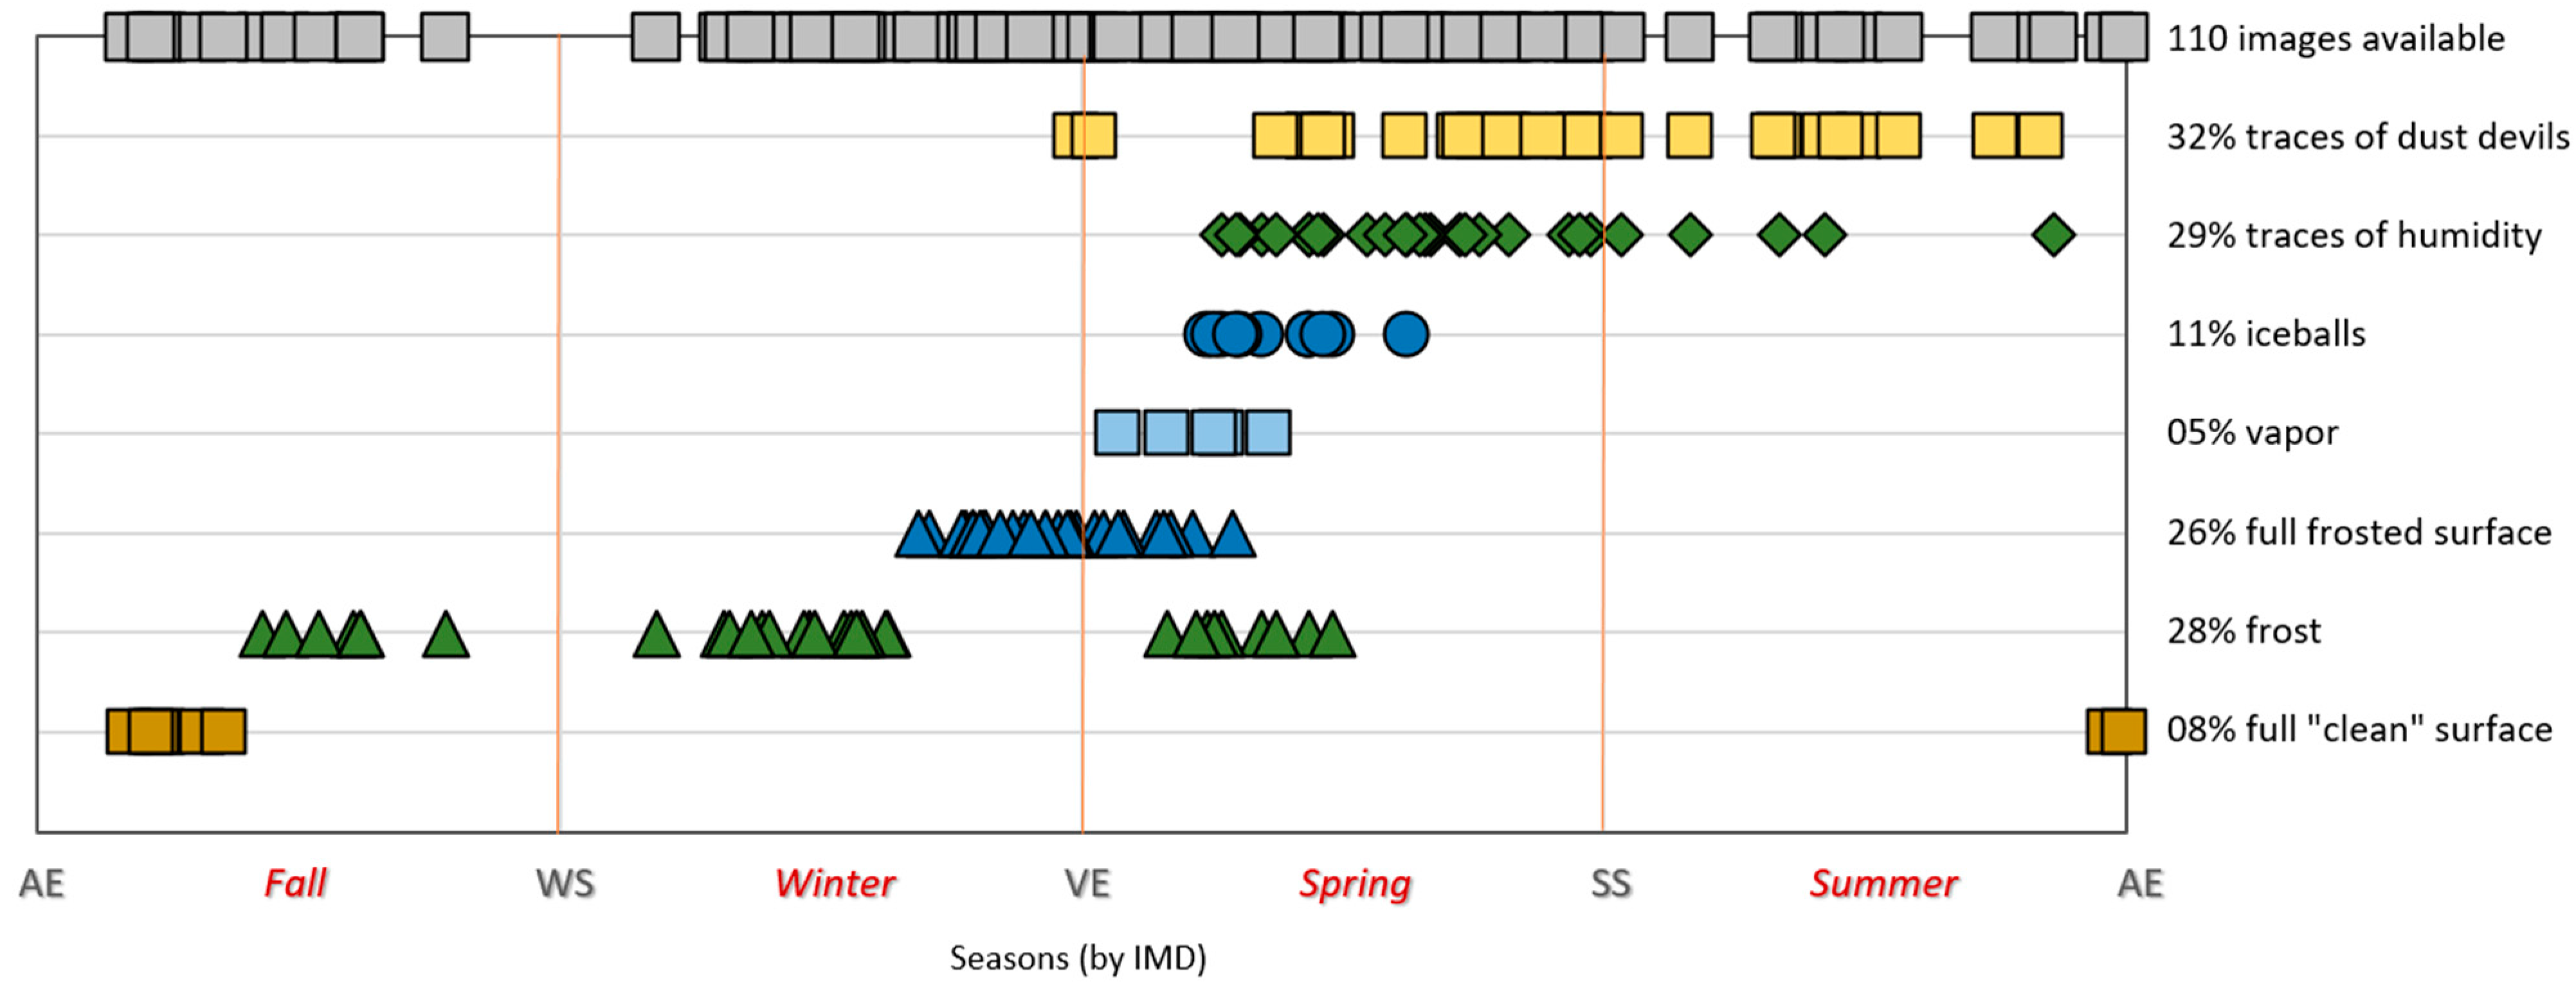
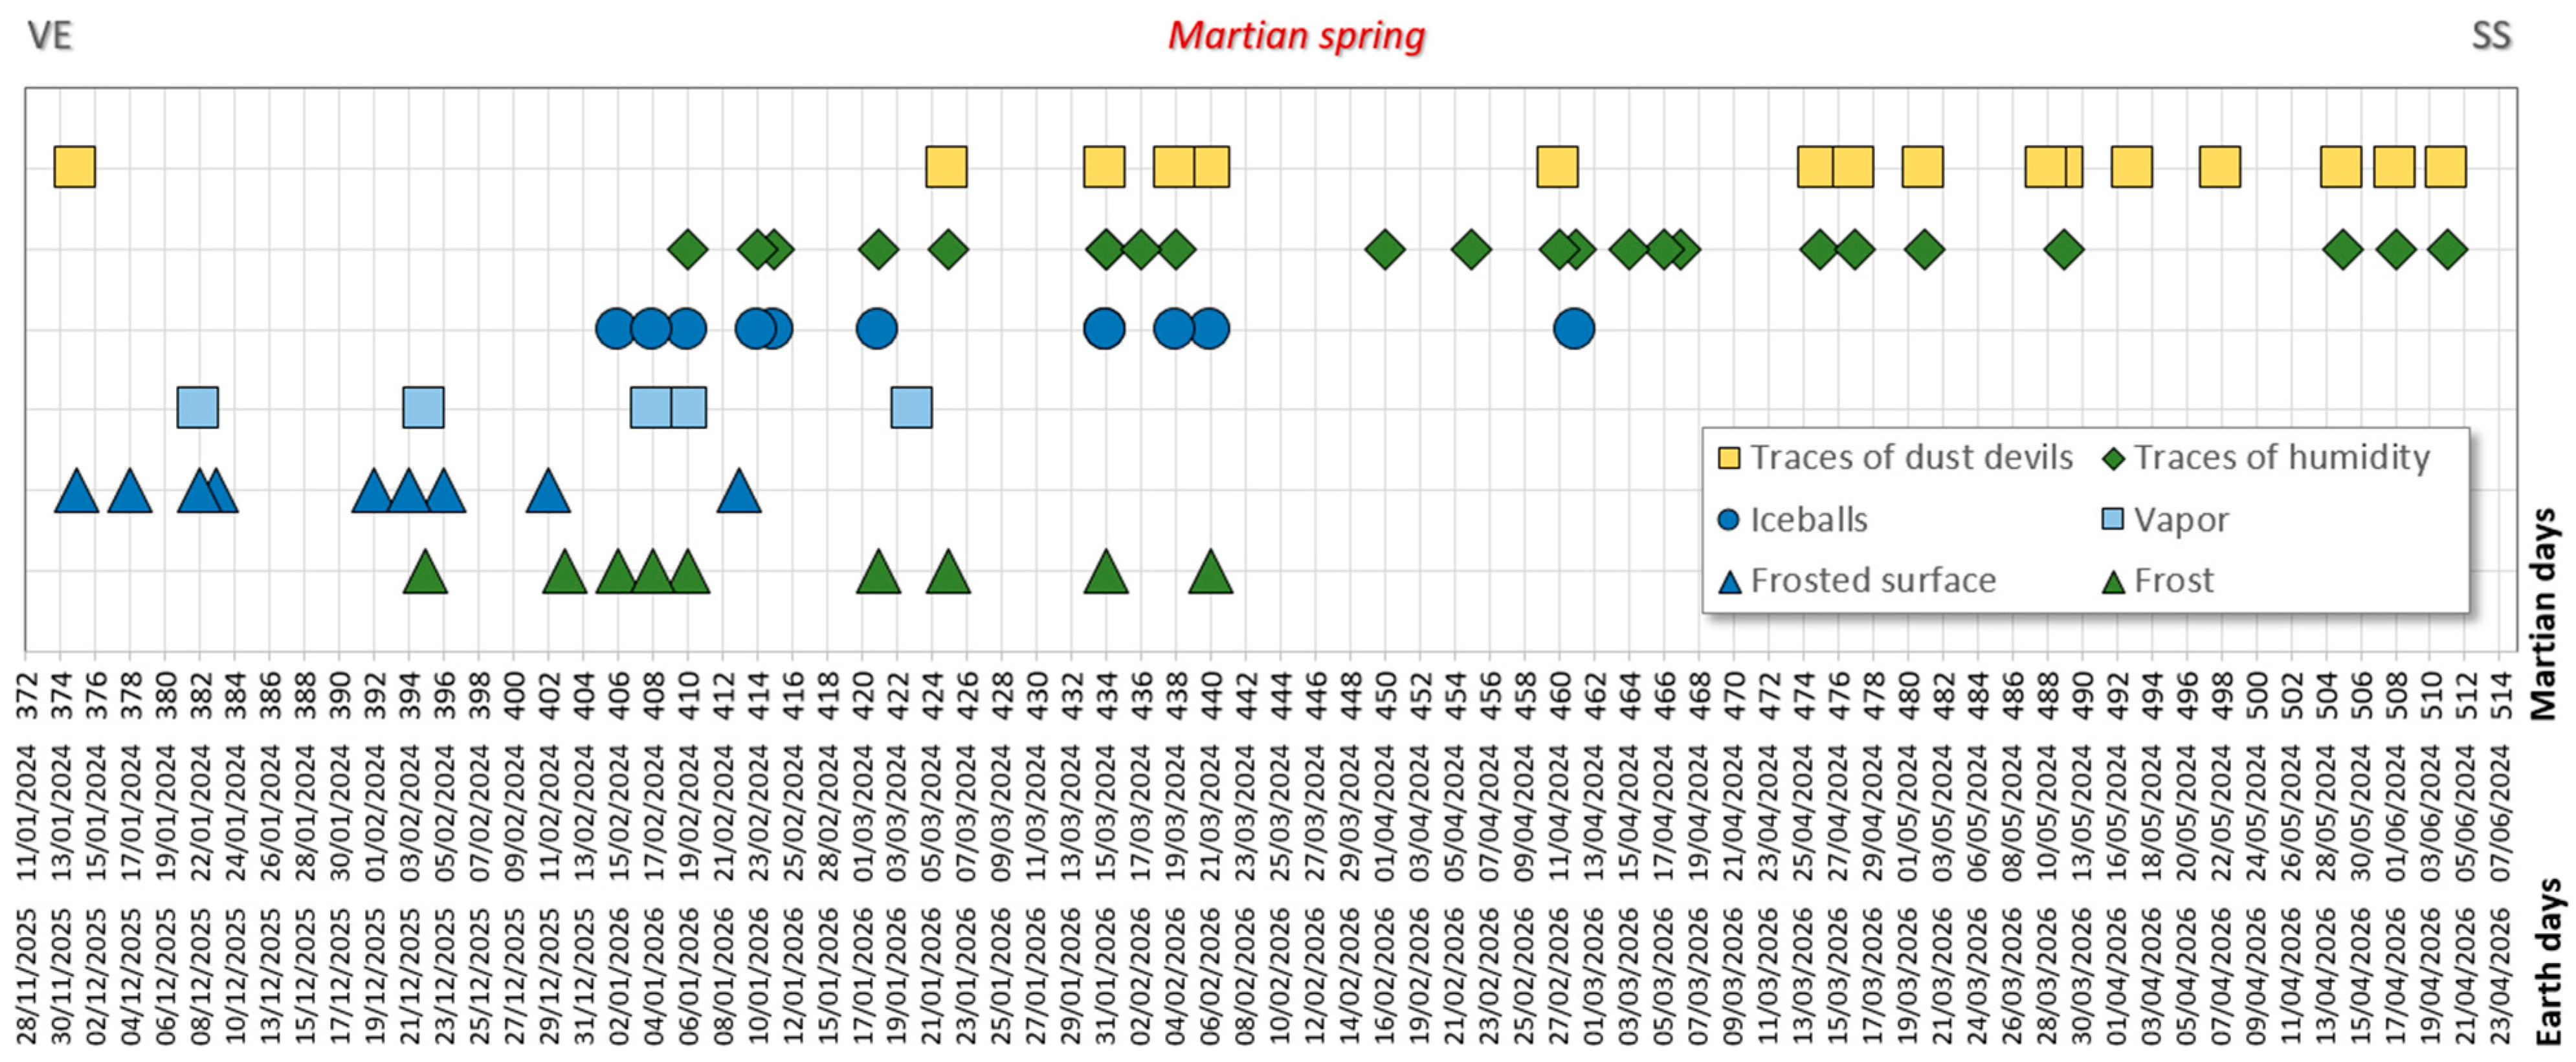
  • Traces of dust devils. The appearance of these dark curves is the key indicator of recent wind activity. These traces are observed throughout the spring and summer (initially on the upwind slope but also—in the summer—on the entire dune surface (Figure 9, “Traces of dust devils”).
  • Traces of humidity. These are dark halos (see Section 4 of characterization) surrounding the channels and seem to indicate moisture in the sand. We hypothesize that they are due to fluid absorption in the sand. This occurs between spring and summer but more frequently in the last three-quarters of the spring. They persist particularly on the poleward slopes of the longitudinal undulations of the dune front (Figure 10, box “Humidity”).
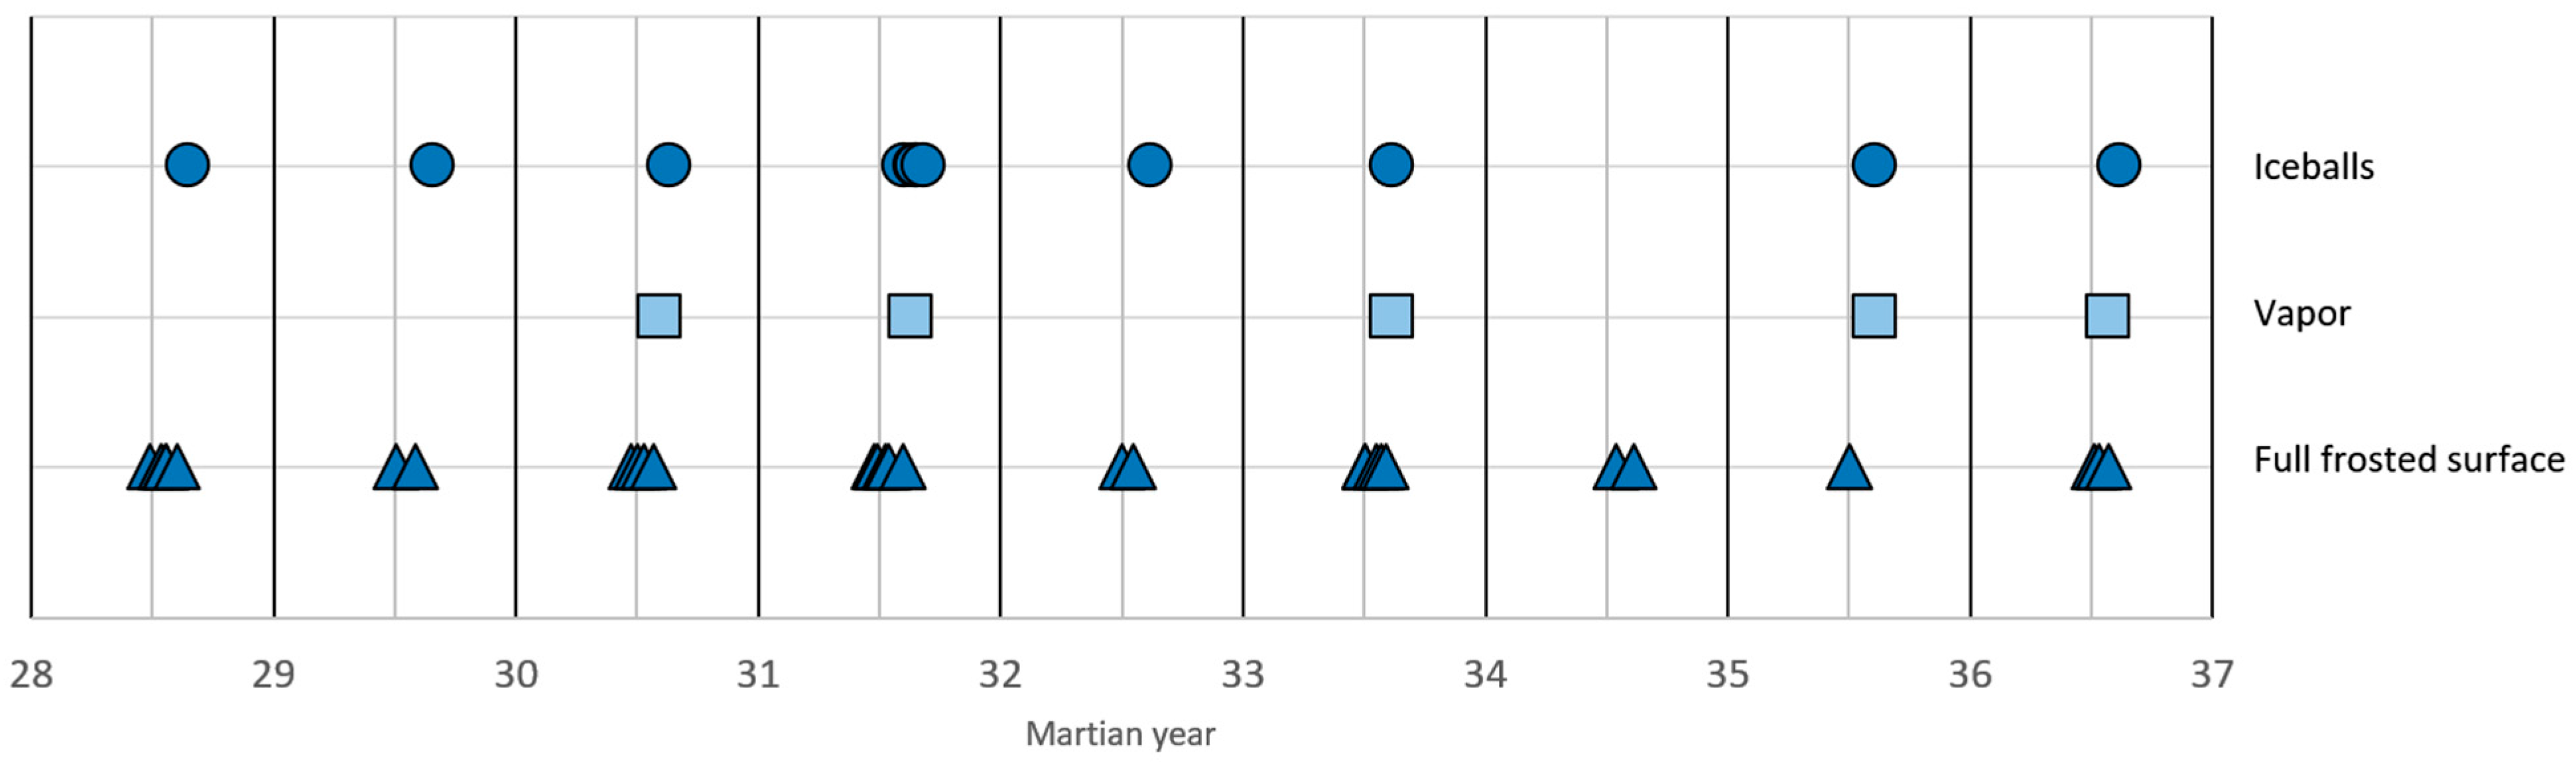
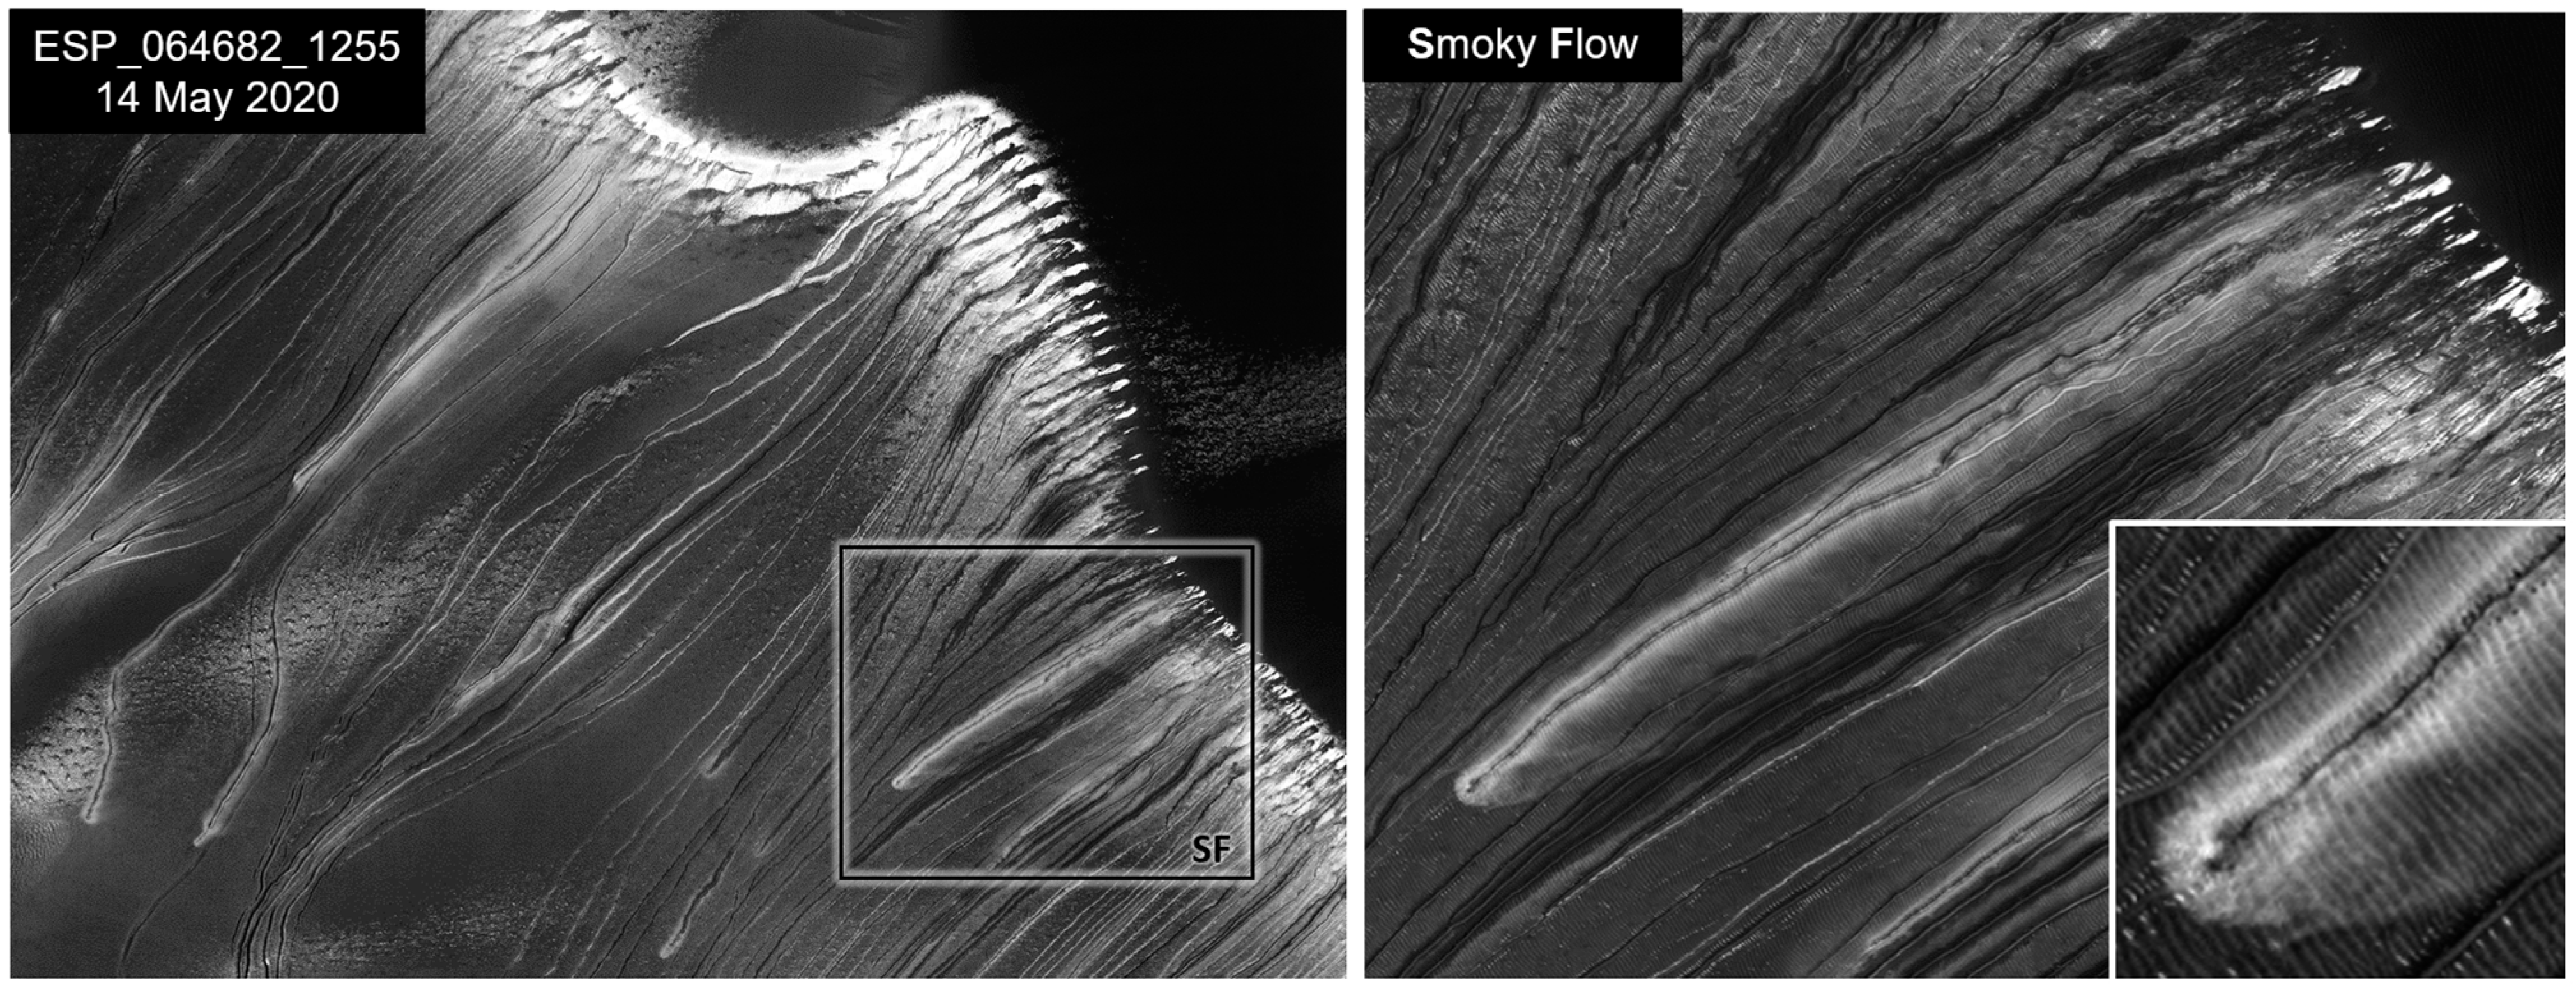
  • Ice balls. These are the high albedo spheroidal or ellipsoidal objects (usually the brightest white in the color palette) observed at the termination or along the end of the channels (Figure 10, box “Ice”). These rare phenomena are typically observed in the first half of spring, and when present, they can occur in large numbers. Figure 8 shows 9 of the 11 phenomena observed in the same photograph (from which also Figure 9 is taken). Ice balls are found in the terminal “spoons” of the channels. Note that the “spoon” in the second channel from the top in Figure 7 “Bottom” is the same one that houses an ice ball in Figure 10 “Ice.” The first photo was taken on the 47th day of year 29, and locally (latitude 54.2° S), 24% of the fall season had passed. The second photo, with the ice ball, was taken on day 410 of year 33 (when locally, about 27% of the spring (26.8) had elapsed). The ice ball is the largest observed during the entire 9 Martian years. The minimum dimensions based on the pixels in the photo are 3 m horizontal, 1.7 m vertical. Looking at the same photo at the highest resolution, one can spot other globular or elongated bodies left along the channels. In general, it is evident that multiple bodies move through different channels on the same day and may also move through the same channel over time.
  • Vapor. This appears to be either fog covering the entire dune or similar to “columns of smoke.” These columns seem to emanate from the termination of channels not reaching the plain, presumably in the V-section. Sometimes, they are observed along the course of a channel where it verges toward sunlight, as observed in Figure 10, comparing the zoom of the “Vapor” box with the corresponding “V” perimeter on the extended image. This extremely rare phenomenon is observed only in the first half of spring.
  • Full frosted surface. Here, the dune frosts completely the whole downwind slope and all or part of the upwind slope (e.g. “Full frosted surface” box in Figure 9). According to our observations, this can occur between mid-winter and mid-spring, and seems particularly frequent around the vernal equinox.
  • Frost. This is the frost present on the dune without producing total coverage (e.g., “Frost” box in Figure 10). Except in the summer, this can happen at different times and in different ways, which we will describe in detail.
  • Full “clean” surface. It does not indicate a particular phenomenon. It means that the dune exhibits none of the transient phenomena mentioned above. This should be the standard condition for Mars, but in reality, it is quite rare on this dune. It may occur more frequently within the first half of autumn (Figure 9, “Full clean surface”).
Regarding frosting episodes, we can further differentiate the following seasonal features:
  • Winter and autumn frost forms inside the channels, and in the cavities of alcoves on their slopes exposed to light. The downwind slope of the megadune may have longitudinal ripples. Again, frost may occur on the side most exposed to light. This frost appears brighter than the spring one. It is unclear whether this is due to direct exposure to light or because it is ice with a higher albedo (e.g., CO2 compared to H2O).
  • Spring frost forms mainly below the ridge (middle Figure 10) but also just upwind (Figure 10 “Frost”). In this case, it will still stay on the downwind slopes of the ripple marks. Looking in detail at the cavities of the alcoves, it is evident that frost is missed on the slopes most directly exposed to light, even when the entire surrounding area is frosted. Here, again, as we have speculated in the Kaiser Crater, it seems to be the wind that causes the frost but it is the shade that allows it to persist.
  • Over the course of the year, episodes I and II are separated by an intermediate phase of frosting of the entire downwind slope of the dune (Figure 9, “Full frosted surface”). This occurs around the local spring equinox (Sol 373, the autumn equinox for the Northern Hemisphere).

4.1. Observations: Seasonality

A quasi-two-year recurrence of the rarer phenomena is evident when considering the terrestrial dates of the HiRISE images. This pattern may suggest a regularity linked to the Martian year. Therefore, we developed the IMD algorithm [31], which we used to create graphs of the time distribution of the classified transients. Figure 11 illustrates a clear regular pattern related to the Martian year, showing that each of these phenomena consistently occurs at the same time each year. The phenomena mutually exhibit the same seasonal sequence. In cases where there is a gap, it is unclear whether the transient did not occur or if an image is missing from the expected time. To answer this last question, Figure 12 shows the full range of transient phenomena monitored over 8 years by projecting their occurrence over the Martian year. In this way, the expected recurrences are evident. The gray squares in the graph represent the chronology of the 110 images studied (Appendix A), highlighting the temporal gaps in HiRISE acquisitions. The X-axis expresses time on a scale that is not linear but proportional to the percentage of occurrence of the phenomena over the season (IMD). It is evident that most of the phenomena and their greatest diversity occur during the spring. The legend shows the percentage occurrence of these phenomena. This percentage is not cumulative, as some phenomena may occur simultaneously, as evident in Figure 10.
The question of whether CO2 or H2O is the erosive agent behind the gully phenomenon is a long-standing and critical dilemma. From comparing Figure 12 and Figure 10, it seems that three phases could be observed simultaneously in the spring. This is not likely for CO2. Figure 13 directly compares the state diagrams of CO2 and H2O. Pressure is shown on a logarithmic scale for easier comparison. The temperature and pressure ranges affecting the Earth and Mars surfaces are also shown. For Earth (shown in green), we consider the maximum atmospheric pressure at sea level and the average pressure at an altitude of 8000 m. For Mars (orange area) are not included in the range: (i) extreme altitudes, characterizing only the slopes of major volcanoes (above 6000 m), and (ii) a limited region on the edge of the Hellas Basin (below −6000 m).
This comparison clearly shows that CO2 cannot cause erosive phenomena involving liquid, as it requires pressure greater than 5 bar to remain in a liquid state. H2O in the Earth’s environment presents a wide range of stability of ice and liquid but does not reach the phase transition between liquid and vapor (Figure 13). It is very important to consider this point of view. Although we are familiar with water vapor, Earth’s environment never maintains it in a stable gaseous state. Of course, even liquid water is not really stable on Earth but is in constant equilibrium with vapor; this is exactly what gives rise to the H2O cycle. In contrast, Figure 13 shows that the Martian environment actually includes the triple point of water and all its phase transitions. Indeed, altitude zero of Mars has been set by convention, precisely at the altitude where the atmospheric pressure corresponds to that of the triple point of H2O. The average temperature at the site is the main factor preventing the Martian environment from reaching the triple point. MOLA and MOLA + HRSC altimeter measurements seem to place the Russell Dune closer to the zero elevation when compared to the Kaiser Dune (Figure 3 and Figure 6). Figure 13 shows that the average values within the Martian temperature and pressure range (216.5 K; 700 Pa) closely match both the widely accepted planetary average and the measurements from the InSight landing site (210 K; 700 Pa). The graphs in Figure 12 and Figure 13 and the images in Figure 10 seem to confirm that water can be considered a potential erosive agent on the Russell Crater dune. This is in agreement with the observations of Reiss and Jaumann [21]. Figure 13, however, leaves CO2 as a possible alternative in terms of frost and ice formation. Let us then try and consider the dynamics of P and T variations that may occur on the Russell Crater dune. Figure 14 shows the Martian box (orange), which was reproduced and magnified on a linear scale together with diurnal and nocturnal temperature and pressure cycles measured over the year. These data were extracted from a graph published by Reiss and Jaumann [21], with measurements made by the Thermal Emission Spectrometer (TES) aboard the Mars Global Surveyor (MGS) in Russell’s area. They are not direct measurements but estimated ones, with uncertainties in both the measurement and its location. Moreover, they refer to only one year not included in the 9 we have considered. Nevertheless, we can take this as a realistic view of what may happen in the Russell Crater environment. In Figure 14, we observe two cycles. The dashed gray curve represents the night cycle obtained from measurements made at about 02 local time. The solid black line is the diurnal cycle obtained from measurements made at about 14 local time. On both curves, the points corresponding to the equinoxes and solstices are marked. Only on the diurnal curve are the labels of the seasons also marked to better follow the analemma. It can be seen that the total range of temperatures is centered in the Martian box and covers nearly its entire extent. During the spring and summer, temperatures can cross the phase transition between vapor and solid for H2O twice a day. Only in winter and at night is the contribution of CO2 in the phenomenon of frosting from atmospheric vapor feasible. In addition, it is interesting to note that, in the spring, the P and T conditions exceed the water triple point by passing through a short liquidity interval. If we imagine a straight line joining the points corresponding to the summer solstices (SSs) of the two curves, we can obtain an idea of the changes in P and T over that day. It is essentially a temperature variation that allows all three phases of water to occur over the same day. The winter solstice (WS) is the seasonal shift characterized by the least change in T but it is also the only one with appreciable pressure change. For all other seasonal shifts, the diurnal cycle appears to be affected substantially by temperature changes.

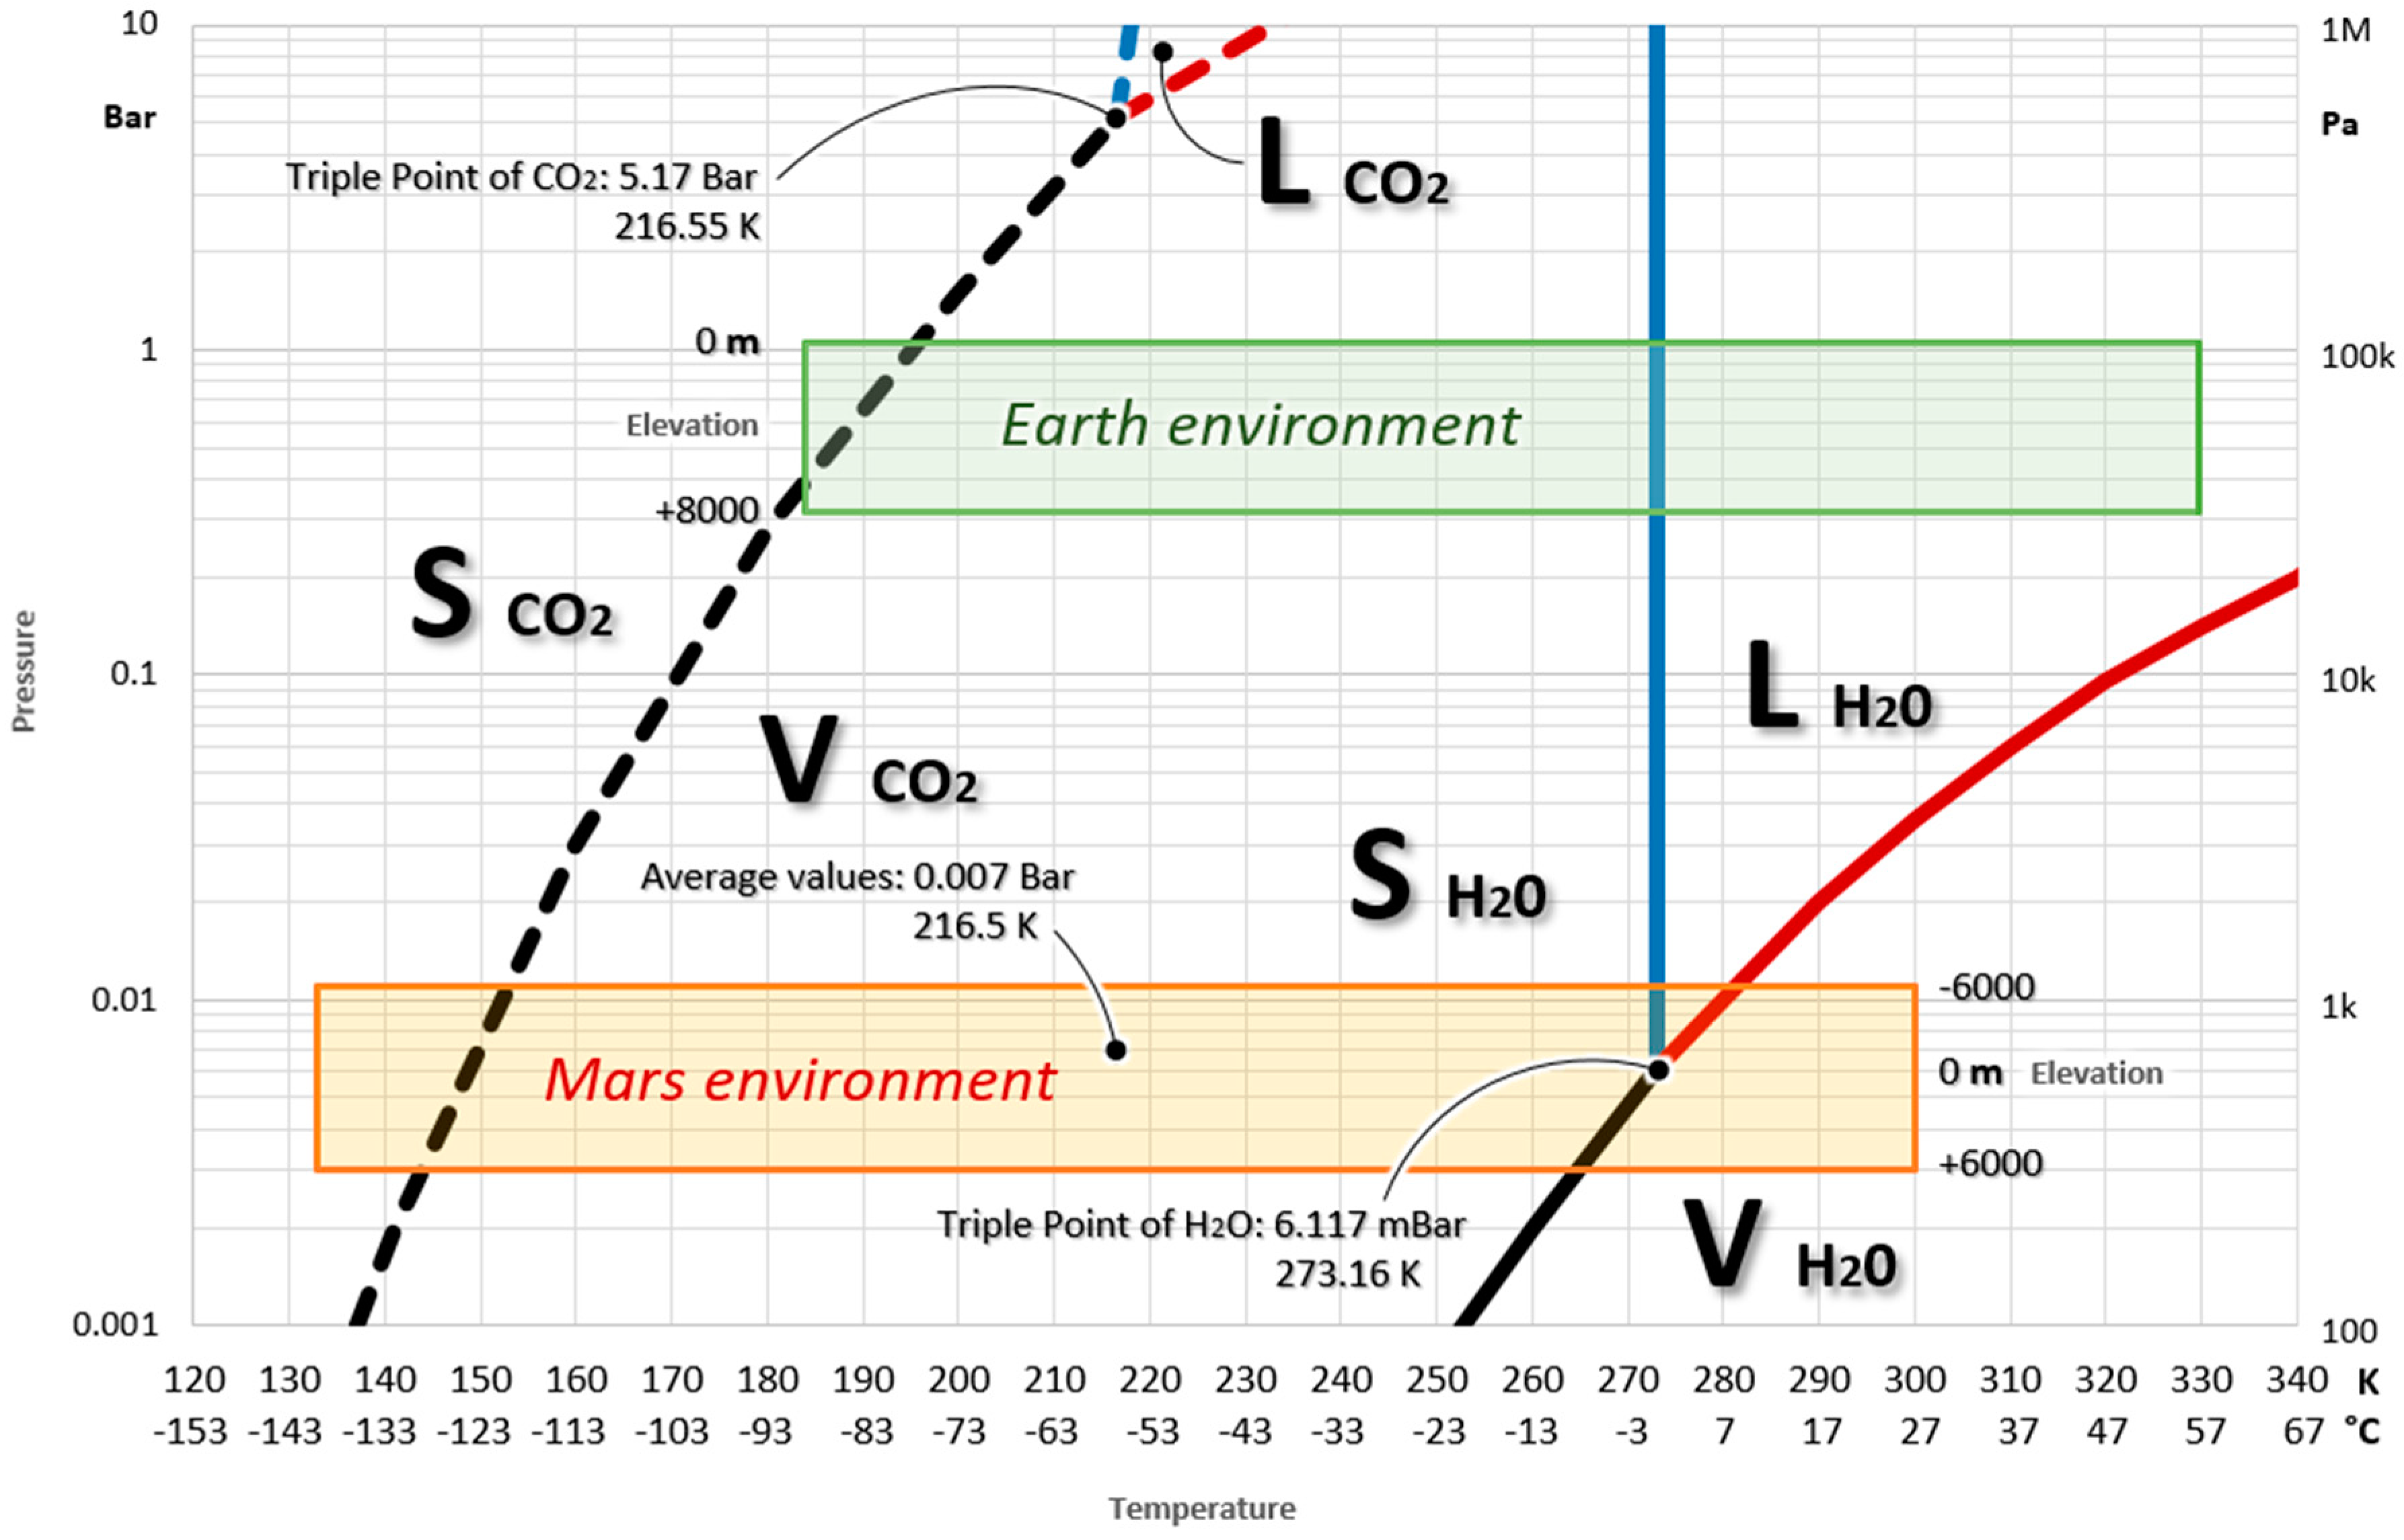
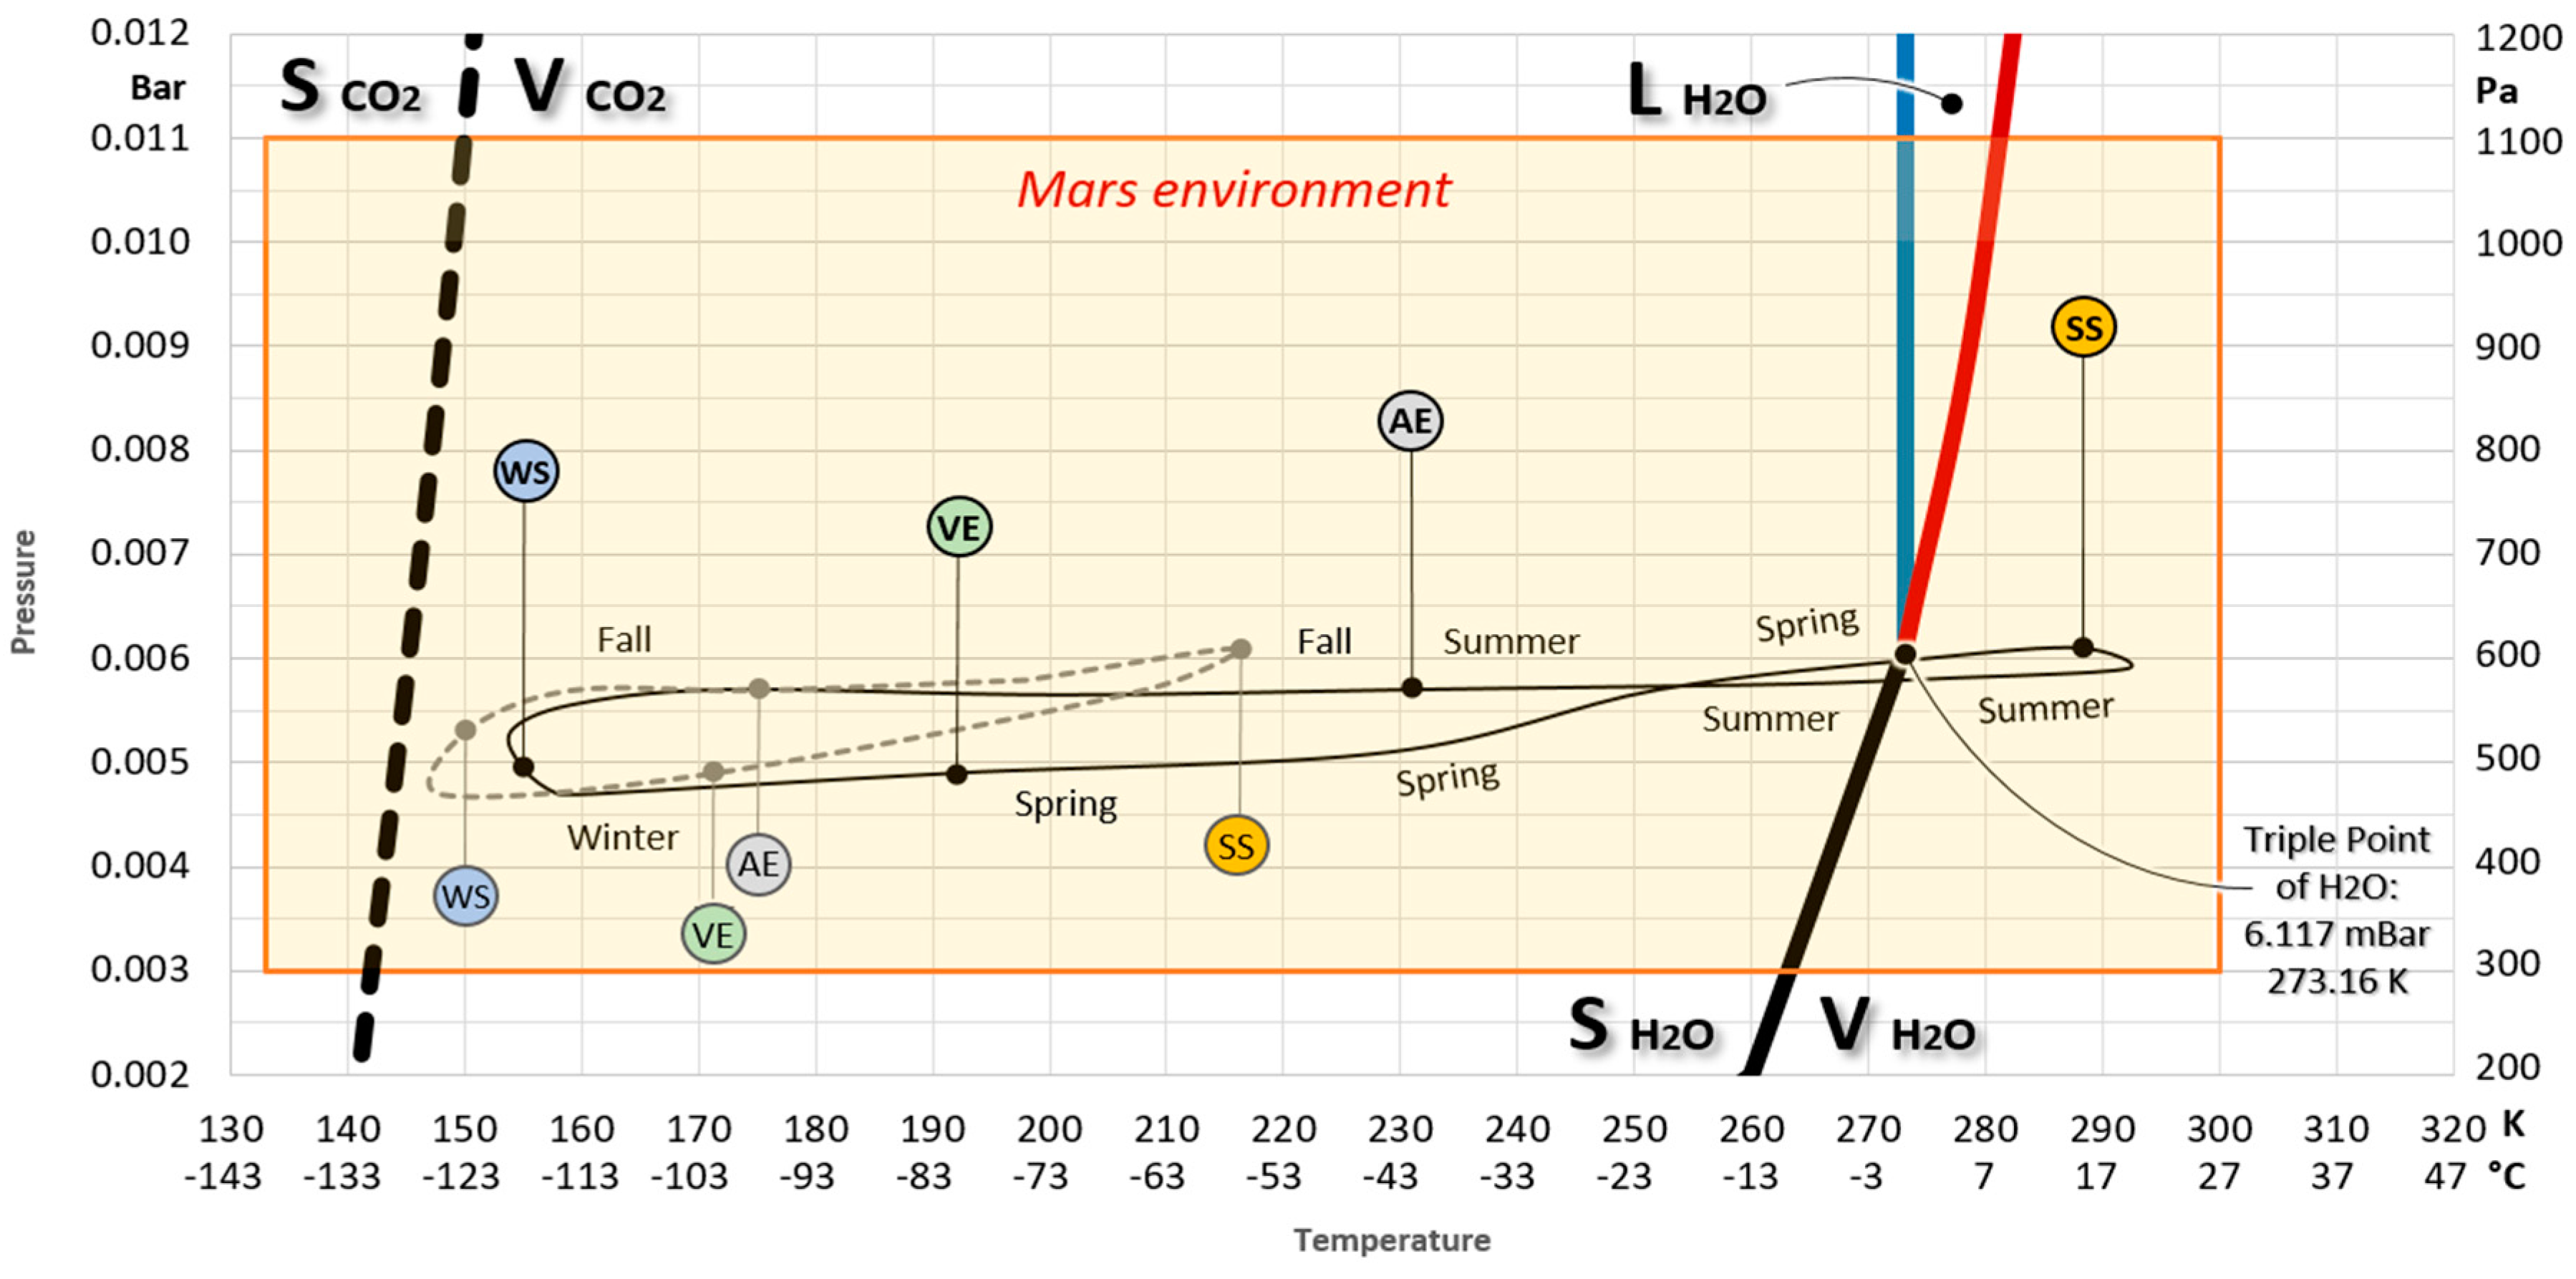
4.2. Discussion: Compatibility of H2O

In this new scenario, H2O likely plays a major role in producing the transients we observed. Spring frosts are likely (Figure 12), which avoid direct light (point II), like water from ACA gullies [18], are H2O frosts that also form during the day (Figure 14). Winter frosts may also be CO2 but are likely to be produced only at night. Water finds conditions for existence in late spring–early summer. We observe this in Figure 12, and this possibility was also considered in [21]. Of course, a locally higher partial pressure of atmospheric H2O than the planetary average is required, but this seems to be supported by local observations from Phoenix [30] as well as by theoretical and experimental evaluations [44,45]. However, this is the steady condition in still air. The aerodynamic effect of wind on the dune introduces additional short-term dynamics. Each gust of wind can locally alter T and P. Through Equation (1), an increase in P followed by a subsequent decrease in T could bring the air below the dew point or the frost point. Condensation of water would be produced even outside the narrow time intervals predictable from day–night dynamics alone. Similarly, such phenomena could enable the condensation of water for more days than can be predicted by seasonal dynamics alone. We remind the readers that the temperatures estimated by TES/MGS are surface temperatures, not air temperatures, and the plan resolution is far from photographic ones. Moreover, the very fact that the water triple point lies within the Martian box and in the middle of the ‘altimetric’ and ‘pressometric’ ranges (Figure 13) indicates that the great variability of atmospheric phenomena that we observe in the spring can actually occur. Indeed, a variation of a few degrees or a dozen millibars is enough to go through all phase transitions. We assume that H2O frost is often formed by freezing dew, which, in turn, will often form directly from the air before the frost. For this reason, on spring days, frost does not form in direct sunlight. Instead, dew alone (without freezing) can form downwind in both the spring and summer, i.e., just when the wet patches around the channels are observed (Figure 10, “Humidity” box). In Figure 14, we can consider, as an approximation, the 6 millibar line as the boundary between the frost that results from freezing dew (above) and the frost that forms directly by phase transition from vapor to ice. We can then assume that, from late summer, presumably not in broad daylight, until the following spring, frost forms without passing through the liquid phase.
Similar to the Kaiser Crater, in the Russell Crater and surrounding area, there are classic ACA gullies that have the potential to inject water vapor into the basin microenvironment (e.g., HiRISE PSP_006728_1250 (https://www.uahirise.org/PSP_006728_1250, accessed on 10 January 2025), locally increasing partial H2O pressure. In this case, the hypothesis that the non-ACA gullies may spring from an exogenous water source rather than an endogenous source takes strength. The aerodynamic effect of the dunes would activate vortices and peculiar physical conditions where site conditions approach the triple point of water. At this point, we have several exogenous agents that can produce erosion on the dune at different times and modes, even within the same day, including wind, water, frost, and ice. The last two are possibly CO2 as well.

4.3. Discussion: Non-ACA Gullies

We will attempt to relate transients and gullies in a comprehensive dynamic. We already know how ACA-like gullies can develop in various modes (equatorward or poleward-facing) between 30 and 60 degrees latitude, both north and south [3,18]. The Kaiser gullies, of ACA-like appearance, are found at about −47 latitude, and the Russell gullies, definitely non-ACA, are at about −54. Both are within the range of the existence of ACAs, but unlike ACAs, they do not appear on canyon slopes or craters. Non-ACA gullies occur on dunes, and unlike ACAs, they cannot draw water from underground. A spring from the ridge is also inconceivable. Moreover, on barchan dunes, gullies occur exclusively on the downwind slope, regardless of the direction of the pole. Except for dust devils, all the transient phenomena we observe on the dunes can be associated with phase transitions and occur only downwind. This supports the initial hypothesis of a downflow phenomenon due to completely exogenous or weather-related causes.
Some authors [22,43] have already proposed ice sublimation as an agent of “linear gullies”. Diniega [22] also suggested that H2O could not sublimate as effectively as CO2. We agree with the ice hypothesis, which is certainly identifiable in ice balls. The U-profile of Russell gullies seems to be produced by simple sand displacement rather than by removal (erosion), which would involve transport and sedimentation. The sliding of a mass in sublimation is compatible with non-ACA tracks. However, a subspherical body such as those we observed (Figure 8) might also not need sublimation to roll on an inclined plane. On the other hand, the evidence collected (Figure 10, Figure 12 and Figure 14) shows that this phenomenon only occurs a few days per year and only when all three water phases seem to be present. However, the question of the genesis of ice balls remains. We are not able to give a definite answer, but it is clear that the problem is much more complex, and the solution will also have to reconcile the flow episodes of a fluid (V-profiles) with those of a solid (U-profiles) in the same channels. Our proposal is a mixed solution. CO2 can frost directly from the atmosphere but only during cold periods. H2O, on the other hand, can frost from the atmosphere only in spring, after regional ACA gullies have transferred meltwater from the subsurface to the atmosphere locally increasing H2O partial pressure. Observation of the three concurrent water phases (Figure 10) initiates the moisture season around the channels. In the early stage (with cold weather), the water initially forms frost; subsequently, it condenses but then freezes, and slowly the frost sublimates. Later in the season (less cold), it condenses but then evaporates, leaving moisture spots. A big question is the genesis of the ice balls and the possible relation to the double profile (U-V) of the channels. We can hypothesize that starting in the spring (when frost III gives way to frost II, see “About frosting episodes” in Section 5 and Figure 12), mixed ice of CO2 and H2O may coexist and this could be the constituent of ice balls. In support of this, we can consider the puzzling patterns that are not infrequently observed around “spoons”. They may resemble branches terminating with other “spoons” or simple small pits surrounding the main “spoon” termination (some examples in Figure 7 “Bottom” and Figure 8). Branches always proceed downhill but also lateral to the trajectory of the channels. Small pits are often observed in the direction of solar irradiance. If the ice body was chemically inhomogeneous, sublimation might not only proceed from the outside to the inside but internal clumps of CO2 might sublimate before H2O at the surface, producing the fragmentation of the main body. This could be the cause of branching and pits.
We cannot specifically explain how ice balls are formed. No one so far has given a definitive explanation. Several papers [20,21,40,43] have proposed debris flow as the cause of Russell channels. These models require a large amount of water, which is not easily explained. It cannot come from rain, and on the dunes, it also cannot come from a geologic source [7]. It has been proposed (e.g., [20]) that it comes from external processes under past climatic conditions. Others (e.g., [23]) argued for the emission of CO2 gas jets but without assessing the related geological implications. We believe that if CO2 were to come from the substrate on which the dune rests, the mass of loose sand would be affected by it, taking on a shape similar to a volcanic cone. If for unknown reasons it were, the dune itself that was impregnated with CO2 ice would then cease to be a dune and become a sort of sandstone outcrop. Under the action of the wind, this stone outcrop would be visibly surrounded and enveloped by other loose sand brought by the wind. Instead, we hypothesize that these debris flows are turbid atmospheric currents produced by the aerodynamic effects of the dune. It would then be a three-phase flow, colder and heavier than the surrounding air, composed of little sand together with CO2 and/or H2O crystals and droplets of H2O. This cold current rushes down into the channels with a swirling motion that produces erosion associated more with displacing sand than transporting it. The upper part of the collector channels (point 3 of the characterization of the Russell gullies) would be alternately affected by both the frost meltwater (coming from zones 1 and 2) and these turbulent flows. This would explain the following observed features: the lack of debris deposits, the gradual growth of the edges of the channels, and the change in profile from V to U. The vorticity of the motion could perhaps also account for the occasional production of the hail-like bodies we have labeled as “ice balls”. Finally, these could slide along the final parts of the gullies (U-shaped sections) with the “blocks of ice in sublimation-style” that Diniega experimented with on Earth with CO2 [22]. We cannot prove this, but we can at least suspect that this is associated with the “smoky flows” observed in two photos where ice balls appeared. These events are already observable in the central part of Figure 10 (Sol 410 of year 33; 26.8% of spring) but one example in particular is highlighted in Figure 15 (Sol 408 of year 35; 25.4% of spring). At first glance, it might appear that we can finally observe in the sunlight those streams of effervescent water that we invoked in the ACA gully model. Instead, a closer magnification (“Smoky Flow” box in Figure 15) reveals that only the front part of the flow appears to produce smoke. The rest of the channel is sided by a halo of frost deposited on the dune surface (otherwise present only downwind of the ripple marks). It looks like a single “smoky blob” sliding into the channel. After all, we assume it is occasionally produced by a particularly intense gust of wind on the dune. Could this possibly be the aggregation phase of solid objects such as those in Figure 8?
From Figure 12, it is evident that on the Russell dune, we could have the chance to observe and study any kind of transient only during the Martian spring. In order to better study rare phenomena such as the formation of ice balls and the coexistence of the three phases of water, we recommend the future focus on at least ten Martian days centered on Sol 410. It will correspond to the Earth dates of 19 February 2024 and 6 January 2026, respectively, for this Martian spring and the next. If this were technically possible, it would be appropriate for photographic shots to be planned during these days at different times of the day. We would recommend this to the operators of the HiRISE/MRO mission. More generally, we recommend the collection of images at different times of the day for any study about gullies (including ACA ones), considering their dependence on light and shadows (see Ref. [18]). In Figure 16, we can observe the spring interval taken from the graph in Figure 12 with a linear and Earth-related time scale. Given the narrow margin of occurrence that these phenomena likely exhibit, we expect a similar distribution of transient events in the future as we have already observed over the 8 Martian years (28 through 36). We report on the time scale, in Earth days, corresponding to the spring of the current Martian year (related images will be released soon) and the spring of the next Martian year. We hope that this scheme will be useful in the future for detecting rare phenomena such as vapor columns, ice balls, and “smoky flows”.

5. Observations: Current Nature

The 110 images of the same slope collected over 8 Martian years allowed us to observe many variations in the path of the Russell Crater gullies, namely, deviations, appearances, or disappearances of collector channels (see point 3 of the characterization). The stereoscopic images we obtained, comparing homologous portions of HiRISE images taken at different times, immediately enhanced this aspect. For ordinary morphological studies, we could usefully employ only images that were close in time. In fact, when they are further apart, channel traces may not perfectly overlap and, in such cases, locally produce visual “noise” (we recommend this technique to quickly detect any slight variation between two photos). Figure 17 attempts to highlight microvariations by comparing a small area centered on the same smoky flow in Figure 15. Images A and B are taken almost in the same Sol, but four years apart. The areas highlighted by the boxes show tracks that have disappeared or are nearly erased. The areas highlighted by the circles show new or reactivated traces. Image C depicts the particular instant when a smoky flow made its passage during the period between the first two photos. The trajectory is highlighted in red in the other photos, showing that the smoky flow passed along an old track, deepening its incision.

Discussion: Current Nature

The abundant presence of water on Mars during the Noachian era, in its modern interpretation, is now widely accepted in the literature. However, only a portion of that water can persist today within the chemical structure of minerals, as ice or as shallow subsurface diurnal moisture, as suggested by observations from the Curiosity and Phoenix landers [46]. Ice and moisture, under current conditions, imply the presence of atmospheric water vapor in concentrations that, at least locally and sporadically, appear to exceed the planetary average [30,44,45].
Russell gullies appear to be current phenomena as the meteorological ones from which they perhaps originated. We note that the theory on the “aerodynamic” origin of quasi-ACA gullies, as well as the observations reported above on non-ACA-related meteorological phenomena, can support the evidence that non-ACAs are current phenomena. Non-ACA gullies often show only moisture halos around channels (see the second half of spring in Figure 16). Moreover, the dunes on which we observe these phenomena appear in geographic areas rich in ACA gullies. It is possible that the ACAs in the region favor aerodynamic dew by locally and seasonally increasing the partial pressure of atmospheric H20. Perhaps the craters where we observe dunal gullies help to maintain a humid microenvironment within them.
It has already been proposed that gullies can be formed by liquid water in environmental conditions similar to those currently present on Mars [47]. It has been hypothesized that—even under current conditions—water can be in the liquid phase, albeit in modest quantities since it would be unstable (e.g., [44,48,49,50,51]). It has been estimated that this could happen on 29% of the Martian surface [49]. The presence of liquid water is commonly considered unlikely except in the presence of quite unusual climatic conditions or in underground environments [25].
Observing Figure 13, the mere fact that the triple point of water falls within the natural environmental conditions of Mars (unlike on Earth) indicates how easily water can rapidly transition among its three phases with slight variations in temperature or pressure by a few millibars. This does not imply that liquid water is commonly present. However, if liquid water were to appear, it would be easier on Mars than on Earth to observe conditions where all three phases coexist, as suggested in Figure 10. Another necessary condition for liquefaction is that the partial pressure of atmospheric H2O must exceed the planetary average. Our study areas are surrounded by non-dune gullies of the ACA type. Nardi and Piersanti [18] attributed the ACA scheme to an endogenous H2O source (permafrost) that disperses as vapor into the atmosphere. This process could seasonally enhance atmospheric H2O concentrations beyond the norm in enclosed environments such as these craters. In fact, the transient condensation of liquid water on the surface has been suggested by observations from the Phoenix rover [30]. Furthermore, simulation experiments conducted on Earth on the stability of pure water under Martian conditions show that surface liquid water can persist for a short time [52,53]. This supports one of the most peculiar features of our model, namely the presence of liquid water only in the short path of the channels and away from direct sunlight.

6. Possibility of Extending the Discussion to Ice in Craters

We hypothesize and have observed that, on Mars, the most extreme form of atmospheric water “forming” is frosting that forms directly from the air. This limitation leads us to a meteorological phenomenon that resembles Earth’s but actually produces erosion that emulates geologic springs. However, we have seen that erosion and eventual transport (quasi-ACA of the Kaiser Crater) can still also be linked to the liquid phase. The ultimate extreme of the phenomenon could be the total absence of the liquid phase, that is, a weather phenomenon. This is probably the case with the ice deposit in the Korolev Crater (72.8° N; 164.4° E). This crater, with a diameter of about 80 km, is located in the northern circumpolar region. It has been observed [54] that the interior of the crater contains deposits of water ice several meters thick. Figure 18 presents a prospective reconstruction obtained by processing several frames captured by the European Mars Express mission. At such high latitudes, the dew point of H2O will always remain below 0 °C (the frost point). In the case of the Korolev Crater, the aerodynamic phenomenon we hypothesize would occur on the downwind side of the rim, producing only crystalline ice grains (frost), predominantly deposited inside the crater. These would still be sporadic phenomena tied to a warm season and a “humid” airflow. However, at these latitudes, ice is relatively stable, and the wind itself can rework these ice grains in a manner similar to how it shapes sand in dunes. It has been well-known since the Viking missions that during winter and/or spring, only the on-pole winds blow, while in the summer, winds can come from both directions [55]. If we assume an almost north-directed wind, it is evident from Figure 18 how the distribution of frost results downwind from the crest of the circular relief. In this case, the central flow crosses a topographic profile characterized by two unequal, specular reliefs. However, the crater’s rim seems to have caused flow vortices and depression producing the frost. Indeed, it appears to have formed a dune of ice crystals. It is significant to note that the ice sheet that fills the basin exhibits a shape that is bounded only by the circular form of the crater. Indeed, it seems oriented to the polar katabatic wind, like a dune section. The downwind front is visibly steeper than the upwind front. TES/MGS observations reveal that, in the late summer, high albedo deposits form within the crater when the temperature exceeds the CO2 frost point [54]. We think this can be considered the conclusion of an H2O cycle that evolves with latitude. A trend that produces ACA gullies at 30° latitude [18], quasi-ACA gullies at 47 degrees of the Kaiser Crater, non-ACA gullies at 54 degrees of the Russel Crater, and a “lake of frost” at 73 degrees of the Korolev Crater.

Speculations on a Water Cycle

Generalizing these observations of Martian “paroxysmal” meteorological phenomena (water on the dunes, ice on the dunes, and ice in the craters), it can be inferred that the repeated cycles of phase transitions of atmospheric H2O interacting with the soil surface may today represent the last remnants of an ancient water cycle on Mars. A hypothetical current cycle could consist of two symmetrical one-way “half-cycles”. In each hemisphere, water stored underground as ice (permafrost from ancient deposition) is slowly transferred to the atmosphere at low- and mid-latitudes through ACA gullies, i.e., passing briefly through the liquid phase. Subsequently, atmospheric transport moves water to the respective pole through repeated phase transition cycles driven by non-ACA erosive action characterized by decreasing content of the liquid phase. As the latitude increases, the brine/melt/evaporation cycles (Kaiser gullies) gradually transform into mixed cycles in which the brine/sublimation transition begins to dominate (Russell gullies), reaching latitudes where the latter becomes prevalent (e.g., Korolev Crater). The conclusion of the half-cycle can only be precipitation in the polar area, where the solid state remains stable in any season. The Korolev Crater, due to its geometry and location, could represent an early paroxysm of this irreversible end.

7. Conclusions

Standard ACA gullies affect the inner slopes of craters and canyons (Figure 1). The hypothesis that they may be generated by liquid water must confront seemingly paradoxical features (exposure, latitude, structure) that could be explained by the model proposed in Ref. [18]. We extended this model to more extreme Martian environments such as dune gullies, where we distinguished two characteristic patterns: quasi-ACA (Figure 4) and non-ACA (Figure 7). The case studies were, respectively, the Kaiser, Russell, and Korolev Craters. Here, satellite photos show slight changes in the course of the gullies but also transitory and seasonal phenomena that occur near the gullies. We hypothesize that water could originate from atmospheric vapor. The presence of the ACA gullies in and around the crater could facilitate the occasional persistence of a microclimate within the crater itself. In this case, the aerodynamic shape of the dune will facilitate the formation of dew or frost (or both) on the downwind slope. Following the classic ACA pattern between two phase transition horizons, at suitable times of the day, the melting of this ice can act as erosion of quasi-ACA gullies. Channels and aprons maintain a classical appearance while the alcove undergoes direct erosion on the poleward slope and gravitational adaptation on the opposite slope (Figure 4A). This would be a meteo–geological phenomenon, where the source is not endogenous; still, the processes of erosion, transport, and sedimentation are similar to those hypothesized for ACA morphology. For the Russell Crater, we listed and studied transient phenomena in 110 HiRISE images over 8 Martian years. Only 8% of these images showed no phenomena (Figure 12). On Mars, it is evident that the present tenuous atmosphere is still quite active, especially in the spring. During this season, it can generate various weather phenomena that can, in turn, be the erosion engine on the surface of the dunes. The gullies observed on the dunes differ from the ACA pattern and present new paradoxical features (e.g., a dune cannot host an aquifer and a spring cannot flow from the crest). Several previous works speculated that erosion of Russell channels required a certain amount of water but they lacked an explanation of where this water might come from. Moreover, no hypothesis explained why erosion was only exerted on one side of the dune and the sporadic presence of ice balls has never been definitively explained. In the Russell Crater, we were able to highlight that, if the erosion appeared to be produced by a liquid, this could be water (Figure 14), while the liquid phase could be ruled out for CO2 (Figure 13).
The idea of phase transition horizons in the model by Nardi and Piersanti (Figure 1 in Ref. [18]) was quasi-static. It predicted only circadian variations. Extending the same idea into the dune scenario, we propose a dynamic action of purely exogenous origin that can still generate gullies taking on the appearance of a spring (Figure 4 and Figure 7). Here, the model supports those transient and seasonal phenomena affecting the same escarpments. It also finds consistency in the paradoxical features of all these phenomena (a lack of a geological source, exposure, and partially overlapping forms). In fact, in this case, the source is not a geological spring even though it is apparently mimicked. The source is atmospheric water vapor and the physical trigger of water phase transitions is caused by the action of the wind on the aerodynamic shape of the dune profile (Figure 5). This action could locally, sporadically, and transiently increase the pressure and decrease the temperature of the air. These conditions bring the air passing over the dune crest below the dew point or frost point of H2O. The temperature range between the dew point and the frost point (when the dew point is below 0 °C) is very small and depends on the local temperature. We have observed that our three case studies, Kaiser, Russell, and Korolev, located at progressively higher latitudes, appear to show the actions of water and frost (quasi-ACA erosion), humidity and frost (non-ACA erosion), and only frost (the Korolev Dune), respectively. The local ACA-type gullies, according to Ref. [18], are produced by the sporadic erosive action of highly unstable endogenic water, and could instead be responsible for a locally and seasonally elevated partial pressure of H2O compared to the planetary average.
The presence of the water triple point within the Martian environmental range (Figure 13), particularly its proximity to the site conditions of the dunes under investigation (Figure 7 and Figure 14), occasionally allows all H2O phase transitions to occur during the daytime, especially in the spring. Under more extreme conditions, during winter and at night, CO2 can produce similar phenomena but without the liquid form (Figure 14). We believe that this model can be applied to all dune gullies as well as those “under-crested” with respect to a crater or any slope where gullies with non-ACA morphology occur. In conclusion, we hypothesize that the morphological dissimilarity (ACA, quasi-ACA, non-ACA) observed among gullies from different sites is an expression of the current water cycle, which turns out to be a predominantly atmospheric “half-cycle”. Water expelled from the subsurface (solid-state) through the ACA gullies of temperate regions undergoes a very limited surface circulation (liquid state) and a more extensive atmospheric circulation (vapor/dew/frost/vapor) until it is finally deposited on the polar ice caps (solid state). Considering that this may have been going on for millions of years, the remaining underground water reserves seem destined to be irreversibly depleted.

Author Contributions

Conceptualization, methodology, software, validation, formal analysis, investigation, resources, data curation, writing original draft preparation, writing—review and editing, visualization, supervision, project administration, funding acquisition: A.N. and A.P. All authors have read and agreed to the published version of the manuscript.

Funding

This research received no external funding and only institutional open access funding provided by Istituto Nazionale di Geofisica e Vulcanologia was granted.

Data Availability Statement

A list of the 110 images used in the study of seasonal phenomena on the Russell Crater dune is provided in Appendix A. All photos used in this work are from the HiRISE Image Gallery of the High-Resolution Imaging Science Experiment, part of the Mars Reconnaissance Orbiter (MRO) archive: https://www.uahirise.org (accessed on 18 November 2024). For Martian altimetry, the following were used: The elevation map from the Mars Orbiter Laser Altimeter (MOLA) of the Mars Global Surveyor (MGS) mission, by the Goddard Space Flight Center (NASA), accessible at https://attic.gsfc.nasa.gov/mola/index.html (accessed on 18 November 2024); DEM with a resolution of 200 m per pixel that combines data from NASA’s MOLA/MGS altimeter with the ESA’s High-Resolution Stereo Camera of the Mars Express (HRSC/MEX). This can be downloaded from Annex: https://astrogeology.usgs.gov/search/map/mars_mgs_mola_mex_hrsc_blended_dem_global_200m (accessed on 18 November 2024). Temperature and pressure data for the Russell Crater area are from the elaborations of Reiss and Jaumann [21], derived from the TES spectrometer installed on board the Mars Global Surveyor (MGS): http://tes.asu.edu/data_archive.html (accessed on 18 November 2024). The seasonality of Mars was calculated using the IMD procedure [31]; the “IMDcalc” software (Excel, Python, and Matlab applications) can be downloaded at https://www.earth-prints.org/handle/2122/16819 (accessed on 18 November 2024). The perspective view of the Korolev Crater (Mars Express mission) was created by the European Space Agency, based on data from the High-Resolution Stereo Camera, showcased at https://www.esa.int/ESA_Multimedia/Images/2018/12/Perspective_view_of_Korolev_crater (accessed on 18 November 2024).

Conflicts of Interest

The authors declare no conflicts of interest.

Appendix A

Summary distribution of seasonal phenomena observed from 110 images of the investigated dune in the Russell Crater. The classification and nomenclature refer to the observations in Section 4 and the graphs in Section 4.1. The Martian year (MY) and the day of the Martian year (Md) are calculated using the IMD algorithm [31]. The “x” marker indicates the presence of the phenomenon related to the respective column in the image related to the respective row.
HiRISE ImageResolution
(cm/px)
Earth Date
(dd/mm/yy)
MYMd“Clean”Dust DevilsFrostFull Frost“Humidity”“Vapor”“Ice Ball”
1PSP_001440_1255_RED50.316/11/200628.4291x
2PSP_001981_1255_RED50.928/12/200628.5332 x
3PSP_002337_1255_RED25.225/01/200728.5360 x
4PSP_002482_1255_RED25.505/02/200728.6370 x
5PSP_002548_1255_RED25.410/02/200728.6375 x
6PSP_002904_1255_RED25.110/03/200728.6402 x
7PSP_003326_1255_RED25.412/04/200728.6434 x x
8PSP_004038_1255_RED25.307/06/200728.7489 x x
9PSP_004249_1255_RED25.223/06/200728.8505 x x
10PSP_005238_1255_RED25.308/09/200728.9580 x x
11PSP_005383_1255_RED25.419/09/200728.9590 x
12PSP_005528_1255_RED26.101/10/200728.9602 x
13PSP_006873_1255_RED50.613/01/200829.135x
14PSP_007018_1255_RED25.425/01/200829.147x
15PSP_007229_1255_RED50.710/02/200829.162x
16PSP_007519_1255_RED50.204/03/200829.184 x
17PSP_009879_1255_RED100.404/09/200829.4263x
18PSP_010090_1255_RED100.820/09/200829.4279x
19PSP_010301_1255_RED101.407/10/200829.4295x
20PSP_010446_1255_RED50.818/10/200829.5306x
21PSP_010868_1255_RED50.620/11/200829.5338 x
22ESP_011580_1255_RED50.014/01/200929.6392 x
23ESP_012213_1255_RED25.305/03/200929.7440 x
24ESP_012569_1255_RED25.301/04/200929.7467x
25ESP_013136_1255_RED25.016/05/200929.8511 x
26ESP_017237_1255_RED101.231/03/201030.2152x
27ESP_018516_1255_RED101.009/07/201030.4250x
28ESP_018872_1255_RED100.806/08/201030.4277x
29ESP_019083_1255_RED50.522/08/201030.4293x
30ESP_019439_1255_RED50.519/09/201030.5320 x x
31ESP_019650_1255_RED50.105/10/201030.5335 x
32ESP_019861_1255_RED50.422/10/201030.5352 x
33ESP_020217_1255_RED25.418/11/201030.6378 x
34ESP_020428_1255_RED25.105/12/201030.6395 x
35ESP_020784_1255_RED25.301/01/201130.6421 x x
36ESP_021496_1255_RED25.926/02/201130.7475 x
37ESP_021562_1255_RED25.203/03/201130.7481 x
38ESP_021918_1255_RED25.231/03/201130.8508 x
39ESP_022340_1255_RED25.403/05/201130.8540 x
40ESP_025597_1255_RED100.912/01/201231.2118 x x
41ESP_027364_1255_RED100.628/05/201231.4252x
42ESP_028063_1255_RED50.622/07/201231.5305 x
43ESP_028208_1255_RED50.702/08/201231.5316 x
44ESP_028419_1255_RED25.418/08/201231.5331 x
45ESP_028630_1255_RED50.804/09/201231.5348 x
46ESP_028841_1255_RED50.520/09/201231.5364 x
47ESP_029263_1255_RED25.323/10/201231.6396 x
48ESP_029408_1255_RED25.203/11/201231.6406 x
49ESP_029619_1255_RED25.520/11/201231.6423 x
50ESP_029764_1255_RED25.301/12/201231.6434 x
51ESP_029830_1255_RED51.306/12/201231.7438 x x
52ESP_030120_1255_RED50.729/12/201231.7461 x
53ESP_030186_1255_RED25.403/01/201331.7466 x
54ESP_030542_1255_RED25.431/01/201331.7493 x
55ESP_030898_1255_RED25.228/02/201331.8520 x
56ESP_031755_1255_RED50.905/05/201331.9585 x
57ESP_032533_1255_RED50.905/07/201332.0644 x
58ESP_033456_1255_RED50.615/09/201332.145
59ESP_034089_1255_RED50.603/11/201332.193 x
60ESP_034234_1255_RED50.715/11/201332.2105 x
61ESP_034445_1255_RED100.701/12/201332.2120 x
62ESP_036357_1255_RED101.329/04/201432.4265 x
63ESP_037280_1255_RED50.510/07/201432.5335 x
64ESP_037702_1255_RED25.212/08/201432.5368 x
65ESP_038335_1255_RED26.230/09/201432.6415 x
66ESP_038467_1255_RED25.110/10/201432.6425 x x
67ESP_038797_1255_RED57.205/11/201432.7450 x
68ESP_039153_1255_RED25.403/12/201432.7477 x x
69ESP_039298_1255_RED25.314/12/201432.7488 x
70ESP_043267_1255_RED50.419/10/201533.2120x
71ESP_044678_1255_RED100.906/02/201633.3227x
72ESP_045377_1255_RED50.201/04/201633.4281 x
73ESP_045588_1255_RED50.317/04/201633.4297 x
74ESP_046089_1255_RED51.126/05/201633.5335 x
75ESP_046155_1255_RED50.631/05/201633.5339 x
76ESP_046511_1255_RED25.228/06/201633.5367 x
77ESP_046722_1255_RED25.315/07/201633.6383 x
78ESP_046867_1255_RED25.526/07/201633.6394 x
79ESP_047078_1255_RED25.211/08/201633.6410 x
80ESP_047434_1255_RED25.208/09/201633.7436 x
81ESP_047790_1255_RED50.506/10/201633.7464 x
82ESP_049148_1255_RED51.020/01/201733.8567 x
83ESP_049992_1255_RED51.126/03/201733.9630 x
84ESP_050203_1255_RED25.212/04/201734.0647 x
85ESP_051060_1255_RED50.718/06/201734.143x
86ESP_053895_1255_RED101.225/01/201834.4259 x
87ESP_055240_1255_RED25.209/05/201834.5360 x
88ESP_055939_1255_RED50.303/07/201834.6413 x
89ESP_056493_1260_RED50.415/08/201834.7455 x
90ESP_057192_1255_RED25.108/10/201834.8508 x
91ESP_059236_1255_RED25.417/03/201935.0664x
92ESP_059302_1255_RED25.222/03/201935.0668x
93ESP_063192_1255_RED50.619/01/202035.4295 x
94ESP_063759_1255_RED50.503/03/202035.5337 x x
95ESP_064682_1255_RED50.414/05/202035.6408 x x
96ESP_065381_1255_RED50.307/07/202035.7460 x
97ESP_065869_1255_RED25.115/08/202035.7498 xx
98ESP_066766_1255_RED25.223/10/202035.8565 x
99ESP_069049_1255_RED50.419/04/202136.170x
100ESP_072662_1255_RED50.826/01/202236.5344 x
101ESP_072807_1255_RED50.306/02/202236.5355 x
102ESP_073163_1255_RED50.706/03/202236.6382 x x
103ESP_073440_1255_RED25.827/03/202236.6403 x
104ESP_073585_1255_RED25.108/04/202236.6414 x x
105ESP_073796_1255_RED50.124/04/202236.6430x
106ESP_074007_1255_RED25.410/05/202236.7446 x x
107ESP_074363_1255_RED25.407/06/202236.7473 x x
108ESP_075352_1255_RED25.523/08/202236.8547 x
119ESP_075497_1255_RED25.204/09/202236.8559 x
110ESP_076130_1255_RED50.223/10/202236.9607x

References

  1. Malin, M.C.; Edgett, K.S. Evidence for recent groundwater seepage and surface runoff on Mars. Science 2000, 288, 2330–2335. [Google Scholar] [CrossRef]
  2. Harrison, T.N.; Osinski, G.R.; Tornabene, L.L. Global Documentation of Gullies with the Mars Reconnaissance Orbiter Context Camera (CTX) and Implications for Their Formation [Abstract 2124]. In Proceedings of the 45th Lunar and Planetary Science Conference Abstracts, Lunar and Planetary Institute, The Woodlands, TX, USA, 17–21 March 2014; Available online: https://www.hou.usra.edu/meetings/lpsc2014/pdf/2124.pdf (accessed on 18 November 2024).
  3. Harrison, T.N. Martian Gully Formation and Evolution: Studies from the Local to Global Scale. Ph.D. Dissertation, University of Western Ontario, London, ON, Canada, 2016. Available online: https://ir.lib.uwo.ca/etd/3980 (accessed on 15 November 2024).
  4. Gaidos, E.J. Cryovolcanism and the recent flow of liquid water on Mars. Icarus 2001, 153, 218–223. [Google Scholar] [CrossRef]
  5. Malin, M.C.; Edgett, K.S.; Posiolova, L.V.; McColley, S.M.; Noe Dobrea, E.Z. Present-Day Impact Cratering Rate and Contemporary Gully Activity on Mars. Science 2006, 314, 1573–1577. [Google Scholar] [CrossRef]
  6. Musselwhite, D.S.; Swindle, T.D.; Lunine, J.I. Liquid CO2 breakout and the formation of recent small gullies on Mars. Geophys. Res. Lett. 2001, 28, 1283–1285. [Google Scholar] [CrossRef]
  7. Costard, F.; Forget, F.; Mangold, N.; Peulvast, J.P. Formation of recent Martian debris flows by melting of near-surface ground ice at high obliquity. Science 2002, 295, 110–113. [Google Scholar] [CrossRef]
  8. Gilmore, M.S.; Phillips, E.L. Role of aquicludes in formation of Martian gullies. Geology 2002, 30, 1107. [Google Scholar] [CrossRef]
  9. Khuller, A.R.; Christensen, P.R. Evidence of exposed dusty water ice within Martian gullies. J. Geophys. Res. Planets 2021, 126, e2020JE006539. [Google Scholar] [CrossRef]
  10. Hartmann, W.K.; Thorsteinsson, T.; Sigurdsson, F. Comparison of Icelandic and Martian hillside gullies. In Proceedings of the 33rd Annual Lunar and Planetary Science Conference, Houston, TX, USA, 11–15 March 2002. Abstract No. 1904. [Google Scholar]
  11. Lee, P. Slope Gullies on Devon Island, Canadian Arctic: Possible Analogs for Gullies on Mars and Evidence for Recent Transient Environmental Change on Mars. In Proceedings of the AGU Fall Meeting Abstracts, San Francisco, CA, USA, 6–10 December 2002; Volume 2002, p. P12A-0362. [Google Scholar]
  12. Christensen, P.R. Formation of recent Martian gullies through melting of extensive water-rich snow deposits. Nature 2003, 422, 45–48. [Google Scholar] [CrossRef] [PubMed]
  13. Williams, K.E.; Toon, O.B.; Heldmann, J.L.; McKay, C.; Mellon, M.T. Stability of mid-latitude snowpacks on Mars. Icarus 2008, 196, 565–577. [Google Scholar] [CrossRef]
  14. Shinbrot, T.; Duong, N.H.; Kwan, L.; Alvarez, M.M. Dry granular flows can generate surface features resembling those seen in Martian gullies. Proc. Natl. Acad. Sci. USA 2004, 101, 8542–8546. [Google Scholar] [CrossRef]
  15. Pelletier, J.D.; Kolb, K.J.; McEwen, A.S.; Kirk, R.L. Recent bright gully deposits on Mars: Wet or dry flow? Geology 2008, 36, 211–214. [Google Scholar] [CrossRef]
  16. Dundas, C.M.; McEwen, A.S.; Diniega, S.; Hansen, C.J.; Byrne, S.; McElwaine, J.N. The formation of gullies on Mars today. Geol. Soc. Lond. Spec. Publ. 2017, 467, 67–94. [Google Scholar] [CrossRef]
  17. Treiman, A.H. Geologic settings of martian gullies: Implications for their origins. J. Geophys. Res. 2003, 108, 8031. [Google Scholar] [CrossRef]
  18. Nardi, A.; Piersanti, A. Geomorphologic observations and physical hypothesis on Martian gullies. Ital. J. Geosci. 2022, 141, 245–258. [Google Scholar] [CrossRef]
  19. Mangold, N.; Forget, F.; Peulvast, F.C.J.P. Narrow gullies over high sand dunes on Mars: Evidence for recent liquid flows. In Proceedings of the EGS General Assembly Conference Abstracts, Nice, France, 21–26 April 2002. Abstract 3080. [Google Scholar]
  20. Mangold, N.; Costard, F.; Forget, F. Debris flows over sand dunes on Mars: Evidence for liquid water. J. Geophys. Res. 2003, 108, 5027. [Google Scholar] [CrossRef]
  21. Reiss, D.; Jaumann, R. Recent debris flows on Mars: Seasonal observations of the Russell Crater dune field. Geophys. Res. Lett. 2003, 30, 1321. [Google Scholar] [CrossRef]
  22. Diniega, S.; Hansen, C.J.; McElwaine, J.N.; Hugenholtz, C.H.; Dundas, C.M.; McEwen, A.S.; Bourke, M.C. A new dry hypothesis for the formation of Martian linear gullies. Icarus 2013, 225, 526–537. [Google Scholar] [CrossRef]
  23. Pasquon, K.; Gargani, J.; Massé, M.; Conway, S.J. Present-day formation and seasonal evolution of linear dune gullies on Mars. Icarus 2016, 274, 195–210. [Google Scholar] [CrossRef]
  24. Orosei, R.; Lauro, S.E.; Pettinelli, E.; Cicchetti, A.; Coradini, M.; Cosciotti, B.; Di Paolo, F.; Flamini, E.; Mattei, E.; Pajola, M.; et al. Radar evidence of subglacial liquid water on Mars. Science 2018, 361, 490–493. [Google Scholar] [CrossRef]
  25. Martínez, G.; Renno, N.O. Water and brines on Mars: Current evidence and implications for MSL. Space Sci. Rev. 2013, 175, 29–51. [Google Scholar] [CrossRef]
  26. Christensen, P.R. Water at the poles and in permafrost regions of Mars. Elements 2006, 2, 151–155. [Google Scholar] [CrossRef]
  27. Feldman, W.C.; Boynton, W.V.; Tokar, R.L.; Prettyman, T.H.; Gasnault, O.; Squyres, S.W.; Elphic, R.C.; Lawrence, D.J.; Lawson, S.L.; Maurice, S.; et al. Global distribution of neutrons from Mars: Results from Mars Odyssey. Science 2002, 297, 75–78. [Google Scholar] [CrossRef]
  28. Mitrofanov, I.; Anfimov, D.; Kozyrev, A.; Litvak, M.; Sanin, A.; Tret’yacov, V.; Krylov, A.; Shvetsov, V.; Boynton, W.; Shinohara, C.; et al. Maps of subsurface hydrogen from the high energy neutron detector, Mars Odyssey. Science 2002, 297, 78–81. [Google Scholar] [CrossRef] [PubMed]
  29. Stuurman, C.M.; Osinski, G.R.; Holt, J.W.; Levy, J.S.; Brothers, T.C.; Kerrigan, M.; Campbell, B.A. SHARAD detection and characterization of subsurface water ice deposits in Utopia Planitia, Mars. Geophys. Res. Lett. 2016, 43, 9484–9491. [Google Scholar] [CrossRef]
  30. Rennó, N.O.; Bos, B.J.; Catling, D.; Clark, B.C.; Drube, L.; Fisher, D.; Goetz, W.; Hviid, S.F.; Keller, H.U.; Kok, J.F.; et al. Possible physical and thermodynamical evidence for liquid water at the Phoenix landing site. J. Geophys. Res. Planets 2009, 114, E00E03. [Google Scholar] [CrossRef]
  31. Nardi, A.; Bagiacchi, P.; Piersanti, A. IMD: A Dating Code to Facilitate the Study of Transient Phenomena on the Surface of Mars. Geosciences 2024, 14, 108. [Google Scholar] [CrossRef]
  32. Kroy, K.; Sauermann, G.; Herrmann, H.J. Minimal model for aeolian sand dunes. Phys. Rev. E 2002, E66, 031302. [Google Scholar] [CrossRef]
  33. Smyth, T.A. A review of Computational Fluid Dynamics (CFD) airflow modelling over aeolian landforms. Aeolian Res. 2016, 22, 153–164. [Google Scholar] [CrossRef]
  34. Sherman, D.J.; Zhang, P.; Bae, J.; Butler, R.J.; Baas, A.C. Morphology of barchan dunes on Earth and Mars: Classification and scale-invariance. J. Geophys. Res. Planets 2024, 129, e2024JE008526. [Google Scholar] [CrossRef]
  35. Green, S.I. Wing Tip Vortices. In Fluid Vortices; Fluid Mechanics and Its Applications; Springer: Dordrecht, The Netherlands, 1995; Volume 30, pp. 427–469. [Google Scholar] [CrossRef]
  36. Gierens, K.; Kärcher, B.; Mannstein, H.; Mayer, B. Aerodynamic contrails: Phenomenology and flow physics. J. Atmos. Sci. 2009, 66, 217–226. [Google Scholar] [CrossRef]
  37. Valantinas, A.; Thomas, N.; Pommerol, A.; Karatekin, O.; Lozano, L.R.; Senel, C.B.; Temel, O.; Hauber, E.; Tirsch, D.; Bickel, V.T.; et al. Evidence for transient morning water frost deposits on the Tharsis volcanoes of Mars. Nat. Geosci. 2024, 17, 608–616. [Google Scholar] [CrossRef]
  38. Hernández-Bernal, J.; Sánchez-Lavega, A.; del Río-Gaztelurrutia, T.; Ravanis, E.; Cardesín-Moinelo, A.; Connour, K.; Tirsch, D.; Ordóñez-Etxeberria, I.; Gondet, B.; Wood, S.; et al. An extremely elongated cloud over Arsia Mons volcano on Mars: I. Life cycle. J. Geophys. Res. Planets 2021, 126, e2020JE006517. [Google Scholar] [CrossRef]
  39. Hernández-Bernal, J.; Spiga, A.; Sánchez-Lavega, A.; del Río-Gaztelurrutia, T.; Forget, F.; Millour, E. An extremely elongated cloud over Arsia Mons volcano on Mars: 2. Mesoscale modeling. J. Geophys. Res. Planets 2022, 127, e2022JE007352. [Google Scholar] [CrossRef]
  40. Jouannic, G.; Gargani, J.; Costard, F.; Ori, G.G.; Marmo, C.; Schmidt, F.; Lucas, A. Morphological and mechanical characterization of gullies in a periglacial environment: The case of the Russell crater dune (Mars). Planet. Space Sci. 2012, 71, 38–54. [Google Scholar] [CrossRef]
  41. Jouannic, G.; Gargani, J.; Costard, F.; Marmo, C.; Mangold, N.; Schmidt, F.; Ori, G. Evolution of polygenic debris flows on a sand dune (Russell crater, Mars). In Proceedings of the European Planetary Science Congress, Rome, Italy, 19–24 September 2010; hal-01713649. Available online: https://hal.science/hal-01713649/document (accessed on 10 January 2025).
  42. Jouannic, G.; Conway, S.J.; Gargani, J.; Costard, F.; Massé, M.; Bourgeois, O.; Carter, J.; Schmidt, F.; Marmo, C.; Ori, G.G.; et al. Morphological characterization of landforms produced by springtime seasonal activity on Russell Crater megadune, Mars. Geol. Soc. Lond. Spec. Publ. 2019, 467, 115–144. [Google Scholar] [CrossRef]
  43. Dinwiddie, C.L.; Titus, T.N. Airborne dust plumes lofted by dislodged ice blocks at Russell crater, Mars. Geophys. Res. Lett. 2021, 48, e2020GL091920. [Google Scholar] [CrossRef]
  44. Hecht, M.H. Metastability of liquid water on Mars. Icarus 2002, 156, 373–386. [Google Scholar] [CrossRef]
  45. Vakkada Ramachandran, A.; Zorzano, M.P.; Martín-Torres, J. Experimental investigation of the atmosphere-regolith water cycle on present-day mars. Sensors 2021, 21, 7421. [Google Scholar] [CrossRef] [PubMed]
  46. Nazari-Sharabian, M.; Aghababaei, M.; Karakouzian, M.; Karami, M. Water on Mars—A literature review. Galaxies 2020, 8, 40. [Google Scholar] [CrossRef]
  47. Heldmann, J.L.; Toon, O.B.; Pollard, W.H.; Mellon, M.T.; Pitlick, J.; Mckay, C.P.; Andersen, D.T. Formation of Martian gullies by the action of liquid water flowing under current Martian environmental conditions. J. Geophys. Res.–Planets 2005, 110, E05004. [Google Scholar] [CrossRef]
  48. Ingersoll, A.P. Mars: Occurrence of liquid water. Science 1970, 168, 972–973. [Google Scholar] [CrossRef] [PubMed]
  49. Haberle, R.M.; Mckay, C.P.; Schaeffer, J.; Cabrol, N.A.; Grin, E.A.; Zent, A.P.; Quinn, R. On the possibility of liquid water on present-day Mars. J. Geophys. Res.–Planets 2001, 106, 23317–23326. [Google Scholar] [CrossRef]
  50. Richardson, M.I.; Mischna, M.A. Long-term evolution of transient liquid water on Mars. J. Geophys. Res. Planets 2005, 110, E03003. [Google Scholar] [CrossRef]
  51. Sears, D.W.G.; Moore, S.R. On laboratory simulation and the evaporation rate of water on Mars. Geophys. Res. Lett. 2005, 32, L16202. [Google Scholar] [CrossRef]
  52. Thompson, J. On the Existence and Stability of Liquid Water on the Martian Surface. Inq. Univ. Ark. Undergrad. Res. J. 2003, 4, 24. Available online: http://scholarworks.uark.edu/inquiry/vol4/iss1/24 (accessed on 18 November 2024).
  53. Herny, C.; Conway, S.J.; Raack, J.; Carpy, S.; Colleu-Banse, T.; Patel, M.R. Downslope sediment transport by boiling liquid water under Mars-like conditions: Experiments and potential implications for Martian gullies. Geol. Soc. Lond. Spec. Publ. 2019, 467, 373–410. [Google Scholar] [CrossRef]
  54. Armstrong, J.C.; Titus, T.N.; Kieffer, H.H. Evidence for subsurface water ice in Korolev crater, Mars. Icarus 2005, 174, 360–372, ISSN 0019-1035. [Google Scholar] [CrossRef]
  55. Tsoar, H.; Greeley, R.; Peterfreund, A.R. Mars: The north polar sand sea and related wind patterns. J. Geophys. Res. Solid Earth 1979, 84, 8167–8180. [Google Scholar] [CrossRef]
Figure 1. In the classic gullies scheme [1], three distinct units are recognizable: alcove, channel, and apron. Here, two schematic representations (section view and frontal view) are compared with real cases taken from HiRISE ESP_011727_1490 (NASA/JPL-Caltech/UArizona).
Geosciences 15 00029 g001
Figure 2. This statistic takes into account the HiRISE images shown in Appendix A. The histogram shows the number of images scattered by a given time interval. The time scale is scanned in steps of 5 Martian days (minimum not included).
Geosciences 15 00029 g002
Figure 3. (A) Kaiser Crater and Russell Crater locations on MOLA/MGS topographic mapping. The two boxes are zoomed in (B,C) to highlight the locations of the dunes under investigation within the craters. On the color scale, elevation 0 is yellow.
Geosciences 15 00029 g003
Figure 4. Middle: Barchan dunes in the Kaiser Crater photographed in autumn; (A) magnification of the area bounded by the box; (B) rotated to observe the escarpment in a vertical position; (C) we observe the same gullies on the enlargement of a photo taken during the winter of the same year. Image credits: HiRISE ESP_025900_1330 and ESP_027878_1330 (NASA/JPL-Caltech/UArizona).
Geosciences 15 00029 g004
Figure 5. (A) An ideal barchan dune is characterized, in plan view, by a typical half-moon shape; (B) the dune profile is the result of its moving dynamic; (C) the dune section is a rough inverted wing profile that can produce just those undesired phenomena of a real wing: vortex, turbulence, condensation, and ice formation.
Geosciences 15 00029 g005
Figure 6. (A) Russell Crater in a color scale proportional to elevation. White = elevation 0 (where, theoretically, the average pressure corresponds to the value of the triple point of H2O). Shades of brown for positive elevations and green for negative elevations. (B) Detailed map of the Russell dune with contour lines superimposed on the color scale. The red circle indicates the area that will be studied by means of HiRISE photos.
Geosciences 15 00029 g006
Figure 7. Anomalous gullies on the Russell Crater dunes. Here, the gullies no longer exhibit the classic ACA pattern but that of “linear gullies”. The initial section of the channels (T box) is characterized by a “V” section. The final section (B box) is characterized by a “U” section. Year 29, Sol 47 (early autumn). Image credit: HiRISE PSP_007018_1255 (NASA/JPL-Caltech/UArizona).
Geosciences 15 00029 g007
Figure 8. Zoom-in of some channel terminations on the Russell Crater megadune. This is the same slope of the same dune as in Figure 7 but this photo was taken in year 33, Sol 410 (early spring), and on this occasion, at the termination of 11 channels, very reflective globular bodies are observed. The largest one (second bottom box) was not present in the same channel photographed in Figure 7 (bottom box, second channel from above). Image credit: HiRISE ESP_047078_1255 (NASA/JPL-Caltech/UArizona), resolution: 25.2 cm/pixel.
Geosciences 15 00029 g008
Figure 9. (Left) The relevant area of the Russel dune (see the red circle in Figure 6). In the zoomed images (3 right panels), we can observe that the gullies are affected by macroscopic seasonal changes together with the surrounding areas. In the labels, we specify the Martian year and the local season. In the southern hemisphere, the year begins in autumn (Ls = 0). Image credit: HiRISE PSP_007018_1255; PSP_002482_1255; ESP_030898_1255 (NASA/JPL-Caltech/UArizona).
Geosciences 15 00029 g009
Figure 10. Frost on the dunes of Russell Crater. Photo taken on year 33, Sol 410 (mid-spring)—resolution 25.2 cm/pixel. It is evident that the frost is deposited just below the dune crest, which is where the gullies originate. The four magnifications in the central photo highlight the possible concurrent presence of water in the three phases. In particular, “Vapor” is observed on undulations exposed to the south and “Humidity” on undulations exposed to the pole. Image credit: HiRISE ESP_047078_1255 (NASA/JPL-Caltech/UArizona).
Geosciences 15 00029 g010
Figure 11. Recurrence of three of the transient phenomena observed on the Russell Crater megadune over nine consecutive Martian years. On the X-axis, the Martian years numbered from 28 to 36 following the convention of “The Planetary Society”. In Earth years, it corresponds to a period between 2006 and 2022.
Geosciences 15 00029 g011
Figure 12. This chart shows the full range of transient phenomena observed on the Russell Crater megadune over nine Martian years. The chronology of observed events is projected over the period of a single year. The X-axis expresses time on a scale that is not linear but proportional to the percentage of occurrence of the phenomena over the season.
Geosciences 15 00029 g012
Figure 13. Phase diagrams of CO2 (dashed line) and H2O (solid line) compared over the same pressure and temperature ranges. Solid/liquid transitions in blue, liquid/vapor transitions in red, and solid/vapor transitions in black. The semilogarithmic scale allows comparison of the respective triple points but also the T and P ranges affecting the Earth’s surface (green area) and the Martian surface (orange area). For both environments, a purely indicative scale relates the respective topographic elevations to the pressure variation.
Geosciences 15 00029 g013
Figure 14. Magnification of the Martian box in Figure 13. Projected inside are P and T values measured or estimated in the Russell Crater megadune: daytime (solid line) and nighttime (dashed line) measurements over a Martian year. The spring equinoxes (VEs), summer solstices (SSs), autumn equinoxes (AEs), and winter solstices (WSs) are highlighted. Seasonal labels are plotted only along the diurnal cycle in order to ease following the analemma.
Geosciences 15 00029 g014
Figure 15. Smoky flows observed on one of the few days when ice balls occur. The flow in the SF box is zoomed in the right panel. Year 35, Sol 408 (mid-spring). This is the same portion of the dune that, in Figure 10, appeared 2 years earlier and 2 days apart during the same season. The additional inset on the right shows the enlargement of the head of the smoky flow. Image credit: HiRISE ESP_064682_1255 (NASA/JPL-Caltech/UArizona).
Geosciences 15 00029 g015
Figure 16. This chart is designed to plan future studies on the Russell Crater dune based on past observations. We reported the events falling within the spring interval in Figure 12. Here, the time scale (X-axis) expresses the Martian day (Sol) counted since the beginning of the year. The two lower scales report the corresponding Earth dates for the next two local spring intervals.
Geosciences 15 00029 g016
Figure 17. We show some evident variations occurred between year 32 (A) and year 36 (B). Boxes highlight areas containing traces that have disappeared. Ovals highlight areas containing new traces. Arrows indicate a pair of adjacent gullies whose activity has alternated over time. In red is the head position and trajectory of a “smoky flow” photographed during year 35 (C). Image credits: HiRISE ESP_038335_1255; ESP_073796_1255; ESP_064682_1255 (NASA/JPL-Caltech/UArizona).
Geosciences 15 00029 g017
Figure 18. A perspective reconstruction of the Korolev Crater with the water ice blanket observed by the European Mars Express mission. The blue arrows indicate a hypothetical wind blowing almost in a northerly direction. Image credit: ESA/DLR/FU Berlin (https://www.esa.int/ESA_Multimedia/Images/2018/12/Perspective_view_of_Korolev_crater, accessed on 18 November 2024).
Geosciences 15 00029 g018
Disclaimer/Publisher’s Note: The statements, opinions and data contained in all publications are solely those of the individual author(s) and contributor(s) and not of MDPI and/or the editor(s). MDPI and/or the editor(s) disclaim responsibility for any injury to people or property resulting from any ideas, methods, instructions or products referred to in the content.

