1. Introduction
Natural hazards at operating nuclear power plant sites should be regularly reviewed to account for operational experiences and new scientific evidence. The novel scientific evidence on the hazard phenomena could radically differ from the hazard characterisation considered in nuclear power plants’ design and may question plant safety. For example, there are cases where the faults near or at nuclear sites of operating power plants are revealed to be active in the recent tectonic regime. The first examples of the closure of a plant because of the discovery of an active fault were the Vallecitos BWR (1977) and the Humboldt Bay BWR (1979) in the U.S. [
1]. Operation of the Tsuruga 2 Nuclear Power Plant [
2] has been suspended since 2011 because the activity and capability of the fault beneath the site have yet to be cleared. At Paks Nuclear Power Plant, Hungary, the fault displacement hazard should be evaluated for faults at the site, the Quaternary reactivation of which was revealed recently [
3]. This should be performed according to the International Atomic Energy Agency’s (IAEA) SSR-1 [
4] requirements and safety guide SSG-9 [
5]. The question to be answered is whether the hazard can be neglected based on the “principle of practical elimination”, as defined by the IAEA SSR-2/1 [
6] requirements and by the WENRA guidance [
7]. This means that either the annual probability of non-zero surface displacement should be on the order of magnitude of 10
−7/a, or the measure of the surface displacement at the 10
−7/a hazard level should be insignificant from the point of view of plant safety. The rule of thumb for the safety significance is that a 0.1 m displacement at a 10
−7/a level should not challenge the plant safety [
8,
9]. If the hazard cannot be screened out this way, the plant’s safety should be justified, which is required to continue operations. The plant’s response to the ground displacement should be analysed using probabilistic safety analysis to determine the consequences of the fault displacements [
10]. If the safety cannot be justified, the operation should be terminated, since implementing protective measures is practically impossible in operating nuclear power plants. However, the new foundation design concepts against fault displacements and lifeline protective materials could be implemented in advanced small reactor designs, e.g., [
11,
12].
The procedure for probabilistic fault displacement hazard analysis was set by Youngs et al. in [
13] and by the standard ANSI-ANS-2.30-2015 [
14]. Guidance is provided by the IAEA TECDOC-1987 [
15]. There are two basic options for characterising the fault displacement hazard for a site: displacement-based and earthquake-based approaches. The latter applies the logic of the probabilistic seismic hazard analysis. In particular, for the strike-slip fault, a methodology has been developed in [
16,
17]. A comprehensive study on strike-slip fault displacement modelling has been recently published in [
18]. The method provides the annual rate at which the displacement
d on the fault exceeds a specified amount of
at the site, based on the earthquake rate at the fault,
. For the characterisation of displacement hazard, the probability that the surface rupture will be non-zero and the probability that the surface scarp of fault rupture will hit the site should be calculated. The conditional probability that the surface displacement will exceed a given value should be evaluated according to the magnitude and position of the rupture relative to the fault and the site. Naturally, the empirical certainty for all these probabilities is insufficient. The epistemic uncertainty is usually treated via expert elicitation and the logic tree method.
For a consequent application of the probabilistic fault displacement methodology—as proposed by the International Atomic Energy Agency’s safety guide SSG-9 [
5] and the IAEA TECDOC-1987 [
15] and shown by the case studies published (see, e.g., the International Atomic Energy Agency (IAEA) benchmark study [
19] and Krško site in Slovenia [
20])—essential empirical data are needed first of all, including the fault geometry, activity, slip-rate etc. The IAEA benchmark study [
19] was performed for a site in Japan, where sufficient information was available regarding faults and their activity. The Krško study [
20] is a more relevant example for the Paks site since the Krško site is in the border region of the Pannonian Basin, in the centre of which lies the Paks site. In the Krško study, uncertainties in the lengths of faults, their slip rates and maximum magnitudes, and the models used to predict on-fault and off-fault displacement were assessed and included in the logic tree. The slip rates were evaluated based on the age and offset of marker horizons. The logic tree framework was used to represent the fault slip rates and their uncertainties. The maximum magnitudes were calculated using an empirical formula based on the rupture length and area.
In the case of the Paks site in Hungary, the possibility of the Quaternary reactivation of the faults at the site and in its vicinity has been disputed for nearly 100 years. In 2016, full-scope site investigations were performed for a new plant at the same site, including accurate mapping of the faults, extensive paleo-seismic investigations, and trenching over the mapped fault that crosses the site. The trenching at the site area provided evidence for some liquefaction-induced ground failure of the soil profile, which happened about 20 ka ago and was repeated with a time gap of about 1 ka [
21,
22]. Unfortunately, this information is insufficient for quantitatively evaluating fault activity. Moreover, there are no recorded historical or instrumental earthquakes around the site. Despite this, according to nuclear regulations, one objection to a surface displacement already obliges the evaluation of the fault displacement hazard. If needed, safety should be justified for consequences of surface displacement, and if it is required, safety measures should be taken without delay (Delaying safety improvement action led to the tragedy of the Fukushima Daichi Plant [
23]). This motivates the development and application of methods for hazard evaluation, which compensate for the insufficiency of empirical data via conservative engineering assumptions and allow proper and in-time decisions in favour of safety.
If the available data do not allow a consequent fault displacement hazard analysis, the IAEA SSG-9 (Rev. 1) [
5] para 4.20 guidance could be advised. According to this, for those seismic sources for which few earthquakes are registered in the compiled geological and seismological databases, the regional seismic source’s parameters could be used to define coefficients
a and
b in the magnitude–frequency relationship. Interpreting this advice, in the studies [
3,
24], a simplified conservative fault displacement hazard evaluation method was developed utilising the hazard disaggregation of the probabilistic seismic hazard analysis (PSHA) performed for the Paks site.
Other efforts have been made to develop simplified methods to evaluate fault displacement. In [
25,
26], a probabilistic fault displacement hazard evaluation methodology was developed for the fault crossing a lifeline.
This paper develops and applies a method for conservatively evaluating the average principal fault surface displacement for the Paks site in Hungary. The fault’s activity is assessed based on the activity of area sources in the PSHA modelling, to compensate for data insufficiency. Contrary to the Krško study [
20], this approach is more appropriate since the options for the maximum magnitude of the fault are data-based and evaluated using earthquake records. Since the faults are accurately mapped, the uncertainty of the fault is neglected. For example, in [
25,
26], it is accounted for that the study fault crosses the site. However, contrary to [
25,
26], a uniform distribution of the rupture along the fault is assumed, and the dependence of the displacement on the relative position of the rupture to the site does not need to be considered. The total probability theorem in the study is used for the non-zero surface displacement and the mean annual probability of exceedance for average displacement. The hazard curve obtained by the newly proposed method is compared to those calculated earlier for the same site and fault [
3].
2. Tectonic and Seismological Information for Surface Displacement Hazard Evaluation
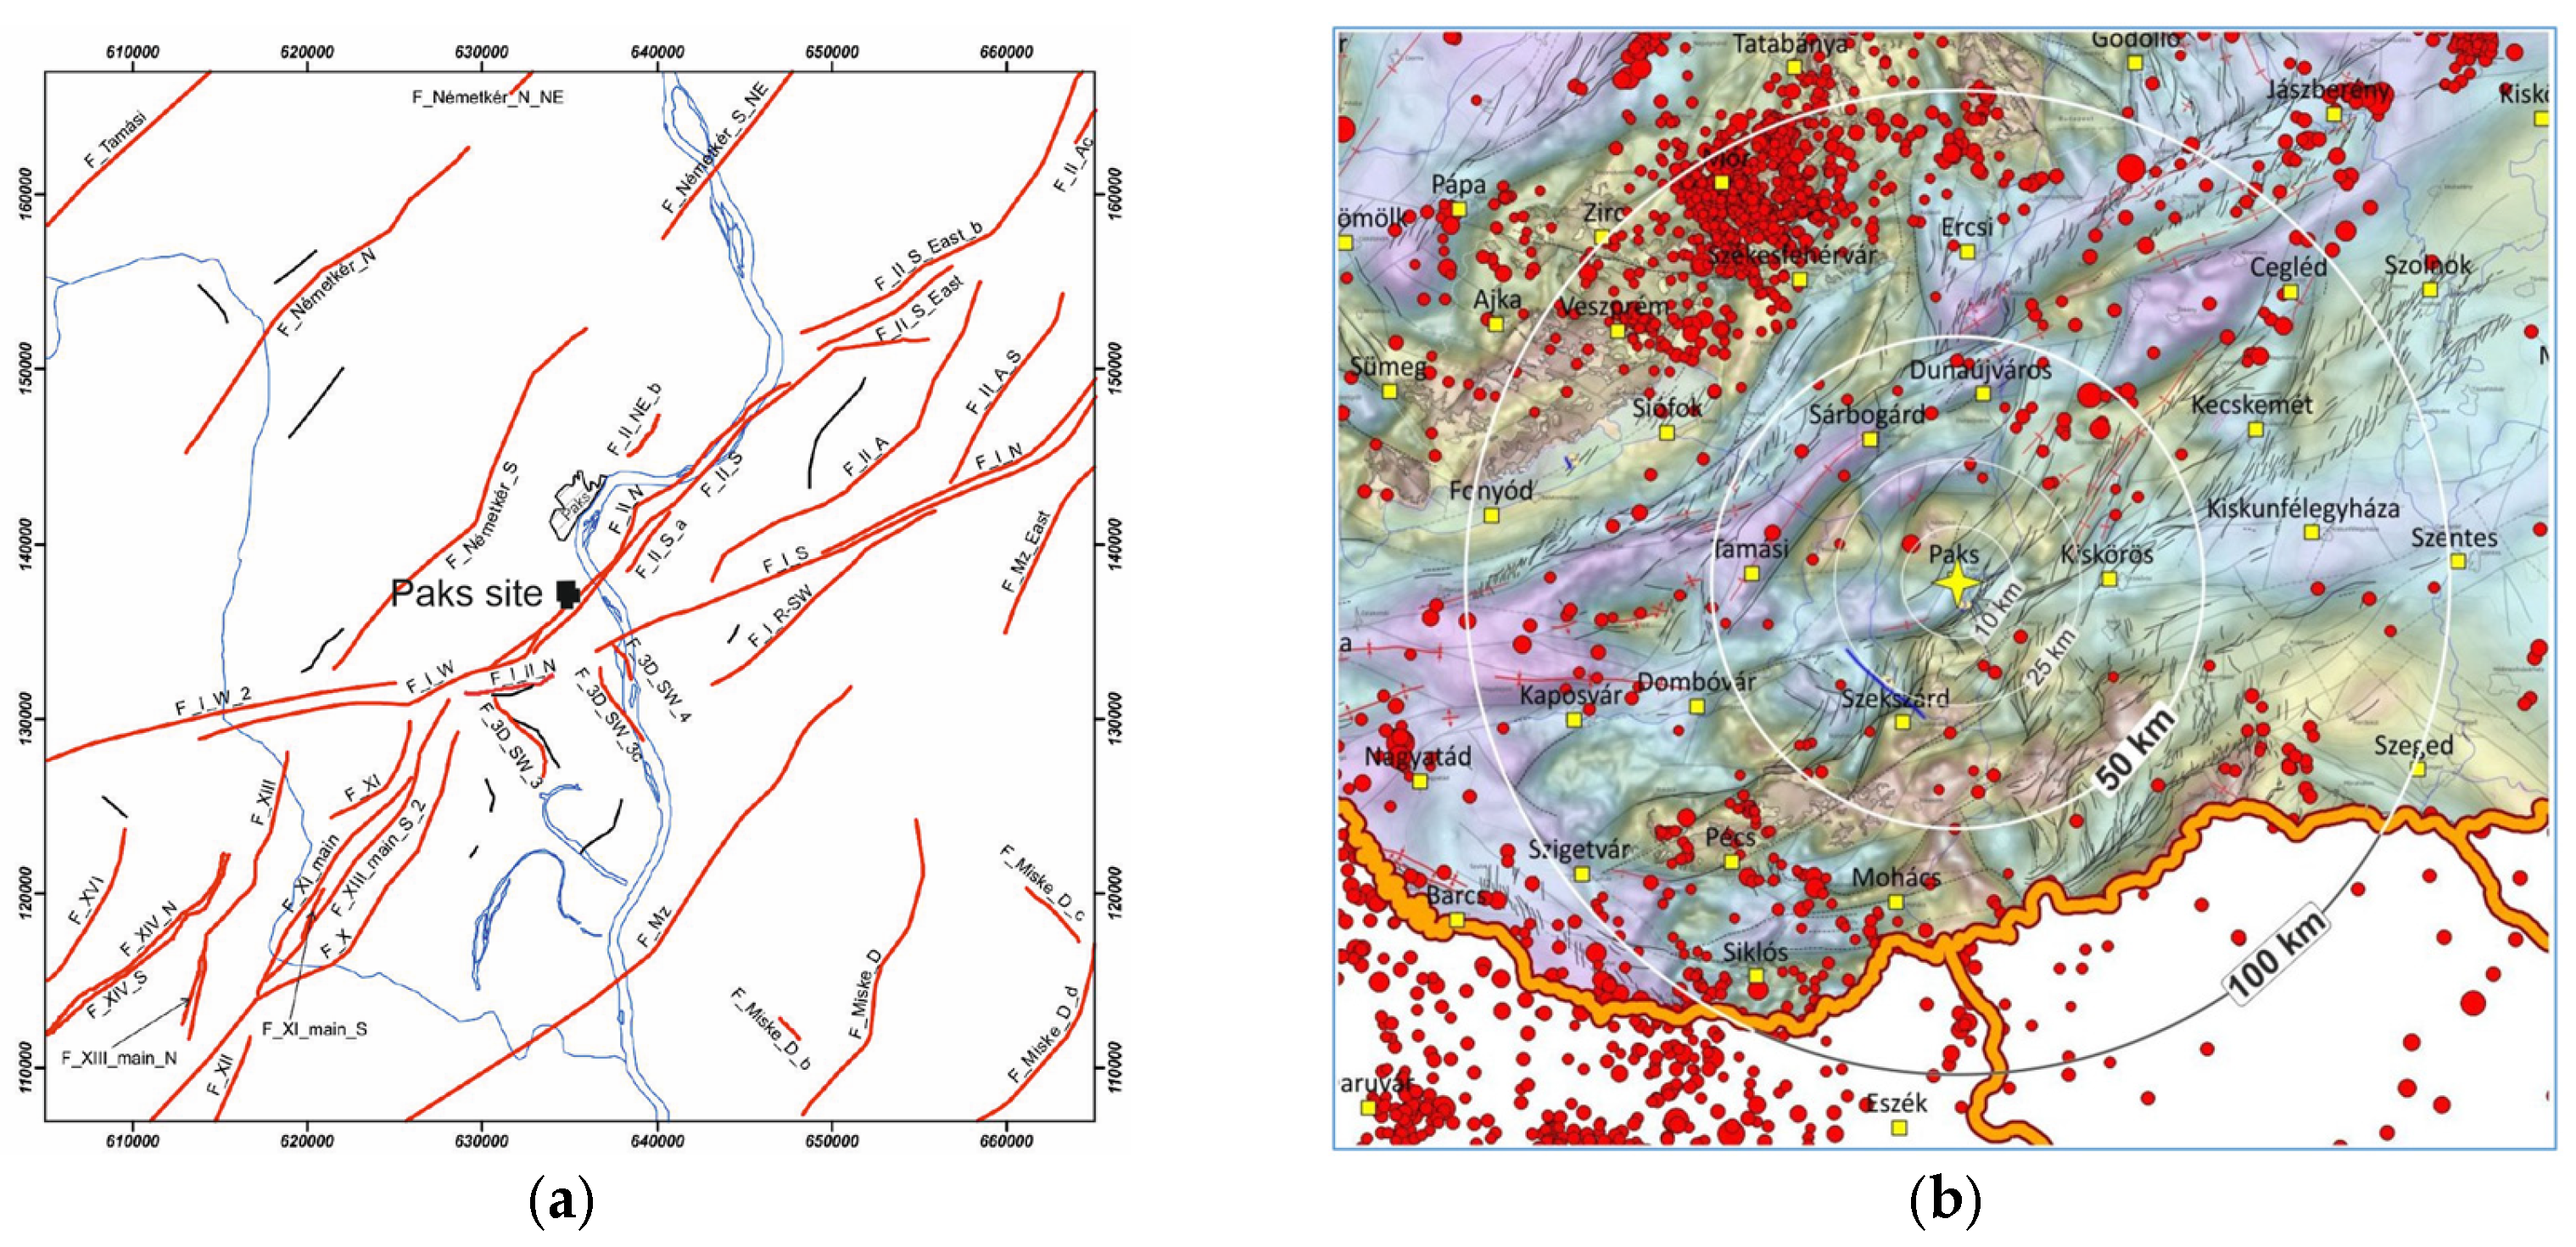
In the case of the Paks site in Hungary, the possibility of the Quaternary reactivation of strike-slip faults at the site was disputed for nearly 100 years. The faults were mapped based on 2D and 3D seismic surveys. The fault traces are shown in
Figure 1a (see also in [
3,
21,
22]). The S-W end of the fault F_II_N crosses the site, and F_II_S is close to the site. The trenching at the site area provided evidence for some liquefaction-induced ground failure of the soil profile, which happened about 20 ka ago and was repeated with a time gap of about 1 ka. The earthquake’s environmental effects were interpreted here using IAEA TECDOC-1767 [
27]. Reconstituting the late Pleistocene geotechnical conditions, these paleo-liquefaction manifestations indicate magnitudes of 4 <
Mw < 5; see [
28]. Surface displacements should not be observed since the displacements were accommodated within thick, loose sediments near the surface. Based on the environmental effects of earthquakes found in the trenching, the faults F_II_N and F_II_S, which are part of the Dunaszentgyörgy–Harta fault zone, were concluded to have been reactivated in the Quaternary period. Paleoseismic investigations in the near regional area (≈25 km in radius) showed similar environmental effects of Quaternary activity. For the completeness of the picture, there are no historical or instrumental records of earthquakes in the site vicinity area; see
Figure 1b. The micro-seismic monitoring, which has been running for 30 years, does not indicate activity, and the GPS monitoring does not show a deformation tendency either. The basic information on the geology, neotectonics, and seismicity of the mid-Pannonian region and the site vicinity area is given in [
3,
21,
22,
24,
29]. The mapped lengths of these faults (
LF) are 26.85 and 27.9 km, respectively. According to the site investigations, the depth and thickness of the seismogenic layer are approximately 12.5 km and 9 km, respectively. The entire area is covered by Pannonian and Quaternary sediments.
According to our concept, the PSHA modelling will be used to characterise fault activity. The seismotectonic modelling for the probabilistic seismic hazard analysis has a 40-year history, starting with seismic hazard re-evaluation in the mid-1980s, updates made in the frame of periodic safety reviews in 1997, 2007, and 2017, and the post-Fukushima stress test in 2011. A full-scope site investigation was completed in 2016 for a new nuclear power plant at the same site. Three models of area sources were composed in the PSHA [
3,
30]. The models cover the area from the Adria and Balkan, extending east to the Vrancea regions. The parameters of the area sources considered are shown in
Table 1.
The M1 model was formed by Hungarian experts, and the SHARE model is based on international research efforts [
31]. The third model is the modified SHARE model, where SHARE zone-04 is split by the Hungarian experts into zones 04A and 04B to better account for the mid-Hungarian fault system. This is based on the newest interpretation of the neotectonics of the Pannonian Basin [
21,
29], and on the experience of seismotectonic modelling [
30].
For the characterisation of the site vicinity faults, those area sources that include the site were considered.
The activity of each area source is defined by the maximum magnitude Mu, the total annual rate of earthquakes , and the slope of the magnitude–frequency distribution estimated by four different methods: Least_Squares_variable_b, Least_Squares_fixed_b, Max_Likelihood_variable_b, and Max_Likelihood_fixed_b.
Based on the earthquake data, the maximum magnitude
Mu, the total annual rate of earthquakes
, and the slope of the magnitude–frequency distribution
were also defined for the area covering the Pannonian Basin (45.5–49.0 N 16.0–23.0 E, 206,117 km
2) and for the site vicinity area 31,400 km
2); see
Table 2.
In total, 18 options can be considered for evaluation of the fault activity. This seems more convincing compared to development of the fault parameters via scaling relationships and the use of fault length and area as inputs, as was performed in [
20]. Nevertheless, a similar cross-check was also made for the studied fault since the accurately mapped fault length and the knowledge of the seismogenic layers’ thicknesses allow us to assess the maximum magnitude assuming a rupture along the entire length of the fault.
Assuming the maximum rupture length is equal to the mapped length of the fault, the maximum magnitude can be calculated, for example, by the empirical formulas published in [
32,
33,
34,
35]. All these formulas have the same form:
Parameters
a and
b differ slightly as defined by different authors. For example, in [
31], the values
a = 4.25 and
b = 1.667 are suggested for the stable continental region and strike-slip faults. Using these parameters, the length
corresponds to
Mw = 6.7. Using the parameters of other authors, the bounding value of
Mw ≤ 6.7 is obtained for maximum magnitude.
The maximum possible rupture area could be
A ≅ 240 km
2. Using the “rupture area—magnitude” correlations of [
33] or [
36], the maximum possible rupture area indicates a magnitude
Mw ≤ 6.4 for both the F_II_N and F_II_S faults.
The maximum magnitudes in
Table 1 and
Table 2 could be considered realistic estimations for the maximum magnitude of the fault at the site.
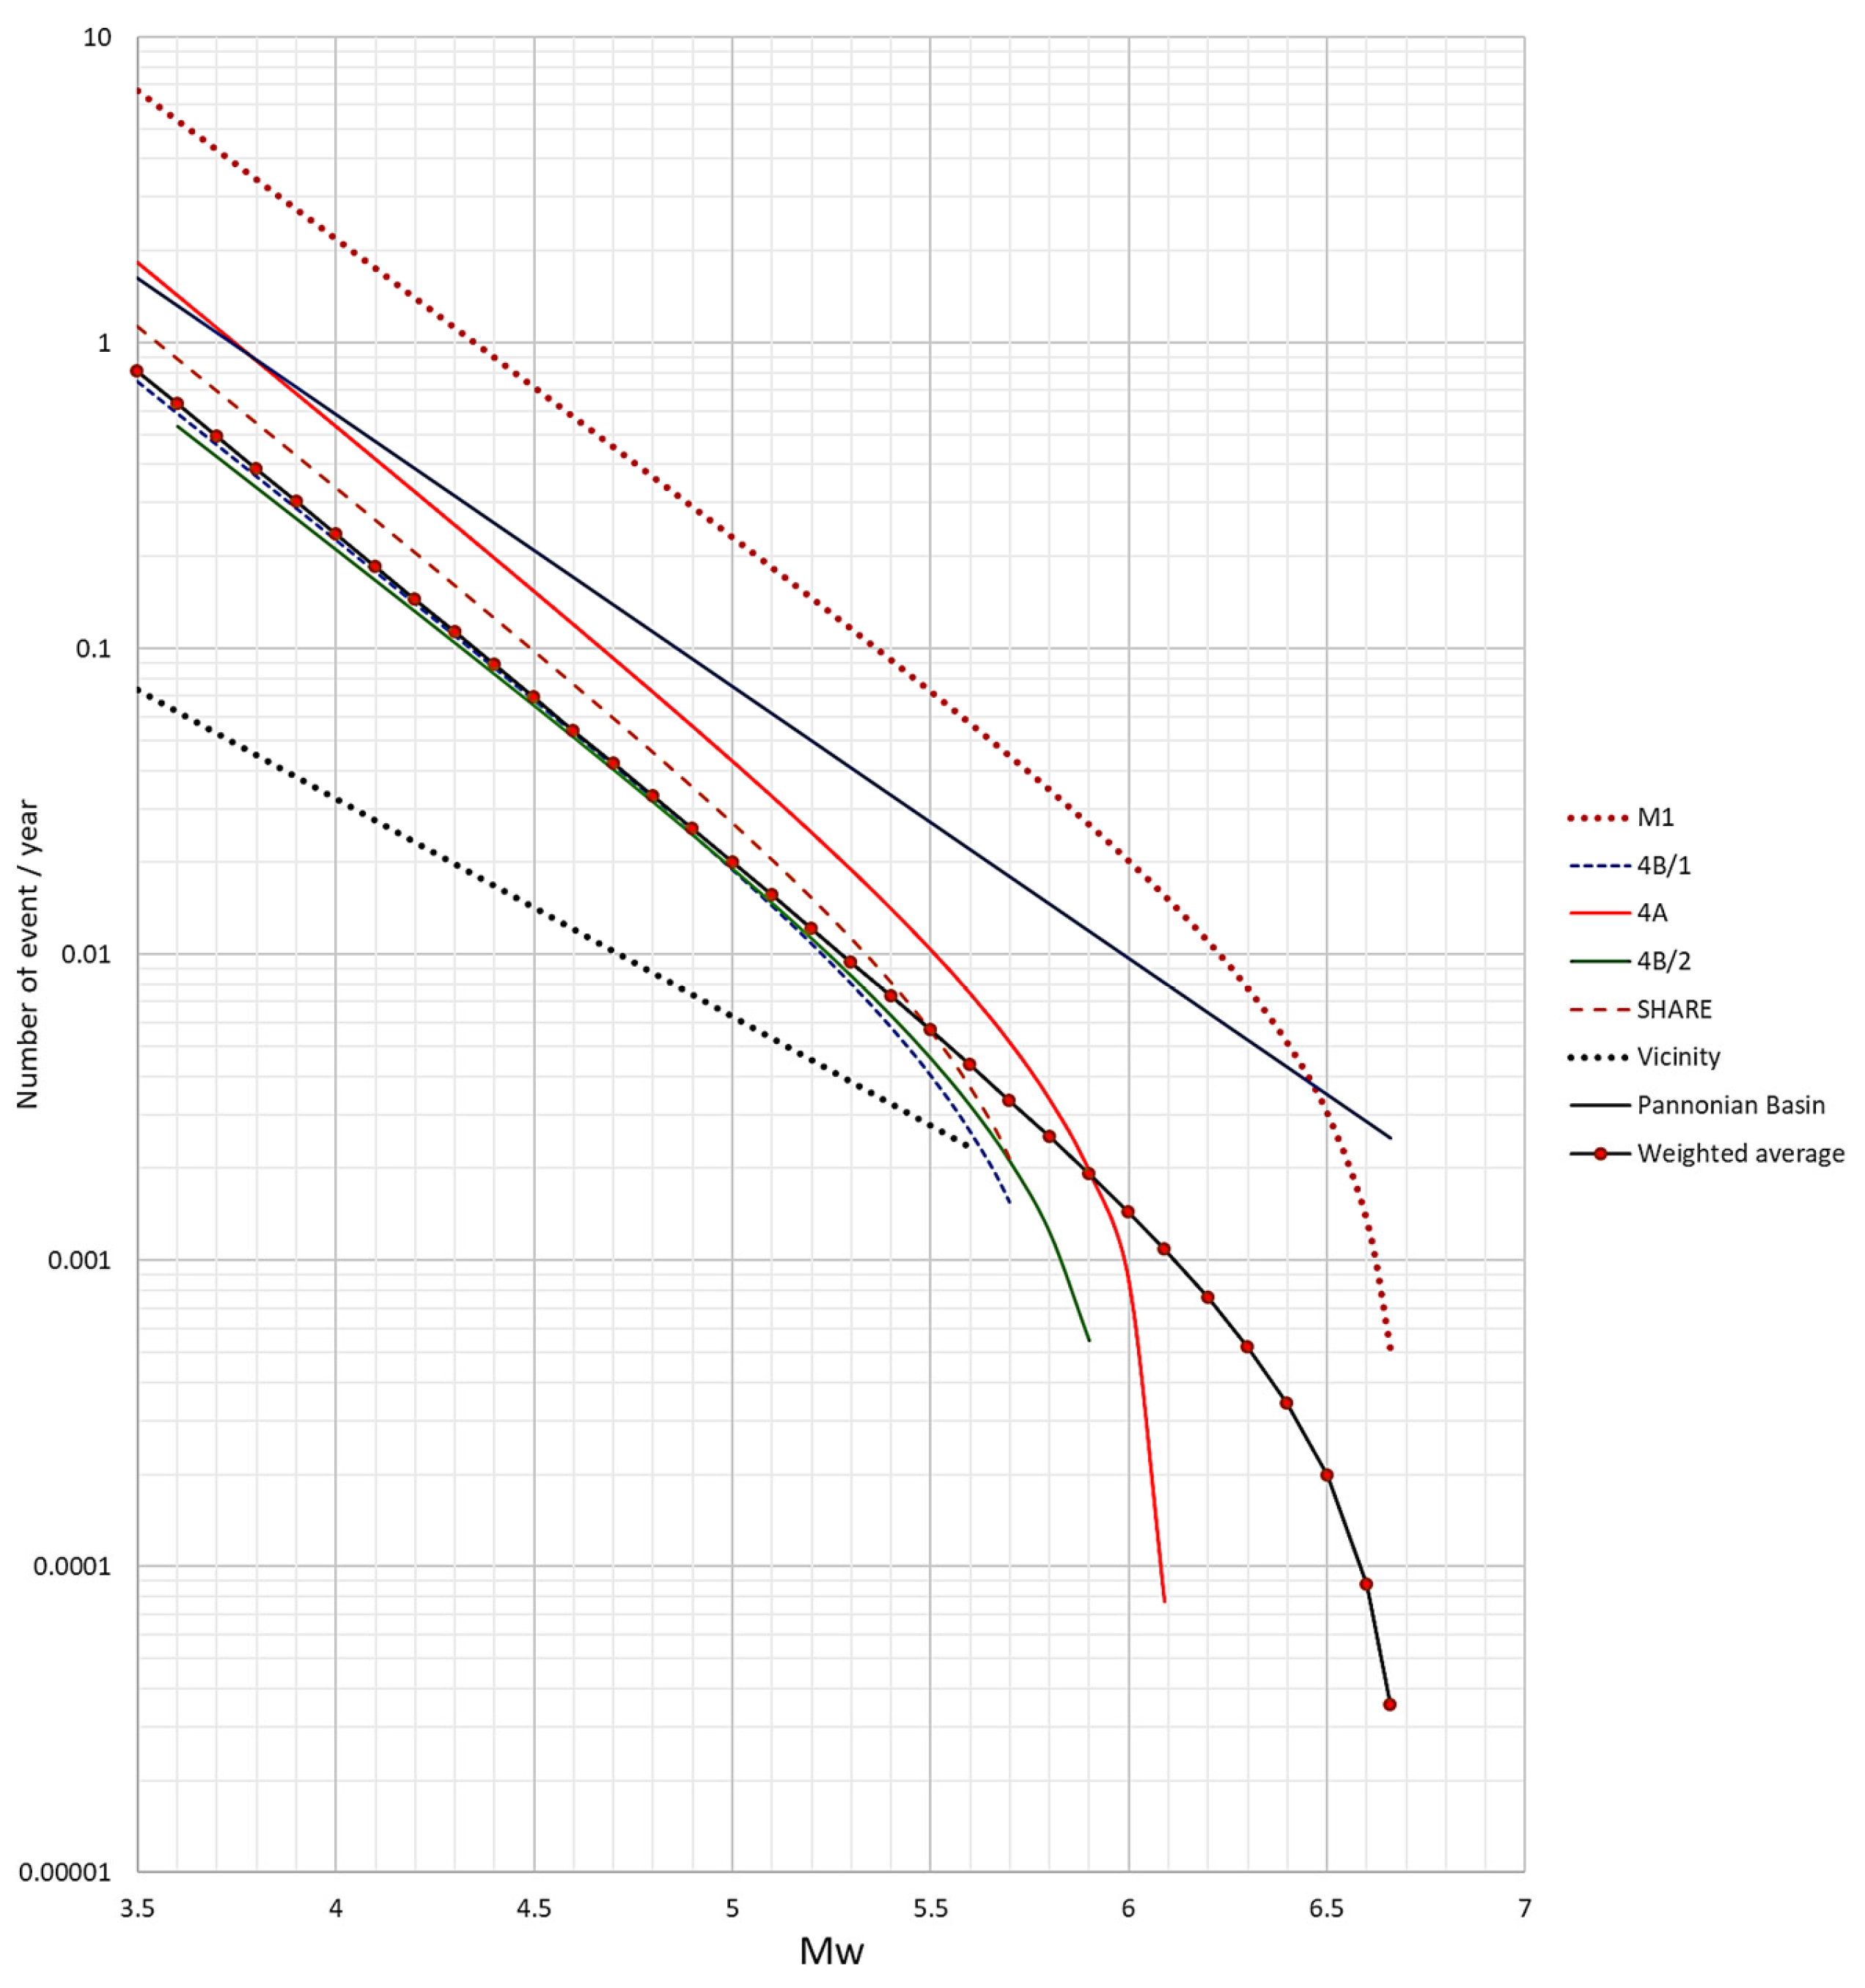
For further consideration, the magnitude–frequency curves are plotted in
Figure 2.
4. Results and Discussion
4.1. Fault Activity
In
Table 1 and
Table 2, there are 18 options for defining the parameters for fault activity:
and
, where
b is the slope in Gutenberg–Richter relation. A clear concept should be followed to evaluate the weighted average, even though the definition of the weights is a matter of expert consideration and judgment. The weights of the options should be defined based on the geometrical proximity of the area sources to the fault rupture trace since the observed surface ruptures are at a short distance from the mapped fault trace [
16]. Fault displacement is a phenomenon that manifests at short distances. The principal fault displacement manifests at a maximum of 100 m from the mapped fault line. The distributed fault displacement decreases exponentially with the distance from the fault [
16]. Contrary to these, distant earthquakes can have a significant contribution to the site’s seismic hazard since the seismic waves travel long distances, causing ground motion at distant locations. For the definition of the weights of the area sources, the following aspects should be considered:
In Model M1, the site is in the background area, which practically lacks local relevance and does not characterise the local activity of the faults considered. The same is valid for the region that almost covers the Pannonian Basin.
The site vicinity earthquake data can provide a more reliable estimation of the fault activity. However, the uncertainty should be significant due to the low number of events.
The study fault is part of the mid-Pannonian fault system. The area sources 04 in the SHARE model and the 4A and 4B sources in the SHARE-Revised model should have essential weight in the activity estimation, which overlaps with the mid-Pannonian fault system.
The weights assigned to the models are shown in
Table 3.
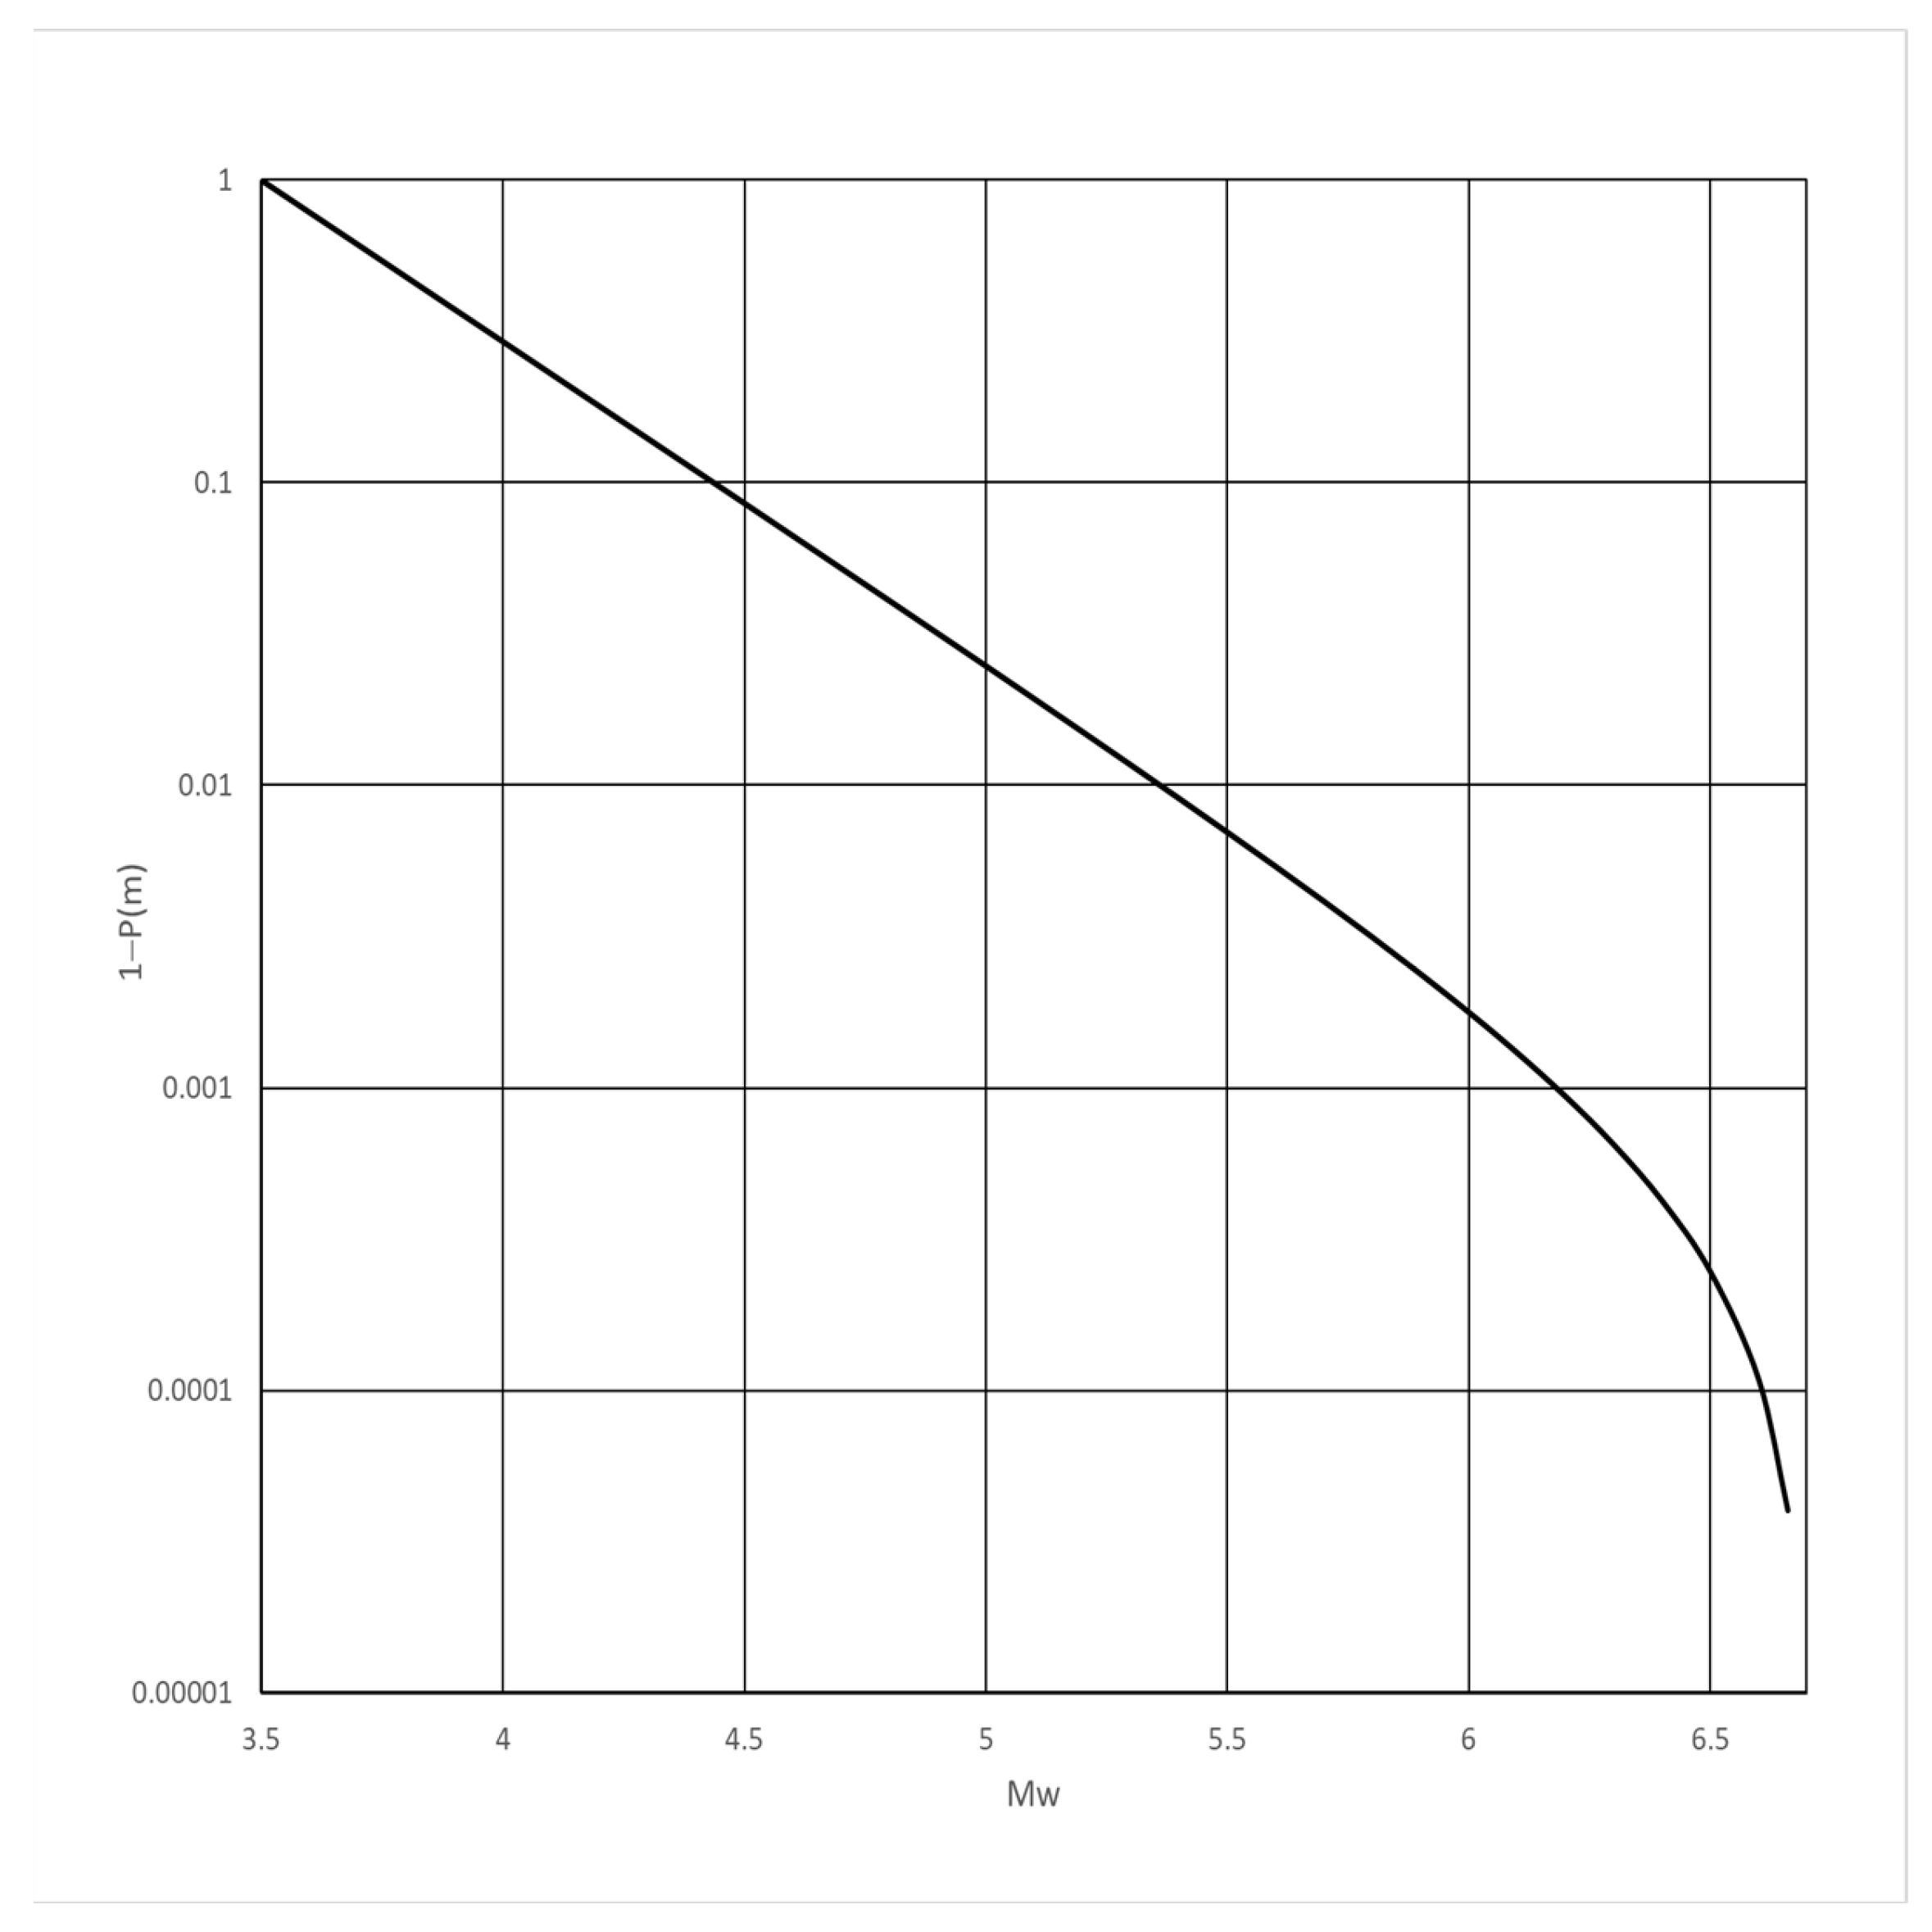
Figure 2 shows the weighted average magnitude–frequency estimation. The complementary probability distribution for magnitudes is shown in
Figure 4.
The parameters of the Gutenberg–Richter relation are
and
,
and
. It should be noted that the maximum magnitude of the weighted average magnitude–frequency relation is equal to the estimation using the formula of [
34].
4.2. Probability of Non-Zero Surface Rupture
Table 4 shows the mean values of the parameters
a and
b, which were defined by different authors and used in recent calculations of
.
The weights of the different formulas were selected considering the novelty of the publication and the data used to develop the empirical relations.
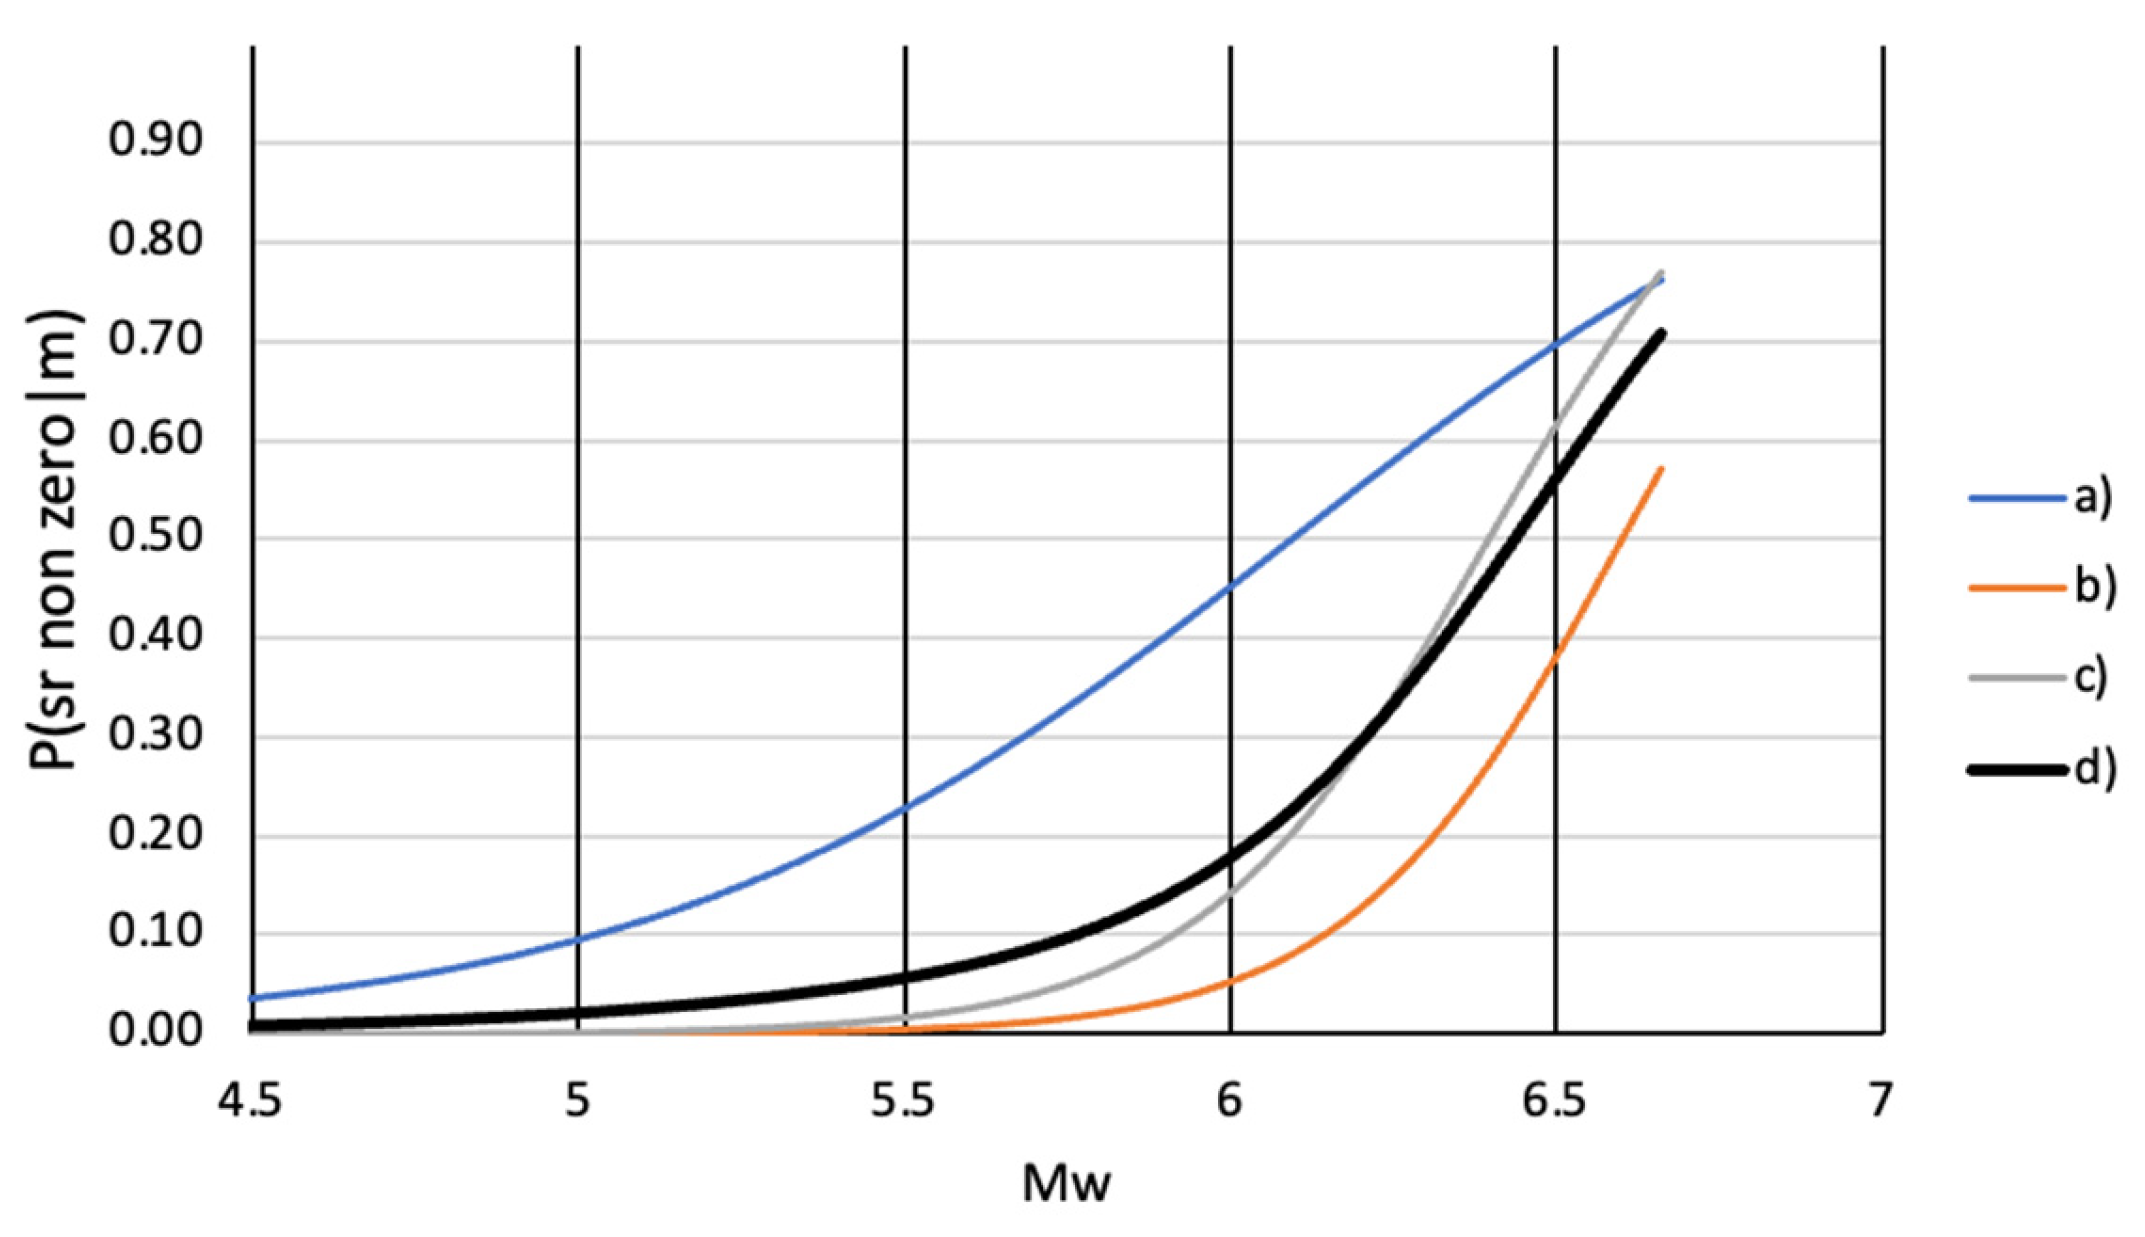
The realisations of the conditional probability
are shown in
Figure 5.
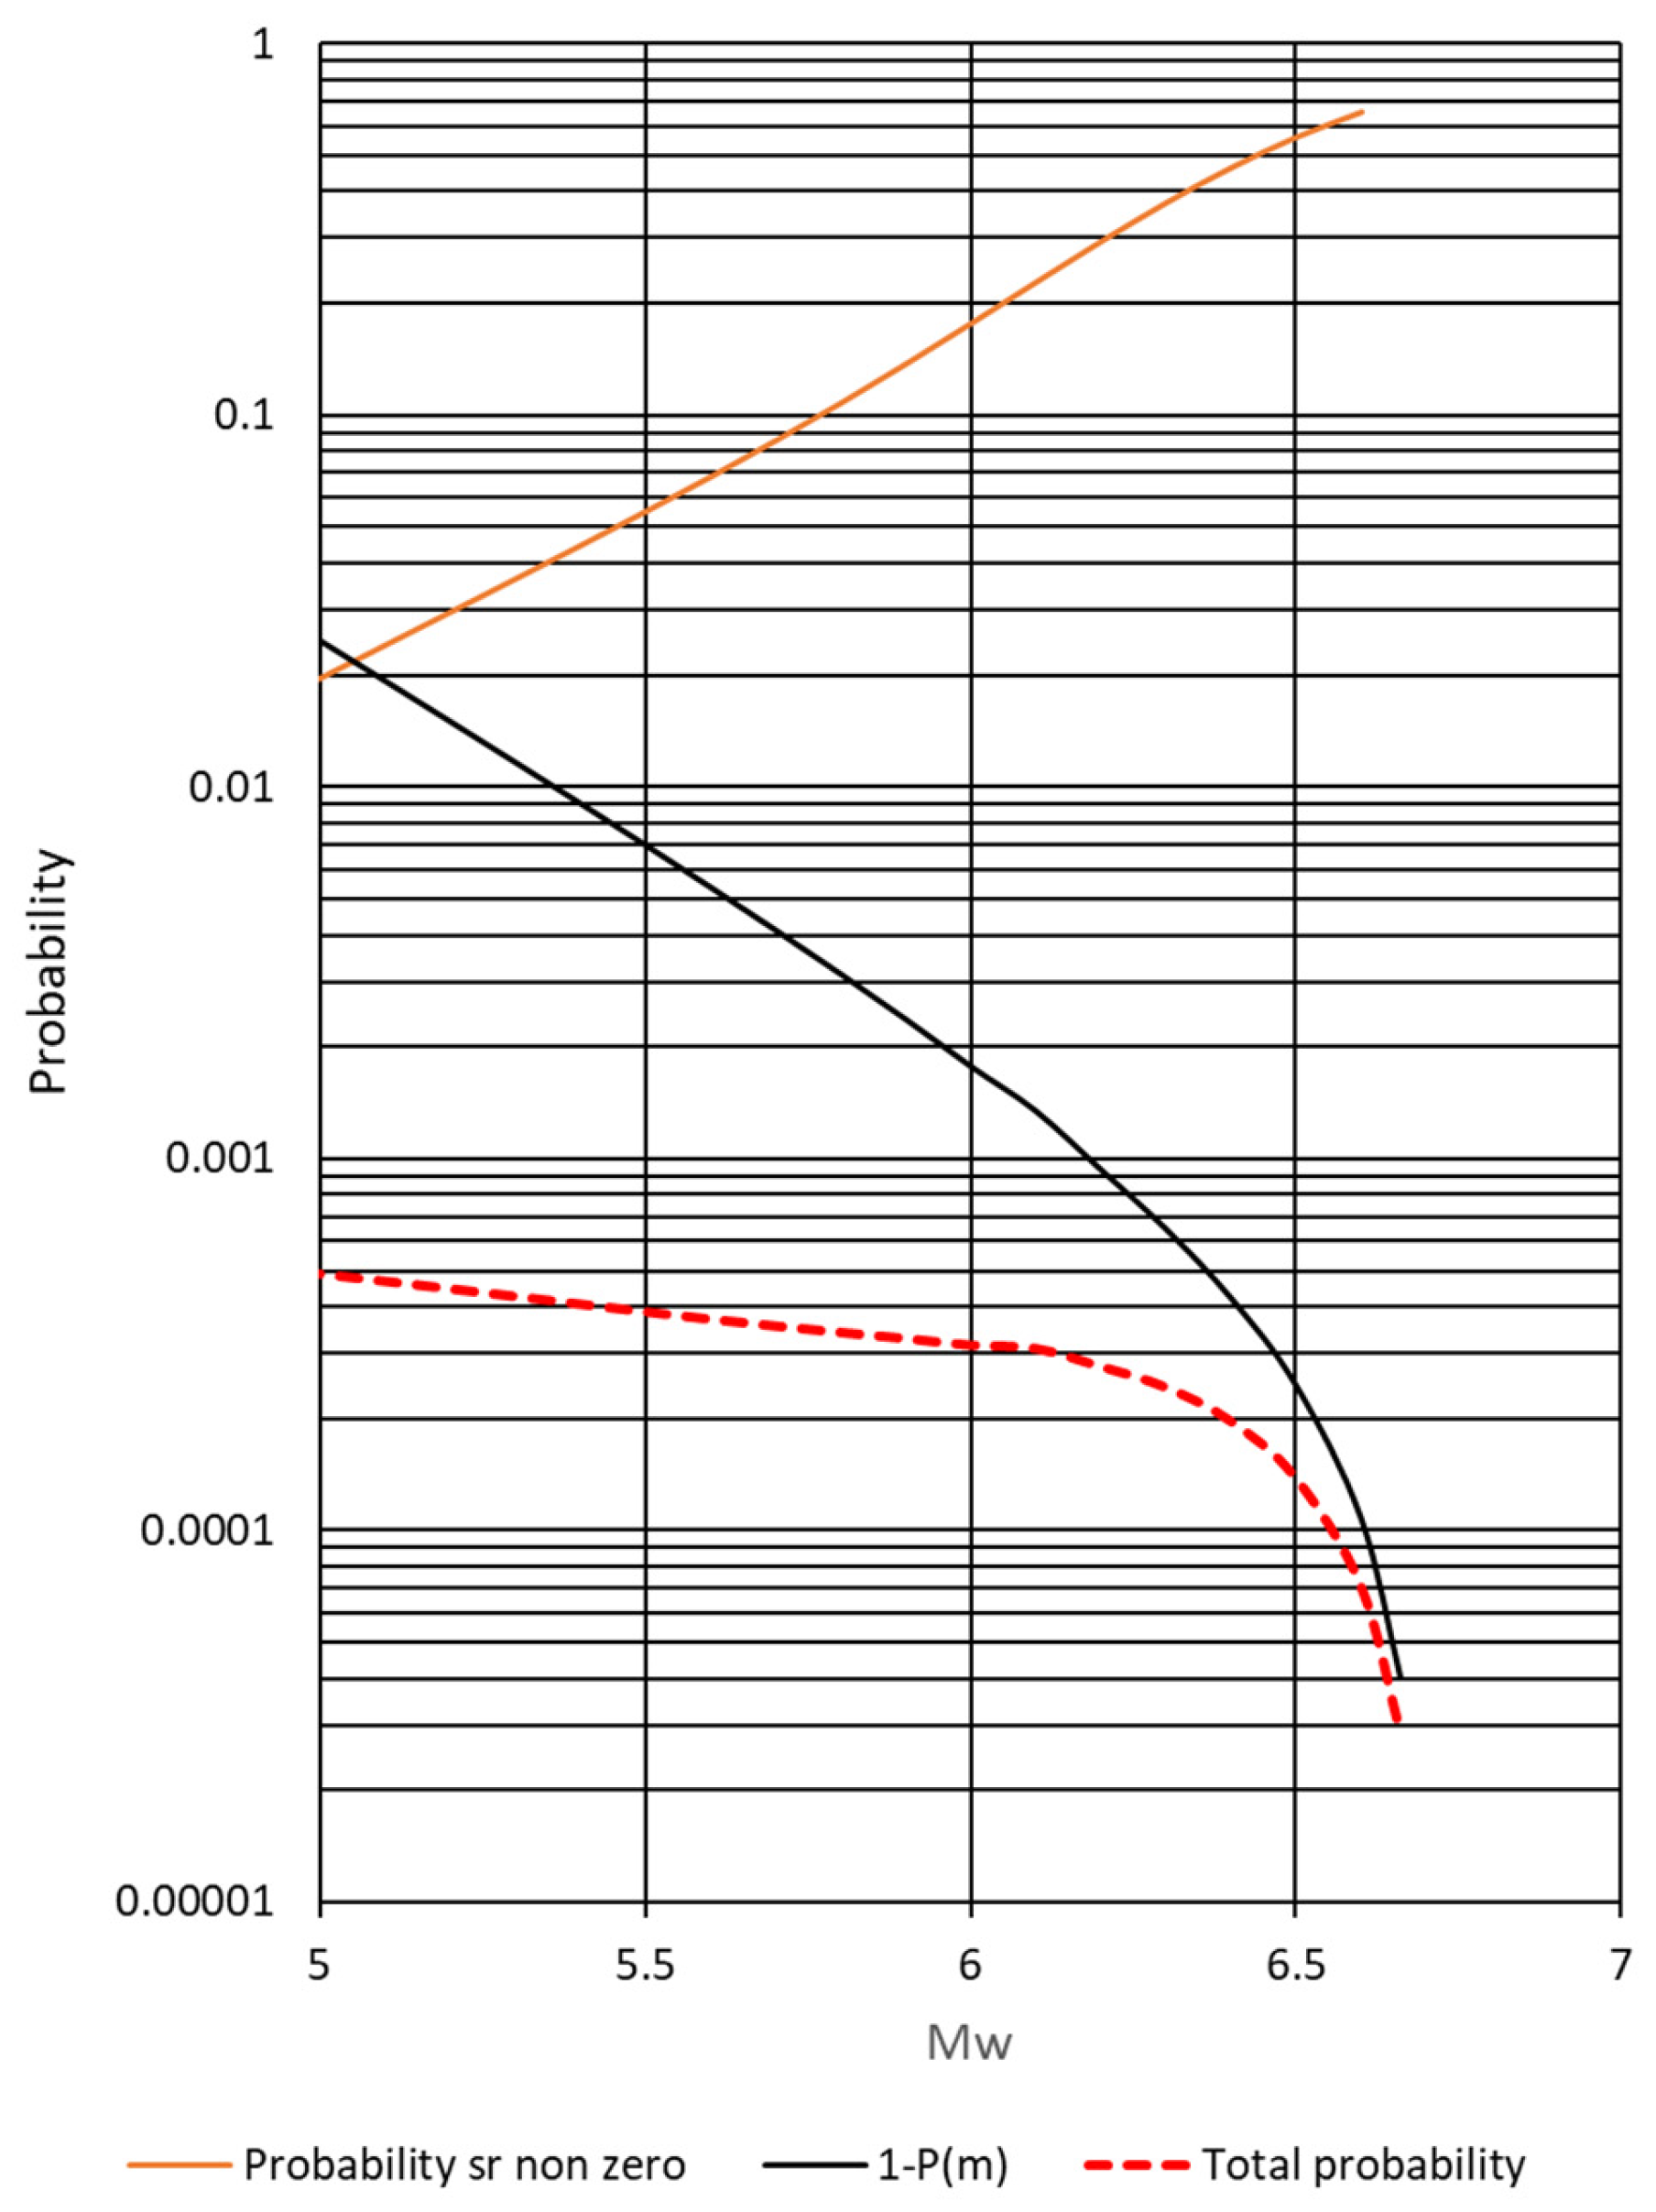
The
was evaluated using the averages of the conditional distribution of non-zero displacement and the magnitude distribution,
Figure 6.
4.3. The Probability of the Surface Rupture Intersecting the Site
The surface rupture length is either correlated with the magnitude or derived from the subsurface rupture length. The study [
30] gives a direct
SRL magnitude scaling formula (Table 2A in [
30]). Since this is a relationship directly derived from the observations, higher weight is associated with it.
In [
34], it is found that the
up to
RL ≅ 15 km rupture lengths and 1:1 above, where the rupture length
RL can be calculated via the formula in Table 4 of [
32]. In [
23], a simple relation is applied:
, where the
RL is calculated via the scaling formula for subsurface rupture length [
33]. The scaling formula for subsurface rupture length developed in [
35] can also be used to calculate
SRL. However, the mixed use of empirical formulas may result in undefined uncertainty.
The weights of used correlations are shown in
Table 5.
The distributions of the length of the surface scarps of fault rupture, as calculated by the scaling formulas of different authors, are shown in
Figure 7.
Figure 8 shows the probability distribution of surface displacement intersecting the site, conditioned upon the magnitude.
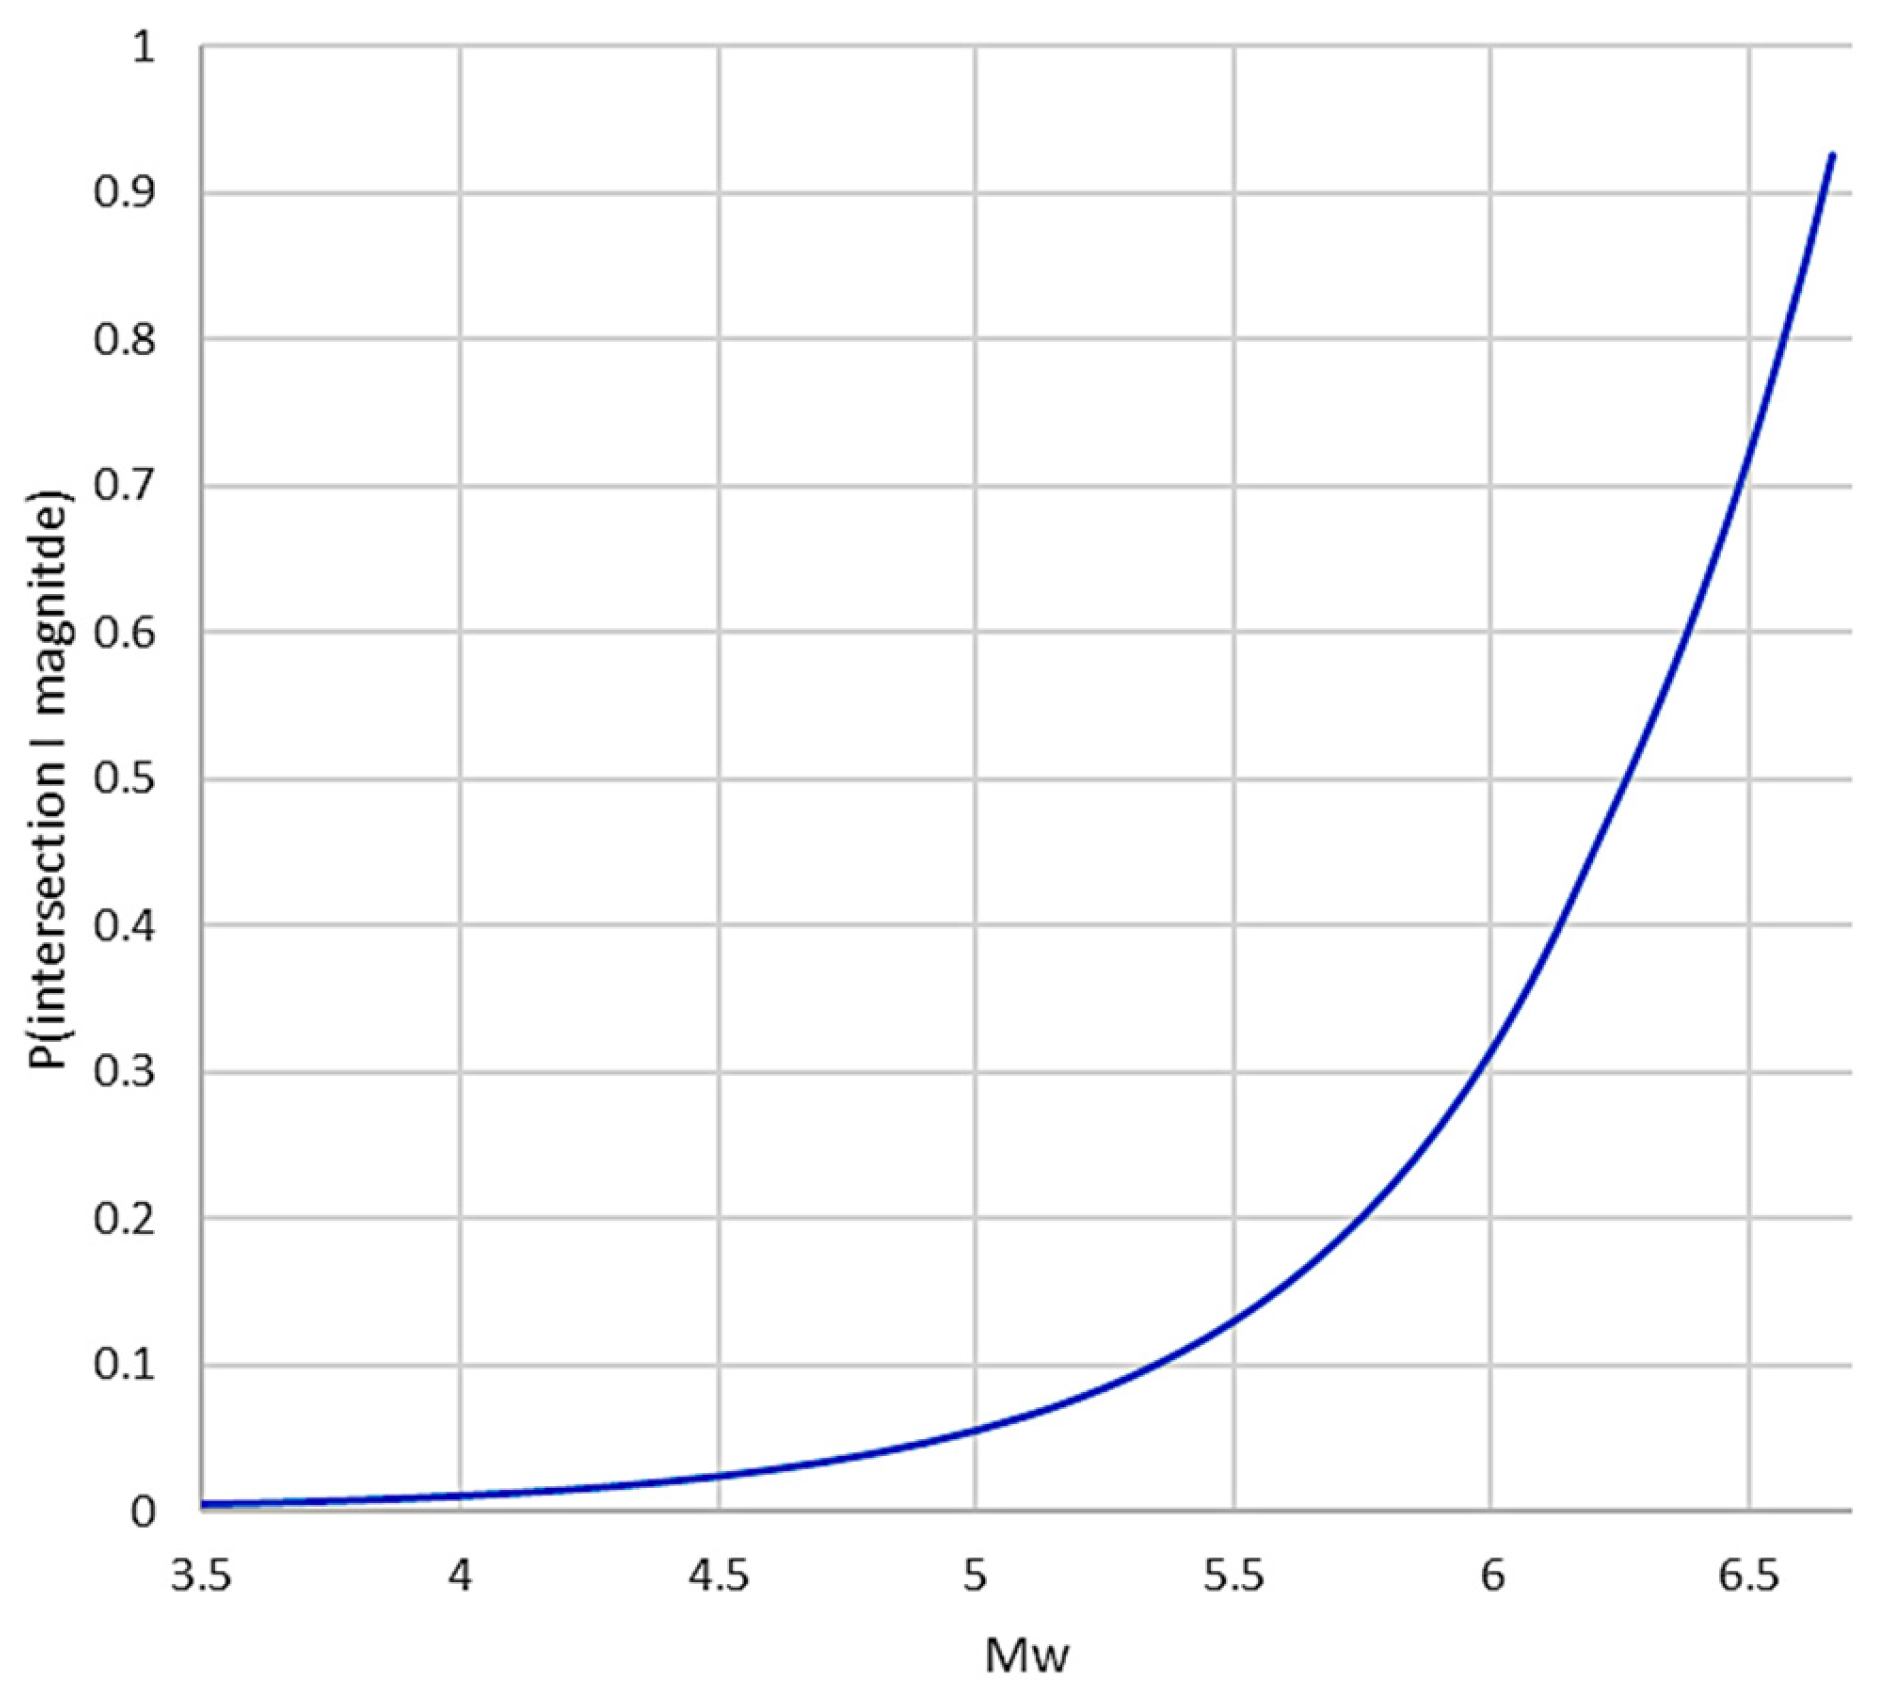
The distribution of the total probability for the intersection of the site is plotted in
Figure 9.
4.4. Evaluation of the Probability of Average Displacement
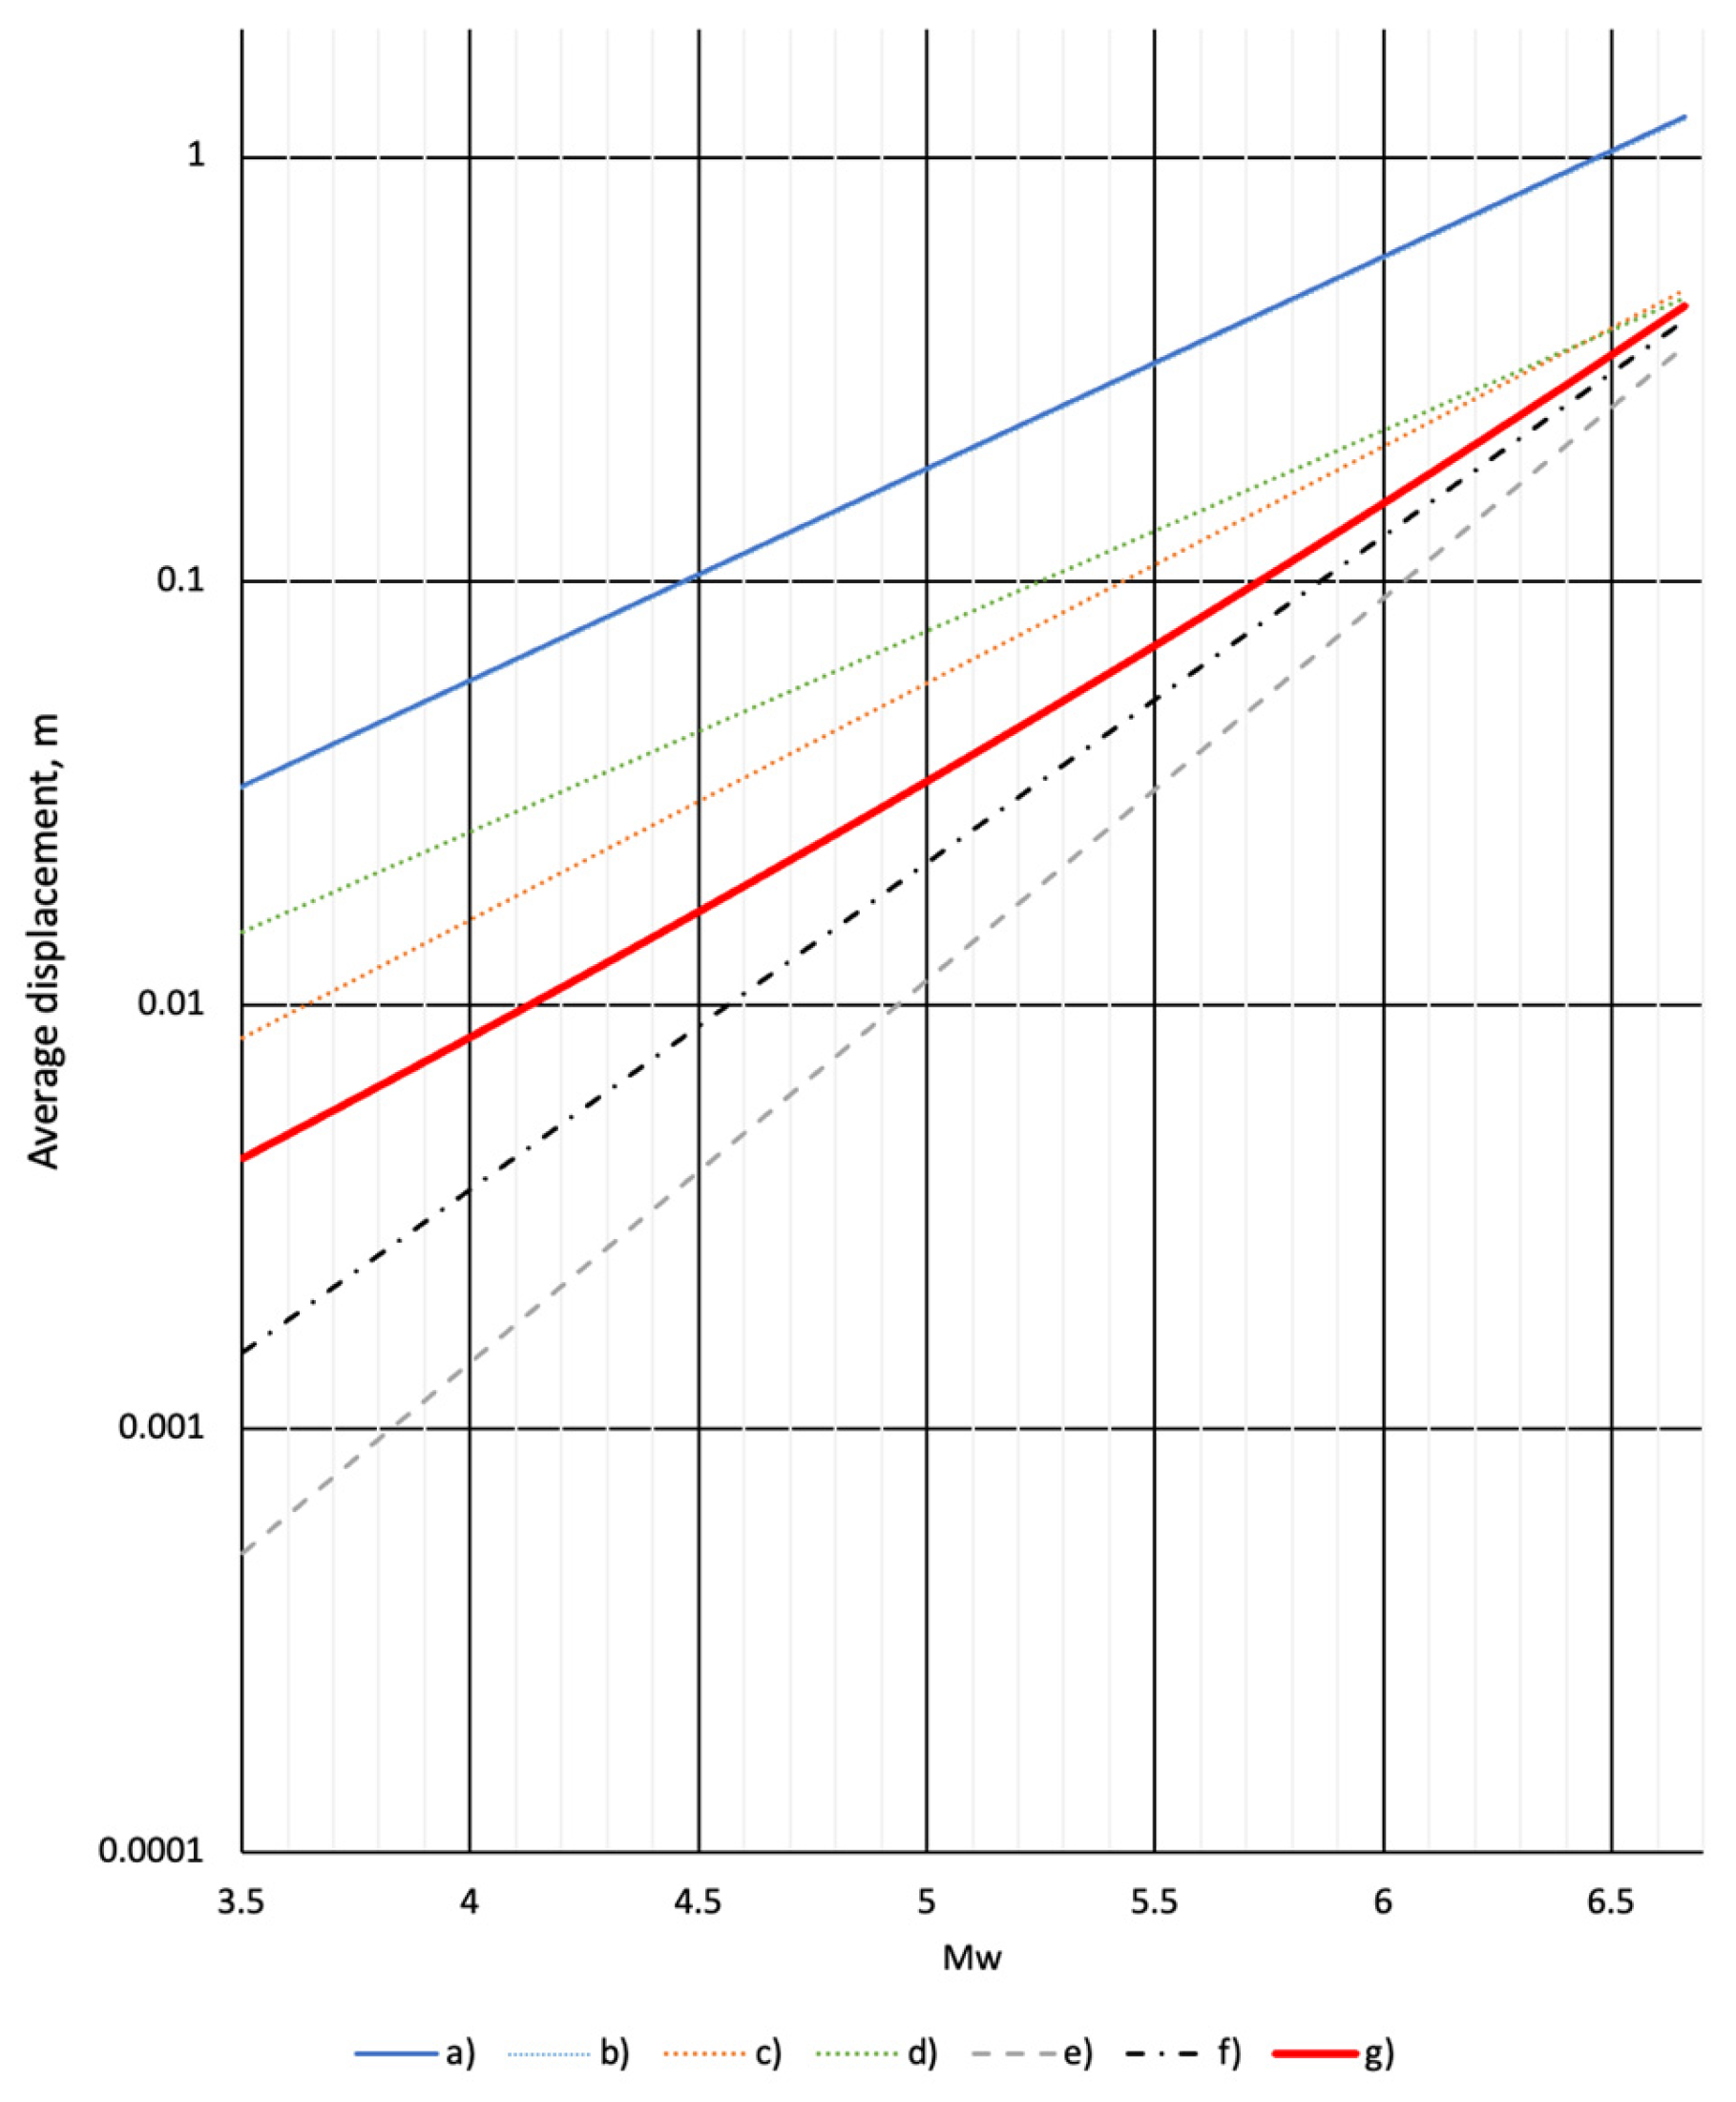
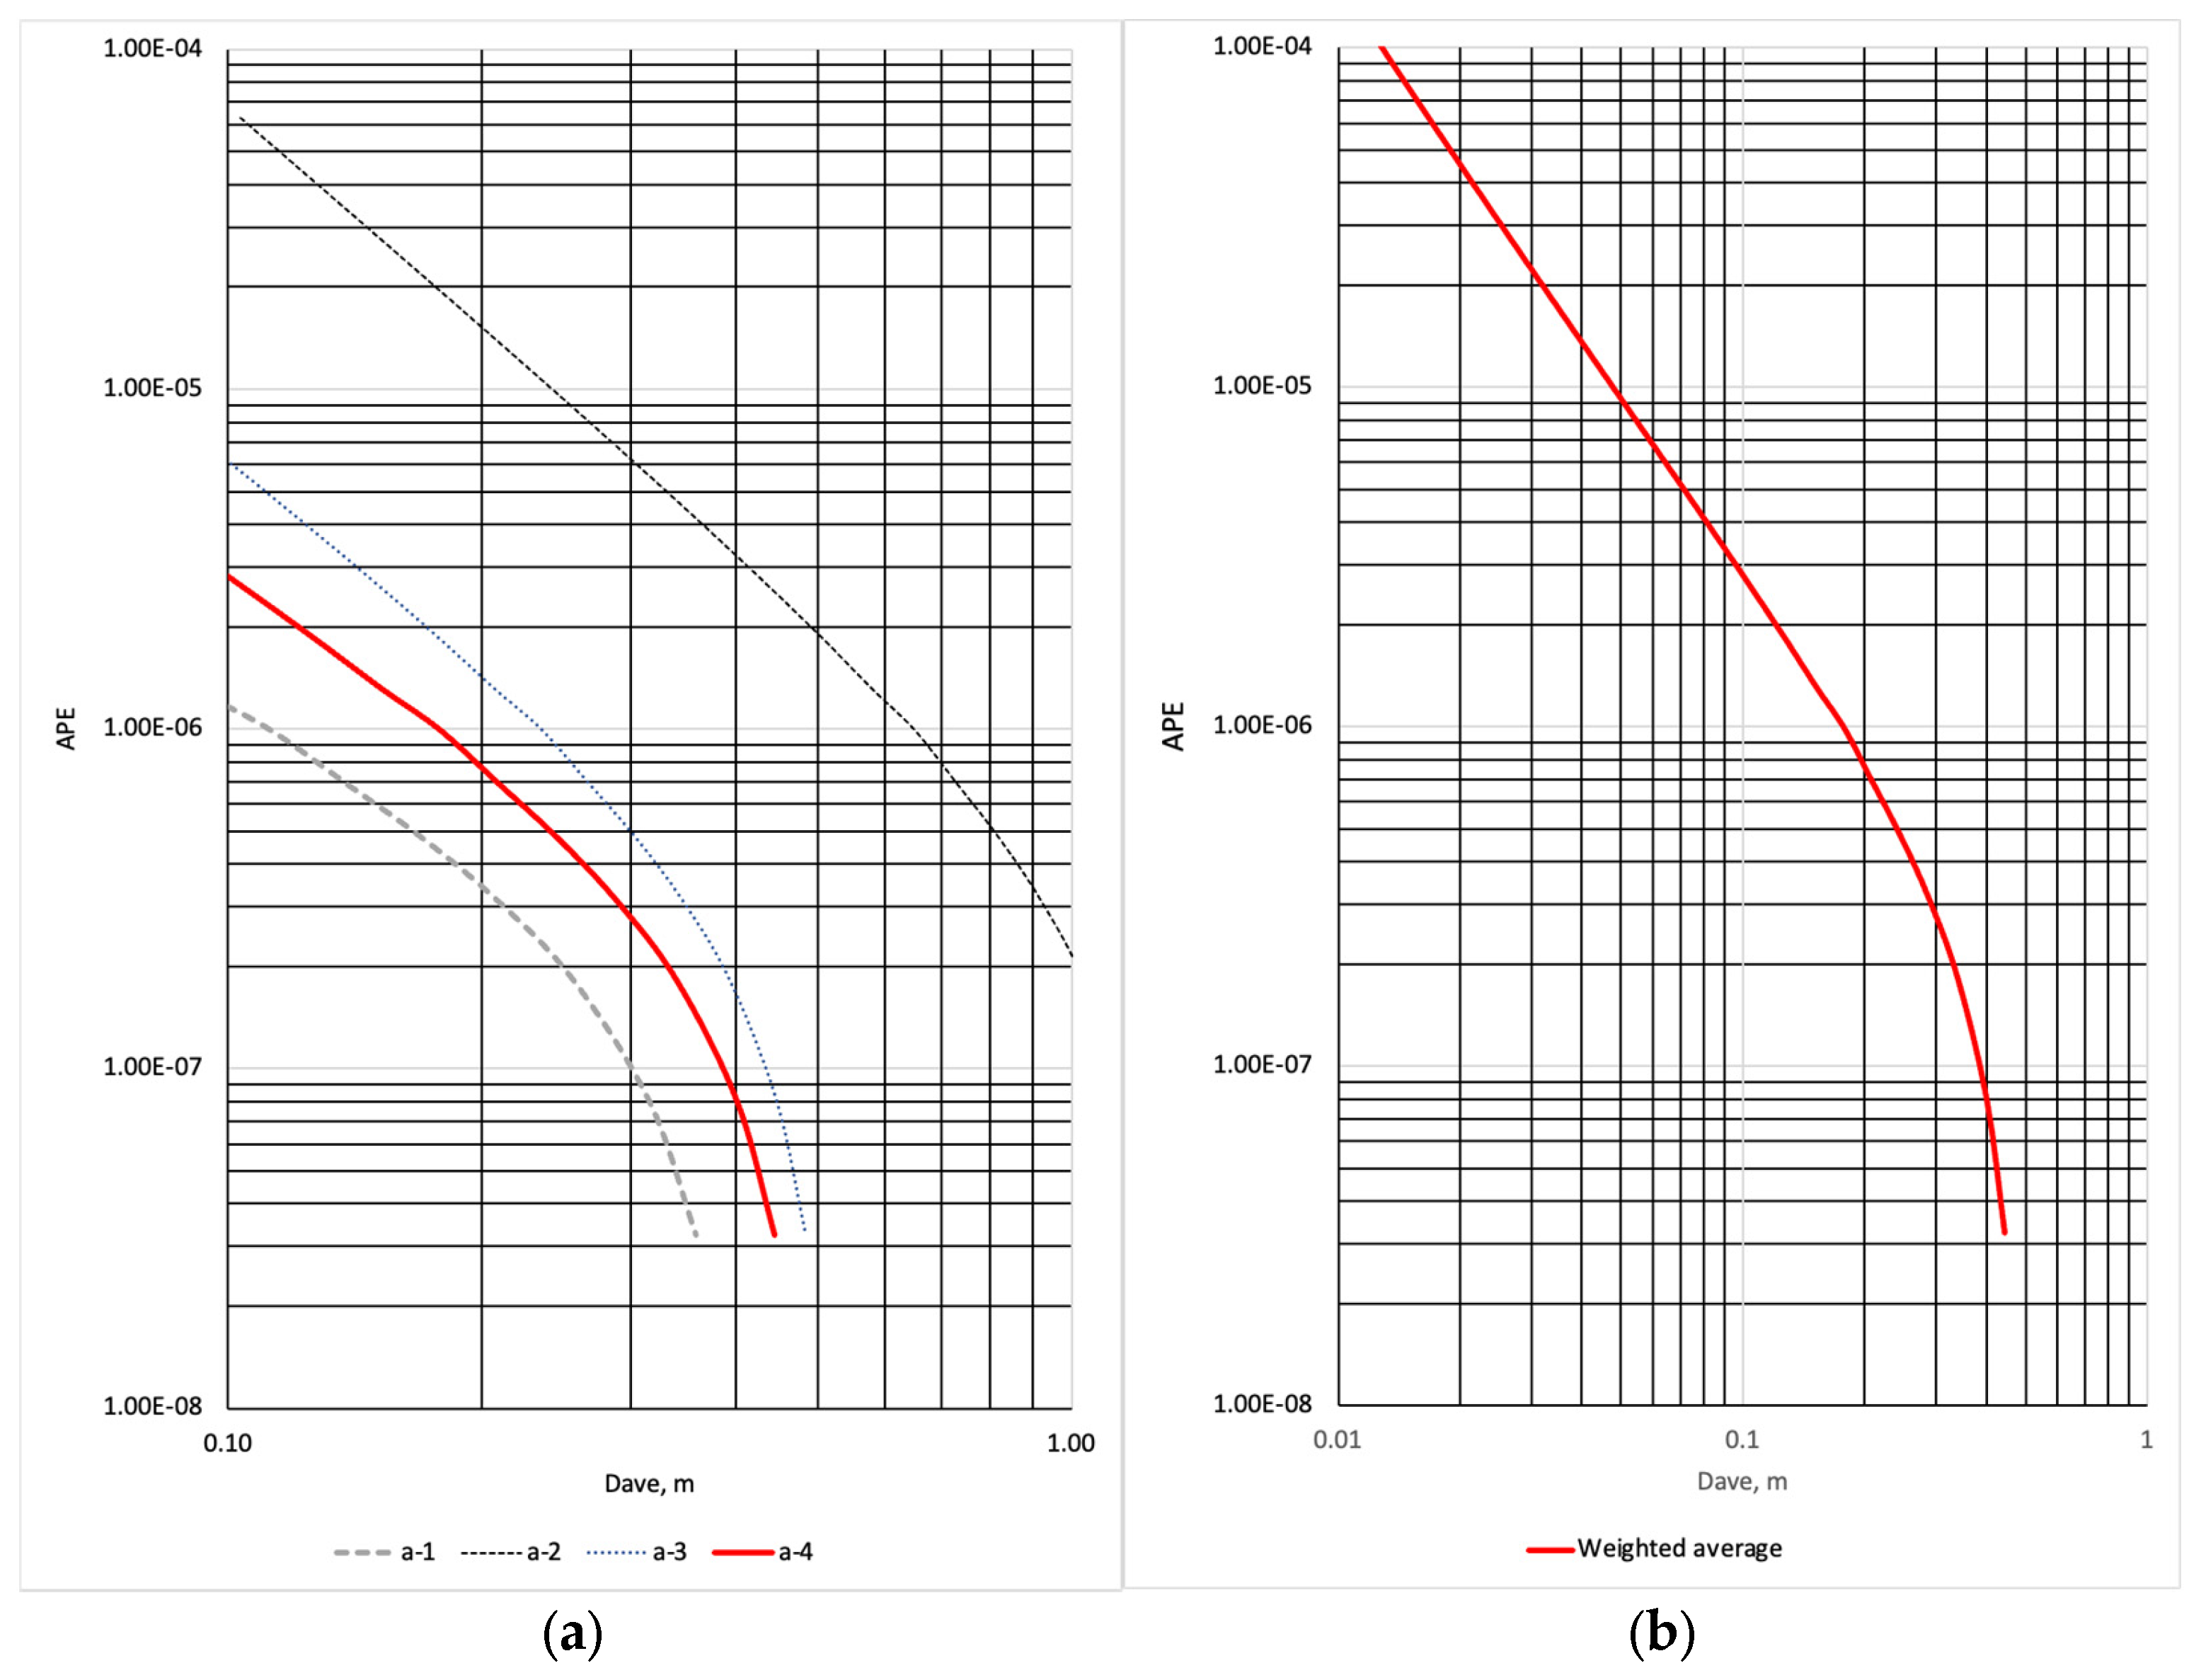
Figure 10 shows the calculation results for the average displacements obtained via different scaling relationships.
The scaling relationships published in the Table 2B of [
33] for
), in the Table 4 of [
34] for
), and [35] of [
35] for
) have been applied. Theses scaling relations should be preferred in the practical hazard analyses since they are derived from the observations. Compared to the relationships of type
, smaller weights should be associated with the relationships
, since these overestimate the average surface displacements; see [
26,
33].
In [
33], a scaling relationship for average displacement as a function of surface rupture length is given (Table 2C in [
33]).
In [
34], a momentum-based scaling relation is given for average subsurface displacement using the rupture length (
Table 3, for
in [
31]) as the independent variable. The rupture length could be calculated by the scaling formula of [
34] (Table 4 in [
34]). This formula of [
34], like the scaling formula versus magnitude, resulted in an overestimation of the average displacement compared with those obtained by the scaling relations of other authors (The two lines in
Figure 10 are overlapping). This overestimation, compared to the results obtained with other correlations, seems unjustified.
Therefore, the highest weight of 0.4 was associated with the direct
relationships, and 0.35 was associated to the
of [
33]. Smaller weights could be justified by the relationships for the subsurface displacements of [
35]: 0.15 for the relationship
and 0.05 for
. The weights of 0.025 are associated with the scaling relationships
and
of [
34].
The weighted average of the displacement scaling relations is plotted in
Figure 10.
Equation (3) and the calculated cumulative probabilities can be used to develop the hazard curve, as shown in
Figure 11a,b.
Figure 11a shows the annual probability of exceedance for the average displacement calculated by the scaling relationships of Leonard [
34], Wells and Coppersmith [
33], and Thingbaijam et al. [
35], as well as the weighted average relationship for the displacement. This could be the basis for the uncertainty analysis of the hazard curve estimation, which will be the subject of future work.
Figure 11b shows the conservative estimation of the mean hazard curve, which can be used as the basis for engineering decisions, i.e., to neglect the hazard in the nuclear power plant’s design and safety evaluation, implement adequate design or safety upgrading solutions to ensure plant safety, or launch a more sophisticated research programme for a sophisticated hazard analysis.
It is important to note that the relationships for the displacement (surface or subsurface) are either direct functions of the magnitude as or composite functions of the magnitude as , also written as . It is assumed that . Thus, the cumulative distribution function for displacement can be defined by applying the idea in Equation (9).
4.5. Consideration of the Uncertainties
Unquestionably, the simplified method outlined above cannot properly treat the aleatory and epistemic uncertainties of the hazard analysis. This is the indisputable advance of expert elicitation and logic-tree modelling compared to any simplified hazard evaluation methods.
A detailed analysis of the uncertainties of the proposed method is the subject of future work since validating the results and evaluating uncertainties is rather difficult due to the lack of direct evidence for surface displacements. Nevertheless, there are certain options for the limited uncertainty estimates.
The randomness of the data and the standard deviation of the scaling relationships are given in the cited papers, see [
32,
33,
34,
35,
36,
37,
38]. Since the variance or the standard deviation for the scaling relationships used in the calculations above is known, the textbook rules should be applied for the variance of the weighted average,
and
, and for the product,
and
.
The epistemic uncertainties are accounted for via the weighting of 18 magnitude–frequency relations for fault activity evaluation and the 3 scaling relationships for surface rupture length, 3 relationships for non-zero surface rupture, and 4 scaling relations for average surface displacements proposed by renowned authors. Thus, the analysis options considered represent the center, the body, and the range of technical interpretations that the larger technical community would have if they were to conduct the study. This is shown in the
Figure 2,
Figure 5,
Figure 7,
Figure 10 and
Figure 11a.
A better treatment of the epistemic uncertainty would need a state-of-the-art probabilistic hazard analysis based on expert elicitation.
4.6. Comparison with Earlier Studies
In the paper by Katona et al. [
3], the disaggregation of the seismic hazard obtained for different hazard levels in the interval 10
−4/a to 10
−7/a compensates for the insufficiency of the data. The disaggregation has been used to characterise the fault activity.
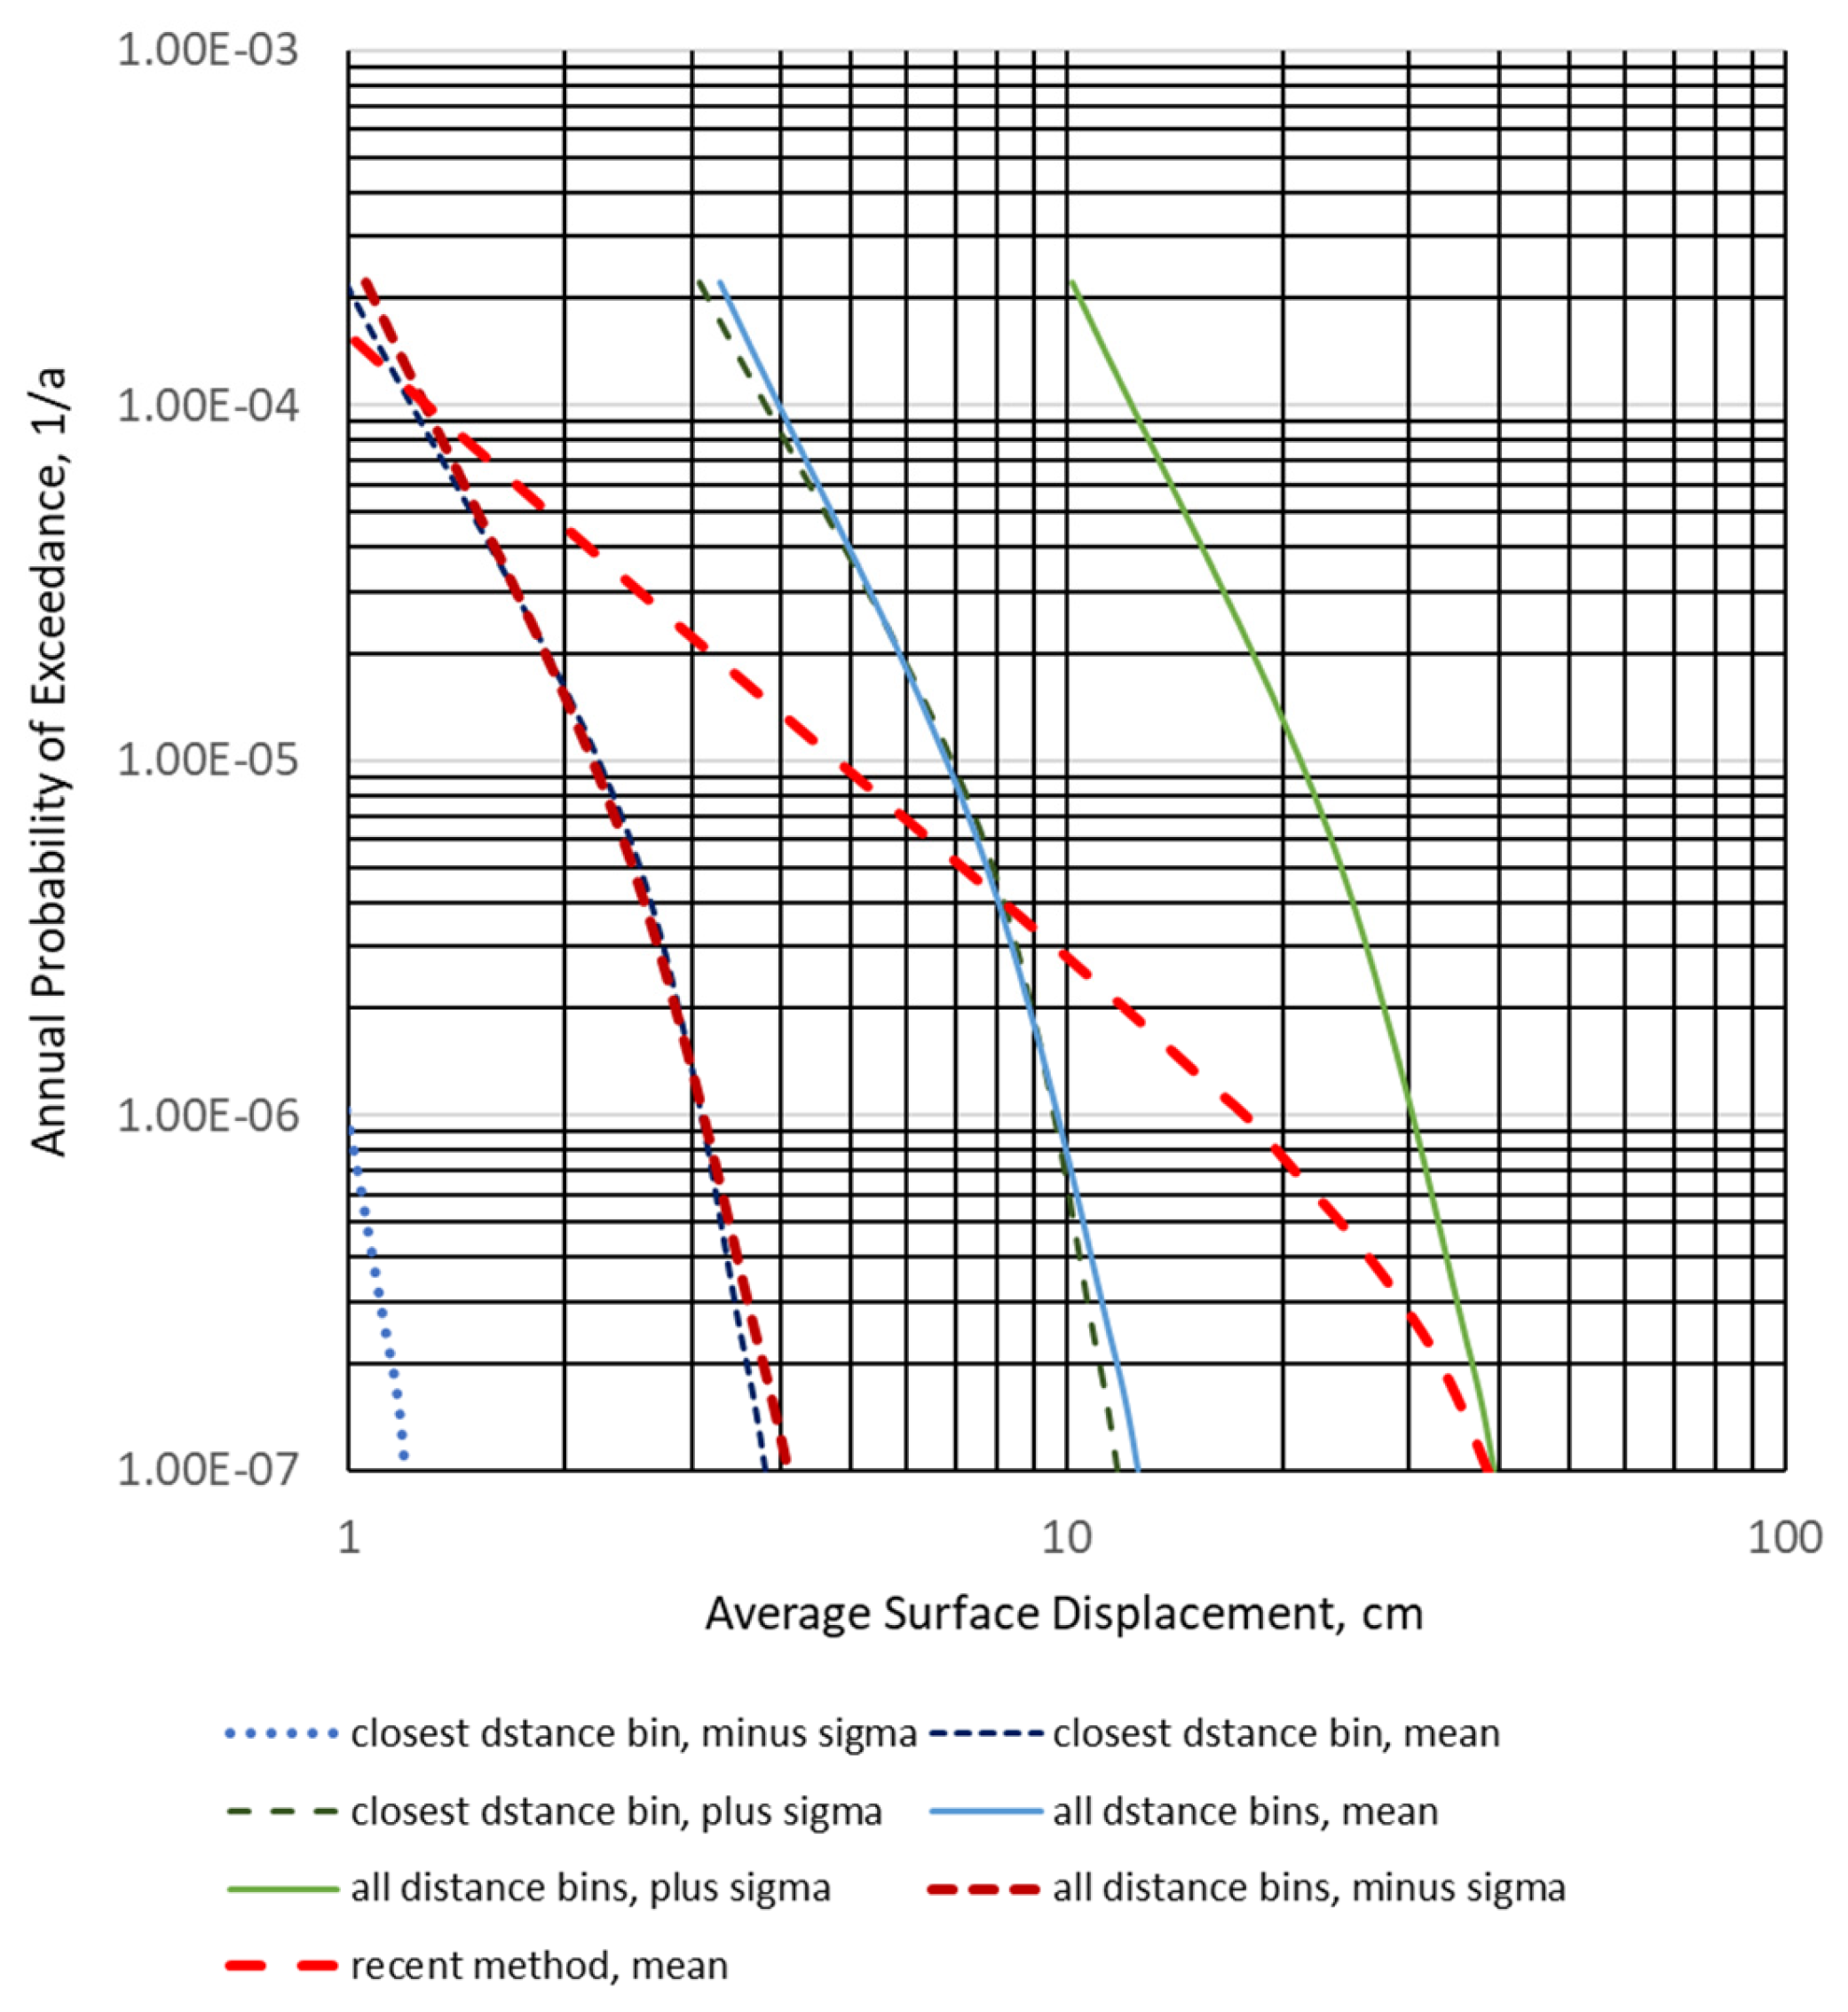
Two calculations were performed: a less conservative calculation that accounts for the earthquakes in the closest-to-the-site distance bin (within approximately 10 km of Joyner-Bore distance) and a more conservative calculation where all events in all distance bins are considered. It should be noted that large and relatively close earthquakes dominate the seismic hazard at low exceedance probabilities.
For the calculation of average surface displacement, the relation used in [
16] has been applied,
, with
a = 1.7927 and
c = 11.2192 and a standard deviation
on the
ln(
D). The dependence of the displacement on the
l/
RL (see
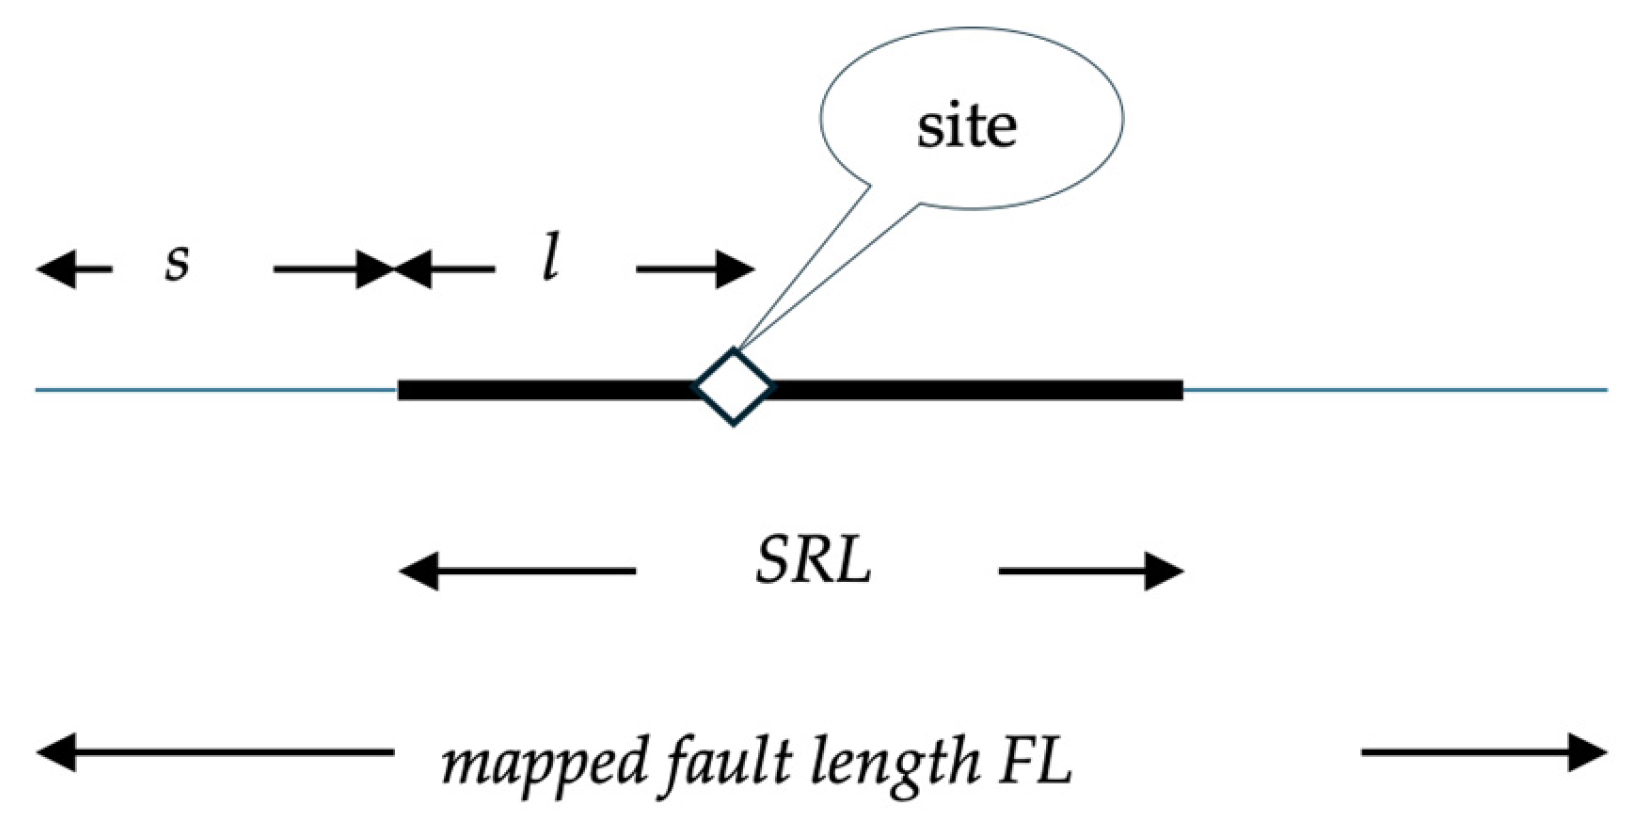
Figure 2 above) was neglected in the magnitude scaling relationship.
Figure 12 plots average displacement results and their dispersion for the two options of considering distance bins; see [
3]. For the comparison, the hazard curve obtained by the calculation method above is also shown in
Figure 12.
The similarities and differences between the results of earlier and recently proposed methods are instructive.
It is very important to emphasise that the hazard curve obtained by the newly developed method stays within the range of the earlier estimates, despite the differences in evaluating the study fault’s activity. This is practically an indirect validation of the proposed methodology.
The differences between the characteristics of the earlier-evaluated and recently obtained hazard curves are explained by the differences between the seismic hazard and fault displacement phenomena and their evaluations. The earlier published method indirectly assessed the fault activity via seismic hazard disaggregation. The disaggregation of the seismic hazard at a given annual frequency of exceedance consists of all possible events that would cause ground motion at the site with a given intensity value (e.g., ground acceleration). This set of earthquake events differs from those that would cause a given surface displacement at a given annual frequency of exceedance, which is considered in the calculation above. Moreover, the area sources considered when estimating the fault activity at a distance from the site and under rare large events are also recorded. These events are associated with the study fault that increases the annual probability of events less than 10−6/a close to the maximum possible magnitude.
Two more trivial aspects explain the differences between the old and newly calculated hazard curves. In the new calculation, the average surface displacement is estimated by a weighted average of six scaling relations, while the old calculation used only one. The mapped length of the fault is properly accounted for in the new method when calculating the site’s intersection probability. This explains why the new hazard curve fits more with the old hazard curve obtained for all distance bins in earlier calculations [
3].
5. Conclusions
The research aimed to develop a simple engineering method for a fault displacement hazard analysis applicable to very specific conditions of the Paks site. Where the fault trace crosses the site and there is a suspicion of the possibility of surface displacement, there are practically no data for quantitative characterisation of the fault activity.
The novelty of the proposed methodology in comparison to deterministic or probabilistic fault displacement hazard analysis is the evaluation of fault activity based on the area source modelling developed for the probabilistic seismic hazard analysis. The simplifications are acceptable thanks to the accurate mapping of the hazard, and the fact that the fault crosses the site. The uniform distribution of the rupture along the fault is a new assumption. The average displacement has been assumed for the entire rupture length. The total probability theorem is used for the calculation of the non-zero surface displacement as well as for the mean annual probability of exceedance for average displacement. The magnitude–frequency relations for seismotectonic activity cover all interpretation options of the seismotectonic information developed during the last 40 years. The formula used in the calculation for the non-zero surface rupture probability and the scaling relations for rupture length, area, and surface displacement represent the state-of-the-art regarding strike-slip faults and are accounted for in the calculations with weights relevant to the site-specific conditions. Thus, the methodology and analysis performed for the Paks site represent the centre, the body, and the range of technical interpretations of the data on fault activity and possible surface displacements. Thus, the calculated mean probabilities and distributions account for the epistemic uncertainties.
A conservative estimation of the mean principal fault displacement hazard curve can be obtained based on the proposed method; this allows for the assessment of the safety relevance of the possible displacements. This could have great importance if the periodic review of the safety of the nuclear power plant reveals the need for re-assessment of the external hazards. Criteria of whether the estimated average surface displacements are safety-relevant have already been presented in [
8,
9]. Based on the performed analysis, the fault displacement hazard at the Paks site is not relevant to safety.
The surface displacement hazard curve obtained by the above-proposed method fits within the range of the surface displacement hazard curves obtained in earlier studies for the Paks site [
3], which can be interpreted as an indirect validation of the analysis method.
The method is recommended for analysing surface displacement hazards at sites such as Paks in Hungary. Generally, the procedure is recommended at sites with operating nuclear facilities for the preliminary assessment of the nuclear safety relevance of fault displacement hazards. Still, it is not recommended as a replacement or alternative to a state-of-the-art probabilistic fault displacement hazard analysis if this sophisticated analysis is needed and feasible.
The time factor is also important because the safety of hazardous facilities cannot tolerate time delays. The proposed methodology addresses the need for an in-time decision and is recommended for use if the possibility of surface displacement only is suspected.
A further task for the research is the numerical evaluation of the uncertainty of the proposed methodology.
Generally, the research community has proposed to concentrate on the “grey” cases where an uncertain indication of the hazard is revealed. Sites covered by thick, soft alluvium could also be interesting [
40,
41]. Both the overestimation and underestimation of the hazard and its consequences—especially in the case of high-hazard facilities—could have significant practical and social impact.
