Abstract
This paper presents the results of a geotechnical investigation regarding the slope stability in a pit lake, emphasizing the impact of water level variations. Advanced analysis techniques were utilized for this study. The research was performed by using fully coupled flow-deformation analyses. For the fully coupled approach, Bishop’s effective-stress equation was used, and for the description of soil hydraulic behavior, the Van Genuchten’s model was applied. The analysis of slope stability associated with reservoir water level changes revealed that the slope tended to become unstable as the water level decreased; the stability factor was negatively related to the rate of water level reduction. Concerning the water level fluctuations, the analyses revealed that the soil mass seemed to become less stable as the rate of water level change increased. Under a specific range of rates of water level variation, the safety factor became higher as the number of fluctuations increased. Additionally, the simulation results concerning the water level rising indicate that the pressure due to the external water level acts on the slope surface with a positive impact on the stability factor. The results obtained reflect the effects under a specific site condition, but they can be used as a reference for evaluating slope stability in a pit lake design.
1. Introduction
The creation of artificial lakes by flooding former open pit mines has become the most common strategy for the long-term rehabilitation of abandoned mine sites [1,2,3,4,5]. The forming lakes constitute important sites of culture and recreation. However, the stability of the pit lake slopes often remains uncertain and presents significant risks in poorly planned structures [6]. Cases of geotechnical failures are common, for example, at pit lake Pątnow [7], Lake Zülpich Mitte, and Lake Concordia near Nachterstedt [8]. In the latter, a massive landslide took place in 2009, when a strip of land 350 m long slipped into the pit lake, causing the loss of several houses and the deaths of three people [9].
To ensure the long-term safety of these structures, it is essential to assess the maximum height at which the pit lakes will be filled and address issues regarding the stability of the reservoir slopes. Investigations have revealed that the stability of the pit lake slopes is influenced by the rate of filling, the fluctuations in water level as well as the velocity of potential reservoir emptying.
According to Johansson and Edeskär [10,11], the rise in water level during reservoir filling leads to stress redistributions produced by external loading, a loss of negative pore pressures due to wetting, and seepage effects. These alterations have the potential to result in reduced shear strength, soil structure collapse, settlements, and slope failure [12]. In a similar way of thinking, Wang et al. [13], Fourniadis et al. [14], Cojean and Caï [15], and Hu et al. [16] suggested that the saturation of the slopes due to reservoir filling leads to a decrease in the shear strength of the soil, a process that constitutes a significant destabilizing factor. Additionally, Fredlund and Rahardjo [17], Gavin and Xue [18], and Bittelli et al. [19] emphasized the suction effect in soil formations, and stated that the reduction in negative pore-water pressure in the upper part of the soil mass and the disappearance of the matrix suction in the unsaturated soil may compromise the stability of the slopes, provoking landslides.
Regarding the effects of water level dropping on slope stability, the issue has been investigated by many authors [20,21,22,23,24,25]. Specifically, Berilgen [26] delved into how parameters like the falling rate of water level, permeability, and slope height affected the stability of a slope under drawdown conditions.
In addition, investigations of slope stability under reservoir water level fluctuations have revealed that during the operation of the reservoir, the fluctuations change the boundary conditions in unstable mass and influence the instability [27]. As mentioned by He et al. [28], more than 5300 landslides have occurred since 2010 in the Three Gorges Reservoir area, where the water level fluctuates between 145 m and 175 m asl. However, compared to the state of filling or emptying the reservoir, few studies addressing the effects of water-level fluctuations on slopes stability have been conducted (e.g., [10,11,28,29,30]).
Moreover, Johansson et al. [10,11], Oh and Lu [31], Liu et al. [32], Mao et al. [33], and Chen et al. [34] emphasized the importance of fully coupled flow-deformation calculations in the study of unsaturated reservoir slope. Due to the complex nature of the interaction between the pore-air pressure and pore -in unsaturated soil, it is recommended that advanced analysis is performed in order to ensure correct stability analysis.
The target of this work was to perform numerical simulations using a fully coupled hydro-mechanical model in order to assess the response of a pit lake slope in relation to the water-level changes. The findings have the potential to enhance the design and operation procedures of artificial lakes in post-mining sites. The open pit mine Most (located in central Europe), which has already been filled with water, was selected as the site to perform the analysis. The modeling was conducted using the PLAXIS 2D v.2016 program, allowing for the consideration of coupled hydro-mechanical computations.
2. Methodology Adopted in Fully Coupled Flow-Deformation Analysis
The stability of the inner dump slope situated on the southeastern bank of Lake Most (Figure 1) was analyzed under the influence of the matrix suction in the unsaturated zone (above water level).
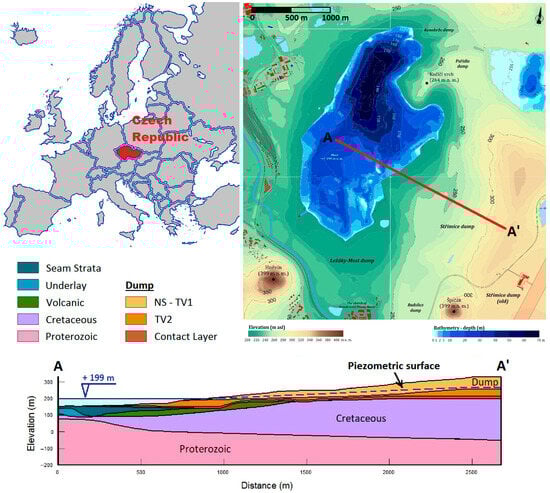
Figure 1.
Position of the study area (Lake Most/Strimice dump) and geological cross-section along the NNW–SSE direction in the southeast side of the lake.
A fully coupled flow-deformation analysis was conducted in order to analyze the simultaneous development of deformations and pore pressures in both saturated and partially saturated soil masses.
This model of analysis utilizes Bishop’s effective-stress [35], defined by the equation:
where σ′, σ are the effective and total stress, respectively; ua is the pore-air pressure, which is constant and small enough to be neglected; uw is the pore-water pressure; and x is the matric-suction coefficient that is determined experimentally in general [36,37]. Due to a lack of experimental data, x is often assumed to be equal to the effective saturation Seff [38], which is given as:
where Sr is the degree of saturation, Sres is the residual degree of saturation, and Ssat is the saturated degree of saturation, while the indices max and min denote the maximum and minimum values respectively.
Assuming that the air-pore pressure is assumed to be negligibly low, the effective stress is simply expressed as:
The degree of saturation Sr, as a function of suction pore-pressure head hp, is defined by Van Genuchten’s function [39] as follows:
where hp = pw/γw. pw is the suction pore pressure, γw is the unit weight of water, and ga, gn,gc = (1 − gn)/gn are the empirical parameters determined according to the USDA soil classification and are linked to air entry, water extraction from the soil, and pore connectivity, respectively [40].
For an estimation of the hydraulic behavior in the soil, Van Genuchten’s model [39] was used, which gives the relative permeability (krel) by Equation (5) [10,11,37].
where gl is an empirical parameter.
The aforementioned parameters affect the saturation–suction relationship of the soil and they have to be measured. In PLAXIS 2D v.2016, their values can be derived by a database of soil properties [40].
Furthermore, the soil unit weight (γ) is defined in relation to the effective degree of saturation, according to the equation:
where the indices denote the unsaturated and saturated conditions, respectively.
In addition, in PLAXIS 2D v.2016 software, the active pore pressure pactive is defined as follows:
where psteady is the steady-state pore pressure and pexcess is the excess pore-water pressure.
Based on the aforementioned, the effective normal stress is defined as follows:
Regarding the application of the Mohr–Coulomb model, the relationship between shear stress and effective stress given by Equation (9), was followed:
where τf = shear strength (kPa); c′ = cohesion (kPa); φ′ = friction angle (peak state).
The stability factor was defined by the strength reduction (or phi/c-reduction) technique and is estimated as the ratio between the available shear strength and the shear stress at failure. This is mathematically handled by expressing ratios of the strength parameters [37] according to Equation (10):
where ΣMsf stands for the controlling multiplier that represents the safety factor (FS). The variable c represents the cohesion, while denotes the friction angle of the soil. The term “reduced” refers to values that are progressively dropped until failure occurs.
For an indication of the instability, the non-convergence of solutions is used [40]. This is indicated by the condition when a stress state, at which the failure criterion and the global equilibrium can be simultaneously satisfied, is not found [20].
3. Study Area
Lake Most was selected as the site of this investigation. It is one of the largest pit lakes in Europe, located in the central part of the Most Basin (Figure 1). The flooding of the residual pit of the Most-Ležáky mine started on October 2008. In May 2014, the pit was flooded to its final permanent water level (199 m asl), and the water level fluctuates in the range of ±60 cm [41].
The Most Basin has a graben structure [42]. The crystalline basement of the area is covered by various heterogeneous sediments of Miocene to Quaternary in age. They comprise clays and sandy-clays with variable carbonate occurrence. These sediments can be classified into two primary geotechnical soil types [5] (Figure 1). The first one (in situ soils) corresponds to a clay layer and coal seam, sandy clays (PJIL layer), three plastic clay layers (JIL1, JIL2 and JIL3), and the Quaternary gravel layer. The second group, corresponding to dump materials produced by the mining operation, is a complicated heterogeneous system. For the stable calculations, it was divided into the following geotechnical units [5]:
- NS–TV1 formation is generally considered as a stable loose material. It is at a certain stage of consolidation and it can be considered as a semi-permeable environment.
- The TV2 layer, which shows very similar values to TV1 concerning the internal friction angle. However, it exhibits a relatively significant decrease in cohesion compared to TV1.
- The Contact Layer, located at the base of the dump, has the lowest strength compared to the other layers.
It is remarkable that it was not possible to distinguish the interface between the NS and TV1 layers [5]; this is why, from a geotechnical standpoint, these two layers were combined into one (NS–TV1) (Figure 1).
4. Stability of the Inner Dump Slopes
Based on the geomorphology and the geological structure of the area, a cross-section with the NNW–SSE direction was designed (Figure 1) that passes through the internal dump slopes which form the southeastern side of Lake Most.
The construction of the cross-section was based on data regarding the geological survey and topographic mapping of the area, as given by the 3D model elaborated by Renaud et al. [5]. The cross-sectional profile incorporates the geology of the site as well as the surface of the water table interpolated using piezometric measurements.
In order to capture the effects of water level variations on slope stability, the investigation was performed using advanced modeling approaches. The slope stability was assessed both during the process of filling the pit as well when it was in operation status with various water levels in the reservoir.
4.1. Numerical Modeling
The modeling was performed using the PLAXIS 2D Version 2016software, which enabled fully coupled flow-deformation analyses. Bishop’s effective-stress equation was utilized for the fully coupled approach, and Van Genuchten’s model was employed to describe the hydraulic behavior in the soil.
4.2. Geometry and Material Types of the Geotechnical Model
The geometric model describing the problem was created using the geological cross-section through the slope of the open pit at a location that satisfies the simplification of plain strain analysis (Figure 1).
The geometric configuration of the model (lateral extent and height) guarantees that the stresses and deformations around the reservoir are not significantly affected by boundary conditions. Moreover, it was assumed that the pit is encompassed by isotropic, elastoplastic formations.
Once the geometry model was completed, the boundary conditions were implemented. In detail, the vertical borders were fixed horizontally, while the bottom boundary was fixed in both directions.
Regarding the hydraulic boundary conditions, the bottom of the model was assumed to be impermeable, while at the right and the left vertical boundaries, the pore pressures were assigned based on the piezometric level in the area.
The geotechnical parameters for the formations modeled in the simulation are given in Table 1. Their constitutive behavior was described by the Mohr–Coulomb linear elastic perfectly plastic model. The geotechnical parameters were determined through in situ, laboratory testing in the area [5] and the scientific literature [43,44,45,46,47].

Table 1.
Geotechnical parameters of the soil formations.
The Van Genuchten parameters used in the model for the NS–TV1 and TV2 formations (which affected by the water level changes) are listed in Table 2. These were derived from the materials PLAXIS database [37].
Table 2.
Geotechnical parameters of the NS–TV1 and TV2 materials.
Following the input of the geotechnical parameters into the model, the finite element mesh was generated with 15-noded triangular elements. The mesh was locally refined in areas where significant stress concentration and substantial deformation were anticipated such as the interface between the basement and the dump material.
The resulting mesh with 45,519 nodes and 5619 finite elements was considered capable of a reliable analysis.
4.3. Computations
The first stage of the simulation corresponded to the initial loading of the model by gravity, while the remaining stages referred to the water level changes.
The generation of the initial pore-water pressures was based on the piezometric level before filling the pit with water. The water pressure distribution was regarded as hydrostatic, despite the fact that certain layers may have had either hypo-hydrostatic pressure (such as interbedded sandy layers), or pressure greater than the hydrostatic. The aforementioned assumption was deemed to have a negligible impact on the behavior of the dump slope.
More specifically, the piezometric surface on the right side of the slope was set at an elevation of +265 m, while the water level in the slope face was set at an elevation of +124 m (empty reservoir status).
5. Effects of Flooding Process on Slope Stability
The flooding process was simulated by progressively increasing the water level by 75 m inside the pit, with a rate of 0.02 m/day until the final flooding level (+199 m) was reached.
The cumulative horizontal displacements during the filling of the reservoir are presented in Figure 2.
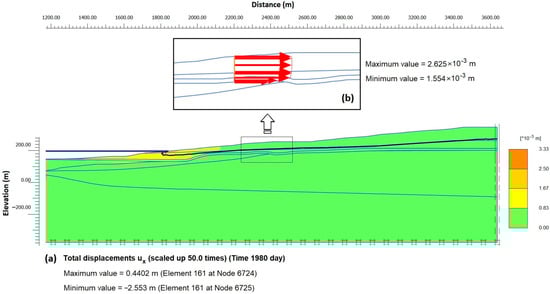
Figure 2.
Slope displacement that resulted by filling the reservoir with water. (a) Estimated horizontal movements (ux). (b) Estimated horizontal displacements (ux) at the location of inclinometer IMV 5/2.
The simulation results demonstrated the water effect on the slope caused in the first reservoir filling.
The maximum calculated horizontal displacements that resulted by filling the pit appeared at the upper third of the slope (NS–TV1 formations). The estimated horizontal displacements approached the value of 2.5 mm at the location of inclinometer IMV 5/2 (Figure 2b and Figure 3a). The positive number of displacements implies movement toward the face of the slope.
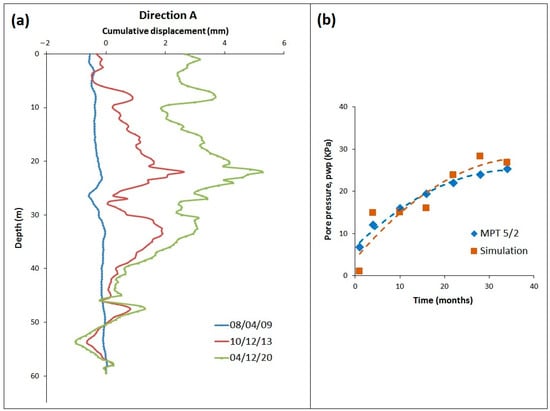
Figure 3.
(a) Inclinometer IMV5/2. Registered deflections (horizontal cumulative displacements) during flooding. (b) Computed and recorded pore-water pressure vs. time during reservoir filling, at the location of piezometer MPT 5/2.
The simulation results are in good agreement with the inclinometer IMV 5/2 measurements (Figure 3a). More specifically, a relative shift between TV2 formation and the underlying Contact Layer, calculated at the +190 m level, matched the inclinometer deflection at this elevation. Moreover, the deflection recorded from an 8 m to 48 m depth below the ground surface (Figure 3a) was attributed to the squeezing of more “plastic” intercalations.
Regarding the pore-water pressure registered at the location of piezometer MPT 5/2 (Figure 3b), the estimated value presented good agreement (at least qualitative) with the in situ measurements.
The rather good match between the simulation results and field observations served as a model calibration procedure, which allowed the utilization of the soil modeling approach (and its parameters) to predict the behavior of the pit over subsequent simulation stages.
The simulation results concerning the suction as the pit is filling with water are presented in Figure 4. A difference in suction before and after flooding was evident only in the small area close to the face of the slope. In this region, the suction can evidently influence the deformation and stability of the soil.
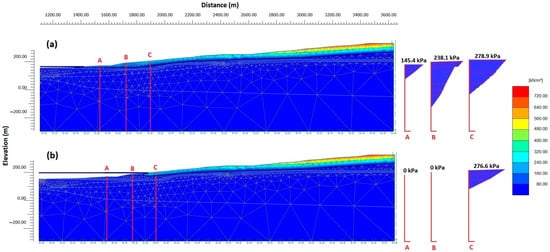
Figure 4.
Suction profile before (a) and after (b) flooding the pit with water.
Moreover, the pressure due to the water level in the lake acts on the slope surface with a positive impact on the stability of the inner dump. As a result, during the process of filling (rise of water level by 75 m inside the pit), the stability factor increased from ΣMsf = 1.59 to ΣMsf = 1.72 (Figure 5).
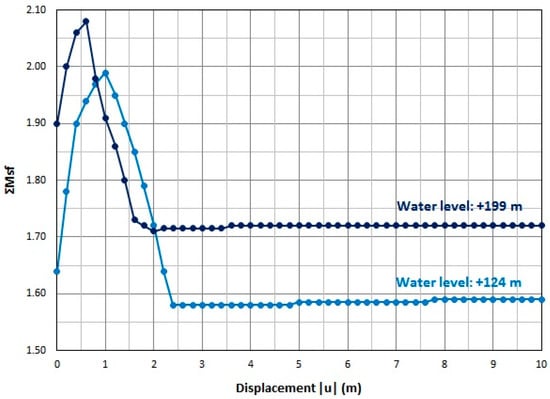
Figure 5.
Evaluation of the safety factor before and after filling the pit with water.
The maximum relative shear stress was equal to 95% and only locally approaches 100%. This indicates a shearing zone in the interface zone between the TV2 formation and the contact layer, which probably caused small-scale differential displacements instead of a massive failure (Figure 6). The most critical surface approximated a composite failure passing through the contact layer at the base of the slope (Figure 6).
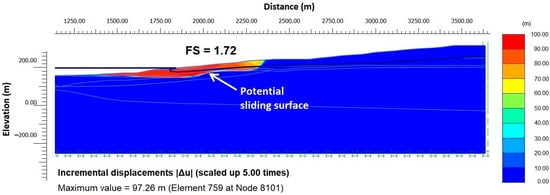
Figure 6.
Incremental displacements for the slope and potential sliding zone (orange part) as the pit is filling with water.
6. Slope Stability under the Impact of Reservoir Water Level
To investigate the influence of the reservoir-water-level variations on the slope stability, finite element analyses were performed for three different cases, as shown in Table 3. At the end of each case (water level change), the stability factor was determined by the phi/c-reduction procedure [37].
Table 3.
Cases modeled in the analysis of slope stability.
6.1. The Impact of Water Level Drawdown on the Slope (Case 1)
The condition of the water level dropping by 5 m (from +199 m to +194 m) at different rates was examined in detail. The excess pore pressures, the suction, and the horizontal displacement contour generated by the water level drawdown at a rate of 2 m/day are displayed in Figure 7.
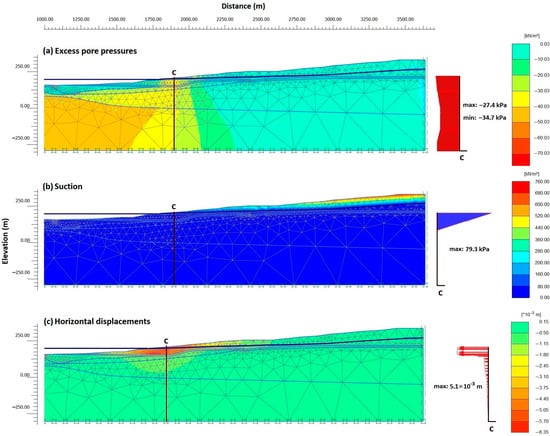
Figure 7.
Results for Case 1 with the water level dropping from +199 m to +194 m at a rate of 2 m/day: (a) excess pore pressures (kPa), (b) suction (kPa), (c) horizontal displacement contour (m).
With reference to the initial conditions (Figure 4b), the unsaturated area became larger, possibly with increased shear strength parameters, and a favorable effect on slope stability. The estimated max suction effect above the water level at vertical section C (Figure 7b) was estimated to be equal to 79.3 kPa. Moreover, the variation in suction vs. depth can clearly be seen on the right side of the figure.
In addition, the maximum excess pore-water pressure that developed was greater than that under the initial conditions (reservoir water level at +199 m) and approached a value of 27.4 kPa. Concerning the produced horizontal displacements profile (Figure 7c), it depicts a relative shift between Contact Layer and the underlying volcanic formation.
The results of the stability analysis suggest that the slope of the reservoir remains stable with a minimum FS = 1.44. With the initial conditions (water level at +199 m) as a reference, the safety factor decreased by about 10% due to the water level drawdown. The most critical surface approximated a composite failure passing through the Contact Layer at the base of the slope (Figure 7c).
Figure 8 depicts the soil behavior at a section 1870 m from the left border of the model when water level dropped from +199 m to +194 m at two extreme rates: 0.015 cm/d and 2040 cm/d, respectively.
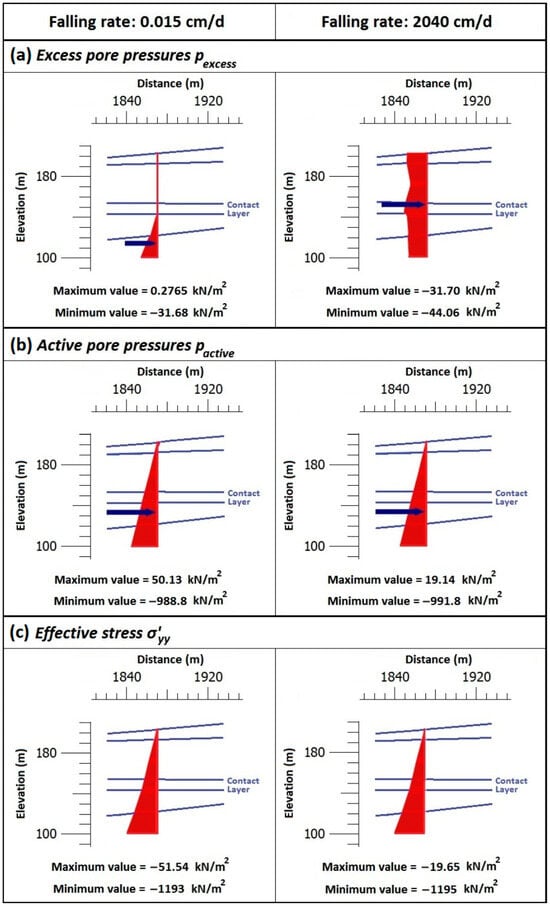
Figure 8.
Soil behavior for water level falling 5 m, at a section 1870 m from the left edge of the model: (a) excess pore pressures, (b) active water pressures, and (c) vertical effective stress versus depth (the negative sign implies pressure).
In detail, the excess pore pressure, the active water pore pressure on the slope, and the Cartesian effective stress σ′yy versus depth are shown in Figure 8.
The model exhibited varying excess pore pressure versus depth. The behavior became nonlinear due to the differentiation of soil formations. In more permeable soil layers, the stress-induced pore pressure is degraded faster. With an increase in the rate of drawdown (Figure 8a), the water may have insufficient time to infiltrate out from the less permeable layers. Therefore, low excess pore pressure is calculated in formations with high permeability.
By comparing the results from the two dropping rates (Figure 8), we observed that the excess pore pressure at the bottom of the Contact Layer near the slope face (at section 1870 m from the left edge of the model) changed from 0.28 kN/m2 at the lower rate to −44 kN/m2 at the higher rate of water level reduction.
Therefore, it follows that more active pressure (and consequently less effective stress) is developed at the higher rate of water level reduction. In detail, an active pore pressure equal to 533 kN/m2 developed at the bottom of the Contact Layer under a falling rate equal to 0.015 cm/d and 578 kN/m2 under a falling rate of 2040 cm/d.
During dissipation, the soil mass consolidates, producing a negative vertical displacement. The results indicate that the lower the falling rate, the higher the vertical effective stress in depth. In detail, the effective stress at the bottom of the contact layer (+142 m) was calculated to be equal to 642 kN/m2 under the falling rate of 0.015 cm/d and 603 kN/m2 under a rate of 2040 cm/d.
Moreover, the analytical results demonstrate the slope deformation caused by the water level falling and the dissipation of the pore-water pressure. Regarding the horizontal displacements Ux (Figure 9), the displacements increased as the falling rate of water level rose. The direction of the vectors was toward the lake.
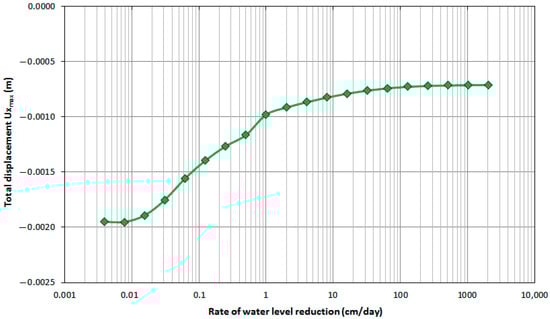
Figure 9.
Horizontal displacements vs. the rate of water level reduction at the slope crest point (x = 1899, y = 201). The negative sign implies movement toward the pit.
The movements with the increase in falling rate destabilize the slope and justify the decrease in safety factor (Figure 10).
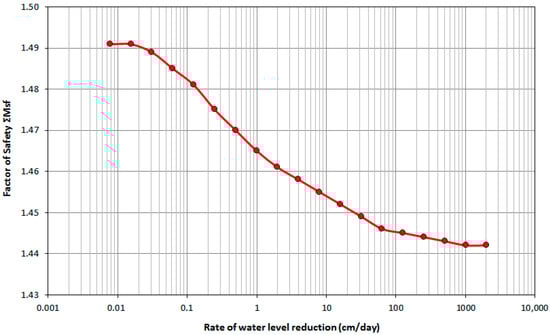
Figure 10.
Variations in safety factor in relation to the water level reduction rate under a 5 m falling in reservoir water level.
The stability decrease is to assign the loss of slope support from the lake water, the change in saturated zone (suction) and the induced pore-water pressures. Under this condition, the water may have insufficient time to infiltrate out from the slope due to the rate of water level changes and the permeability of soil formation. The findings agree with the results obtained from the research work conducted by Sun et al. [25] and Xia et al. [48].
However, the results suggest that the slope is stable under the aforementioned reservoir water-level dropping conditions (Figure 10). The minimum value was estimated 1.44, primarily attributed to soil consolidation resulting from water pressure dissipation.
6.2. The Impact of Water Level Fluctuations on the Stability of the Slope (Case 2)
The position of the water level in the pit was defined as +199 m. The level change magnitude was set to be equal to 60 cm (linearly lowered and raised), and the simulation was conducted at various rates of water level change. In addition, the analysis was repeated for an increasing number of water level fluctuation cycles.
Figure 11 shows the resulting soil behavior in the section 1870 m from the left edge of the model after 2 and 128 water level fluctuations, with a level alteration speed of 8 cm/d. As can be seen, only a slight soil volumetric strain appeared after two water level fluctuation cycles (Figure 11a) with the total volumetric strain at the base of the Contact Layer equal to −4 × 10⁻⁶. This was much less than that after 128 level fluctuations, which was equal to −2 × 10⁻⁴.
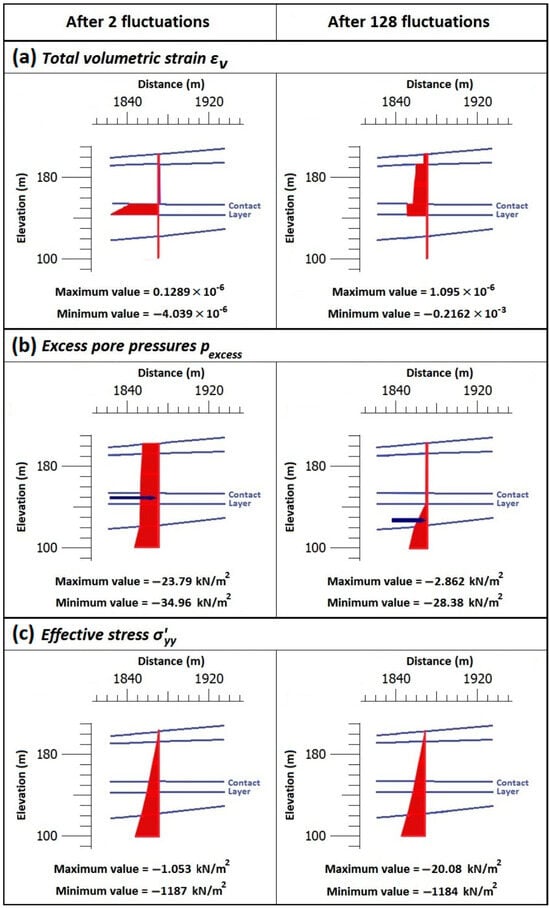
Figure 11.
Soil behavior generated at a section 1870 m from the left edge of the model after 2 and 128 water level fluctuation cycles. (a) total volumetric strain. (b) excess pore pressure. (c) vertical effective stress versus depth (the negative sign in volumetric strain implies swelling and in stress pressure).
Additionally, as the water level fluctuations increased, the excess pore-water pressure dropped significantly. The explanation could be that when the number of fluctuations rises, the water has more time to seep out. The excess pore pressure was less after 128 cycles of fluctuations than it was after the initial two cycles (Figure 11b). In particular, the excess pore pressure at the bottom of the Contact Layer was equal to 26.8 kN/m2 at the lower number of fluctuations and changed to 3.2 kN/m2 when the number of fluctuations increased.
In addition, the repeated cycles of fluctuation facilitated consolidation, causing vertical displacement and higher stability. In detail, the value of the vertical effective stress at an elevation of +142 m (at the bottom of the Contact Layer) was estimated to be equal to 606 kN/m2 after two (2) water-level fluctuations and rose to 617 kN/m2 after one hundred and twenty-eight (128) cycles of fluctuations. Regarding the impact of suction on the flow analysis, this was minimal under variable water level and was not examined further.
The stability analyses revealed that the slope remained stable under all of the reservoir water-level fluctuation circumstances stated, although it was reduced as the rate of the water level change increased.
Figure 12 presents the calculated safety factor in relation to the rate of water level alteration. The analyses show that in a specified number of fluctuations, the induced pore-water pressure diminished the stability as the rate of change in the water level increased.
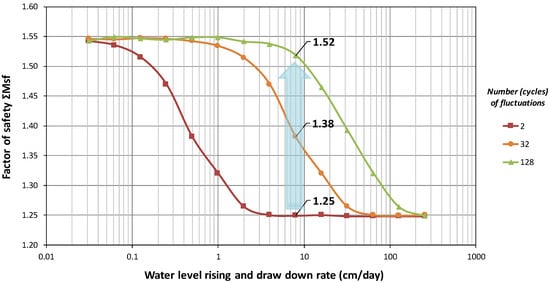
Figure 12.
Safety factor vs. the rate of water level changes and the cycles of fluctuations.
The change in the stability factor was marginal after a specific rate of water level fluctuation. This value can be attributed to the induced excess pore pressure and the soil permeability (Figure 12).
However, at a specific rate of water level change, the safety factor rose as the number of fluctuations (cycles) increased (Figure 12). The greater the number of fluctuations, the greater the impact on the safety factor. This was confirmed by the dissipation process discussed and the higher effective stress attained in the soil mass with repeated fluctuations.
6.3. The Impact of Water Level Rising on the Slope Stability (Case 3)
The study of slope after increasing the reservoir water level by 5 m at various rates showed that the range of the unsaturated zone was reduced relative to the initial condition (water level at +199 m).
The analytical results indicate that suction had an insignificant influence on the deformation, and a small impact on the slope stability compared to the state of the water level dropping. The excess pore pressure increased as the rise in rate grew (Figure 13a), resulting in lower effective vertical stress and stability.
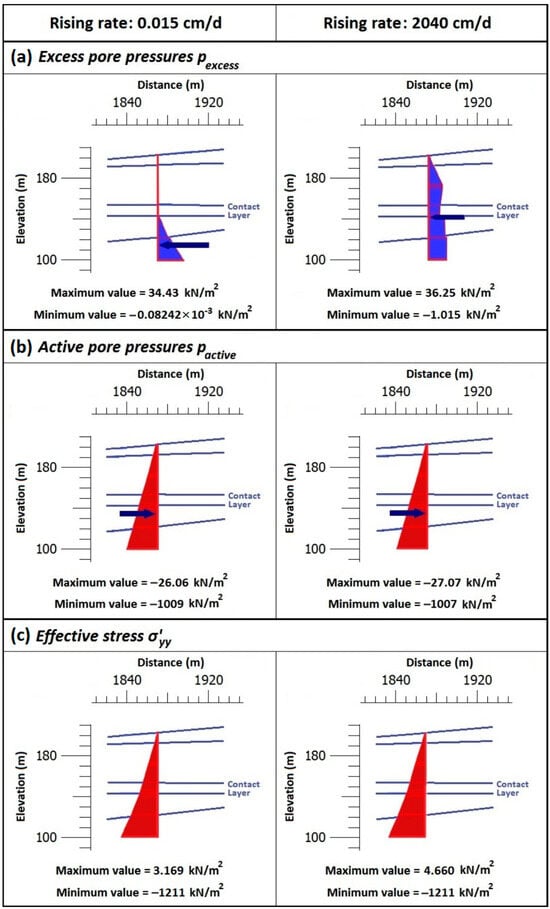
Figure 13.
Soil behavior after the water level rose 5 m in a section 1870 m from the left edge of the model. (a) excess pore pressure, (b) active water pressure, and (c) vertical effective stress versus depth (the negative sign implies pressure).
Moreover, as the increment rate rose, the active pore pressure on the slope surface decreased and improved the stability of the mass. By comparing the results from the two rising rates, it is evident that the excess pore pressure at the bottom of the Contact Layer near the slope face (at the section 1870 m from the left edge of the model) increased from 0.40 kN/m2 at the lower rate to 22 kN/m2 at the higher rate of water level rising (Figure 8a).
Moreover, it can be seen that less active pressure (and consequently higher effective stress) developed with a higher rate of rising. In detail, an active pore pressure equal to 621 kN/m2 developed at the bottom of the contact layer under a rising rate of 0.015 cm/d and 599 kN/m2 under the rate of 2040 cm/d.
Through the dissipation of water pressure, the soil mass consolidated. The analytical results indicate that the lower the falling rate, the higher the vertical effective stress in depth. In detail, the effective stress at the bottom of the Contact Layer (+142 m) was calculated to be equal to 589 kN/m2 under a rising rate of 0.015 cm/d and 610 kN/m2 under a rate of 2040 cm/d.
Regarding the slope movements, the horizontal displacements decreased with an increase in the rate of rising (Figure 14), with a tendency to stabilize at high rates of water level change. The direction of the vectors of the horizontal displacements Ux was toward the face of the slope.
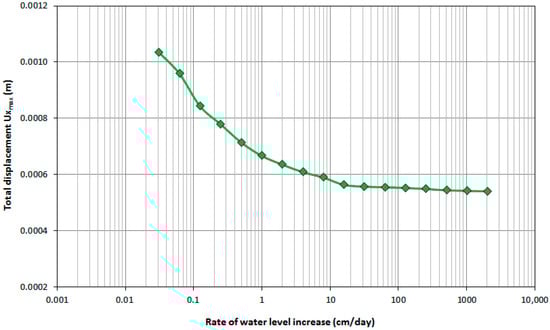
Figure 14.
Horizontal displacements vs. the rate of water rising at the crest of the slope (coordinates: x = 1899, y = 201).
The safety factor attained the max value (FS = 1.69) when the rate of rising exceeded the permeability and consequently the seepage in the soil mass (Figure 15).
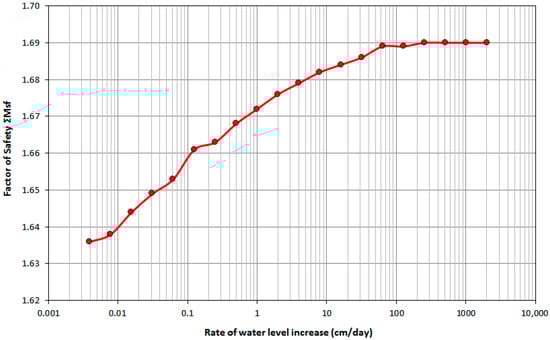
Figure 15.
Relation between safety factor and reservoir filling rate under a 5 m increase in the reservoir water level.
The results indicate that the rise in water level is more favorable for slope stability than the decrease in water level. The results are consistent with the findings of Paronuzzi et al. [27]. The seepage force and the water load resulting from the increase in the water level in the reservoir dominated in relation to the effect of the pore-water pressure that negatively affected the shear strength of the soil. As result, the stability factor increases if the water level rises.
7. Conclusions
The following conclusions were drawn from the slope stability analysis with regard to variations in water level:
- The slope stability decreases as the water level drops; the stability factor is negatively related to the rate of lowering the water level.
- Increased fluctuations affect slope safety. With a specified number of fluctuations, the soil mass seems to become less stable as the rate of change in the water level increases. However, at a specific speed, the stability grows as the number of fluctuations increases.
- The rise in the water level causes the unsaturated region of the slope to shrink, and may reduce the stability of the reservoir slope. However, the water pressure due to the external water level acts on the slope surface with a positive impact on the stability factor, and as a final result, the rise in water level improves slope stability.
- Furthermore, when comparing the stability of the slope, it is more stable under conditions of gradual water-level rising than water-level drop conditions.
These results can serve as a reference for the assessment of the slope stability in pit lakes, leading to the prevention of problems and better management of the project.
Author Contributions
Conceptualization, E.S.; Methodology, E.S. and G.S.; Map production, geometrical, and geological models, V.R., M.A.H. and J.B.; Software; G.S., E.S., and D.V.; Validation, E.S., M.G., V.R., M.A.H. and J.B.; Formal analysis, E.S., M.G. and G.S; Data curation, D.V. and G.S.; Supervision, E.S. All authors have read and agreed to the published version of the manuscript.
Funding
The work was conducted within the RAFF project (Risk Assessment of Final Pits During Flooding), co-financed by the Research Fund for Coal and Steel (RFCS) under Grant Agreement No. 847299-RAFF.
Institutional Review Board Statement
Not applicable.
Informed Consent Statement
Not applicable.
Data Availability Statement
The original contributions presented in the study are included in the article; further inquiries can be directed to the corresponding author.
Conflicts of Interest
The authors declare no conflicts of interest.
References
- Schultze, M.; Hemm, M.; Geller, W.; Benthaus, F.C. Pit Lakes in Germany: Hydrography, Water Chemistry, and Management. In Acidic Pit Lakes; Springer: Berlin/Heidelberg, Germany, 2013; pp. 265–291. [Google Scholar]
- Schultze, M.; Pokrandt, K.-H.; Hille, W. Pit Lakes of the Central German Lignite Mining District: Creation, Morphometry and Water Quality Aspects. Limnologica 2010, 40, 148–155. [Google Scholar] [CrossRef]
- Oggeri, C.; Fenoglio, T.M.; Godio, A.; Vinai, R. Overburden Management in Open Pits: Options and Limits in Large Limestone Quarries. Int. J. Min. Sci. Technol. 2019, 29, 217–228. [Google Scholar] [CrossRef]
- Redondo-Vega, J.M.; Melón-Nava, A.; Peña-Pérez, S.A.; Santos-González, J.; Gómez-Villar, A.; González-Gutiérrez, R.B. Coal Pit Lakes in Abandoned Mining Areas in León (NW Spain): Characteristics and Geoecological Significance. Environ. Earth Sci. 2021, 80, 792. [Google Scholar] [CrossRef]
- Renaud, V.; Al Heib, M.; Burda, J. 3D Large-Scale Numerical Model of Open-Pit Lake Slope Stability case Study of Lake Most. Bull. Eng. Geol. Environ. 2022, 81, 282. [Google Scholar] [CrossRef]
- Lund, M.A.; Blanchette, M.L. Closing Pit Lakes as Aquatic Ecosystems: Risk, Reality, and Future Uses. Wiley Interdiscip. Rev. Water 2023, 10, e1648. [Google Scholar] [CrossRef]
- Geller, W.; Schultze, M.; Kleinmann, B.; Wolkersdorfer, C. Acidic Pit Lakes: The Legacy of Coal and Metal Surface Mines; Springer Science & Business Media: Berlin/Heidelberg, Germany, 2012. [Google Scholar]
- Vinzelberg, G.; Dahmen, D. The Inden Residual Lake and the Federal Autobahn A44n–Geotechnical Requirements to Be Met by Large-Scale Structures in the Rhenish Lignite Mining Area. In Proceedings of the 12th International Symposium Continuous Surface Mining-Aachen 2014; Springer: Berlin/Heidelberg, Germany, 2015; pp. 91–100. [Google Scholar]
- Graupner, H. Nachterstedt Landslide Raises Worries for Other Former Mine Areas; Deutsche Welle: Bonn, Germany, 2009. [Google Scholar]
- Johansson, J.; Edeskär, T. Effects of External Water-Level Fluctuations on Slope Stability. Electron. J. Geotech. Eng. 2014, 19, 2437–2463. [Google Scholar]
- Johansson, J.; Edeskär, T. Modelling Approaches Considering Impacts of Water-Level Fluctuations on Slope Stability. J. Earth Sci. Geotech. Eng. 2014, 4, 17–34. [Google Scholar]
- Jia, G.W.; Zhan, T.L.T.; Chen, Y.M.; Fredlund, D.G. Performance of a Large-Scale Slope Model Subjected to Rising and Lowering Water Levels. Eng. Geol. 2009, 106, 92–103. [Google Scholar] [CrossRef]
- Wang, H.B.; Xu, W.Y.; Xu, R.C.; Jiang, Q.H.; Liu, J.H. Hazard Assessment by 3D Stability Analysis of Landslides Due to Reservoir Impounding. Landslides 2007, 4, 381–388. [Google Scholar] [CrossRef]
- Fourniadis, I.G.; Liu, J.G.; Mason, P.J. Regional Assessment of Landslide Impact in the Three Gorges Area, China, Using ASTER Data: Wushan-Zigui. Landslides 2007, 4, 267–278. [Google Scholar] [CrossRef]
- Cojean, R.; Caï, Y.J. Analysis and Modeling of Slope Stability in the Three-Gorges Dam Reservoir (China). The Case of Huangtupo Landslide. J. Mt. Sci. 2011, 8, 166–175. [Google Scholar] [CrossRef]
- Hu, X.; He, C.; Zhou, C.; Xu, C.; Zhang, H.; Wang, Q.; Wu, S. Model Test and Numerical Analysis on the Deformation and Stability of a Landslide Subjected to Reservoir Filling. Geofluids 2019, 2019, 5924580. [Google Scholar] [CrossRef]
- Fredlund, D.G.; Rahardjo, H. Soil Mechanics for Unsaturated Soils; John Wiley & Sons: Hoboken, NJ, USA, 1993. [Google Scholar]
- Gavin, K.; Xue, J. A Simple Method to Analyze Infiltration into Unsaturated Soil Slopes. Comput. Geotech. 2008, 35, 223–230. [Google Scholar] [CrossRef]
- Bittelli, M.; Valentino, R.; Salvatorelli, F.; Pisa, P.R. Monitoring Soil-Water and Displacement Conditions Leading to Landslide Occurrence in Partially Saturated Clays. Geomorphology 2012, 173, 161–173. [Google Scholar] [CrossRef]
- Lane, P.A.; Griffiths, D.V. Assessment of Stability of Slopes under Drawdown Conditions. J. Geotech. Geoenviron. Eng. 2000, 126, 443–450. [Google Scholar] [CrossRef]
- Duncan, J.M.; Wright, S.G. Soil Strength and Slope Stability; Wiley: Hoboken, NJ, USA, 2005. [Google Scholar]
- Yang, H.; Rahardjo, H.; Xiao, D. Rapid Drawdown of Water Table in Layered Soil Column. In Geoenvironmental Engineering and Geotechnics: Progress in Modeling and Applications; American Society of Civil Engineers: Reston, VA, USA, 2010; pp. 202–209. [Google Scholar]
- Pinyol, N.M.; Alonso, E.E.; Corominas, J.; Moya, J. Canelles Landslide: Modelling Rapid Drawdown and Fast Potential Sliding. Landslides 2012, 9, 33–51. [Google Scholar] [CrossRef]
- Fan, L.; Zhang, G.; Li, B.; Tang, H. Deformation and Failure of the Xiaochatou Landslide under Rapid Drawdown of the Reservoir Water Level Based on Centrifuge Tests. Bull. Eng. Geol. Environ. 2017, 76, 891–900. [Google Scholar] [CrossRef]
- Sun, G.; Yang, Y.; Jiang, W.; Zheng, H. Effects of an Increase in Reservoir Drawdown Rate on Bank Slope Stability: A Case Study at the Three Gorges Reservoir, China. Eng. Geol. 2017, 221, 61–69. [Google Scholar] [CrossRef]
- Berilgen, M.M. Investigation of Stability of Slopes under Drawdown Conditions. Comput. Geotech. 2007, 34, 81–91. [Google Scholar] [CrossRef]
- Paronuzzi, P.; Rigo, E.; Bolla, A. Influence of Filling–Drawdown Cycles of the Vajont Reservoir on Mt. Toc Slope Stability. Geomorphology 2013, 191, 75–93. [Google Scholar] [CrossRef]
- He, C.; Hu, X.; Xu, C.; Wu, S.; Zhang, H.; Liu, C. Model Test of the Influence of Cyclic Water Level Fluctuations on a Landslide. J. Mt. Sci. 2020, 17, 191–202. [Google Scholar] [CrossRef]
- Zhan, T.L.T.; Zhang, W.J.; Chen, Y.M. Influence of Reservoir Level Change on Slope Stability of a Silty Soil Bank. In Unsaturated Soils 2006; ASCE Press: Reston, VA, USA, 2006; pp. 463–472. [Google Scholar]
- Shen, Y.B.; Zhu, D.Y.; Yao, H.Y. Critical Slip Field of Slope in Process of Reservoir Water Level Fluctuations. Rock Soil Mech. 2010, 31, 179–183. [Google Scholar]
- Oh, S.; Lu, N. Slope Stability Analysis under Unsaturated Conditions: Case Studies of Rainfall-Induced Failure of Cut Slopes. Eng. Geol. 2015, 184, 96–103. [Google Scholar] [CrossRef]
- Liu, Y.; He, L.Q.; Jiang, Y.J.; Sun, M.M.; Chen, E.J.; Lee, F.-H. Effect of in Situ Water Content Variation on the Spatial Variation of Strength of Deep Cement-Mixed Clay. Géotechnique 2019, 69, 391–405. [Google Scholar] [CrossRef]
- Mao, J.-Z.; Guo, J.; Fu, Y.; Zhang, W.-P.; Ding, Y.-N. Effects of Rapid Water-Level Fluctuations on the Stability of an Unsaturated Reservoir Bank Slope. Adv. Civ. Eng. 2020, 2020, 1–10. [Google Scholar] [CrossRef]
- Chen, G.; Li, Q.-Y.; Li, D.-Q.; Wu, Z.-Y.; Liu, Y. Main Frequency Band of Blast Vibration Signal Based on Wavelet Packet Transform. Appl. Math. Model. 2019, 74, 569–585. [Google Scholar] [CrossRef]
- Bishop, A.W.; Blight, G.E. Some Aspects of Effective Stress in Saturated and Partly Saturated Soils. Geotechnique 1963, 13, 177–197. [Google Scholar] [CrossRef]
- Khalili, N.; Khabbaz, M.H. A Unique Relationship for χ for the Determination of the Shear Strength of Unsaturated Soils. Geotechnique 1998, 48, 681–687. [Google Scholar] [CrossRef]
- Plaxis, B.V. Plaxis 2D Reference Manual; Plaxis, B.V.: Delft, The Netherlands, 2018. [Google Scholar]
- Bolzon, G.; Schrefler, B.A.; Zienkiewicz, O.C. Elastoplastic Soil Constitutive Laws Generalized to Partially Saturated States. Géotechnique 1996, 46, 279–289. [Google Scholar] [CrossRef]
- Van Genuchten, M.T. A Closed-Form Equation for Predicting the Hydraulic Conductivity of Unsaturated Soils. Soil Sci. Soc. Am. J. 1980, 44, 892–898. [Google Scholar] [CrossRef]
- Galavi, V. Groundwater Flow, Fully Coupled Flow Deformation and Undrained Analyses in PLAXIS 2D and 3D. Plaxis Rep. 2010. [Google Scholar] [CrossRef]
- Žižka, L.; Burda, J. Post Exploitation Lakes. In Zpravodaj Hnӗdé Uhlí; Brown Coal Research Institute: Budovatelů, Czech Republic, 2021; pp. 11–46. [Google Scholar]
- Burda, J.; Veselý, M.; Řehoř, M.; Vilímek, V. Reconstruction of a Large Runout Landslide in the Krušné Hory Mts. (Czech Republic). Landslides 2018, 15, 423–437. [Google Scholar] [CrossRef]
- Arvanitidis, C.; Steiakakis, E.; Agioutantis, Z. Peak Friction Angle of Soils as a Function of Grain Size. Geotech. Geol. Eng. 2019, 37, 1155–1167. [Google Scholar] [CrossRef]
- Stiakakis, E.; Agioutantis, Z. Stiffness and Strength Parameters of the Ptolemais Calcareous Marls. In Proceedings of the International Workshop in Geoenvironment and Geotechnics, Milos Island, Greece, 12–14 September 2005; pp. 51–57. [Google Scholar]
- Steiakakis, E.; Agioutantis, Z. A Kinetic Behavior Model at a Surface Lignite Mine, Based on Geotechnical Investigation. Simul. Model. Pract. Theory 2010, 18, 558–573. [Google Scholar] [CrossRef]
- Steiakakis, E.; Kavouridis, K.; Monopolis, D. Large Scale Failure of the External Waste Dump at the South Field Lignite Mine, Northern Greece. Eng. Geol. 2009, 104, 269–279. [Google Scholar] [CrossRef]
- Steiakakis, E.; Xiroudakis, G.; Lazos, I.; Vavadakis, D.; Bazdanis, G. Stability Analysis of a Multi-Layered Slope in an Open Pit Mine. Geosciences 2023, 13, 359. [Google Scholar] [CrossRef]
- Xia, M.; Ren, G.M.; Zhu, S.S.; Ma, X.L. Relationship between Landslide Stability and Reservoir Water Level Variation. Bull. Eng. Geol. Environ. 2015, 74, 909–917. [Google Scholar] [CrossRef]
Disclaimer/Publisher’s Note: The statements, opinions and data contained in all publications are solely those of the individual author(s) and contributor(s) and not of MDPI and/or the editor(s). MDPI and/or the editor(s) disclaim responsibility for any injury to people or property resulting from any ideas, methods, instructions or products referred to in the content. |
© 2024 by the authors. Licensee MDPI, Basel, Switzerland. This article is an open access article distributed under the terms and conditions of the Creative Commons Attribution (CC BY) license (https://creativecommons.org/licenses/by/4.0/).