1. Introduction
Highways play a pivotal role in Egypt’s economy, particularly in densely populated regions such as the Nile Valley. The Western Desert, Eastern Desert, and Nile Valley Highways serve as the primary arteries connecting Cairo to the Upper Egypt provinces, with the western and eastern desert routes witnessing substantial traffic. Recent years have seen a surge in highway use due to urban expansion, reclamation projects, and industrial zones. A considerable portion of these highways traverse rock-cut zones, presenting significant engineering challenges, particularly in the context of highway slope instability and rockfalls [
1,
2,
3,
4,
5].
Slope instability along highways creates risks and concerns for the safety of commuters, the integrity of transportation infrastructure, local businesses, and the environment. As urbanization continues to expand in the coming decades, the demand for civil infrastructure development in challenging terrains will inevitably lead to an increase in the number of rock cuts along transportation networks [
6,
7]. While rockfalls may frequently occur along highways, they often remain unnoticed until they result in major inconveniences, property damage or, in the worst cases, loss of life. This largely underscores the public’s limited awareness of rockfall hazards unless a specific incident garners substantial attention [
8,
9,
10,
11,
12].
Transportation organizations, tasked with establishing and maintaining safe and cost-effective roadways and routes, often grapple with the issue of rockfalls. The term “rockfall” encompasses various types of rock slope failures that harm highways. The classification and assessment of slope stability necessitate a profound understanding of engineering geology and geotechnical factors, including geological structures, rock mass discontinuities, and the characteristics of rock-cut faces. Additional factors like traffic density, road design, and vehicle movement patterns also need consideration [
13,
14].
Multiple methodologies have been proposed to evaluate slope instability, including investigations of the engineering properties of rocks and rock masses, studies on the impact of boulders falling from slopes onto highways using modeling tools, and the utilization of rockfall hazard rating systems. The level and nature of the hazard risk depend on factors such as rock discontinuity characteristics, slope height, rock weathering, water presence, and the effectiveness of catchment systems. The volume and speed of traffic, sight distance, and other elements also influence the consequences of potential rockfalls, including potential environmental hazards [
15,
16,
17,
18,
19].
The primary objectives of this study are to investigate the vulnerability of limestone rock-cut faces based on field assessments and to offer recommendations for slope stability enhancement. The term “rockfall” is employed in a comprehensive sense, encompassing various modes of rockfalls and rockslides. This study involves field investigations in the rock-cut region to identify the geological and geotechnical characteristics of the rock material and evaluate factors impacting slope stability. Specific goals include identifying variables leading to slope instability, collecting discontinuity data to understand geological structures and their influence on failure modes, and assessing the arrangement of rock cuts to simulate the impact of falling rocks on the highway. A comprehensive rating system for landslide hazards will be employed, and mitigation strategies will be developed for different highway sections to address potential issues.
In the following sections, this study delves into the types of decorative stones used in indoor and outdoor settings, the geographical and geological context of the area, laboratory testing results for rock samples, and the application of the AHP approach in weight estimation for stones. Furthermore, the study explores the TOPSIS approach and its utility, culminating in the proposed assessment approach. Results and discussions, along with limitations and implications of the study, are presented. Finally, the conclusions drawn from this research are outlined.
Using different modeling programs like CRSB, several studies have examined the effects of rolling and bouncing boulders from rock slopes on highways [
20,
21]. The adoption of rock fall hazard rating systems has also been the subject of recent literature, with Oregon serving as a notable example. The system has been thoroughly studied in several states in both the United States and Canada [
22,
23,
24].
The assessment of hazard risk involves a comprehensive analysis of various factors that collectively determine the degree and nature of the threat. Key contributors to hazard risk include the characteristics of rock discontinuities, the height of the rock slope, the style of rock weathering, the presence of water, and the effectiveness of the catchment ditch. Additionally, the level of consequence is influenced by factors such as traffic volume, speed, decision site distance, and other relevant considerations. The potential ramifications of rockfalls extend beyond infrastructure safety, as they pose a risk to ecosystems. Specifically, rocks with high concentrations of pyrite in metamorphic or sedimentary formations can lead to significant environmental concerns if rockfall or subsequent filtration results in the entry of sulfuric acid into rivers or streams [
25,
26,
27,
28,
29]. The intricate interplay of these factors underscores the need for a comprehensive understanding of the various elements contributing to rockfall hazards and their potential environmental impact [
30,
31,
32].
Evaluating the stability of cut rock masses is critical for ensuring the safety of highways, especially in regions like Egypt’s Nile Valley, where many roads pass through rock-cut zones prone to slope instability and rockfalls. While existing methods, such as geological assessments, rockfall hazard rating systems, and modeling tools, provide valuable insights, they often focus on isolated factors and lack an integrated approach. These methods typically overlook the complex interaction between geological conditions, traffic patterns, and environmental risks, making it difficult to assess and mitigate rockfall hazards effectively.
This research offers a hybrid, numerical field-based evaluation of limestone rock-cut faces. By considering key factors such as rock mass characteristics and slope geometry, this study aims to provide more accurate stability assessments and tailored mitigation strategies. The proposed approach offers a more holistic solution to rockfall hazards, improving safety and infrastructure resilience.
Therefore, the primary focus of this study is to investigate the vulnerability of limestone rock-cut faces using field tests. The term “rockfall” is utilized broadly, covering various scenarios like free-falling, toppling, bouncing, rolling, or sliding rocks. Field investigations in the rock-cut area aimed to evaluate crucial geological and geotechnical properties of the rock material and identify key factors affecting slope stability. Specific objectives include: (1) describing essential variables contributing to unstable slope hazards at the site, (2) collecting discontinuity data to comprehend geological structures and patterns, assessing their orientation’s impact on failure modes (planar and wedge failure analysis), (3) analyzing the arrangement of the rock cut in different regions to simulate boulder falls and assess their impact on the highway, (4) applying a landslide hazards rating system, and (5) formulating a mitigation strategy for each highway section, exploring diverse options and designs to anticipate future challenges.
2. Geological Features of the Investigated Area
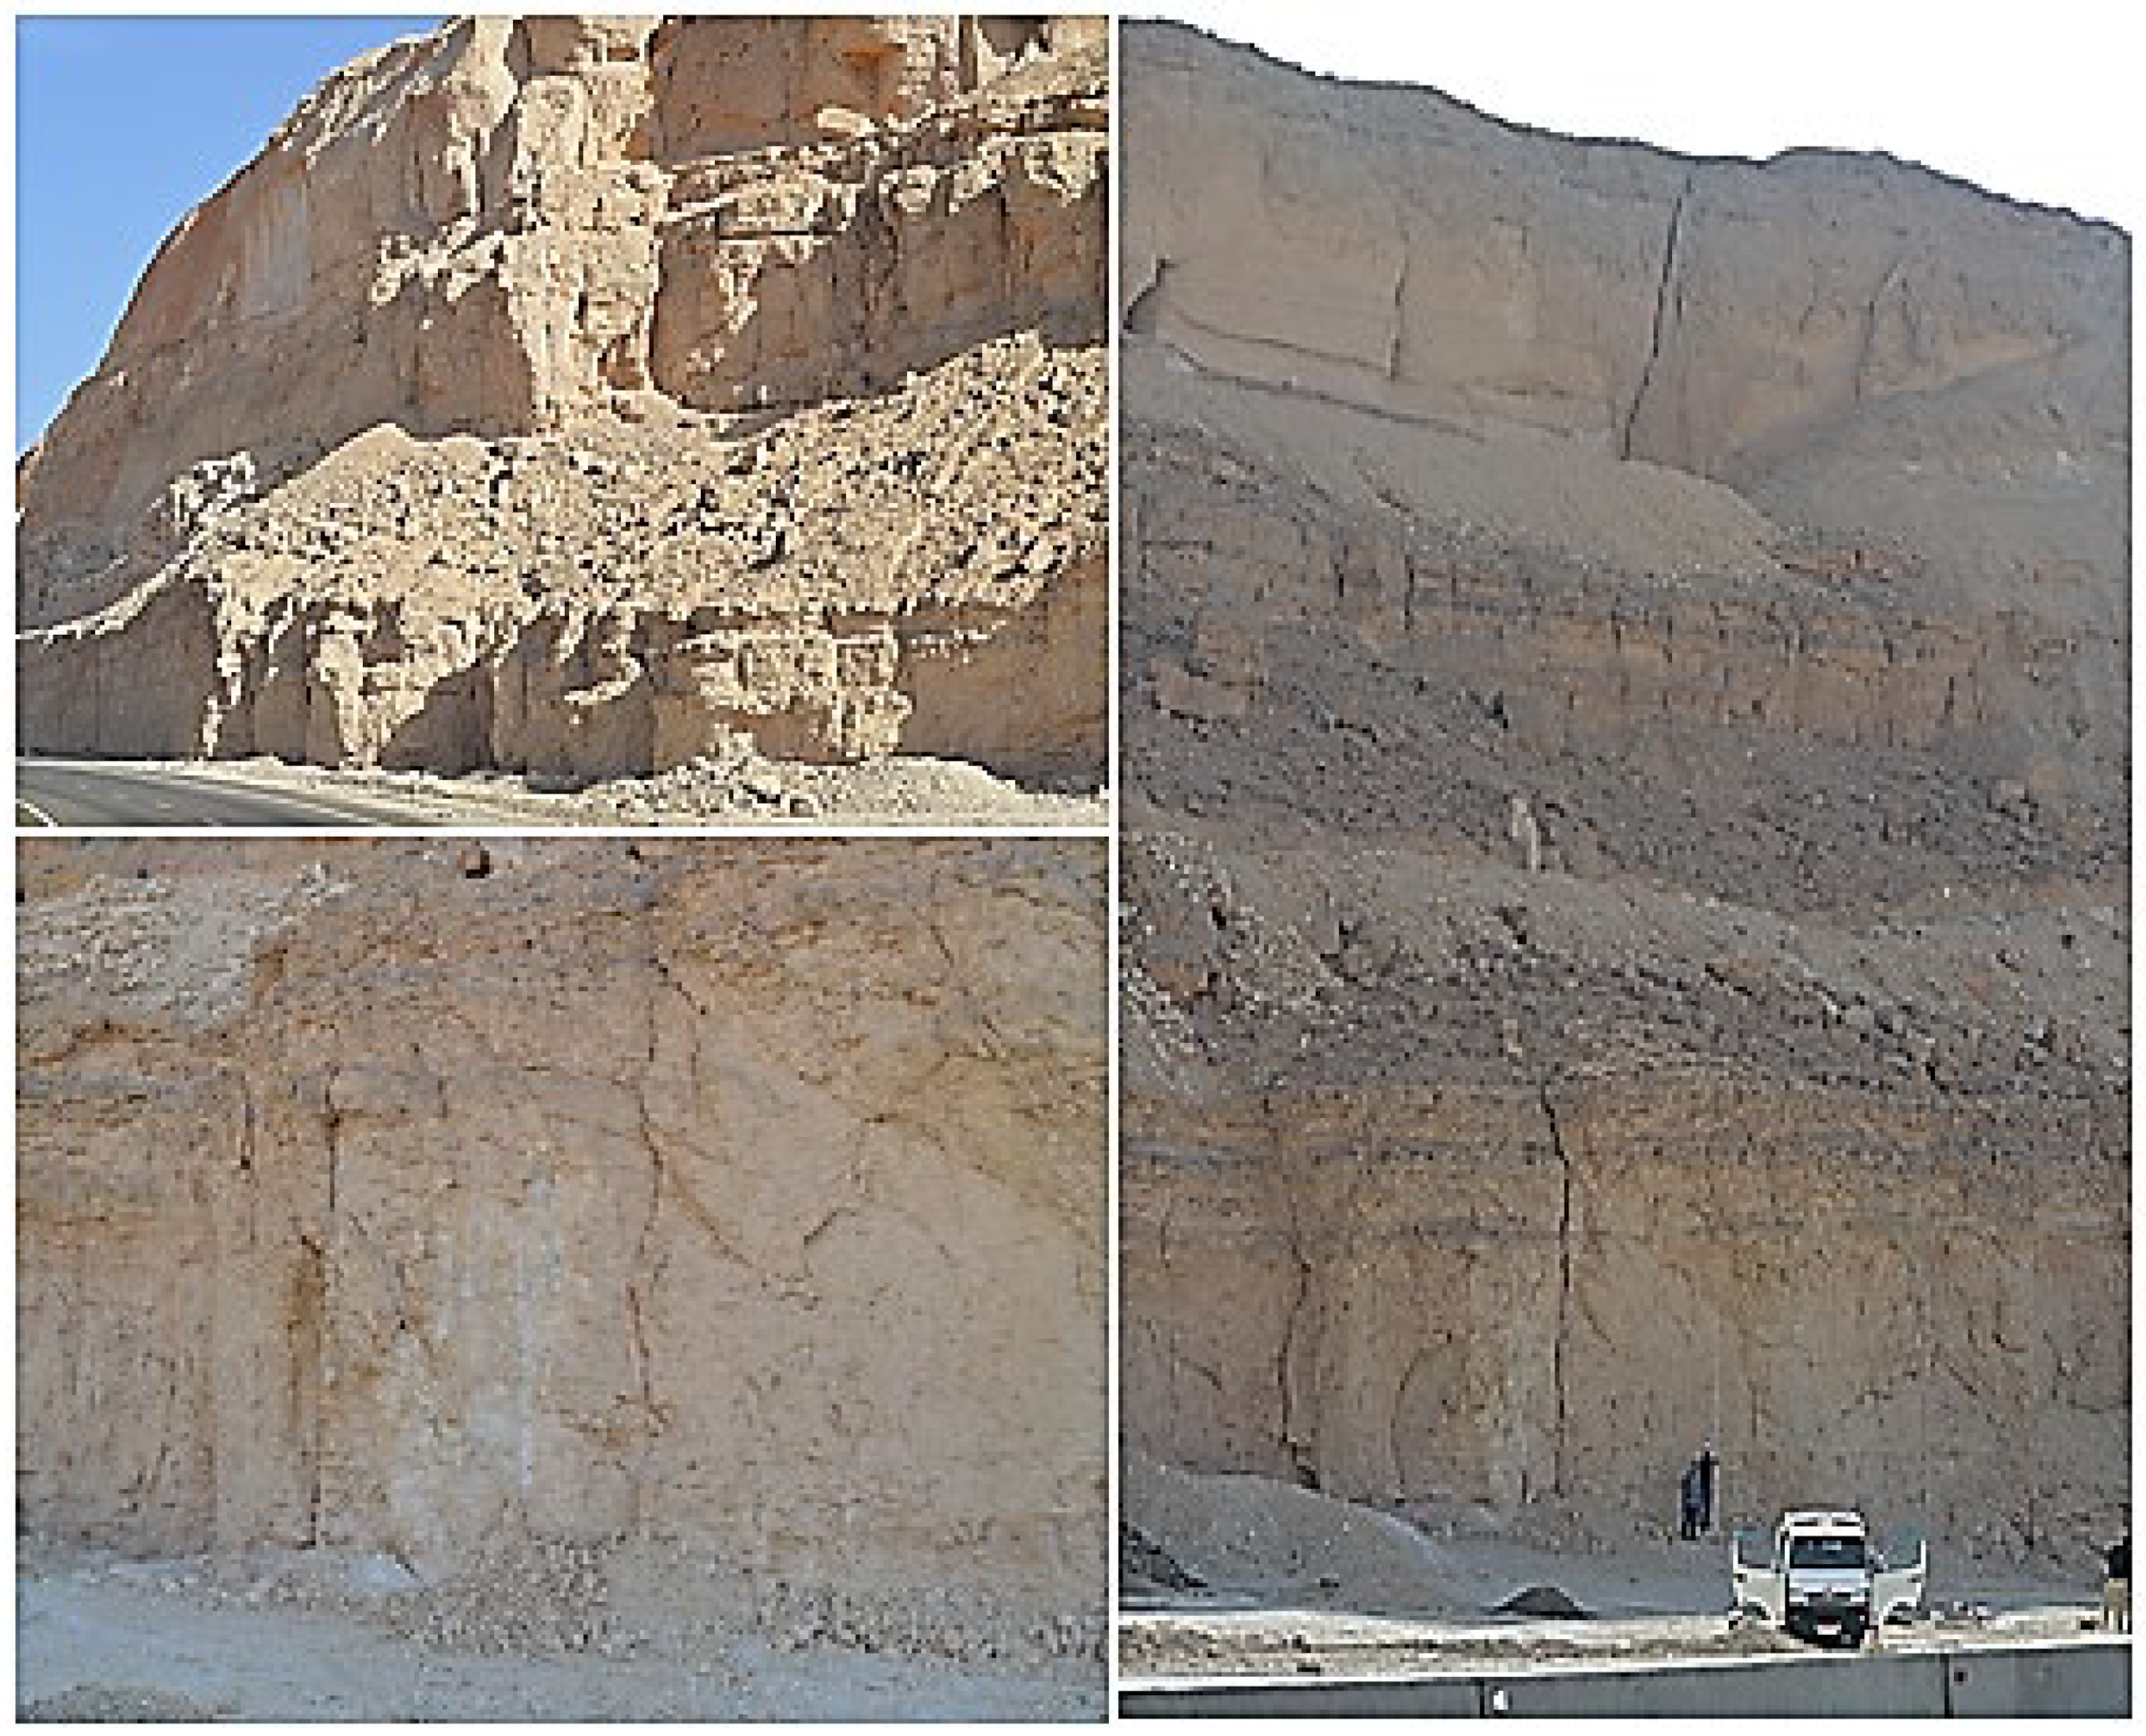
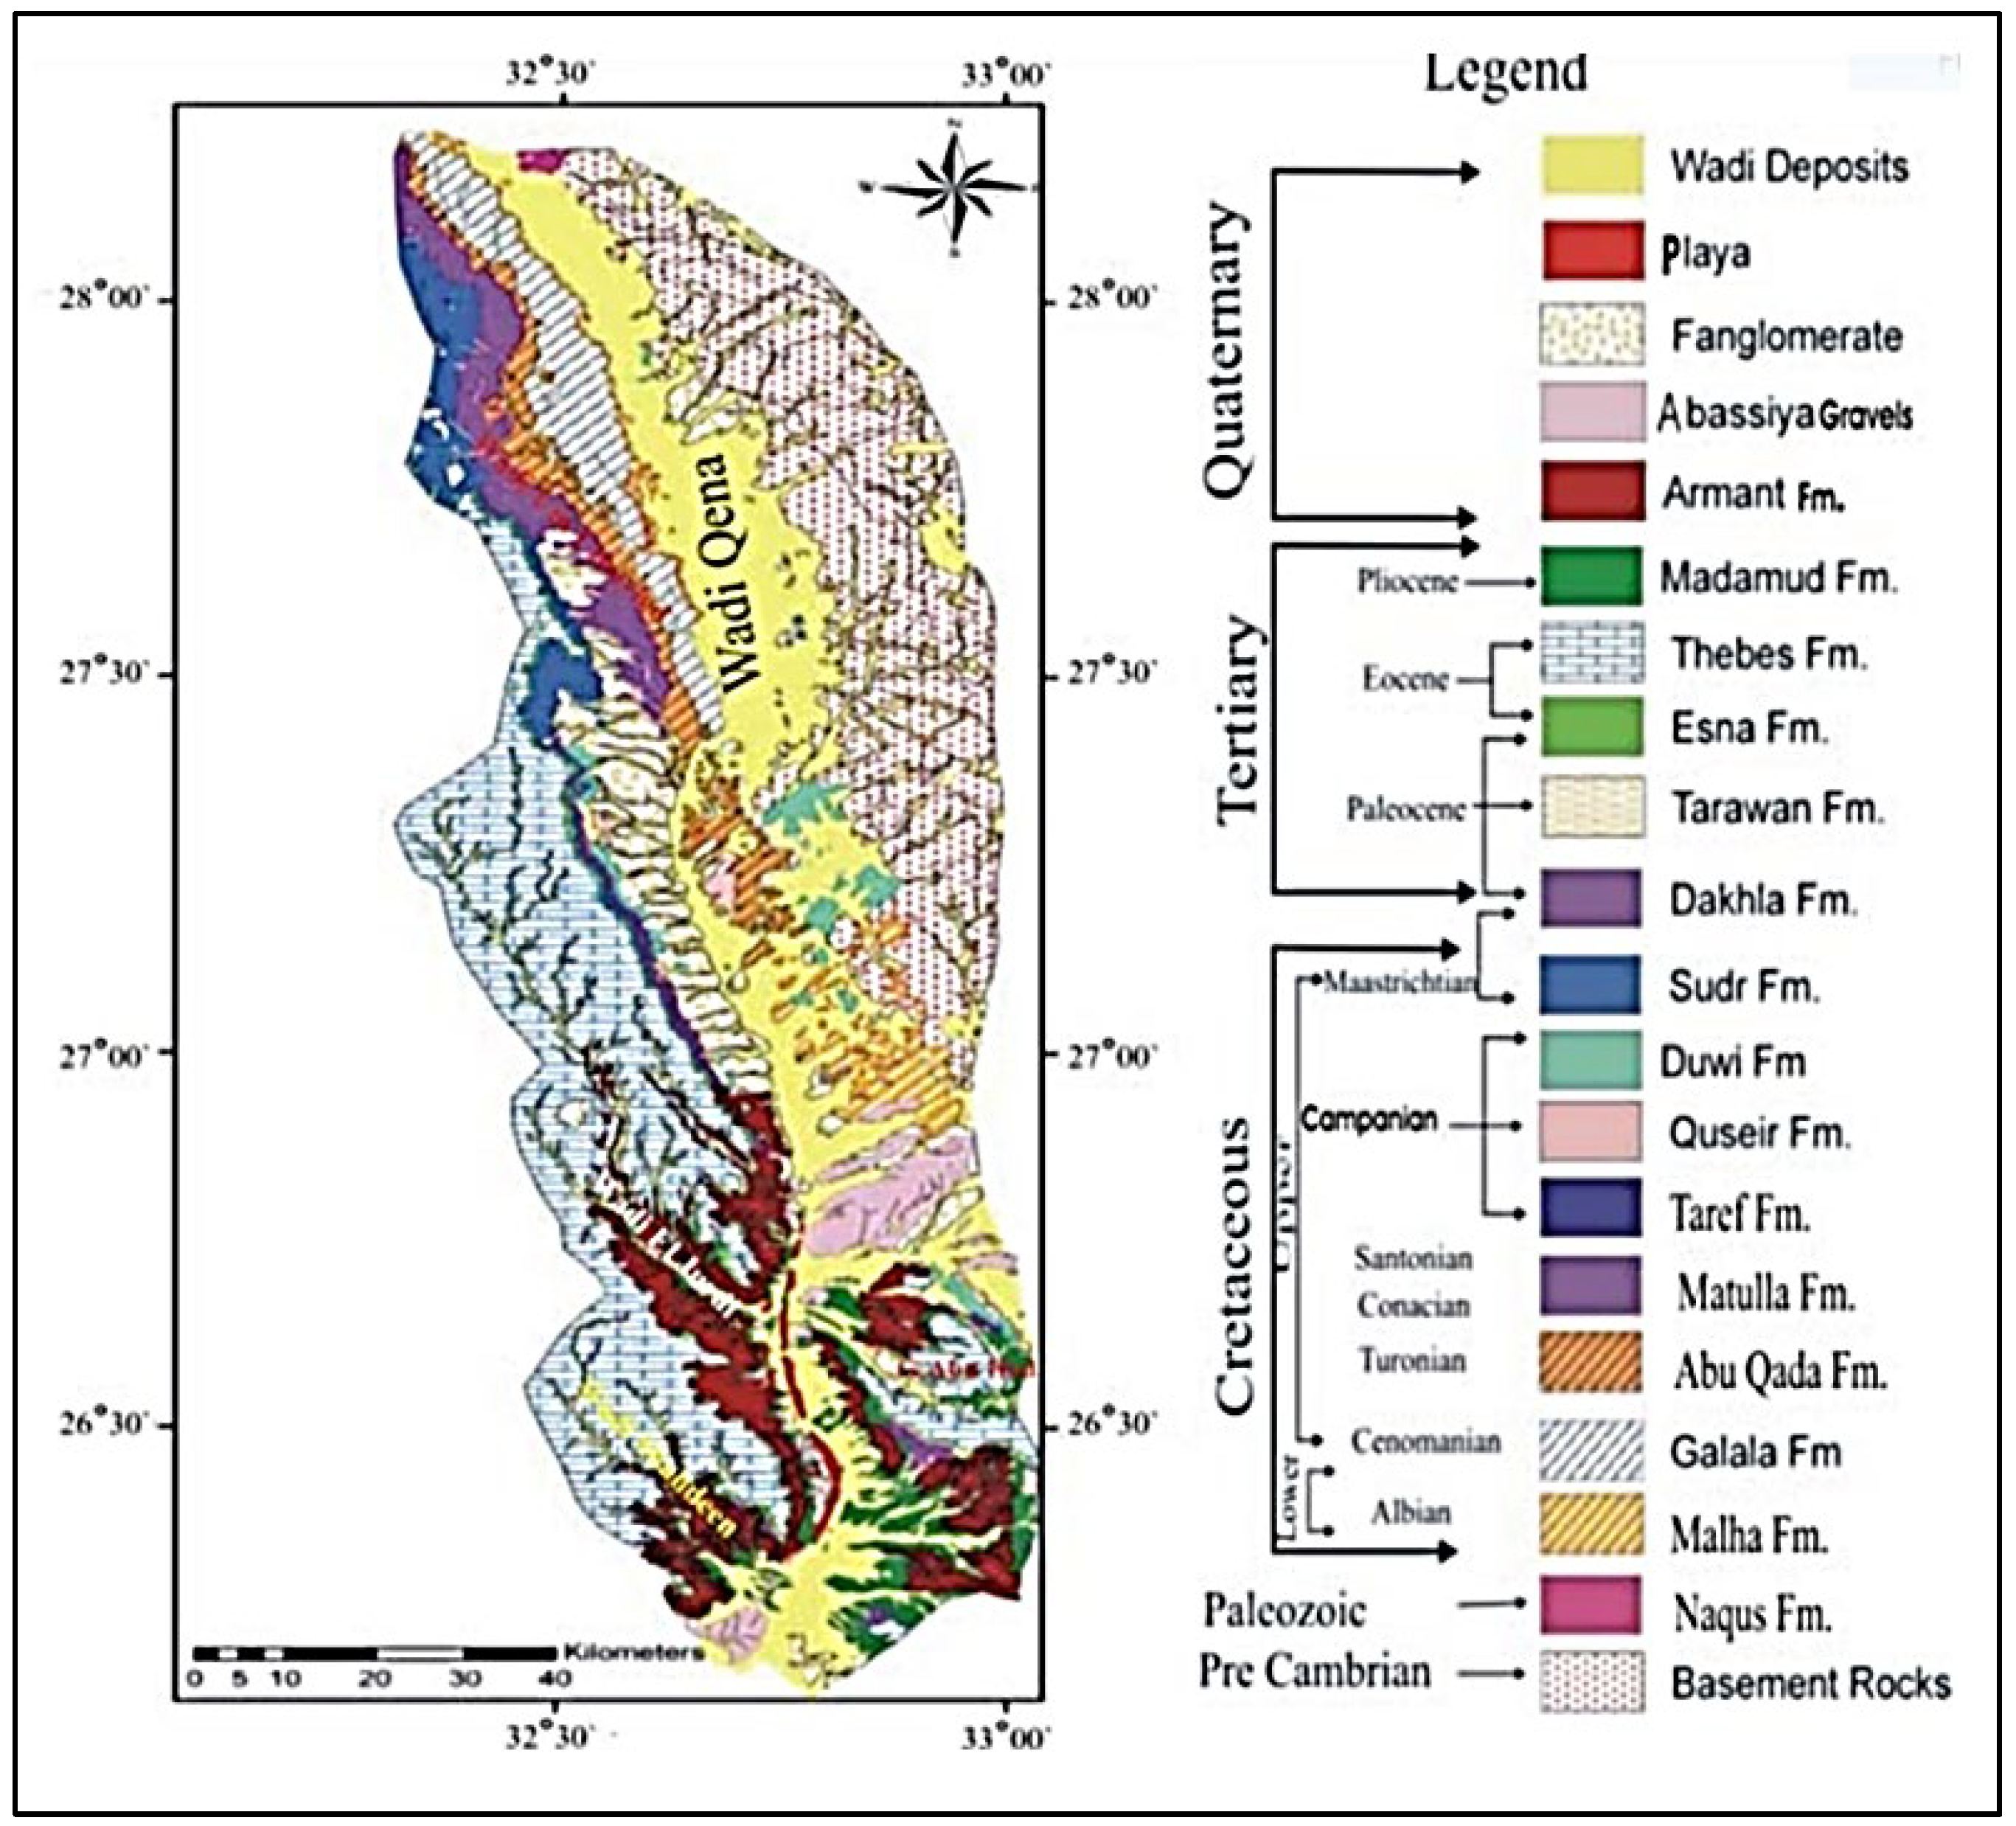
This study focuses on a 2 km long rock-cut zone along the Eastern Desert Highway, located approximately 90 km north of New Qena, spanning the region between the Sohag and Qena governorates, as shown in
Figure 1 [
33,
34,
35]. The area is predominantly composed of Eocene limestone, which is significantly dissected by filled sinkholes. The limestone exhibits a color range from white to grey, with aged reddish surfaces that highlight its exposure to weathering. Along this stretch, the highway consists of two lanes in each direction, with no ditches and minimal road edges, as depicted in
Figure 2. The limestone in the rock cut is heavily fractured and contains numerous sinkholes filled with highly weathered debris. A geological map of the region reveals a network of joints cutting through the area [
36,
37].
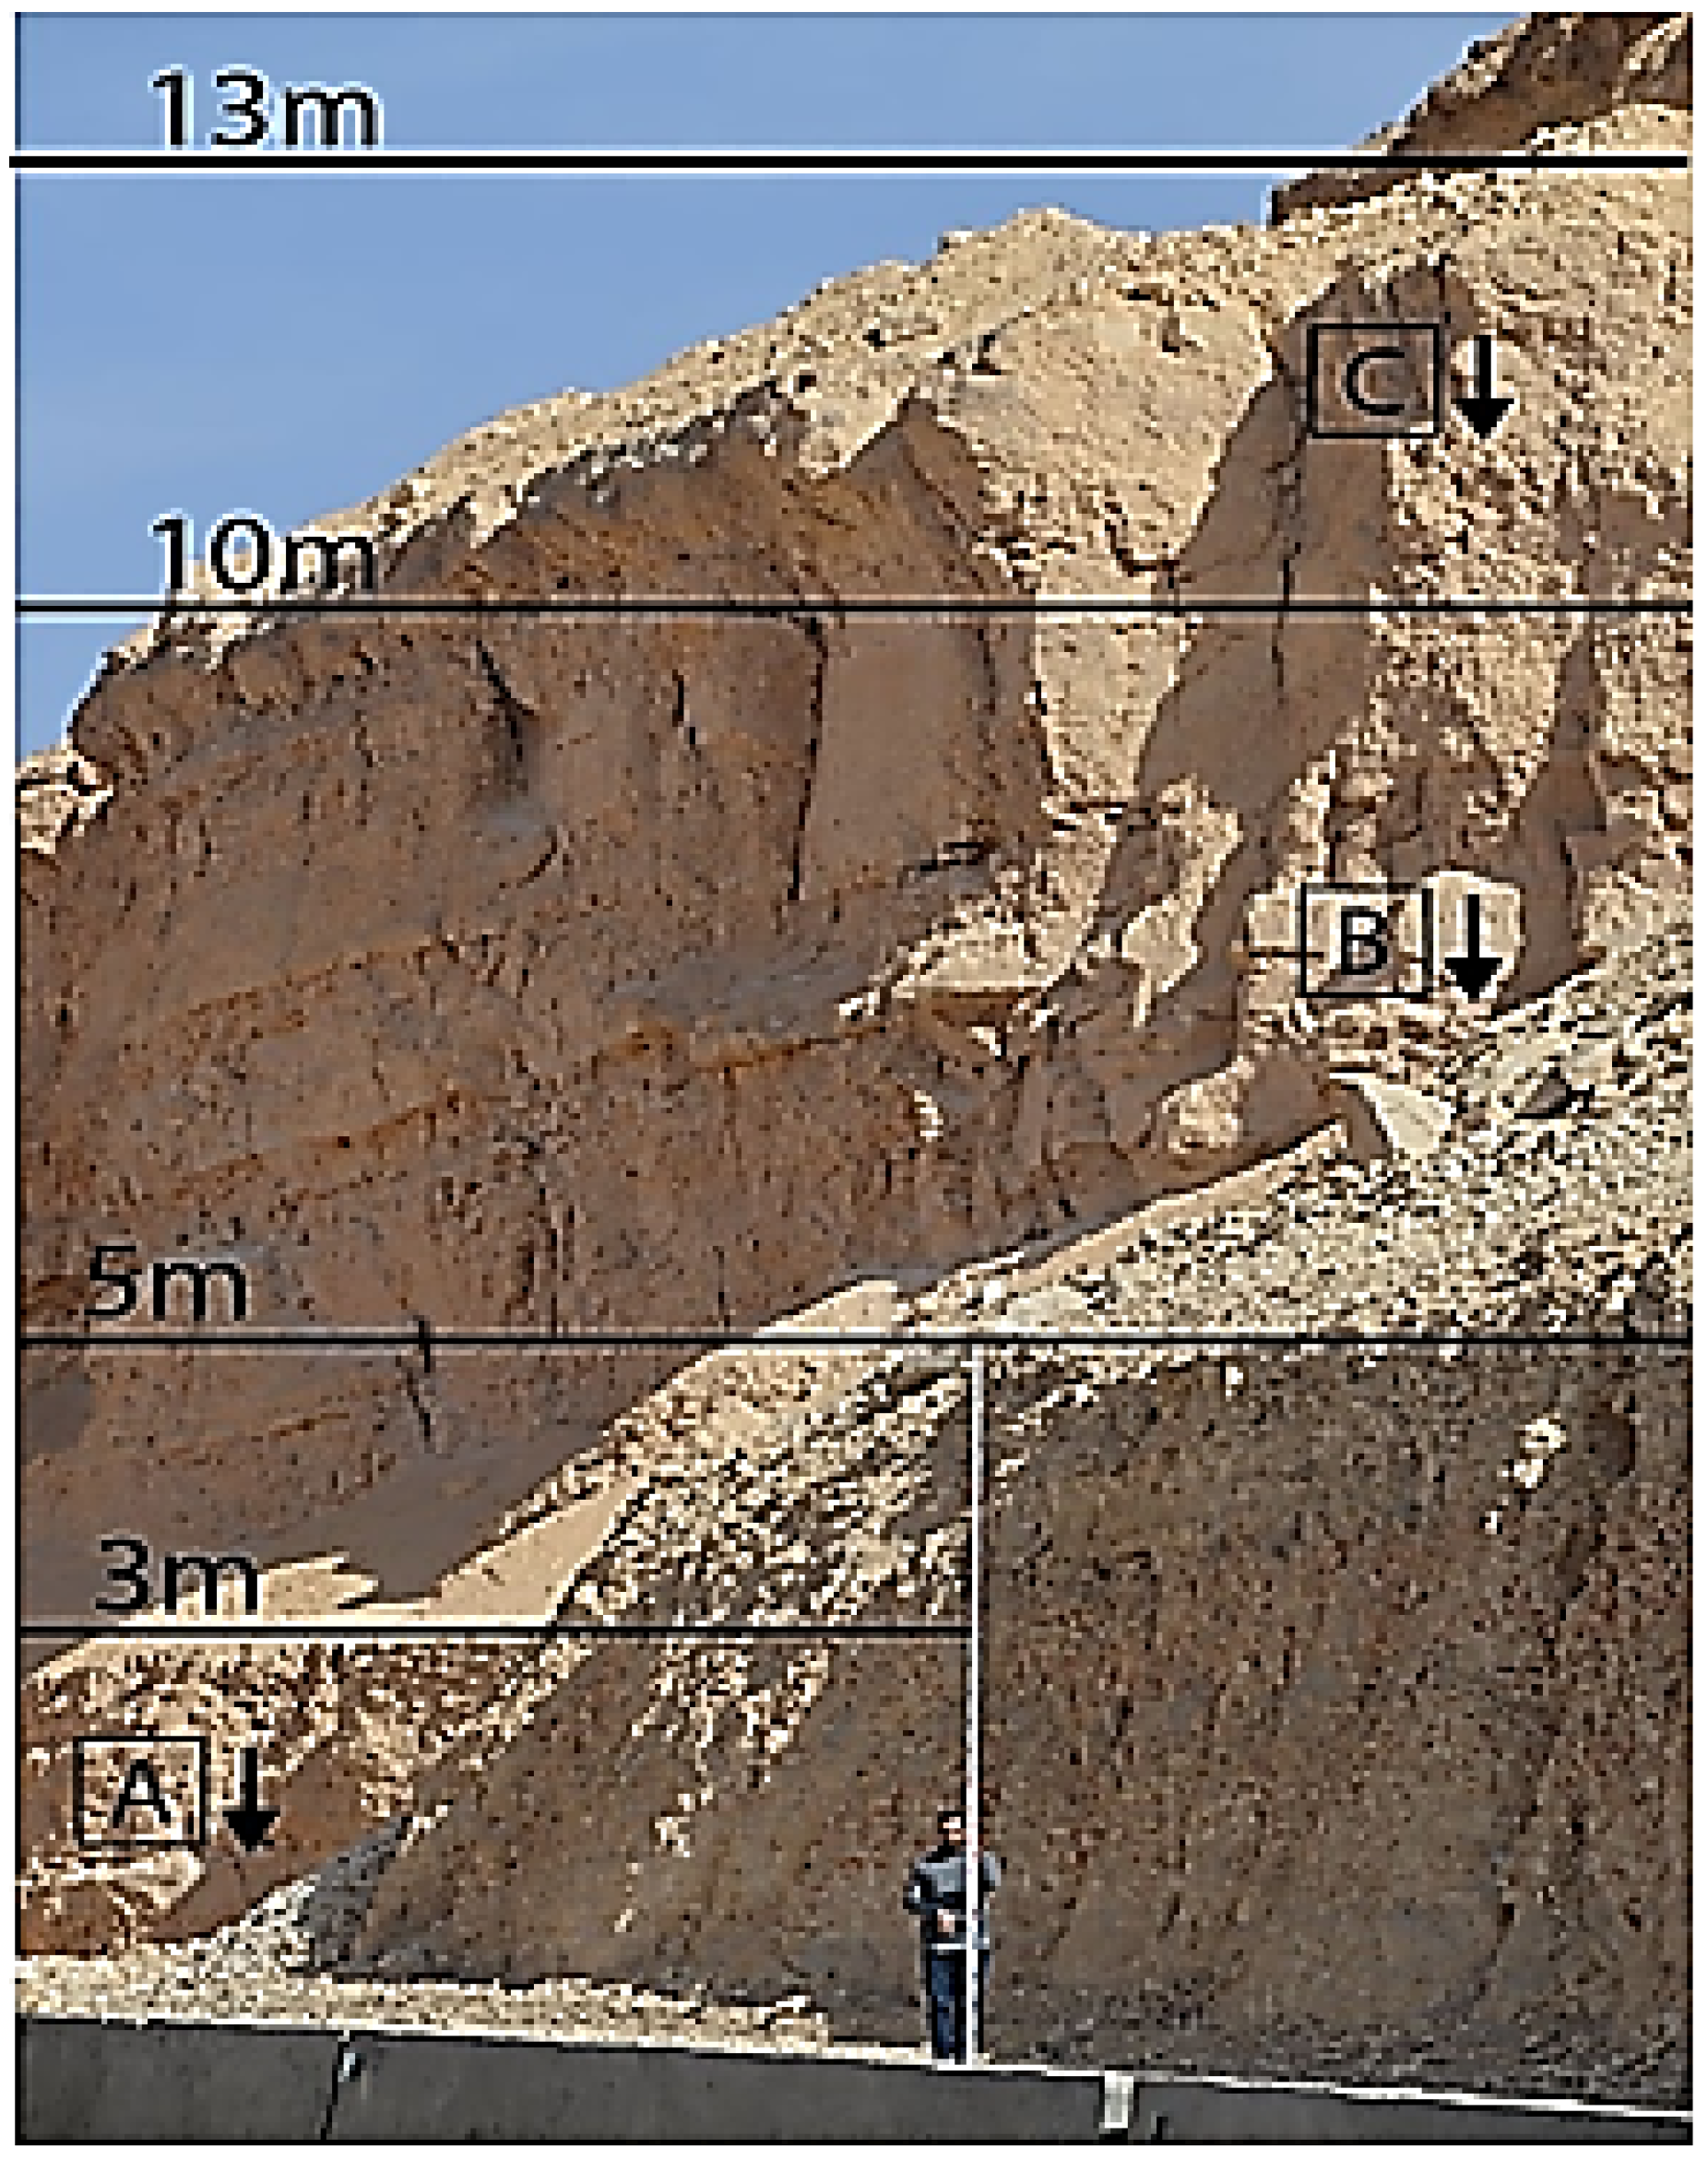
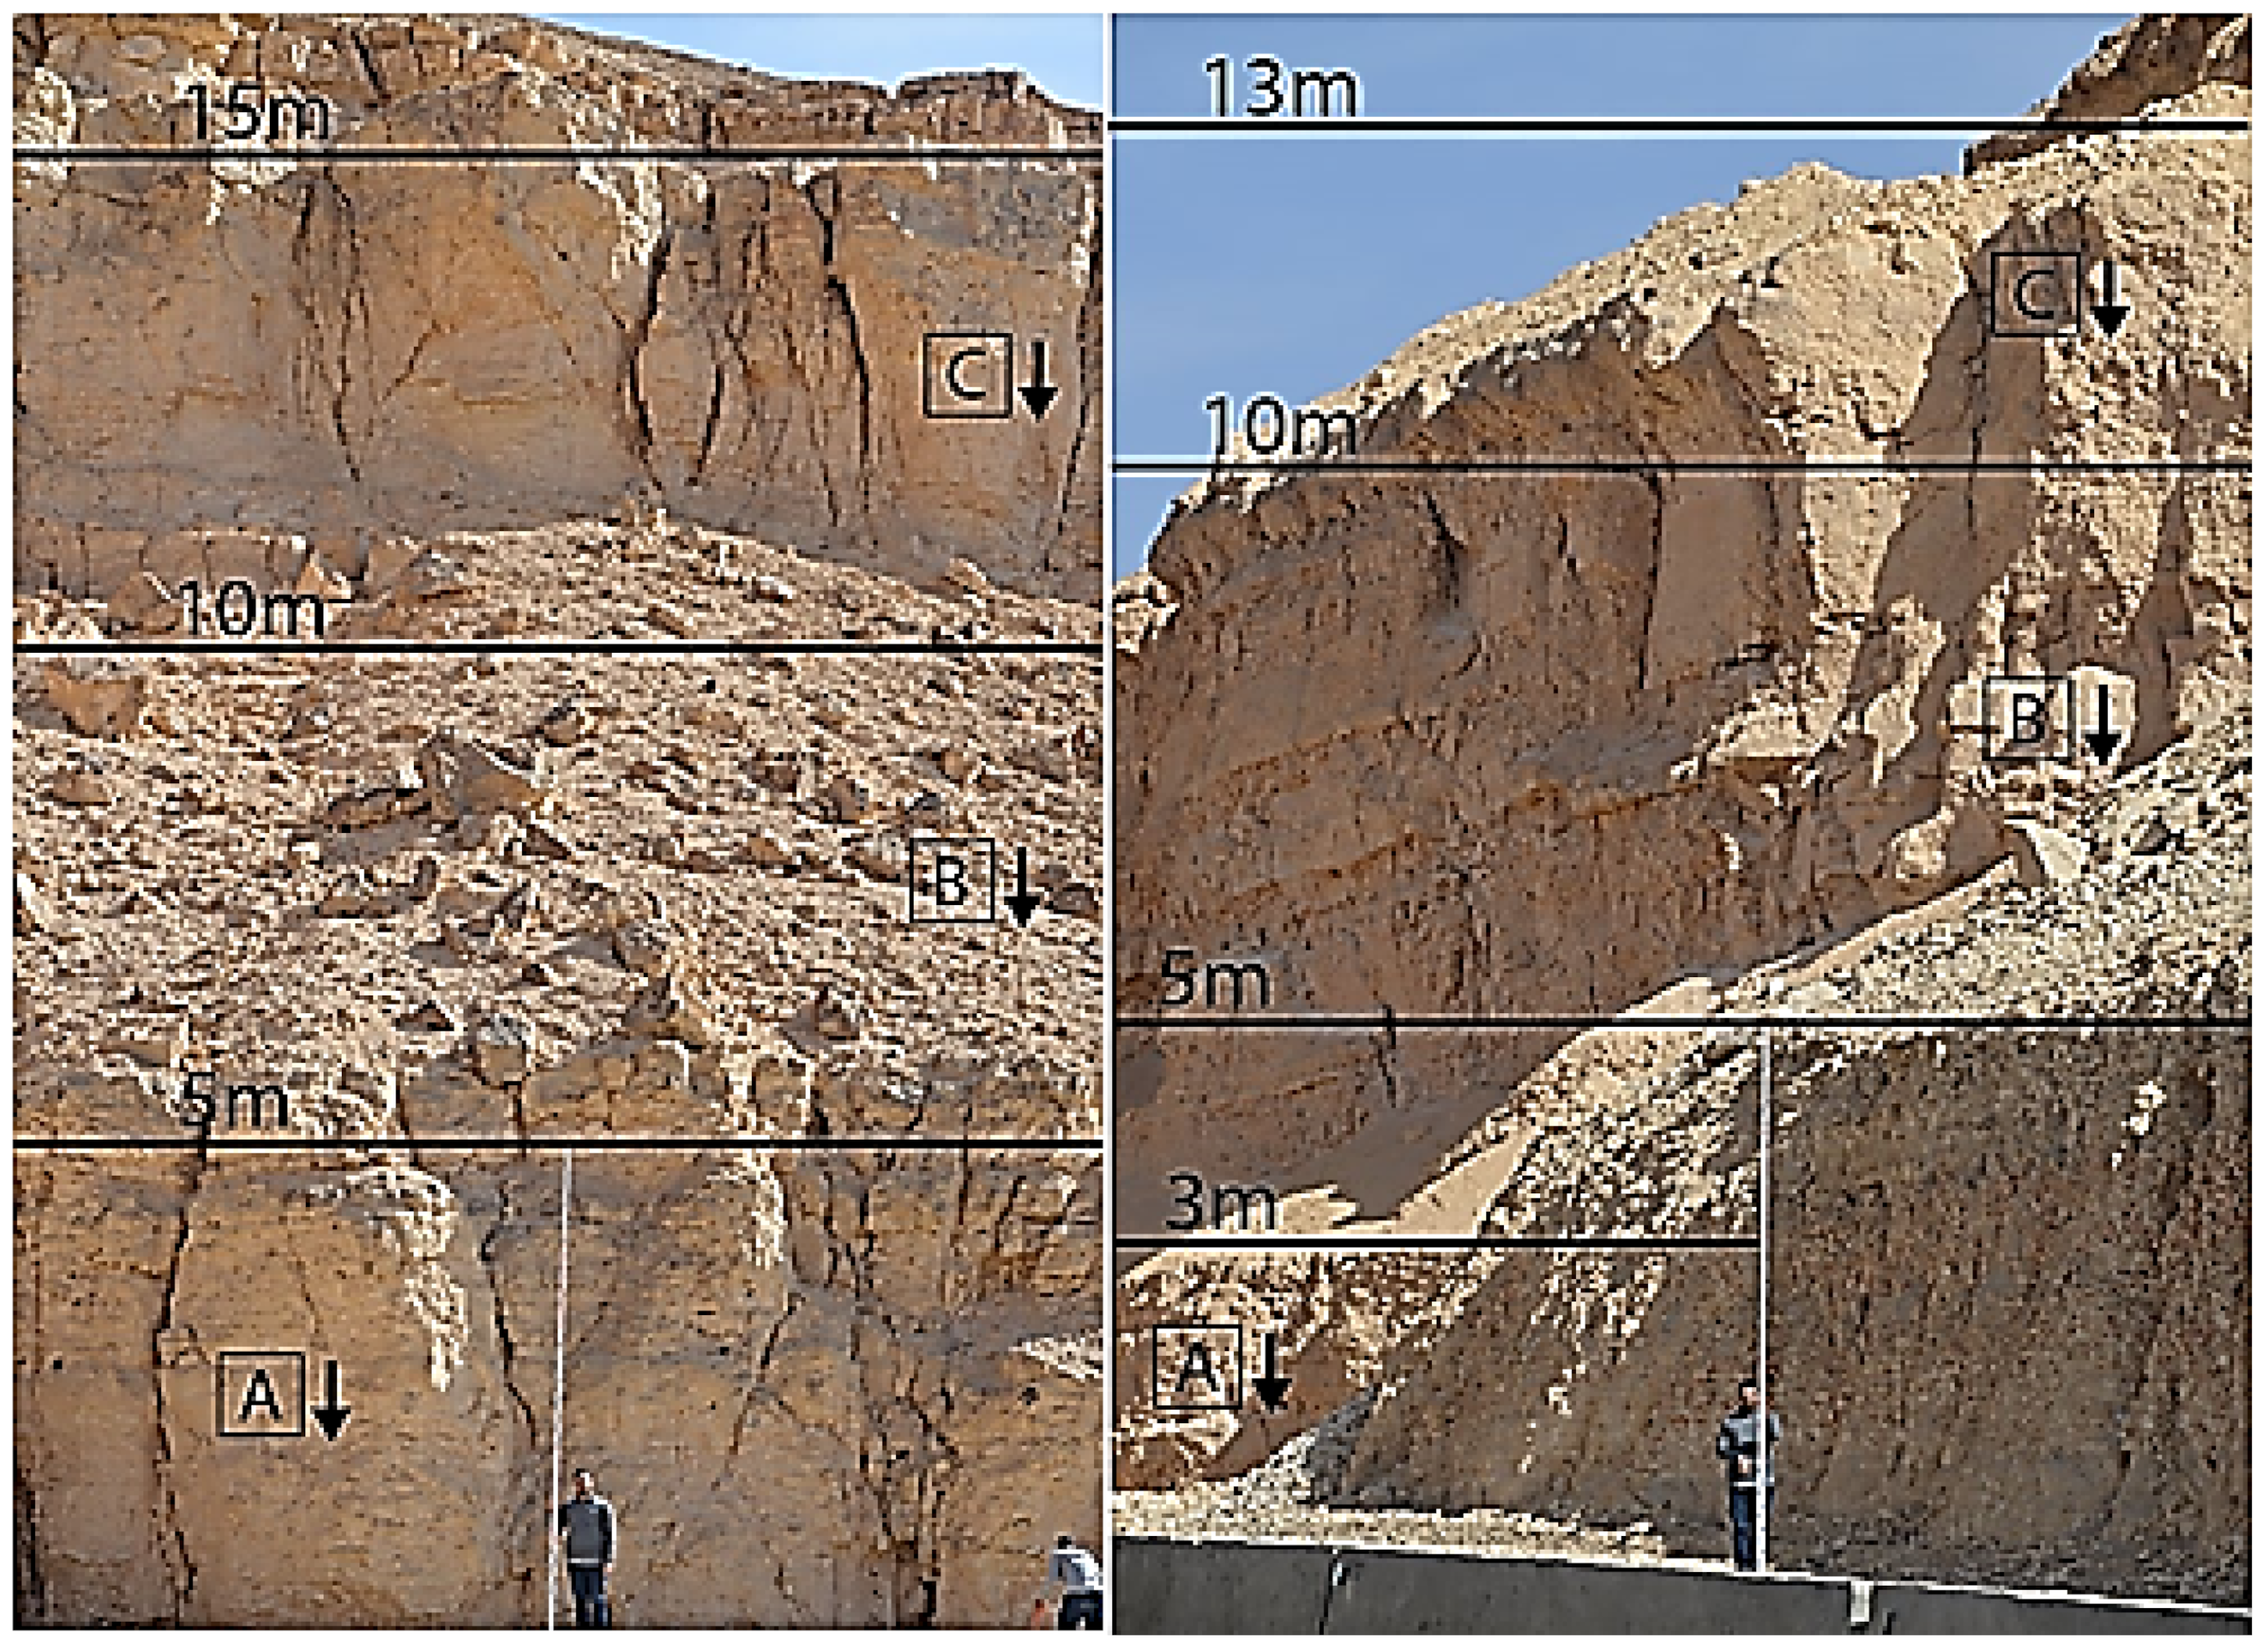
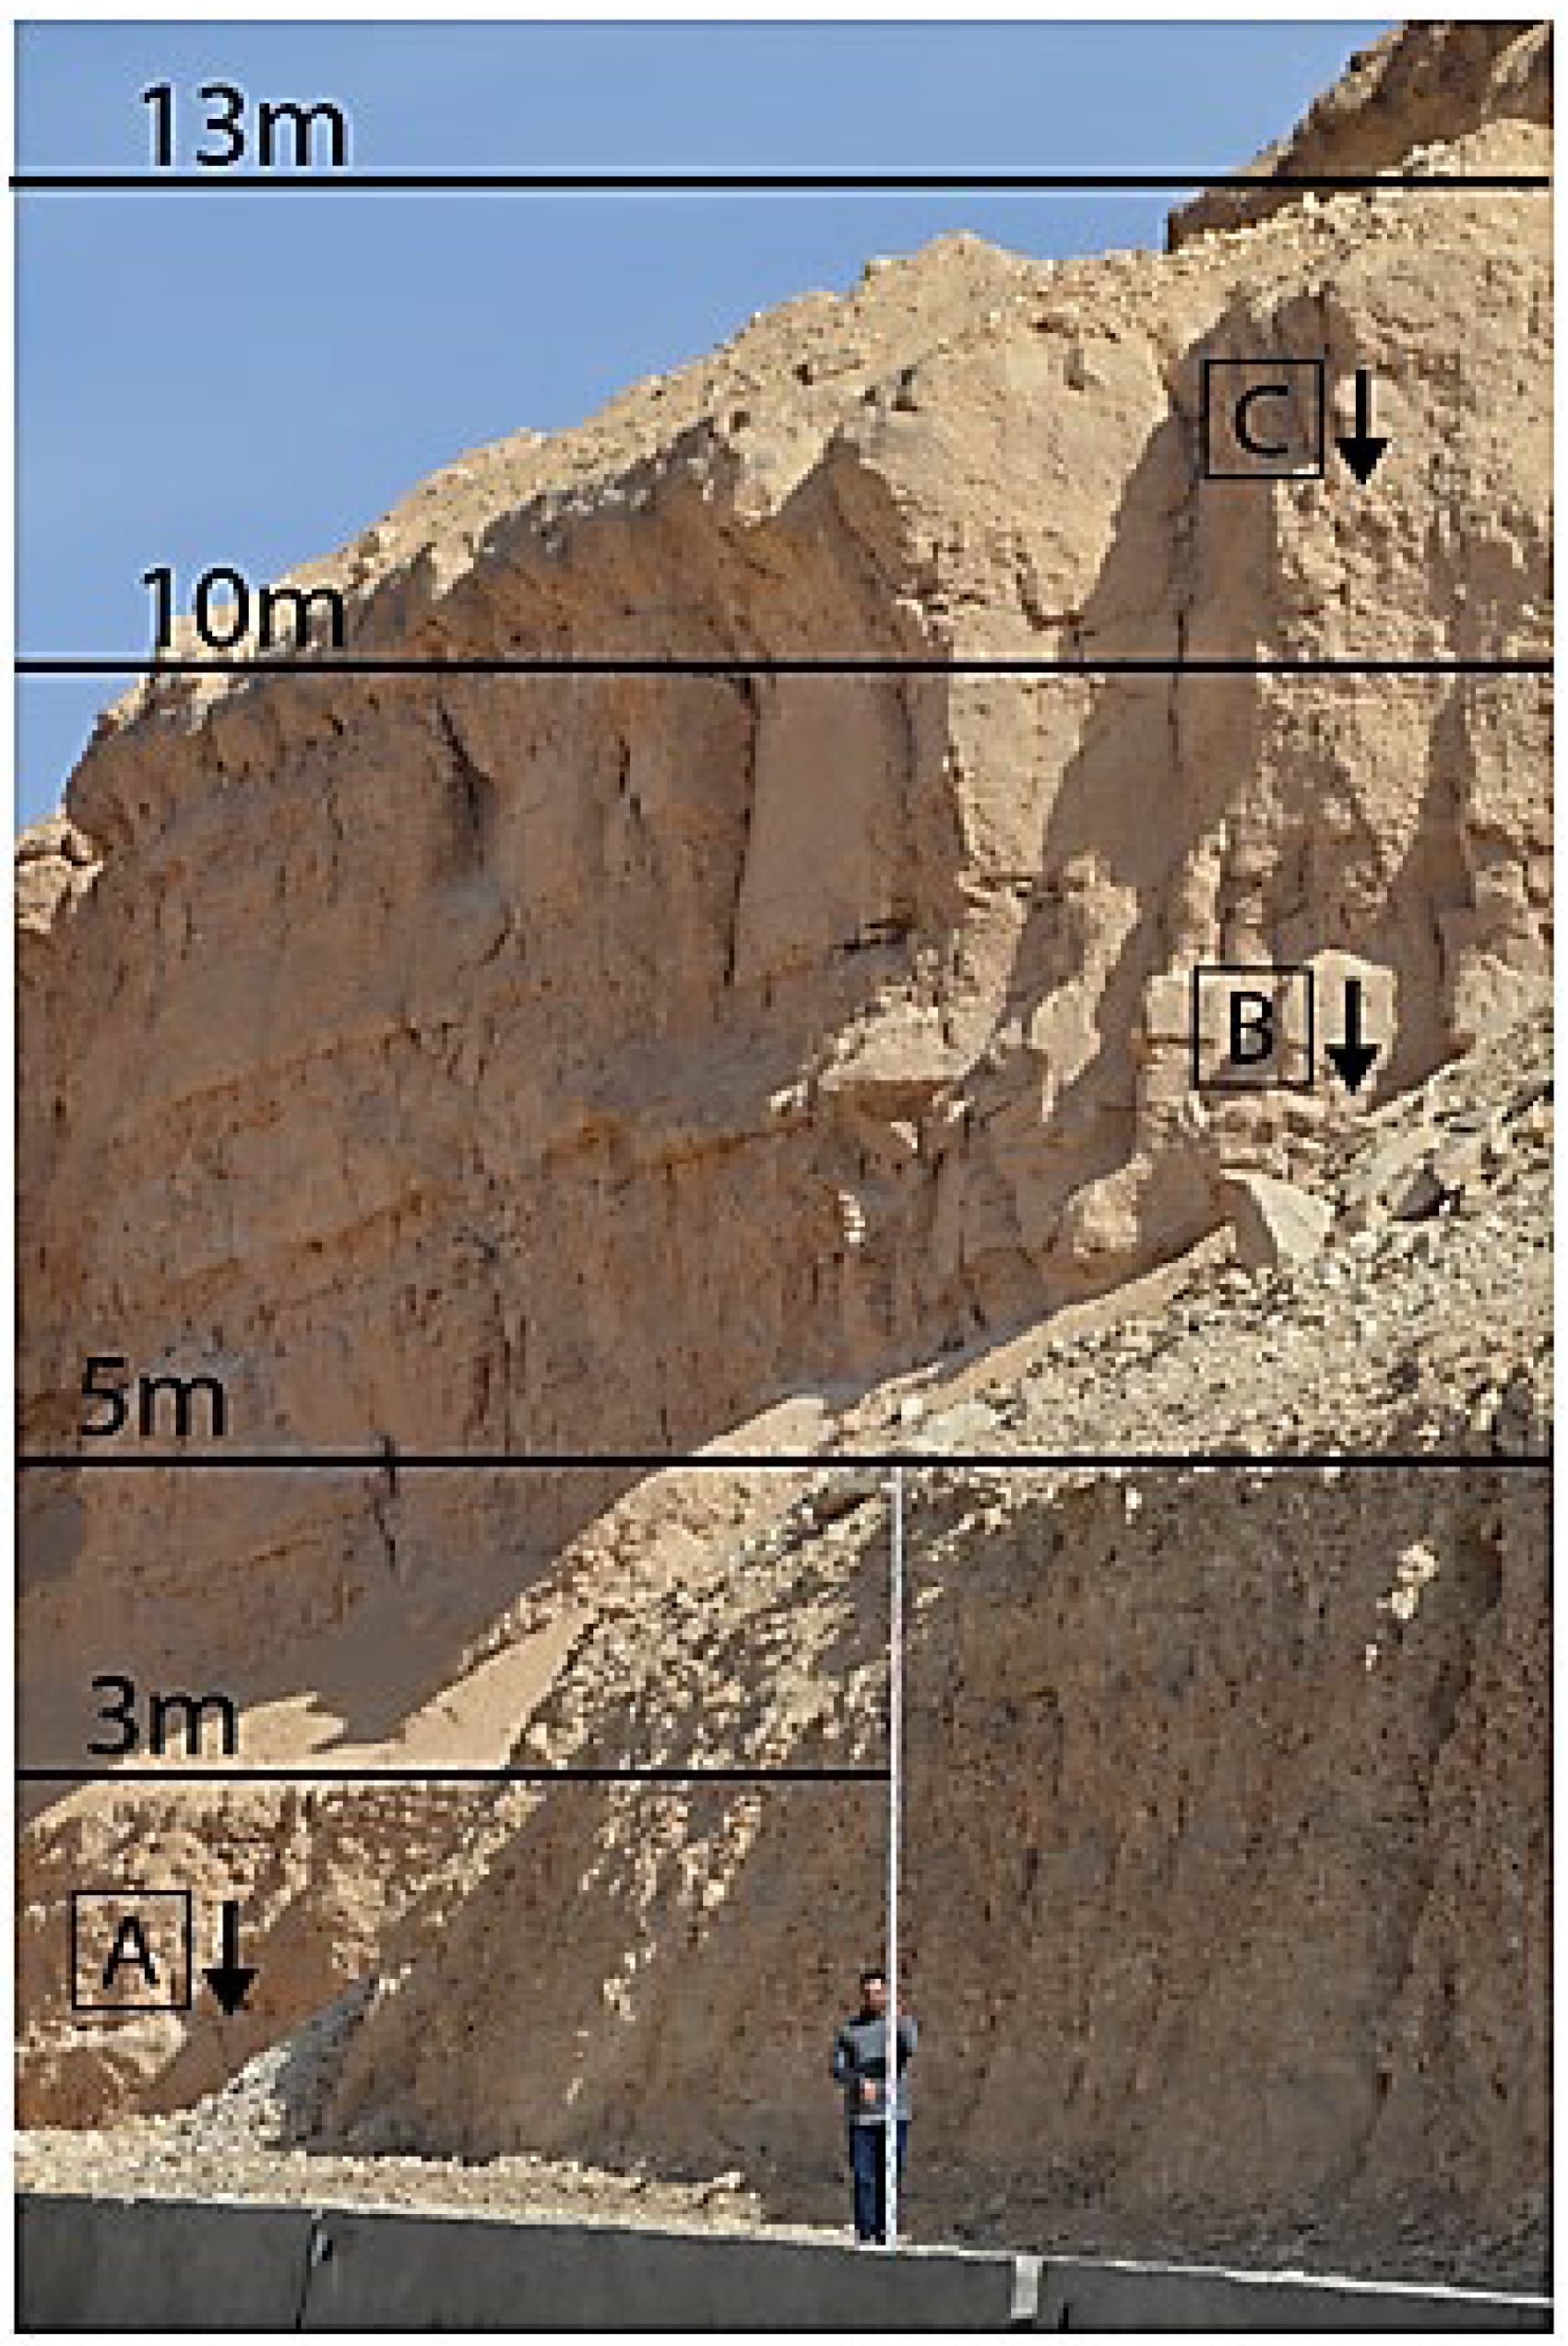
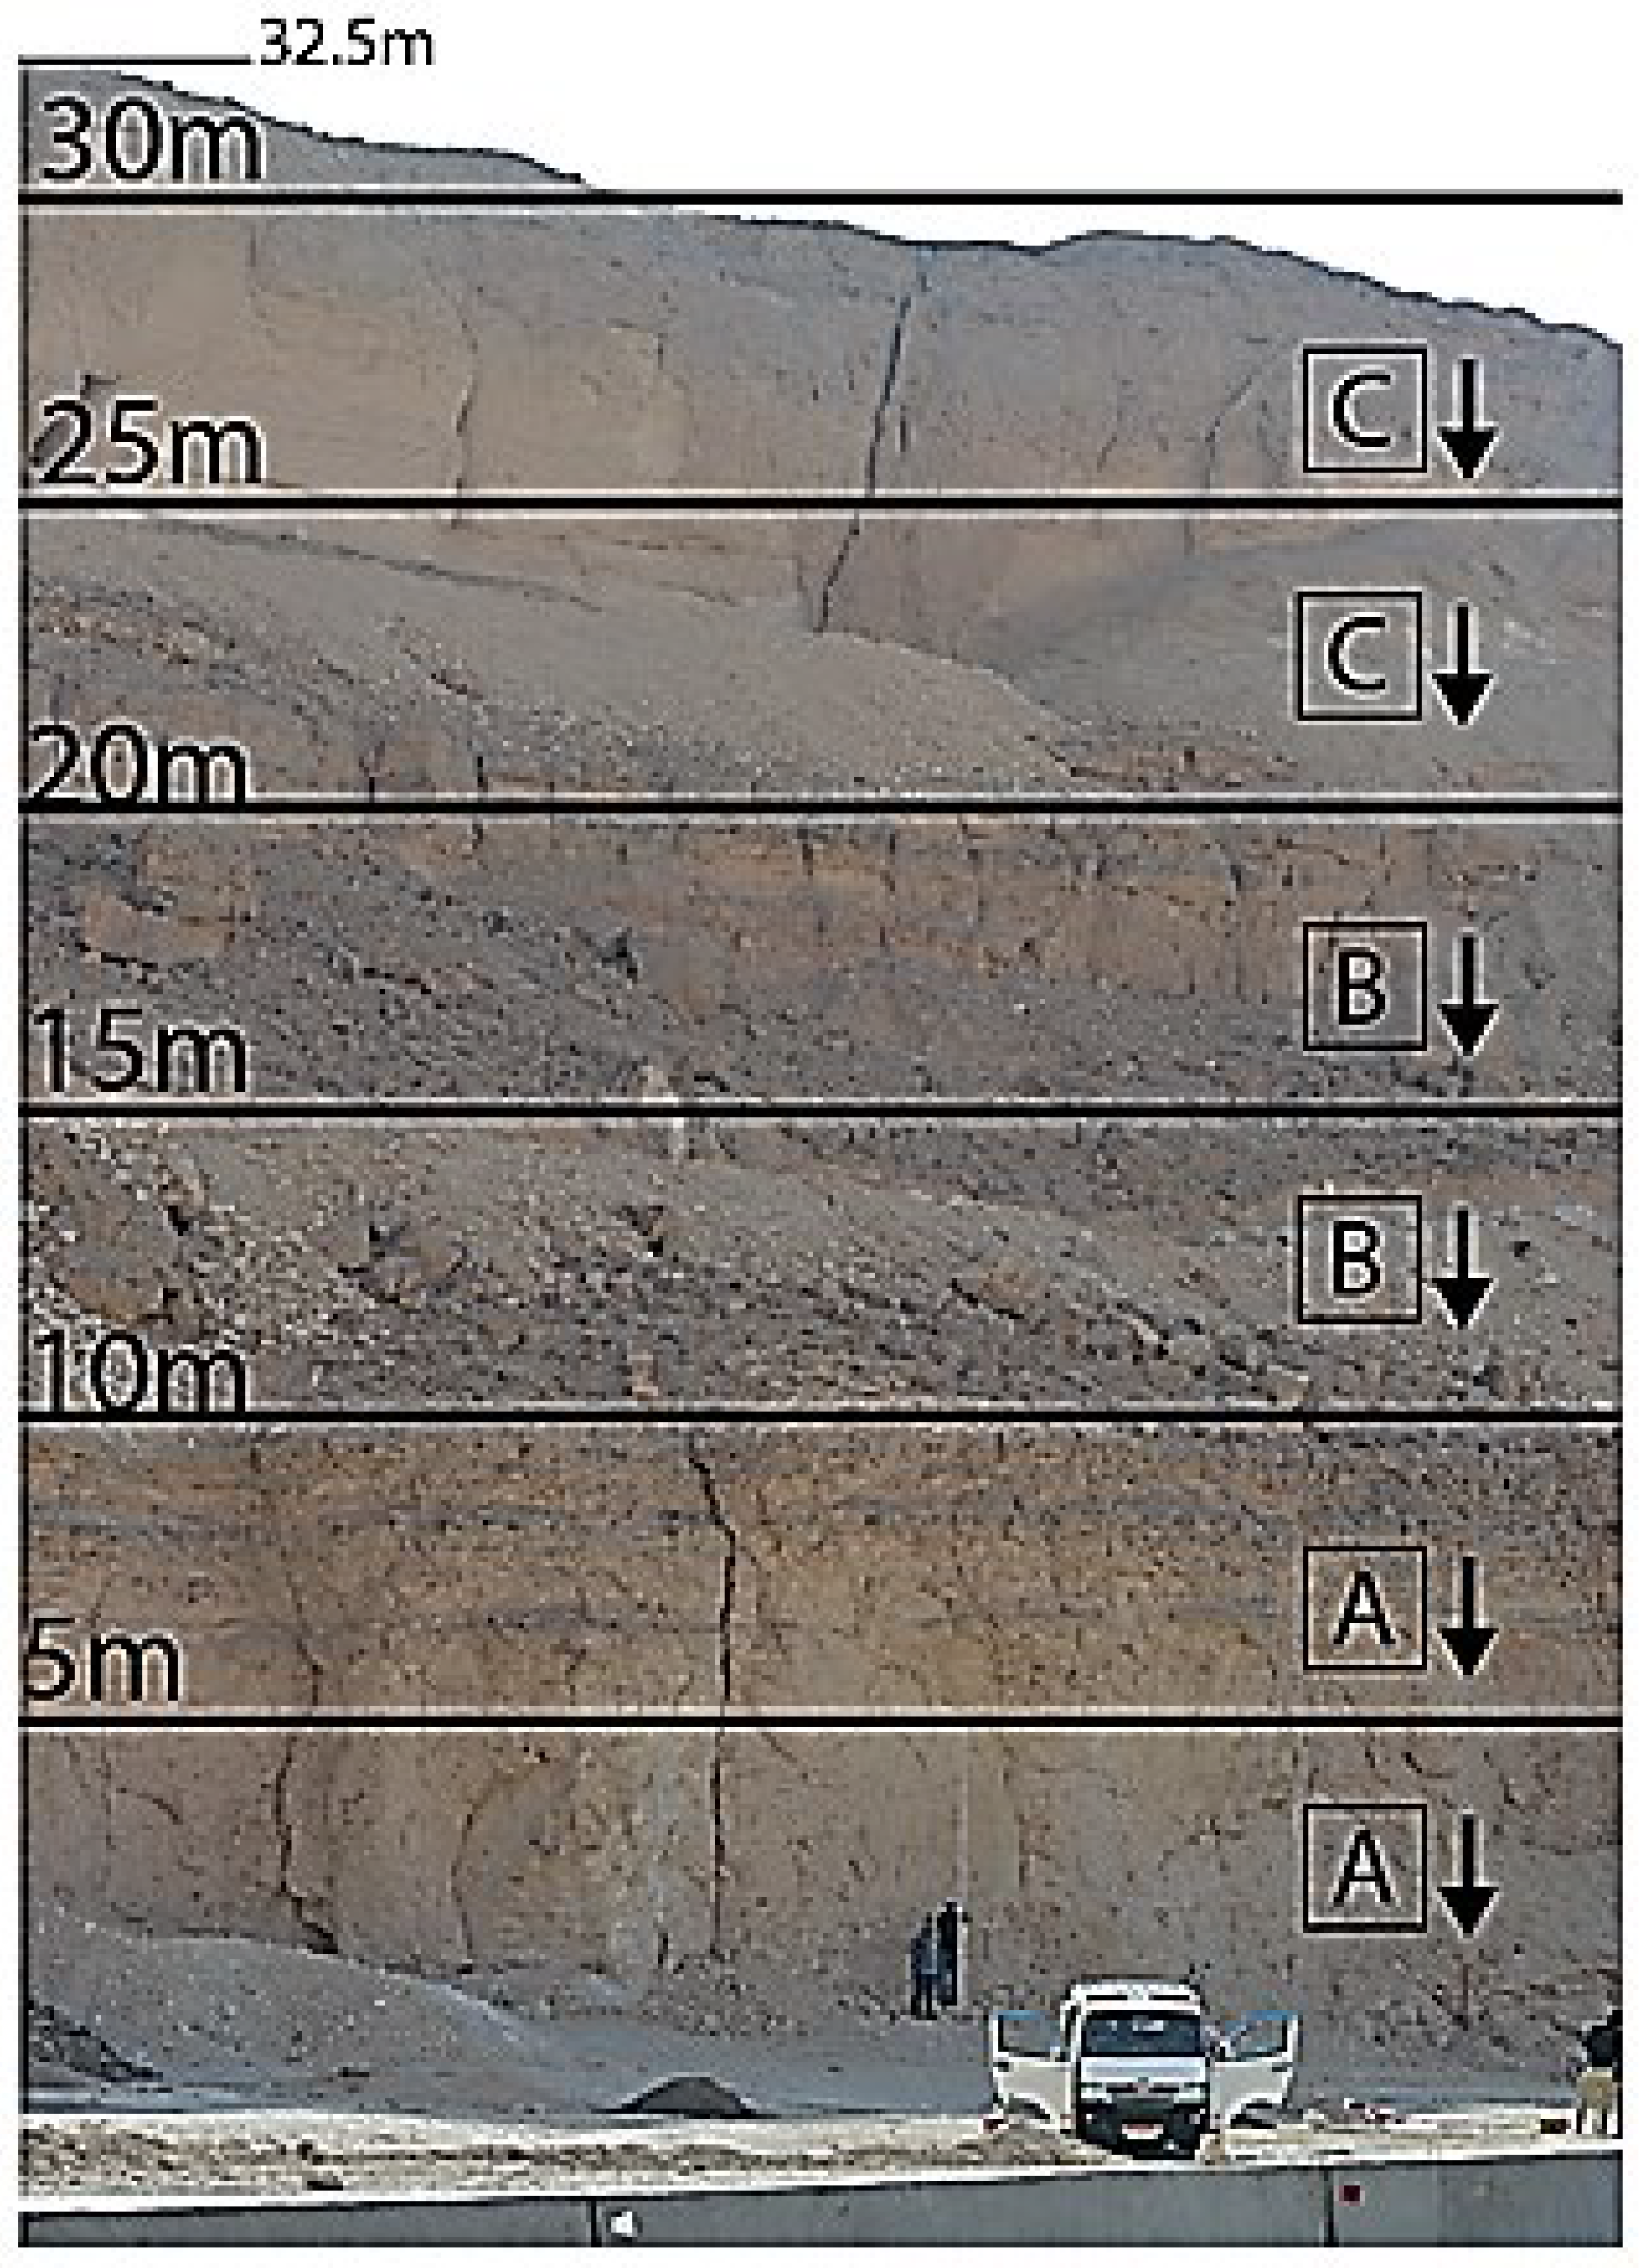
The geological deposits in the region are predominantly limestone, with the study area stratified into three distinct layers—A, B, and C—based on their thickness, cohesiveness, and structural features. Each layer exhibits unique material characteristics that influence its stability and response to environmental factors.
Layer A is characterized by a substantial thickness and relatively high cohesiveness, making it the most stable of the three layers. Its compact limestone structure provides resistance to the weight of overlying rocks, allowing it to maintain structural integrity under significant stress. This layer is less affected by external forces, such as weathering or erosion, due to its position deeper within the geological profile. The material composition typically includes hard, unfractured limestone with minimal porosity, contributing to its overall stability.
In comparison to Layer A, Layer B exhibits reduced cohesiveness and moderate thickness, placing it in an intermediate stability category. This layer is composed of limestone that may show increased fracturing or marly characteristics, which diminish its overall mechanical strength. The fractures and marly inclusions facilitate water infiltration, which can exacerbate weathering processes over time. As a result, Layer B is more susceptible to deformation and localized instabilities, particularly under increased loads or environmental changes.
Layer C, positioned at the topmost level of the rock formation, is the weakest and least cohesive layer. Its exposure to external environmental factors, such as rainfall, wind, and general erosion, has significantly altered its material properties. This layer consists of weathered limestone and fragmented material, often with high porosity and reduced density. The prolonged exposure to external elements has led to the degradation of its structure, making it highly vulnerable to mechanical stresses. This layer also displays evidence of chemical weathering processes, further weakening its integrity.
Samples from each layer were collected independently to ensure their unique properties were accurately represented. Mechanical and physical tests were conducted on the samples to assess their strength, cohesion, and resistance to weathering. Two site visits supported this analysis: the first to establish site coordinates and define boundary conditions, and the second to focus on the detailed sampling process. This included efforts to align sample collection practices with sedimentation processes and the geological environment specific to each layer. The differentiation in material properties among Layers A, B, and C underscores the complex interplay of geological processes that influence the region’s stratigraphy and stability. Understanding these variations is crucial for applications such as construction, drilling, and resource extraction, where material behavior under stress is a critical factor.
Debris cones are observed at the base of the cut. The rock cut exhibits both horizontal and vertical curvature, illustrated in
Figure 2. With a height ranging from 5 to 25 m, the rock cut lacks catchment ditches or benches. The cliff sides are predominantly uneven, with reddish spots indicating heavily worn areas in specific sections. On the western side of the roadway, the higher segments of the cut slope typically dip towards the highway [
38].
The crest width along the rock cut in the study section varies from 0.5 to 2 m, and the cut face is irregular, featuring joints that descend sharply towards the road, potentially leading to wedge failures as depicted in
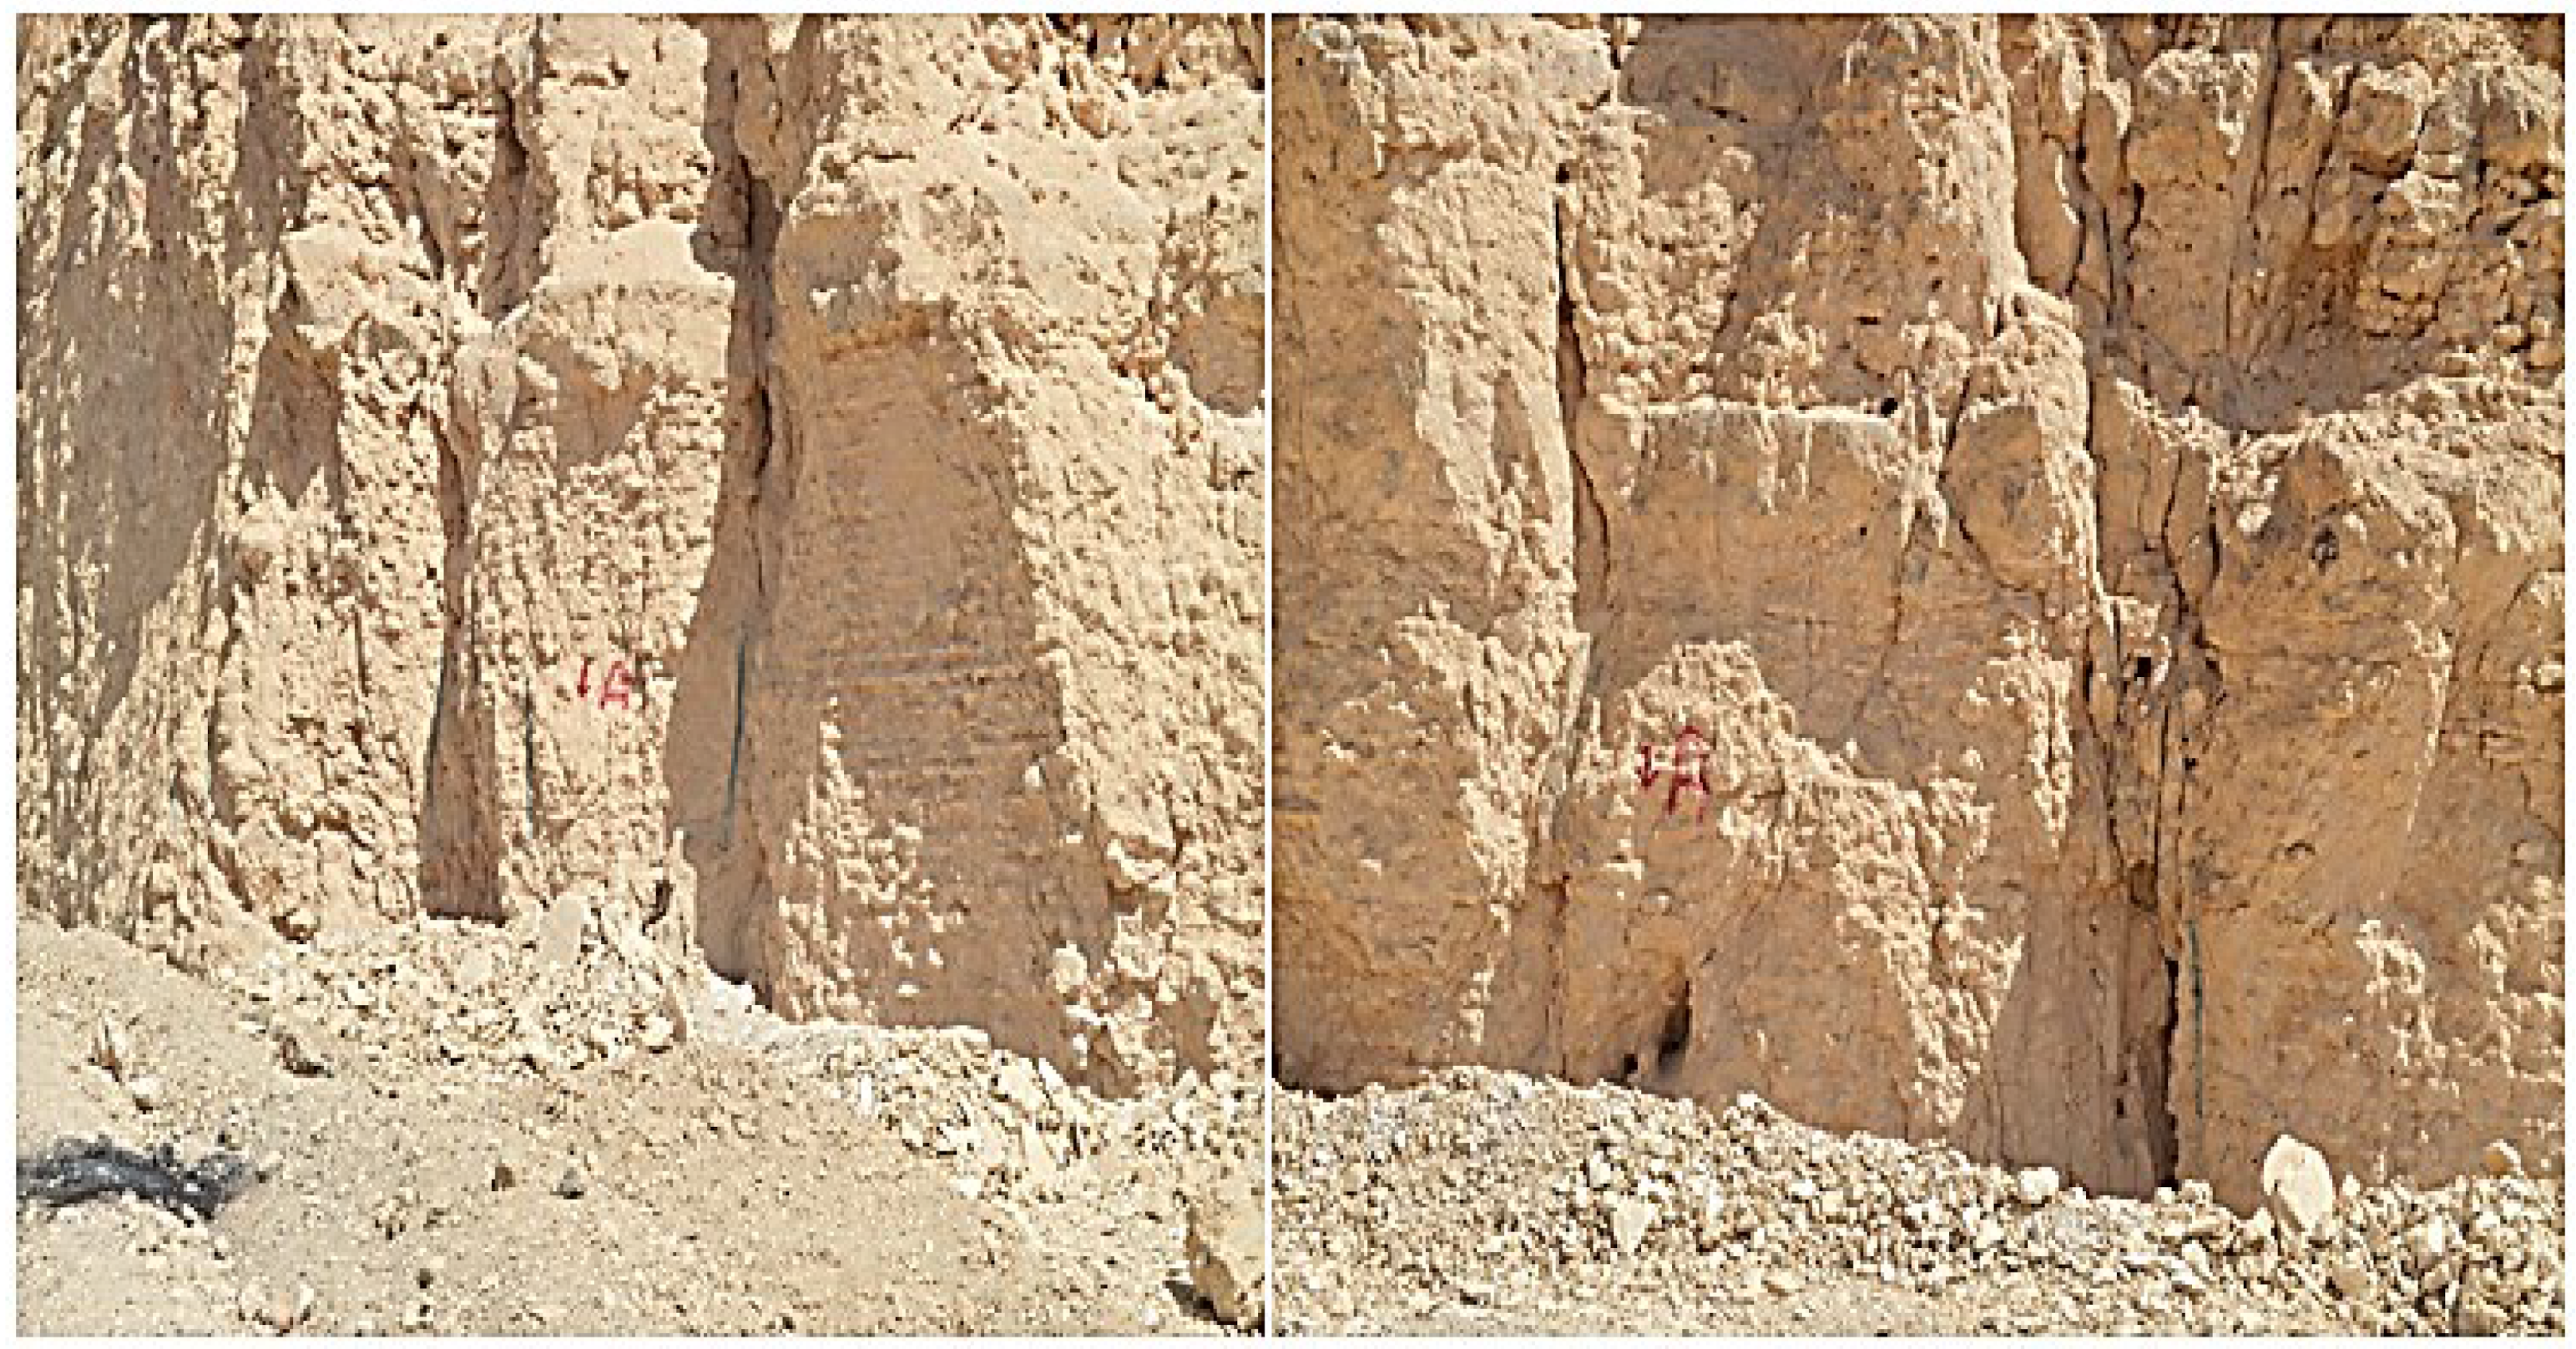
Figure 3. The limestone in the rock cut is notably characterized by the presence of filled sinkholes, as illustrated in
Figure 4. These sinkholes play a crucial role in slope stability, filled with blocks ranging from 20 cm to 1 m, weakly cemented with easily degradable reddish sandy muddy materials. Karst features predominantly arise from solution voids along discontinuities, creating cavities supported by the remaining points of contact across opened discontinuities. The reduced contact area diminishes shear strength, and points of contact may fracture due to overstressing [
39,
40].
3. Materials and Methods
The engineering properties of both intact rock and the rock mass were obtained through comprehensive field-testing procedures. Specifically, detailed mechanical and geological tests were employed to assess the rock characteristics, as per the methods described by Barnett and Williams [
41]. Simple assessments involved manual pressure tests and the use of geological hammers, along with similar field tools, to evaluate the intact rock strength within the study area (see
Table 1). A geological hammer was utilized to conduct field inspections at over 50 distinct locations. These inspections included the assessment of intact limestone rocks, weathered materials along discontinuities, and cemented materials within sinkholes.
Multiple strength measurements were carried out at various exposures, with the results consolidated for analysis [
42]. The unconfined compressive strength (UCS) of intact limestone ranged from 12.5 to 50 MPa, while the marly limestone exhibited significantly lower strengths, typically less than 1.25 MPa. Furthermore, the cemented materials within the filled sinkholes displayed compressive strengths below 1.25 MPa.
For the slope stability analysis, several key factors were considered, including the evaluation of slope conditions, susceptibility to instability, determination of critical slope angles, and the identification of potential failure mechanisms. The properties of the rock mass, such as rock mass quality, slope geometry, and the shear strength of discontinuities, were also critical in the analysis. Discontinuities, including bedding planes, fractures, faults, and schistosity planes, greatly influence the behavior of the rock mass, particularly in the context of slope stability. Their geometry, frequency, and shear strength directly impact the overall stability of slopes and must be carefully analyzed to predict potential failure mechanisms. The study area was divided into three distinct geological strata, labeled as A, B, and C, as listed in
Table 1. Independent samples were collected from each stratum, with the corresponding physical and mechanical properties presented in
Figure 5. A series of comprehensive tests—physical and mechanical—were performed on these samples to analyze their characteristics.
3.1. Site Investigation and Sample Preparation
Two site visits were conducted as part of the field investigation. The first visit was dedicated to determining the location coordinates and establishing the boundary conditions for the study. The second visit focused on collecting data from the three strata, considering their unique geological settings and characteristics, as per
Figure 5.
All materials were collected in bulk, and core samples were extracted from each layer. These cores were then prepared for detailed physical and mechanical testing. The input parameters for the slope stability analysis, categorized by formation type, are provided in
Table 1, with standard deviation values indicated in parentheses. However, due to a limited sample size, standard deviation values for black clay and loam were not calculated.
Consolidated drained tests were performed on three samples under three different normal stresses to assess shear strength, while other tests were conducted with single or double repetitions, following ASTM standards [
43].
In this research, the lithology of the rock mass is a key factor influencing failure mechanisms in open-pit mining, quarry operations, and the construction of roadside slopes. The physical properties of the rock mass were systematically examined to identify potential failure zones. The mineral composition of the rock, which governs its mechanical properties, including strength, was analyzed through a series of tests.
Critical rock qualities such as porosity, mineralogy, density, and cementation degree were measured, as these factors have a significant impact on rock strength. The mineralogical composition was specifically tested to determine its influence on the rock’s type, strength, color, and other intrinsic properties, following the methodology of Malkawi et al. [
44].
According to Yasir et al. [
45], an increase in the degree of cementation enhances the rock’s strength, a relationship that was verified through tests in this study. The stability of rock slopes was found to be closely tied to the mineral composition and physical properties of the rock mass. In particular, slopes constructed with high walls composed of weathered rocks or alluvial materials were observed to exhibit lower shear strength and a higher vulnerability to additional weathering processes, such as erosion. These observations were confirmed through shear strength assessments of the rock materials in question.
Despite the mitigating effects of cohesiveness and friction angle on the influence of shear stress magnitude on rock slope stability, these strength parameters exhibit inherent limitations [
46]. Geological structures, including the dip direction, intra-formational shear zones, joints, discontinuities, and faults, play a crucial role in influencing slope stability. Failures often occur either within intact zones or along surfaces adjacent to these structural discontinuities [
47].
When the applied shear stress in a rock mass exceeds its inherent strength, slope failure is likely to occur. Thus, shear strength is a critical determinant of rock mass stability. During the design phase, it is essential to account for factors that alter shear strength, as these can significantly affect slope stability. According to Abramson, failure typically originates at a specific point in the rock slope and subsequently propagates through the entire rock mass [
48,
49]. In slope failure simulations, Stead and Eberhardt [
50] observed that, in the absence of external triggering events, gradual strength degradation and failure in a rock mass are primarily caused by internal factors.
All physical and mechanical properties of the rock mass were rigorously tested according to established protocols to ensure accurate representation of the material’s behavior under stress.
3.2. Characteristics of Limestone
Various laboratory tests have been performed to determine the physical and mechanical properties of limestone, which will be discussed in the following sections. The mineral composition of a rock significantly influences its nature, strength, color, and other characteristics. According to Yasir et al. [
45], increased cementation enhances a rock’s strength. The mineral composition and physical properties of the rock mass are crucial factors in defining the rock’s strength, which in turn affects slope stability. Constructing rock slopes with pit high walls made of weathered or alluvial materials can lead to reduced shear strength and a greater vulnerability to further erosion and weathering.
3.2.1. Physical Properties
In this study, density and porosity were the primary characteristics examined. Porosity plays a crucial role in determining a rock’s capacity to absorb water, directly impacting its durability and long-term stability. Rocks with higher porosity are more vulnerable to weathering and erosion, making porosity a critical factor in assessing the rock’s performance in structural applications over time. Analyzing both density and porosity provides important insights into the rock’s structural integrity and its behavior under different environmental conditions, which is essential for assessing its suitability for engineering and construction applications.
Density is defined as the mass per unit volume of a material and is calculated using Equation (1):
where
M represents the mass and
V is the volume. The mass of a rock in its natural state differs from the mass of a rock with only its solid phase.
The data in
Table 2 represent the results of mass and volume measurements taken from samples of limestone, which were systematically collected from different sections within each layer (A, B, and C). Each layer was divided into four sections, and 25 samples were taken from each section, ensuring comprehensive representation of the material’s variability across the entire layer.
For each of the 25 samples collected from the designated sections, the mass was first measured. After weighing, the material was grounded to ensure a uniform texture and eliminate any voids that could affect the volume measurement. The grounded material was then placed into a scaled flask, and the volume was determined by observing the displacement of the material within the flask. This process allowed for accurate and consistent volume calculations for each sample.
After measuring both mass and volume for each sample, the average mass and average volume for each section were calculated. These averages were then used to compute the corresponding density for each section within the layer. This approach ensures that the final results represent the material properties more accurately by taking into account the variability within each layer and section, as well as the precise measurements of mass and volume that reflect the true characteristics of the limestone.
In summary, the density values presented are derived from an average of 25 measurements taken from each of the four sections per layer, with each sample being grounded and its volume calculated using a scaled flask. This methodology ensures a thorough and reliable assessment of the limestone’s physical properties.
To measure water absorption, rock samples were dried at 105 °C for 24 h, then immersed in distilled water at 20 °C ± 2 °C for 24 h. After immersion, the samples were surface-dried with a damp cloth and weighed to the nearest 0.0001 g. The water absorption, expressed in g/cm
2 for the polished surface, is calculated using Equation (2):
where
A is the dry weight of the sample in grams,
B is the weight of the sample after immersion, and the
Area represents the polished surface area in square centimeters.
The focus on density in this study is crucial as it reflects the overall compactness of the rock, which can influence its mechanical strength and durability. By estimating density, we aim to assess the rock’s ability to withstand external forces and its suitability for various applications in construction and engineering.
Porosity, the measure of void spaces within a rock, was determined for limestone samples from different locations. The data on the weights of Sample “A” before and after heating are presented in
Table 3, while
Table 4 and
Table 5 provide the same information for Samples “B” and “C,” respectively.
Table 5 also includes the statistical analysis for all samples. Porosity is calculated using Equation (3):
In this equation, is the pore volume in cubic centimeters, is the bulk volume in cubic centimeters, is the dry weight in grams, is the weight after immersion in water, and is the density of the liquid in g/cm3.
3.2.2. Mechanical Characteristics
The mechanical properties, including compressive strength, tensile strength, and abrasion resistance, were evaluated for three distinct layers, based on the locations of their respective samples.
Compressive strength refers to the stress at which a rock fails, and it is calculated using Equation (4):
where
= compressive strength of rock in kg/cm
2,
F = applied force in kN, and
A = initial cross-sectional area in cm
2.
Cylindrical specimens, with a diameter-to-length ratio of 1:2, were prepared from limestone using a disk saw. The samples were dried in an electric furnace at 105 °C for 24 h and then weighed with an electronic balance. Tests were conducted using a 150-ton capacity digital compression machine at a loading rate of 1 ton per minute.
Tensile strength for selected limestone samples was measured through double-shear testing. The shear strength (
) of the rock was determined using Equation (5):
where
P = applied load at failure (kN) and
A = cross-sectional area (cm
2).
Table 6 summarizes the mechanical properties of the limestone samples, such as density (γ), uniaxial compressive strength (
σc), Young’s modulus (E), Poisson’s ratio (υ), direct shear strength of joints at peak (
), cohesion (C), and friction angle (
).
Ten specimens of various dimensions (D × T × L) were prepared from four types of rocks using a disk saw. After drying at 105 °C for 24 h, the specimens were tested using a 50-ton capacity digital compression machine, with a loading rate of 30 kg per minute and a support distance of 2 cm between the testing points.
During the design phase, rock strength parameters such as cohesion (C) and the internal friction angle (
) are critical for determining the Factor of Safety (FOS) in rock slope stability assessments. Shear strength is a key mechanical property of rock and soil, playing a vital role in evaluating slope stability. Cohesion and friction angle are determined through triaxial compression tests in the lab, with internal friction angle being a primary factor in assessing a rock’s resistance to shear stress [
49].
Viscosity, defined as a material’s resistance to flow under stress, and plasticity, the ability to undergo permanent deformation without breaking, are recognized as mechanical properties due to their connection to stress response. However, these properties are also influenced by physical factors such as temperature, mineral composition, and porosity. For limestone, which is predominantly brittle, its behavior is typically governed by fracture and failure rather than by viscous flow or plastic deformation. As a result, viscosity and plasticity have not been included in the current model. Nevertheless, under certain conditions-such as elevated temperatures or pressures-limestone may exhibit visco-plastic behavior, suggesting these properties could be relevant in future studies
3.3. Mohr’s Envelope
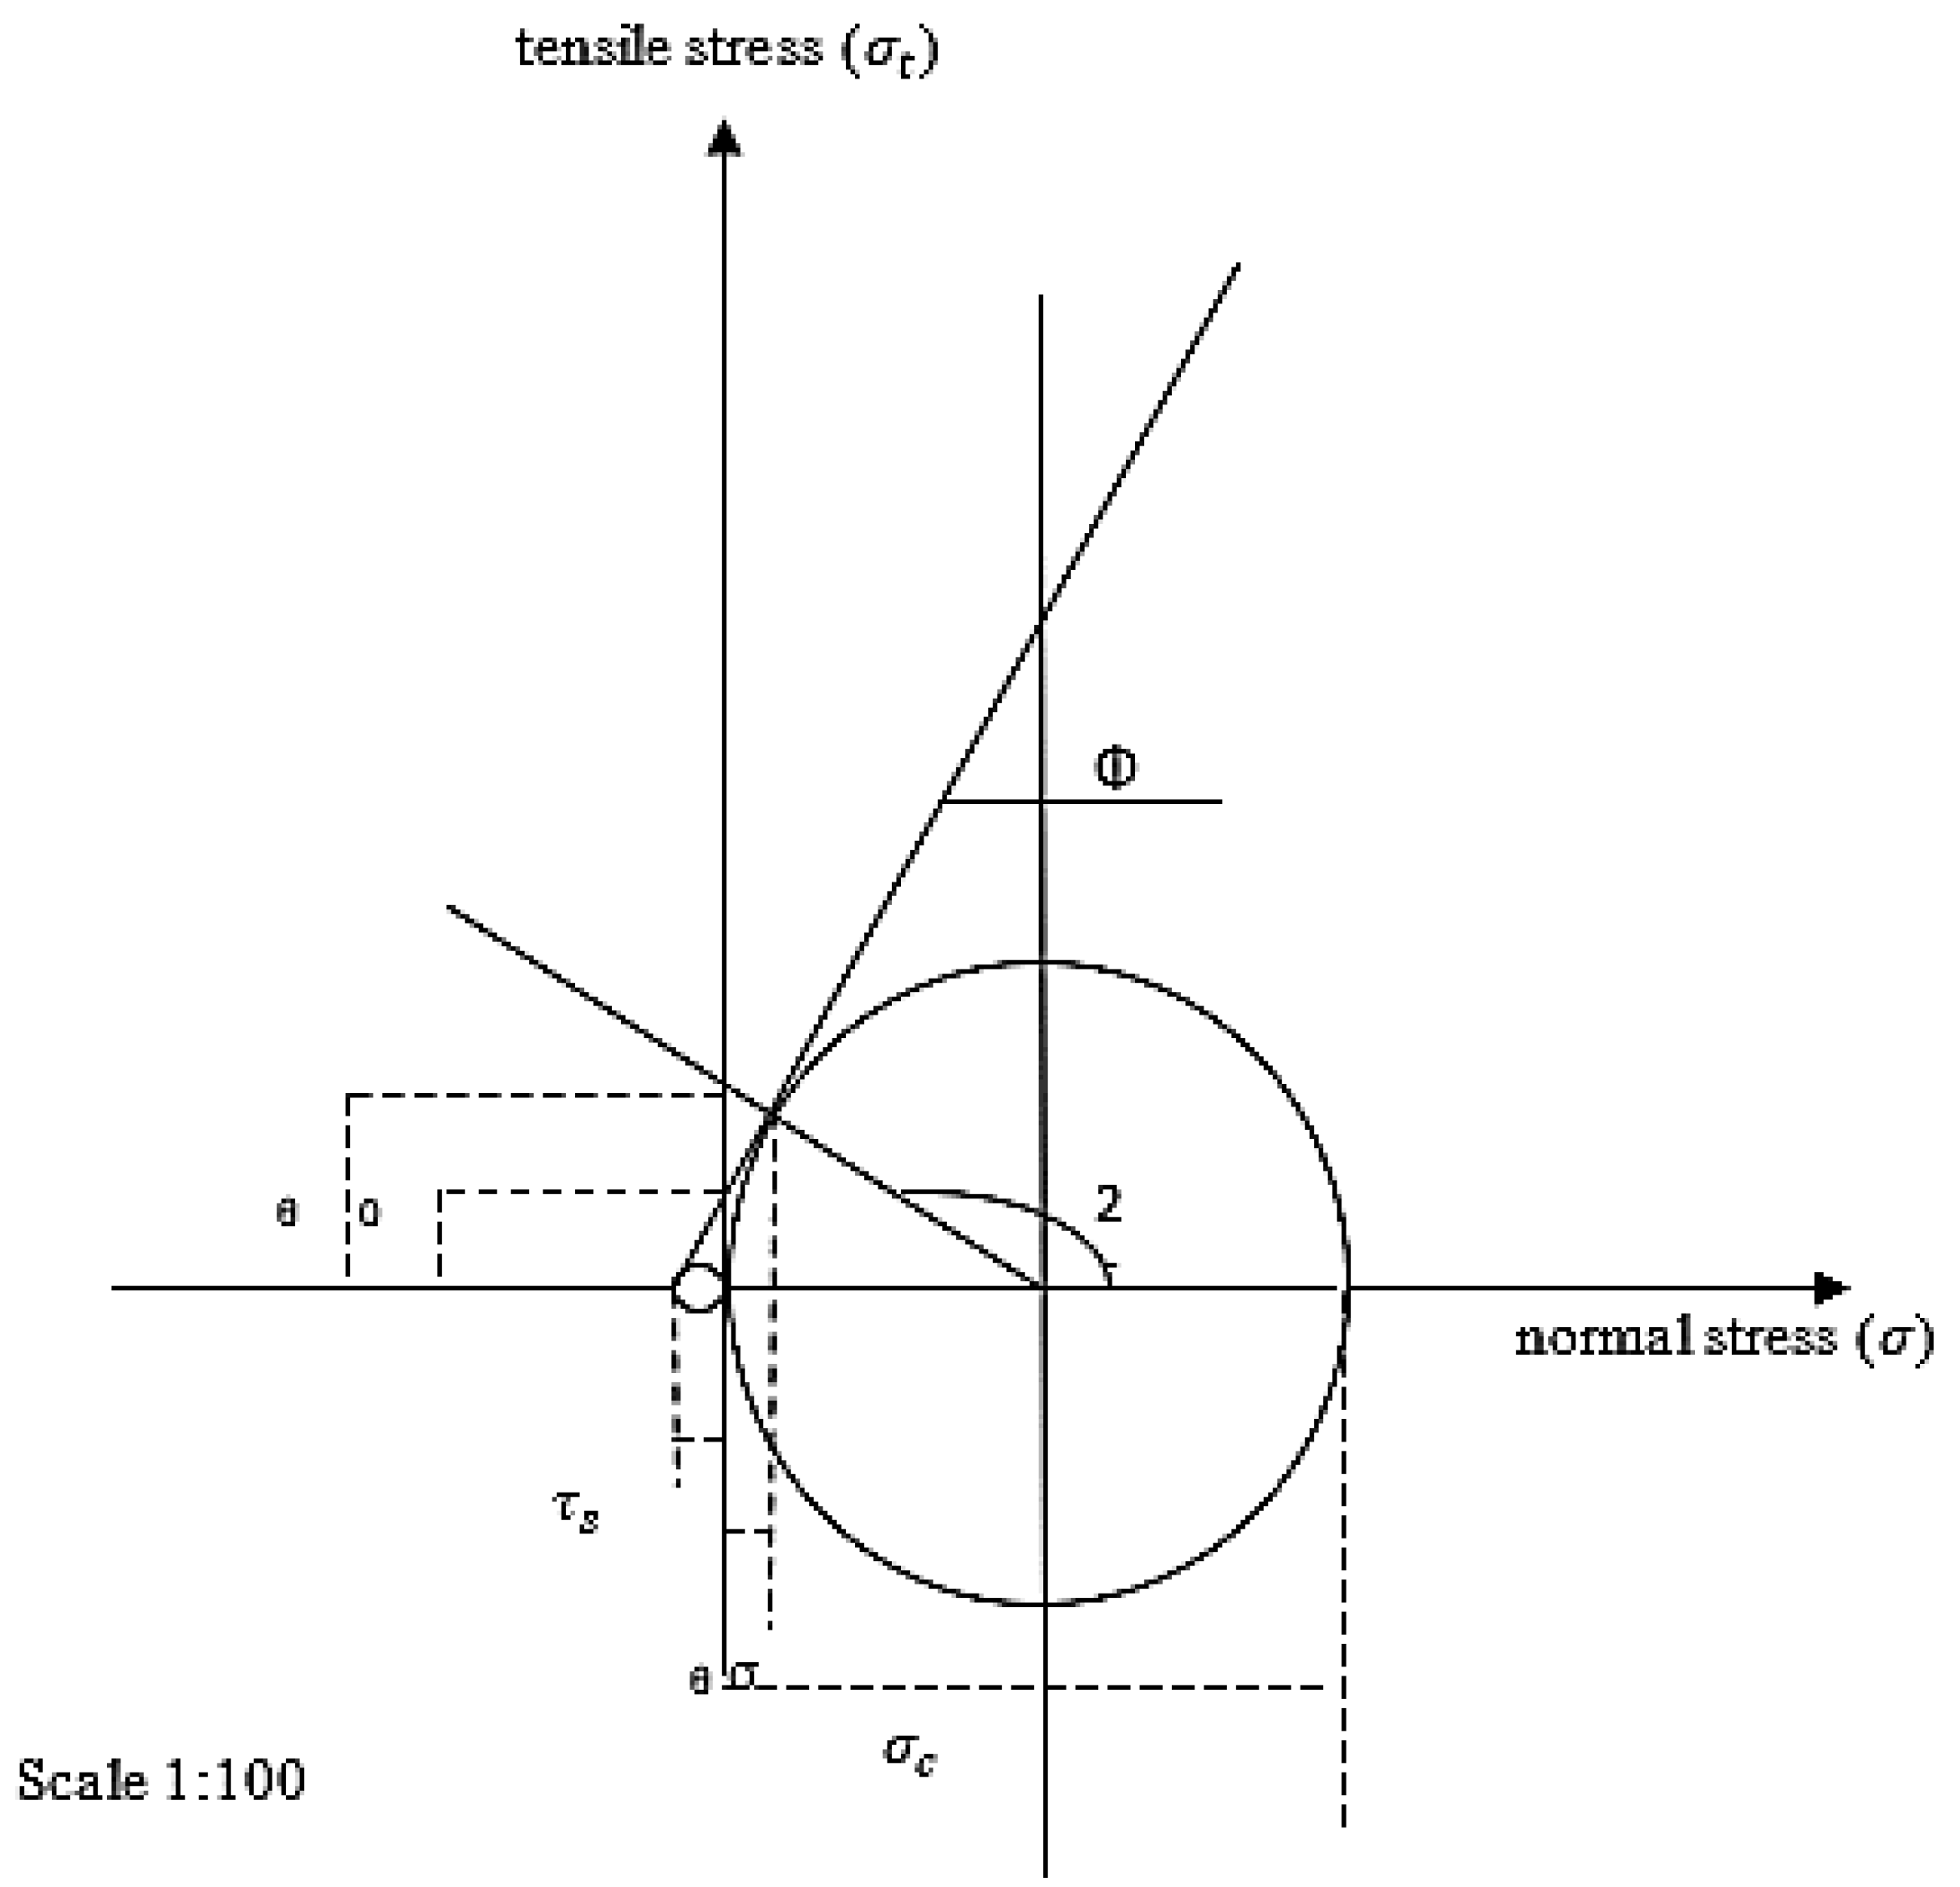
This approach involves constructing Mohr’s envelope by testing samples under both uniaxial compression and tension. The envelope is plotted as a tangent to the compression and tension circles.
Figure 6 provides an illustration of Mohr’s envelope for various rock blocks, with the following key parameters defined in the figure:
= compressive strength, 77.6 MPa.
= tensile strength, 7 MPa.
= normal stress on the plane of failure, 27 kN/m3.
= tensile stress on the plane of failure, 75.6 kN/m3.
θ = angle of failure, 74°.
= angle of internal friction, 40°.
Τ0 = cohesion, 30 MPa.
Table 7 presents the results of Mohr’s envelope analysis for all limestone sites.
Intensity–Duration–Frequency (IDF)
The calculation of the probability of rainfall magnitude is contingent upon the statistical method utilized and the data available for a specific location. However, a common approach to estimating the probability of rainfall magnitude (P) is represented as per
Table 8.
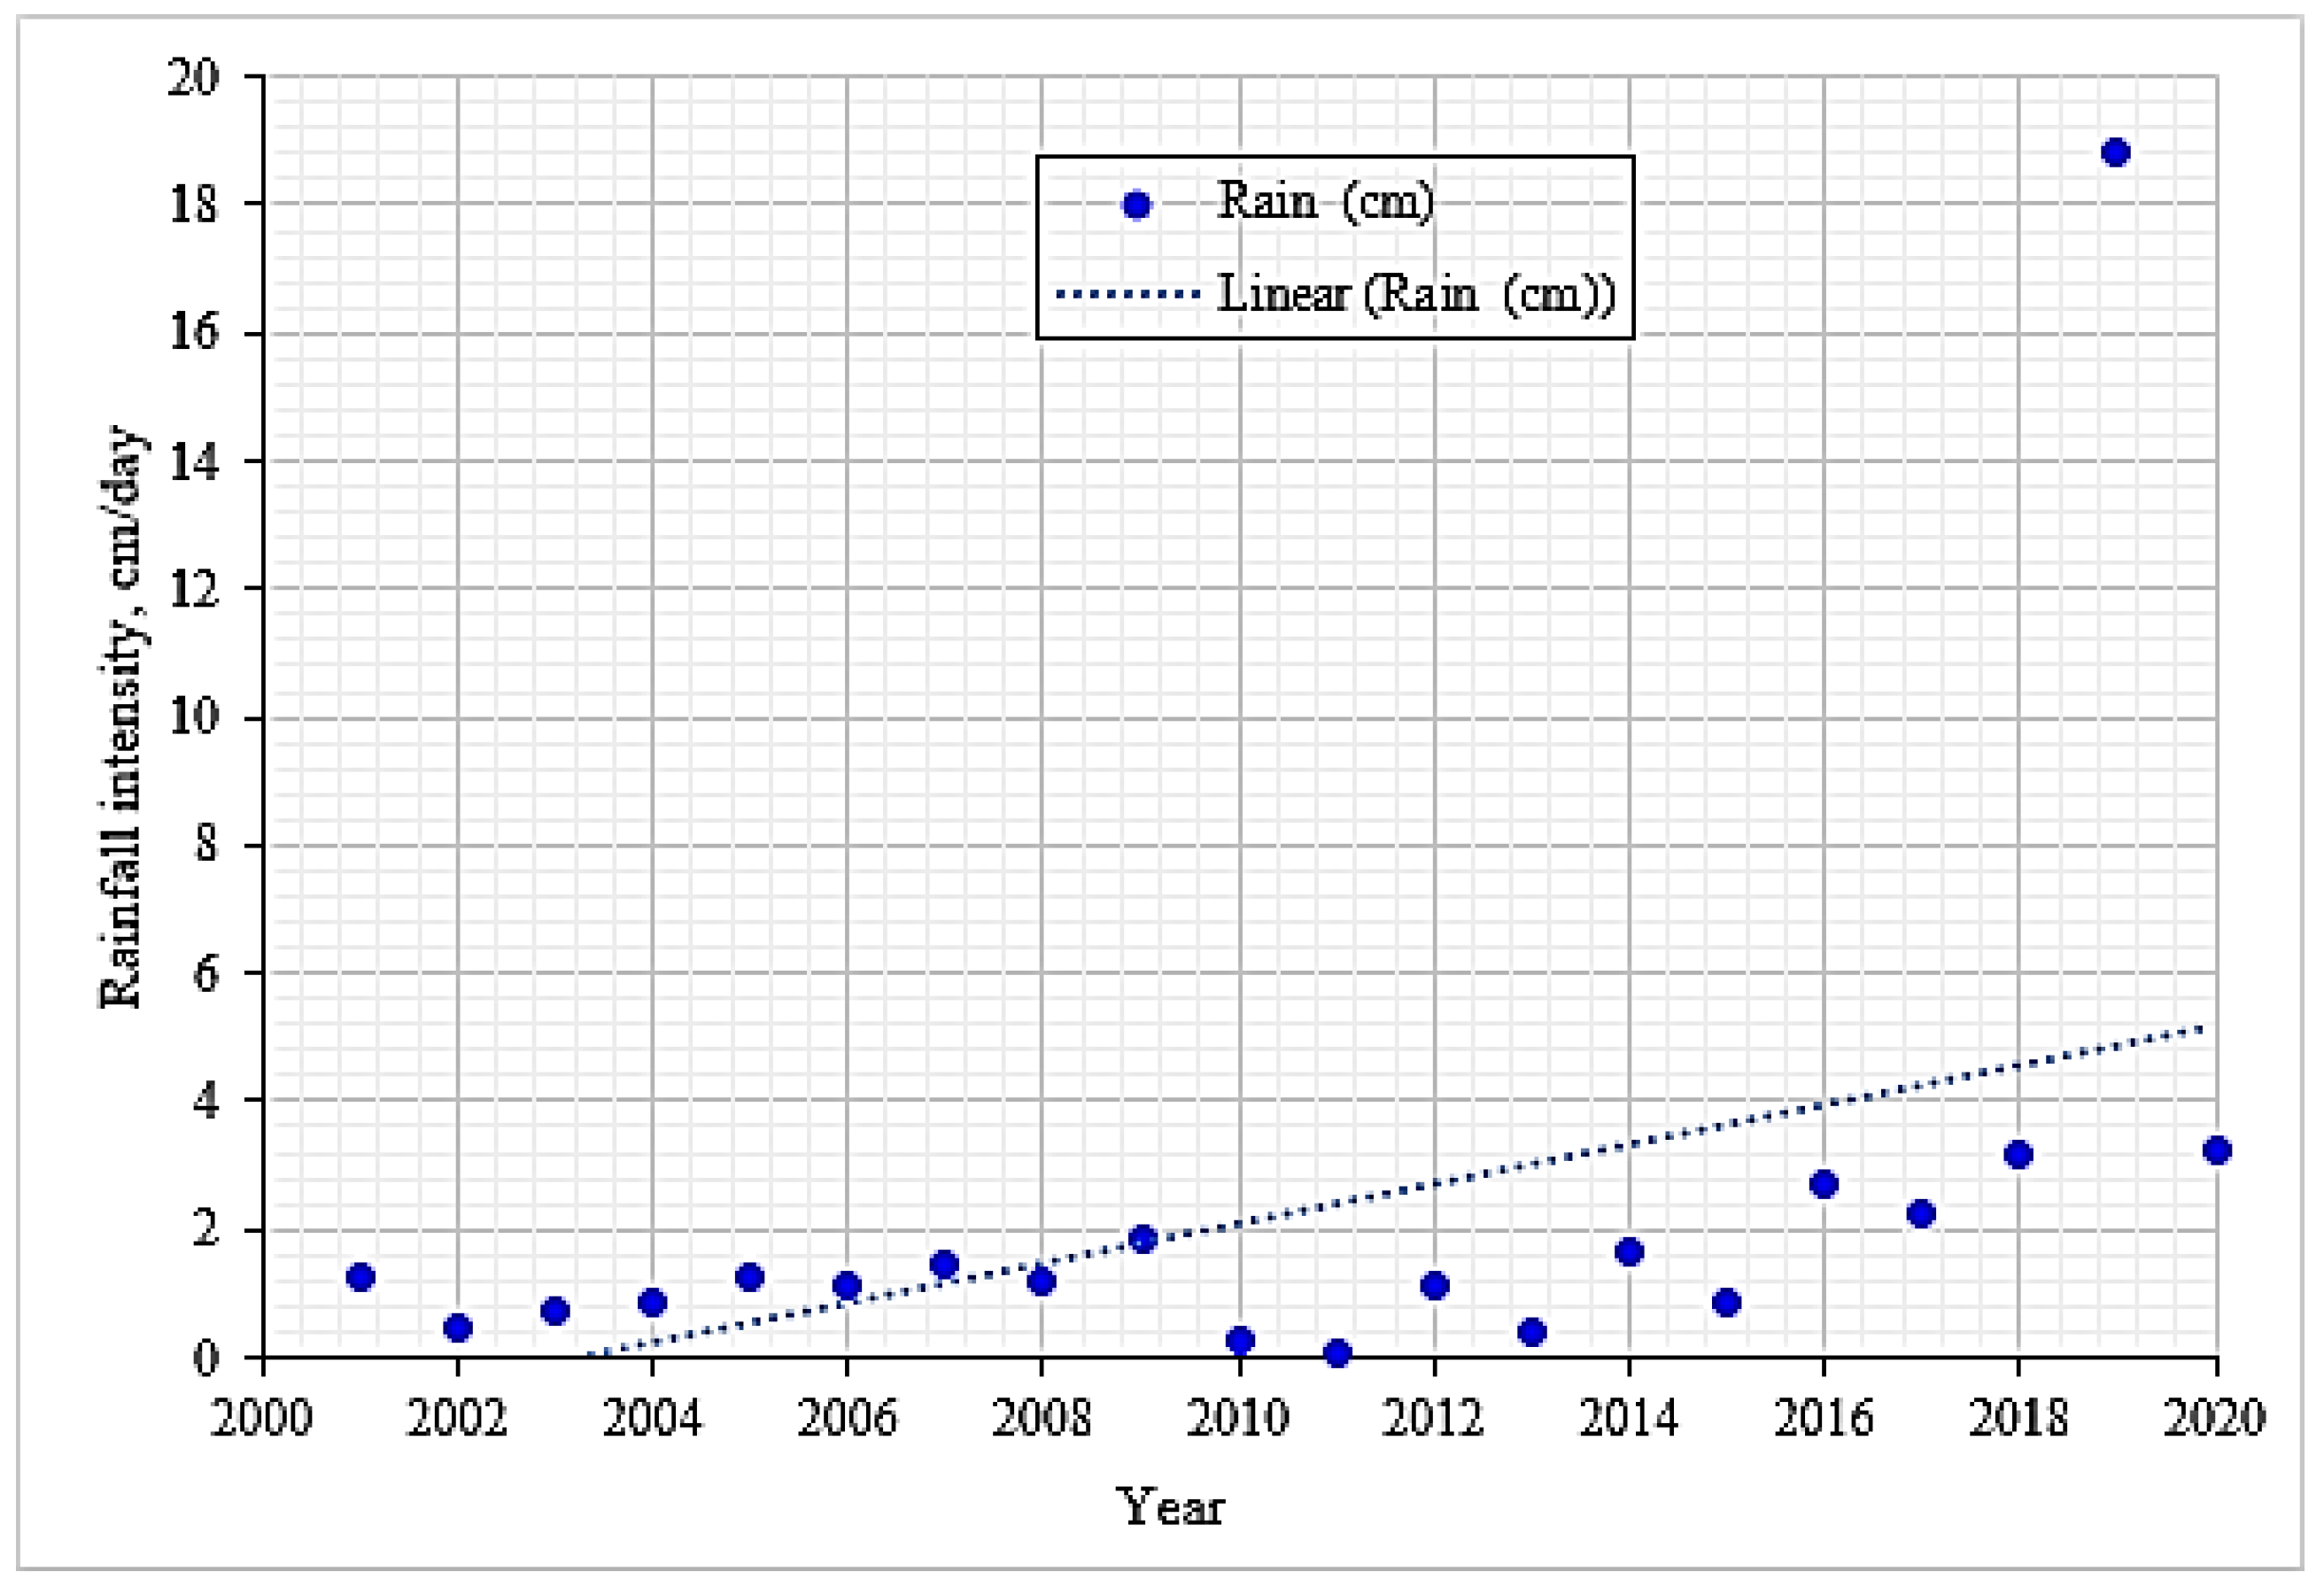
Table 8 offers a detailed summary of the Intensity–Duration–Frequency (IDF) data, which includes information on the year, rainfall (cm), the probability formula P =
+ 1, and the corresponding T values.
Figure 7 depicts the, IDF, relationship between the intensity of rainfall (rate of precipitation), its duration (length of time over which the rain occurs), and the frequency (return period or how often such an event is expected to occur). The IDF curve helps engineers and planners design stormwater systems, flood control measures, and drainage infrastructure by providing a way to predict extreme weather events based on historical rainfall data. It is crucial for understanding and preparing for potential flooding and managing water resources efficiently.
Table 8 presents the probability of a specific rainfall magnitude, denoted by P, expressed as either a percentage or a fractional likelihood. The return period, T, represents the average number of years between occurrences of similar magnitudes, while n indicates the total number of years analyzed in the dataset.
The influence of rainfall on slope stability is acknowledged as a critical factor, particularly due to its impact on rock mass strength. Processes such as weathering, pore pressure buildup, and increased failure susceptibility due to saturation are highlighted as significant. To address this, it is proposed that rainfall Intensity–Duration–Frequency (IDF) data be integrated into the simulation calculations. The IDF relationship, as presented in
Figure 7 and
Table 8, is utilized to provide a statistical framework for predicting the magnitude and recurrence of rainfall events. By incorporating the probability and return period (T) of such events, a more accurate assessment of their impact on rock mass strength can be achieved, allowing stability evaluations to be refined.
In future studies, rainfall-related parameters should be incorporated into modeling approaches to ensure the effects on rock mass strength are fully accounted for, particularly in regions subject to heavy rainfall. This would enable a more comprehensive and realistic evaluation of slope stability under varying environmental conditions.
4. Results
In this study, slope stability analysis using Plaxis has been conducted to assess three distinct locations with varying geometric characteristics. The analysis covers these different geometries, and the geographic coordinates of the study area are provided in
Table 9.
4.1. Geometry #1
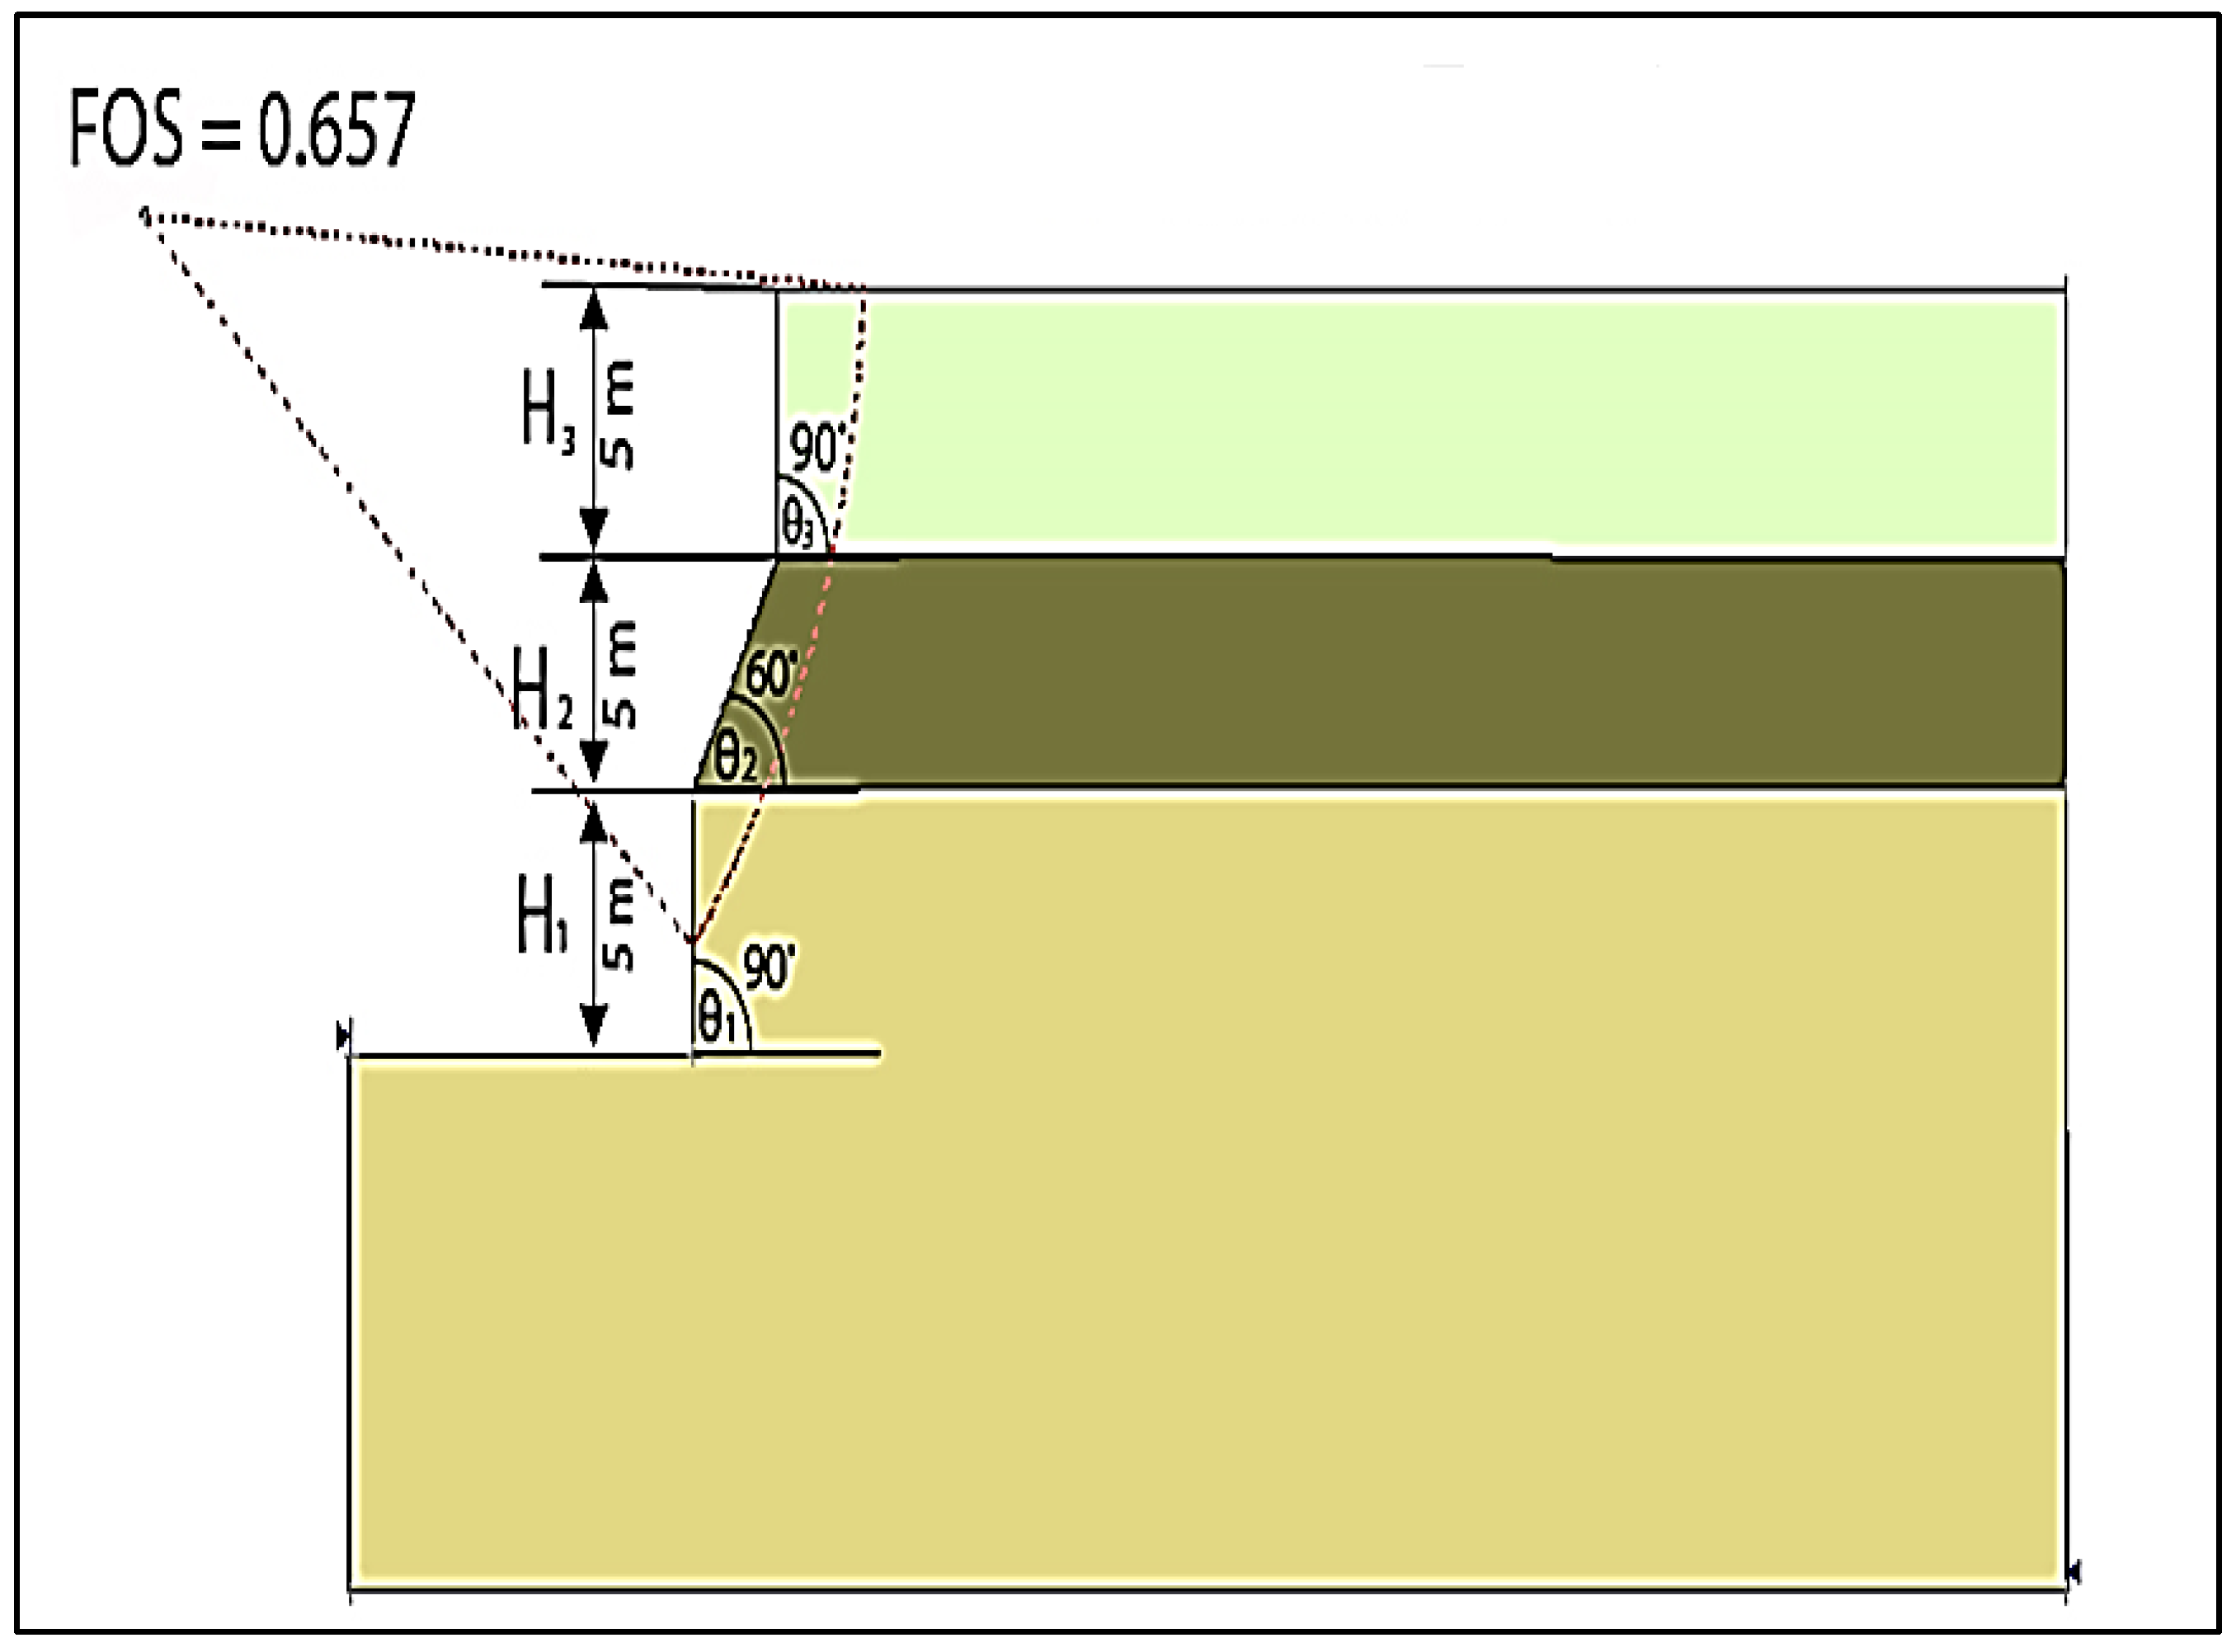
Figure 8 illustrates the layout of the first study area, highlighting essential parameters such as the height, slope angle, and density of each bench, as listed in
Table 10. This figure also captures the in-situ conditions of Geometry #1, providing a thorough understanding of the geological characteristics and structural configuration of the site. The detailed representation enables a clear visualization of the slopes’ attributes, essential for assessing their stability and performance.
Table 11 presents the geomechanical properties of each layer utilized in the numerical modeling with the Finite Element Plaxis code. In addition,
Figure 9 demonstrates the Factor of Safety (FOS) calculated using the Plaxis finite element method, which reveals an initial FOS of 0.657 for the slope before any redesign efforts were undertaken. This preliminary value highlights significant concerns regarding the slope’s stability, suggesting an increased vulnerability to potential failure mechanisms. Such a low Factor of Safety emphasizes the importance of conducting a detailed evaluation and redesign to enhance the slope’s resilience against geological and environmental stresses.
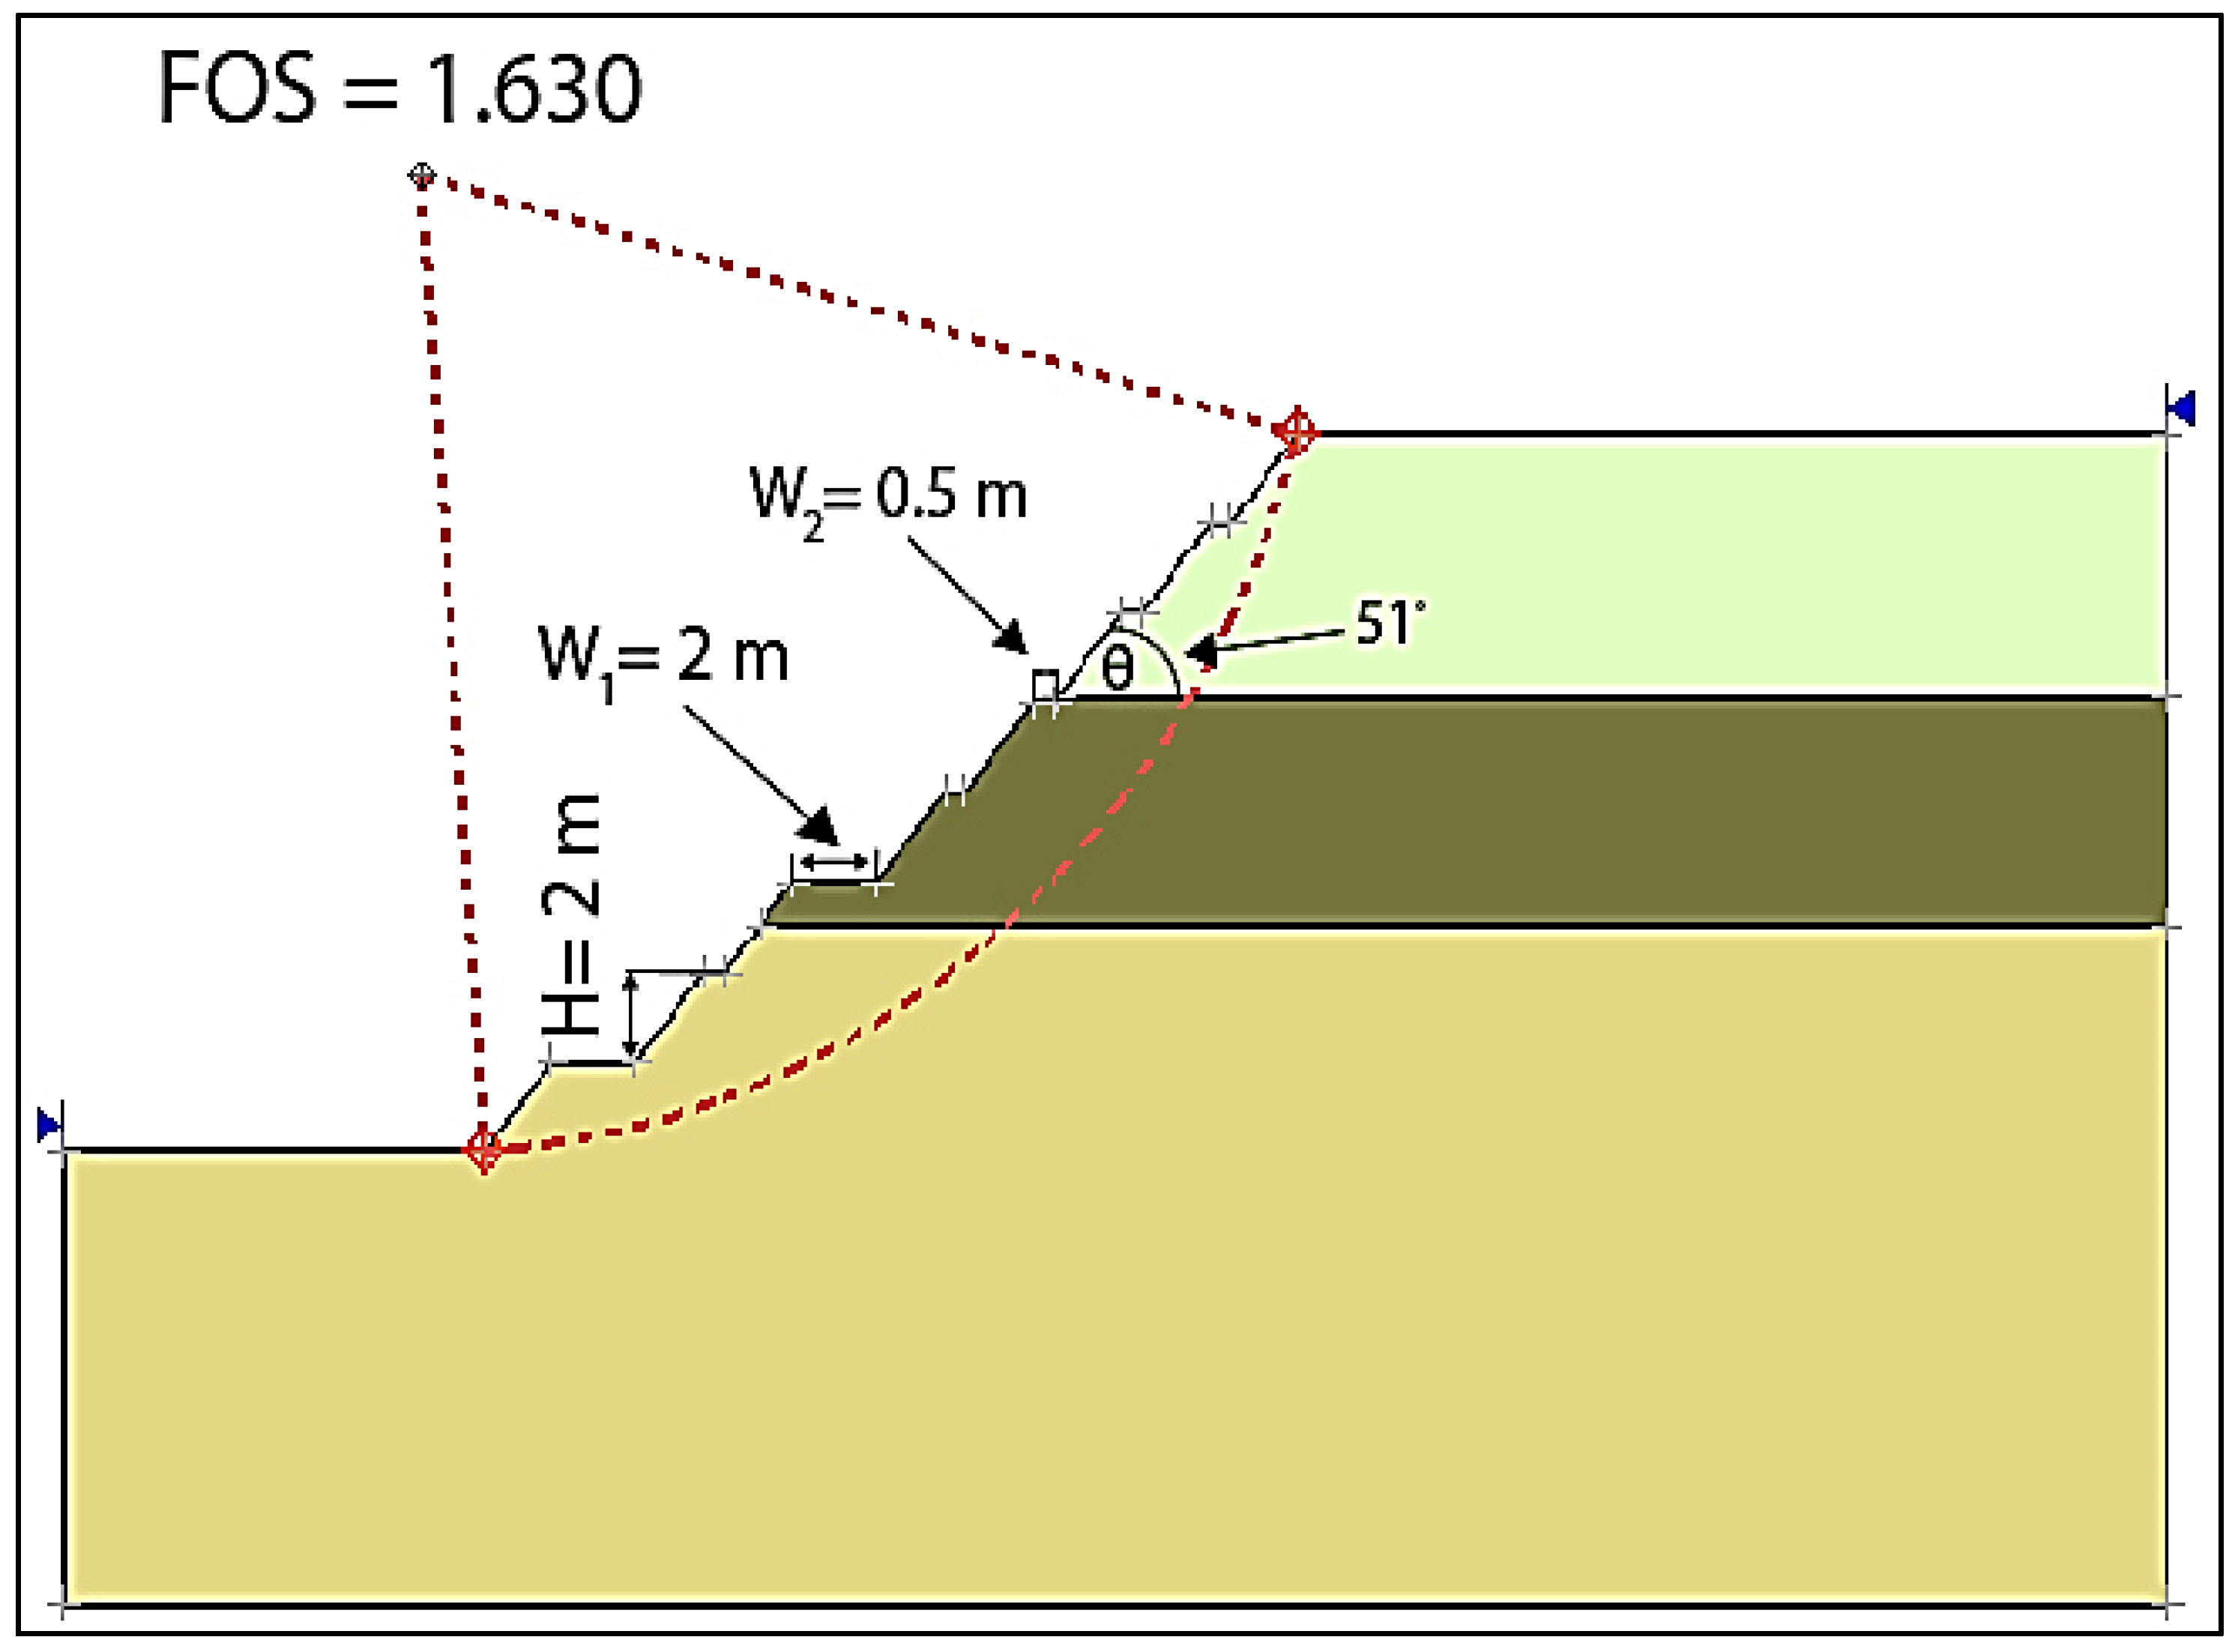
Following the redesign process,
Figure 10 illustrates a marked improvement in the Factor of Safety, with the FOS increasing to 1.63. This substantial enhancement represents a 2.5-fold increase from the initial value, indicating a notable reduction in the risk of slope failure. The redesign not only strengthens the structural integrity of the slope but also establishes a more secure operational environment. By effectively addressing the identified weaknesses, this improvement significantly mitigates the potential hazards associated with slope instability.
Overall, these figures collectively demonstrate the critical importance of utilizing advanced modeling techniques, such as the Plaxis finite element method, to inform design decisions and improve safety in slope engineering. The enhancements achieved through the redesign process exemplify the value of rigorous analysis and proactive measures in ensuring the long-term stability and safety of geotechnical structures.
4.2. Geometry #2
Figure 11 shows the in situ configuration of Geometry #2 for the slope. A comprehensive analysis of the original slope design was carried out using Plaxis, as illustrated in
Figure 12. The slope consists of three benches with angles of 90, 60, and 90 degrees, and respective heights of 3, 7, and 3 m. The initial Factor of Safety was found to be 0.699.
Following the assessment, a thorough redesign was implemented to significantly improve safety measures for the slope. The updated configuration, as illustrated in
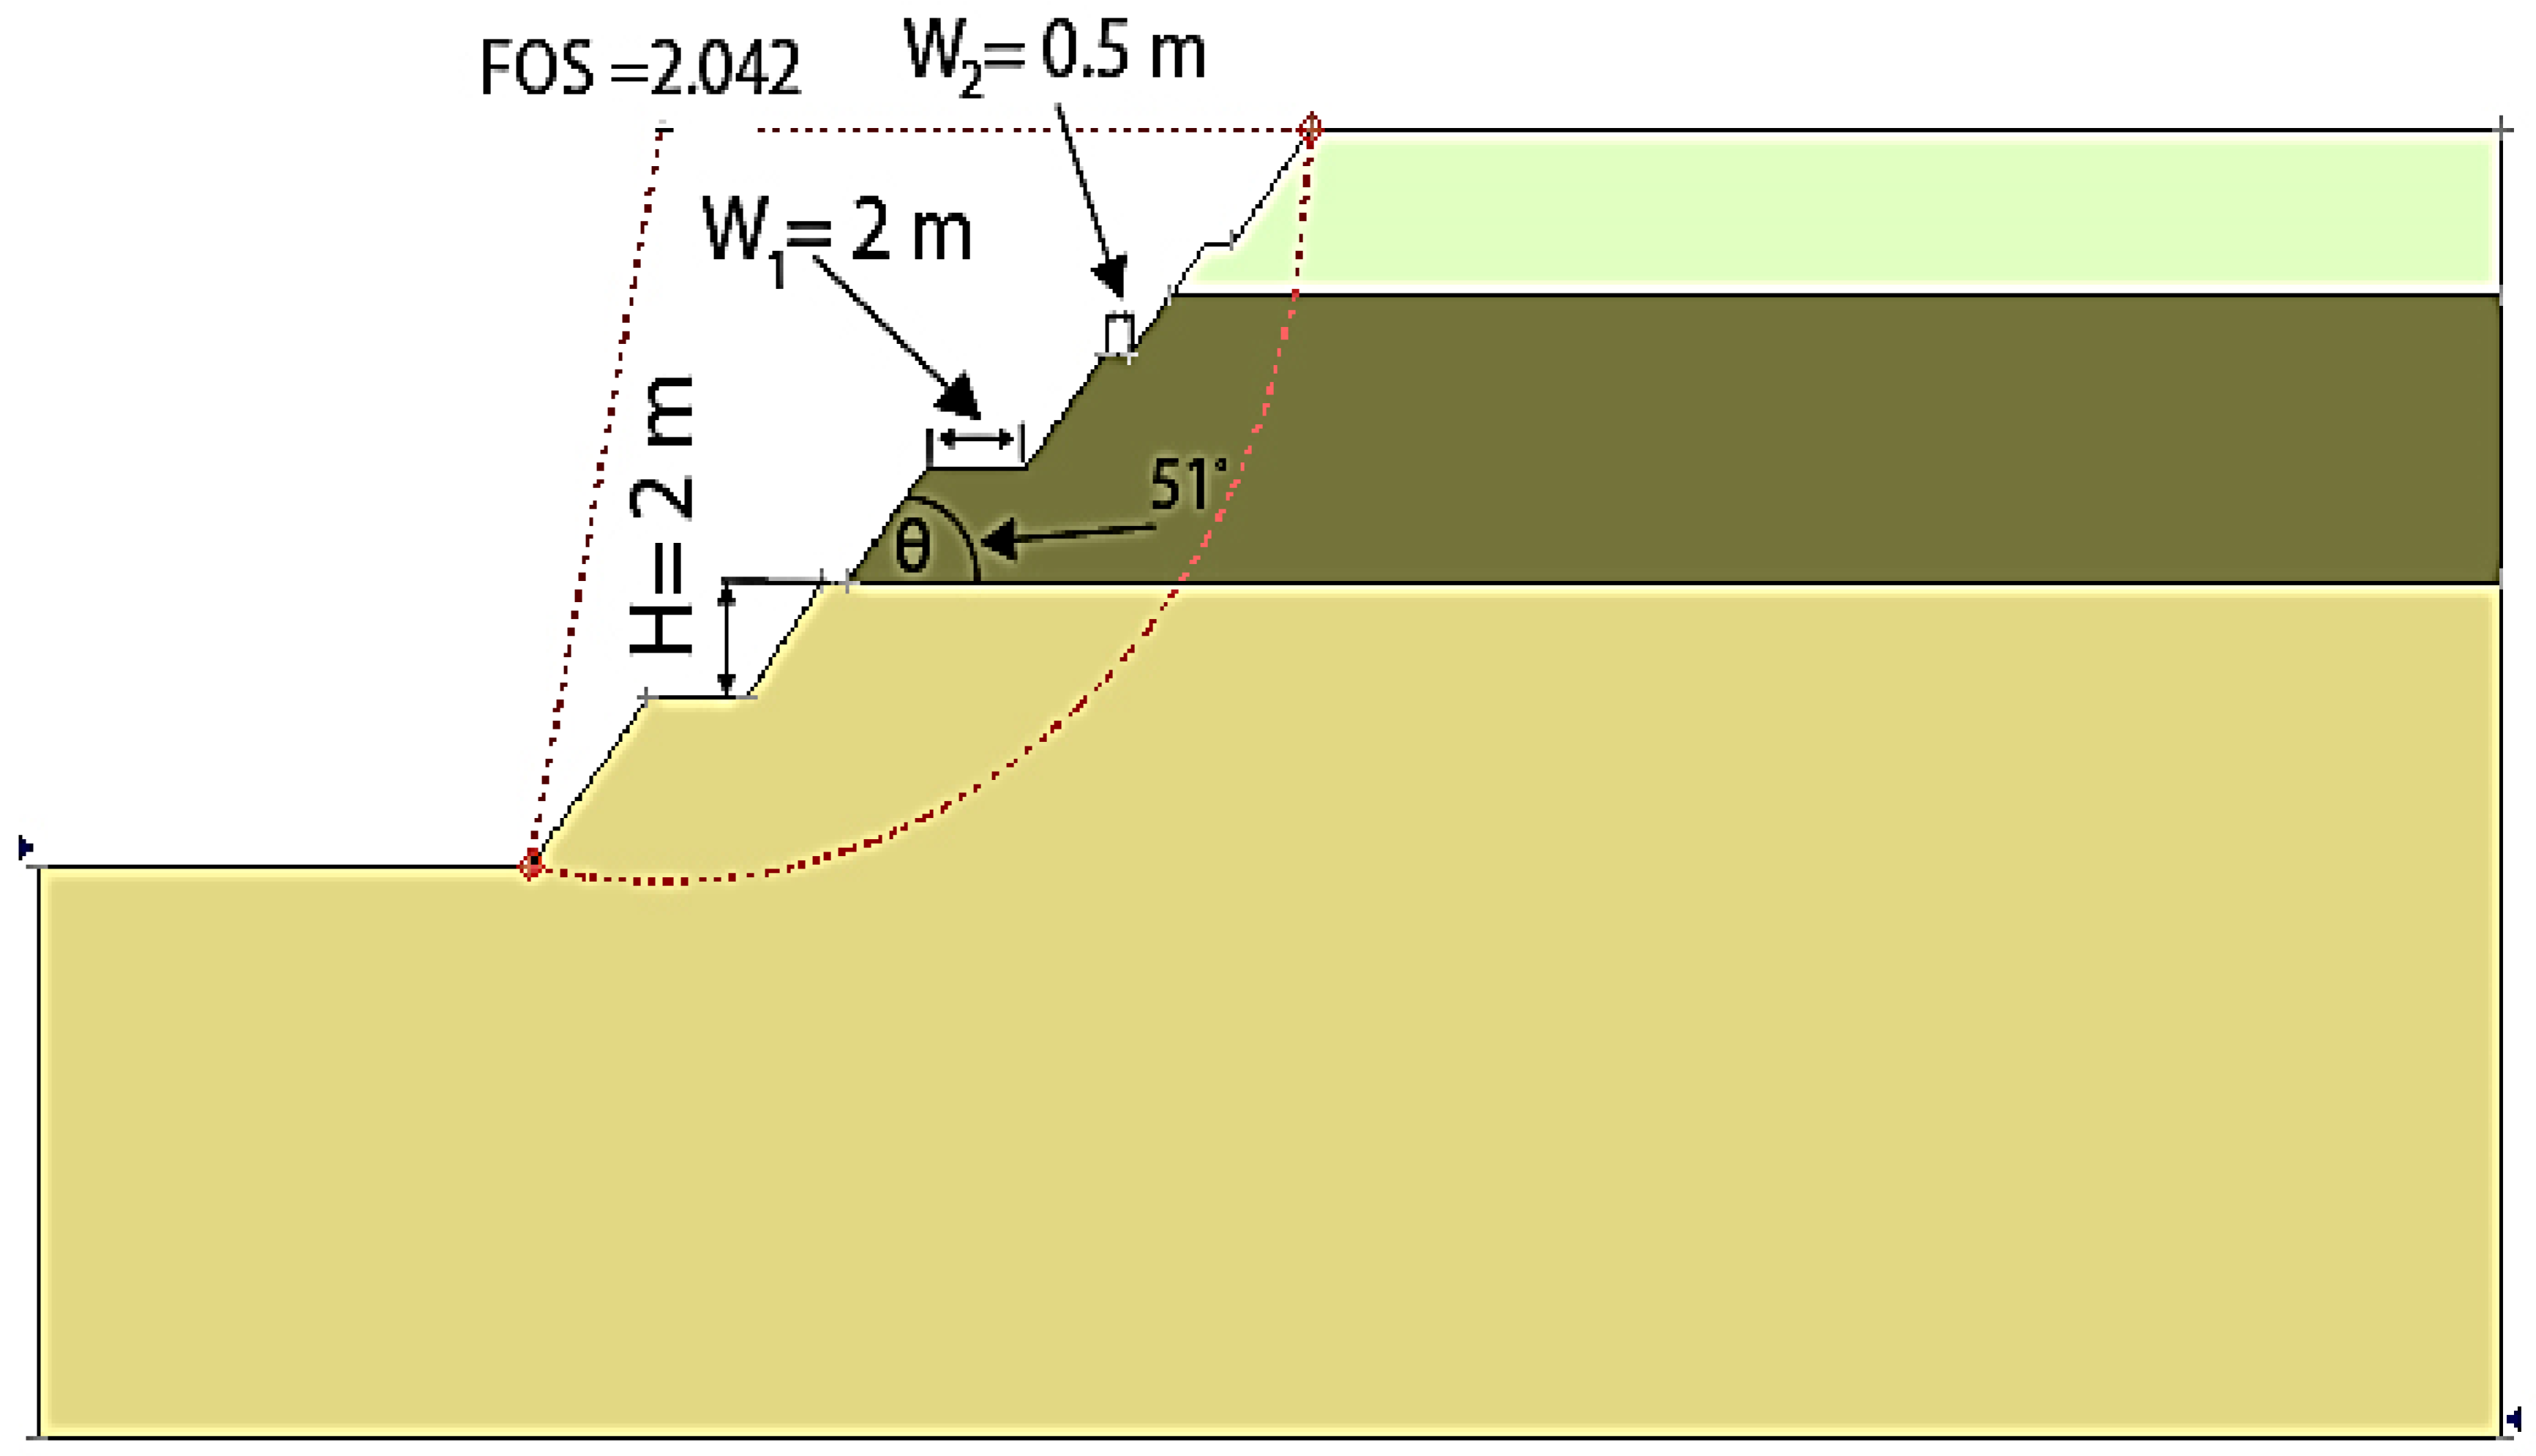
Figure 13, introduced several key changes to optimize stability. The slope was restructured with benches having a 51-degree angle, offering a more balanced and secure gradient compared to the original design. The bench height was set at 2 m, ensuring a better distribution of forces along the slope. Additionally, the working berm width was made adjustable, varying between 0.5 to 2 m, allowing for greater flexibility in managing the terrain and responding to site-specific conditions.
This revised design,
Figure 13, resulted in a notable enhancement of the Factor of Safety, which increased to 2.042—a significant improvement over the original factor of 0.699. The higher safety factor demonstrates the effectiveness of the redesign in addressing the previously identified risks. By improving slope stability, this redesign successfully reduces the likelihood of cut-slope failure, ensuring a safer and more reliable structure for long-term operations. The combination of steeper bench angles, controlled bench height, and adjustable berm width was essential in mitigating potential hazards associated with the initial configuration, ultimately providing a more robust and secure solution.
4.3. Geometry #3
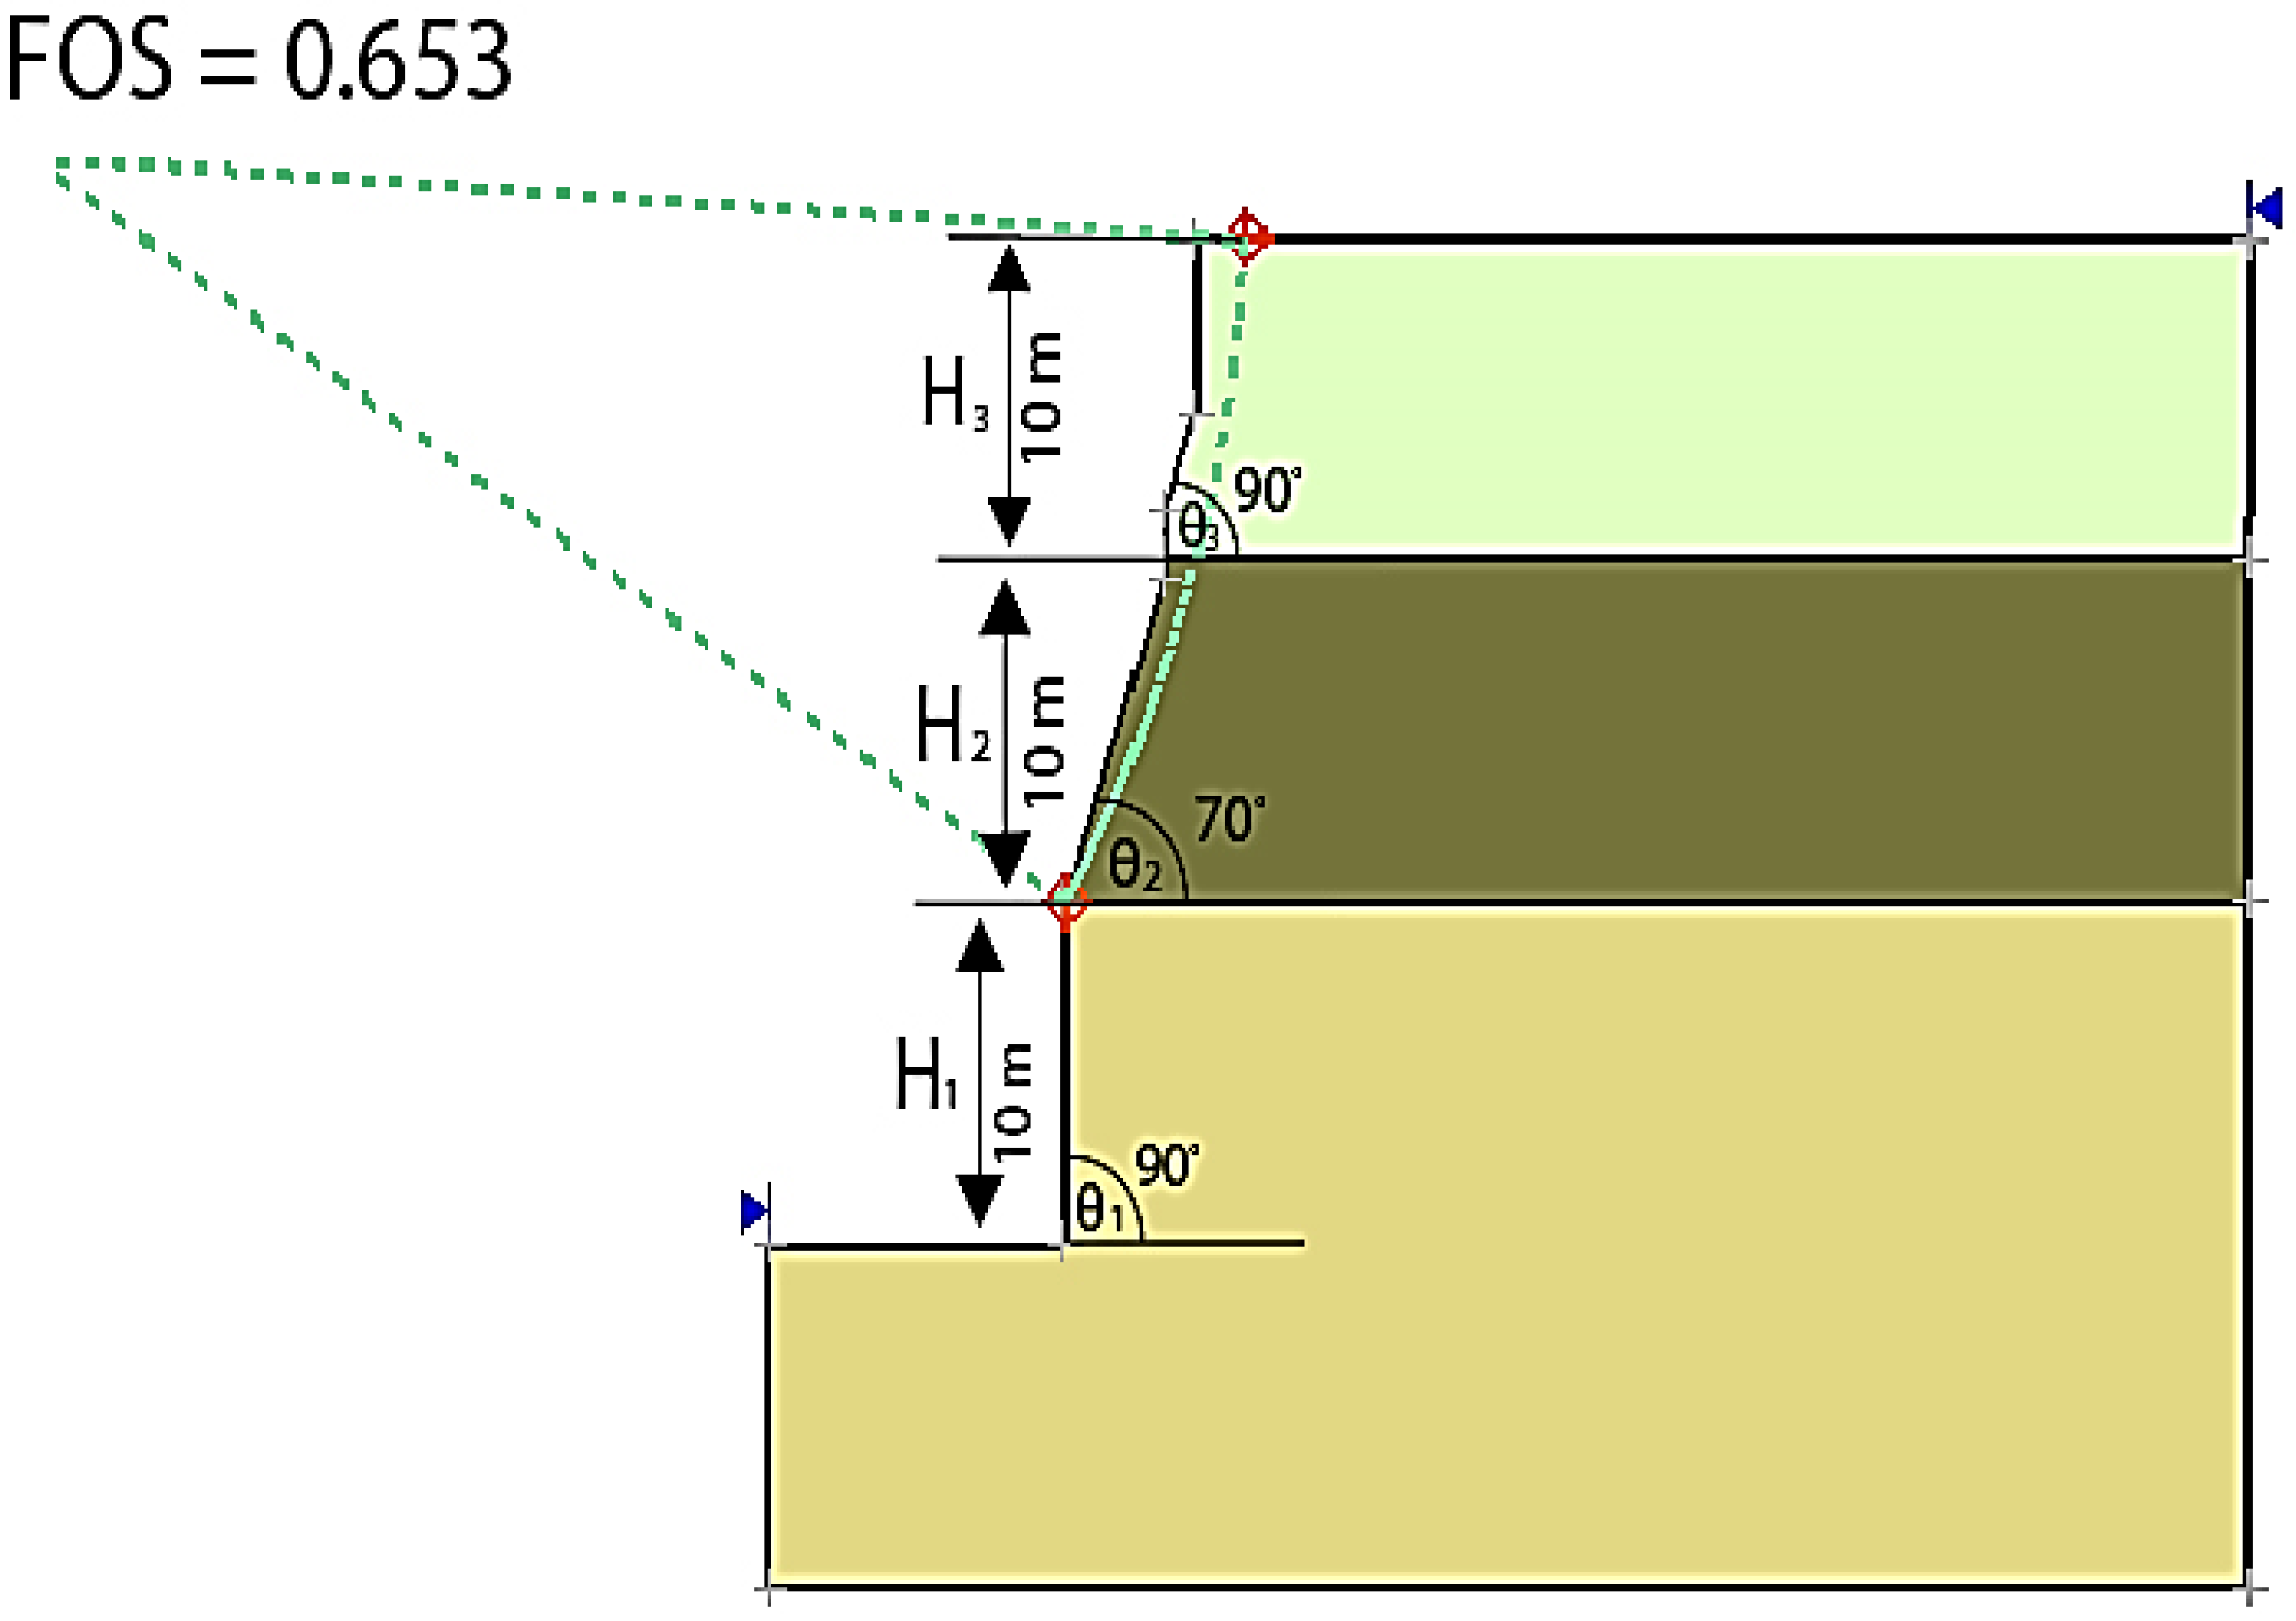
Figure 14 illustrates the detailed layout of the slope referred to as Geometry #3. A thorough analysis conducted using Plaxis software revealed that the original configuration comprised three distinct benches, each characterized by specific slope angles of 90, 60, and 90 degrees. Each of these benches had a uniform height of 10 m. The initial safety factor calculated for this arrangement was 0.653, which indicated potential instability and raised concerns regarding the slope’s ability to withstand various environmental and operational pressures.
Given the implications of this initial safety assessment, which highlighted the need for intervention, a redesign of the slope was initiated with the primary goal of enhancing its stability and safety. The revised configuration, depicted in
Figure 15, features benches that have been modified to incorporate a more favorable slope angle of 51 degrees. This adjustment significantly improves the distribution of forces acting upon the slope, thereby reducing the risk of failure. Moreover, the height of each bench was reduced to 2 m, lowering the center of gravity and further contributing to the overall stability of the slope.
Additionally, the redesign introduced a flexible berm width that varies from 0.5 to 2 m. This adaptability allows for a more tailored response to specific geological and environmental conditions, enhancing the slope’s ability to manage surface water runoff and other factors that could contribute to instability. Such flexibility is crucial in geotechnical design, as it enables engineers to optimize the slope for varying site conditions and operational requirements.
The effectiveness of this redesign is clearly demonstrated in
Figure 16, which shows that the updated slope configuration successfully mitigated the risks associated with the cut slope. After implementing these changes, the safety factor improved significantly, increasing to 1.952. This remarkable enhancement not only reflects a reduced likelihood of slope failure but also signifies the successful application of modern geotechnical engineering principles in practice.
Overall, the redesign of Geometry #3 serves as a vital measure in addressing potential hazards and ensuring safe operational conditions. It exemplifies the importance of utilizing advanced modeling techniques, like Plaxis, to inform design decisions and implement effective solutions in slope engineering. This case underscores the critical role that thorough analysis and proactive redesign play in enhancing the stability and safety of slopes in various applications, ultimately contributing to the broader field of geotechnical engineering.
5. Discussion
Figure 17 illustrates the critical factors contributing to slope instability in a stone-cutting region. This area features a 20-m-high rock cut characterized by significant face irregularities and open vertical joints, alongside a 10-m-high cut exhibiting looseness at its upper section. The lane width in this region is 4 m, with a shoulder width of less than 0.5 m and no catchment ditch present.
An analysis of the terrain has identified numerous elements that significantly challenge stability, each possessing unique characteristics that emphasize the importance of comprehensively understanding the geological, engineering, and infrastructural factors affecting slope stability. A key geological factor influencing stability is the orientation of discontinuities, which plays a crucial role in triggering wedge and planar failures that threaten the integrity of the slope.
Furthermore, the rock masses in the region demonstrate low strength, which compounds the risk of instability. The presence of sinkholes filled with angular materials held together by a weak and easily erodible matrix adds another layer of complexity to the stability issues faced in this area.
Additionally, the unstable irregularities and loose material on the upper portion of the cut, which are susceptible to rock falls, present immediate hazards. These irregularities in the rock structure necessitate careful attention in slope management practices to reduce the likelihood of instability-related incidents. Overall, these findings underscore the need for effective mitigation strategies that account for the intricate interplay of geological factors impacting slope stability.
Beyond geological considerations, engineering practices are vital in influencing slope stability. The method of excavation used in slope cutting significantly impacts the overall stability, as illustrated in the accompanying figures. Ineffective blasting techniques can lead to face irregularities and looseness in the rock face, which exacerbate the difficulties in maintaining slope integrity.
Infrastructure elements also significantly complicate slope stability challenges. The design of a single-lane road in each direction, combined with insufficient shoulder width, restricts motorists’ ability to navigate around debris or fallen materials. Additionally, the lack of drainage ditches to collect loose materials allows them to encroach onto travel lanes, heightening the risk of accidents. The road’s sharp curves further limit the decision sight distance for drivers, increasing the likelihood of hazardous encounters with unstable slopes.
The factors identified in this context can be categorized into three primary groups that elevate the risk of slope instability. First, geological factors include the types of rock present, the strength of intact rock, the resilience of weathered materials along discontinuities, the occurrence of sinkholes, the strength of cemented materials found in sinkholes, and the alignment of adverse discontinuities. Each of these elements plays a critical role in determining the stability of the slope.
Second, engineering factors, particularly the methods of excavation, are paramount in ensuring slope stability. Poor blasting practices can lead to irregular rock faces and slackness, which compromise the structural integrity of the slope. Lastly, infrastructure factors such as the absence of heads, drainage benches for mining activities, and inadequate road trenches significantly contribute to the risk of rock falls that can obstruct travel lanes, limiting escape routes for vehicles.
In summary, the complex interaction between geological, engineering, and infrastructure factors illustrates the multi-faceted nature of slope stability in stone-cutting regions. A comprehensive understanding of these interrelated elements is essential for effective slope management and the formulation of strategies aimed at mitigating instability risks. This approach is crucial to safeguarding both the structural integrity of infrastructure and the safety of individuals in the surrounding area.
6. Conclusions
This study examines a critical section of a major Egyptian highway connecting Aswan and Cairo, focusing on a one-kilometer stretch that passes through a rock cut. This segment plays a vital role in facilitating transportation and commercial activities, underscoring the importance of balancing technical, safety, and financial considerations. Slope instability is not merely a short-term operational concern; its impacts can be far-reaching, potentially resulting in severe disruptions or even closures of mining operations. Slope failure generally occurs when shear stress within a rock mass exceeds its shear strength, a condition often exacerbated by geological discontinuities such as faults and fractures. A range of factors—including geological structures, lithology, slope geometry, groundwater conditions, and operational practices—contributes to the delicate equilibrium that governs slope stability.
A thorough and integrated approach is essential when designing and planning for slope stability. This approach must account for various factors by incorporating strategies such as drainage systems, continuous monitoring, reinforcement techniques, and improvements to geological structures. Together, these measures work to enhance and maintain rock slope stability. Advances in technology have revolutionized slope monitoring, offering more detailed insights into slope dynamics over time. The ability to accurately predict slope failure is crucial for the safe operation of mines, and the adoption of artificial intelligence (AI) models has significantly improved the speed and precision of safety factor (FOS) assessments in slope stability analyses.
The evaluation of AI models highlights the importance of including a wide range of input variables to produce accurate slope stability predictions. As shown in
Table 12, assessments, evaluations, and numerical modeling demonstrate that several roadside slopes in their current configuration are unstable. The significant improvements in FOS values following slope redesign emphasize the critical role of these modifications. Redesigns, informed by thorough stability analysis, are essential for enhancing both the safety and functionality of mining operations.
In conclusion, the examination of slope stability involves a wide array of geological, engineering, and technological factors. This intricacy emphasizes the critical need for maintaining a safe and sustainable operational environment. Progress in this area will hinge on ongoing research, the integration of state-of-the-art technologies, and a committed effort to understand and tackle the challenges related to slope instability.
7. Limitations and Suggestions for Future Research
The adoption of a continuous–discontinuous coupling method, such as FEM-DEM, is suggested to better capture the complex behavior of rockfall and the instability of local rock blocks. Weathered limestone, with its dispersion potential and variable mechanical properties, poses challenges that a purely finite element method (FEM) may not fully address. While FEM is effective for large-scale slope stability assessments, it often falls short in modeling localized failure mechanisms and interactions, particularly in fractured or weathered rock masses.
Integrating a more advanced approach like FEM-DEM, which combines the ability to simulate the continuum behavior of the rock mass with the discontinuous failure of individual rock blocks, should be considered. This method would allow for more precise simulations of rockfall events, accounting for the distinct characteristics of weathered limestone and the interactions between rock blocks after failure.
Future research plans include exploring this methodology to enhance the accuracy of rockfall analysis and to develop a more comprehensive framework for slope stability evaluation.
