Abstract
Real-time drilling analysis requires knowledge of lithology at the drill bit. However, logging-while-drilling (LWD) sensors in the bottom hole assembly (BHA) are usually positioned 2–50 m (7–164 ft) above the bit (called the sensor offset), leading to a delay in real-time drilling analysis. The current industry solution to overcome this delay involves stopping drilling to perform a bottoms-up circulation for cuttings evaluation—a process that is both time-consuming and costly. To address this issue, our study evaluates three methodologies for real-time lithology prediction at the bit using drilling and petrophysical parameters. The first method employs a petrophysical approach, which involves using bulk density and neutron porosity predicted at the bit. The second method combines unsupervised and supervised machine learning (ML) for prediction. The third method employs classification algorithms on manually labeled lithology data from mud log reports, a novel approach used in this work. Our results show varying degrees of success: the bulk density versus neutron porosity cross-plot method achieved an accuracy of 58% with blind-well test data; the ML approach improved accuracy to 66%; and the Random Forest (RF) classification with manual labeling significantly increased accuracy to 86%. This comparative analysis of three different methodologies for lithology prediction has not been previously explored in the literature. While clustering and classification methods have been regarded as the most effective, our study demonstrates that they do not always yield the best result. These findings demonstrate that ML models, particularly the manual labeling approach, substantially outperform the petrophysical method. This new algorithm, designed for real-time applications, uses selected input parameters to effectively minimize problems associated with the sensor offset of LWD tools. It rapidly adapts to changes, offering a quicker and more cost-effective interpretation of lithology. This eliminates the need for time-consuming bottoms-up circulation to evaluate cuttings. Ultimately, this approach enhances drilling efficiency and significantly improves the accuracy of lithology prediction, notably in identifying interbedded geological layers.
1. Introduction
One of the main objectives of drilling a well is to improve drilling efficiency. To meet the growing demand for hydrocarbons, enhancing real-time drilling efficiency and advancing automation are crucial [1]. During drilling operations, determination of lithology in real-time is pivotal for improving drilling efficiency. Different types of formation layers can cause considerable irregularities in the azimuth and inclination of the well axis, leading to a higher likelihood of vibrations and downtime [2,3,4,5]. Accurate lithology type prediction and its corresponding rock strength helps with borehole stability and Rate of penetration (ROP) analysis, both of which contribute to improved drilling efficiency. However, the traditional method of determining lithology by examining the cuttings received at the shale shaker is challenging, specifically in interbedded sections. This challenge presents an opportunity to employ machine learning (ML) techniques to predict the lithology at the drill bit using petrophysical and drilling parameters. Such an approach enables a more accurate and prompt determination of rock types, overcoming the limitations and delays inherent in traditional methods and effectively addressing sensor offset issues.
ML methods have been used to predict lithology during drilling operations. In the past, data-driven and ML methods to predict the lithology involved implementing drilling [6,7,8,9,10,11,12,13] or petrophysical parameters [14,15,16,17,18,19,20,21,22,23,24]. A combination of drilling and petrophysical parameters was used to predict the compressional wave velocity, porosity, and bulk density but not for lithology prediction [25,26]. Supervised and unsupervised ML techniques have also been integrated to identify heterogeneous and complex reservoirs to optimize well positioning and geosteering [27].
Studies have used ML techniques based on drilling data as input parameters to determine lithology. For instance, Ref. [28] used a public dataset from the Volve field on the Norwegian continental shelf to predict lithology using measurement while drilling data. Ref. [11] developed a hybrid model that integrated analytical correlations with an ML algorithm to predict lithology at the bit using West Siberian oil and gas basin data. Ref. [9] used a multi-layer perceptron (MLP) with drilling variables to classify and predict the lithology of data from five wells operated by Equinor. Similarly, Ref. [8] employed an artificial neural network (ANN) with multiple drilling parameters to predict ten lithofacies with high accuracy. Ref. [13] used random forest (RF) and extreme gradient boosting (XGBoost) algorithms with 13 drilling parameters to predict lithology. Furthermore, Ref. [12] used an ANN algorithm with an optimizer to predict the complex lithologies of vertical, inclined, and horizontal wells from drilling data in the Eagle Ford region. Ref. [29] predicted the lithology using real-time drilling data from the South Pars gas field in Iran with medium accuracy using an ANN. Ref. [6] integrated an unsupervised method to predict rock types using an optimized adjusted penetration rate. Ref. [7] used the SVM classification method by integrating seismic attributes to predict the lithology of a formation using well log data for a heterogeneous carbonate reservoir in Iran. Ref. [30] developed an ML voting classifier model to predict lithology using multiple classification algorithms: support vector machine (SVM), logistic regression, RF, K-nearest neighbors (KNN), and MLP, with drilling properties as input parameters. Ref. [10] used three ML models—ANN, adaptive neuro-fuzzy inference system, and functional neural network to predict lithological variations using drilling parameters.
Multiple ML models have been investigated using petrophysical measurements to predict lithology. Ref. [16] used an RF classifier on a dataset of five wells from the Lower Congo Basin in West Africa, while Ref. [15] developed end-to-end ML models to predict lithology from petrophysical data. Ref. [18] conducted a comparative analysis of different classification models using well log data from the Anadarko Basin in Kansas. Ref. [23] applied a classification and neural network approach to the Alaska North Slope dataset. Ref. [16] used an RF and XGBoosting ensemble method on Athabasca oil sand log data to predict lithology. Ref. [31] performed a comparative analysis that included SVMs, generalized regression neural networks (GRNNs), and Elman simple current neural network models for lithology prediction. Ref. [14] used five ML classifiers (Naïve Bayes, SVM, ANN, RF, and gradient tree boosting) on data from two wells in the Ordos Basin, China, to forecast lithology. Ref. [20] incorporated XGBoost with Bayesian optimization (BO), while Ref. [20] used one-versus-rest and one-versus-one SVMs and RF to predict the rock type. Ref. [21] used a one-versus-one SVM, RF, neural networks, and XGBoost algorithms. Ref. [22] used an integrated approach that included numerical equations, neuro-fuzzy neural networks, and statistical analyses to predict lithology. Ref. [24] explored using supervised ML methods such as SVM, decision tree (DT), RF, MLP, and XGBoost to forecast rock types. Table A1 summarizes the list of papers providing the evidence of using ML to predict lithology using drilling or petrophysical or both parameters.
ML techniques have been previously applied to predict lithology using drilling or petrophysical parameters as inputs. However, no comparative analyses have been performed between lithology predictions derived from predicted neutron porosity and predicted bulk density cross-plots and those obtained through ML methods. Additionally, manual lithofacies detection using mud log reports for precise rock-type identification, bypassing the clustering step in ML, and directly classifying rock types based on drilling and petrophysical data have not been explored. The issue of sensor offset, which causes a lag in real-time drilling analysis, has also not been used in lithology prediction. The current industry practice to overcome this delay involves stopping drilling to perform bottoms-up circulation—a process that is economically challenging. To fill this gap, we developed and compared three approaches for real-time lithology prediction at the bit. The first approach involves lithological prediction using the predicted bulk density and predicted neutron porosity at the bit, as determined using ML techniques [25,26]. Advancing beyond traditional methods, the second approach employs ML techniques, including k-means clustering and hierarchical clustering for lithofacies clustering, along with KNN, RF, SVM, MLP, and DL classifications for lithology prediction at the bit. The third approach uses manual labeling of lithofacies from mud log reports as training data, followed by classification using the aforementioned ML algorithms. The third approach, specifically designed for real-time applications, trains models using drilling and petrophysical data from four wells on the Norwegian continental shelf, with the accuracy of these models assessed by validating their predictions using an unseen or blind test well dataset (blind–test) and conducting a comparative analysis with the lithology log of the tested well. The most effective model was quantitatively identified based on its accuracy performance with the testing well, along with its F1 score and receiver operating characteristic (ROC) curve.
2. Field Overview
The data for this study were obtained from five wells (A, B, C, D, and E) located on the Norwegian continental shelf, spanning measured depths from 650 m MD to 4500 m MD. These data include logging-while-drilling (LWD) logs and surface drilling data, collected from hole sizes of 17 ½, 12 ¼, and 8 ½ inches. Among the five wells, four were used for model training, whereas the fifth (Well #B) was used to evaluate the accuracy of the developed model by comparing it with the lithology from the mud log report. Surface drilling parameters include ROP, surface revolutions per minute (SRPM), surface weight on bit (SWOB), surface torque (STOR), and hole size (HS), while gamma ray (GR), compressional wave velocity (DTCO), porosity (TNPH), bulk density (RHOB), and IMP/ARC attenuation resistivity 40-in at 400 kHz (A40L) resistivity value are the input LWD variables used in the clustering. Downhole drilling parameters were not included due to the poor quality and inconsistency of measurements, making surface drilling data a more reliable choice for this analysis.
3. Methodology
In total, three methods were used to predict lithology during drilling. The first method is the bulk density vs. neutron porosity cross-plot. The second method uses clustering and classification with selected parameters for further model refinement. The third method uses labeled lithology in the training data and applies classification models to predict the lithology type at each depth. Figure 1 illustrates the workflow of these three methods, highlighting the key steps involved in clustering, classification, and model selection based on accuracy.
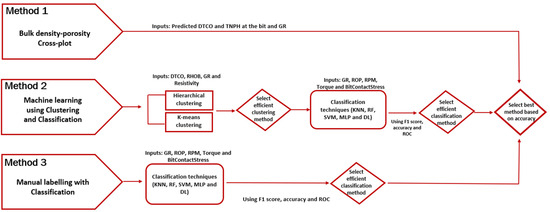
Figure 1.
Workflow for lithology prediction methods. The figure outlines three approaches: bulk density vs. porosity cross-plot, clustering and classification, and labeled lithology classification, along with key decision points for selecting the most accurate model.
The three approaches for lithology prediction at the drilling bit, using drilling and petrophysical data, follow a similar workflow. The first step involved selecting the parameters to be included in the model training dataset. Subsequently, the input parameters from the four wells were cleaned and scaled, and the correlation relationship of each parameter analyzed through multicollinearity analysis before training the model. The model’s prediction accuracy was evaluated on a new well dataset, serving as blind–test, where its quality was assessed depth-by-depth through its F1 score and ROC curve. The F1 score, representing the harmonic mean of precision and recall, ranged from 0 to 1. A higher F1 score indicates the superior predictive quality of the model, reflecting a balanced integration of precision and recall in its performance. The ROC curve was used to understand the model’s ability to distinguish between clusters by analyzing the area under the ROC curve (AUC) values. Similar to the F1 score, the AUC ranged from 0 to 1, with a higher AUC indicating a more effective model for differentiating between clusters. Accuracy, which measures the proportion of correctly classified instances out of the total instances, and the F1 score were calculated using the following equations:
where True Positives (TP) is the number of correctly predicted positive instances, True Negatives (TN) is the number of correctly predicted negative instances, False Positives (FP) is the number of incorrectly predicted positive instances, and False Negatives (FN) is the number of incorrectly predicted negative instances.
where precision, also called positive predicted value, and recall, also known as sensitivity or true positive rate, are defined as:
3.1. Method 1: Bulk Density and Neutron Porosity Cross-Plot
Cross-plots of the bulk density (on the y-axis, reversed) and neutron porosity (on the x-axis) were used to determine the lithology. It is important to note that the bulk density and neutron porosity cross-plot was used exclusively for clustering purposes. Given that neutron porosity is not a direct measure of true porosity and is significantly influenced by clay content, it often results in porosity overestimation. Nonetheless, since this value was only used for lithology detection and not involved in any other calculations, this limitation did not affect this study substantially. Lines for clean sandstone, clean limestone, and clean dolomite converge at the y-axis at their respective matrix densities: 2.65 g/cm3 for clean sandstone, 2.71 g/cm3 for limestone, and 2.85 g/cm3 for dolomite. In this analysis, 50% hard cutoff lines were included between clean sandstone and clean limestone (sand-lime line) and between clean limestone and clean dolomite (lime-dolo line) to simplify the real-time analysis. The 50% hard cut-off lines were determined by averaging the matrix densities between clean sandstone and clean limestone (sand-lime = 2.68 g/cc) and between clean limestone and clean dolomite (lime-dolo = 2.78 g/cc), respectively. Data points exhibiting more than 80 API gamma ray log values were classified as shale. For non-shale data points, those above the sand-lime line, those between the sand-lime and lime-dolo lines, and those below the lime-dolo line with less than 20% neutron porosity were classified as sandstone, limestone, and dolomite, respectively. These lines were plotted under the assumption that the pore spaces were filled with brine (density: 1.03 g/cm3).
The prediction of the bulk density and neutron porosity used in the conventional method for lithology prediction during drilling was adapted from Ref. [25]. They found that KNN regression was the most effective ML method for predicting the bulk density and neutron porosity at the bit and identified ROP, SWOB, STOR, SRPM, and GR as the key input parameters for predicting these two response variables.
3.2. Method 2: ML Using Clustering and Classification
In this method for predicting the lithology at the bit, clustering and classification techniques are employed owing to the absence of lithofacies information in the dataset. Initially, k-means clustering parameters, such as GR, RHOB, TNPH, DTCO, and A40L, were selected. The dataset was split into 80% for training and 20% for testing to evaluate the performance of the machine learning models. While k-means clustering requires the analysis of input parameter selection, hierarchical clustering offers a more straightforward approach, allowing for the inclusion of all available parameters directly in cluster formation, thereby eliminating the need for additional parameter analysis.
3.2.1. k-Means Clustering
To determine the optimal number of clusters and ensure effective performance for k-means clustering, we analyzed the plot of the sum of squares within (SSW) against the number of clusters (Figure 2a) and calculated the silhouette scores for various potential cluster numbers (Figure 2b). These plots indicate that the ideal number of clusters for the k-means analysis appears to be five, as evidenced by the higher silhouette score (Figure 2a) and the “elbow” in the SSW plot (Figure 2b). Although the plots indicate a marginal preference for five clusters over four, further validation against lithology logs and consultations with domain experts indicate that choosing four clusters provides a more meaningful and accurate representation of the distinct lithologies present in the study area. In addition, the inherent noise and high variability of the drilling and petrophysical data contribute to silhouette scores of less than 0.5, often resulting in overlapping clusters with less distinct separation.
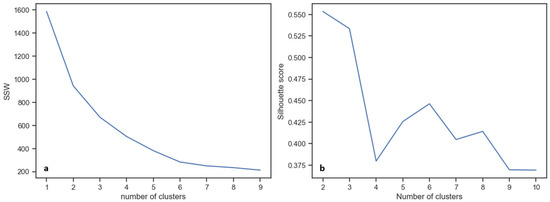
Figure 2.
(a) Elbow plot and (b) silhouette score for the optimum number of clusters selection for k-means clustering model.
Given the absence of mineralogical or facies data in the dataset, boxplots of key petrophysical parameters (GR, DTCO, TNPH, and RHOB) in relation to clustered lithofacies are shown in Figure 3. The low porosity and reduced GR readings of Facies 2 and 3 suggest carbonate formation. Field experience showed a higher frequency of limestone than dolomite, leading to the identification of Facies 2 as dolomite and Facies 3 as limestone. The differentiation of the other lithofacies was based on GR and DTCO log analyses. Higher GR readings in Facies 0 than in Facies 1 indicated shale, a conclusion supported by the increased travel time observed in the DTCO logs for shales. Similarly, Figure 4 presents a series of cross-plots comparing different petrophysical properties from a dataset, with each plot showing the relationship between two properties. The data points were color-coded based on lithofacies classification, indicating four distinct categories. Marginal histograms on the axes of each plot highlight the distribution of the individual properties.
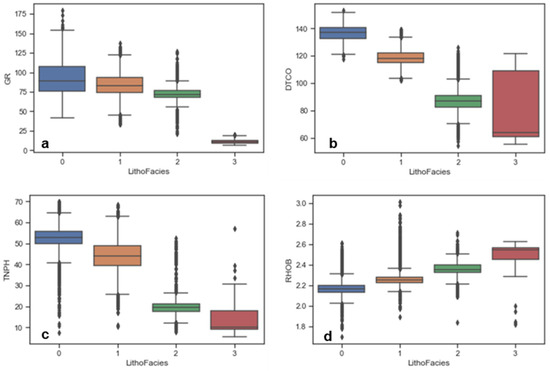
Figure 3.
Boxplots showing the distribution of petrophysical parameters—(a) Gamma ray (GR, Api), (b) Compressional wave velocity (DTCO), (c) Thermal neutron porosity (TNPH, %), and (d) Bulk density (RHOB)—across four clustered lithofacies categories.
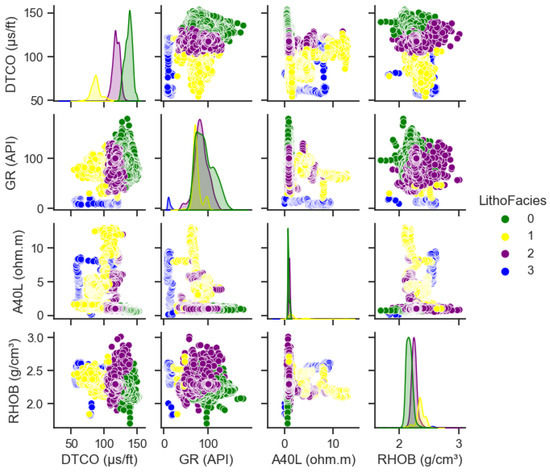
Figure 4.
Pair and density Plots of the clustered lithofacies from k-means clustering with respect to petrophysical parameters.
3.2.2. Hierarchical Clustering
The hierarchical clustering methodology is tested using four linkage criteria: single, complete, average, and Ward’s linkages. After analyzing the dendrogram structures, cluster cohesion, and separation, the Ward linkage method was selected. This method, notable for its emphasis on minimizing within-cluster variance, resulted in a clear dendrogram that suggested the existence of four distinct clusters, consistent with the k-means clustering results (Figure 5).
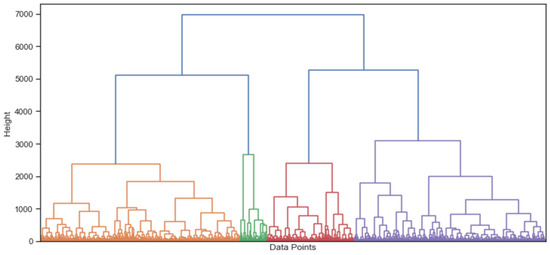
Figure 5.
Dendrogram using Ward’s linkage method to cluster lithofacies data. The figure illustrates the formation of four primary clusters, identified by distinct color coding, with the y-axis representing the hierarchical clustering distance.
3.2.3. Prediction of Clustered Lithofacies
To accurately predict the clusters that develop during drilling, the input parameters for the classification algorithms were selected based on their proximity to the drill bit. Given that the primary objective of this study is to predict the lithology at the bit during drilling, the data used in the model must be either at or adjacent to the bit. Of the LWD measurements, only the GR was placed 3 m away and was therefore included as an input parameter. Drilling parameters, such as ROP, STOR, and SRPM, were selected as input variables because the recording was affected by the bit. In addition, to include the effect of the force required to crush the rock independent of the hole size, we developed and used a new variable, BitContactStress (as defined in Equation (5)),
The applied SWOB in drilling varies due to changing BHA weight as the hole size increases or decreases. This affects the force applied to the bit, which in turn impacts the drilling performance. To maintain consistency across different hole sizes, we normalized the SWOB by the hole size, ensuring that the force per unit area at the bit-rock interface remains comparable.
Graphical representations such as boxplots and scatterplots were used for each input parameter to identify any outliers in the dataset. The analysis demonstrated that the maximum values of GR, ROP, and porosity should not exceed 200 API, 150 m/h, and 70%, respectively. For drilling parameters, BitContactStress, RPM, and STOR values should be greater than 0.1 kN/m2, 10 RPM, and 0.1 kNm, respectively. Figure 6 presents boxplots of all the input parameters used for clustering and classification. Once the outliers of the input parameters were removed, the next step was to scale them to ensure that they all had an equivalent range to enhance the convergence rate and effectiveness of the developed algorithms.
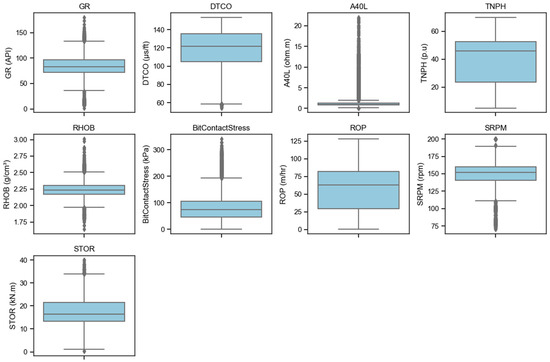
Figure 6.
Boxplots of input data for the study after removing outliers.
To optimize the prediction of clustered lithofacies, hyperparameter tuning for RF, SVM, MLP, and deep learning (DL) was performed using GridSearchCV accompanied by a five-fold cross-validation strategy. This approach divides the training dataset into five subsets, with four subsets used for training and one for validation in each cycle, aiming to mitigate overfitting and enhance model reliability.
In the comparative analysis of the five lithology classification techniques, the performance of each model was assessed by examining the confusion matrices for each of the four lithofacies clusters. The F1 score was computed for each cluster to gauge model effectiveness in achieving a favorable tradeoff between precision and recall—an important indicator of the accuracy of class-specific predictions.
3.3. Method 3: Manual Labeling with Classification Approach
The third methodology involved manually labeling lithology data from well logs to train classification algorithms, ensure precision, and leverage geological expertise. This approach, distinct from the conventional method and clustering-classification technique, solely uses ML models, KNN, RF, SVM, MLP, and DL, without clustering. In this method, the selected drilling parameters (ROP, BitContactStress, SRPM, STOR, and GR) were directly applied to the classification models. The results were evaluated using accuracy, F1 score, ROC curves, and depth-by-depth analysis with blind-well test data, thus offering a comprehensive comparison with other methods.
Following the detailed description of the methodology and input parameters for each model, Table 1 summarizes the optimal model parameters that achieved the highest accuracy for lithology prediction. These parameters were determined through rigorous hyperparameter tuning and validation processes. The table provides a comparative analysis of the most effective parameter settings for each algorithm employed across the three methods: Method 2.a (k-means Clustering), Method 2.b (Hierarchical Clustering), and Method 3 (Manual labelling with Classification Approach).

Table 1.
Summary of hyperparameters demonstrating best performance across ML models.
4. Results
4.1. Method 1: Bulk Density vs. Neutron Porosity Cross-Plot
As presented in Section 3.1, the predicted bulk density and neutron porosity at the bit was determined from ML adapted from Ref. [25]. In total, five independent parameters—ROP, GR, SWOB, STOR, and RPM—were used to predict both bulk density and neutron porosity. Moreover, five regression methods were developed and compared: Multilinear Regression, KNN, RF, SVM Regression and ANN. The KNN model exhibited the best prediction accuracy for the validation dataset [25]. Therefore, the predicted data for neutron porosity and bulk density from the KNN model were used to plot the neutron porosity and bulk density cross-plot in Figure 7, which shows that most of the data were detected as shale, followed by limestone. The results indicated limestone in the 12 ¼” and reservoir sections—not matching the lithology log of the blind–test well, indicating that the accuracy of this method when applied to the blind–test well was approximately 58%.
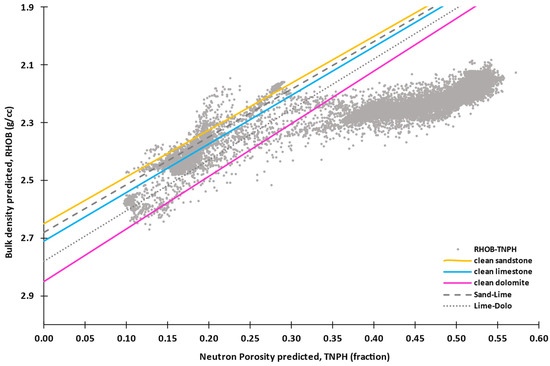
Figure 7.
Predicted bulk density and predicted neutron porosity cross-plot for Well #B indicating lithologies.
4.2. Method 2: ML Using Clustering and Classification
Section 3.2 describes each ML model used to predict lithofacies based on clusters formed by the k-means and hierarchical clustering algorithms. The accuracy and F1 score for each model in predicting lithofacies from these clusters were calculated and presented in Table 2 and Table 3. The F1 scores for the k-means clustering approach showed high performance for shale, sandstone, and limestone lithofacies, with scores of 0.94, 0.83, and 0.85, respectively, whereas the F1 score for dolomite was not available because of its minimal representation after outlier removal. The hierarchical clustering approach revealed F1 scores of 0.95 for shale, 0.89 for sandstone, 0.98 for limestone, and an improved score of 0.89 for dolomite, attributed to the algorithm’s clustering methodology. Overall accuracies of 0.90 and 0.98 were observed for the k-means and hierarchical clustering methods, respectively. Given the high and comparable performance levels in these metrics, especially for shale, sandstone, and limestone, the comparative analysis has shifted toward evaluating the model’s accuracy with the blind–test well.

Table 2.
Accuracy of the classification models in predicting the lithofacies clustered by k-means algorithm and F1 scores.

Table 3.
Accuracy of the classification models in predicting the lithofacies clustered by hierarchical clustering algorithm and F1 scores.
Performance of the Classification Algorithms with the Blind–Test Well
A blind–test well dataset was not used during the training or testing phases of model development to test the accuracy of the model for lithology prediction. The lithology was established at the end of the well report and covered a depth range of 717–2920 m measured depth (MD), including 13,956 data points. All parameters used for training the model of the blind–test well are provided in the Appendix A. By applying the developed models to the blind–test well, we aimed to understand whether the clusters formed from the k-means and hierarchical clustering methods based on selected drilling parameters can accurately predict the lithology. Table 4 shows the accuracy of each classification algorithm developed in Method 2 when applied to the blind–test well data.

Table 4.
Accuracy of the classification algorithms developed to predict clustered lithofacies from k-means and hierarchical clustering on blind–test well data (13,956 depth points).
Comparing the accuracy of the predictions for the blind–test well in Table 4, the RF model applied to the k-means clustered data emerged as the most effective, achieving an accuracy of 66%. Although the SVM model exhibited the best results with hierarchical clustering, its overall accuracy was lower than that of the k-means algorithm. Figure 8 shows a depth-by-depth comparison of the classification algorithms that predict clusters using the k-means algorithm. Table 4 shows that k-means clustering outperformed hierarchical clustering across all models.
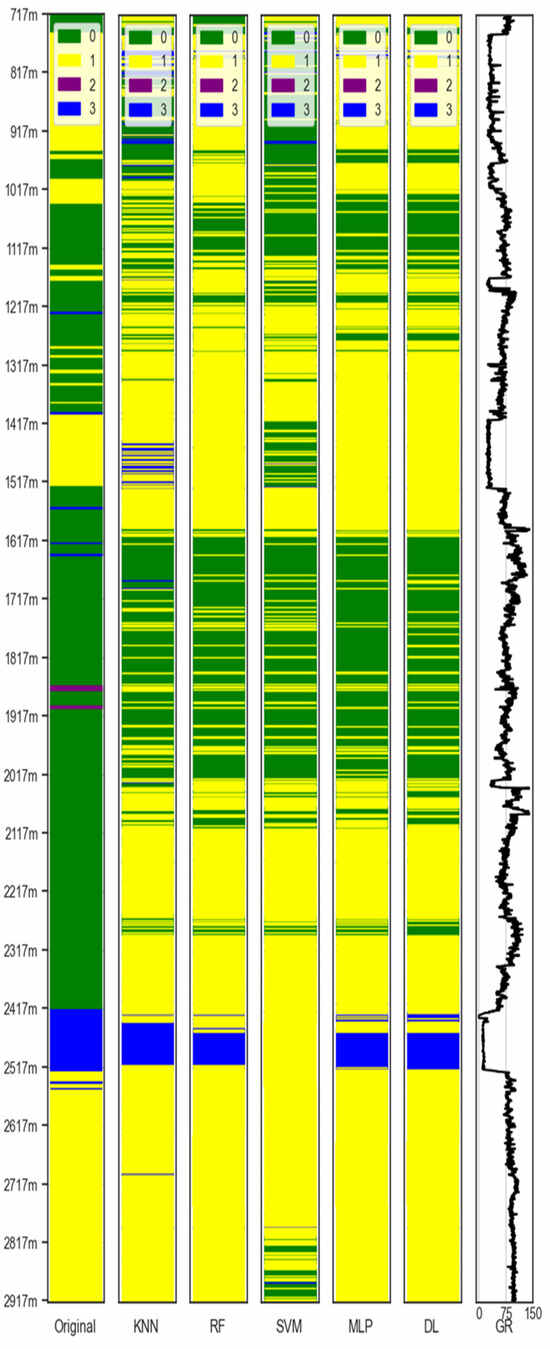
Figure 8.
Lithofacies classification using k-means clustering followed by ML models and the GR of the blind–test well. The leftmost column shows the original lithofacies from the blind–test well, while the other columns represent lithofacies prediction classifications by KNN, RF, SVM, ANN, and DL models.
4.3. Method 3: Manual Labelling with Classification Approach
Table 5 provides a comparative analysis of the classification models for predicting the lithology using the classification-only approach, detailing the accuracy and F1 scores of each model. Similar to the previous methods, the models evaluated included KNN, RF, SVM, MLP, and DL. For shale (0) and sandstone (1), the models demonstrated high and consistent performance, with average F1 scores of 0.93 and 0.95, respectively, and low standard deviation, indicating consistent results across the models. However, the classification of dolomite (2) was markedly less effective, with a much lower average F1 score (0.10 and higher standard deviation (0.060). Limestone (3) classification was more effective, with an average F1 score of 0.89 and a standard deviation of 0.007. Overall, the accuracy of the models was robust, averaging 0.94 with a standard deviation of 0.004, highlighting consistent performance across different lithofacies classifications despite the challenges posed by data imbalance in specific categories, such as dolomite. The ROC curve and AUC information for each model are shown in Figure 9. Furthermore, a depth-by-depth comparison of the predicted lithologies obtained from the classification algorithms developed in Method 3 with the blind–test well data is illustrated in Figure 10.

Table 5.
Accuracy of the classification models in predicting the lithofacies from manual labelling with classification approach and F1 scores.
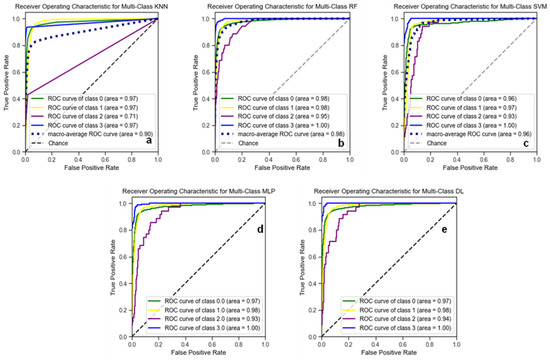
Figure 9.
ROC curves for multi-class classification models from (a) KNN, (b) RF, (c) SVM, (d) MLP, and (e) DL. The curves demonstrate the trade-off between sensitivity and specificity for each lithological class, with the AUC indicating model performance, where a score of 1 represents perfect classification.
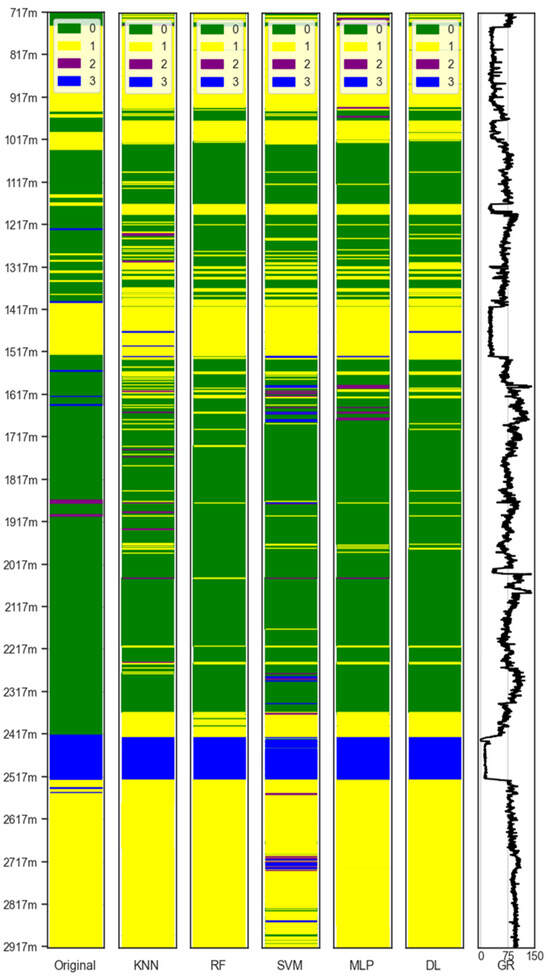
Figure 10.
Lithofacies classification from manually labeled data and GR of the blind–test well (graph in the last column). The leftmost column shows the original lithofacies from the blind–test well, and the other columns represent classifications by KNN, RF, SVM, ANN, DL, and GR models lithofacies predictions.
Table 6 presents the accuracies of various classification algorithms applied to the blind–test well data, comprising 13,956 depth points. Among the models, the RF algorithm achieved the highest accuracy of 85.4%, closely followed by MLP at 85%. DL also performed well, with an accuracy of 84.5%. The KNN algorithm exhibited a moderate accuracy of 80.7%, whereas SVM had the lowest accuracy at 75.8%.

Table 6.
Accuracy of the classification algorithms developed to predict manually labeled lithofacies on blind–test well data (13,956 depth points).
5. Discussion
The bulk density vs. neutron porosity cross-plot results indicate that the petrophysical approach exhibits limited accuracy, underscoring the necessity of leveraging ML algorithms to improve lithology prediction. Notably, the accuracy and F1 scores of the classification algorithms developed using post-k-means and hierarchical clustering exhibited similar results. Consequently, a comparative analysis (Table 4) was conducted between the two cluster models to verify their accuracy with the blind–test well. A significant outcome of this analysis was the improvement in prediction accuracy for lithology determination in the blind–test well, which increased to 66% when the RF classification algorithm based on k-means clustering was used. This improvement is evident in Figure 8, which shows the model’s proficiency in identifying most lithologies; however, the model does not detect some interbedded layers. In addition, the classification models based on k-means clustering failed to detect dolomite layers in the blind–test well, attributed to the imbalance of the dataset, where out of 13,850 data points, only 90 represented dolomite, corresponding to a mere 3 m. The limited availability of data, particularly for dolomite, presents a significant challenge in the training and testing phases of ML models. This data deficiency undermines the ability of the model to accurately recognize and classify dolomite layers, specifically for k-means clustering and classification-only methods. Hierarchical clustering—less dependent on predefined parameters and more robust to outlier data points—effectively recognizes dolomite, as evidenced by an F1 score of 0.89. Despite this capability, the overall accuracy achieved with hierarchical clustering was lower than those of the k-means and classification-only methods.
In previous studies as shown in Table A1, clustering and classification approaches performed better in predicting lithology [16,28]. This study offers a novel comparative analysis of three distinct methodologies for lithology prediction, a topic not extensively covered in the previous published literature as shown in Table A1. While clustering and classification methods are frequently regarded as the most effective, our research reveals that they do not consistently deliver the best results. However, in this study, the classification-only method was superior to the other methods. This discrepancy with the existing literature can be attributed to potential errors in cluster formation and subsequent predictions. Therefore, manually labeling the lithology data for the training dataset reduced errors from the clustering phase and enhanced the model’s accuracy. Since field geologists had already interpreted the lithology by examining drill cuttings, we ensured that the developed model was trained with accurate data from the lithology log. Consequently, the input parameters did not skew the model’s output related to lithology. The developed model effectively established a relationship between the input parameters and the lithology data. Figure 9, displaying the ROC curves, shows that the developed classification models yielded robust cluster predictions, as evidenced by AUC values close to 1. Furthermore, Table 6 presents the accuracy results of each classification algorithm when applied to the blind–test well, demonstrating a significant improvement in model accuracy compared to the clustering and classification methods. Notably, the RF algorithm achieves an accuracy of 85.4%. This effectiveness is further illustrated in Figure 10, which shows the successful detection of thin sandstone and shale layers as well as the precise identification of a long carbonate section beyond 2417 m MD.
The analysis of the GR log revealed both the strengths and weaknesses of employing ML models in comparison with lithological interpretations made by geologists in the field. Among the limitations observed, the best ML model, i.e., the RF algorithm in Method 3, inaccurately characterized the lithology at 717 m MD, predicting the presence of sandstone and thin shale instead of the reported shale. A similar discrepancy was noted at an MD of 1217 m, where the models erroneously indicated a thin layer of sandstone despite a consistent GR trend indicative of shale. Furthermore, at 2367 m, a transition is observed from shale to marl, a carbonate-rich mudstone. However, the ML model inaccurately predicted the presence of sandstone, owing to a slight reduction in GR readings attributable to the carbonate content within the shale. Although these inaccuracies reveal model limitations, the model strengths, particularly in real-time interpretation, are noteworthy. For example, between 1160 and 1180 m MD, the developed ML model successfully identified a region of sandstone, a conclusion supported by the GR readings. In contrast, field interpretation identified only a 5-m segment of this interval as sandstone, largely because cuttings suggested an 80% shale composition within this depth range. Furthermore, at depths of 1560, 1621, 1640, 2542, and 2555 m MD, field interpretation of the lithology indicated carbonate, despite the presence of high GR readings. In contrast, the ML model accurately predicted the correct lithology at these depths, benefiting from its ability to interpret changes directly and promptly in GR readings. In field-based observations, geologists sometimes experience delays in recognizing and analyzing such changes, unlike the immediate response of the ML model.
Although the developed ML models provided promising results, several limitations were observed during the study. First, the bulk density and neutron porosity cross-plot was implemented for clustering purposes. Since neutron-porosity is not the true porosity and is heavily impacted by the presence of clay, it tends to overestimate porosity. However, as this value was not used for any other calculations and solely served the purpose of lithology detection, this limitation was considered acceptable in this study. Future quantitative analysis will likely provide better results with the true porosity data. Second, as previously mentioned there must be sufficient data points representing that lithology. Finally, model generalizability is another important consideration. As with any machine learning model, the developed model was trained on data collected from a specific geographical location. This means the model’s predictions are localized and accuracy of the models will be compromised in a different geographical location. Therefore, it cannot be directly applied to other geographical regions without retraining the model using local data.
Overall, the results indicate that the third method, involving manual labeling of lithology data and classification using drilling parameters at the bit, offers the best solution for real-time lithology prediction in the studied offshore well in the North Sea. The studies mentioned in the Introduction predominantly focused on clustering and classification for lithology prediction, which can be prone to errors owing to inaccuracies in cluster formation. The results of this study highlight the advantages of manual labeling and classification in lithology prediction. This approach avoids the potential inaccuracies of clustering because it precisely identifies lithology with specific parameters. Notably, model robustness was validated by assessing the accuracy at each depth increment rather than over small intervals. This analysis, uncommon in literature, highlights the reliability of this approach. Additionally, using real-time petrophysical and drilling parameters directly at the bit allows for a more dynamic and immediate response to changes in the lithology, thereby enhancing the practical applicability of the developed model in real-time drilling. Unlike other models that may experience delays due to sensor offset, the developed model ensures immediate and accurate adaptation to changing lithological conditions. While the methodology can be applied, retraining the models using data from the new field is crucial.
6. Conclusions
This study evaluates three methods for real-time lithology prediction at the bit using drilling and petrophysical parameters for offshore drilling operations. The comparative analysis was performed to quantify the accuracy of all three models and to select the best prediction. The first method involves a petrophysical approach, relying on predicted bulk density and predicted neutron porosity at the bit. The second method integrates both unsupervised and supervised machine learning techniques for prediction. The third method uses classification algorithms on manually labeled lithology data from mud log reports. Prediction results from the blind–test well showed that:
- Random Forest classification applied to manually labeled lithofacies outperformed predictions from bulk density vs. neutron porosity cross-plots, as well as clustering and classification predictions.
- The best model showed improved accuracy in detecting interbedded geological layers that are challenging to identify during real-time drilling.
- The machine learning approach reduces the need for time-consuming procedures like bottoms-up circulation to evaluate drilling cuttings.
- The use of gamma ray well logs as input data allows the model to provide immediate adaptation to shifts in lithological changes, overcoming the typical delays associated with sensor offset.
- It should be noted that while the presented method is universal, it must be trained with field-specific data.
Author Contributions
Methodology, Software, T.B.; Formal analysis, writing—original draft, Visualization, Validation, T.B. and A.S.; Conceptualization, Supervision, E.H., T.G.K., M.W. and R.N.; Methodology, Funding acquisition, writing, review and editing, Visualization, R.N. All authors have read and agreed to the published version of the manuscript.
Funding
This research received funding from AkerBP ASA under award number FY22ORA412. Financial support for publication was provided by the University of Oklahoma’s Office of the Vice President for Research and Partnerships and the Office of the Provost.
Data Availability Statement
The data will be made available on specific user request.
Acknowledgments
The authors would like to thank AkerBP ASA and Sekal AS for their technical and financial support for this project. We also extend our gratitude to Son Dang for his valuable technical assistance with the petrophysical analysis.
Conflicts of Interest
The authors declare that they have no competing financial interests or personal relationships that may have influenced the work reported in this study.
Abbreviation
| A40L | Attenuation resistivity 40-in at 400 kHz (ohm. m) |
| ANN | Artificial neural network |
| AUC | Area under curve |
| BHA | Bottom hole assembly |
| CV | Cross-validation |
| DL | Deep Learning |
| DT | Decision Tree |
| DTCO | Compressional wave velocity (microsec/ft) |
| GR | Gamma ray (API) |
| HS | Hole size (in) |
| KNN | K-nearest neighbors |
| LWD | Logging-while-drilling |
| MD | Measured depth (m) |
| ML | Machine learning (m) |
| MLP | Multi-layer perceptron |
| MWD | Measurement while drilling |
| RF | Random Forest |
| RHOB | Bulk Density (g/cc) |
| ROC | Receiver operating characteristic |
| ROP | Rate of penetration (m/hr) |
| SRPM | Surface revolutions per minute |
| SSW | Sum of squares within |
| STOR | Surface torque (kN.m) |
| SVM | Support vector machine |
| SWOB | Surface weight on bit (kN) |
| TNPH | Thermal neutron porosity log (p.u) |
Appendix A

Table A1.
Summary of research papers employing machine learning to determine lithology using drilling or petrophysical or both data as input parameters.
Table A1.
Summary of research papers employing machine learning to determine lithology using drilling or petrophysical or both data as input parameters.
| Authors | Objective | Data | Methodology | Summary |
|---|---|---|---|---|
| Zhou et al. (2011) [6] | Develop a data-driven model for rock property estimation using drilling data. | MWD data (penetration rate, pulldown pressure, rotation pressure) from a Rio Tinto mining site in the Pilbara region, Western Australia. | Unsupervised approach with Optimized Adjusted Penetration Rate (OAPR) and Gaussian Process regression. | Estimates rock types like shale and ore using MWD data with OAPR in an unsupervised manner. |
| Sebtosheikh and Salehi (2015) [7] | Predict lithology in a carbonate reservoir using SVM and seismic attributes. | Data from five wells in a hydrocarbon field in Iran. | SVM classification with seismic attributes and petrophysical logs. | Demonstrates SVM’s effectiveness in lithology prediction with seismic attributes. |
| Al-Khdheeawi et al. (2019) [8] | Develop ANN model for 10 lithologies using drilling data. | Drilling data from three drilled sections of two conventional vertical oil wells. | ANN trained with drilling parameters like ROP and mud flow rate. | ANN predicts lithologies like claystone and sandstone with 0.94 correlation. |
| Arnø et al. (2021) [9] | Real-time lithology classification with deep learning. | Data from five wells operated by Equinor, including surface drilling data and LWD measurements. | Cascade of MLPs estimating LWD sensor readings. | Achieves 0.66 accuracy in real-time lithology classification. |
| Mahmoud et al. (2021) [10] | Real-time prediction of lithology and tops using ML. | Data from two gas wells in the Middle East. | ANN, ANFIS, and FNN models trained on drilling parameters. | ANN achieved >98.1% accuracy in predicting lithology. |
| Zhekenov et al. (2021) [11] | Lithology-on-bit prediction using hybrid modeling. | Drilling data from West-Siberian oilfield. | Combines analytical parameters with RF and gradient boosting. | Hybrid model predicts lithology with up to 85% accuracy. |
| Agrawal et al. (2022) [12] | Real-time litho-facies prediction using ANN and optimization. | Data from four wells in Eagleford, USA. | ANN optimized with algorithms like ADAM and SGD. | ANN achieved 86% accuracy for complex litho-facies prediction. |
| Yao et al. (2022) [13] | Real-time lithology identification using ML models. | Data from 16 wells. | RF and XGBoost for lithology identification with feature selection. | XGBoost outperformed RF with 79.21% accuracy. |
| Xie et al. (2018) [14] | Compare five ML methods for lithology identification. | Data from Daniudui and Hangjinqi gas fields, China. | Naïve Bayes, SVM, ANN, Random Forest, and GTB with cross-validation. | GTB and RF show high accuracy and robustness. |
| Nawal et al. (2022) [15] | Develop LithoBot AutoML framework for lithofacies. | Data from 118 wells in the Norwegian Sea. | AutoML framework using random forest classifiers and thresholding. | LithoBot achieves 94.5% accuracy with a user-friendly interface. |
| Desouky et al. (2023) [16] | Use RF and XGB for lithology prediction. | Data from Athabasca Oil Sands, 20 wells. | Ensemble techniques like RF and XGB with grid search. | XGB achieved 94% accuracy, outperforming RF. |
| Zhang et al. (2018) [17] | ML-based workflow for lithology and fluid content prediction. | Data from offshore West Africa, seven wells. | Random forest algorithm with seismic attributes and textural analysis. | RF achieved nearly 85% accuracy in predicting lithology. |
| Mohamed et al. (2019) [18] | Compare ML algorithms for lithology classification. | Data from eight wells in Anadarko Basin, Kansas. | SVM, KNN, RF, MLP, and K-means with hyperparameter tuning. | SVM achieved best lithology classification with 66% F1-score. |
| Sun et al. (2019) [19] | Optimize lithology identification models while drilling. | Data from Yan’an Gas Field, China. | OVR SVMs, OVO SVMs, and RF with grid search. | RF achieved > 90% accuracy, suitable for lithology identification. |
| Sun et al. (2020) [20] | Data-driven lithology identification using ensemble learning. | Data from Daniudi and Hangjinqi gas fields, China. | XGBoost with Bayesian Optimization, compared with GTB-DE. | XGBoost-BO achieved AUC values of 0.968 and 0.987. |
| Sun et al. (2021) [21] | Predict formation lithology at the bit using LWD data. | Data from Changqing oilfield, Ordos Basin, China. | SVM, RF, NN, and XGBoost with grid search. | XGBoost achieved > 90% accuracy, improving drilling accuracy. |
| Ehsan and Gu (2020) [22] | Integrated approach for lithofacies and clay mineralogy identification. | Data from Talhar Shale, Lower Indus Basin, Pakistan. | Neuro-Fuzzy networks, cross plots, and statistical analyses. | Successfully identified lithofacies and clay mineralogy, aiding hydrocarbon characterization. |
| Popescu et al. (2021) [23] | Automated lithology prediction using ML algorithms. | Data from >100 wells, Alaska and Australia. | SVM, tree-based methods, KNN, and DNN with feature engineering. | ML achieved > 70% lithological match, reducing interpretation time. |
| Kumar et al. (2022) [24] | Apply ML techniques for interpreting banded coal seams. | Data from four boreholes in Talcher coalfield, India. | SVM, DT, RF, MLP, and XGBoost with performance metrics. | XGBoost achieved 90.67% accuracy, effective for coal exploration. |
| Sharma et al. (2023) [25] | Predict porosity and bulk density at the bit using ML. | Data from four wells on the Norwegian continental shelf. | MLR, KNN, RF, SVM, and ANN for porosity and bulk density prediction. | KNN was most effective, with R2 values of 86% and 74%. |
| Sharma et al. (2023) [26] | Predict Vp at the bit using ML algorithms. | Data from a field on the Norwegian continental shelf. | MLR, KNN, RF, and SVM regression models. | RF was most efficient with R2 value of 98%, enhancing real-time drilling. |
| Pandey et al. (2020) [27] | Use data mining for reservoir characterization during geosteering. | Data from a Norwegian North Sea field. | PCA for feature extraction, followed by hierarchical clustering. | Successfully identified heterogeneous formations, aiding well placement. |
| Gupta et al. (2020) [28] | Develop ML workflow for real-time lithology prediction. | Data from Volve Field, Norwegian shelf, 12 wells. | Supervised algorithms like RF, DT, and CNN with PCA. | Achieved 80% accuracy in identifying lithology clusters. |
| Moazzeni and Haffar (2015) [29] | Use ANN for real-time lithology prediction to optimize drilling. | Data from 12 wells in South Pars gas field, Iran. | BP neural network model with TANSIG and PURELIN functions. | ANN predicted lithology with ~90% accuracy, aiding drilling optimization. |
| Aniyom et al. (2022) [30] | Develop voting classifier for lithology identification. | Data from FORGE well 58-32, Utah. | Ensemble of SVM, Logistic Regression, RF, KNN, and MLP. | Voting classifier improved prediction by 1.50%, identifying lithologies. |
| Chen (2020) [31] | Compare SVM, GRNN, and Elman for lithology identification. | Data from three wells. | SVM, GRNN, and Elman neural network comparison. | SVM achieved > 80% accuracy in small regions and 65–75% overall. |
References
- Elmgerbi, A.; Chuykov, E.; Thonhauser, G.; Nascimento, A. Machine Learning Techniques Application for Real-Time Drilling Hydraulic Optimization. In Proceedings of the International Petroleum Technology Conference, IPTC 2022, Riyadh, Saudi Arabia, 21–23 February 2022. [Google Scholar]
- Burak, T.; Akin, S. Estimation of Downhole Inclination in Directionally Drilled Geothermal Wells. In Proceedings of the World Geothermal Congress 2020+1, Reykjavik, Iceland, 24–27 October 2021. [Google Scholar]
- Sharma, A.; Al Dushaishi, M.; Nygaard, R. Evaluating PDC Bit-Rock Interaction Models to Investigate Torsional Vibrations in Geothermal Drilling. Geothermics 2024, 20, 103060. [Google Scholar] [CrossRef]
- Sharma, A.; Al Dushaishi, M.; Nygaard, R. Fixed Bit Rotary Drilling Failure Criteria Effect on Drilling Vibration. In Proceedings of the 55th U.S. Rock Mechanics/Geomechanics Symposium, Online, 18–25 June 2021. [Google Scholar]
- Burak, T. Application of Artificial Neural Networks to Predict the Downhole Inclination in Directionally Drilled Geothermal Wells. Master’s Thesis, Middle East Technical University, Ankara, Türkiye, 2018. [Google Scholar]
- Zhou, H.; Hatherly, P.; Ramos, F.; Nettleton, E. An Adaptive Data Driven Model for Characterizing Rock Properties from Drilling Data. In Proceedings of the IEEE International Conference on Robotics and Automation, Shanghai, China, 9–13 May 2011; pp. 1909–1915. [Google Scholar] [CrossRef]
- Sebtosheikh, M.A.; Salehi, A. Lithology Prediction by Support Vector Classifiers Using Inverted Seismic Attributes Data and Petrophysical Logs as a New Approach and Investigation of Training Data Set Size Effect on Its Performance in a Heterogeneous Carbonate Reservoir. J. Pet. Sci. Eng. 2015, 134, 143–149. [Google Scholar] [CrossRef]
- Al-Khdheeawi, E.A.; Mahdi, D.S.; Feng, R. Lithology Determination from Drilling Data Using Artificial Neural Network. In Proceedings of the 53rd U.S. Rock Mechanics/Geomechanics Symposium 2019, New York, NY, USA, 23–26 June 2019. [Google Scholar]
- Arnø, M.; Godhavn, J.M.; Aamo, O.M. Real-Time Classification of Drilled Lithology from Drilling Data Using Deep Learning with Online Calibration. In Proceedings of the SPE/IADC Drilling Conference, Proceedings 2021, Virtual, 8–12 March 2021. [Google Scholar] [CrossRef]
- Mahmoud, A.A.; Elkatatny, S.; Al-AbdulJabbar, A. Application of Machine Learning Models for Real-Time Prediction of the Formation Lithology and Tops from the Drilling Parameters. J. Pet. Sci. Eng. 2021, 203, 108574. [Google Scholar] [CrossRef]
- Zhekenov, T.; Nechaev, A.; Chettykbayeva, K.; Zinovyev, A.; Sardarov, G.; Tatur, O.; Petrakov, Y.; Sobolev, A. Application of Machine Learning for Lithology-on-Bit Prediction Using Drilling Data in Real-Time. In Proceedings of the Society of Petroleum Engineers—SPE Russian Petroleum Technology Conference 2021, RPTC 2021, Virtual, 12–15 October 2021. [Google Scholar] [CrossRef]
- Agrawal, R.; Malik, A.; Samuel, R.; Saxena, A. Real-Time Prediction of Litho-Facies From Drilling Data Using an Artificial Neural Network: A Comparative Field Data Study with Optimizing Algorithms. J. Energy Resour. Technol. Trans. ASME 2022, 144, 043003. [Google Scholar] [CrossRef]
- Yao, X.; Song, X.; Han, L.; Wang, Z.; Zhang, R.; Liu, W.; Fu, J.; Zhu, S.; Zhu, Z. A Novel Method for Real-Time Identification of Formation Lithology Based on Machine Learning. In Proceedings of the 56th U.S. Rock Mechanics/Geomechanics Symposium 2022, Santa Fe, NM, USA, 26–29 June 2022. [Google Scholar] [CrossRef]
- Xie, Y.; Zhu, C.; Zhou, W.; Li, Z.; Liu, X.; Tu, M. Evaluation of Machine Learning Methods for Formation Lithology Identification: A Comparison of Tuning Processes and Model Performances. J. Pet. Sci. Eng. 2018, 160, 182–193. [Google Scholar] [CrossRef]
- Zhang, Z.; Halpert, A.D.; Bandura, L.; Coumont, A.D. Machine Learning Based Technique for Lithology and Fluid Content Prediction—Case Study from Offshore West Africa. In Proceedings of the SEG Technical Program Expanded Abstracts 2018, Anaheim, CA, USA, 14–19 October 2018; pp. 2271–2276. [Google Scholar] [CrossRef]
- Mohamed, I.M.; Mohamed, S.; Mazher, I.; Chester, P. Formation Lithology Classification: Insights into Machine Learning Methods. In Proceedings of the Proceedings—SPE Annual Technical Conference and Exhibition 2019, Calgary, AB, Canada, 30 September–2 October 2019. [Google Scholar] [CrossRef]
- Sun, J.; Li, Q.; Chen, M.; Ren, L.; Huang, G.; Li, C.; Zhang, Z. Optimization of Models for a Rapid Identification of Lithology While Drilling—A Win-Win Strategy Based on Machine Learning. J. Pet. Sci. Eng. 2019, 176, 321–341. [Google Scholar] [CrossRef]
- Sun, Z.; Jiang, B.; Li, X.; Li, J.; Xiao, K. A Data-Driven Approach for Lithology Identification Based on Parameter-Optimized Ensemble Learning. Energies 2020, 13, 3903. [Google Scholar] [CrossRef]
- Sun, J.; Chen, M.; Li, Q.; Ren, L.; Dou, M.; Zhang, J. A New Method for Predicting Formation Lithology While Drilling at Horizontal Well Bit. J. Pet. Sci. Eng. 2021, 196, 107955. [Google Scholar] [CrossRef]
- Ehsan, M.; Gu, H. An Integrated Approach for the Identification of Lithofacies and Clay Mineralogy through Neuro-Fuzzy, Cross Plot, and Statistical Analyses, from Well Log Data. J. Earth Syst. Sci. 2020, 129, 101. [Google Scholar] [CrossRef]
- Popescu, M.; Head, R.; Ferriday, T.; Evans, K.; Montero, J.; Zhang, J.; Jones, G.; Kaeng, G.C. Using Supervised Machine Learning Algorithms for Automated Lithology Prediction from Wireline Log Data. In Proceedings of the Society of Petroleum Engineers—SPE Eastern Europe Subsurface Conference, EESC 2021, Kyiv, Ukraine, 23–24 November 2021; pp. 2019–2023. [Google Scholar] [CrossRef]
- Kumar, T.; Seelam, N.K.; Rao, G.S. Lithology Prediction from Well Log Data Using Machine Learning Techniques: A Case Study from Talcher Coalfield, Eastern India. J. Appl. Geophys. 2022, 199, 104605. [Google Scholar] [CrossRef]
- Nawal, M.; Kumar, S.; Shekar, B. LithoBot: An AutoML Approach to Identify Lithofacies. In Proceedings of the SEG Technical Program Expanded Abstracts 2022, Houston, TX, USA, 28 August–1 September 2022; pp. 1885–1889. [Google Scholar] [CrossRef]
- Desouky, M.; Alqubalee, A.; Gowida, A. Decision Tree Ensembles for Automatic Identification of Lithology. In Proceedings of the Society of Petroleum Engineers—SPE Symposium: Leveraging Artificial Intelligence to Shape the Future of the Energy Industry, AIS 2023, Al Khobar, Saudi Arabia, 17 January 2023; pp. 1–12. [Google Scholar] [CrossRef]
- Sharma, A.; Burak, T.; Nygaard, R.; Hoel, E.; Kristiansen, T.; Hellvik, S.; Welmer, M. Projecting Petrophysical Logs at the Bit through Multi-Well Data Analysis with Machine Learning. In Proceedings of the SPE Offshore Europe Conference & Exhibition 2023, Aberdeen, Scotland, 5–8 September 2023. [Google Scholar] [CrossRef]
- Sharma, A.; Burak, T.; Nygaard, R.; Hellvik, S.; Hoel, E.; Welmer, M. Projection of Logging While Drilling Data at the Bit by Implementing Supervised Machine Learning Algorithm. In Proceedings of the SPE Oklahoma City Oil and Gas Symposium, Oklahoma, OK, USA, 17–19 April 2023. [Google Scholar] [CrossRef]
- Pandey, A.; Hoel, E.; Hellvik, S.; Al Dushaishi, M.F.; Nygaard, R. Data Mining Well Logs for Optimum Well Placement. In Proceedings of the International Conference on Offshore Mechanics and Arctic Engineering—OMAE 2020, Virtual, 3–7 August 2020; Volume 11, pp. 1–7. [Google Scholar] [CrossRef]
- Gupta, I.; Tran, N.; Devegowda, D.; Jayaram, V.; Rai, C.; Sondergeld, C.; Karami, H. Looking Ahead of the Bit Using Surface Drilling and Petrophysical Data: Machine-Learning-Based Real-Time Geosteering in Volve Field. SPE J. 2020, 25, 990–1006. [Google Scholar] [CrossRef]
- Mohammad Ali, A.M. Artificial Intelligence for Lithology Identification through Real-Time Drilling Data. J. Earth. Sci. Clim. Chang. 2015, 6, 3–6. [Google Scholar] [CrossRef]
- Aniyom, E.; Chikwe, A.; Odo, J. Hybridization of Optimized Supervised Machine Learning Algorithms for Effective Lithology. In Proceedings of the Society of Petroleum Engineers—SPE Nigeria Annual International Conference and Exhibition, NAIC 2022, Victoria Island, Lagos, Nigeria, 1–3 August 2022. [Google Scholar] [CrossRef]
- Gang, C. Study on Real-Time Lithology Identification Method of Logging-While-Drilling. IOP Conf. Ser. Earth. Environ. Sci. 2020, 546, 052007. [Google Scholar] [CrossRef]
Disclaimer/Publisher’s Note: The statements, opinions and data contained in all publications are solely those of the individual author(s) and contributor(s) and not of MDPI and/or the editor(s). MDPI and/or the editor(s) disclaim responsibility for any injury to people or property resulting from any ideas, methods, instructions or products referred to in the content. |
© 2024 by the authors. Licensee MDPI, Basel, Switzerland. This article is an open access article distributed under the terms and conditions of the Creative Commons Attribution (CC BY) license (https://creativecommons.org/licenses/by/4.0/).