Abstract
Magnetic fabric, paleomagnetic, and petrophysical studies were conducted on rocks in the Tafresh area of the central Urumieh-Dokhtar magmatic arc in Iran. The samples included Late Triassic dark gray sandstone, a mafic dyke, diorites, and a felsic dyke in the Zaghar region. Hydrothermal alteration in the Spid intrusion was investigated to understand the effects of alteration on magnetic fabric patterns. The AMS measurements support the theory that the Nayband Formation was constructed under a crustal extension regime. Magnetic susceptibility anisotropy in a microdioritic dyke indicates compression from the NNE-SSW, likely due to tectonic activity. AMS results from diorites in Zaghar suggest intrusions were emplaced in extensional spaces between the Tafresh and Chaghar thrust faults. The Spid intrusion’s magnetite is the primary carrier of magnetic susceptibility, but hydrothermal alteration has partly converted it into hematite, resulting in lower susceptibility and higher porosity in altered diorites. This process leads to a bimodal distribution of magnetic lineation trends. The Spid and Zaghar massifs underwent a northward tilt of about 30 degrees around an east-west axis following the Early Miocene. Post-Eocene rotations in the area are typically within ±20 degrees. This study demonstrates how magnetic properties can provide new insights into the evolution of tectono-magmatic processes and structural controls within a magmatic arc.
1. Introduction
Anisotropy of magnetic susceptibility (AMS) allows one to quantify the precise preferred orientation of magnetic materials [1]. It is regarded as the best tool compared to other traditional fabric measurements for evidencing concealed fabric in poorly oriented rocks, such as magmatic rocks [2]. AMS has been used in particular to characterize the primary magmatic flows and/or the location of preferential pathways for the magma ascent of plutonic, volcanic, and subvolcanic rocks, e.g., in [3,4]. Many publications have widely demonstrated its usefulness in all types of rocks (granites, high metamorphic rocks, dykes, and sedimentary sequences, e.g., [1,5,6,7,8]).
In structural geology and tectonics, the magnetic fabrics of igneous rocks are useful to analyze the syn-emplacement deformation of rocks, or the post-emplacement solid-state ductile structures formed during orogenesis, e.g., in [2,9,10]. In numerous classically considered post-tectonic granites, AMS has revealed unexpected internal structures favoring their interpretation as syn-tectonic, e.g., in [2,11]. The syn-magmatic strain that produces AMS fabrics has been proposed to result from tectonic deformation, magmatic emplacement, or a combination of these two processes. Therefore, AMS is used to determine tectonic fabrics for obtaining temporal constraints on past tectonic regimes, e.g., in [12,13,14]. In [12], the anisotropy of magnetic susceptibility (AMS) axes was compared with tectonic deformation axes for various worldwide plutons in both compressional and extensional regimes. In [13], TIMA (TESCAN Integrated Mineral Analyser) and AMS data were integrated in the Ernest Henry deposit and provided a tectono-metasomatic history and structural controls. The authors also related rock fabric to alteration style and introduced the mentioned methods as a tool for quantifying the critical controls on mineralization. In [14], the relationship between syn-magmatic tectonic deformation and magmatic flare-up events was investigated by collecting the magnetic mineral fabric data of plutons from the East Pacific continental arc.
After crystallization, granitic intrusions are usually submitted to considerable tectonic deformations. Tectonic cycles produce associations of various magma types and provide open spaces and ways for hot, dissolved-ion-rich fluids to pass through reservoir rocks that facilitate dissolution, mineral deposition, clay mineral formation, and mineralization [15,16,17,18,19]. Identifying the petrographic effects of magmatic or tectonic strain provides valuable information for investigating the transport and/or deformation processes. Although these processes alter the alignment of minerals, the altered intrusions have not yet been the subject of any petrofabric studies. Mass transfer processes that occur within intrusions due to significant tectonic events are responsible for the formation of ore deposits.
Each type of deposit is characterized by unique alteration assemblages due to the different temperature, pressure, composition of the fluids and permeability, type of rock, and the water/rock ratio [18,20,21]. Almost all of the mineralogical, chemical, and physical characteristics of rocks are significantly modified by hydrothermal alteration [22,23,24,25]. For a particular rock, the creation of secondary minerals has an impact on its physical and mechanical characteristics. The relationships between strength and porosity, density, or mineralogy during hydrothermal alteration have been explored [18,19,26,27,28,29,30].
The impacts of tectonics and hydrothermal fluids on the mineral fabric are described in the current work. In the studied area, there are previous AMS data from fresh and altered igneous rocks from central Iran where, following extensive submarine volcanic activity in the Eocene, several stocks and subvolcanic intrusions—including Ghahan, Sarbadan, Moshakyeh, and Spid—were emplaced during the Early Miocene (19.07–20.37 Ma) [31]. In [32], AMS, structural, petrographic, and geochemical evidence was combined to study the emplacement mechanism of the Ghahan and Sarbadan plutons. In [33], the magnetic susceptibility and alteration of the Moushakieh pluton was studied. The Spid pluton, which contains an Fe anomaly, has been previously explored by several authors [34,35]. Due to the lack of knowledge regarding how alteration processes affect the magnetic fabric, the Spid pluton was chosen for detailed magnetic fabric analysis. In the current investigation, 31 additional oriented cores were drilled to fill a gap in the AMS data reported by [35].
First, the main focus is on the field and sampling of oriented cores from different geological units. Then, the analytical techniques, including the AMS results, paleomagnetism, magnetic properties, and finally density and porosity of the samples, are depicted in order to better understand the effects of fluid flows on the rock fabrics. Paleomagnetic investigations of mineralized samples have also been undertaken, in particular, to define the age of mineralization. Finally, in order to assess strain intensity differences across the region, we also investigate the magnetic fabric of the Late Triassic sedimentary rocks and a crosscutting mafic dyke, in addition to the AMS data of a dioritic stock and one felsic dyke in the Zaghar area. Comparing the new findings to the previous structural information is expected to enhance our ability to better explain the AMS approach for emplacement mechanisms and tectonic characteristics.
2. Geological Settings
The studied area is located in the central Urumieh-Dokhtar magmatic arc (UDMA), a distinct linear magmatic complex with a NW–SE strike parallel to the main Zagros fold and thrust belt in Iran (Figure 1) [36,37,38,39]. It developed during the subduction of the Neo-Tethys oceanic crust beneath the Iranian plate [39,40,41,42] and has been active from the Late Jurassic to the present [37,38].
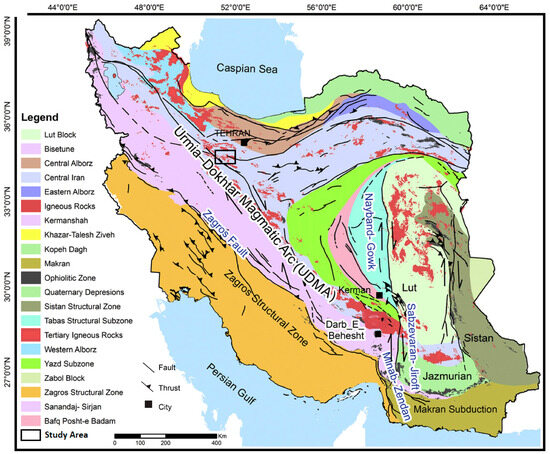
Figure 1.
Index map showing the Urumieh-Dokhtar magmatic arc (UDMA) and the study area in Iran (modified from [36]).
The prospected outcrops are situated in Markazi and Qom provinces, ~180 km southwest of Tehran, and cover a small part of the Farmahin and Tafresh 1:100,000 geological quadrangle maps [43,44]. Field work was carried out over two locations: Zaghar and Spid, which are in the southwest and southeast of Tafresh City, respectively (Figure 2a).
Based on the Saidiyeh 1:250,000 geological map [45], the outcrops in the Zaghar area consist mainly of dark gray limestone with intercalations of dark gray shale (Late Triassic: TRn2, Figure 2) that are followed by Jurassic shale and sandstone (Jshs), Cretaceous limestone (Km2), and the Eocene volcano-sedimentary series [46]. The Nayband Formation consists of mostly shale and sandstone outcrop in the east, on the Tafresh–Shahrab road (Figure 3a–d). The thickness of this sequence is more than 1300 m. A Jshs unit of 80 m in thickness is outcropping on the Tafresh–Farmahin road and in the Noghreh–Kamar valley. This part of the Shemshak formation is made of thin layered gray shale and interlayers of sandstone.
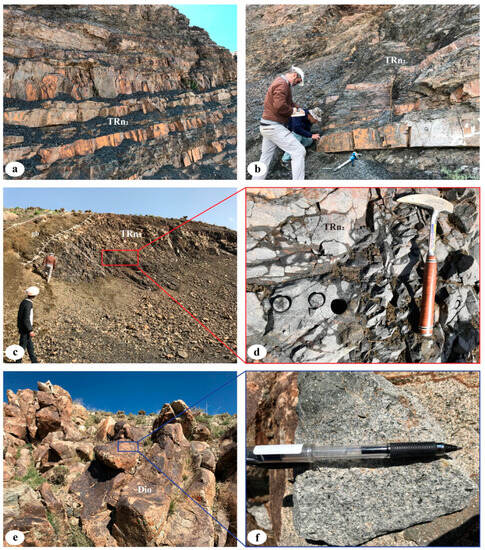
Figure 3.
Filed views of the Zaghar area. (a,b) Late Triassic dark gray limestone with intercalations of dark gray shale (TRn2). (c) A microgabbroic-diabasic dyke crosscut TRn2 unit. (d) Drilled core samples from shale. (e) A close-up of the Zaghar pluton. (f) A hand specimen of dioritic stock.
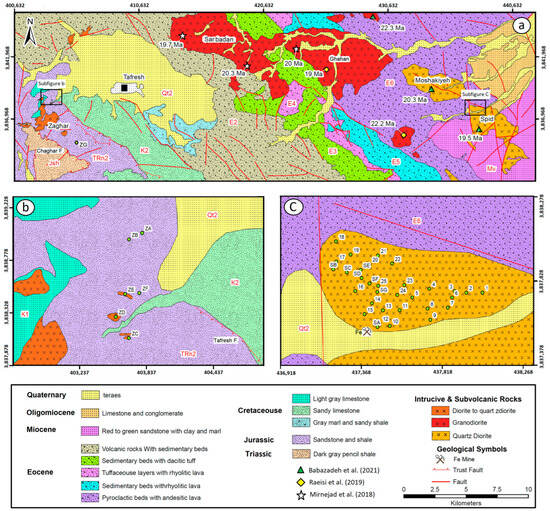
Figure 2.
(a) The locations of Tafresh city (black square) and two studied areas on the Qom geological map at a scale of 1:250,000 [47]. U-Pb zircon dating of the plutons is extracted from [31,48]; (b,c) Geological maps of the Spid and Zaghar areas, respectively. The numbers represent sampling sites (39 stations) for the magnetic fabric and paleomagnetism studies.
Volcano-sedimentary strata from the Triassic, Jurassic, Cretaceous, and Eocene are cut by a series of microgabbroic-diabasic dykes [45]. Plagioclase, pyroxene, hornblende, olivine, apatite, rutile, and opaque minerals are present in the mafic dykes, which exhibit granular and granular to sub-ophitic textures. The mafic dykes have undergone extensive hydrothermal alterations, including saussuritization, chloritization, sericitization, carbonatization, and silicification [45]. The current study examines the magnetic fabric and magnetic mineralogy of a mafic dyke near Zaghar village (Figure 3c). The microdioritic dyke is 2 km long and 10 m wide with a general EW striking orientation.
Several post-Eocene intrusions, stocks, and dykes have been emplaced into the TRn2 and Jshs units and changed to hornfels and skarn in the contact metamorphic aureole. The largest one is the Zaghar intrusion that is outcropped at two locations (Figure 3e,f). The main intrusion is typical of a magmatic arc and is composed of diorite to quartz diorite with a calc-alkaline and metaluminous nature [46]. These researchers investigated the geology, mineralization, fluid inclusion, and stable isotope properties of the Zaghar Cu-(Au) skarn deposit. Several felsic dykes with general EW to NE–SW strikes occurred around the Zaghar intrusion. Because the intrusions and these dykes are dioritic in composition, it was expected that the dykes would be ramified from the intrusion.
The Zaghar intrusions and their host rocks are surrounded by the Tafresh, Talkhab, and Chaghar faults. The mean strike of a Tafresh fault varies from N130 to N150W, with an average dip of 50° to the southwest [32]. Parallel to the Tafresh and Talkhab faults, the Chaghar fault has an NW–ES strike and dips ~2–25° to the southeast, which thrusts Eocene limestone, sandy limestone, tuff, and marl over Oligomiocene marl and limestone.
Tafresh district is made of Eocene to Miocene volcano-sedimentary sequences intruded by plutonic rocks. The ages of the volcanic rocks have already been reported as 54.7–44.3 Ma [49], and as 26.0 ± 1.6 Ma [50]. In [31], the age, mineral chemistry, and whole rock chemical composition of several granitoid rocks from NE Tafresh was reported. These intrusive rocks (including Ghahan, Navis, Kasva, Anjeleh, and Sarbadan intrusions), consisting of granodiorite and diorite, were emplaced during the early Miocene (19.07–20.37 Ma). In [32], the emplacement mechanism of the Tafresh granitoids (Sarbadan and Ghahan stocks) was investigated to define tectonic stress/strain fields in the late Miocene. Later, for a better understanding of the petrogenesis, time of emplacement, and tectonic setting of Miocene igneous rocks in the Tafresh area, new geochemical and isotopic data was produced [48]. The approximate sample locations of U-Pb zircon dating for the references mentioned are shown in Figure 2a. The Eocene volcano-sedimentary units are cut by a number of N–S to NW–SE elongated mafic to intermediate dykes [51]. Zircon LA-ICP-MS U-Pb ages for the major rock types range from 24 to 19 Ma, while gabbroic dykes’ ages are around 17.5 Ma [48].
Current research focuses on the more detailed magnetic fabric of fresh and altered samples from the Spid pluton. In [35], a part of the Spid intrusion has been studied to discover the passageways of ore-bearing fluids within the stock. The pluton was intruded into Eocene volcano-sedimentary sequences, including dacitic to andesitic tuffs and lavas [43]. Based on field and textural observations, the pluton would be classified as subvolcanic and is diorite to quartz diorite in composition. It has undergone extensive propylitic and argillic alterations. The southern and western portions of the pluton are covered by Quaternary alluvial deposits (Qt2, Figure 2c). At the contact point between the pluton and the Eocene volcanic rocks, pyrite, chalcopyrite, hematite, and oligiste are deposited (Figure 4a). The mineralized body is lenticular in shape and contains the typically laminated veins of the fault-fill vein system, one with N–S and the other with E–W tendencies. Goethite, malachite, and azurite are created as a result of supergene alteration. Figure 4b exhibits some drilled core samples taken from the deposit for paleomagnetic measurements.
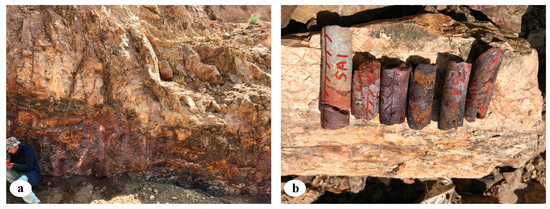
Figure 4.
(a) Filed view of iron oxide mineralization in the contact of the Spid pluton with their volcanic host rocks. (b) Some drilled core samples taken from the deposit for paleomagnetic measurements.
3. Sampling
Representative samples of different rock types and geological data were collected in the Zaghar area and Spid pluton. Oriented cylindrical core samples were taken from the Nayband Formation’s shale and sandstone in the Zaghar region at four different sites (#ZA, ZB, ZC, and ZG; Table 1; Figure 2c) for the study of the magnetic fabric and paleomagnetism. From each site, six to ten core samples approximately 5 to 15 cm in length were collected. In this area, the mafic dykes are characterized by subvertical NW–SE striking orientations [45]. A mafic dyke crosscutting the Nayband Formation 3.5 m in width and 200 m in length and with a major N–S striking (160°/78°) was selected for AMS fabric determinations (#ZC; Figure 1; Table 1). Flow directions in dykes derived from AMS data are better defined near the chilled margins, where elongate and planar particles become imbricated; the sampling for AMS analyses should be performed as close as possible to the dyke margins [10,52]. Accordingly, sampling was carried out at eight sites: five from country rocks (#ZC4–8; Table 1) and three along the chilled margin of the dyke (#ZC1–3; Table 1). Drilled cores were spaced from 10 to 30 cm across the dike and its country rocks. AMS sampling from the major Zaghar pluton was not possible due to the high topographic relief, which was incompatible with the transport of the heavy drill. Several locations were therefore drilled through a single dioritic stock (#ZD1–9; Table 1) and a microdioritic dyke with a N40E strike (#ZE1–9; Table 1) for AMS and paleomagnetic analyses. A total of nine cores were extracted from this stock, varying in length between 4 and 6 cm, while each core was spaced approximately 10 m apart. Nine specimens were drilled within the dike width.

Table 1.
Anisotropy of magnetic susceptibility data from the Spid and Zaghar area.
The Spid pluton and its associated Fe anomaly have previously been investigated. Here, the interpretation of the magnetic fabric of the Spid intrusion was derived from [35] (#S1-S25; Table 1). In the current study, 31 additional oriented cores were gathered throughout the Spid intrusion to better understand the effects of alteration on magnetic fabric patterns (#SB, SC, SD, SE, SF, and SG; Table 1). Samples were cut into cylindrical specimens with a diameter of 25 mm and a length of 22 mm at each site (the standard size for magnetic measurements). For AMS analysis, a minimum of two cores from each site and 191 standard core pieces overall were gathered. The samples displayed a range of different degrees of hydrothermal alteration.
4. Materials and Methods
4.1. Anisotropy of Magnetic Susceptibility (AMS)
When a material is exposed to a low magnetic field (H), the acquired magnetization (M) is linearly linked to the magnetic field as follows: M = KH [53], where K is the volumetric magnetic susceptibility. Since M and H are both stated in A/m, the volumetric susceptibility (K) is dimensionless. The anisotropy of the magnetic susceptibility—i.e., its variations in the different directions of a sample—can be mathematically expressed as a second-rank tensor with three orthogonal eigenvectors K1 ≥ K2 ≥ K3 and geometrically viewed as a susceptibility ellipsoid. The long axis of the ellipsoid K1 defines the magnetic lineation and the short axis K3 defines the pole of the magnetic foliation (the plane formed by K1 and K2 axes) [53,54]. It is frequently assumed that magnetic lineation (K1) represents the stretching direction of magmatic flow [2,55,56,57]. Additionally, scalar parameters, including the bulk magnetic susceptibility (Km), percentage of magnetic anisotropy (P%), and shape parameter, were obtained from the AMS data and used to describe the AMS ellipsoid (T). The average or bulk susceptibility is given by Km = (K1 + K2 + K3)/3; the percentage of magnetic anisotropy P% = 100[(K1/K3) − 1] and the shape parameter T = ln [K2/(K1/K3)]/ln[K1/K3] [58] were then calculated for each sampling station and reported in Table 1.
To investigate the effect of alteration on magnetic fabric parameters, six core samples with different magnetic susceptibilities (300 to 20,000 µSI) were drilled in the Spid pluton at intervals of less than 50 cm. In situ magnetic susceptibility was measured using a portable susceptibility meter (SM30), allowing for the characterization of the magnetic behavior in the field. Low-field AMS measurements of some sites from Spid pluton were performed at room temperature using AGICO MFK1-FA Kappabridge at the Geomagnetic Laboratory, Shahrood University of Technology, Iran (#S1–S25; Table 1). All magnetic measurements of the Zaghar and new Spid sites were performed at CEREGE in Aix en Provence, France. An MFK1 Kappabridge device was used to assess the low-field magnetic susceptibility (equipment from both laboratories operates at 200 A m−1 peak field and 976 Hz frequency, with a maximum sensitivity of 2 × 10⁻⁸ SI).
4.2. Paleomagnetism
A total of 90 cores of 32 sites from the Spid pluton and 56 cores of 7 sites from the Zaghar area in the west of Tafresh were drilled. A minimum of five oriented samples were collected from each site using a portable water cooling and gasoline powered drilling machine. Each core was oriented in the field by a magnetic compass. All the collected paleomagnetic samples were trimmed into 2.2 cm-long standard cylindrical specimens with a diameter of 2.54 cm to obtain 350 standard specimens. The block samples were prepared at the Shahrood University of Technology Geomagnetism lab.
The natural remanent magnetization (NRM) of all samples was measured using a superconducting rock magnetometer (SRM-760R; 2G Enterprises) installed in a magnetically shielded room in the paleomagnetic laboratory CEREGE in Aix en Provence (France). Stepwise alternating field (AF) demagnetization was performed on samples, typically in 15 to 30 steps at small intervals of 5 mT, from 2 mT to a maximum field of 100 mT using the in-line demagnetizer of the superconducting rock magnetometer. Samples with high coercivity were thermically demagnetized in 10 to 18 temperature steps for 40 min per step between 20 and 680 °C using the shielded oven TD-48SC (ASC). The results for each paleomagnetic sample are presented in Supplementary Tables S1–S5. One purpose of the demagnetization was to reveal the most stable remanent magnetization components once the soft viscous or other secondary remanences had been removed [59].
Principal component analysis (PCA) was used to determine the best-fit line through selected demagnetization data points for each sample [60] using PaleoMac software version 6.5 [61]. To compute the average directions, we used the statistical approach of [62] with the parameters k (precision parameter) and α95 (semiaperture of the 95% confidence cone around the average direction). Magnetization vectors with maximum angular deviation values greater than 5 were not included in the site mean calculations. For most samples, a single line could be fitted to the demagnetization data points. For less than 10% of the demagnetization results, it was necessary to anchor the magnetization vector to the origin. Individual sample directions were considered as outliers and rejected from the site mean calculation if the angular distance between the sample direction and the estimated site mean was greater than 18°. Some oriented core samples were also collected from the ore deposit at the contact point of the Spid intrusion (#SA; Table 1).
4.3. Rock Magnetism
Rock magnetic analyses consisting of magnetic susceptibility vs. temperature curves and hysteresis loops were performed to characterize magnetic mineralogy though Curie temperatures (Tc), mineral grain sizes, and domain state determinations for Zaghar and Spid representative samples.
4.3.1. Thermomagnetic Measurements
A small piece of the residual sample from each representative sample was cut and selected for rock magnetic experiments to identify the main ferromagnetic/ferrimagnetic mineral particles and detect possible chemical alterations and mineral phase transformations during a complete heating-cooling cycle in the thermomagnetic analysis. The identification of the basic magnetic mineralogy responsible for the susceptibility and its anisotropy was measured with an MFK-1 device coupled to a CS-3 temperature control apparatus in air and argon atmospheres (to prevent a possible interaction between oxygen and heated samples from the resulting chemical changes) located in CEREGE, Aix en Provence, France. This device records the susceptibility variation (Km) as a function of temperature from 20 °C to 700 °C, allowing magnetic transitions, such as Curie temperatures, to be determined, as well as irreversible crystallographic transformation during heating. The temperature dependence of the susceptibility curves (χ-T curves) is a useful method for identifying magnetic mineral phases [63,64]. In order to evaluate the influence of magnetic mineralogy changes induced by hydrothermal alteration on the magnetic susceptibility and fabric, the rock magnetic behavior was investigated on 10 representative samples from the Spid and Zaghar areas. Fresh and hydrothermally altered samples of different alteration intensities with magnetite relics and without any petrographic evidence of magnetite were analyzed using the temperature-dependence of low-field magnetic susceptibility measured in air using the CS-3 furnace option of the MKF1 Kappabridge. A black shale sample at the contact point with Zaghar stock was also measured, but in an Argon atmosphere.
4.3.2. Hysteresis Loop Study
A magnetic hysteresis loop analysis was conducted on 12 samples. Hysteresis curves and back field remanence acquisition curves were obtained on 0.2 to 0.9 g rock fragments using a Micromag 3900 PMC vibrating sample magnetometer (VSM) with a maximum field of 1 T at CEREGE, Aix-enProvence, France. A high field slope corresponding to paramagnetic susceptibility (χhf) and intercept to origin (saturation magnetization Ms) was computed on the 0.7–1 T part of the curves. Hysteresis and remanence parameters (coercivity Bc, saturation remanence Mrs, and remanent coercivity Bcr) were evaluated only if the ferromagnetic signal was significant. The S ratio was computed as the back field remanence at −0.3 T divided by Mrs. Table 2 presents the results of VSM measurements on representative Spid and Zaghar samples.

Table 2.
Rock magnetic parameters obtained with the VSM.
4.4. Density and Porosity
Density and porosity are crucial factors in determining how fluids move through a rock formation. In order to determine the impact of alteration on the physical characteristics of rocks, the current study examines the density and porosity of the selected samples and relates them to the magnetic susceptibility of various types of altered diorites. Density (ρ), or mass per unit volume, is one of the fundamental properties of matter. Measuring an object’s bulk volume (Vb) and grain volume is a standard method for determining its porosity (Vg). While grain volume solely measures the volume of solid material in the sample, bulk volume is based on overall dimensions and includes volume contributions from any fractures or voids that may be present. We measured the porosity of the samples using two different techniques: helium pycnometry and water saturation. Each cylindrical sample’s dry weight (md) was calculated for this study using a delicate electronic balance (0.0001 g precision). Then, using calipers, their dimensions were measured and bulk volumes (Vb) were computed (Supplementary Table S5). Only samples with approximately ideal cylinder volumes were used for the measurements. A few chosen samples were weighed once more when the samples were saturated with water (Ws).
The mass of pore water is calculated using the formula (Ws − md) (Ww). As a result, porosity is determined by the formula Φw = (Ww/Vb) × 100. The bulk density is the density based on the entire volume of the sample, including any pore space. The grain density (ρg) is the density based solely on the solid material, excluding the pore space. It is also calculated through ρg = (ρb)/(1 − Φw/100). The bulk density of selected samples (ρb) ranges from 2.3 to 2.82 g cm−3. Following the procedure, the porosity of the dry cylindrical samples was measured successively by saturation methods and with a helium injection at 2.2 bar pressure using a helium pycnometer at CEREGE, Aix-enProvence, France (Øgas; Supplementary Table S6).
5. Results
5.1. Anisotropy of Magnetic Susceptibility (AMS)
AMS fabric that detects the anisotropic distribution and orientation of magnetic minerals in the rocks has long been used for finding the emplacement mechanism of epizonal intrusions and their relationship to large-scale structures [2,53,65,66,67]. Figure 5, Figure 6, Figure 7 and Figure 8 illustrate the lower hemisphere stereonet used to identify the various magnetic fabric orientations of the research area. K1 (magnetic lineation) and K3 (pole of magnetic foliation) are represented, respectively, by squares and circles. Around the direction of the site-mean ellipses with a 95% degree of confidence are drawn.

Figure 5.
(a) AMS mean directions and confidence ellipses projected on an equal-area lower hemisphere of the sites of the Nayband Formation (ZA, ZB, ZD, ZC5–8, ZF, and ZG). (b) The plot of anisotropy (P) versus magnetic susceptibility (Km). (c) The plot of AMS shape (T) versus anisotropy (P).

Figure 6.
(a) AMS mean directions and confidence ellipses projected on an equal-area lower hemisphere of sites at mafic dyke (ZC1–4) and its country rocks in the Nayband Formation (ZC5–8). (b) The plot of anisotropy (P) versus magnetic susceptibility (Km). (c) The plot of AMS shape (T) versus anisotropy (P).

Figure 7.
(a) AMS mean directions and confidence ellipses projected on an equal-area lower hemisphere of sites at the Zaghar intrusion. (b) The plot of anisotropy (P) versus magnetic susceptibility (Km). (c) The plot of AMS shape (T) versus anisotropy (P).
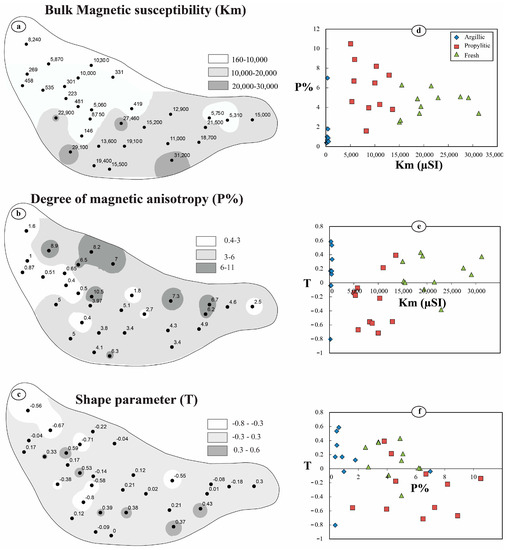
Figure 8.
Magnetic parameters of the Spid pluton. (a–c) Contour maps of magnetic susceptibility (Km), anisotropy degree (P%), and shape parameter (T), respectively. (d) Km vs. P%. (e) T vs. Km. (f) T vs. P%.
5.1.1. Zaghar Area
From the oldest rocks in the Zaghar area, which date to the late Triassic era, 34 oriented cores were taken from five geographic distributions (#ZA, ZB, ZC4–8, ZD, ZF, and ZG; Figure 2b). Anisotropy of magnetic susceptibility measurements were performed on dark gray limestone with intercalations of dark gray shale. The total AMS data for the different locations of the Nayband Formation is clustered for K1 but weakly defined for K2 and K3 (Figure 5a). The AMS fabrics show lineations subhorizontally oriented along the NE-SW direction (confidence angle: 29; 21) and foliations recording a very shallow dip (confidence angle: 24.19).
In the plot of bulk susceptibility (Km) against the magnetic anisotropy (P), the samples are divided into two categories (Figure 5b). A low susceptibility cluster (Km < 250 µSI) that likely corresponds to paramagnetic carrier phases can be seen in the mudstone and shale of the Nayband Formation. Some samples exhibit significantly larger anisotropy and higher susceptibility due to changes in the magnetic mineralogy. In this case, the amounts of anisotropy and magnetic susceptibility are positively correlated. Overall, the AMS fabrics are reasonably weak, with P values ranging from 1 to 1.12 (Table 1, Figure 5b). Their isotropic to weakly anisotropic nature illustrates that these rocks have not been substantially deformed. Both prolate and oblate shapes can be seen in the AMS ellipsoids (Figure 5c).
One mafic dyke crosscutting the Nayband Formation and its country rocks was drilled in site #ZC. The AMS results of the dyke (ZC1–4) are characterized by vertical foliation planes with a NE–SW strike and lineations that plunge strongly to the NE (Figure 6a).
The magnetic fabric of the dyke’s country rocks (ZC5–8) and the previous measured magnetic fabric of the Nayband Formation are identical (compare Figure 5a and Figure 6a). Country rocks clearly show stronger anisotropy and lower magnetic susceptibility than the mafic dyke (Figure 6b). The magnetic ellipsoids of the dyke exhibit a preference for oblate over prolate fabric in the country rocks, as shown by the T versus P diagram (Figure 6c).
AMS measurements on the diorites and a felsic dyke with the same composition at Zaghar (#ZD and #ZE, respectively; Table 1) are illustrated in Figure 7a. Since both units are similar in composition, the dyke is probably ramified from the intrusion. In general, the AMS data of the granodiorites and the dyke are poorly clustered, but they reveal a moderate E-plunging K1, a moderate SW-oriented K2, and a shallow NW-oriented K3 (Figure 7a). Except for two sites of diorites, others have low anisotropy and a magnetic susceptibility greater than 5000 μSI (Figure 7b). There is no obvious correlation between the shapes and the anisotropy (Figure 7c).
5.1.2. Spid Pluton
According to the measured magnetic fabric studies, the bulk magnetic susceptibilities of individual sites throughout the Spid pluton range over a large interval, from 146 μSI to 31,200 μSI, with an average of 10,806 μSI (Table 1). Detailed microscopic observations reveal that the highest susceptibilities correspond to the fresh diorite (#9, Figure 2c), confirming that magnetite is the main magnetic carrier in the rock [35]. Therefore, the pluton can be described as ferromagnetic granite (Km ≥ 500 μSI; [2]). An inverse distance weighted (IDW) interpolation of ArcGIS 10.8 is used to contour the individual magnetic parameters (Figure 8a–c). On the contoured map of Km, the northwestern part of the pluton has a low Km, whereas the southern and eastern margins, especially those in contact with the iron oxide deposit (#9, #15, and #23, Figure 2c), have higher magnetic susceptibilities (Figure 8a). The magnetic anisotropy, represented as an anisotropy percentage (P%) for the Spid pluton, is given in Table 1 and shown in Figure 8b. The anisotropy values for individual core pieces range from 0.4% to 10.5% (Table 1). The majority of the sites have low anisotropy, indicating the lowest intensity of deformation. Sites around the center and two isolated sites next to the northwest pluton boundary reveal higher P% values (Figure 8b).
The stations with the lowest susceptibilities (Km < 500 μSI) (#14, #17, #22, #23, #SB, #SF, #SD, and #SE) correspond to the samples that are located in the vicinity of the faults and subjected to argillic alteration (Figure 8a).
T values for individual core samples range across the pluton range in value from −0.8 to +0.6 (Figure 8c). The susceptibility ellipsoids show a priority from prolate to oblate, suggesting that the planar element of the magnetic fabric dominates (Figure 8c).
In AMS research, a plot of P% and T vs. Km and T vs. P% is employed to correlate specific shape fabrics with either susceptibility or anisotropy (Figure 8d–f). In Figure 8d, the magnetic susceptibility magnitude correlates with the observed alterations in the field and petrography. For the fresh and poorly altered samples, the Km is higher than 500 µSI and magnetite is the dominant magnetic carrier. A decreased magnetic susceptibility is present in the samples that underwent propylitic alteration. The sharp decrease in susceptibility for the rocks subjected to propylitic alteration may be due to the creation of epidote through the interaction of Ca-plagioclase with primary magnetite. The lowest susceptibilities (Km < 400 µSI) correspond to samples that are argillitized, where only paramagnetic minerals remain, and propylitic ones have increased anisotropy. While fresh rocks have oblate ellipsoids and are slightly anisotropic, the propylitic rocks have more anisotropy and are prolate (Figure 8e). The relationship between T and P% suggests that the anisotropy and magnetic fabric ellipsoids have changed from fresh to propylitic and argillitic samples. In addition, for the samples with argillic alteration, the anisotropy is decreased while the shape parameters remain constant (Figure 8f). These variations can be attributed to modifications in the magnetic mineral’s particle size and domain structure during fluid flow.
The general AMS fabric of the samples has shallow NNE–SSW plunging magnetic lineations and a shallow-to-moderate dipping foliation, while there are some changes depending on the position in the Spid pluton (Figure 9a). Due to the heterogeneous magnetic fabric of the Spid pluton, the resultant AMS data are investigated in more detail. The pluton’s magnetic lineation is characterized by a bimodal distribution of trends (Figure 9a). The dominant set varies in trend between south and north, with a shallow plunge. The second set of lineations varies in trend toward the east. The latter lineations are mostly located at the western half of the pluton for the altered sites containing the lowest magnetic susceptibilities. Except for two sites, the others are characterized by subhorizontal magnetic lineations. The average trend/plunge of magnetic lineation is 174°/6°. The magnetic fabric of the Spid pluton shows the poles to magnetic foliation (K3) are more clustered, and a general westward dip is predominant (Figure 9a).
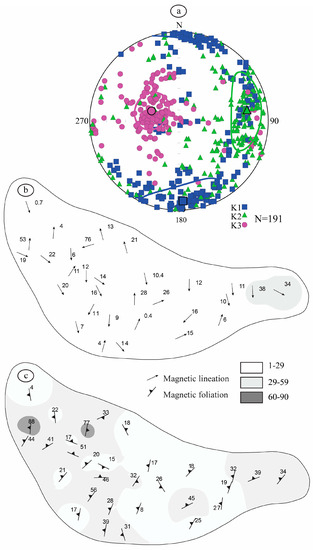
Figure 9.
(a) AMS mean directions and confidence ellipses projected on an equal-area lower hemisphere of sites at the Spid pluton. (b,c) Magnetic lineation and foliation maps of the Spid pluton, respectively.
Magnetite is likely the principal ferromagnetic mineral. However, the spatial distribution and concentration of possible magnetite types (single-domain, pseudo-single-domain, and multidomain) remain to be determined.
To investigate the effect of alteration on magnetic fabric parameters, six core samples with different magnetic susceptibilities (300 to 20,000 µSI) were drilled in the Spid pluton at intervals of less than 50 cm (#SG1–SG6; Table 1; Figure 10).
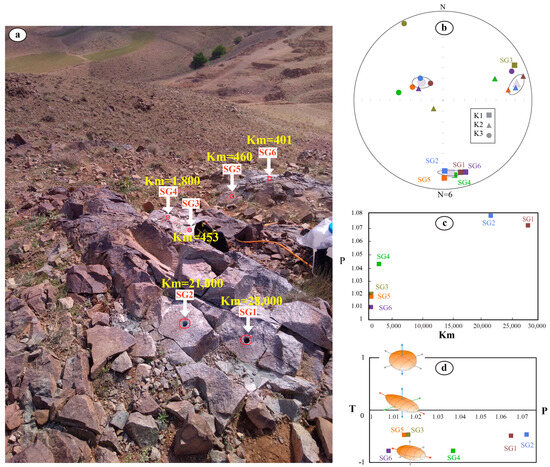
Figure 10.
(a) Drilled cores with different magnetic susceptibility magnitude along a profile across an outcrop in the center of the Spid pluton (#SG). (b) Mean AMS directions from different samples. (c,d) Anisotropy degree vs. Km and T, respectively.
The mean AMS directions from different sites are retained (Figure 10b). It is likely that susceptibility magnitudes (K) lower than 500 μSI characterize poor magnetite rocks. Plotting the magnetic anisotropy against the mean bulk susceptibility (Km) divides the samples into two groups (Figure 10c): a low susceptibility group of samples with a low degree of anisotropy (the likely paramagnetic samples) and a high susceptibility group with a high degree of anisotropy (the ferromagnetic samples). This shows that changes in mineralogy affect the degree of anisotropy. The shape parameter, however, remained constant through the alteration. A secondary fabric should be inherited from the protolith. Indeed, directional data (Figure 11) indicates that most samples have recorded the same lineation (except G3) and foliation (except G3 and G6). SG3 and SG6, which are the two samples with the lowest susceptibility, show AMS axis exchanges (switch of K1 with K2 and K2 with K3), as described in [68].
5.2. Rock Magnetic Properties
The samples have Mrs/ Ms ranging from 0.16 to 0.49, with an average of 0.33, and Bcr/Bc ranging from 1.71 to 3.52, with an average of 2.64 (Table 2). These ratios (Mrs/Ms versus Bcr/Bc) are plotted on a Day plot [69], shown in Figure 11. This Day plot specifies and distinguishes the single domain (SD), pseudo-single domain (PSD), and multidomain (MD) magnetic grains and will also serve as a better magnetic granulometry indicator when plotted together with theoretical mixing curves [70]. In this study, S ratios > 0.95 and Bcr < 65 mT indicate in a few high Ms samples that the dominant magnetic mineral is magnetite or maghemite. These results reveal that most of the recorded remanence is held by grains falling within the PSD and SD domain-state for representative samples (Figure 11). Other samples have an S ratio of 0.1 to 0.87, with Bcr up to 261 mT and Mrs/Ms up to 0.5. This is typical of hematite in the Spid pluton or pyrrhotite in Zaghar black schists. Indeed, specular hematite is visible under a microscope in the samples from the Spid pluton.
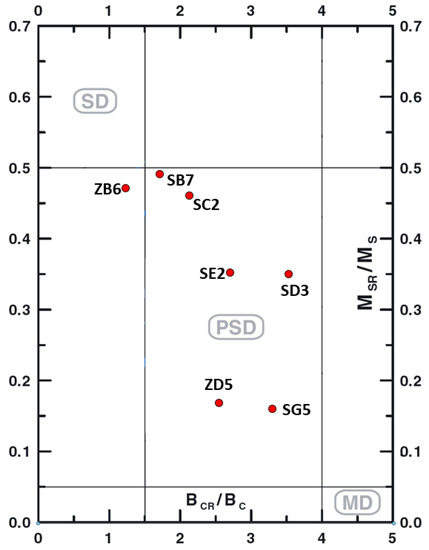
Figure 11.
Mrs/Ms vs. Bcr/Bc plot of the hysteresis parameters for representative specimens of the Spid and Zaghar areas. SD: single domain; PSD: pseudo-single domain; MD: multi-domain, after [70]. (Bcr: coercivity of remanence; Bc: coercivity; Mrs: saturation remanence; Ms: saturation magnetization).
Figure 12 shows the thermomagnetic curves for representative samples from the Spid and Zaghar areas. SB20 is a high-susceptibility sample (10,000 µSI) from the Spid pluton. Still, it shows a number of transformations during successive heating runs (at 150, 350, 410, and 580 °C). First, an irreversible susceptibility that increases near 150 °C is observed during heating; then, an irreversible susceptibility decreasing by a factor of two occurs near 350 °C. This is typical of maghemite transformation into hematite [71,72].
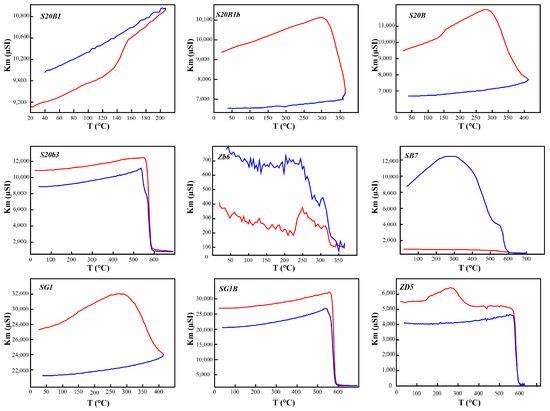
Figure 12.
Typical thermomagnetic curves for the Zaghar and Spid samples. (Red = heating, blue = cooling).
Maghemite is a phase formed by the deuteritic oxidation of magnetite during late emplacement fluid interactions. The 150 °C increase may be interpreted as the dehydration and crystalline defect reorganization of near amorphous precursors of maghemite. Then, a subsequent heating at 410 °C showed no more inflexions and little irreversibility. A higher temperature cycle shows, upon heating, a simple Curie point of near pure magnetite (580 °C), while, upon cooling, a secondary Curie point appears near 560 °C (weakly substituted titanomagnetite). Thermomagnetic (K–T) curves for samples S20b3, SG1B, and ZD5 show sharply decreasing values of susceptibility during heating, with a Curie temperature near 580°C indicating magnetite (Figure 12). The decay above 600 °C in some curves (e.g., Figure 12) indicates the existence of a substantial amount of either stabilized maghemite or hematite [64,73].
Another high susceptibility sample of the Spid pluton (SG1, ~28,000 µSI), as well as a Zaghar stock sample (ZD5, 5495 µSI), show very similar behavior, showing that poorly crystalline maghemite is the main magnetic mineral present in these high-susceptibility samples, together with pure and eventually weakly substituted magnetite. The K–T curve obtained from argillic-altered diorite with low susceptibility (SB7, 661 µSI) shows a rather flat heating curve, with faint evidence of a magnetite Curie point and no hint of a hematite Néel point between 600 and 700 °C. A major increase during cooling at 580 °C is indicative of abundant pure magnetite neoforming during heating above 600 °C. The K–T curve obtained for a ZD5 granite sample from the north of Zaghar, Km = 5499 µSI, exhibits non-flat patterns with a slight decrease at 350 °C (Figure 12), which might be interpreted, again, as the destruction of maghemite.
The TC of 320 °C for the Zb6 shale sample from the north of Zaghar (Km = 390 µSI) is typical of monoclinic pyrrhotite. The heating curve exhibits a steep increase near 220 °C, typical of the lambda transformation of hexagonal pyrrhotite. It therefore seems that this sulfide rich sample bears both forms of pyrrhotite. Apart from this shale sample, thermomagnetic curves indicate the presence of more or less substituted magnetite and maghemite as the chief magnetic minerals carrying susceptibility in the studied samples of the Zaghar and Spid intrusions. Hysteresis measurements, based more on remanence properties, also highlight the presence of hematite in these intrusions.
A preliminary reflected light observation indicates that magnetite and hematite are present. To petrographically confirm these interpretations in the case of the SG susceptibility gradient (Figure 13), we prepared for SEM observation polished sections of SG1, SG4, and SG5 (high, medium, and low susceptibility, respectively). Figure 13a shows that SG1 exhibited large corroded oxide grains, with TiO2 content indicated by an EDS of 12%. One grain of porous pure iron oxide (Figure 13b) is typical of hydrothermal hematite. It thus appears that even high-susceptibility zones are heavily transformed by alteration, although titanomagnetite (partly transformed into titanomaghemite) has not been totally dissolved. The intermediate sample SG4 showed rare remnants of small corroded titanomagnetite (Figure 13c), but most iron oxides seem to have formed as oriented inclusions within pyroxenes (Figure 13d). Again, pure porous pure hematite is visible. Finally, the low susceptibility sample did not show any remnant of titanomagnetite or maghemite, and just a few corroded pyroxenes with iron oxides inclusions. Therefore, it seems that the whole observed range of susceptibility corresponds to quite significant hydrothermal alteration, the contrast being linked by the amount of digestion that had affected the primary oxides and the amount of inclusion formation within iron-bearing silicates.
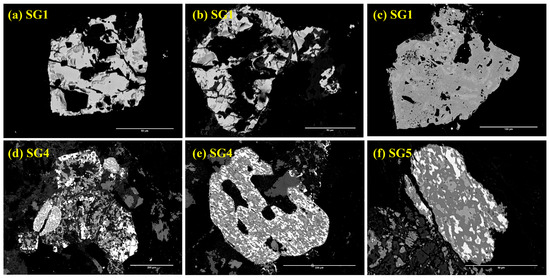
Figure 13.
SEM images in backscattered mode of iron oxide grains in three samples from the SG outcrop. (a,b) SG1, corroded large FeTi oxide grains with remnants of crystal shape (12% TiO2 in EDS). (c) SG1, one large grain of pure Fe oxide; low total and darker color indicate Fe3+ oxide or hydroxide. (d) SG4, composite corroded grain made of pyroxene, Fe, Ti, Mn, and pure Ti oxides, as well as sphene rich in Fe oxides. (e) SG4, corroded sphene loaded with small oxide inclusions. (f) SG5, sphene and oxide mixture.
5.3. Density and Porosity vs. Magnetic Susceptibilty
The porosity values (Φw) vary from 0.23 in a relatively fresh diorite in the Spid pluton (S6A3) up to 7.7% in the altered diorite (S17A3) with the lowest magnetic susceptibility (Supplementary Table S6). The grain density of selected samples ranges from 2.6 in S17A3 (argillic altered diorite) to 2.85 g cm−3 in S15B4 (relatively fresh diorite). Figure 14a shows a clear negative correlation between grain density and porosity, with a similar slope but different ρg at zero porosity for each pluton. Conversely, porosity increases as susceptibility decreases (Figure 14b). This can be interpreted as the effect of alteration. Due to the formation of more hydrated minerals (clays and other secondary silicates) at the expense of magmatic primary silicates (feldspars, pyroxene), ρg should decrease with alteration. Conversely, with the hydrothermal dissolution of primary minerals (mainly feldspars), porosity should increase. The Zaghar pluton has a distinctly lower ρg at zero porosity (2.61 versus 2.73), linked either to a less mafic primary composition and mineralogy than Spid, or a porosity decrease due to the precipitation of neoformed minerals. This would mean that even the samples with zero porosity are significantly altered. The helium porosity (Φgas) of the studied samples varies from −0.31 to 12.9% with an average of 3.76% (Supplementary Table S6). Figure 14c shows that Φgas is systematically higher than Φw, indicating a large amount of microporosity (likely in clays) inaccessible to water.
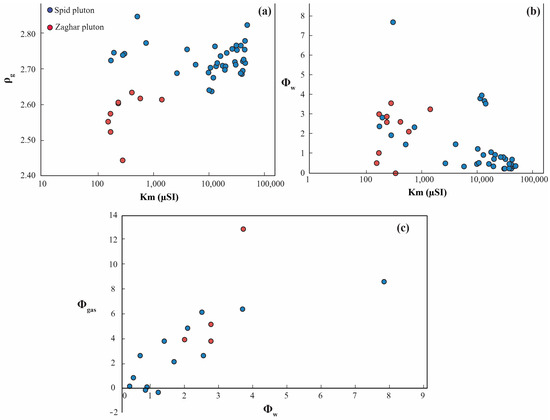
Figure 14.
(a) Cross plot of the grain density (ρg) versus the magnetic susceptibility (Km) of all the investigated lithotypes. (b) Plot of measured porosity using water (Φw) versus magnetic susceptibility (Km). (c) Plot of measured porosity using helium (Φgas) versus measured porosity using water (Φw).
An independent test of our interpretation of Figure 14a in terms of alteration can be performed by a comparison between the measured grain densities (ρg) or porosity against the magnetic susceptibility (Km). Figure 14b and c clearly demonstrate that the samples with a higher degree of alteration based on lower susceptibility present relatively lower grain density and higher porosity.
5.4. Paleomagnetism
In our study, initial intensities of the natural remanent magnetization (NRM) of Spid and Zaghar specimens were measured. The NRM intensity values of the Spid specimen ranged between 1.58 and 23,100 mA/m, and the NRM intensity values of the Zaghar specimens ranged between 1.2 and 5460 mA/m. The paleomagnetic investigations comprising AF and thermal demagnetizations yielded a very reliable and stable dataset. AF demagnetization on 54 standard specimens was carried out in 30 successive steps from 4 mT up to 100 mT, and thermal demagnetization was performed on 88 standard specimens in 20 progressive demagnetizations from 20 °C up to 680 °C. Zijderveld vector migration diagrams [74] were constructed to display and assess the demagnetization trends for each specimen. Figure 15 shows the representative Zijderveld diagrams and intensity decay curves for both the AF and thermal specimens.
A weak viscous magnetization component was usually erased at around 20–30 mT of the applied magnetic field and below a temperature of 300 °C. High-field components (HFCs) and high-temperature components (HTCs) decaying towards the origin can be defined after ~30 mT and ~300 °C, respectively. The HTCs could be resolved at the temperature interval of 350–400 °C and 550–585 °C or 590–680 °C (Figure 16), indicating the presence of the stable remanence carriers Ti-poor titano-magnetite and Ti-rich titano-hematite. For both HFC and HTC determinations, 10 to 14 sequential demagnetization steps that decayed steadily towards the origin were used to define the characteristic remanent magnetization (ChRM) directions. The results for each paleomagnetic sample are presented in Supplementary Tables S1–S5. Due to the presence of magnetite as the chief carrier of magnetization, the AF demagnetization process was efficient enough to define a linear trajectory decaying towards the origin (Figure 15). Most specimens displayed a linear magnetization direction with a maximum angular deviation less than 15° for most samples. Most samples showed decreasing magnetization up to temperatures of 550–580 °C, indicative of (Ti-poor) magnetite. Some samples required higher temperatures, up to 680 °C, indicative of the presence of hematite.
Given the relatively scattered demagnetization behavior, the ChRM direction data in this study were not as strictly selected as the index criteria. Here, the isolated ChRM directions were obtained according to the abovementioned data selection criteria and, in the end, 165 ChRM directions were used in the statistical analysis for this study. The paleomagnetic dataset derived from this study did not yield good grouping, as shown in the stereonet plot (Figure 16), and most of the sites did not have stable and consistent paleomagnetic directions. For the ChRM calculations, each discrete specimen’s data acceptance limits were constrained within MAD ≤ 25°. The site-mean directions were calculated using three or more ChRM directions. The mean ChRM direction calculated for the Spid pluton was D = 28.2°; I = 80.2° (α95 = 7.8°; k = 4.5). For Zaghar it was D = 63.7°; I = 85.8° (α95 = 6.4°; k = 5.5) (Figure 16).
Both massifs show the same average direction within the angular error, with mostly reverse polarity, suggesting they cooled in the same dominant polarity chron and were submitted to the same tectonic rotation after ChRM acquisition. The average geomagnetic field directions predicted in north-central Iran during the Miocene have an inclination of about 52° [75]. Therefore, our study indicates that both massifs were affected by a post-Early Miocene tilting of about 30° toward the north around a roughly EW axis. It is not possible to evaluate a potential rotation around a vertical axis given the lack of paleohorizontal constraint. Post-Eocene rotations published in the vicinity of our area are moderate [49,75,76,77], typically ±20°. Such rotations do not significantly change our estimate of northward tilting of the Spid and Zaghar massifs.
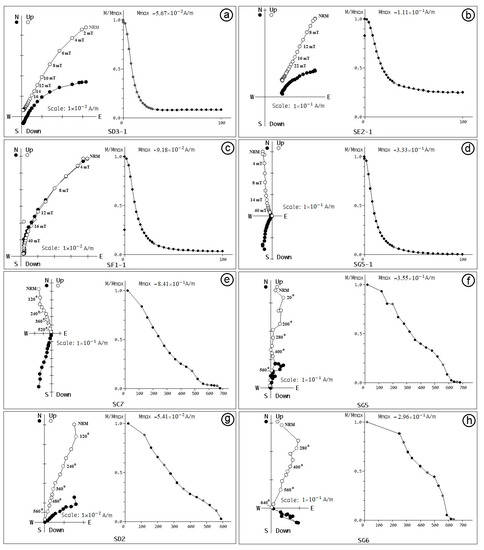
Figure 15.
Typical orthogonal vector [78] and intensity decay curves plot for AF (a–d) and thermal (e–h) demagnetizations. Directions are all plotted in geographical coordinates; solid and open circles represent the vector endpoints projected onto the horizontal and vertical planes, respectively. Numbers on the plots show temperature/applied alternating magnetic field steps. NRM: natural remanent magnetization.
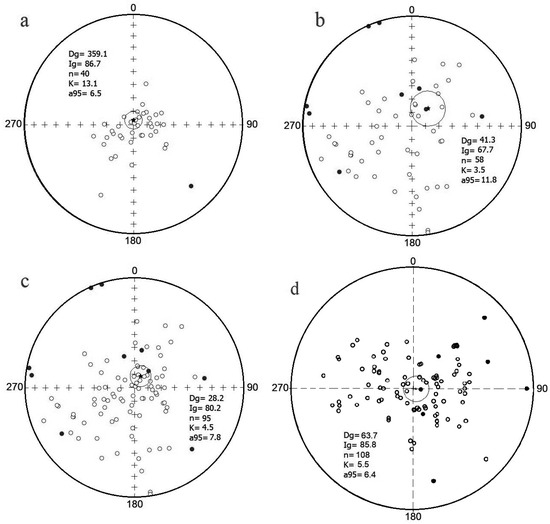
Figure 16.
Equal area stereographic projections of the paleomagnetic directions for the (a) Spid old sample; (b) Spid new samples; (c) all Spid samples; and (d) all Zaghar samples. (Reverse polarity—open circle).
6. Discussion
In this research, field, mineralogy, and some magnetic and physical properties associated with the obtained magnetic fabric from different rock units of the Zaghar and Tafresh areas are compiled to understand the relationships during the tectono-magmatic evolution. Here, AMS measurements are presented as a series of plots on lower hemisphere stereonets that show each of the three orthogonal vectors for each specimen under analysis. The parameters L (K1/K2) and F (K2/K3) proposed by [79] have been included to characterize magnetic ellipsoids. A review of previous structural measurements and interpretations has been used for verification.
6.1. Nayband Formation
According to the rock magnetic analysis, pyrrhotite is the main carrier of AMS in the Zaghar black shale. A summary of the structural information derived from the AMS data for the Nayband Formation in the Zaghar area is illustrated in Figure 17a, in which the inferred magnetic lineation is dominantly SW-trending (204°, 13°) and the foliation (normal to K3) dips extremely toward the south (76°, 5°). Here, the lineation is dominant (Figure 17b). According to [12], the consistent sub-horizontal lineation (K1) and variable sub-vertical K3 confirm the extensional settings in which the direction of lineation is parallel to the azimuth of extension. Consequently, δ1 represents subvertical lithostatic compression, and δ3 defines the direction of crustal extension. Magnetic lineations in extensional settings have been defined by the crenulation of the clay minerals (i.e., paramagnetic minerals) parallel to the stretching direction [80] or by the intersection axis resulting from the girdling of phyllosilicate basal planes parallel to the stretching direction [81,82].
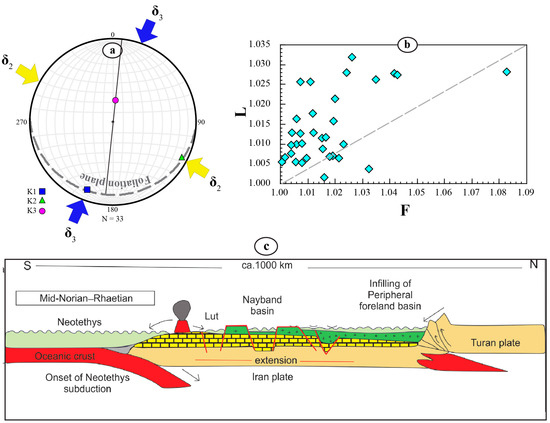
Figure 17.
(a) Summary of the structural information derived from the AMS data for the Nayban Formation in the Zaghar area. (b) Plot of L (lineation) versus F (foliation) [79]. (c) Geodynamic model for the deposition of the Nayband Formation in the southwestern margin of CEIM in an active continental margin following the Neotethys subduction [83].
The Upper Triassic (Norian-Rhaetian) Nayband Formation is situated at the southwestern margin of the Central East Iranian Microcontinent and records Eo-Cimmerian events [83]. Therefore, it seems the magnetic fabric orientations of the Nayband Formation (i.e., sub-horizontal K1 and sub-vertical K3) indicate that δ1 was vertical and is representative of lithostatic compression (Figure 17a). Earlier studies have suggested that up to 3000 m-thick marine Norian-Rhaetian sediments of the Nayband Formation were deposited in WNW–ESE-trending extensional basins [84] (Figure 17c). Our findings from the magnetic fabrics of this formation demonstrate that the magnetic lineations acquired in the early stages of deformation for the extensional regimes can persevere, even in the presence of later tectonic events.
6.2. Mafic Dyke Crosscutting the Nayband Formation
The microgabbroic-diabasic dyke crosscutting the Nayband Formation with a general NW–SE striking in the field preserves well-clustered AMS vectors (Figure 6a) and displays shallowly NW-plunging K3 values, highly NE-plunging K1 values, and shallowly SW-plunging K2 values. A summary of the structural information derived from the AMS data for this mafic dyke (Figure 18a) illustrates that the AMS data define a strongly NE–SW dipping foliation associated with steeply NE-plunging lineation. The samples are neither foliation nor lineation dominant (Figure 18b). According to [85], the investigated dyke shows normal magnetic fabric due to the approximate parallelism of the magnetic foliation and lineation to the dyke plane.
The magnetic lineation of the dyke is mostly nearly vertical (Figure 6b). Consequently, the dyke magma propagated through a vertical flow, and it was a probable feeder zone. On the other side, the sub-vertical fabric is consistent with high tectonic compression, in which the dominant stress (δ1) should have been sub-horizontal and the weakest stress (δ2) is sub-vertical (Figure 18a). In [86], the petrology of the same mafic dykes in the east of Tafresh was studied and they were attributed to intra-plate alkaline basalts. In [51], a paleostress analysis was conducted according to the fault-slip data and trajectory of dykes in the Salafchegan area, west of Qom. The authors assumed that the NS-striking dykes in this area were injected in the NE–SW maximum horizontal stress direction due to right-lateral transpression from the Miocene to the present (Figure 18c). The inferred shortening direction, which is responsible for significant thin-skinned folding and thrusting, is consistent with the start of Neotethys subduction at the southern margin of the Iran Plate and matches the shortening direction proposed by [87] for subduction-related magmatism in the UDMA. This information confirms the major shortening trend proposed by [88], as well as the regional stress field of NW–SE convergence (arc-parallel stretching).
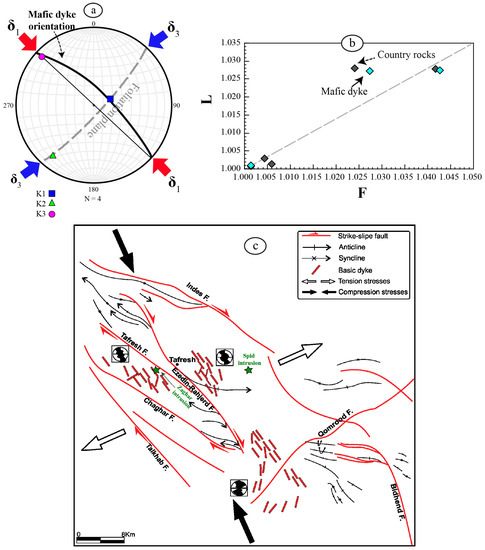
Figure 18.
(a) Summary of the structural information derived from the AMS data for the Mafic dyke crosscutting the Nayband Formation. (b) Plot of L (lineation) vs. F (foliation) [79]. (c) Structural map and the main stress vectors in the studied area. The major shortening trend is based on [88].
6.3. Diorites and Microdioritic Dyke in Zaghar
Although the AMS measurements of the Zaghar diorites and microdiorites reveal a general moderate plunging to the east in terms of magnetic lineation, as well as a vertical NE–SW striking foliation, in a bid to better understand the AMS distribution of the Zaghar intrusion, the data of the small intrusion of diorites and the felsic dyke were investigated separately (Figure 19a,b). The diorites have a sub-horizontal, NW–SE trending AMS lineation and a sub-vertical NW–SE striking foliation. According to [89], such fabric occurred during emplacement along a syn-magmatic shear zone (e.g., Mono Creek granite). The felsic dyke shows poor clustering of K1 but a general NE orientation consistent with the observed magnetic lineation of the diorites (Figure 19b). These samples are neither strongly oblate (foliation dominant), nor strongly prolate (lineation dominant) (Figure 19c).

Figure 19.
(a,b) Summary of the structural information derived from the AMS data for the diorites and the felsic dyke in Zaghar, respectively. (c) Plot of L (lineation) vs. F (foliation) [79].
The Tafresh area was subjected to the main NE–SW stress parallel to the compression of the Eurasian–Arabian block convergence. The intrusions in the Zaghar are surrounded by some trust faults: Tafresh to the north and Chaghar and Talkhab to the south (Figure 18c). Their mean strikes vary from N130E to N150W, with an average dip of 50° to the southwest [90]. These faults, which are parallel to the regional tectonic fabric of the UDMA, were active in the Miocene through strike-slip movements [91]. In this regard, the formation of extensional voids or tensional gashes played a crucial role in the emplacement of magma in the region [92]. The geological context and earlier AMS results obtained from [32] suggest that the neighboring Sarbadan and Ghahan granitoids in the central part of the UDMA were emplaced through a similar mechanism.
In [93], the effects of the Ezedin-Rahjerd thrust fault in the Tafresh were investigated for changes in the main structure trends, such as reverse faults, fold axes bending, and the formation of minor structures (Figure 18c). The cited structures had a different trend from those in the UDMA. Parallel dykes were classified into two sets: (1) the older and mafic dykes with a dominant trend of N40–45W that were injected as a result of the main structures of the UDMA; and (2) the felsic and subvolcanic dykes with a dominant trend of N20–30E that were formed in tension fractures caused by Ezedin-Rahjerd transverse fault activity. This classification is comparable to the dyke sets reported by [51], who stated the EW-striking dykes in this area were probably injected after folding and due to clockwise rotation stress axes. The latter regime sheared the folds and rotated them to a Z-shape geometry. The studied microdioritic dyke with a general EW to NE–EW strike is just one of several felsic dykes reported in the Eocene rocks of the Zaghar and Tafresh areas [45,51]. It was probably formed by the development of tension fractures with a N20–30E trend that is not unexpected in such a right lateral transverse fault zone. It means the strain regime has remained NW–SE compressional after the emplacement of the main intrusions.
6.4. Spid Intrusion
Since the Spid pluton is subject to subsequent secondary processes, like deformation and hydrothermal alteration, the obtained magnetic fabric should be interpreted with more attention. Magnetic susceptibility magnitude correlates with the observed evidence of alterations in the field and petrography. Propylitic samples have increased anisotropy, while fresh rocks have oblate ellipsoids and are slightly anisotropic. According to rock magnetic analysis and thermomagnetic curves, magnetite and hematite are the main carriers of AMS in the fresh and altered quartz diorites, respectively.
Most samples in the Spid intrusion exhibit well-clustered AMS vectors (Figure 9a), and the majority of p values are near-isotropic (p < 1.05) to weakly anisotropic (Figure 8d). Although there is some variation in the orientation of K1 and K2, the general structural information derived from the AMS data shows moderately NW-plunging K3 values, shallowly S-plunging K1 values, and moderately NE-plunging K2 values (Figure 9a). As previously mentioned, interaction with hydrothermal fluids and the subsequent mineralogical changes cause the K1 and K2 of some samples to be mixed (Figure 10b). The fabrics are foliation-dominant (Figure 9a and Figure 20d), so the AMS data are divided into two subsets based on the lineation’s plunge. The majority of the samples with a moderate NE–SW trending foliation but predominantly SSE-plunging lineation belong to the first subset (Figure 20a). In this case, the shallow-plunging lineation (K1) is oblique (80°) to the inferred axis of shortening (defined by K3), so we interpret this main fabric as the result of sinistral transpression (Figure 20c). Rather than simply representing an Eocene volcanic trend, the UDMA is interpreted here as a well-organized transpressional belt that accommodated a significant amount (~38 km) of late Miocene–Holocene shortening [91]. Structural analysis of the thrust faults, folds, and dyke orientations has revealed a transpression tectonic event in this part of the UDMA [91]. Many authors have proposed models to explain the emplacement of granitoids within the UDMA. Most of these models evoke the transpressional context, e.g., [32].
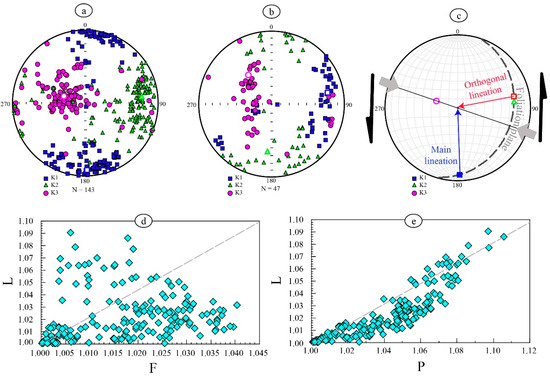
Figure 20.
AMS data for samples from the Spid pluton. (a) Stereonet in which the three AMS tensors are plotted for the specimens with south-plunging K1. (b) Stereonet with AMS tensors for the specimens with NE-plunging. (c) Summary of the structural information derived from the AMS data. (d) Plot of L (lineation) vs. F (foliation) [79]. (e) Plot of L (lineation) vs. P (anisortopy).
The second set of samples has a well-clustered K3 but is associated with shallow NE–SW plunging K1 values and variable NNE–SSE plunging K2 values (Figure 20b). It indicates that the K1 and K2 of the latter fabric have been mixed, which is consistent with a purer foliation. The second cluster is inferred as a shear strike-slip component, oriented roughly normally in the shortening direction. As previously stated, the samples from the aforementioned sites show evidence of hydrothermal alteration, with a clear decrease in Km due to converting magnetite to hematite. These samples exhibit relatively lower grain density and higher porosity, too (Figure 14a,b). The oblique relationship between the shear zone and second magnetic lineations (for the argillic-altered sites) suggests ore- bearing fluids have passed through an E–W orientated conduit. Since the lineation was strengthened with the increases in magnetic anisotropy (Figure 20e), the statins were active during the development of the second fabric. As a consequence, as regional deformation shifted from sinistral transpression to sinistral strike-slip, the second fabric likely overprinted the dominant fabric. This implies that structures like strike-slip faults facilitated the passing of hydrothermal fluids through the intrusion and created the resultant Fe deposit. The samples with a higher degree of alteration exhibit a relatively lower grain density and higher porosity.
7. Conclusions
This study provides a comprehensive analysis of the physical and magnetic properties of various rocks in the central Urumieh-Dokhtar magmatic arc. The findings shed light on how magnetic characteristics can be used to evaluate structural data and comprehend temporal tectono-magmatic evolution.
- The AMS database revealed an extensional regime during the formation of shale and sandstone in the Nayband Formation, consistent with previous tectonic settings inferred from paleogeography and paleotectonic history. The findings from magnetic fabric analysis of this formation indicate that the magnetic lineations formed during the initial phases of deformation in extensional regimes can endure, even when subsequent tectonic events occur.
- The vertical magnetic lineation of the mafic dyke is aligned with a major shortening trend proposed by previous studies and the regional stress field of NW–SE convergence in the UDMA.
- A sub-horizontal NW–SE trending lineation and a sub-vertical NW–SE striking foliation from the AMS results of diorites in the Zaghar reveal the intrusions emplaced along some tensional spaces that were developed between two thrusts of the Tafresh and Chaghar faults. The microdioritic dykes that occurred in this area were consistent with NNE–SSW shortening, which was particularly well-developed from the late Miocene onward.
- Detailed investigations of the Spid pluton provide conclusive evidence that the mineralogical changes in the altered samples have, indeed, resulted in modifications to their magnetic susceptibility, grain density, and porosity. While the magnetic fabrics within the intrusion are predominantly foliation-dominant, they can be classified into two subsets based on the plunge of the lineation. The oblique relationship between the shear zone and the second magnetic lineations in the altered samples of the Spid intrusion, as well as the reinforcement of the magnetic lineations with increasing magnetic anisotropy, provide evidence of the development of secondary fabrics resulting from the flow of hydrothermal fluids through an E–W oriented conduit. Therefore, one of the outstanding advantages of the AMS method is its ability to serve as a valuable tool for quantifying the structural controls on mineralization and for exploring prospective areas.
- Paleomagnetic investigations demonstrate that the Spid and Zaghar massifs had similar average directions with mostly reverse polarity, indicating that they experienced the same dominant polarity chron and tectonic rotation after acquiring ChRM. The study proposes that the massifs underwent a northward tilting of approximately 30° around an EW axis after the Early Miocene. However, it was not possible to determine the likelihood of rotation around a vertical axis due to the lack of sufficient paleohorizontal constraints. The study also noted that post-Eocene rotations in the area were typically within ±20°, which did not significantly impact the estimation of the northward tilting of both massifs.
Supplementary Materials
The following supporting information can be downloaded at: https://www.mdpi.com/article/10.3390/geosciences13090275/s1, Table S1: ChRM directions measured by PCA method for the previous Spid samples (Rahimi, 2017).; Table S2: ChRM directions measured by PCA method for Spid samples (This study); Table S3:ChRM directions measured by PCA method for Zaghar samples; Table S4: Summary of all used ChRM directions and associated statistical analysis from Spid pluton; Table S5: Petrophysical data of the special core analyses 50 for the studied intrusions in Tafresh;. All the analytical data are presented in the paper, including the Supplementary Materials.
Author Contributions
Conceptualization, M.S., P.R. and H.M.; Methodology, P.R., M.S. and F.D.; Software, M.S., N.R. and P.R.; Validation, P.R. and F.D.; Formal Analysis, P.R. and F.D.; Investigation, M.S.; Resources, M.S. and P.R.; Data Curation, M.S. and P.R.; Writing—Original Draft Preparation, M.S. and N.R.; Writing—Review and Editing, P.R. and H.M.; Visualization, M.S., N.R., and P.R.; Supervision, M.S.; Project Administration, M.S.; Funding Acquisition, M.S. and P.R. All authors have read and agreed to the published version of the manuscript.
Funding
This research received no external funding.
Acknowledgments
This research has been supported by the Center for International Scientific Studies and Collaboration (CISSC) and the French Embassy in Iran, through the Gundishapur PHC program. The authors would like to acknowledge the financial support of Shahrood University of Technology for the field work. Edris Bakhtavar is highly appreciated for his valuable contribution to the core sampling.
Conflicts of Interest
The authors declare no conflict of interest.
References
- Rochette, P.; Jackson, M.; Aubourg, C. Rock magnetism and the interpretation of anisotropy of magnetic susceptibility. Rev. Geophys. 1992, 30, 209–226. [Google Scholar] [CrossRef]
- Bouchez, J.L. Granite is never isotropic: An introduction to AMS studies of granitic rocks. In Granite: From Segregation of Melt to Emplacement Fabrics; Springer: Berlin/Heidelberg, Germany, 1997; pp. 95–112. [Google Scholar]
- Nédélec, A.; Bouchez, J.-L. Granites: Petrology, Structure, Geological Setting, and Metallogeny; OUP: Oxford, UK, 2015. [Google Scholar]
- Seifivand, A.; Sheibi, M. Ballooning emplacement and alteration of the Chah-Musa subvolcanic intrusion (NE Iran) inferred from magnetic susceptibility and fabric. Geol. Mag. 2020, 157, 621–639. [Google Scholar] [CrossRef]
- Duermeijer, C.; Nyst, M.; Meijer, P.T.; Langereis, C.; Spakman, W. Neogene evolution of the Aegean arc: Paleomagnetic and geodetic evidence for a rapid and young rotation phase. Earth Planet. Sci. Lett. 2000, 176, 509–525. [Google Scholar] [CrossRef]
- Kaymakcı, N.; Langereis, C.; Özkaptan, M.; Özacar, A.A.; Gülyüz, E.; Uzel, B.; Sözbilir, H. Paleomagnetic evidence for upper plate response to a STEP fault, SW Anatolia. Earth Planet. Sci. Lett. 2018, 498, 101–115. [Google Scholar] [CrossRef]
- Lazos, I.; Sboras, S.; Chousianitis, K.; Kondopoulou, D.; Pikridas, C.; Bitharis, S.; Pavlides, S. Temporal evolution of crustal rotation in the Aegean region based on primary geodetically-derived results and palaeomagnetism. Acta Geod. Geophys. 2022, 57, 317–334. [Google Scholar] [CrossRef]
- van Hinsbergen, D.J.; Dekkers, M.J.; Bozkurt, E.; Koopman, M. Exhumation with a twist: Paleomagnetic constraints on the evolution of the Menderes metamorphic core complex, western Turkey. Tectonics 2010, 29, TC3009. [Google Scholar] [CrossRef]
- Cañón-Tapia, E.; Chávez-Álvarez, M. Rotation of uniaxial ellipsoidal particles during simple shear revisited: The influence of elongation ratio, initial distribution of a multiparticle system and amount of shear in the acquisition of a stable orientation. J. Struct. Geol. 2004, 26, 2073–2087. [Google Scholar] [CrossRef]
- Tauxe, L.; Gee, J.; Staudigel, H. Flow directions in dikes from anisotropy of magnetic susceptibility data: The bootstrap way. J. Geophys. Res. Solid Earth 1998, 103, 17775–17790. [Google Scholar] [CrossRef]
- Aranguren, A.; Cuevas, J.; Tubia, J.; Román-Berdiel, T.; Casas-Sainz, A.; Casas-Ponsati, A. Granite laccolith emplacement in the Iberian arc: AMS and gravity study of the La Tojiza pluton (NW Spain). J. Geol. Soc. 2003, 160, 435–445. [Google Scholar] [CrossRef]
- Burton-Johnson, A.; Macpherson, C.; Muraszko, J.; Harrison, R.; Jordan, T.A. Tectonic strain recorded by magnetic fabrics (AMS) in plutons, including Mt Kinabalu, Borneo: A tool to explore past tectonic regimes and syn-magmatic deformation. J. Struct. Geol. 2019, 119, 50–60. [Google Scholar] [CrossRef]
- Austin, J.; McFarelane, H.; Schlegel, T.; Patterson, B.; Birchall, R.; Walshe, J.; Björk, A.; Shelton, T. Tectono-Metasomatic History and Structural Controls of the Ernest Henry Iron Oxide-Copper-Gold (IOCG) Deposit: Insights from Integrated Mineralogy and Magnetic Fabric Studies; CSIRO: Canberra, Australia, 2021; p. 66. [Google Scholar]
- Burton-Johnson, A.; Riley, T.; Harrison, R.; Mac Niocaill, C.; Muraszko, J.; Rowley, P. Does tectonic deformation control episodic continental arc magmatism? Evidence from granitic magnetic fabrics (AMS). Gondwana Res. 2022, 112, 1–23. [Google Scholar] [CrossRef]
- Finizola, A.; Sortino, F.; Lénat, J.-F.; Valenza, M. Fluid circulation at Stromboli volcano (Aeolian Islands, Italy) from self-potential and CO2 surveys. J. Volcanol. Geotherm. Res. 2002, 116, 1–18. [Google Scholar] [CrossRef]
- Hurwitz, S.; Garfunkel, Z.; Ben-Gai, Y.; Reznikov, M.; Rotstein, Y.; Gvirtzman, H. The tectonic framework of a complex pull-apart basin: Seismic reflection observations in the Sea of Galilee, Dead Sea transform. Tectonophysics 2002, 359, 289–306. [Google Scholar] [CrossRef]
- Hase, H.; Hashimoto, T.; Sakanaka, S.y.; Kanda, W.; Tanaka, Y. Hydrothermal system beneath Aso volcano as inferred from self-potential mapping and resistivity structure. J. Volcanol. Geotherm. Res. 2005, 143, 259–277. [Google Scholar] [CrossRef]
- Pola, A.; Crosta, G.; Fusi, N.; Barberini, V.; Norini, G. Influence of alteration on physical properties of volcanic rocks. Tectonophysics 2012, 566, 67–86. [Google Scholar] [CrossRef]
- Pola, A.; Crosta, G.B.; Fusi, N.; Castellanza, R. General characterization of the mechanical behaviour of different volcanic rocks with respect to alteration. Eng. Geol. 2014, 169, 1–13. [Google Scholar] [CrossRef]
- Mehegan, J.M.; Robinson, P.T.; Delaney, J.R. Secondary mineralization and hydrothermal alteration in the Reydarfjordur drill core, eastern Iceland. J. Geophys. Res. Solid Earth 1982, 87, 6511–6524. [Google Scholar] [CrossRef]
- Cox, M.E.; Browne, P. Hydrothermal alteration mineralogy as an indicator of hydrology at the Ngawha geothermal field, New Zealand. Geothermics 1998, 27, 259–270. [Google Scholar] [CrossRef]
- Lumb, P. Engineering properties of fresh and decomposed igneous rocks from Hong Kong. Eng. Geol. 1983, 19, 81–94. [Google Scholar] [CrossRef]
- Arel, E.; Tugrul, A. Weathering and its relation to geomechanical properties of Cavusbasi granitic rocks in northwestern Turkey. Bull. Eng. Geol. Environ. 2001, 60, 123–133. [Google Scholar]
- Begonha, A.; Braga, M.S. Weathering of the Oporto granite: Geotechnical and physical properties. Catena 2002, 49, 57–76. [Google Scholar] [CrossRef]
- Arıkan, F.; Ulusay, R.; Aydın, N. Characterization of weathered acidic volcanic rocks and a weathering classification based on a rating system. Bull. Eng. Geol. Environ. 2007, 66, 415–430. [Google Scholar] [CrossRef]
- Chang, C.; Zoback, M.D.; Khaksar, A. Empirical relations between rock strength and physical properties in sedimentary rocks. J. Pet. Sci. Eng. 2006, 51, 223–237. [Google Scholar] [CrossRef]
- Kahraman, S.; Gunaydin, O.; Fener, M. The effect of porosity on the relation between uniaxial compressive strength and point load index. Int. J. Rock Mech. Min. Sci. 2005, 42, 584–589. [Google Scholar] [CrossRef]
- Sousa, R.; Guilhermino, L.; Antunes, C. Molluscan fauna in the freshwater tidal area of the River Minho estuary, NW of Iberian Peninsula. Ann. Limnol. Int. J. Limnol. 2005, 41, 141–147. [Google Scholar] [CrossRef]
- Tamrakar, N.K.; Yokota, S.; Shrestha, S.D. Relationships among mechanical, physical and petrographic properties of Siwalik sandstones, Central Nepal Sub-Himalayas. Eng. Geol. 2007, 90, 105–123. [Google Scholar] [CrossRef]
- Ceryan, S.; Tudes, S.; Ceryan, N. Influence of weathering on the engineering properties of Harsit granitic rocks (NE Turkey). Bull. Eng. Geol. Environ. 2008, 67, 97–104. [Google Scholar] [CrossRef]
- Mirnejad, H.; Raeisi, D.; McFarlane, C.; Sheibi, M. Tafresh intrusive rocks within the urumieh-dokhtar magmatic arc: Appraisal of neo-tethys subduction. Geol. J. 2019, 54, 1745–1755. [Google Scholar] [CrossRef]
- Raeisi, D.; Mirnejad, H.; Sheibi, M. Emplacement mechanism of the Tafresh granitoids, central part of the Urumieh–Dokhtar Magmatic Arc, Iran: Evidence from magnetic fabrics. Geol. Mag. 2019, 156, 1510–1526. [Google Scholar] [CrossRef]
- Hosseinian, A. Using Magnetic Susceptibility Anisotropy (AMS) Technique for Evaluating the Magnetic Susceptibility and the Alteration Associated with Fe Mineralization in Moushakieh Intrusive Pluton (Northwest Qom); University of Tehran: Tehran, Iran, 2017. [Google Scholar]
- Karamian, M. The Study of the Spid Iron Deposit Genesis by Using a Combination of Geochemical, Geophysical and Petrographic Data; University of Tehran: Tehran, Iran, 2015. [Google Scholar]
- Rahimi, N. Using Anisotropy of Magnetic Susceptibility (AMS) Technique for the Identification of Hydrothermal Alteration Passages in the Intrusive Body Associated with Spid Iron Deposit (West Qom); University of Tehran: Tehran, Iran, 2017. [Google Scholar]
- Stöcklin, J. Structural history and tectonics of Iran: A review. AAPG Bull. 1968, 52, 1229–1258. [Google Scholar]
- Berberian, M.; King, G. Towards a paleogeography and tectonic evolution of Iran: Reply. Can. J. Earth Sci. 1981, 18, 1764–1766. [Google Scholar] [CrossRef]
- Berberian, F.; Muir, I.; Pankhurst, R.; Berberian, M. Late Cretaceous and early Miocene Andean-type plutonic activity in northern Makran and Central Iran. J. Geol. Soc. 1982, 139, 605–614. [Google Scholar] [CrossRef]
- Alavi, M. Tectonics of the Zagros orogenic belt of Iran: New data and interpretations. Tectonophysics 1994, 229, 211–238. [Google Scholar] [CrossRef]
- Dercourt, J.; Zonenshain, L.; Ricou, L.-E.; Kazmin, V.; Le Pichon, X.; Knipper, A.; Grandjacquet, C.; Sbortshikov, I.; Geyssant, J.; Lepvrier, C.; et al. Geological evolution of the Tethys belt from the Atlantic to the Pamirs since the Lias. Tectonophysics 1986, 123, 241–315. [Google Scholar] [CrossRef]
- Alavi, M. Regional stratigraphy of the Zagros fold-thrust belt of Iran and its proforeland evolution. Am. J. Sci. 2004, 304, 1–20. [Google Scholar] [CrossRef]
- Agard, P.; Omrani, J.; Jolivet, L.; Whitechurch, H.; Vrielynck, B.; Spakman, W.; Monié, P.; Meyer, B.; Wortel, R. Zagros orogeny: A subduction-dominated process. Geol. Mag. 2011, 148, 692–725. [Google Scholar] [CrossRef]
- Hajian, H. Geological Map of the Tafresh Area: Tehran; Geological Survey of Iran: Tehran, Iran, 1977.
- Radfar, J.; Kohansal, R.; Hadjian, J. Geological Quadrangle Map of Farmahin; Geological Survey of Iran: Tehran, Iran, 2006; p. 5959.
- Kazemi Mehrnia, M.; Hajian, J.; Ghorbani, M. Geological Map of Saidiyeh; Geological Survey of Iran: Tehran, Iran, 2015; p. 5959.
- Shahhosseini, A.; Alipour-Asll, M.; Hosseina, L.; Bahar-Firouzi, K. Geology, mineralization, fluid inclusion, and stable isotope characteristics of the Zaghar and Sarabadan Cu-(Au) skarn deposits, Tafresh, Central Iran. Ore Geol. Rev. 2020, 124, 103646. [Google Scholar] [CrossRef]
- Emami, M.; Hajian, J. Geological map of the Qom, Scale 1: 250,000. Geol. Surv. Iran Sheet No. NI 1991, 39–46. [Google Scholar]
- Babazadeh, S.; Raeisi, D.; D’Antonio, M.; Zhao, M.; Long, L.E.; Cottle, J.M.; Modabberi, S. Petrogenesis of Miocene igneous rocks in the Tafresh area (central Urumieh-Dokhtar magmatic arc, Iran): Insights into mantle sources and geodynamic processes. Geol. J. 2022, 57, 2884–2903. [Google Scholar] [CrossRef]
- Verdel, C.; Wernicke, B.P.; Hassanzadeh, J.; Guest, B. A Paleogene extensional arc flare-up in Iran. Tectonics 2011, 30, TC3008. [Google Scholar] [CrossRef]
- Ghorbani, M.R.; Graham, I.T.; Ghaderi, M. Oligocene–Miocene geodynamic evolution of the central part of Urumieh-Dokhtar Arc of Iran. Int. Geol. Rev. 2014, 56, 1039–1050. [Google Scholar] [CrossRef]
- Bazgir, E.; Alavi, S.A.; Ehteshami Moinabadi, M.; Ebadi, L. Stress regime change from Miocene to pliocene-Quaternary and its relationship with structures and dykes emplacement in thd Salafchegan area Oroumiyeh-Dokhtar magmatic belt. J. Tecton. 2018, 2, 15–25. [Google Scholar]
- Knight, M.D.; Walker, G.P. Magma flow directions in dikes of the Koolau Complex, Oahu, determined from magnetic fabric studies. J. Geophys. Res. Solid Earth 1988, 93, 4301–4319. [Google Scholar] [CrossRef]
- Tarling, D.; Hrouda, F. The Magnetic Anisotropy of Rocks; Chapman & Hall: London, UK, 1993; 217p. [Google Scholar]
- Kouémo, J.T.; Njanko, T.; Kwékam, M.; Naba, S.; Nké, B.E.B.; Sandjo, A.F.Y.; Fozing, E.M.; Njonfang, E. Kinematic evolution of the Fodjomekwet-Fotouni Shear Zone (West-Cameroon): Implications for emplacement of the Fomopéa and Bandja plutons. J. Afr. Earth Sci. 2014, 99, 261–275. [Google Scholar] [CrossRef]
- Owens, W. Mathematical model studies on factors affecting the magnetic anisotropy of deformed rocks. Tectonophysics 1974, 24, 115–131. [Google Scholar] [CrossRef]
- Guillet, P.; Bouchez, J.L.; Wagner, J.J. Anisotropy of magnetic susceptibility and magmatic structures in the Guérande granite massif (France). Tectonics 1983, 2, 419–429. [Google Scholar] [CrossRef]
- Bouchez, J.L.; Gleizes, G.; Djouadi, T.; Rochette, P. Microstructure and magnetic susceptibility applied to emplacement kinematics of granites: The example of the Foix pluton (French Pyrenees). Tectonophysics 1990, 184, 157–171. [Google Scholar] [CrossRef]
- Jelinek, V. Characterization of the magnetic fabric of rocks. Tectonophysics 1981, 79, T63–T67. [Google Scholar] [CrossRef]
- Mertanen, S.; Karell, F. Palaeomagnetic and AMS studies on Satulinmaki and Koijarvi fault and shear zones. Geol. Surv. Finl. Spec. Pap. 2012, 52, 195–226. [Google Scholar]
- Kirschvink, J. The least-squares line and plane and the analysis of palaeomagnetic data. Geophys. J. Int. 1980, 62, 699–718. [Google Scholar] [CrossRef]
- Cogné, J. PaleoMac: A Macintosh™ application for treating paleomagnetic data and making plate reconstructions. Geochem. Geophys. Geosyst. 2003, 4, 34–67. [Google Scholar] [CrossRef]
- Fisher, R.A. Dispersion on a sphere. Proc. R. Soc. London. Ser. A Math. Phys. Sci. 1953, 217, 295–305. [Google Scholar] [CrossRef]
- Lattard, D.; Engelmann, R.; Kontny, A.; Sauerzapf, U. Curie temperatures of synthetic titanomagnetites in the Fe-Ti-O system: Effects of composition, crystal chemistry, and thermomagnetic methods. J. Geophys. Res. Solid Earth 2006, 111, B12S28.1–B12S28.18. [Google Scholar] [CrossRef]
- Dunlop, D.J.; Özdemir, Ö. Rock Magnetism: Fundamentals and Frontiers; Cambridge University Press: Cambridge, UK, 1997. [Google Scholar]
- Bouchez, J.L.; Delas, C.; Gleizes, G.r.; Nédélec, A.; Cuney, M. Submagmatic microfractures in granites. Geology 1992, 20, 35–38. [Google Scholar] [CrossRef]
- Rochette, P. Magnetic susceptibility of the rock matrix related to magnetic fabric studies. J. Struct. Geol. 1987, 9, 1015–1020. [Google Scholar] [CrossRef]
- Sheibi, M.; Bouchez, J.; Esmaeily, D.; Siqueira, R. The Shir-Kuh pluton (Central Iran): Magnetic fabric evidences for the coalescence of magma batches during emplacement. J. Asian Earth Sci. 2012, 46, 39–51. [Google Scholar] [CrossRef]
- Rochette, P.; Aubourg, C.; Perrin, M. Is this magnetic fabric normal? A review and case studies in volcanic formations. Tectonophysics 1999, 307, 219–234. [Google Scholar] [CrossRef]
- Day, R.; Fuller, M.; Schmidt, V. Hysteresis properties of titanomagnetites: Grain-size and compositional dependence. Phys. Earth Planet. Inter. 1977, 13, 260–267. [Google Scholar] [CrossRef]
- Dunlop, D. Theory and application of the Day plot ([M. sub. rs]/[M. sub. s] versus [H. sub. cr]/[H. sub. c]), 2. Application to data for rocks. J. Geophys. Res. 2002, 107, 2057. [Google Scholar] [CrossRef]
- Astudillo, N.; Roperch, P.; Townley, B.; Arriagada, C.; Maksaev, V. Importance of small-block rotations in damage zones along transcurrent faults. Evidence from the Chuquicamata open pit, Northern Chile. Tectonophysics 2008, 450, 1–20. [Google Scholar] [CrossRef]
- Krása, D.; Herrero-Bervera, E. Alteration induced changes of magnetic fabric as exemplified by dykes of the Koolau volcanic range. Earth Planet. Sci. Lett. 2005, 240, 445–453. [Google Scholar] [CrossRef]
- Petrovsky, E.; Hulka, Z.; Kapicka, A. A new tool for in situ measurements of the vertical distribution of magnetic susceptibility in soils as basis for mapping deposited dust. Environ. Technol. 2004, 25, 1021–1029. [Google Scholar] [CrossRef] [PubMed]
- Zijderveld, J. AC demagnetization of rocks: Analysis of results. In Developments in Solid Earth Geophysics; Elsevier: Amsterdam, The Netherlands, 2013; pp. 254–286. [Google Scholar]
- Mattei, M.; Cifelli, F.; Muttoni, G.; Zanchi, A.; Berra, F.; Mossavvari, F.; Eshraghi, S.A. Neogene block rotation in central Iran: Evidence from paleomagnetic data. Bulletin 2012, 124, 943–956. [Google Scholar] [CrossRef]
- Mattei, M.; Cifelli, F.; Muttoni, G.; Rashid, H. Post-Cimmerian (Jurassic–Cenozoic) paleogeography and vertical axis tectonic rotations of Central Iran and the Alborz Mountains. J. Asian Earth Sci. 2015, 102, 92–101. [Google Scholar] [CrossRef]
- Song, P.; Ding, L.; Zhang, L.; Cai, F.; Zhang, Q.; Li, Z.; Wang, H.; Jafari, M.K.; Talebian, M. Paleomagnetism From Central Iran Reveals Arabia-Eurasia Collision Onset at the Eocene/Oligocene Boundary. Geophys. Res. Lett. 2023, 50, e2023GL103858. [Google Scholar] [CrossRef]
- Zijderveld, J. The natural remanent magnetizations of the Exeter volcanic traps (Permian, Europe). Tectonophysics 1967, 4, 121–153. [Google Scholar] [CrossRef]
- Flinn, D. On tests of significance of preferred orientation in three-dimensional fabric diagrams. J. Geol. 1958, 66, 526–539. [Google Scholar] [CrossRef]
- Mattei, M.; Speranza, F.; Argentieri, A.; Rossetti, F.; Sagnotti, L.; Funiciello, R. Extensional tectonics in the Amantea basin (Calabria, Italy): A comparison between structural and magnetic anisotropy data. Tectonophysics 1999, 307, 33–49. [Google Scholar] [CrossRef]
- Cifelli, F.; Mattei, M.; Hirt, A.M.; Günther, A. The origin of tectonic fabrics in “undeformed” clays: The early stages of deformation in extensional sedimentary basins. Geophys. Res. Lett. 2004, 31, L09604.1–L09604.4. [Google Scholar] [CrossRef]
- Cifelli, F.; Mattei, M.; Chadima, M.; Hirt, A.M.; Hansen, A. The origin of tectonic lineation in extensional basins: Combined neutron texture and magnetic analyses on “undeformed” clays. Earth Planet. Sci. Lett. 2005, 235, 62–78. [Google Scholar] [CrossRef]
- Etesampour, A.; Mahboubi, A.; Moussavi-Harami, R.; Arzani, N.; Salehi, M.A. Sandstone petrography and geochemistry of the Nayband Formation (Upper Triassic, Central Iran): Implications for sediment provenance and tectonic setting. Austrian J. Earth Sci. 2019, 112, 20–41. [Google Scholar] [CrossRef]
- Fürsich, F.T.; Hautmann, M.; Senowbari-Daryan, B.; Seyed-Emami, K. The Upper Triassic Nayband and Darkuh formations of east-central Iran: Stratigraphy, facies patterns and biota of extensional basins on an accreted terrane. Beringeria 2005, 35, 53–133. [Google Scholar]
- Rochette, P.; Jenatton, L.; Dupuy, C.; Boudier, F.; Reuber, I. Diabase dikes emplacement in the Oman ophiolite: A magnetic fabric study with reference to geochemistry. In Proceedings of the Ophiolite Genesis and Evolution of the Oceanic Lithosphere: Proceedings of the Ophiolite Conference, Muscat, Oman, 7–18 January 1990; Springer: Berlin/Heidelberg, Germany, 1991. [Google Scholar]
- Kazemi, H. Petrology of Dykes in East of Tafresh, Iran; Shahid Beheshti University: Tehran, Iran, 2005. [Google Scholar]
- Arvin, M.; Pan, Y.; Dargahi, S.; Malekizadeh, A.; Babaei, A. Petrochemistry of the Siah-Kuh granitoid stock southwest of Kerman, Iran: Implications for initiation of Neotethys subduction. J. Asian Earth Sci. 2007, 30, 474–489. [Google Scholar] [CrossRef]
- Hessami, K.; Jamali, F.; Tabassi, H. Major Active Faults of Iran: Tehran; International Institute of Earthquake Engineering and Seismology: Tajrish, Iran, 2003. [Google Scholar]
- Titus, S.J.; Clark, R.; Tikoff, B. Geologic and geophysical investigation of two fine-grained granites, Sierra Nevada Batholith, California: Evidence for structural controls on emplacement and volcanism. Geol. Soc. Am. Bull. 2005, 117, 1256–1271. [Google Scholar] [CrossRef]
- Rajabioun, J. Brittle Deformation Analysis in Tafresh Area with Emphasize Paleostress Reconstruction; Tarbiat Modares University: Tehran, Iran, 2000. [Google Scholar]
- Morley, C.K.; Kongwung, B.; Julapour, A.A.; Abdolghafourian, M.; Hajian, M.; Waples, D.; Warren, J.; Otterdoom, H.; Srisuriyon, K.; Kazemi, H. Structural development of a major late Cenozoic basin and transpressional belt in central Iran: The Central Basin in the Qom-Saveh area. Geosphere 2009, 5, 325–362. [Google Scholar] [CrossRef]
- Ramsay, J.G.; Huber, M.I.; Lisle, R.J. The Techniques of Modern Structural Geology: Folds and Fractures; Academic Press: Cambridge, MA, USA, 1983; Volume 2. [Google Scholar]
- Davoodi, Z. Influence of the basement strike-slip fault on the 2005 and 2014 Earthquakes, Qeshm Island, Iran. J. Seismol. Earthq. Eng. 2016, 18, 219–230. [Google Scholar]
Disclaimer/Publisher’s Note: The statements, opinions and data contained in all publications are solely those of the individual author(s) and contributor(s) and not of MDPI and/or the editor(s). MDPI and/or the editor(s) disclaim responsibility for any injury to people or property resulting from any ideas, methods, instructions or products referred to in the content. |
© 2023 by the authors. Licensee MDPI, Basel, Switzerland. This article is an open access article distributed under the terms and conditions of the Creative Commons Attribution (CC BY) license (https://creativecommons.org/licenses/by/4.0/).