Abstract
Nepal is one of the most seismically active regions in the world, as highlighted by the recent devastating 2015, Mw~7.8 Gorkha earthquake, and a robust assessment of seismic hazard is paramount for the design of earthquake-resistant structures. In this study, we present a new probabilistic seismic hazard assessment (PSHA) for Nepal. We considered data and findings from recent scientific publications, which allowed us to develop a unified magnitude homogenized seismicity catalog and propose alternative seismic source characterization (SSC) models including up-to-date parameters of major thrust faults like main frontal thrust (MFT) and main boundary thrust (MBT), while also considering existing SSC models and various seismic hazard modeling strategies within a logic tree framework. The sensitivity analyses show the seismic hazard levels are generally higher for SSC models integrating the major thrust faults, followed by homogenous volume sources and smoothed seismicity approach. The seismic hazard maps covering the entirety of Nepal are presented as well as the uniform hazard spectra (UHS) for five selected locations (Kathmandu, Pokhara, Biratnagar, Nepalganj, and Dipayal) at return periods of 475- and 2475-years considering Vs,30 = 760 m/s. The results obtained are generally consistent with most recent studies. However, a notable variability in seismic hazard levels and several discrepancies with respect to the Nepal Building Building Code NBC105: 2020 and global hazard model, GEM are noted, and possible causes are discussed.
1. Introduction
Nepal is one of the most tectonically active regions of the world characterized by a rapid crustal deformation mainly due to rather rapid convergence between Indian and Eurasian plates, with shortening rates of 18–21 mm/year [1,2,3]. This active convergence region has recorded some of the largest magnitude earthquakes in an inter-plate continental context (e.g., recently the 2015 Mw~7.8 Gorkha earthquake, 1934 Mw~8.0 Bihar earthquake). In addition, it is believed that the Himalayan region has the potential to initiate megathrust earthquakes like the historical event that occurred on June 6, 1505, with an estimated moment magnitude up to 8.5 [2,4]. One of the particularities of earthquakes in the Himalayan region, unlike other subduction-like domains, is their shallow focal depths (<20–40 km), which usually initiate within the Main Himalayan Thrust (MHT) and propagate southward to the large faults of the Main Frontal Thrust (MFT) or the Main Boundary Thrust (MBT). These relatively shallow depth and high magnitude events pose a very high seismic risk issue for Nepal [5]. Recent studies (e.g., [5]) mention the fact that the most dominant and destructive earthquakes that occurred in the Himalayan megathrust faults are of rather shallow focal depth (in range ~10 km). Moreover, the recent major earthquake (Gorkha, Mw~7.8, 2015) was reported to have a focal depth of around 5–10 km [5]. Thus, this particularity of shallow depth events is clearly an ingredient that contributes to the higher seismic hazard and seismic risk for Nepal and the surrounding region.
Assessing credible seismic hazard estimations for Nepal is a critical step to prepare, prevent, and minimize the damages due to earthquakes. The need for credible seismic hazard assessment was highlighted through several recent seismic hazard studies ([6,7,8,9,10]) and the recent revision of the national seismic building code of Nepal NBC105: 2020 [11]. These recent studies improved the seismic hazard assessment for Nepal. However, several key elements for state-of-the-art practice to conduct probabilistic seismic hazard assessment are yet to be explored, challenged, and reviewed to attain a comprehensive and up-to-date seismic hazard assessment for Nepal.
Among the recent PSHA models, the seismic source model integrated with Global Hazard Model (GEM) [12] is adapted from a study conducted at the scale of the Indian sub-continent by [13] and based on large scale area source zones which also includes deep seismogenic sources (up to 25–70 km) seems to be clearly not appropriate given the seismotectonic context of Nepal based on recent findings (for e.g., [14]). Most seismic hazard studies previously performed relied on one single area-based source seismic hazard model (e.g., [7,10]) without sufficient consideration of uncertainties in terms of geometry, depth, and other seismic parameters. The recent PSHA study [6] conducted specially for the new national building code of Nepal (in the seismic building code improvement efforts after the 2015 Gorkha earthquake) is a step toward a new seismic hazard model for Nepal. However, one of the main limitations of the study [6] is that the integrated model considers the MHT as the main controlling seismic source, without considering alternative seismic source models. The recent works by [8,15] in the context of Nepal also mark important improvement in terms of consideration of alternative source models and even individual faults in some recent studies, [8] albeit limitations notably in terms of completeness of fault databases, consideration of comprehensive seismic catalog and propagation of uncertainties. PSHA calculation involves considering the occurrence of multiple earthquake rupture scenarios and their uncertainties in a probabilistic manner to evaluate the probability of exceeding several ground motion levels over a certain time for a given site. Although the original methodology of PSHA calculation from Cornell [16] is well established, it continues to be improved with several recent advances notably in terms of propagation of both aleatory and epistemic uncertainties [17]. Epistemic uncertainty is considered to address for lack of knowledge or limited data while aleatory uncertainty addresses the natural randomness in the earthquake process [18]. Epistemic uncertainty is generally represented through model uncertainty and parametric uncertainty. In this study, they are considered through consideration of alternative seismic source models, the definition of the range of seismic parameters, methods of seismic rate computations (e.g., Poissonian or characteristic approaches), ground motion models, etc. Epistemic uncertainty is expected to be decreased over time as more data become available and as the models become refined based on new data. On the other hand, the aleatory uncertainties are considered for example through Monte Carlo propagation on a range of seismic parameters (on hypocentral depths, magnitude, etc.), to simulate the randomness of the earthquake process (like spatial uncertainty, time uncertainty, ground motion uncertainty, etc.), which in principle does not evolve over time. Thus, this study attempts to consider these latest advancements in terms of PSHA methods to improve PSHA for Nepal Himalayas. Moreover, through this study, we try to valorize recent data and findings for Nepal Himalayas to offer improvement notably through the incorporation of an up-to-date earthquake catalog, consideration of major fault sources, existing and alternative source models, and ground motion models.
The adaptation and enforcement of credible seismic hazard estimations through the building code provisions are paramount to prevent or minimize the damage of buildings and catastrophic losses due to earthquakes. In this study, we attempt to propose new alternative PSHA source models with the objective to contribute towards comprehensive seismic hazard studies for Nepal and potentially for the rational evolutions in seismic provisions within the future version of the Nepalese building code (NBC). Hence, we perform a comparative evaluation of the uniform hazard spectra (UHS) obtained in this study with the design spectra proposed in the recent national building code NBC105:2020 [11] to assess the potential causes for differences.
2. Geodynamics and Seismotectonic Context
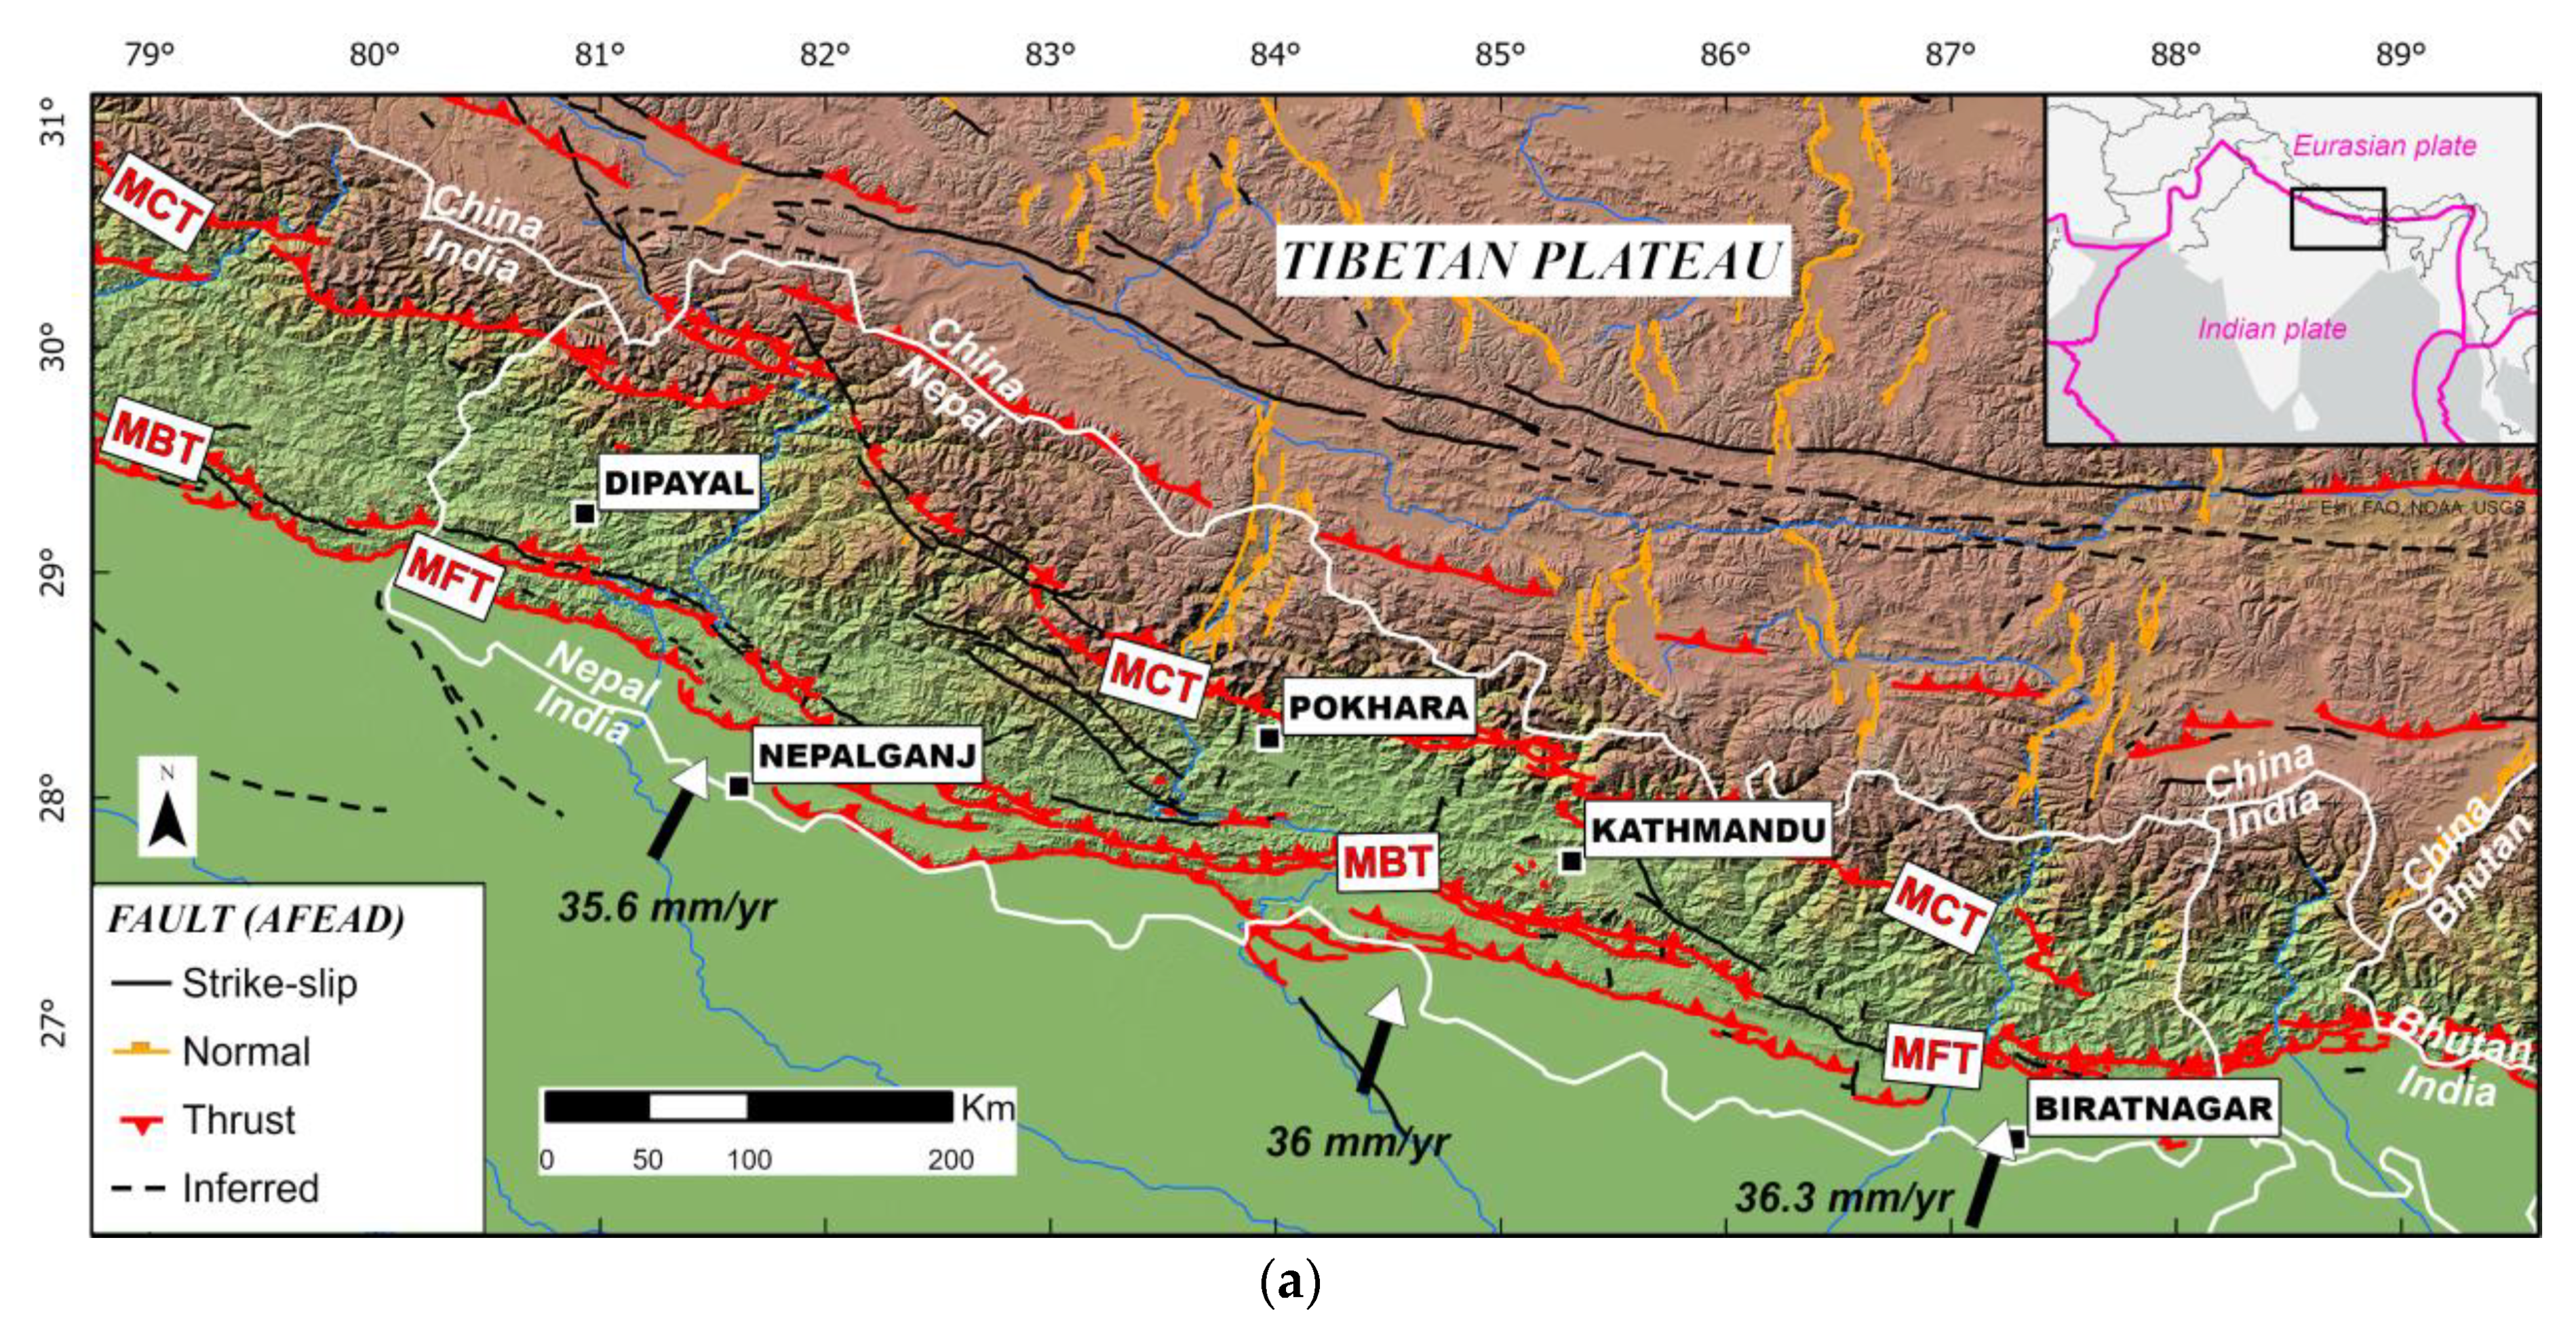
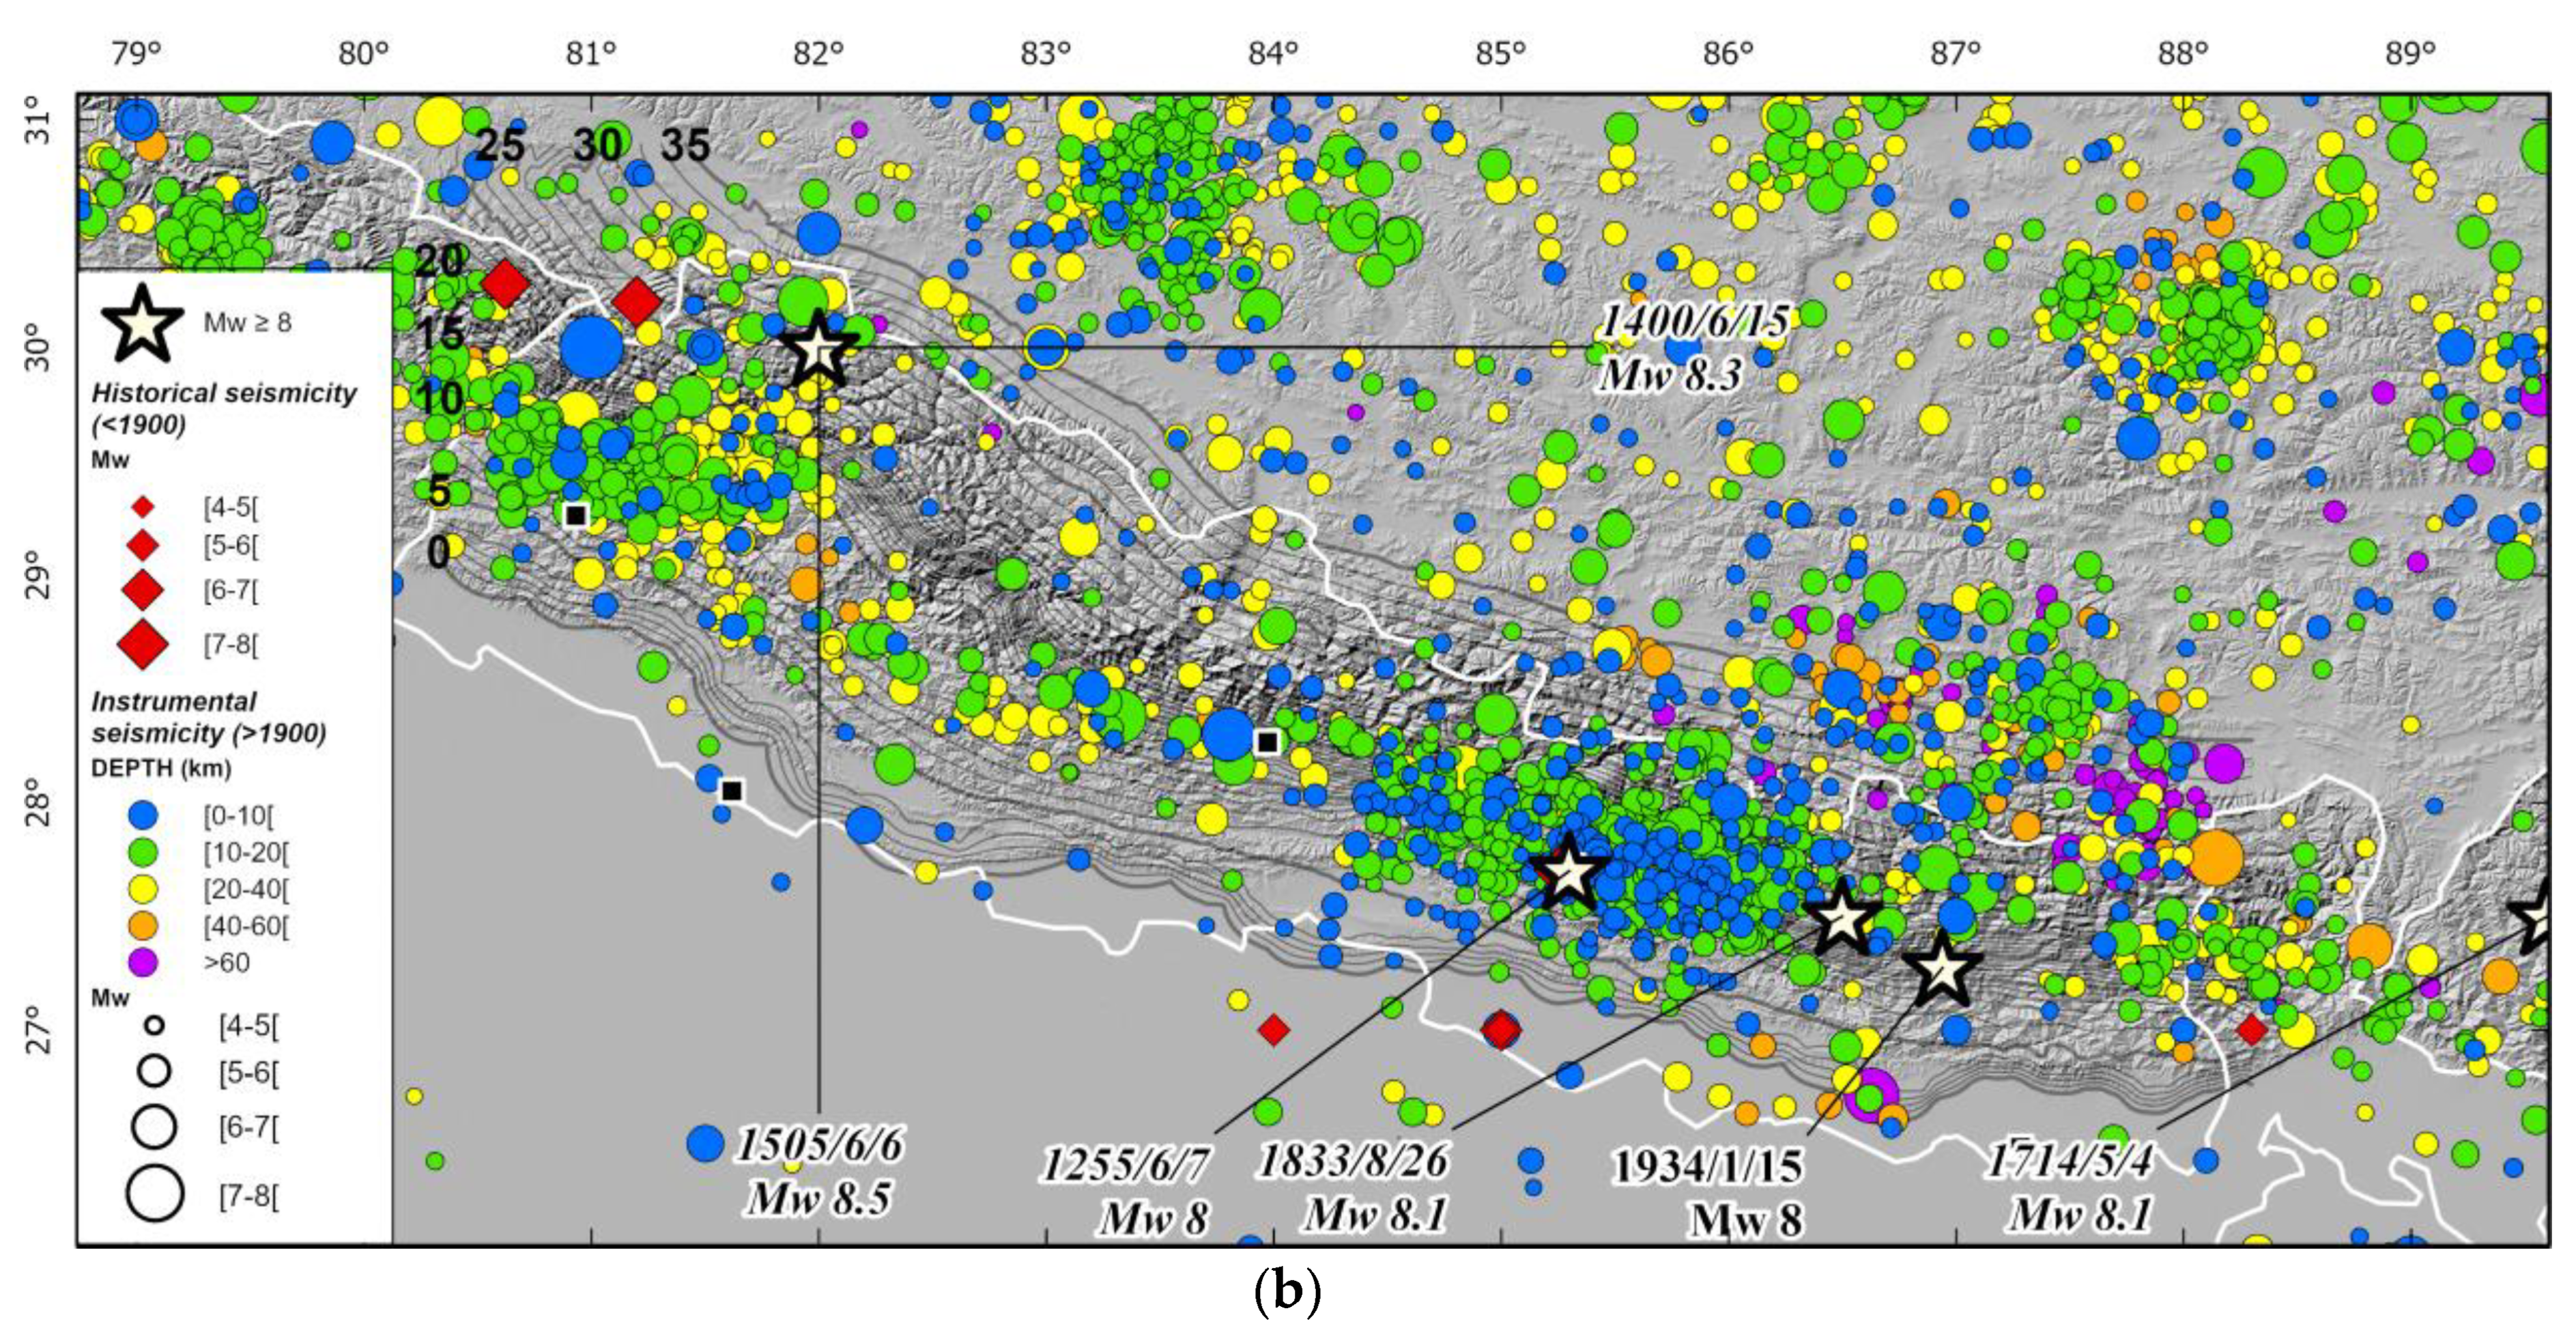
The Himalayan chain in Nepal is characterized by a complex fault system of predominantly ~1000 km long sub-parallel major thrusts from the south to the north: the Main Frontal Thrust (MFT), Main Boundary Thrust (MBT), and Main Central Thrust (MCT) (Figure 1a). Minor crustal lateral and normal faults distributed over the Himalayan chain accommodate part of the convergence at a smaller scale. The MFT corresponds to a surface active fault and is exposed along the southern edge of the Sub-Himalayan foothills with a roughly WNW–ESE strike. At depth, the MFT merges with a “decollement” that dips gently to the north beneath the Lesser Himalaya forming together the well-known Main Himalayan Thrust (MHT). The MHT results from the subduction between Indian and Asian plates and acts as a subduction interface even though the idea of continental subduction (through under thrusting?) is still debated [19,20,21,22,23,24]. The MBT lies on the same “decollement” with a steeper dip angle nearby the surface whereas the MCT corresponds to an old thrusts zone underlying the green schist facies rocks at the base of the Greater Himalayan Sequence. Geological reconstruction and microseismicity models on the MHT agreed about the presence of two or three sub-horizontal surfaces (or flat) bounded on several sides by more steeply dipping ramps. The presence or not of a duplex structure at depth is still debated [25,26] regarding the lateral variation of the seismicity distribution. In any case, according to the along-strike variation of the distance between the mid-crustal ramp and the surface trace of the MFT, it is clear that the geometry of the MHT system at depth is complex and varies from east to west [27] (Figure 1b).
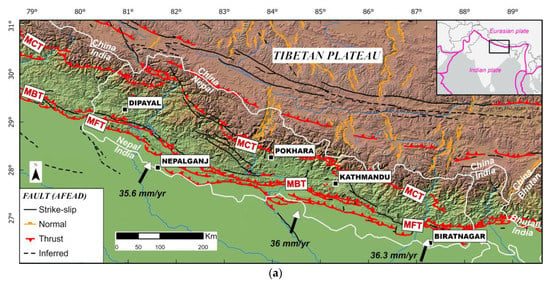
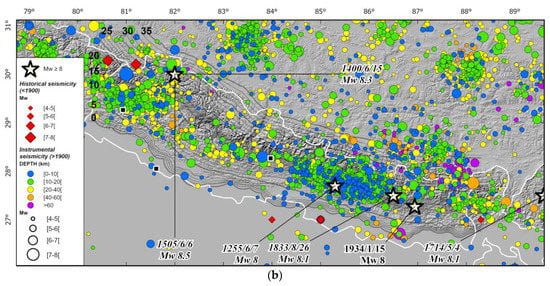
Figure 1.
(a) Structural map of Nepal and Himalayan mountains showing the major thrusts, strike-slip, and normal faults. Black and white arrows indicate India’s plate motion relative to Eurasia in ITRF 2005. Cities with highest population are labeled. MCT: Main Central Thrust, MBT: Main Boundary Thrust, MFT: Main Frontal Thrust. (b) Seismicity map (raw catalog) of Nepal and Himalayan mountains (see Section 3.1 for further details about the seismicity catalog used in this study). The depth contours of the MHT decollement layer are from [27] with depth values in bold. Magnitude > 8 earthquakes are represented by stars and labeled (in italics for historical events with higher uncertainty on their epicentral location).
Geodetic studies show a convergence perpendicular to the arc varying from 20.2 ± 1.1 mm/year in Western Nepal to 21.2 ± 2 mm/year in Eastern Nepal consistent with the long-term geomorphic shortening rates of 18–21 mm/year [1,2,3]. Recent studies refined the total convergence rate between India and Asia at ~36 mm/year from continuous GPS stations [28] (Figure 1a) estimating that half of the convergence (reduced to ~14–19 mm/year) is accommodated across Himalaya [29]. How this geodetic strain (i.e., stress accumulation) is distributed over the active structures of the Himalayas remains poorly documented because of gaps in GPS measurements. However, GPS observations allow us to estimate that during the interseismic period, the shortening rate rises from 0 mm/year at the MFT to ~3 mm/year at the Himalaya piedmont (bounded by the MBT) to ~13–17 mm/year north of the High Himalaya (bounded by the MCT) [30]. Furthermore, the authors deduced from geodetic data that the MHT is actually locked ~100–150 km downdip from the MFT, which corresponds to a maximum depth of >20 km [1,29], and this locked portion of fault can rupture all the way to the surface during large earthquakes (Mw > 8) as confirmed by geomorphic studies [26,31,32,33]. In terms of interseismic coupling, the MHT seems to be largely coupled along its complete length suggesting that there is no aseismic creep close to the MFT [34]. Yet, recent studies show that the MHT displays lateral variations of its coupling ratio suggesting regional heterogeneities with local low coupling ranging from 0.2 to 0.8 [35,36]. Hence, it is unclear which part of the interseismic shortening is involved in elastic/anelastic deformation which is critical to determine the seismic potential of faults. In our models, we take a large range of fault coupling to overcome this issue.
Whereas the MBT formed earlier than the MFT, as suggested by parallel lithological contact with the Proterozoic stratigraphy level (named Lesser Himalaya domain) exposed in its hanging wall, recent activity along one of its reactivated segments has been observed through geological and geomorphic studies [4,37]. Even if no clear fault scarps have been documented along the MBT, geomorphic studies allowed us to describe the occurrence of at least two large earthquakes over the last 2000 years (Figure 1b). The MFT and the MBT are located in the southern part of Nepal, spaced 20–50 km apart, and bounded by the Sub-Himalaya domain built out of the Siwalik sedimentary foreland basin. The MCT, located further north, formed at ~22–18 Ma and seems to have accommodated a total shortening of 140–500 km [38,39]. At present-day, the MCT is considered inactive by many authors [40,41] but might have actually remained episodically active as suggested by [19,42]. To the north of the MBT, the deformation is distributed over moderate active faults with right-lateral strike-slip component (i.e., Western Nepal Fault System, Karakoram fault… [43]) then gradually displaying both lateral and normal components toward the Tibetan Plateau.
Regarding instrumental and historical seismicity, the region is characterized by dense and localized seismicity in the West and East–Southeast Nepal, with much less activity in the central part of the country (Figure 1b). Large (Mw > 7) and great (Mw > 8) earthquakes follow the same geographic distribution such as the two historical Mw > 8 earthquakes, Mw~8.5 in 1505 and Mw~8.1 in 1833 and were situated more than 70 km northward of the MFT. The 1934 Ms~8.2 earthquake despite a controversial rupture plane geometry [44] displayed the same geographic distribution and fault parameters as historical earthquakes. The regional focal mechanisms (please refer to the Section 4.1 for further details) reflect the fault kinematics with mostly thrusting in the south, strike-slip in the central part, and normal in the northern part [9]. The seismically active section of the MHT, because of its sub-horizontal dip (a mean dip of ~8–10°), underlies most of Nepal and concentrates along the northern, down-dip edge of the coupled zone (interpreted as the brittle–ductile transition zone at depth and located ~100–150 km from the MFT) suggesting that the well-known 1505 earthquake (and so the 1505 magnitude-like events) have been initiated on the MHT [4,45]. It appears that most of the seismicity in Nepal (>70%) is shallow seismicity (<25 km) so is in the hanging wall of the MHT or probably on the MHT itself, with a small chance of being on secondary splay faults (or/and duplex?). The up to 30 km depth part of the seismicity is randomly distributed over the whole country while the earthquakes up to 40 km depth seem to underline a roughly ~W–E-oriented wide band.
3. Seismicity Database
3.1. Compilation of Seismicity Database
In Nepal, National seismic monitoring through localized seismic networks began in the early 1980s. Since then, the catalog completeness in the region has changed significantly over time due to the increase in the seismic station’s coverage. The historical events were compiled through various relevant studies [10,46] and Global Historical Earthquake Archives (GHEA) [47]. The instrumental earthquake catalogs for Nepal and surrounding regions are mainly available from the National Seismological Centre, Nepal (DMN) and National Centre for Seismology—India (NDI). The global catalogs, which provide revised estimation for magnitude (CMT), location (EHB), and ISC-GEM catalog [48,49] were also considered based on a broad region between 75° E and 93° E in longitude and 24° N and 34° N in latitude, to be able to work with a robust seismic sample to establish the correlations between the different magnitude scales and the moment magnitude Mw.
The data available from various agencies/institutes were used for the compilation of a unified catalog. Duplicate events were identified and removed in the final earthquake catalog. Time, distance, and magnitude intervals were chosen by trial-and-error tests. The potential duplicate events were flagged and then manually reviewed to check that duplicates were correctly identified. Our review focused on doubtful duplicate events (duplicate events associated with large intervals in time, distance, or magnitude) or on pairs of events with very similar parameters that may correspond to true duplicate events. This investigation led to the most reasonable (see Table 1) distance and time window to identify the duplicates for different periods in history. We adopted the scheme (difference in distance, time, and magnitude) presented in Table 1 as a final choice.

Table 1.
Scheme use to identify the duplicate events among different source catalogs.
After the identification of duplicates, the location of the events was retained according to the following source priority criteria defined based on the relative degree of reliability on the epicentral locations: ISC_GEM, EHB, ISC, NDI, USGS, REF, GHEA, and GCMT. For instance, we trust the catalog that has been reviewed (ISC_GEM and EHB are the relatively more reliable catalogs because their epicentral location is revised or reviewed). The selection process is iterative and follows the priority scheme. Figure S1 represents the repartition of source epicentral locations as a function of magnitude and time for the final compiled catalog for this study. The final homogenized raw catalog contains 12,584 events above Mw* ≥ 1.0, among which 145 are Mw* ≥ 6.0 and 39 are Mw* ≥ 7.0, and 8 are Mw* ≥ 8.0. The main sources of information used to develop the new catalog for this study are presented in Table 2.

Table 2.
The main sources of information used to develop the new catalog for this study.
3.2. Magnitude Homogenization
Magnitude homogenization into moment magnitude Mw was carried out by adopting a priority scheme based on magnitude types: direct moment magnitude (Mwd), proxy moment magnitude (Mwp), local magnitudes (mL), surface wave magnitude (Ms), body wave magnitude (mb), duration magnitude (md), coda wave (Mc) and non-specified magnitude (M).
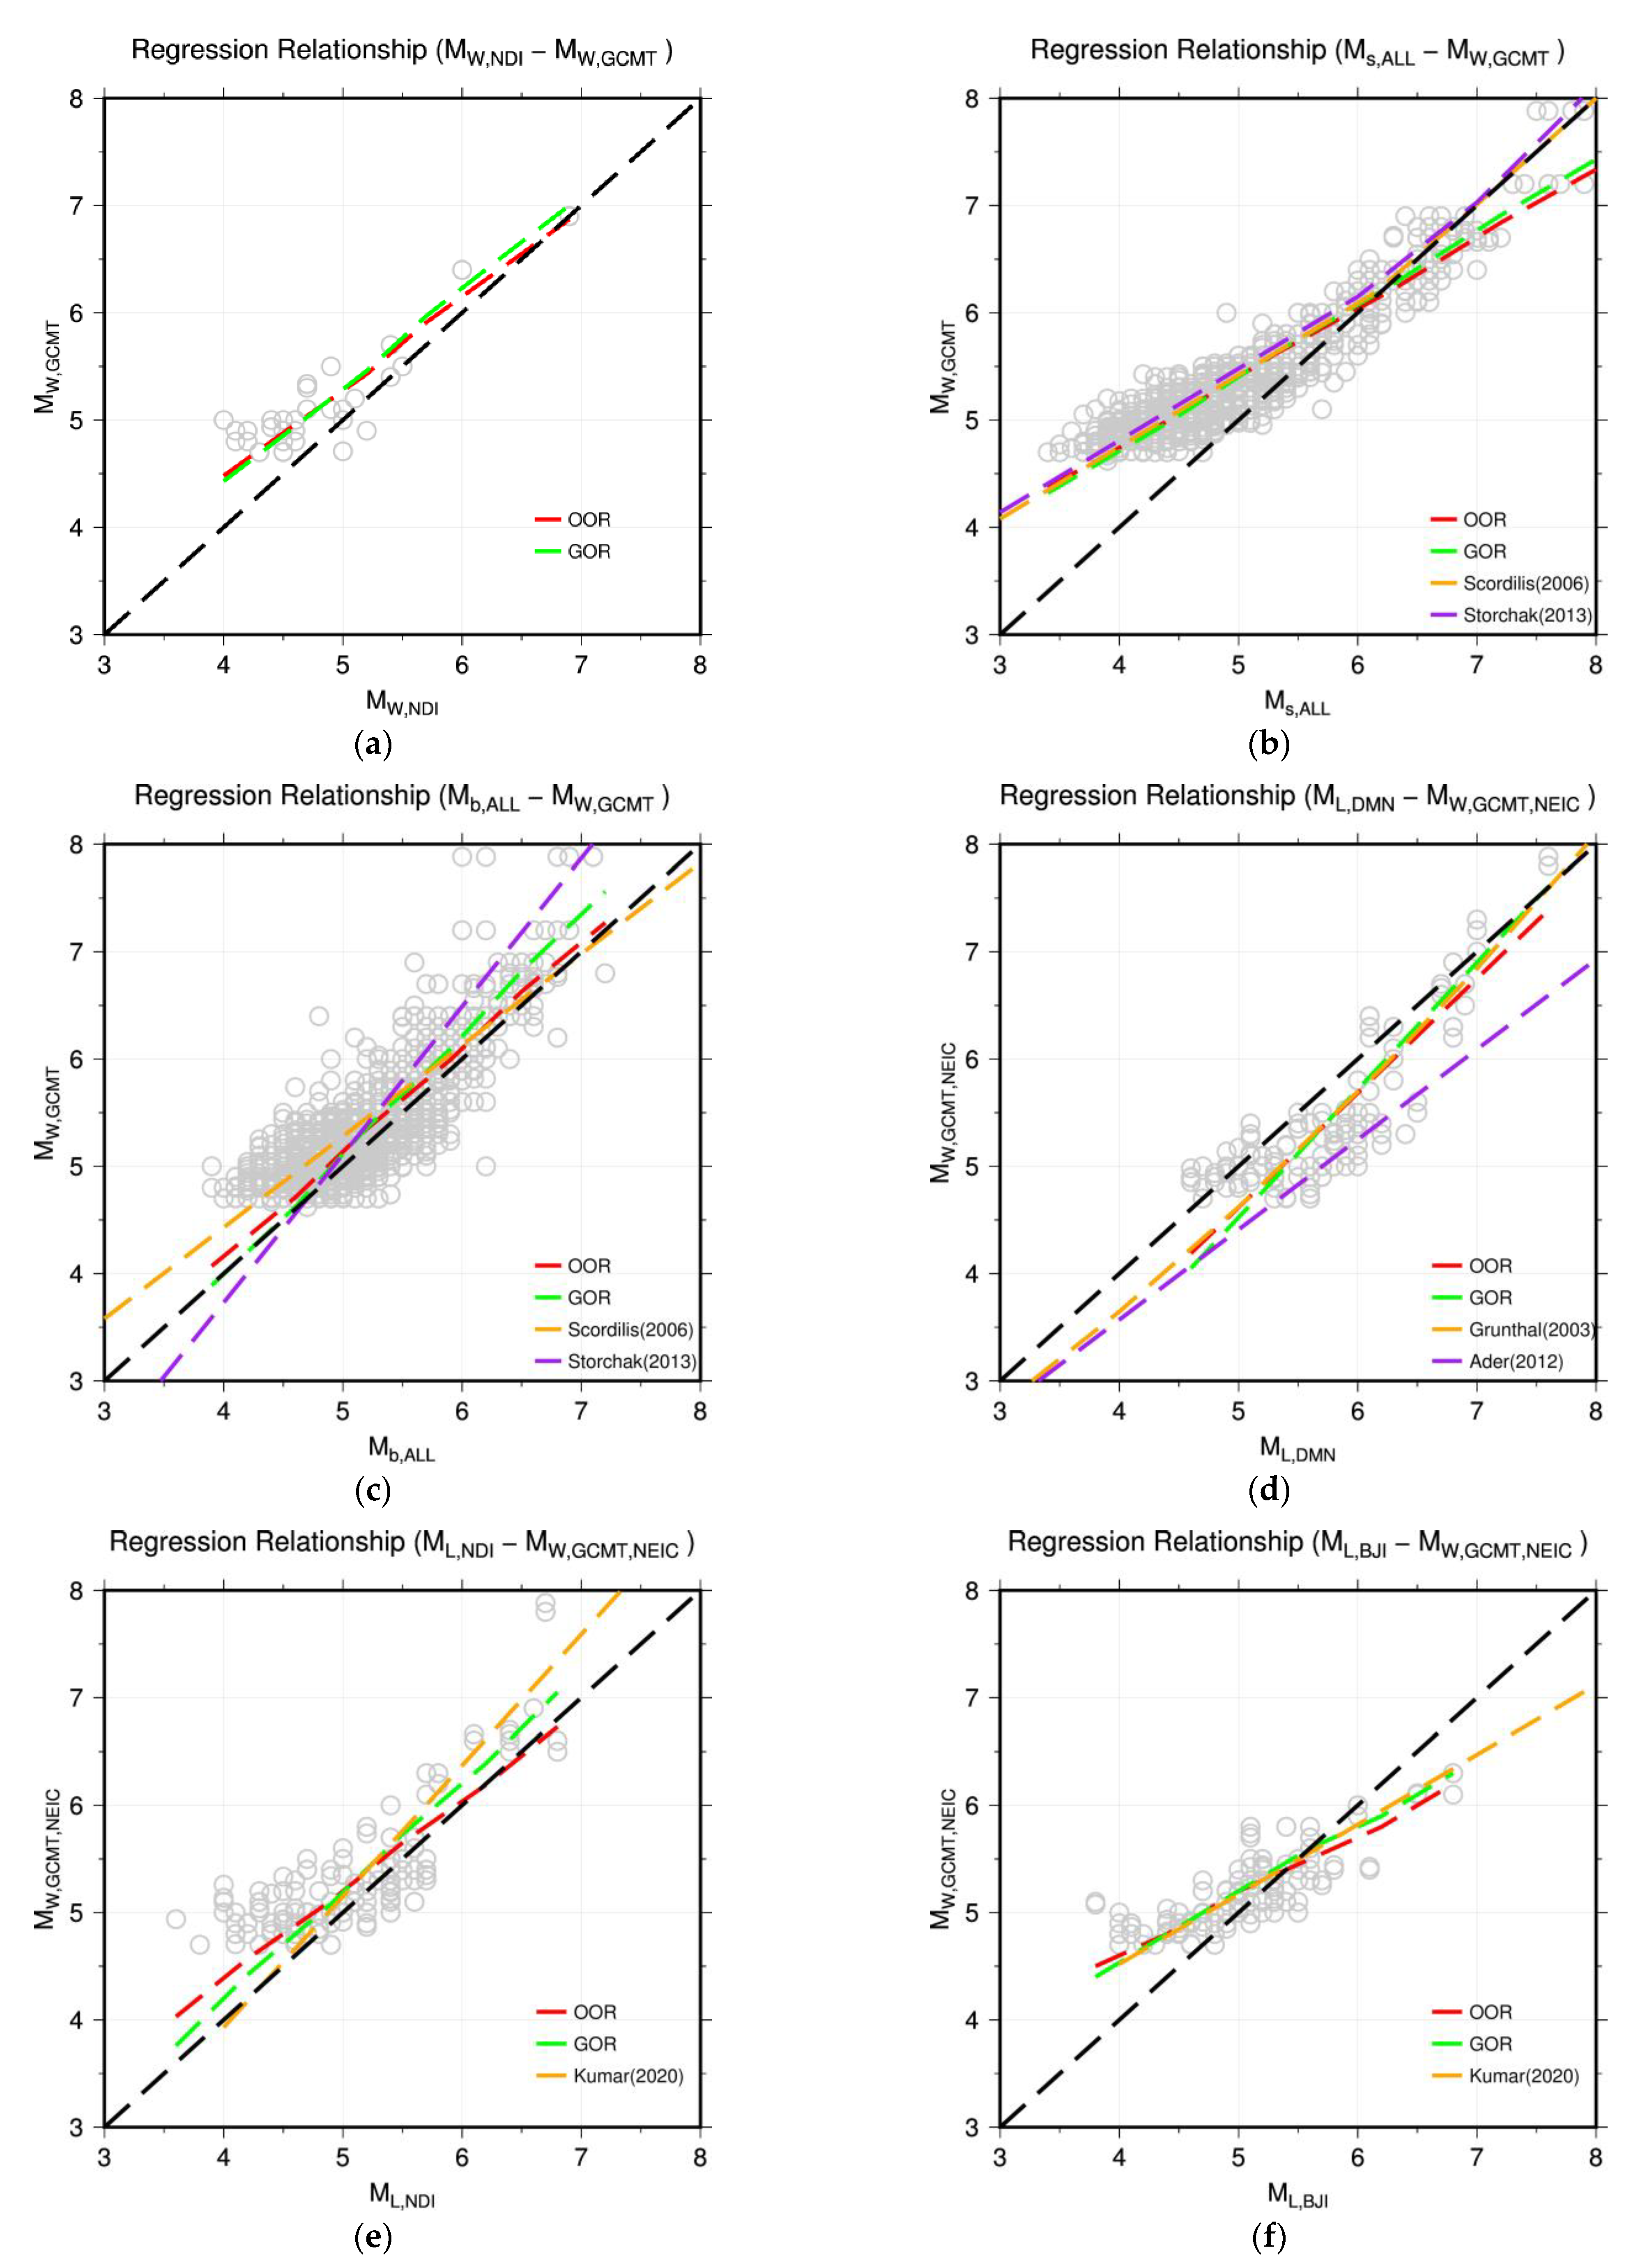
We compared the magnitude pairs and different magnitude conversions available in the recent bibliography along with two general and ordinary orthogonal regressions (GOR and OOR) evaluated based on the magnitude pairs obtained in this study (Figure 2, Table 3). The Mw,NDI show the systematic shift with respect to GCMT, a possible underestimation specifically for a magnitude lower than 5.5. Thus, GOR established through the pairs (which considers uncertainty in two directions), was used to adjust direct moment magnitudes Mw,NDI. And proxy moment magnitude (Mwp) was adopted as equivalent to Mw as it mostly concerns events from the ISC_GEM catalog, which are reviewed.
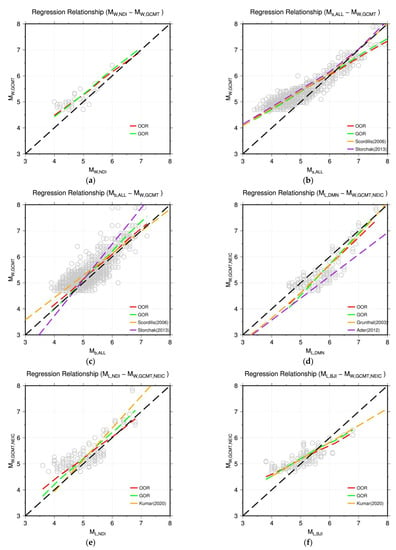
Figure 2.
Magnitude pairs and magnitude regression relationships for homogenization of the earthquake catalog in Mw*. (a) Mw,NDI—Mw,GCMT; (b) Ms,ALL—Mw,GCMT; (c) Mb,ALL—Mw,GCMT; (d) mL,DMN—Mw,GCMT,NEIC; (e) mL,NDI—Mw,GCMT,NEIC; (f) mL,BJI—Mw,GCMT,NEIC. The grey circles represent the magnitude pairs identified.

Table 3.
Regression relationships derived from the generalized orthogonal regression (GOR) method utilized in this study.
Similarly for other magnitude types, the analysis of magnitude pairs led to the choice of relationship proposed by [56] for Ms, [57] for Mb, and [51] for mL,DMN. For Ms to Mw, the models developed by [56,57] seem appropriate. The model developed by [56] was preferred because it is more recent and widely acknowledged. For Mb to Mw, although the data are largely dispersed, the model developed by [57] seems the most appropriate. mL,DMN shows the systematic shift, a possible overestimation for all magnitude ranges. The relationship as given by [51] seems appropriate and hence adopted.
GOR relationship established through magnitude pairs evaluated in this study (Figure 2, Table 3) was adopted for mL,NDI, and mL,BJI. The GOR approach provides the relation that minimizes the square of the orthogonal distance of the experimental data from the regression line [58]. We follow the GOR [58,59] method also adopted by [60] because unlike the OOR procedure, which supposes equal uncertainty on both x and y variables, the GOR procedure allows us to account for the estimated uncertainty of both the dependent and independent variables. Hence, albeit the debate about the superiority of one or other conversion relationship as discussed recently in [61], the authors believe that the regression techniques considering the uncertainty on most variables like the GOR approach are preferable.
Regarding the events that contain only md, Mc, or M, considering the lack of enough magnitude pairs with reference Mw for specific evaluation, we adopted a 1:1 equivalent relationship to convert to Mw. The homogenized magnitude is noted as Mw* with an uncertainty equal to the recombined variance of the original magnitude estimate and of the variance associated with the conversion models.
3.3. Declustering of the Seismicity Catalog
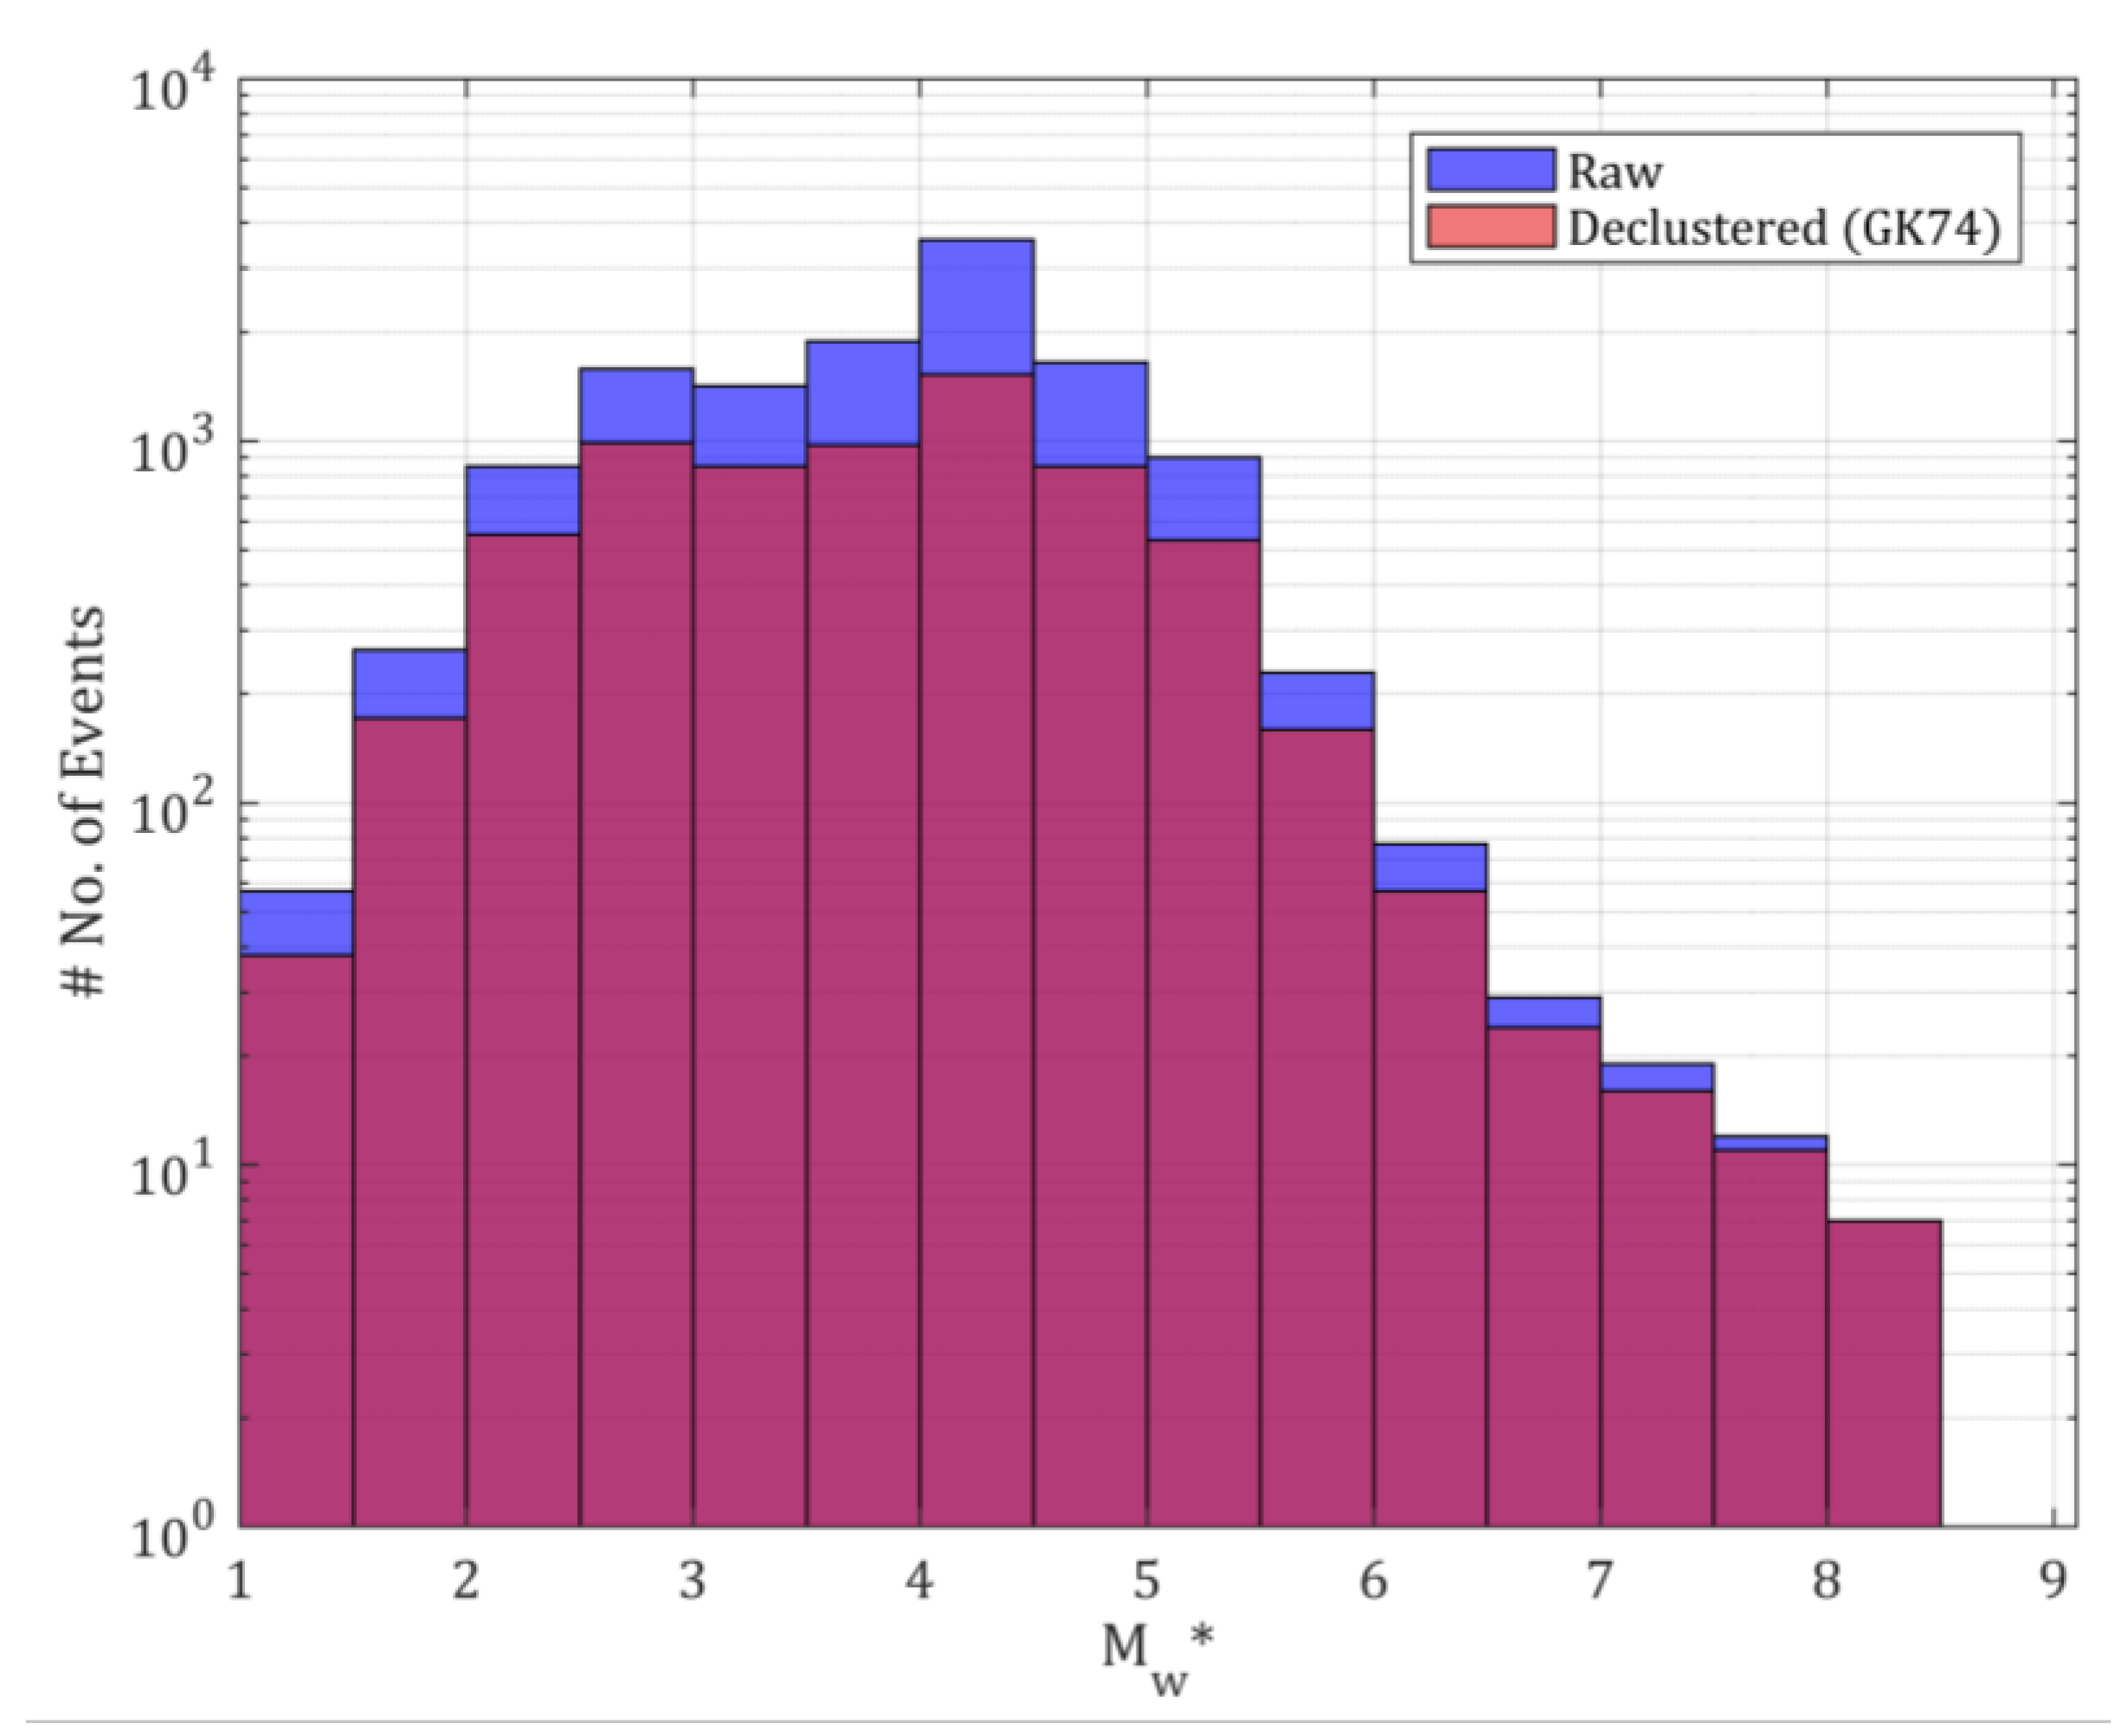
There is no unique solution to separate the time-independent part of seismicity from the seismic activity related to aftershocks, foreshocks, or clusters of earthquakes. Hence, we chose for this study, the widely applied and accepted spatio-temporal windows approach proposed by Gardener and Knopoff (GK74) [62] to obtain a statistically independent declustered catalog. The histogram (Figure 3) shows that for both raw and declustered catalogs, the number of events below magnitude 4.0 marks an inflection point which indicates that the catalog is mostly not complete below the magnitude of 4.0. The declustering process identified about half of the events (53.7%) as mainshocks and the rest of the events are identified as either foreshocks (9.4%) or aftershocks (36.9%). The other algorithms available for declustering, like the one from Uhrhammer [63], were not considered in this study. They will be considered for the tests of their applicability in future updates.
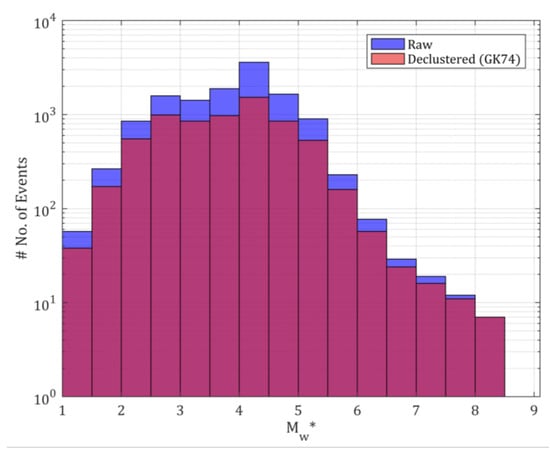
Figure 3.
Magnitude histogram of raw and declustered catalogs developed in this study.
3.4. Completeness Periods
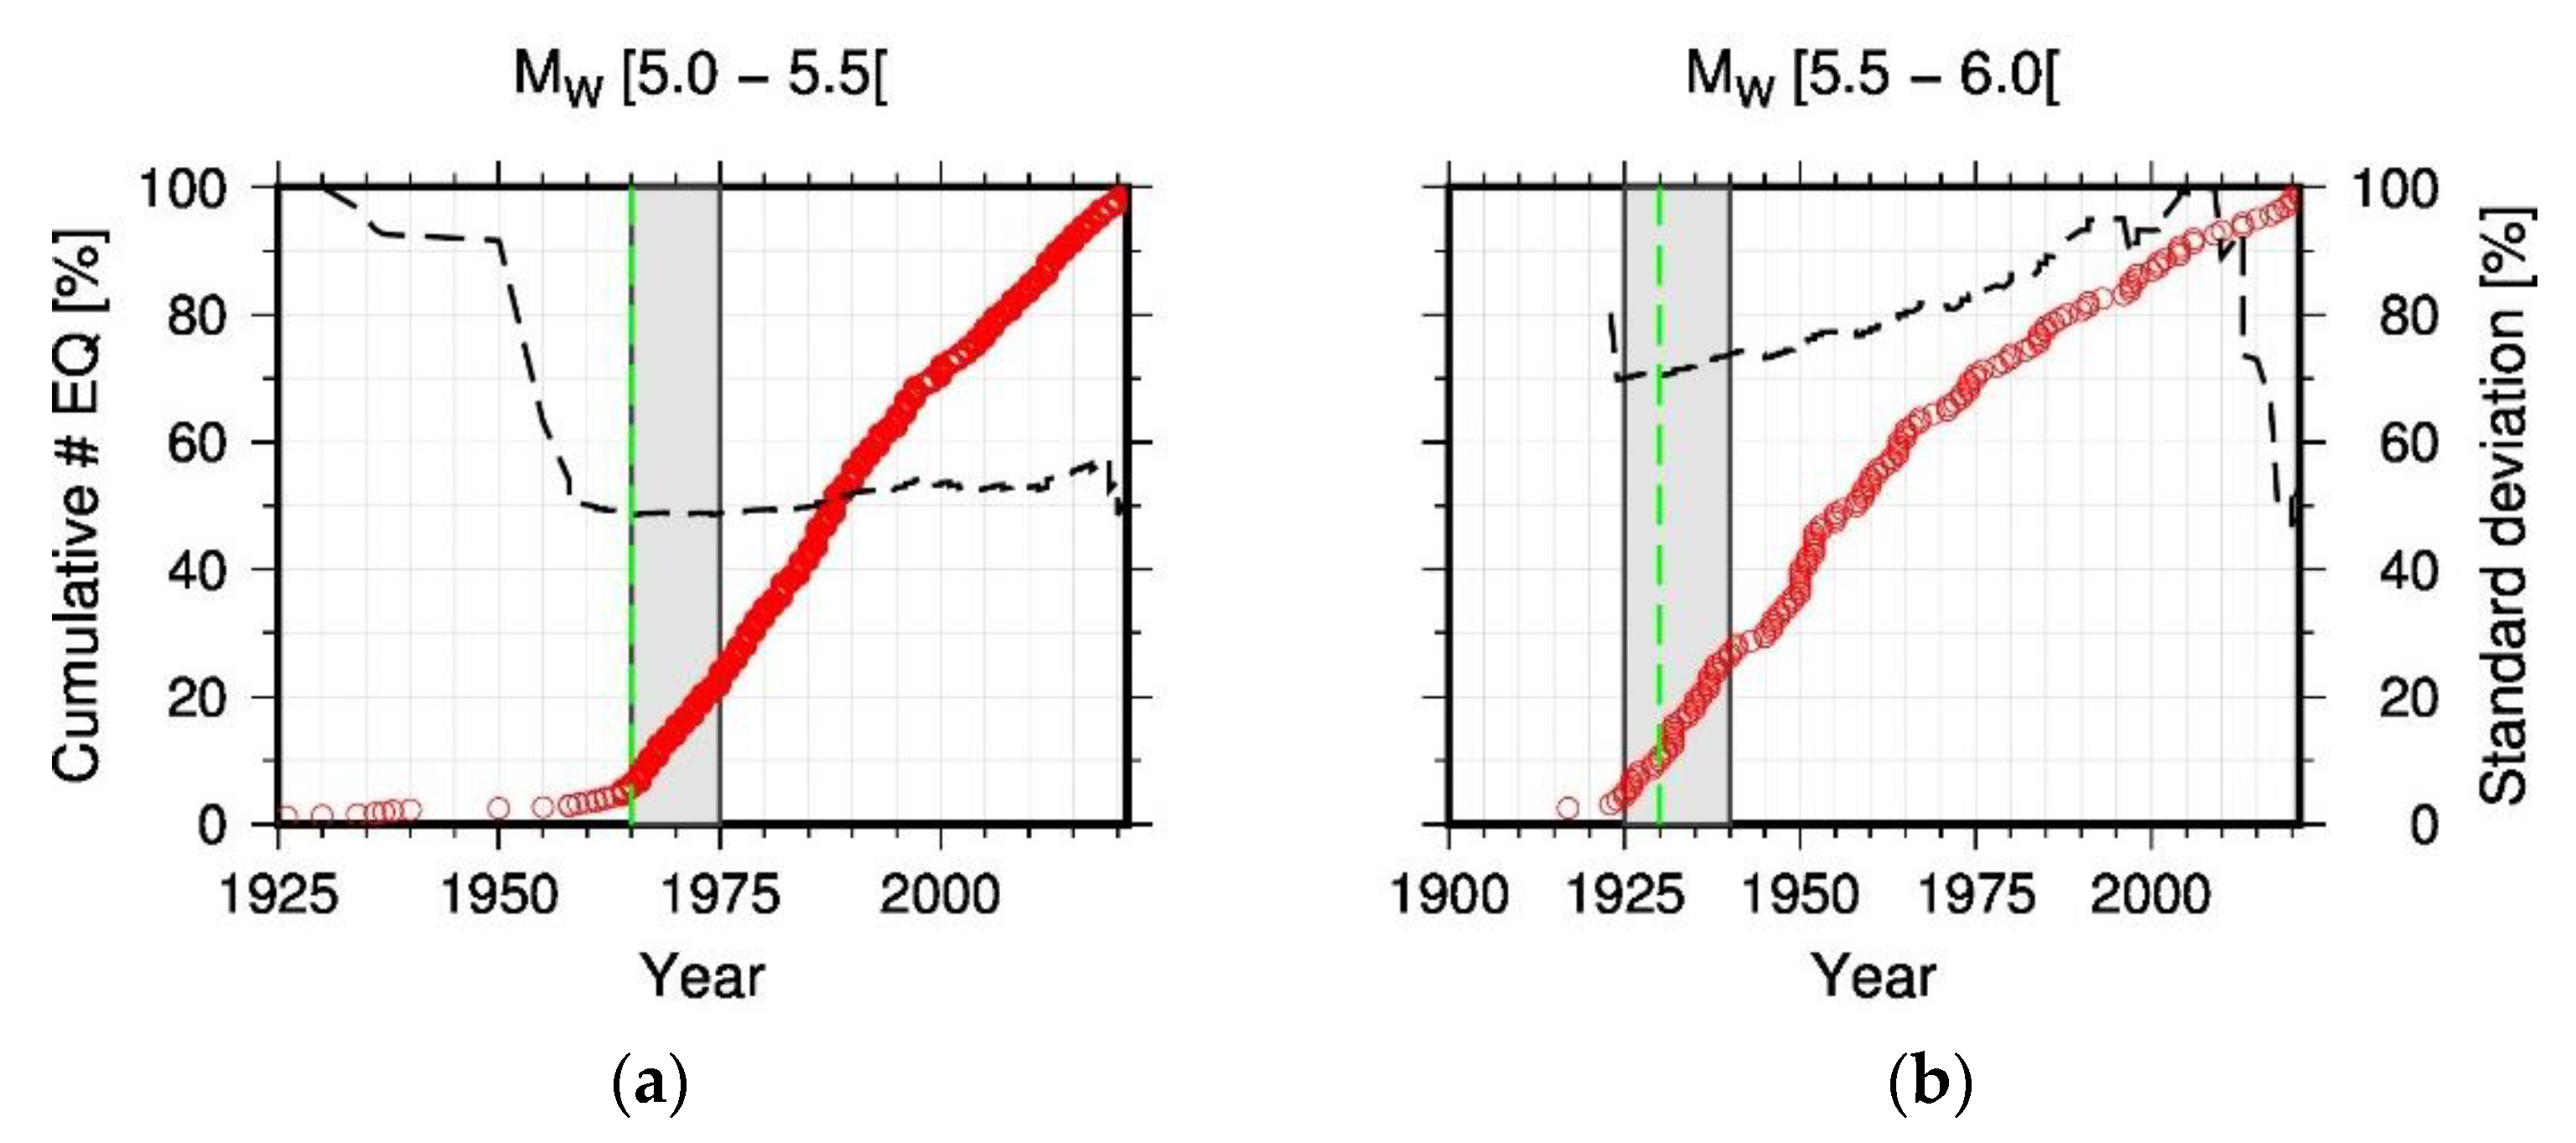
The catalog of seismicity was analyzed to define the completeness periods (after which the annual rate of earthquakes become approximately constant i.e., stationary) per range of magnitudes based on the “slope method” based on the cumulative number of events along time and method based on the inter-event variance [64] (Figure 4 and Figures S1 and S2).
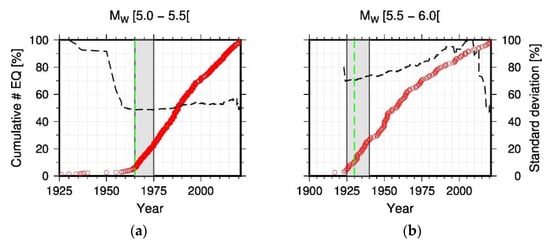
Figure 4.
Examples of completeness analysis performed for magnitude bin of (a) Mw5.0–5.5 and (b) Mw5.5–6.0. Cumulative number of earthquakes as a function of time (red circles). Inter-event variance (black dashed line). Best estimate is shown as green dashed line. Gray shade represents the lower to upper estimates.
For each magnitude bin, we evaluated the range of completeness year to consider uncertainties (Table 4). This uncertainty range increases for higher magnitude bins for which the completeness period is longer and data are scarce. The mean completeness period established is 21 years for the lowest magnitude range of Mw3.0–3.5 and 821 years for the highest magnitude range of Mw8.0–9.0. We considered 2021 as the end year to avoid possible biases since seismicity data for recent years are usually not complete or are subject to revisions.

Table 4.
Estimates of the year of completeness.
4. Seismic Source Characterization
The seismic source models (SSM) are made of seismic source zones that represent volumes of the Earth’s crust and linear individual faults exhibiting the same seismotectonic regime and seismicity occurrence features. They are modeled assuming that the seismicity is either homogenously or heterogeneously distributed over their extent and the occurrence parameters are calculated by processing the subset of events that occurred within the polygon describing the seismic source. Seismic hazard studies previously performed in Nepal [7,8,9,10,65] provide significantly variable PSHA results since the SSC models and hypothesis used are not consistent from one study to another. Thus, the intent of the current study was to consider the existing model proposed by [10], which is mostly based on seismicity patterns, and to also develop independent and more accurate SSM applicable to the Nepalese Himalayas including in turn three types of seismic sources at regional scale: the crustal volume sources, the major Himalayan crustal fault sources, and the subduction-like interface domain.
From the previous models [7,8,10,65] it was evidenced that the seismic hazard was controlled by crustal zones and fault sources. However, there is a deep thrust decollement layer (the Main Himalayan Thrust, MHT) acting as a wide plate interface with an important seismogenic potential that must be considered into the models. The authors of [9] previously included the MHT and the Karakoram fault as single fault sources in their probabilistic seismic hazard models associated with sparse areal sources centered on active faulting region. However, the models do not consider the other main structures connecting on the MHT at depth as an alternative source of seismic hazard for Nepal despite their recent activity [4,19,37,42]. In contrast to [9] and based on the MHT fault coupling values from [35,36], we decided to consider in our models the two major seismogenic structures of Nepal accommodating most of the regional shortening rate, that is to say mainly the Main Frontal Thrust (MFT) and the Main Boundary Thrust (MBT), and also a minor part on the Main Central Thrust (MCT) and active strike-slip/normal faults located in Northern Nepal.
Therefore, the models developed in this study incorporate alternative source model geometries, based on the geometrical complexity of the seismogenic structures at depth (i.e., ramp and flat on the MHT) and include the tectonic lateral variations observed in the region [1,2,3,4,9,29,37,66,67,68,69,70,71,72]. This approach of modeling implies that although specific active faults are not introduced in the seismic hazard model, they are modeled through the generation of fictitious rupture planes anywhere in the volume, however not able to generate earthquakes stronger than the adopted magnitude threshold.
The intention is also to adopt two alternative methods for the determination of the activity rates. In the first one, the activity rates are assumed to be homogeneously distributed in each seismotectonic volume. On the other, the spatial variability of the activity rates is accounted for by a smoothed seismicity approach in which alternative kernel functions are considered.
4.1. Homogenous Volume Sources
4.1.1. Source Model Based on Thapa and Wang (2013)—SM1
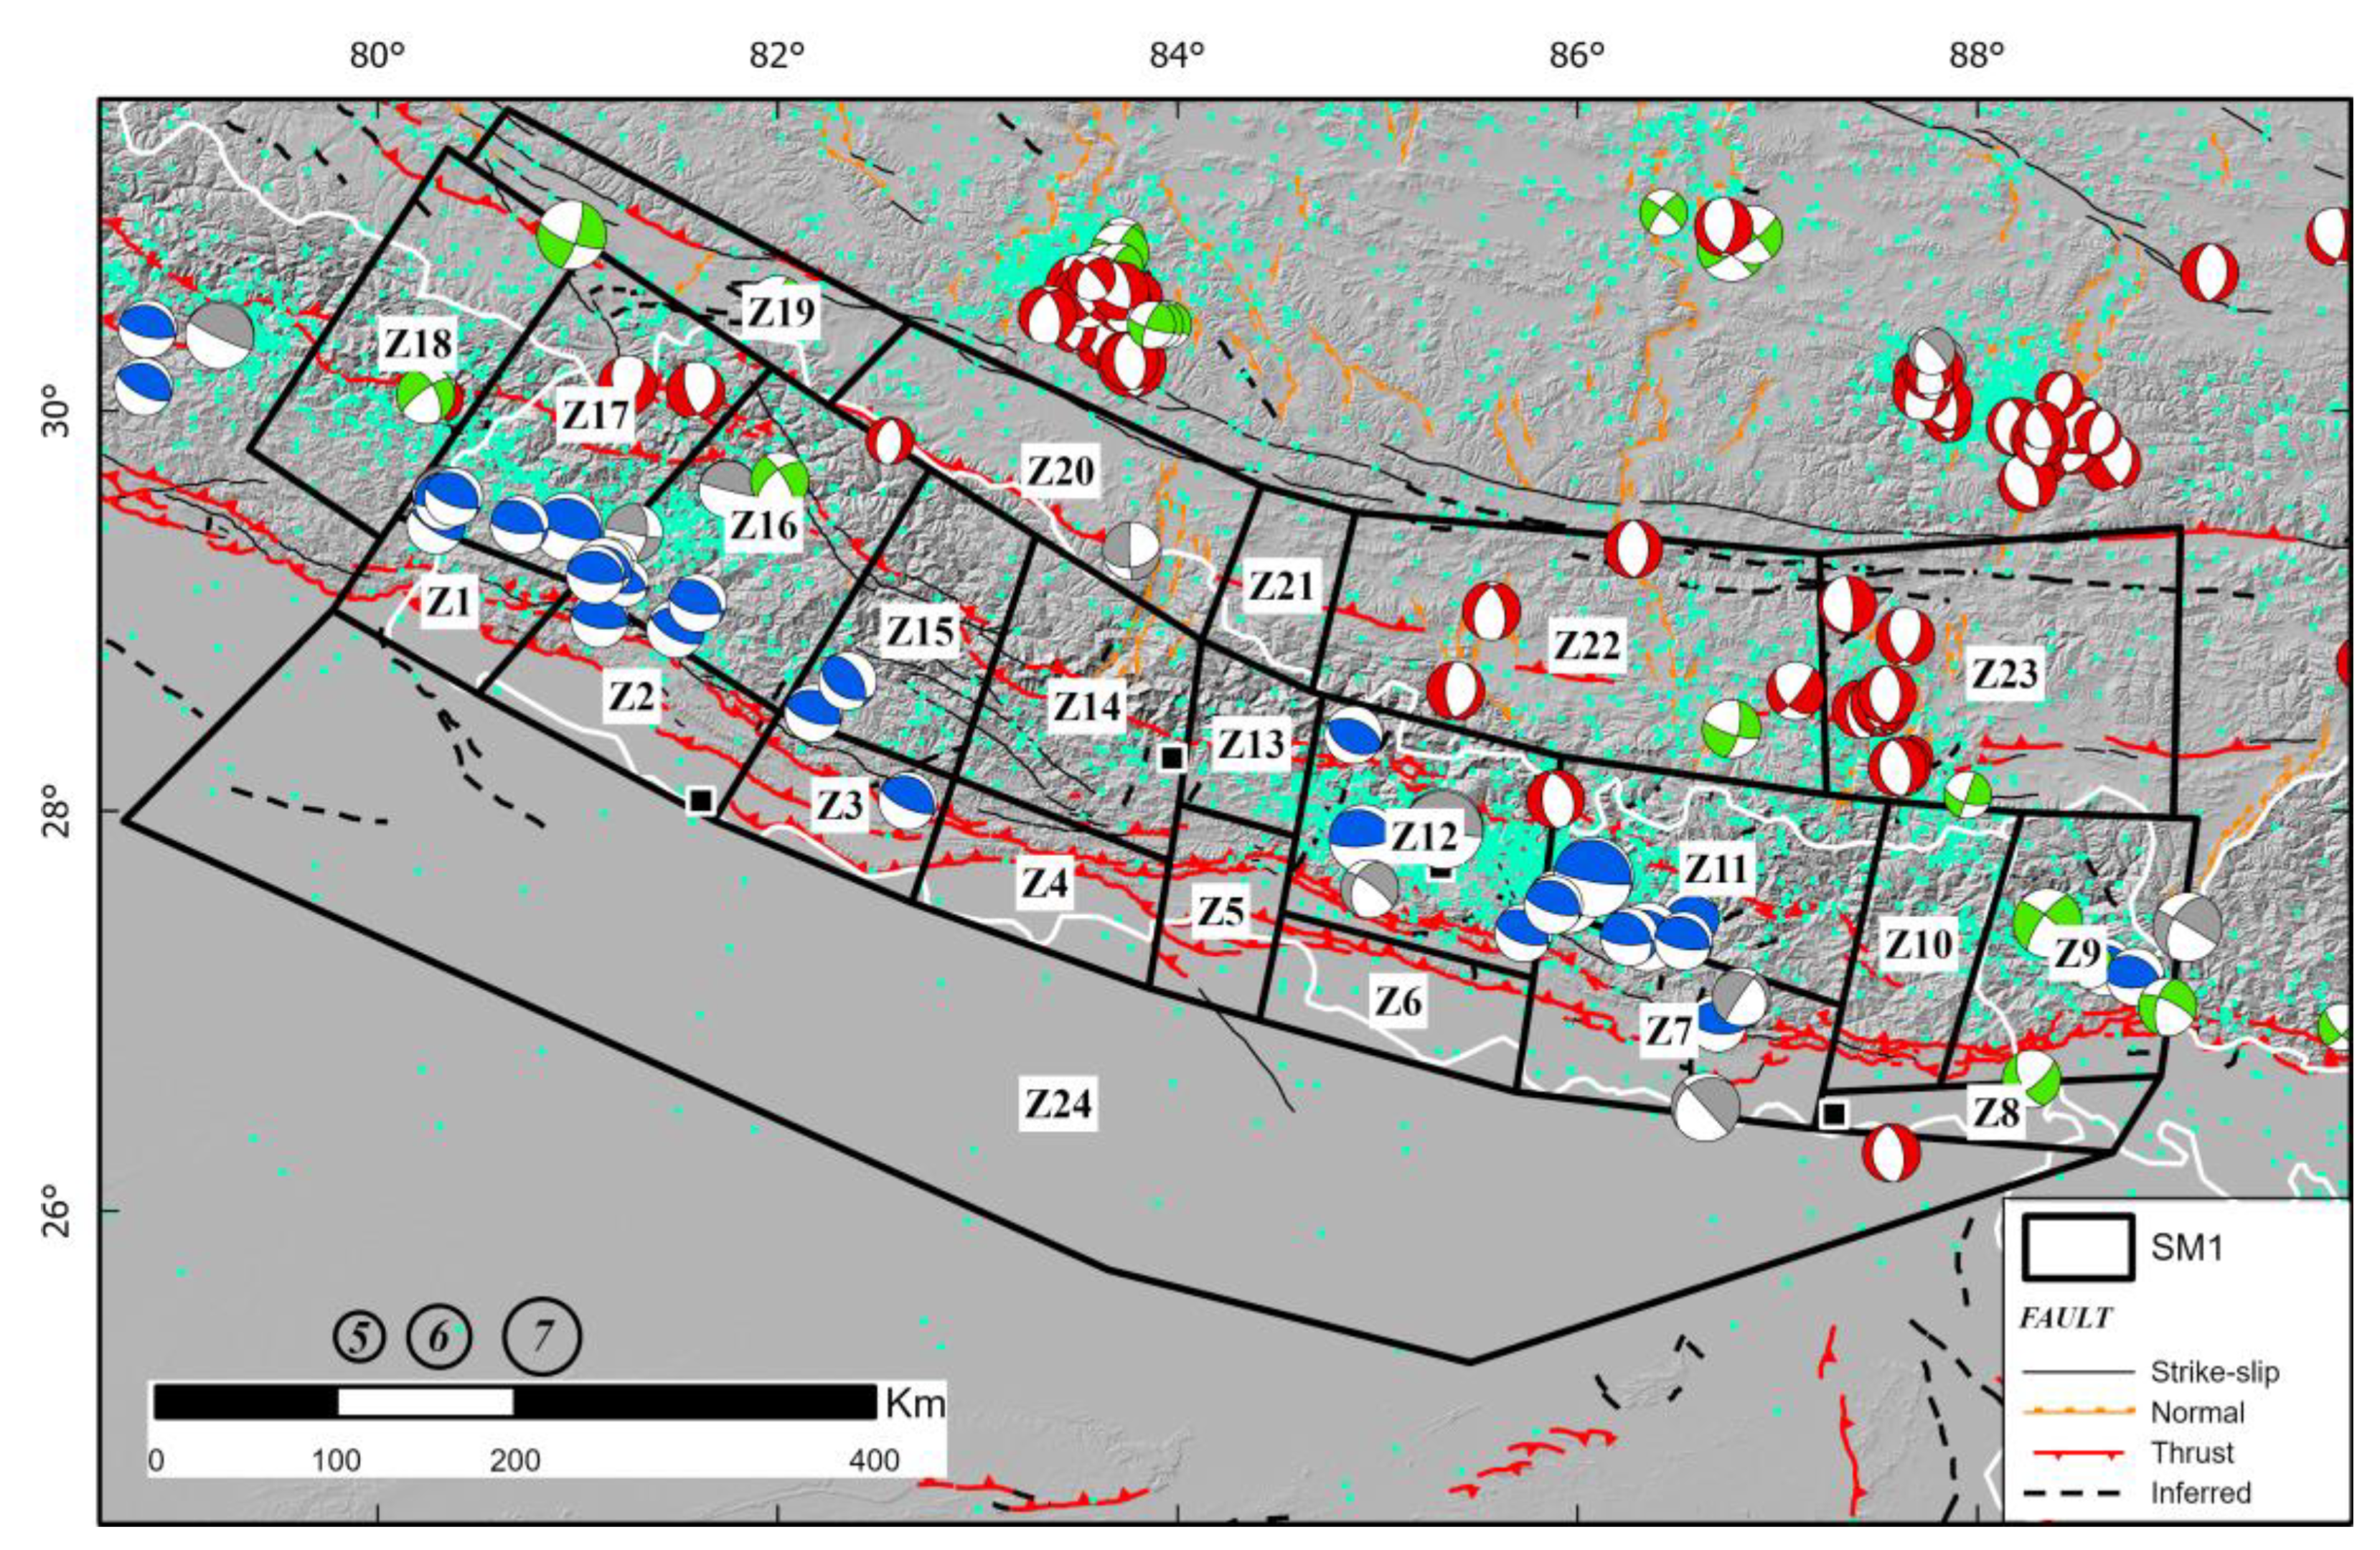
The seismic source model named SM1 is inspired by [10] and is composed of initially 23 zones to which a zone was added in the foreland basin of the Himalayan chain, allowing us to consider the seismicity at Southernmost Nepal (Figure 5). These 24 zones encompass the major seismotectonic domains to cover the active regions to the west (India), the east (Bhutan), and to the north (Tibet Plateau, China). The SM1 zonation encompasses the Nepalese Himalayan mountains, from south to north: (i) the ~W–E to WNW–ESE active thrusts (MFT, MBT) in the Outer Himalaya, (ii) the mainly ~W–E reverse to ~N–S lateral faulting in the Lesser Himalaya and (iii) the mainly ~N–S normal to ~SE–NW lateral faulting of the extensional Tethys Himalaya at Southern Tibet. In terms of seismicity magnitude and distribution, most of the instrumental and historical seismicity is distributed along an arc-parallel band in the Lesser Himalayas. In detail, the seismicity is concentrated into two clusters with the highest magnitude earthquakes localized in the east, in the vicinity of Kathmandu City, and in the far western region. While [10] set a hypocenter depth for active crustal seismicity comprised between 0–10 km for the whole region, we applied a maximum depth of rupture up to 20 km for the zones Z1 to Z8 and Z24, 30 km for the zones Z9 to Z18, 40 km for the zones Z19 to Z23, according to the northward low-dipping geometry of the thrust beneath the whole Nepal [73,74] and considering that the majority of the earthquakes in Nepal occurred along and above the MHT. In addition, we consider a subduction-like interface domain with a maximum magnitude of up to Mw~9.0 for the zones Z9 to Z18, where the greatest magnitude of historical seismicity is assumed to be localized. Whereas the zones Z1 to Z8 and Z19 to Z24 are referenced as a domain of active crustal deformation that corresponds to an intraplate tectonic regime where the magnitude of earthquakes never exceeds Mw~7 (Table 5). As such, according to the maximum magnitude at each zone provided by the seismicity catalog, we attributed the maximum magnitude of Mw~7.5 for the region Z1 to Z8 and Z24, and Mw~7 for the area Z19 to Z23. In both cases, we cautiously add 0.5 to the maximum magnitude observed at each zone before integration into the model (see Supplementary Materials, Tables S1–S3 for detailed parameters) relying on the maximum observed magnitude from our seismicity catalog, on previous PSHA publications [75,76] and similarities among tectonic regions which remains a rather conservative but widely applied method for PSHA studies.
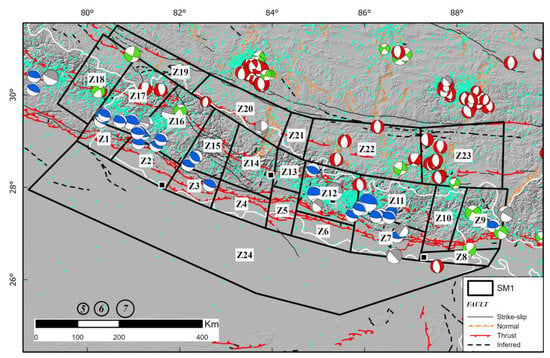
Figure 5.
SM1 model zonation overlapped on the seismotectonic map of Nepal displaying main active faults (from AFEAD database, http://neotec.ginras.ru/index/mapbox/database_map.html; accessed on 15 April 2023), seismicity (blue dots) and focal mechanisms mainly from the CMT catalog (https://www.globalcmt.org; accessed on 15 April 2023) where red pattern is for normal, green for strike-slip, and blue for thrust faulting events. Z1 to Z23 correspond to the SM1 zones names.
In terms of fault characterization parameters, we used the comprehensive AFEAD fault catalog (http://neotec.ginras.ru/index/mapbox/database_map.html; accessed on 30 April 2023) to draw the active fault traces over the region and to collect fault attributes. We also compiled the focal mechanism from the literature [1,66,68,70,71,77,78] and the CMT catalog (https://www.globalcmt.org; accessed on 15 April 2023) in order to better assess the kinematics of faulting in each area. Thus, we assign a major, medium, and minor percentage coefficient for the three categories of fault kinematics (strike-slip, reverse, normal) corresponding to what have been observed or inferred within each zone. Finally, for each category, we determine the fault attribute values associated with their uncertainties (strike, dip, and rakes) based on the AFEAD fault database and the references therein.
4.1.2. Source Model including the MHT Geometry—SM2
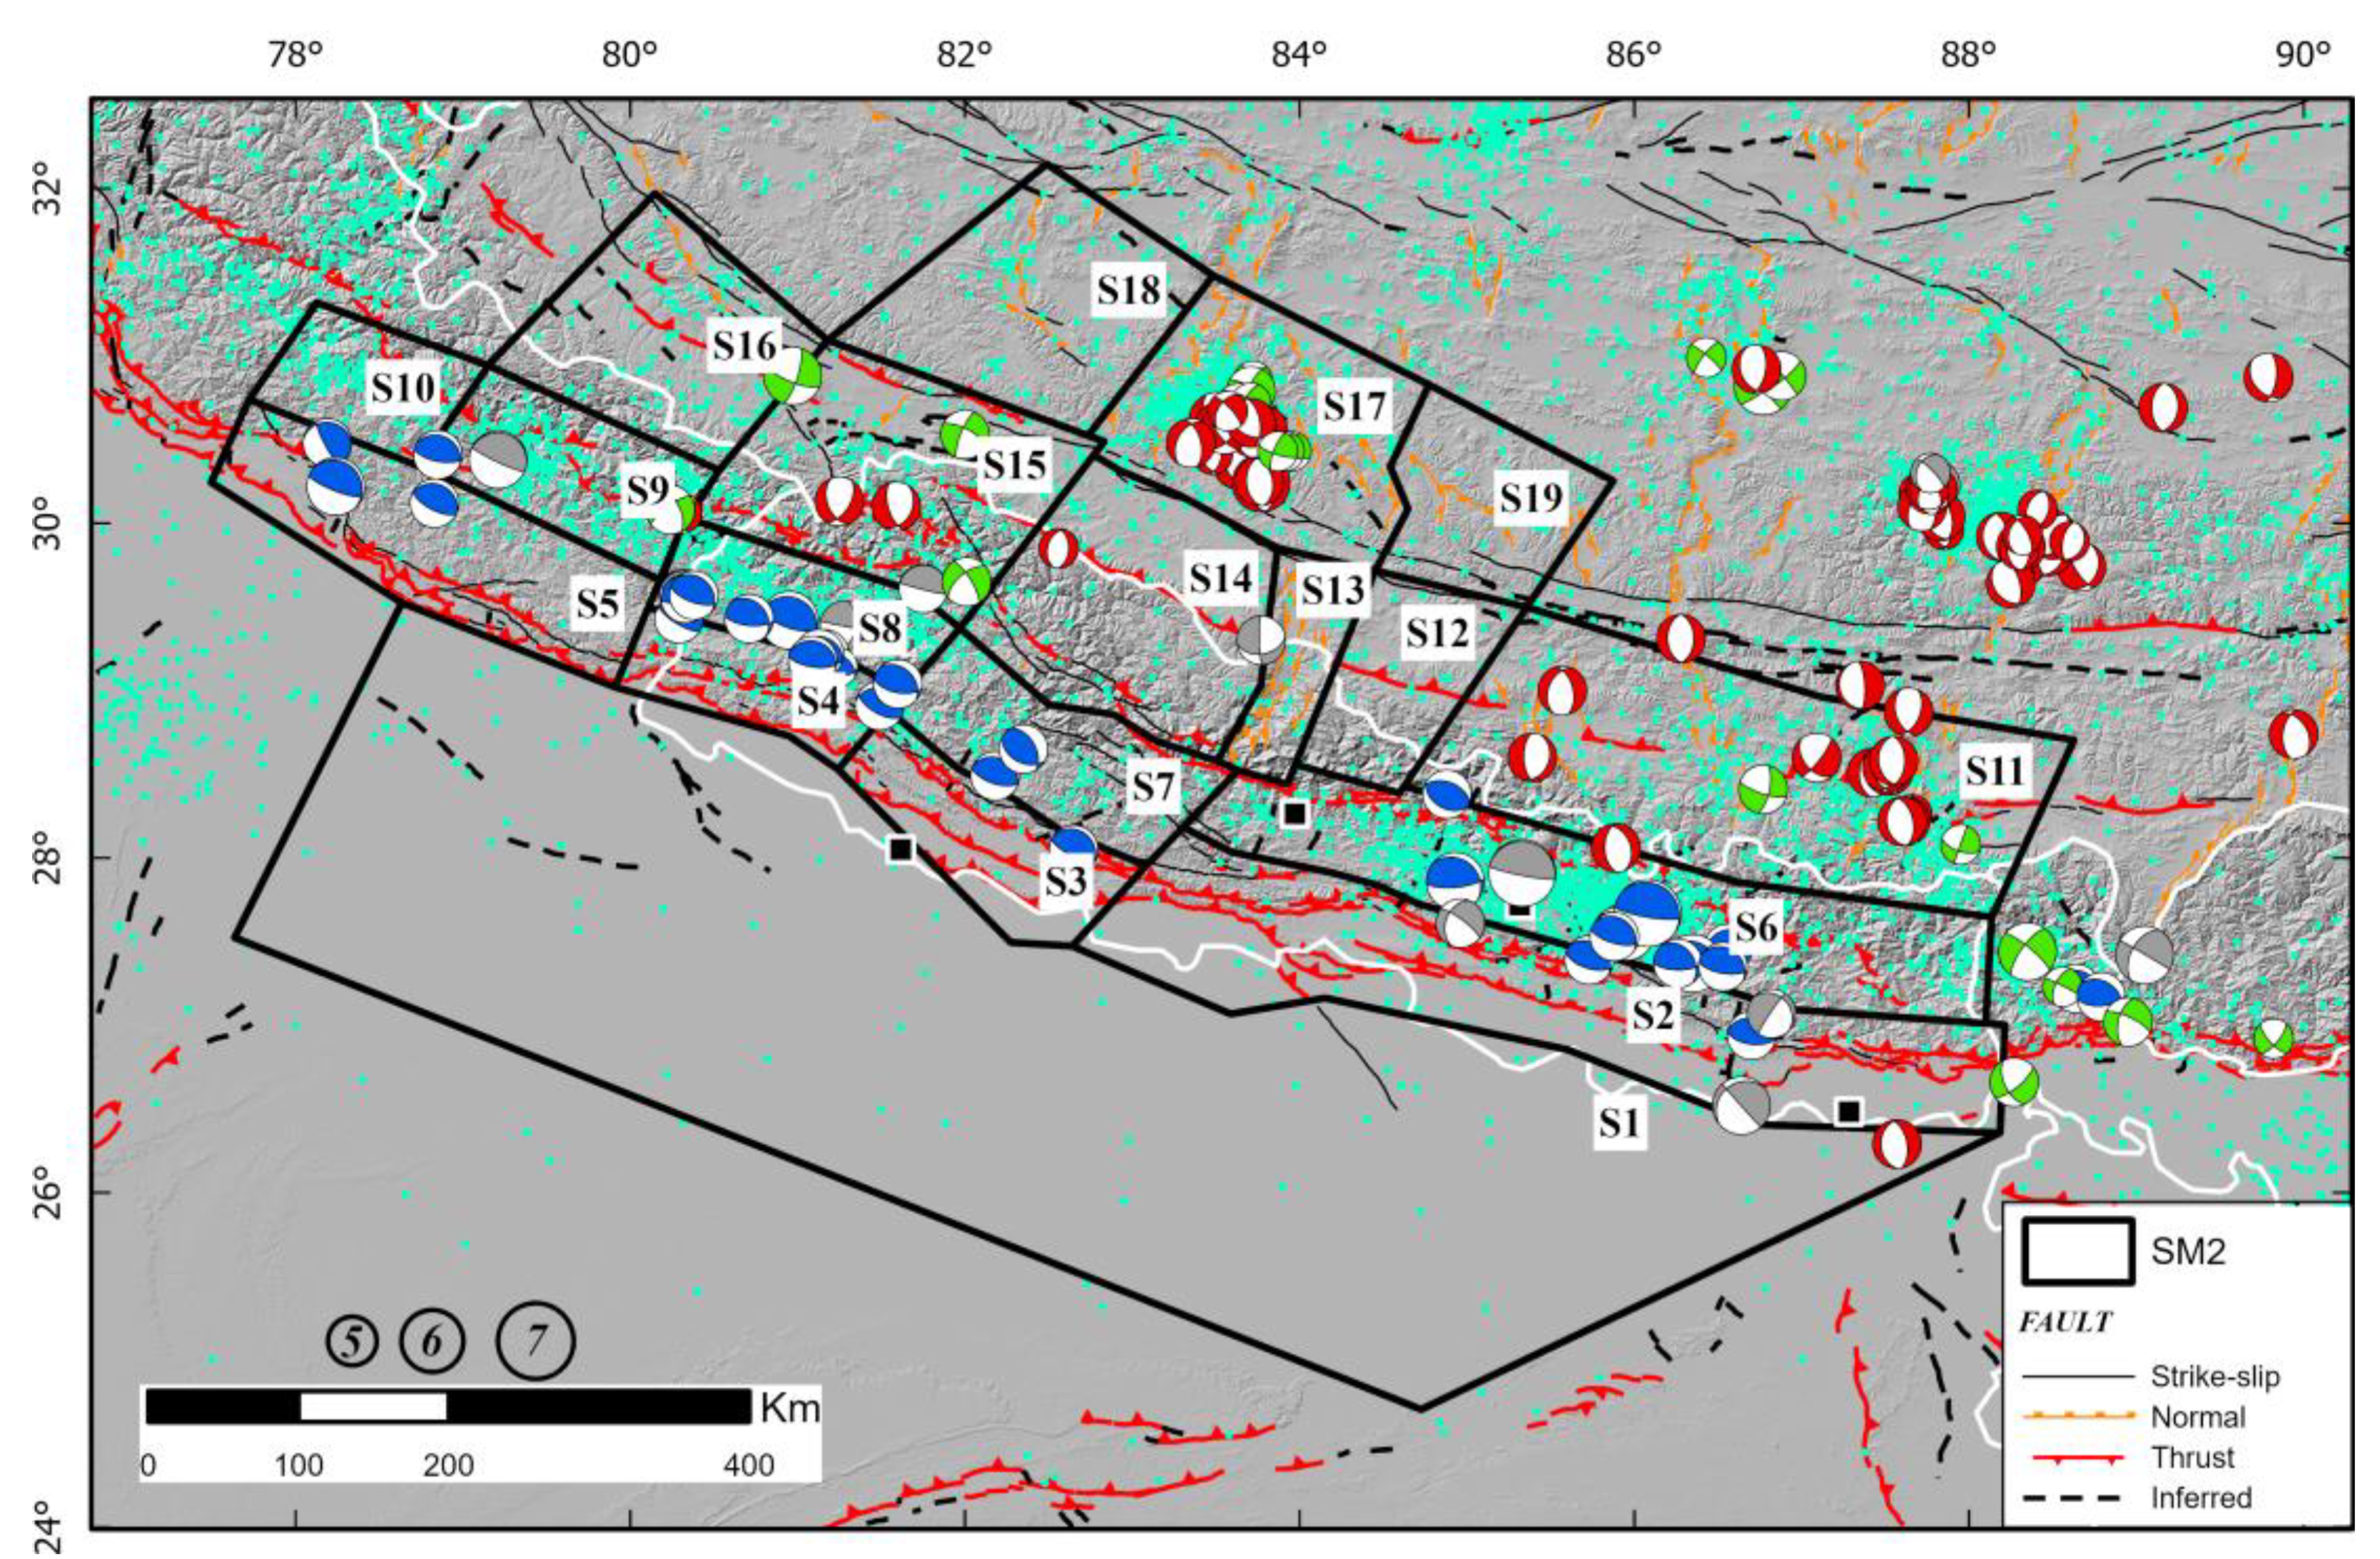
The seismic source model named SM2 developed for this study is composed of 19 zones that cover the major seismotectonic domain of the Himalayan Mountains, i.e., Western Nepal, North and East India, and south of Tibet (Figure 6). The SM2 area source model varies from the SM1 model in the sense that we consider the kinematics but also the geometry of the faults, the seismicity magnitude, and distribution and we mimic the geometry of the ramp-and-flat pattern of the decollement layer (MHT) at depth to define the boundary of the areas. The geometry and size of the polygon areas are consistent with the surface fault traces encompassing: (i) the sparse strike-slip faults within the foreland basin (S1) (ii) the ~1000 km long ~W–E to WNW–ESE active thrusts (MFT, MBT) in the Outer Himalaya (S2–S5), (iii) the mainly ~W–E reverse to ~N–S lateral faulting in the Lesser Himalaya (S6–S10), (iv) the MCT and MCT sub-parallel ~E–W reverse faults to ~N–S and NW–SE strike-slip and normal faults (S11–S16), (v) the mainly ~N–S normal to ~E–W lateral faulting of the extensional Tethys Himalayas at Southern Tibet (S17-S19). For the SM2 model, we assigned the same depth distribution as in the SM1 model, with a maximum depth of rupture up to 20 km for the zones S1 to S5, 30 km for the zones S6 to S10, 40 km for the zones S11 to S19. In addition, the SM2 source model extends further north and west than the SM1 model since we consider here the ramp-and-flat basal decollement layer extending over more than ~150 km beneath Nepal with a surface extent of ~1000 km (maximum rupture length of the MHT) encompassing the seismicity clustering to the west [9,27,69] (Figure 6). Therefore, this implies that the subduction-like interface domain with maximum magnitude up to Mw~9.0 encompasses the zones S6 to S10 and S14 to S16, where the greatest magnitude seismicity is localized. Whereas the zones S1 to S5, S11 to S13, and S17 to S19 are referenced as active crustal deformation that corresponds to an intraplate tectonic regime where the magnitude of earthquakes never exceeds Mw~7. As such, according to the maximum magnitude at each zone provided by the seismicity catalog, we attributed the maximum magnitude of Mw~9 for the zones S14 to S16 located around the epicenter of the 1505 AD earthquake. We attributed a maximum magnitude of Mw~8.5 for zone S6 in the east (Kathmandu vicinity), Mw~8 for the zones S7 to S10, Mw~7.5 for zones S1 to S2, S11 to S13, S17 to S19 and Mw~7 for the zones S3 to S5. In both cases, we cautiously add 0.5 to the maximum magnitude observed at each zone before the integration into the model (see Supplementary Materials, Tables S1–S3 for detailed parameters) relying on the maximum observed magnitude from our seismicity catalog, in previous PSHA publications [75,76] and similarities among tectonic regions which remains rather conservative but widely applied method for PSHA studies. In terms of crustal structure, we delimitate the polygon boundaries reflecting the geometry of the MHT proposed by [9] with a simplified ramp-flat-ramp symmetrical structure emerging at the MFT and rooting at 20–40 km depth. This is consistent with the fact that the surface fault traces as well as the seismicity distribution are related to the geometry of the basal thrust at depth according to [1] and as it has been highlighted during the 2015, Gorkha earthquake [5].
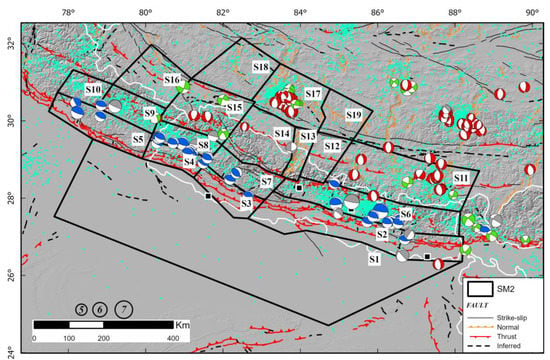
Figure 6.
SM2 model zonation overlapped on the seismotectonic map of Nepal displaying main active faults (from AFEAD database, http://neotec.ginras.ru/index/mapbox/database_map.html; accessed on 15 April 2023), seismicity and focal mechanisms mainly from the CMT catalog (https://www.globalcmt.org; accessed on 15 April 2023) where red pattern is for normal, green for strike-slip, and blue for thrust faulting events. Grey patterns are for undefined faulting events due to either stress heterogeneity or spatial variations of stress. S1 to S19 correspond to the SM2 zones names.
As for the previous source model, we used the comprehensive AFEAD fault catalog (http://neotec.ginras.ru/index/mapbox/database_map.html; accessed on 30 April 2023), the focal mechanism from the literature [1,66,68,70,71,77,78] and the CMT catalog (https://www.globalcmt.org; accessed on 15 April 2023) in order to better assess the kinematics of faulting in each area.
4.1.3. Macrozone/Fault Source Model—SM3F
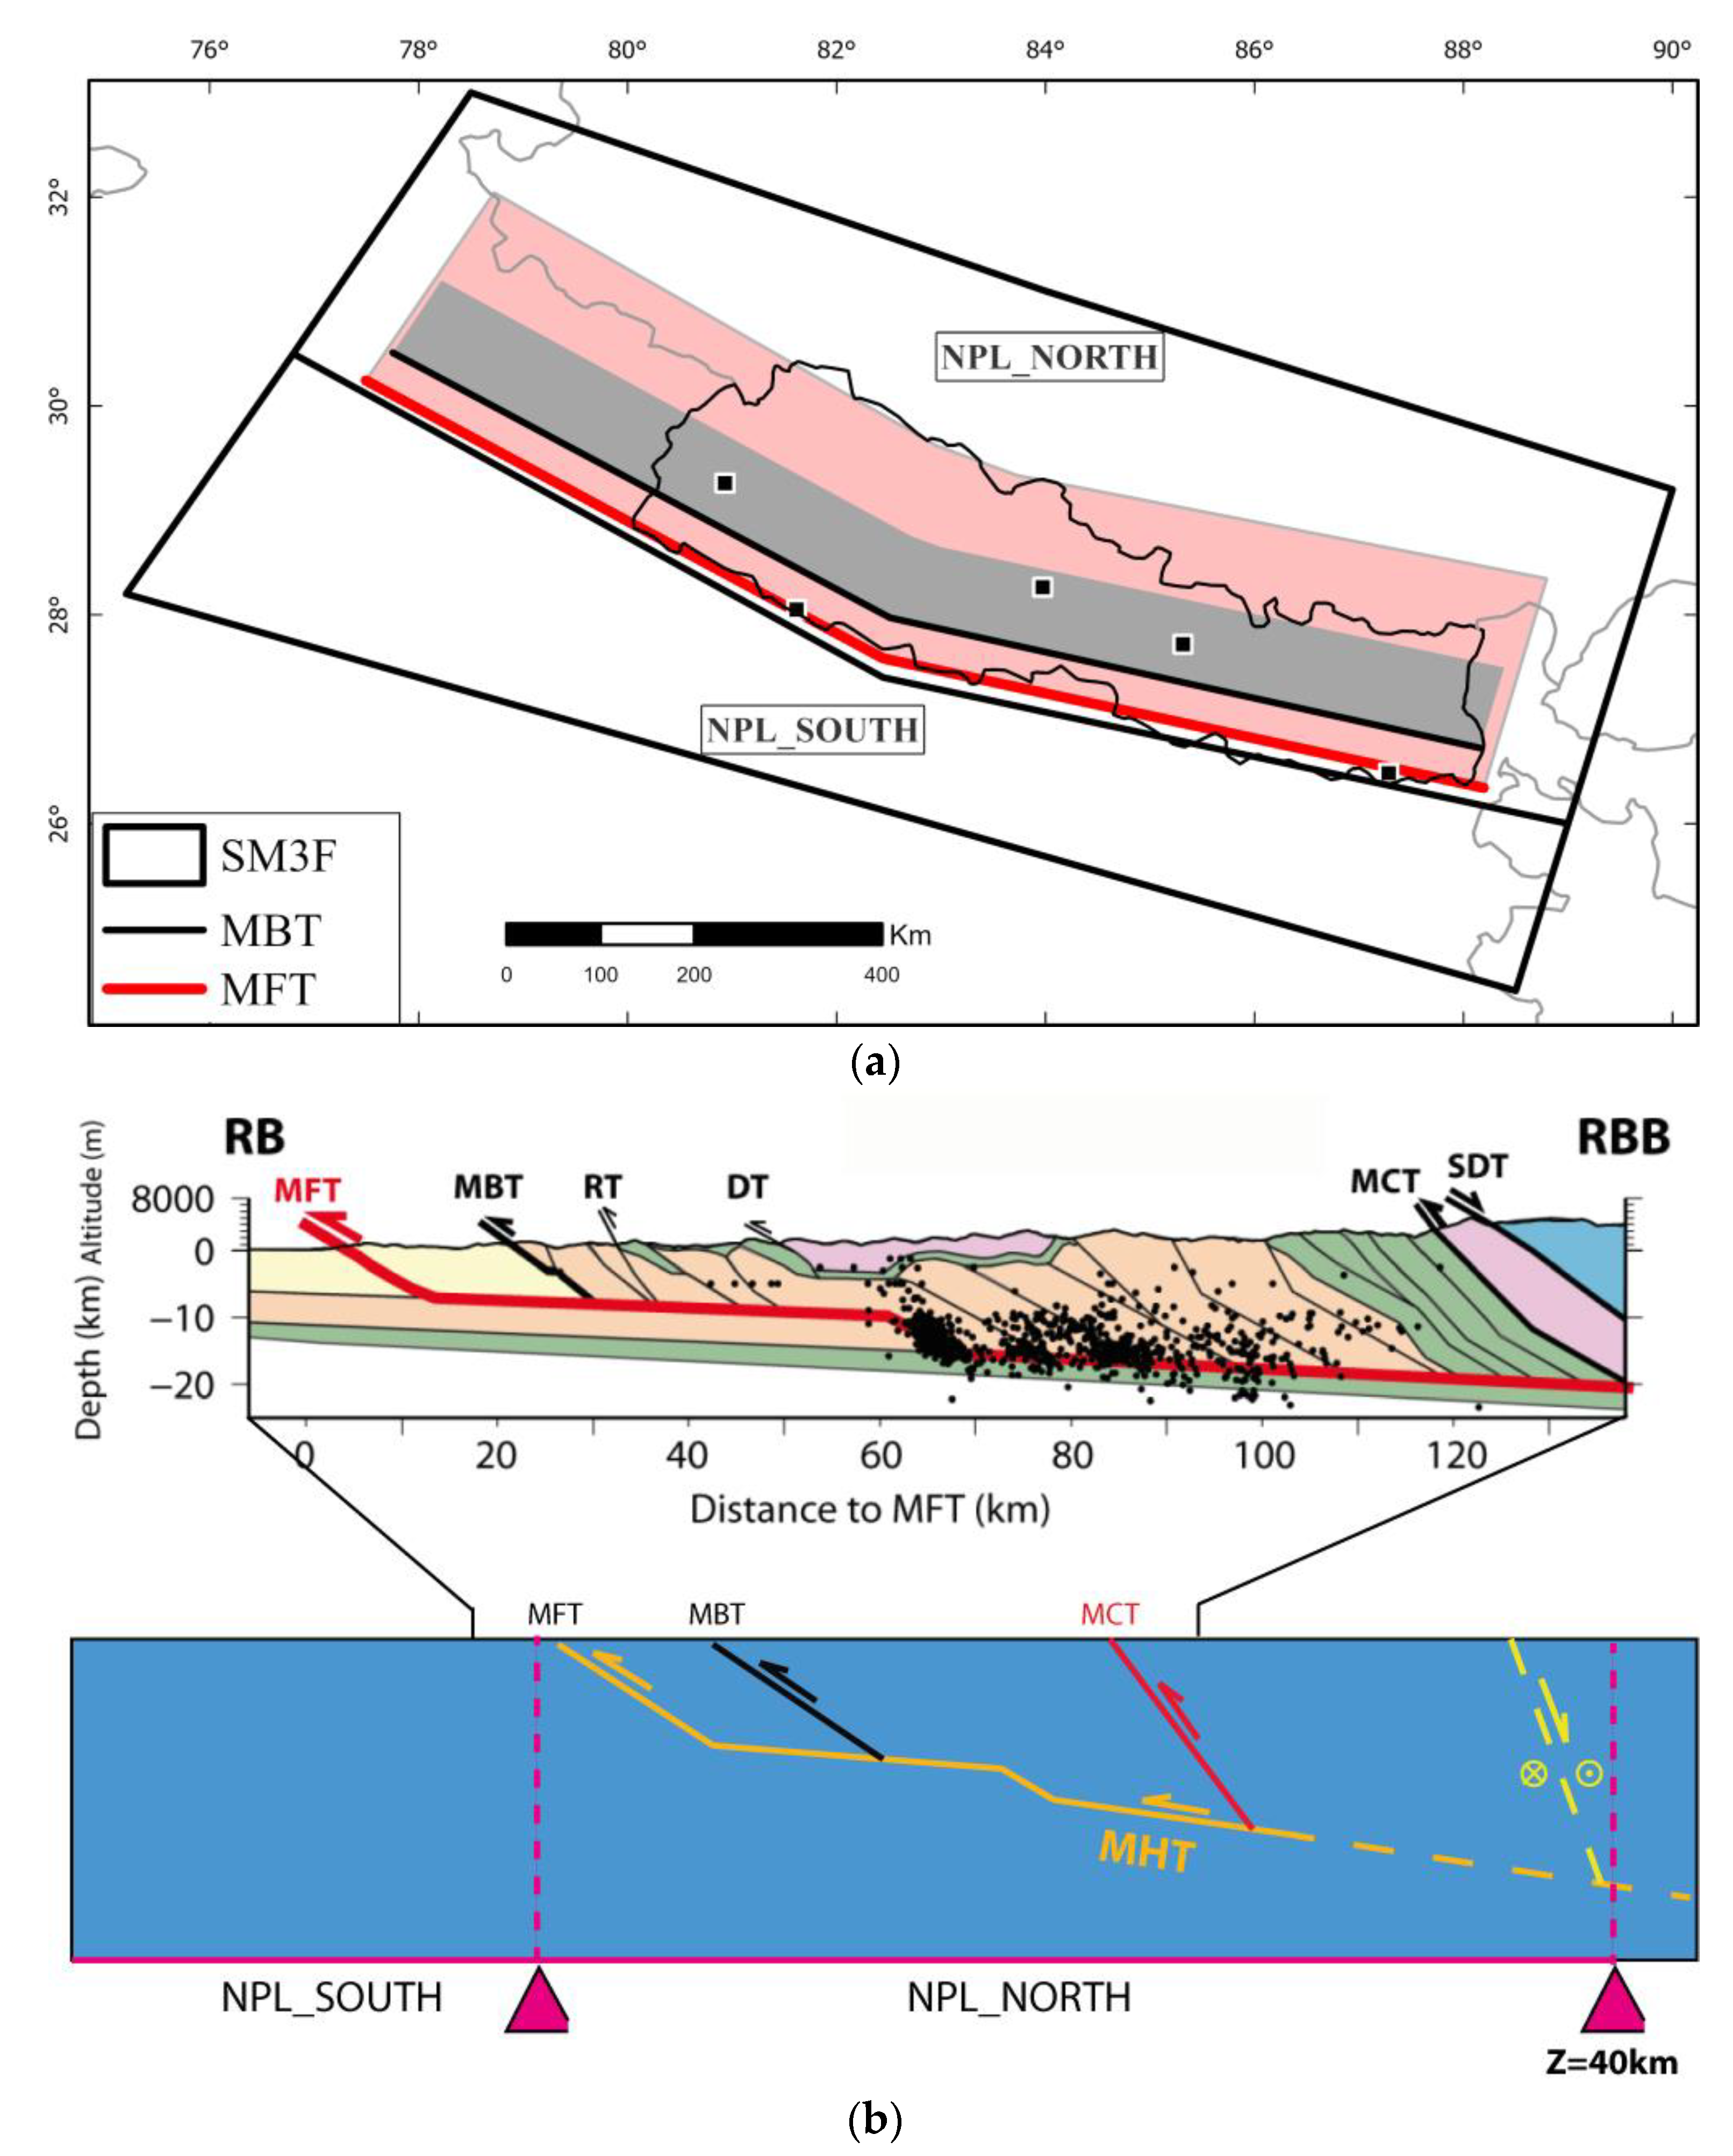
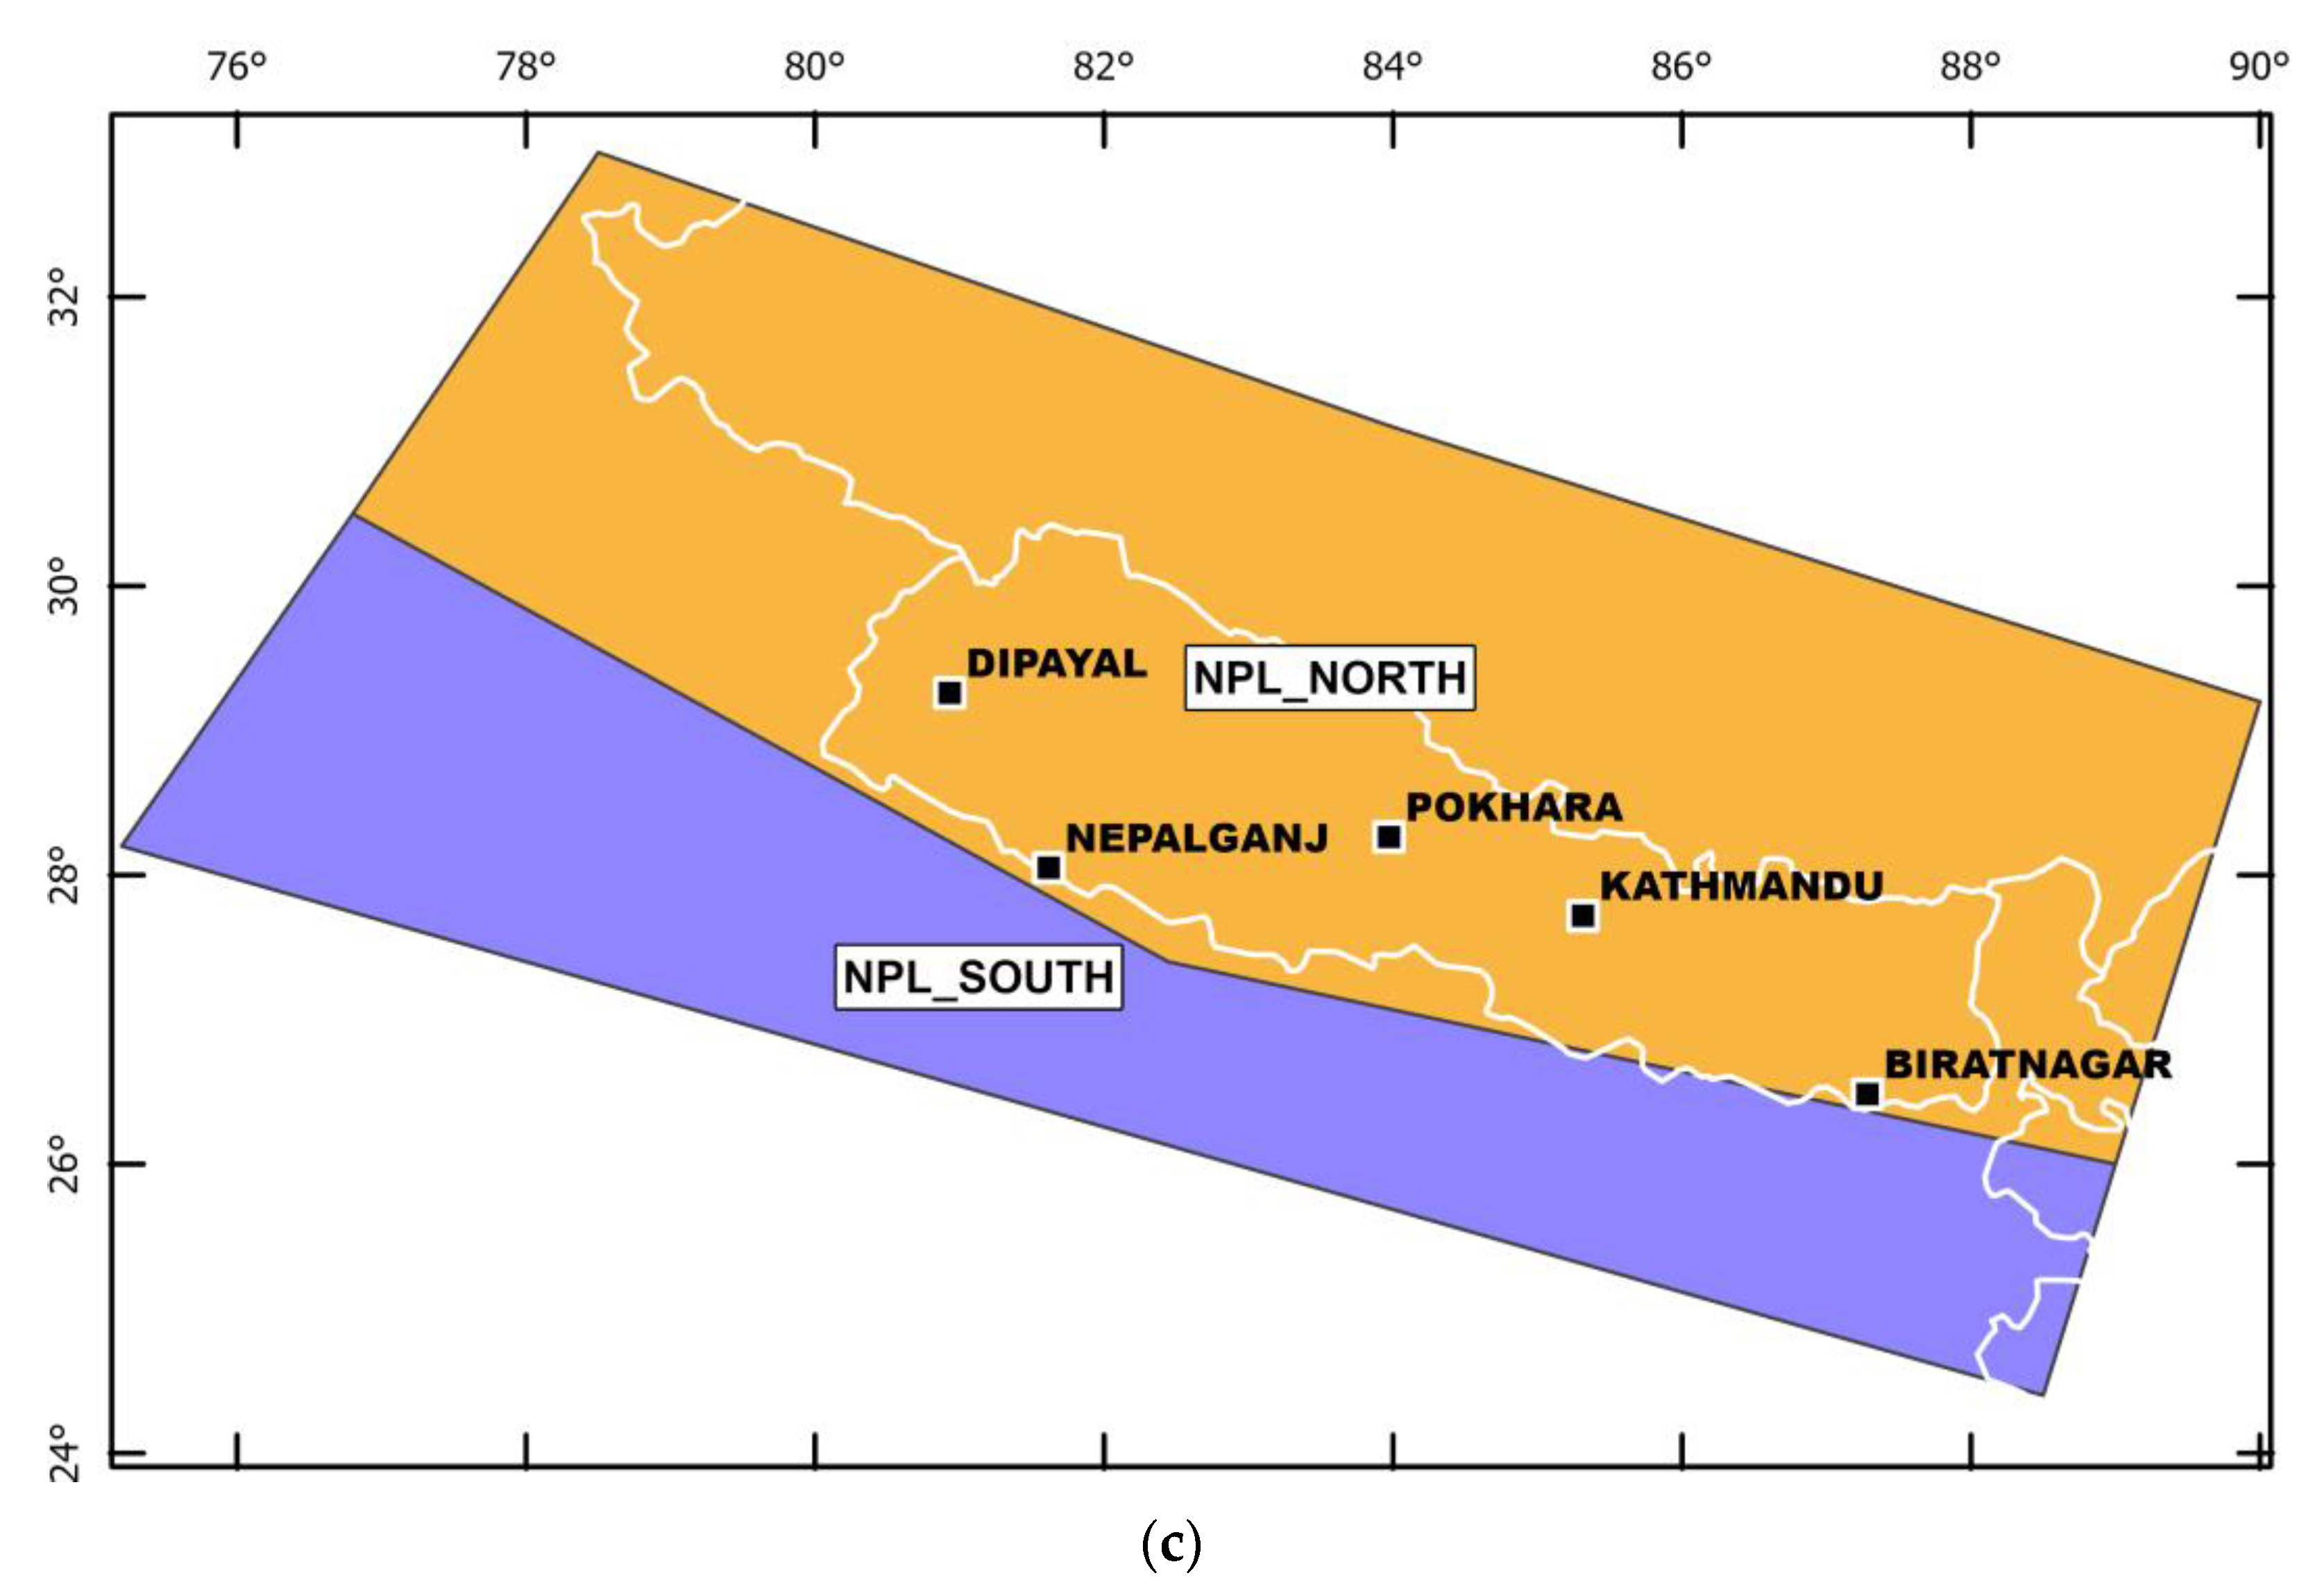
To consider the major thrust faults of the Nepal region capable to accommodate the entire convergence rate and thus, to produce large to great earthquakes (Mw > 8) we defined two simplified homogenous seismic zones models at the regional scale (called SM3F). Unlike the two previous models, we consider the faults in the north area as 3D planes that allow us to reflect accurately the geometry and kinematics of the major faults at depth, associated (or not) with the basal decollement layer (MHT). In order to prioritize the effect of the major fault in the seismic hazard models, we simplify the seismicity source volumes to two areas with homogenous seismicity (Figure 7), and in turn, we consider that the great magnitude earthquakes (Mw ≥ 8) initiate on the MHT at defined depth and can rupture the main structures such as the MFT and the MBT. Furthermore, according to recently published studies [5,79,80] that highlight a slip rate deficit over the Himalayan chain, we propose, as a new approach, that part of the convergence rate can also be distributed among known (or unknown) individual crustal faults, with or without surface expression, located northward between the MBT and the Tibetan Plateau (e.g., the MCT) that can also produce large magnitude earthquakes. Each of these structures is weighted, depending on their probability of occurrence (given their recurrence rate of earthquakes, whether it is known), before being introduced into the models. In addition, three fault recurrence models are applied based either on geological data (i.e., slip rate) or on the seismicity catalog distribution to account for the epistemic uncertainties.
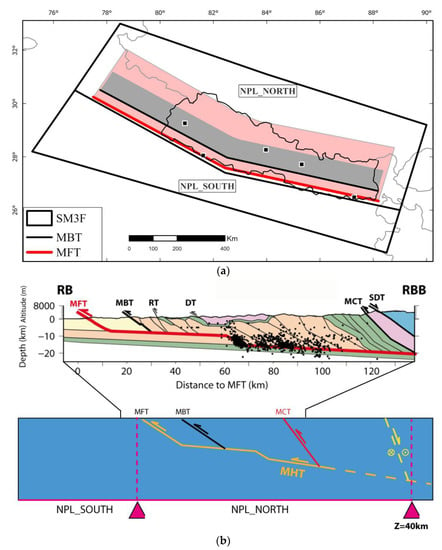
Figure 7.
(a) Macrozone/fault SM3F model zonation with the surface traces for simplified main thrust faults considered in the model. (b) Simplified and not to scale cross-section of the MHT with the main related thrusts considered into the SM3F model modified after [14].
Hence, the simplified two seismic source zones (NPL_NORTH, NPL_SOUTH) are located on either side of the frontal thrust (MFT) that circumscribe the seismically active zone in the north and the less active foreland basin in the south as suggested by the distribution of the seismicity. The external boundaries encompass the most active part of the Himalayas eastward and westward of Nepal (i.e., India in the south, east, and west, and the Tibetan Plateau in the north). In addition, the north area (NPL_NORTH) is considered a subduction-like interface domain capable of Mw ≥ 8, according to the historical records of M > 8.5 events (e.g., the 1505 earthquake) [2,32] with major reverse and minor lateral and normal faulting components and includes 3D fault geometry with a depth of rupture varying from 15 km to 40 km (see Supplementary Materials, Table S3 for detailed parameters). Unlike the northern zone, the southern zone (NPL_SOUTH) is considered a domain of active shallow crustal deformation (that corresponds to an intraplate tectonic regime) where the magnitude of earthquakes never exceeds Mw~7.5 with a maximum depth of 20 km and with a major strike-slip component.
The internal boundary between the two polygons follows the sharp geometry of the very frontal thrust (MFT) that reflects the complex geometry of the flat-and-ramp fault plane at depth.
4.1.4. Homogenous Activity Parameters
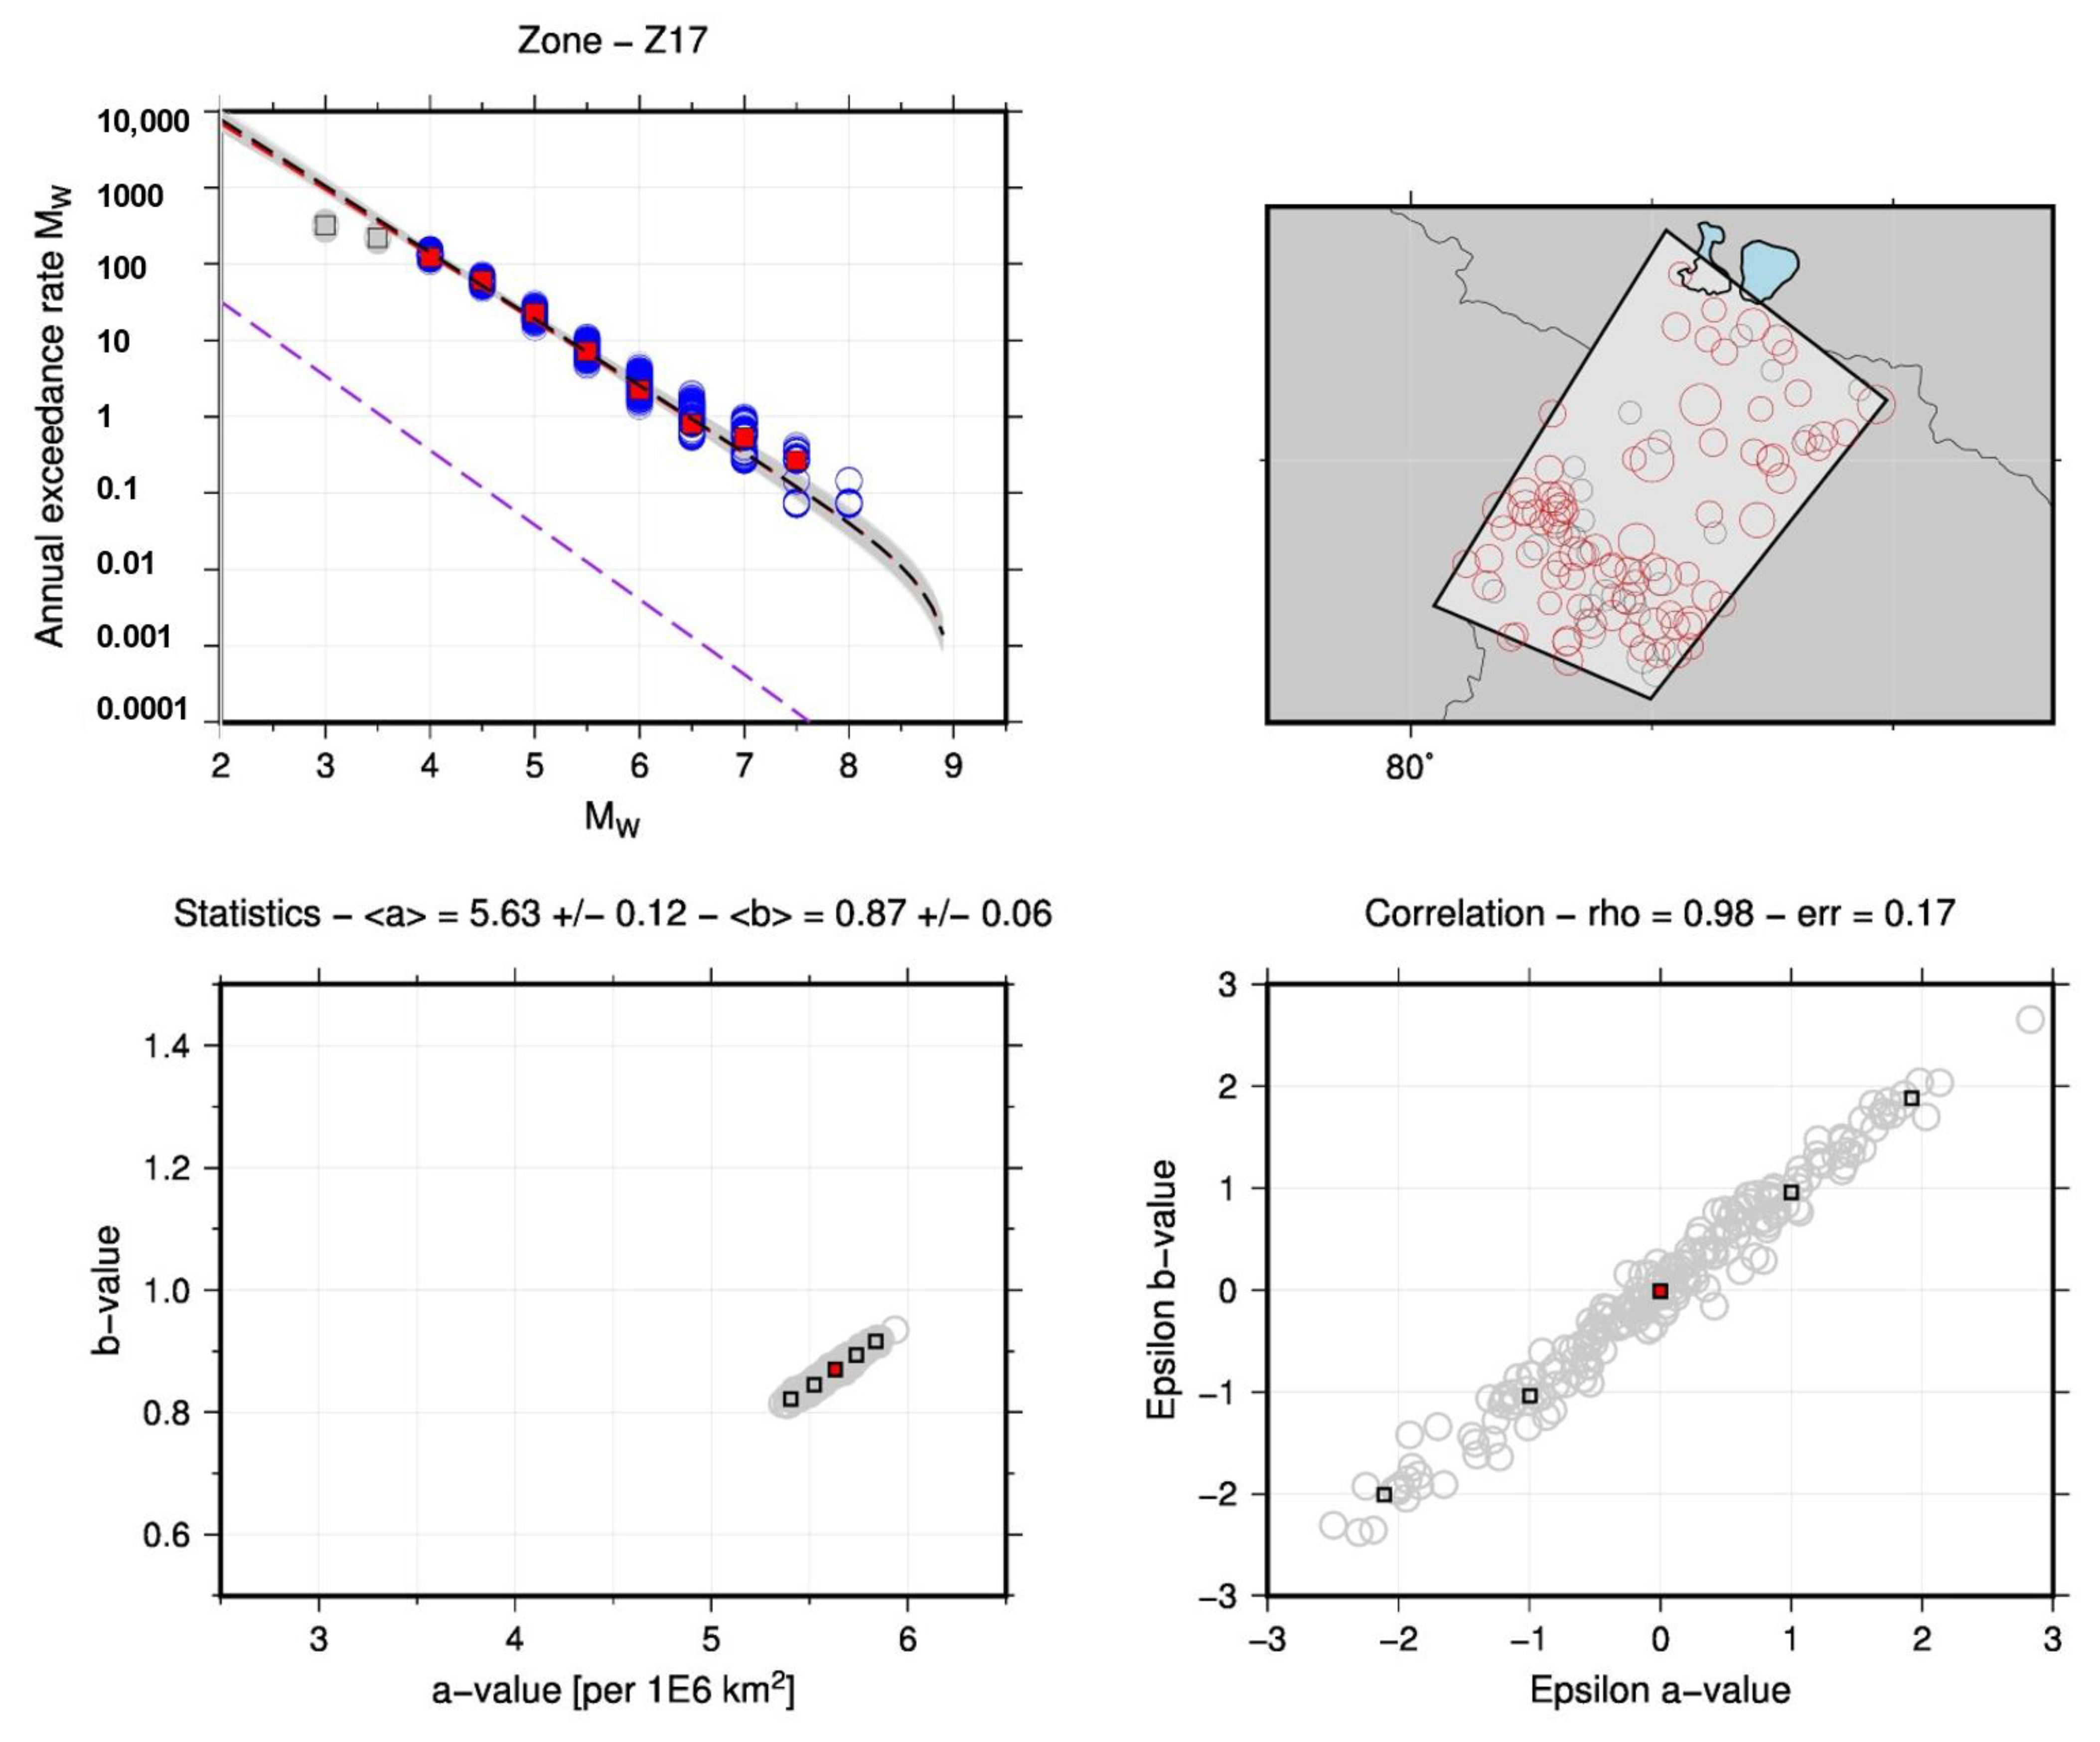
The observed activity rates of the seismotectonic zones of the crustal and subduction interface sources are determined from the catalogs compiled for this study. In each zone, the seismicity is homogeneous, and the Gutenberg–Richter relationship [81] is assessed. The Gutenberg–Richter model has been adopted to calculate the seismic activity rates in its truncated form. The EPRI [82] method is adopted to determine the a and b values, which is an updated and improved version of the Weichert method [83], which takes into account the magnitude, location, and completeness uncertainties through the use of a synthetic catalog. The project catalog is used to compute synthetic catalogs using Gaussian distributions to consider and propagate the uncertainty for location and magnitude. Similarly, the uncertainties on completeness years are also propagated for the calculation of the activity rates adopting a uniform distribution. Figure 8 is an example of the Gutenberg–Richter model evaluation made for a zone (Z17) volume source included in SM1 which represents one of the most active regions of Nepal. The parameters (a and b values) obtained are consistent with the active regions. The correlation between the a and b values is close to 1 which suggests that the Gutenberg–Richter parameter is quite well constrained based on the seismicity catalog.
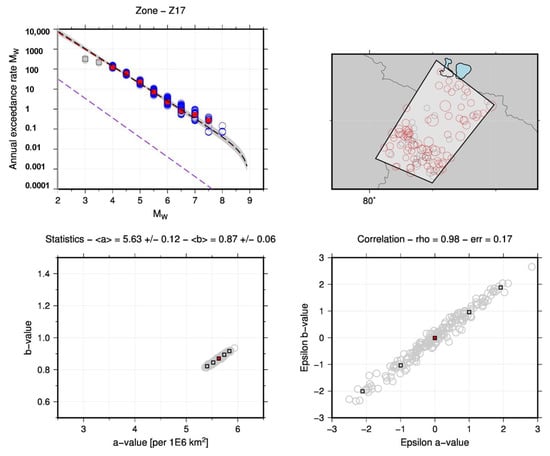
Figure 8.
Example of GR evaluation performed for the zone Z17 for SM1 evaluated based on catalog developed in this study. (Top left) Observed seismicity rates (blue circles for individual solutions) compared to modeled G-R curves (gray lines for individual solutions). The mean G-R curve is shown in black and compared to the SCR G-R defined by [84] shown in purple. The red color refers to the solution obtained with the original catalog. (Top right) Map of the seismicity considered in the analysis. Only the epicenter shown as red circles are selected for the calculation after applying the completeness criteria (Bottom left) Statistics of the a-values (per 1 million km2) and b-values obtained through the Monte Carlo sampling (gray circles). The percentiles 2, 16, 50, 84, and 98th are shown as squares. (Bottom right) Analysis of the correlation of the individual G-R solutions (gray circles).
We merged the zones of similar tectonic features to compute GR to make the seismicity sample more statistically robust (for example we merged Z1, Z2, and Z3 in the southwest of Nepal). The Gutenberg–Richter models derived for all the sources SM1, SM2, and SM3 (see Supplementary Materials, Tables S1 and S2 for further details) are reasonably well constrained. The a-value parameters are scaled to the area of a million square kilometers for inter-comparability purposes. It should be underlined that the b values obtained for the sources are close to the adopted prior value 1.0.
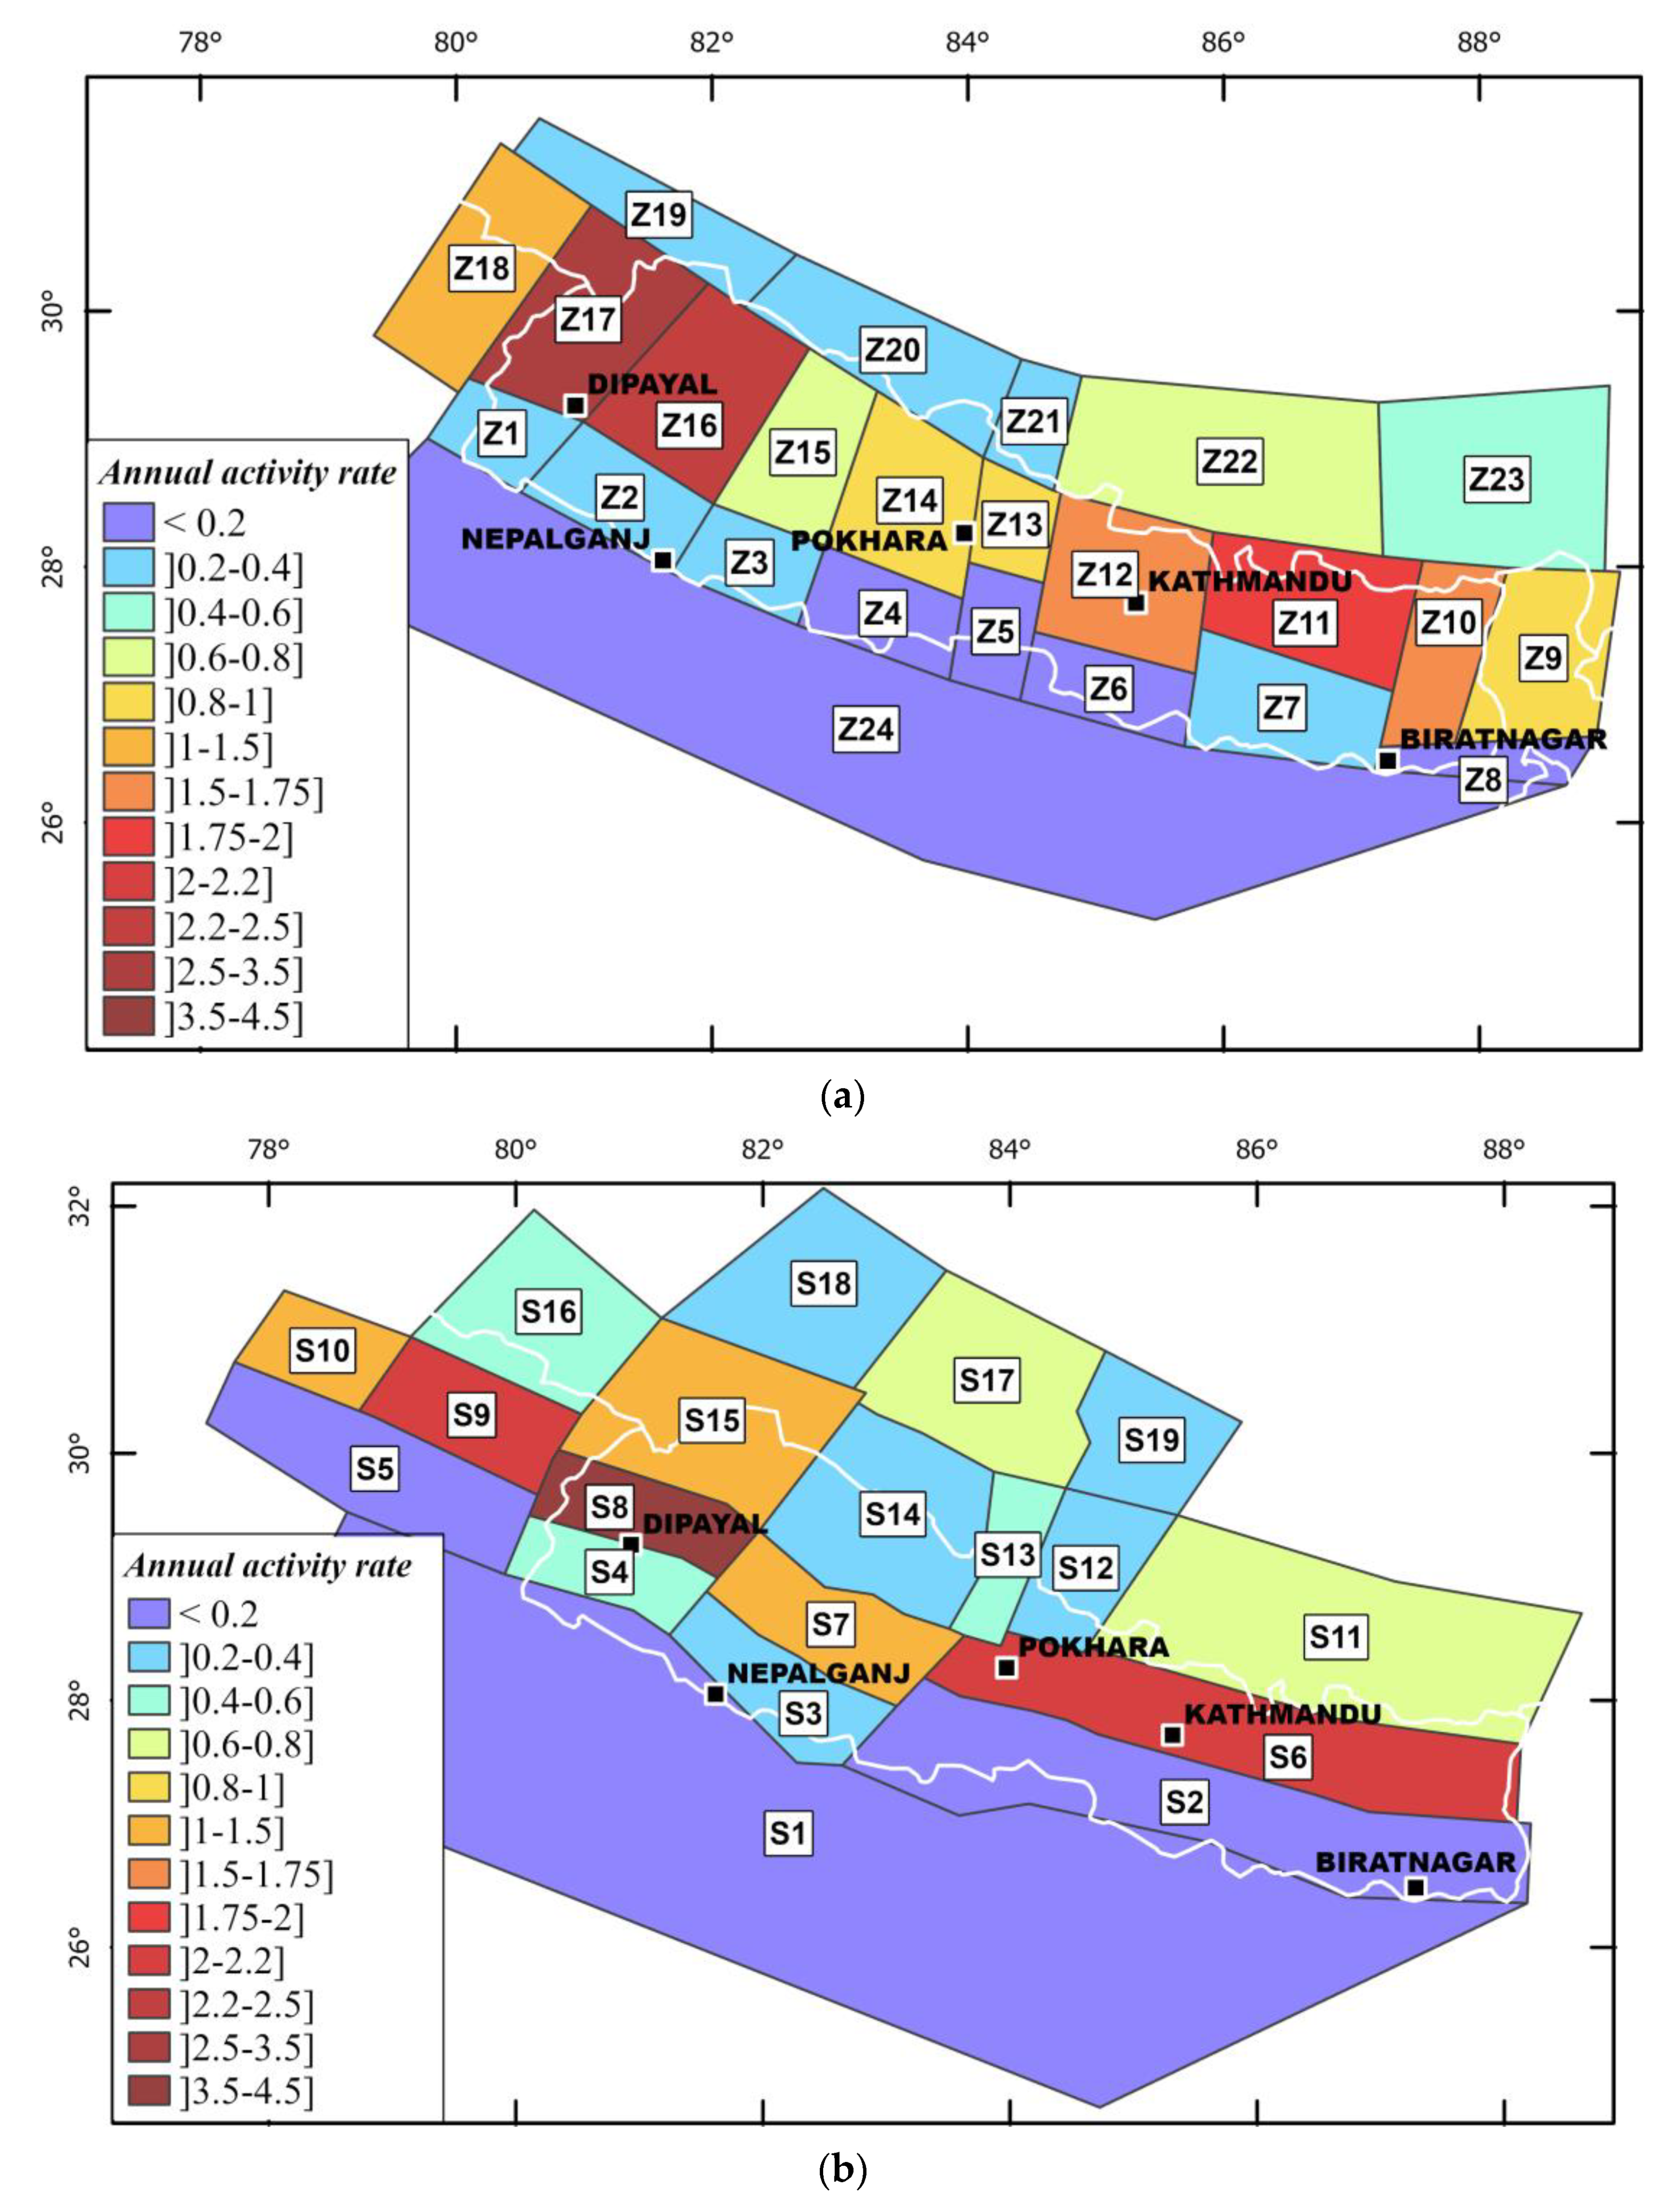
The comparison of activity rates in terms of the annual rate of occurrence (λ) (scaled to million km2 considering Mw ≥ 6.0) derived from the GR adjustments (Figure 9) shows the variation of effective seismicity rates. In general, we can observe the progression of higher rates from zones in the south to the zones in the north consistently with the historical seismicity patterns. The highest rate is obtained for zone Z17 in SM1 and zone S8 in SM2. For the case of SM3, the highest seismicity rate is obtained for NPL_NORTH. These differences between SM1, SM2, and SM3 demonstrate the part of epistemic uncertainties for final PSHA calculations.
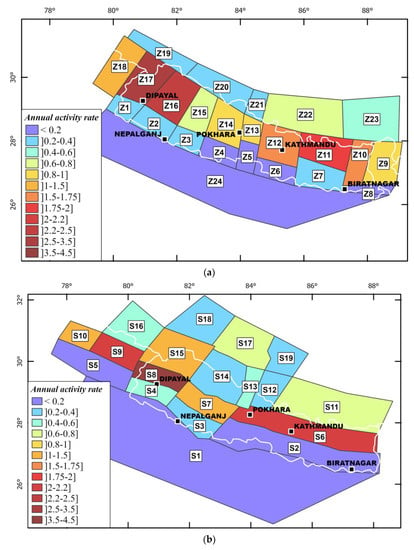
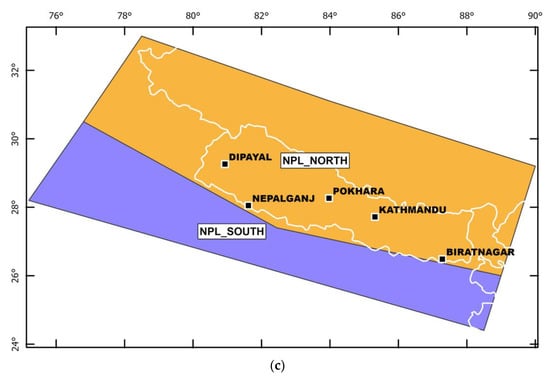
Figure 9.
Cumulated annual activity rates scaled to million km2 considering Mw ≥ 6.0 for the three models (a) SM1; (b) SM2; and (c) SM3F. The color scale prevails for the three models.
4.2. Major Himalayan Thrust Fault Sources
The MHT is the main seismic source in Nepal and has the potential for mega earthquakes. The MHT is thought to extend as a succession of flat and ramp decollement beneath the Lesser Himalaya and to form a steeper ramp at the front of the High Himalaya (Figure 7b). Most of the crustal deformation in the Himalayas occurs on the Main Himalayan Thrust fault (MHT) [3,67], where the Indian lithosphere underthrusts beneath the chain. The MHT absorbs about 20 mm/year of the India–Eurasia convergence [85] which accounts for about half of the total convergence rate. The MHT reaches the surface at the Main Frontal Thrust fault (MFT) [40], where the secular slip rate has been estimated from the study of uplift of Holocene terraces to be ~20 mm/year [2,3,70,80]. Whereas the MBT formed earlier than the MFT, as suggested by parallel lithological contact with the Proterozoic stratigraphy level (named Lesser Himalaya domain) exposed in its hanging wall, recent activity along one of its reactivated segments has been observed through geological and geomorphic studies allowing to describe the occurrence of at least two large earthquakes over the last 2000 years [4,37]. The MCT, located further north, formed at ~22–18 Ma and seems to have accommodated a total shortening of 140–500 km [38,39]. At present-day, the MCT is considered inactive by many authors [40,41] but might have actually remained episodically active as suggested by [19,42]. To the north of the MBT, the deformation is distributed over moderate active faults with right-lateral strike-slip component (i.e., the Western Nepal Fault System, the Karakoram fault… [43]) then gradually displaying both lateral and normal components toward the Tibetan Plateau.
Previous geodetic and modeling studies [27,85,86,87] assumed the MHT to be locked from the surface to a certain depth and found a satisfying fit to the data with a mean fault dipping about 8–10° to the north and a downdip end of the locked part of the fault about 100–150 km from its surface trace. The observation of meter scale displacements on some regions of the MFT indicates that during large (Mw > 8) earthquakes, the locked portion of the fault sometimes ruptures all the way to the surface [32,40]. The width of the fault surface that corresponds to the locked-to-creeping transition has been estimated at around >20 km depth [29,88]. In our models, we consider that the Mw > 8 great earthquakes initiate on the MHT and either propagate onto the MFT (MHT + MFT) accommodating 60% of the slip rate or onto the MBT (MHT + MBT) accommodating 20% of the slip rate or onto various individual crustal faults scattered between the MBT and the normal faulting Tibetan Plateau (including the MCT) accommodating the last 20% of the slip rate [27,85].
Furthermore, according to paleo-seismological studies, the Himalayas may have produced earthquakes with magnitudes as high as Mw~8.8. Along the Himalayan foothills in Nepal, there is evidence for a ~17 m slip event on the MFT (dated to 1100 C.E) at locations separated by 240 km along strike [32,40]. Evidence for a similar event with an age loosely constrained to ca. 1413 C.E. was also found in the Kumaon and Garhwal Himalayas [45]. In fact, there is a possibility that these paleo ruptures may relate to the 1505 historical earthquake, which would then be inferred to have ruptured the Himalayan front from Western Nepal to Garwhal over a distance possibly as large as 800 km [89]. Hence, regarding the maximum magnitude (Mw ≤ 9) and depth of rupture (≤40 km), we assume that the fault surface rupture does not exceed an average length of 1000 km that can rupture at once. In addition, to be consistent with the geological data from the literature, we consider in our model a mean slip rate of 16 mm/year overall Nepal [27], an MHT mean dip of ~8° [1], a wide range of fault seismic coupling comprised between 20% and 80% [31,35] as predicted from its lateral geometry variation [35,36].
Three alternative recurrence seismicity models were considered for the faults which include a characteristic model [90] CHAR_YC85 and exponential model [90] GR_YC85 for which the fault activity is characterized by documented geologic, geomorphic, or geodesic data. In a characteristic (CHAR_YC85) model, the annual rate takes a uniform distribution above a certain threshold of magnitude while in the exponential (GR_YC85) approach, the distribution of the seismic annual rates with magnitude takes a truncated exponential form: the activity rate is constrained by the upper bound magnitude, the b-value for the region, and the fault slip rate. The third model is a Poissonian, GR_ab model based on GR parameters calculated from the seismic catalog.
The limit of background Mmax 8.0 is chosen since we model the major thrusts able to generate the megathrusts earthquakes. Below this magnitude threshold, the seismicity is uniformly distributed in the volume of the background zone on fictitious faults and constrained by the GR parameters of the zone. The sensitivity analysis due to alternative recurrence models is conducted and subsequently, weights are assigned, which is discussed in detail in Section 6.
4.3. Heterogenous or Smoothed Models—SM4
As an alternative to the homogenous seismicity rate model, a smoothing approach was used which avoids the use of any seismotectonic zonation. This method assumes that future earthquakes are considered more likely to occur near past earthquakes than in areas where no earthquakes have been observed.
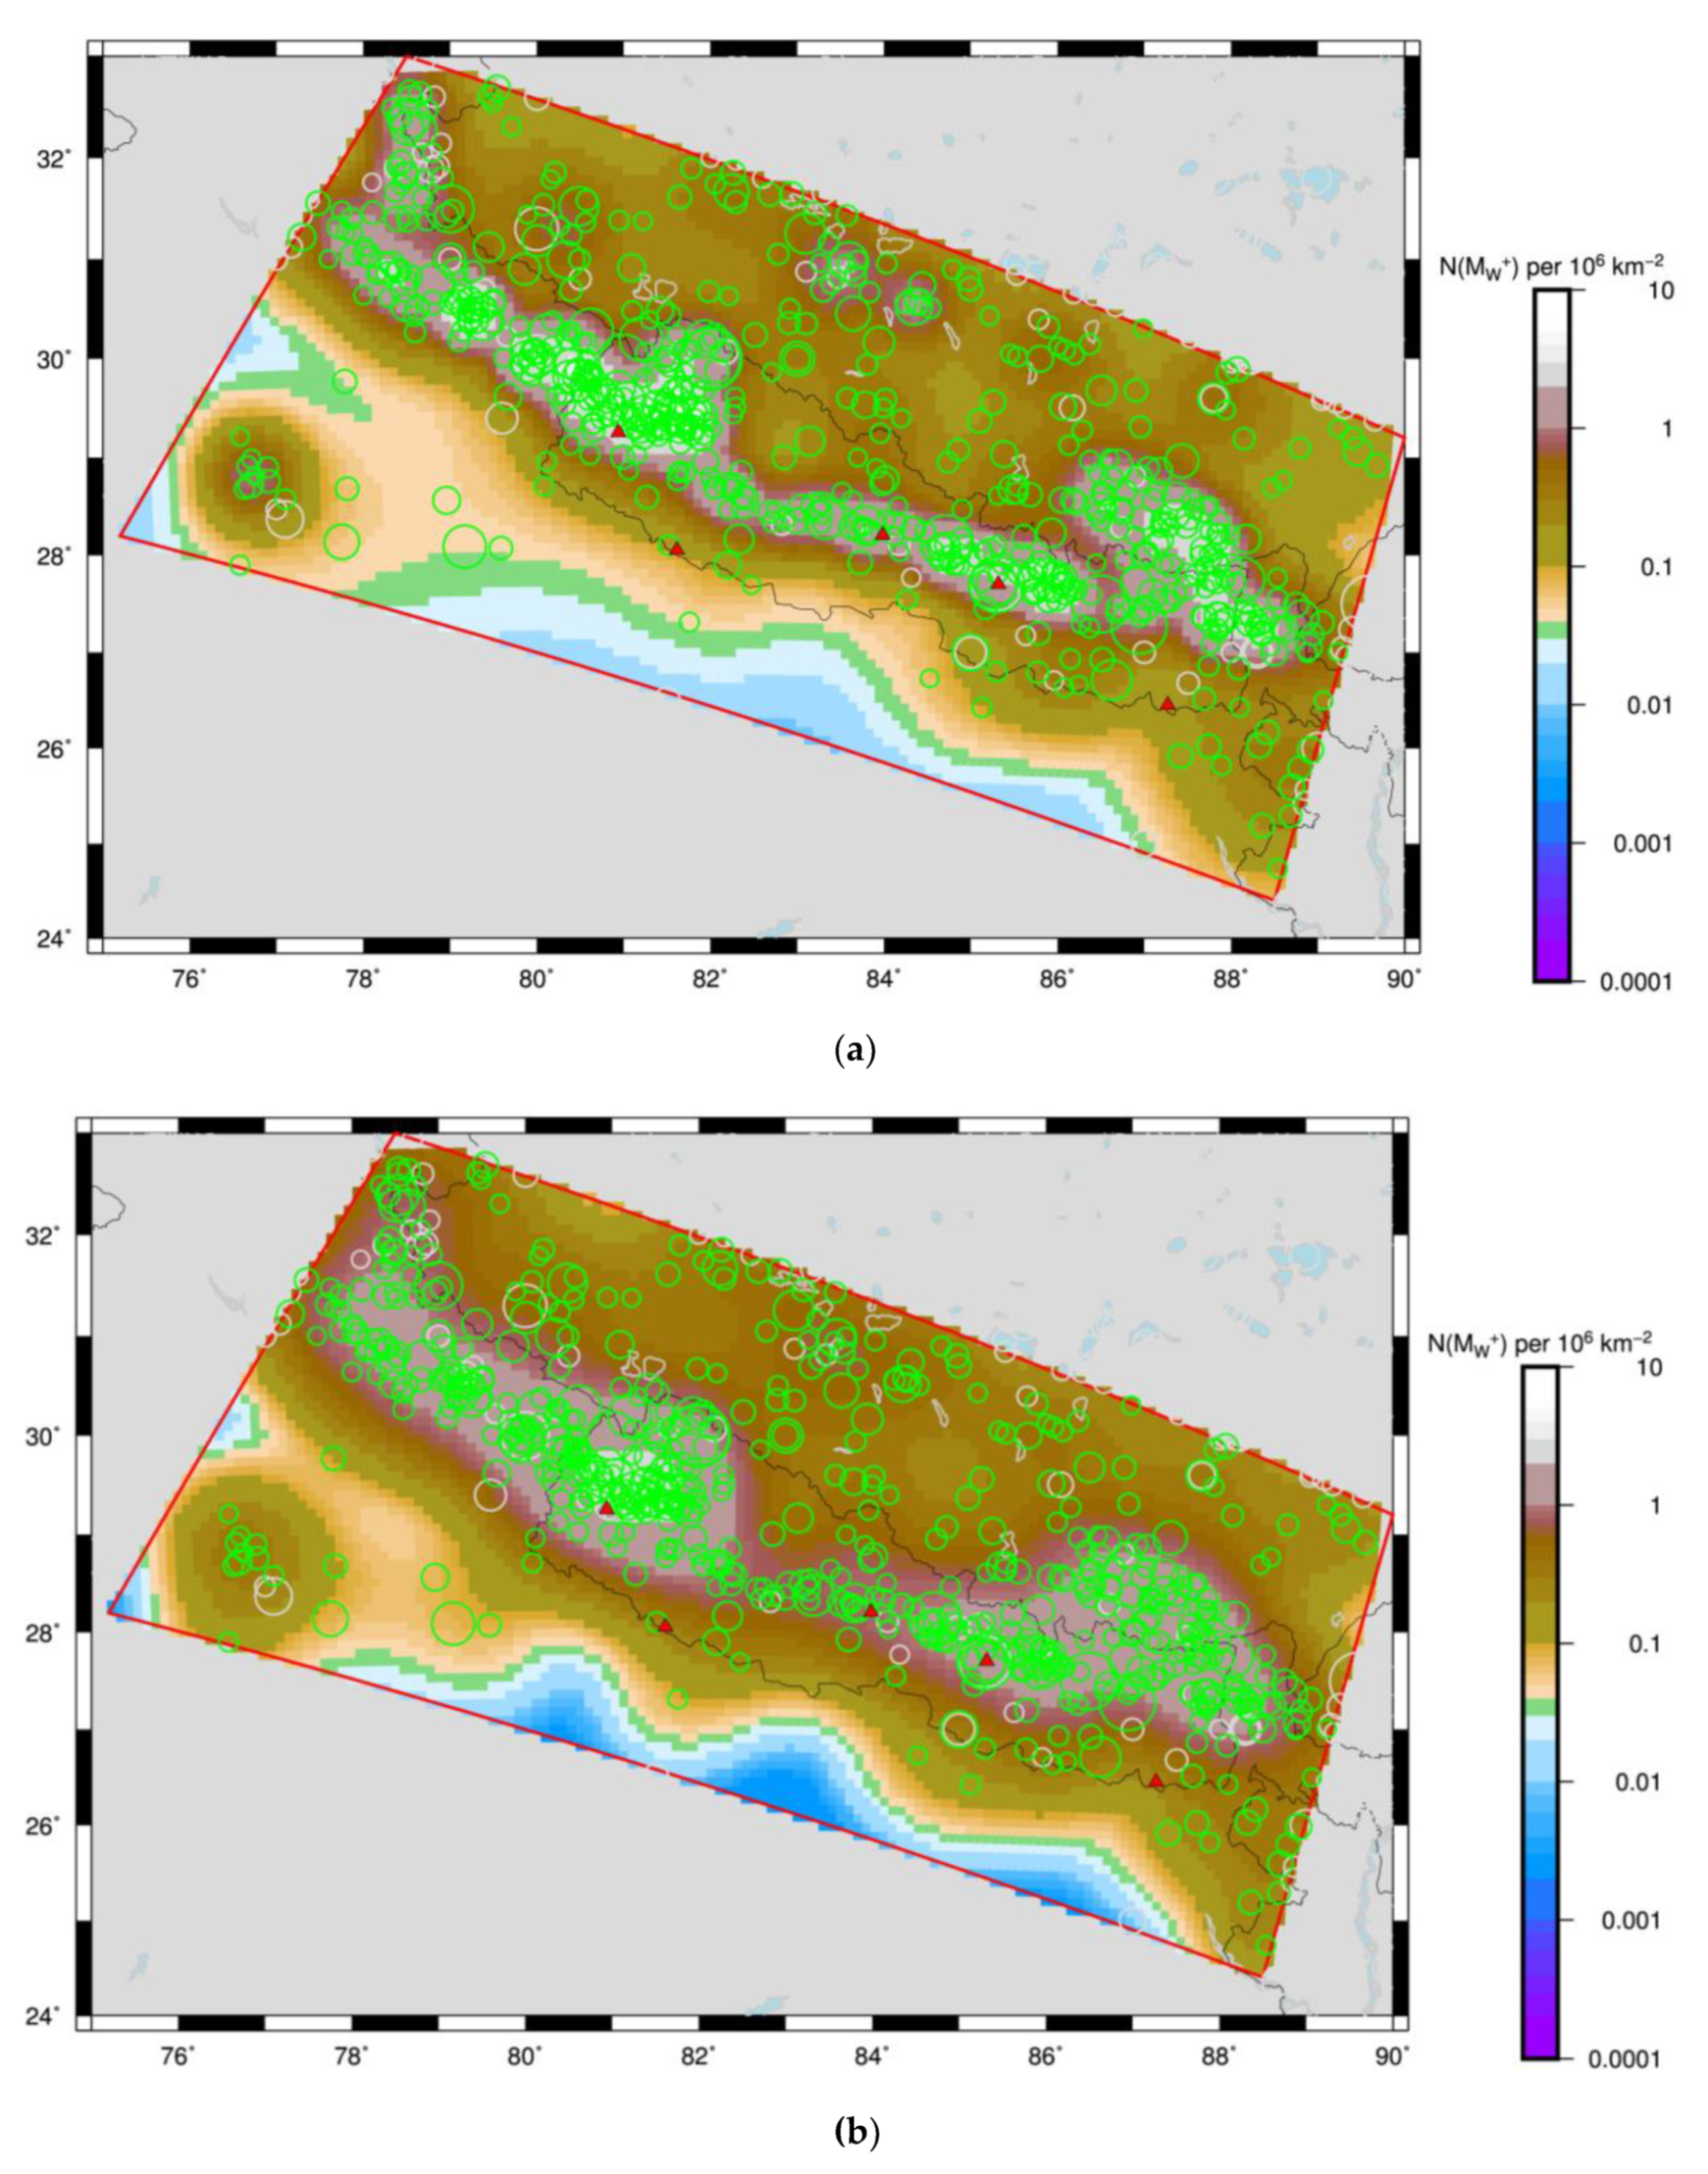
Two types of algorithms were used for the definition of the kernel: firstly, a fixed kernel [91] whose width is proportional to the magnitude of the earthquake only and a second algorithm called adaptative kernel that defines the kernel adaptively [92] based on a number of neighboring events. The smoothing width corresponds to the distance to the nth nearest earthquake whose magnitude is greater than or equal to the minimum magnitude threshold. A magnitude threshold of 4.5 was chosen assuming that the catalog is relatively well constrained only above this threshold and the rates were computed for each grid point at 10 × 10 km. The computed smoothed seismicity rates were implemented considering the seismicity limits and parameters defined for SM2 and thus introduced into the final SSC logic tree (see Section 6 for further details) as SM4. Similarly, the major thrust faults were introduced while considering the smoothed seismicity rates for the background seismicity and seismicity limits and parameters defined for SM3F and thus into the final SSC logic tree (see Section 6 for further details) as SM4F.
In a region characterized by a relatively high concentration of earthquakes like Nepal, the short smoothing width is deemed most appropriate. Two alternative kernels SA5 and SF10 (Figure 10) were finally selected as enough and non-redundant within a logic tree framework of SSC to better account for the epistemic uncertainties in the activity rate estimates. No spatial limits are applied for what concern the region of interest to compute the rates to take into consideration the uncertainty linked to the limits between high activity in north–northeast and relatively stable south–southwest to consider the uncertainty in the location of major thrust faults.
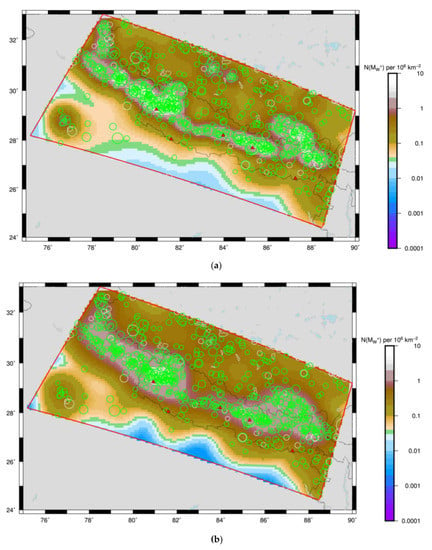
Figure 10.
N-value (number of events greater than Mw* ≥ 6) per million km2 computed for the target region using kernel functions (a) adaptative kernel using 5 neighboring events (SA5) and (b) fixed kernel using 10 neighboring events (SF10). The green circles are epicentral locations of the events within the completeness period of consideration and grey ones are outside completeness period and are not considered for assessment of activity parameters. The sites considered for the UHS results comparison are in red triangles.
5. Ground Motion Models
The selection of appropriate ground motion models (GMMs) applicable to Nepal is clearly one of the main challenges since currently, no fully local GMM based on locally observed seismic data has been developed suitable for PSHA purpose [93]. Some efforts have been made in recent years to develop GMMs adapted for the Himalayan context (e.g., [94,95,96]), however, for this study, we exclude the application of such GMMs due to several limitations such as the model developed for estimation of PGA only or/and use of very limited local data from Nepal for development of GMM. Hence, for this project, we made the simple choice to adopt a multiple GMM approach using GMMs developed based on global or Japanese datasets.
Hence, we carefully analyzed GMMs recently published and also the ones used in recent PSHAs carried out in Nepal [12,93] and selected several GMMs developed based on data from similar seismotectonic settings to account for epistemic uncertainties. The suitability of the set of GMMs was verified according to the criteria (e.g., tectonic regime, functional form, regression coefficients, frequency range of the model, datasets, etc.), based on [97]. The screening criteria adopted for this project constitute a compromise between the strict criteria of [98] and the somewhat more lenient criteria by [97], supplemented by considerations regarding factors such as time-averaged shear-wave velocity over the upper 30 m (Vs30), style of faulting and the ground motion intensity measures to be considered (e.g., the maximum response spectral period). The synthesis of validity domains for each of the selected GMMs is detailed in Tables S4 and S5 of the Supplementary File. The final selected GMMs combine five GMMs to model the ground motion in active shallow crustal (ACR) sources and six GMMs to model for the subduction interface-like sources. Among the six GMMs selected for the subduction interface-like sources, we selected three GMMs of ACR type and three GMMs of subduction interface type consistently with the strategy adopted in some recent studies e.g., [15]. However, we considered interface-type GMMs with lower weight, because although subduction-like ground motion is not fully ruled out for applicability in the Himalayan region as several recent studies indicated, the ground motion characteristics of the Himalayan region are more coherent with those of active shallow crust (e.g., [99]). The other argument for a lower weight given to subduction GMM is that due to a lack of locally developed GMMs, the selected subduction GMM is based mainly on the data of subduction zones around the world like Japan, Chile, Taiwan, etc., which are of very different contexts and characteristics (Oceanic–Continental collision) while the Himalayan subduction context is a shallow (Continental–Continental collision) context which is likely to have very different ground motion characteristics.
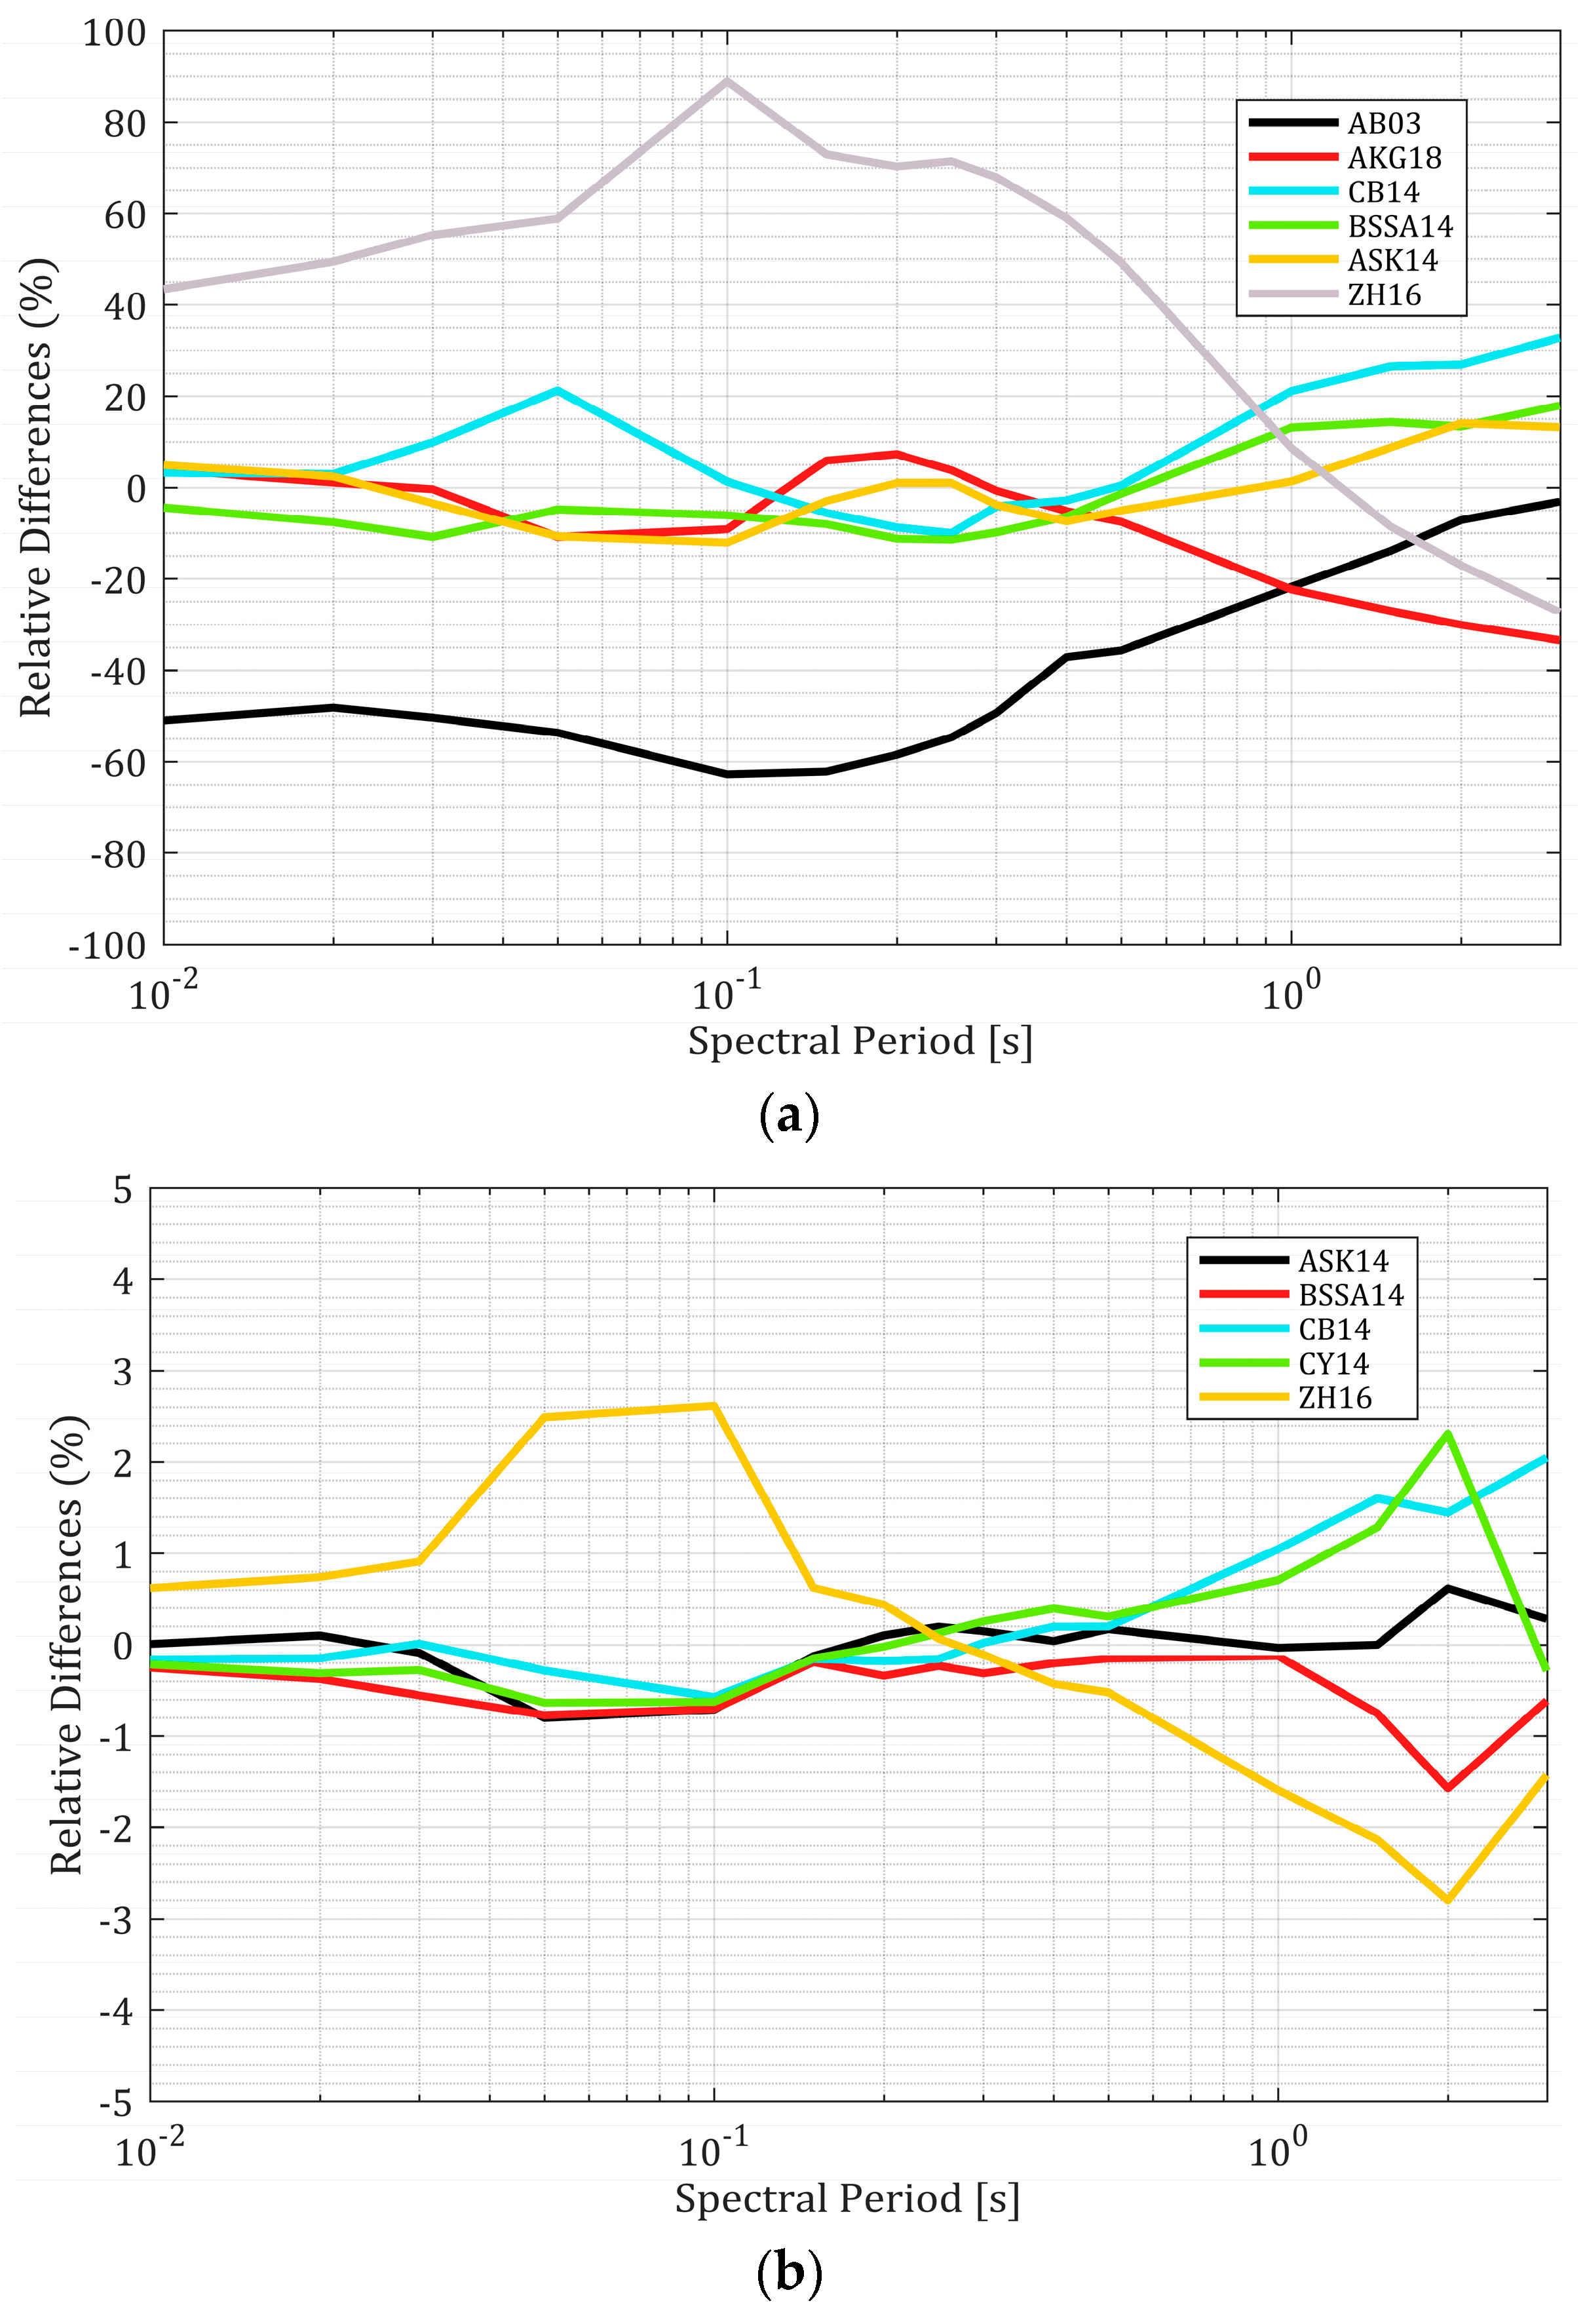
The sensitivity analysis (Figure 11) shows that the variability due to GMMs is essentially controlled by subduction-type sources and the ACR-type GMMs indicate very limited variability. It is simply because the contribution of ACR-type sources to the seismic hazard remains very limited for the considered site (in this case Kathmandu). In general, among the GMMs applied to subduction-like sources, the AB03 [100] leads to the lowest seismic hazard levels while ZH16 leads to the highest. All other GMMs [101,102,103] lead to seismic hazard levels fluctuating close to the median. Finally, among GMMs grouped into the subduction interface type, we weighted all the crustal-type GMMs (2/3) while giving relatively lower weight (1/3) to the subduction-type GMMs. Furthermore, all the ACR-type GMMs considered for subduction interface sources were equally weighted among each other, while among the subduction interface-type GMMs, i.e., ZH16 [104] was given slightly lower weight since it leads to the highest relative differences among GMMs used for subduction-type sources.
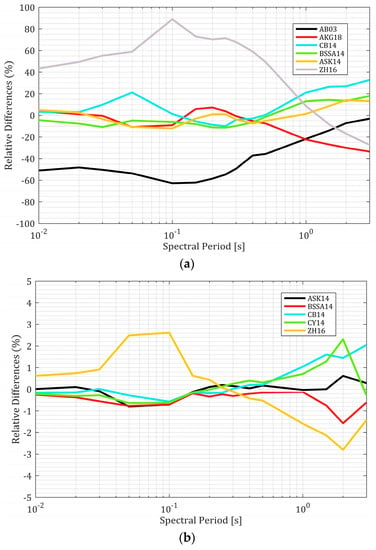
Figure 11.
Relative differences in response spectra calculated for each GMM, return period of 475 years, site of Kathmandu, Vs,30 = 760 m/s (a) GMPEs applied to interface-type sources and (b) ACR-type sources. Note the difference in y-scale between two figures.

Table 5.
Selected GMPEs for crustal and Himalayan collision domain.
Table 5.
Selected GMPEs for crustal and Himalayan collision domain.
| Target Source | GMM | GMM Type | Weight |
|---|---|---|---|
| Active shallow crustal sources | CB14 [103] | Crustal | 0.2 |
| BSSA14 [102] | Crustal | 0.2 | |
| CY14 [105] | Crustal | 0.2 | |
| ASK14 [101] | Crustal | 0.2 | |
| ZH16 [106] | Crustal | 0.2 | |
| Himalayan collision zones (Subduction interface-like sources) | AB03 [100] | Subduction | 0.13 |
| ZH16 [104] | Subduction | 0.08 | |
| AKG18 [107] | Subduction | 0.13 | |
| BSSA14 [102] | Crustal | 0.22 | |
| CB14 [103] | Crustal | 0.22 | |
| ASK14 [101] | Crustal | 0.22 |
6. SSC Sensitivity Analysis and Logic Tree
The sensitivity analysis was carried out to better identify the components of the SSC models that affect the most seismic hazard estimates. The seismotectonic models presented in Section 4 are integrated into a sensitivity test to determine the impact on the seismic hazard calculation of each of the hypotheses considered (see Section 6 for further details). An aleatory uncertainty related to distribution for magnitude, hypocentral depth, and fault orientations was also explored. A right trapezoidal distribution was used for hypocentral depth, left trapezoidal distribution for maximum magnitude between two bounds (see Supplementary Materials, Tables S1–S3 for further details). For each seismic source, the style of fault mechanisms can be normal, reverse, or strike-slip for which a probability was assigned based mainly on the evaluation of fault parameters in fault databases and focal mechanisms of past events.
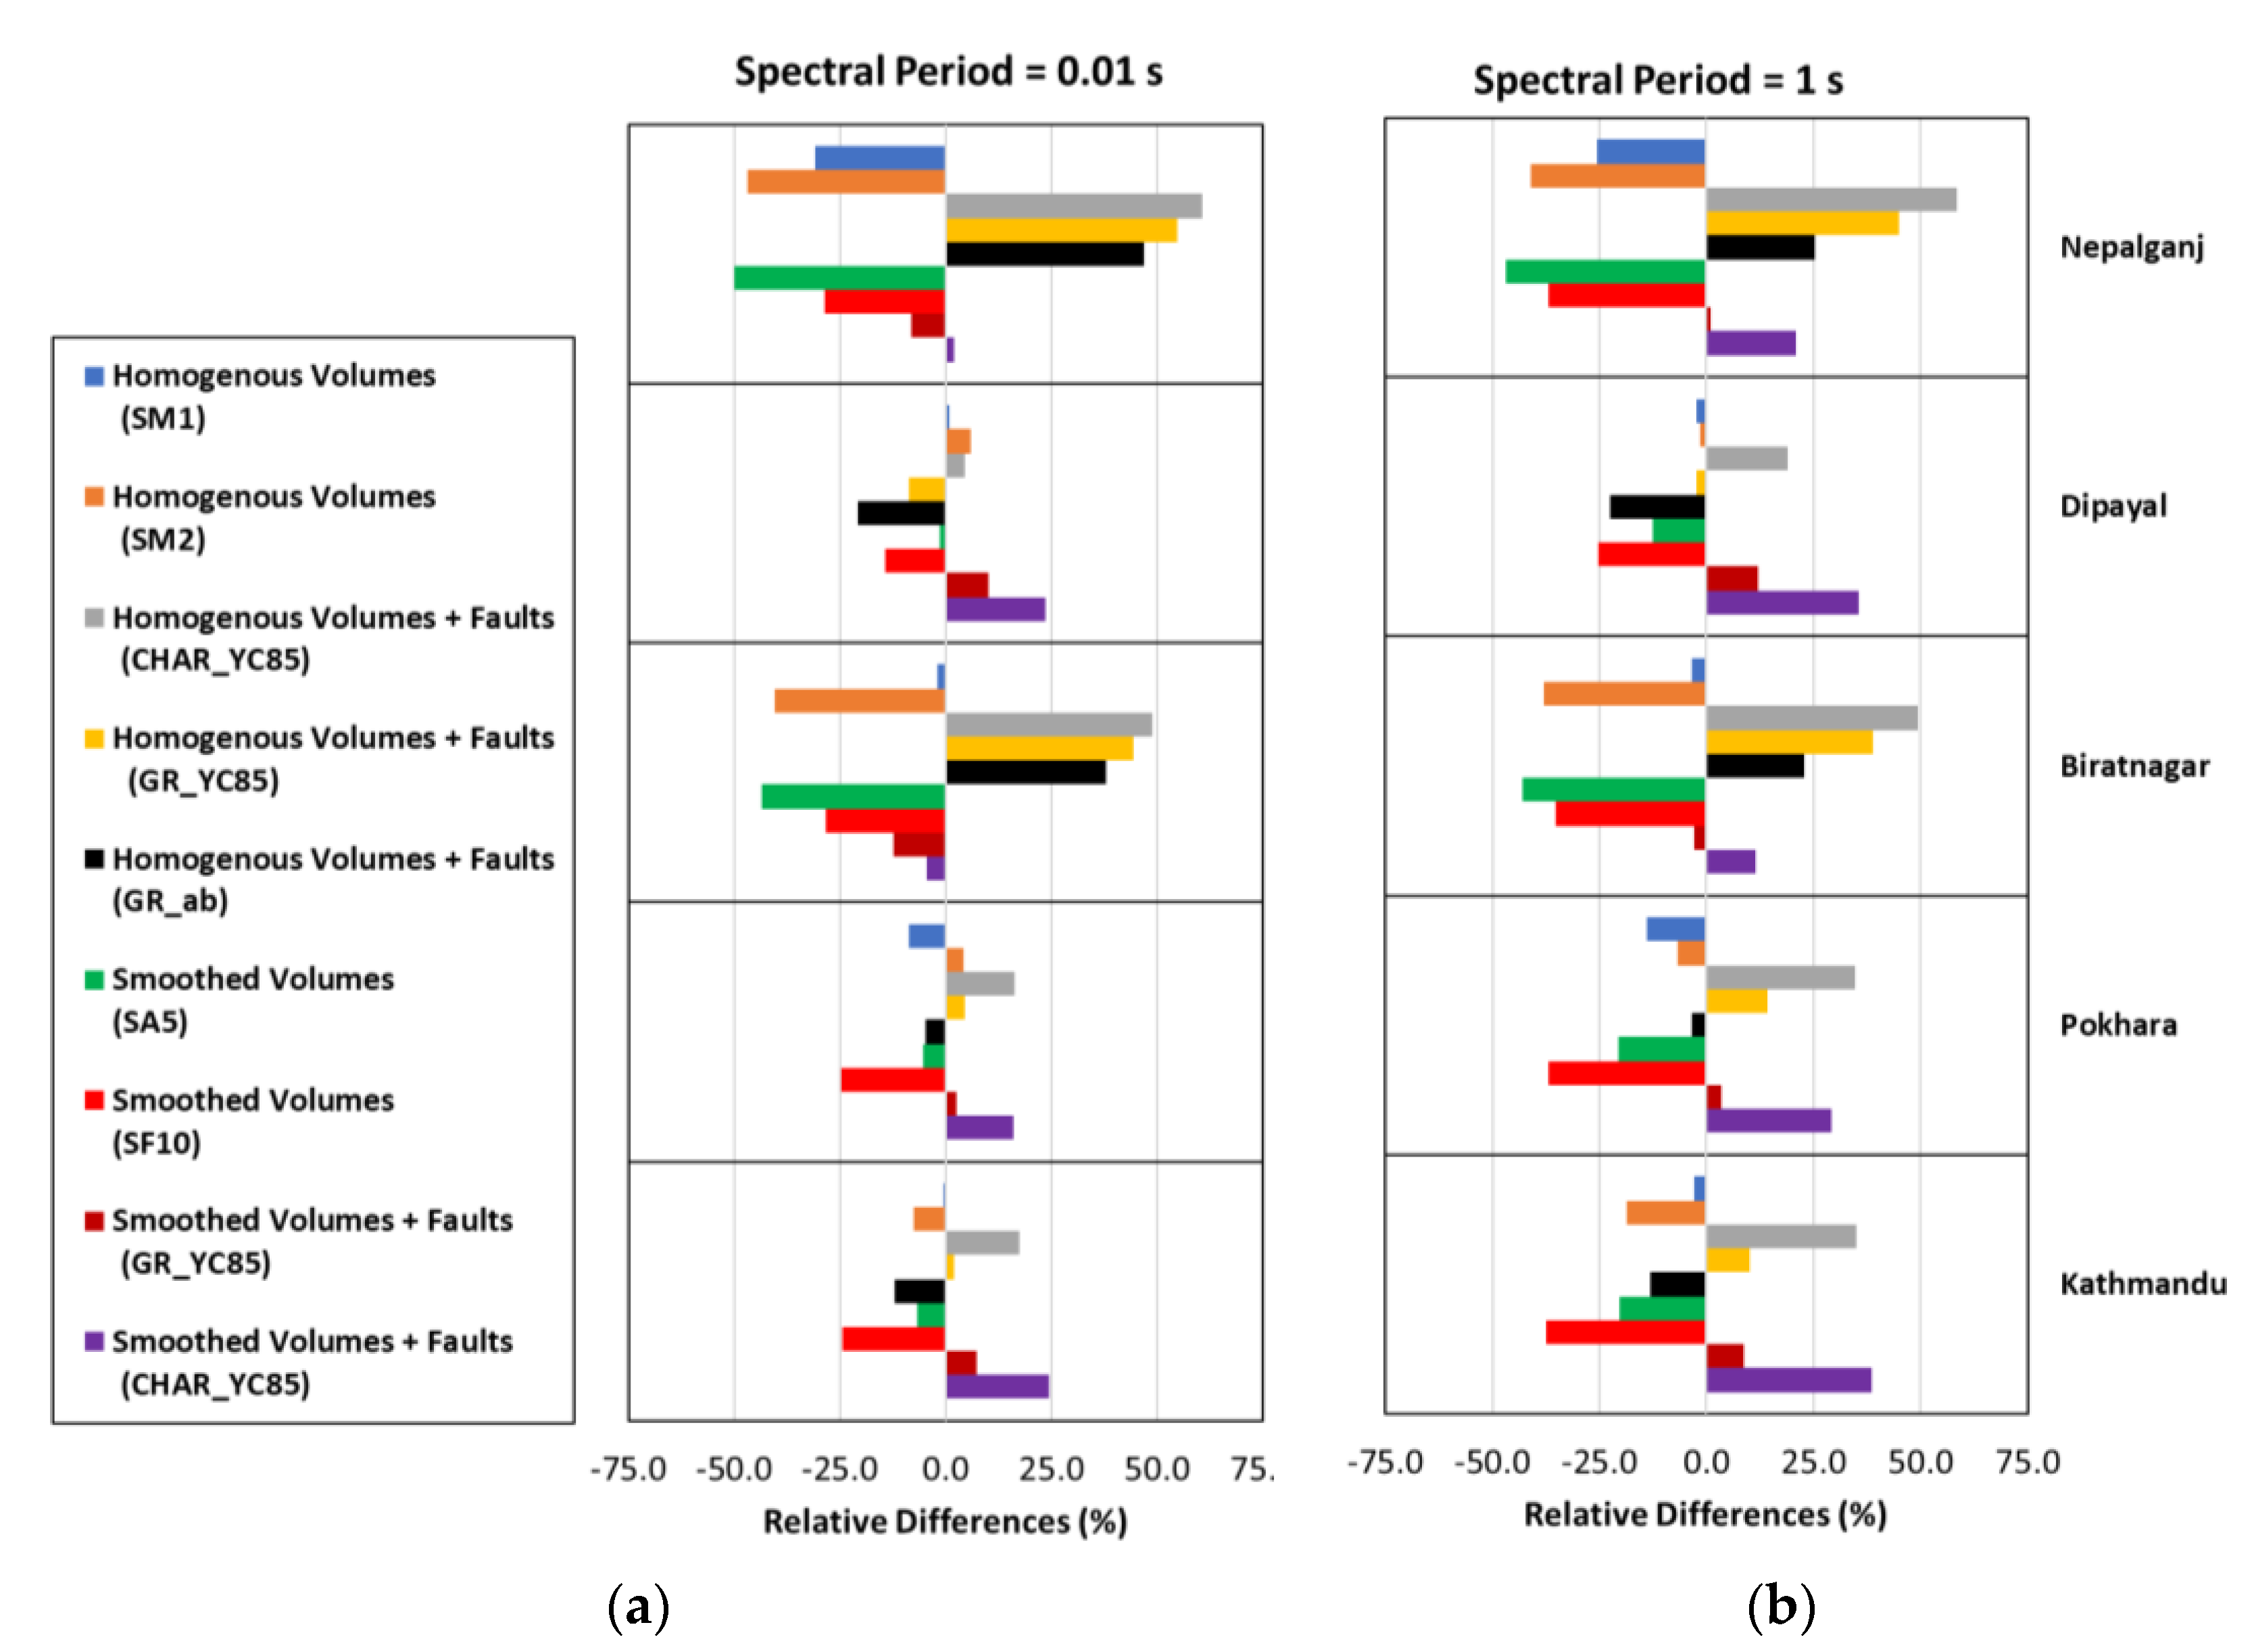
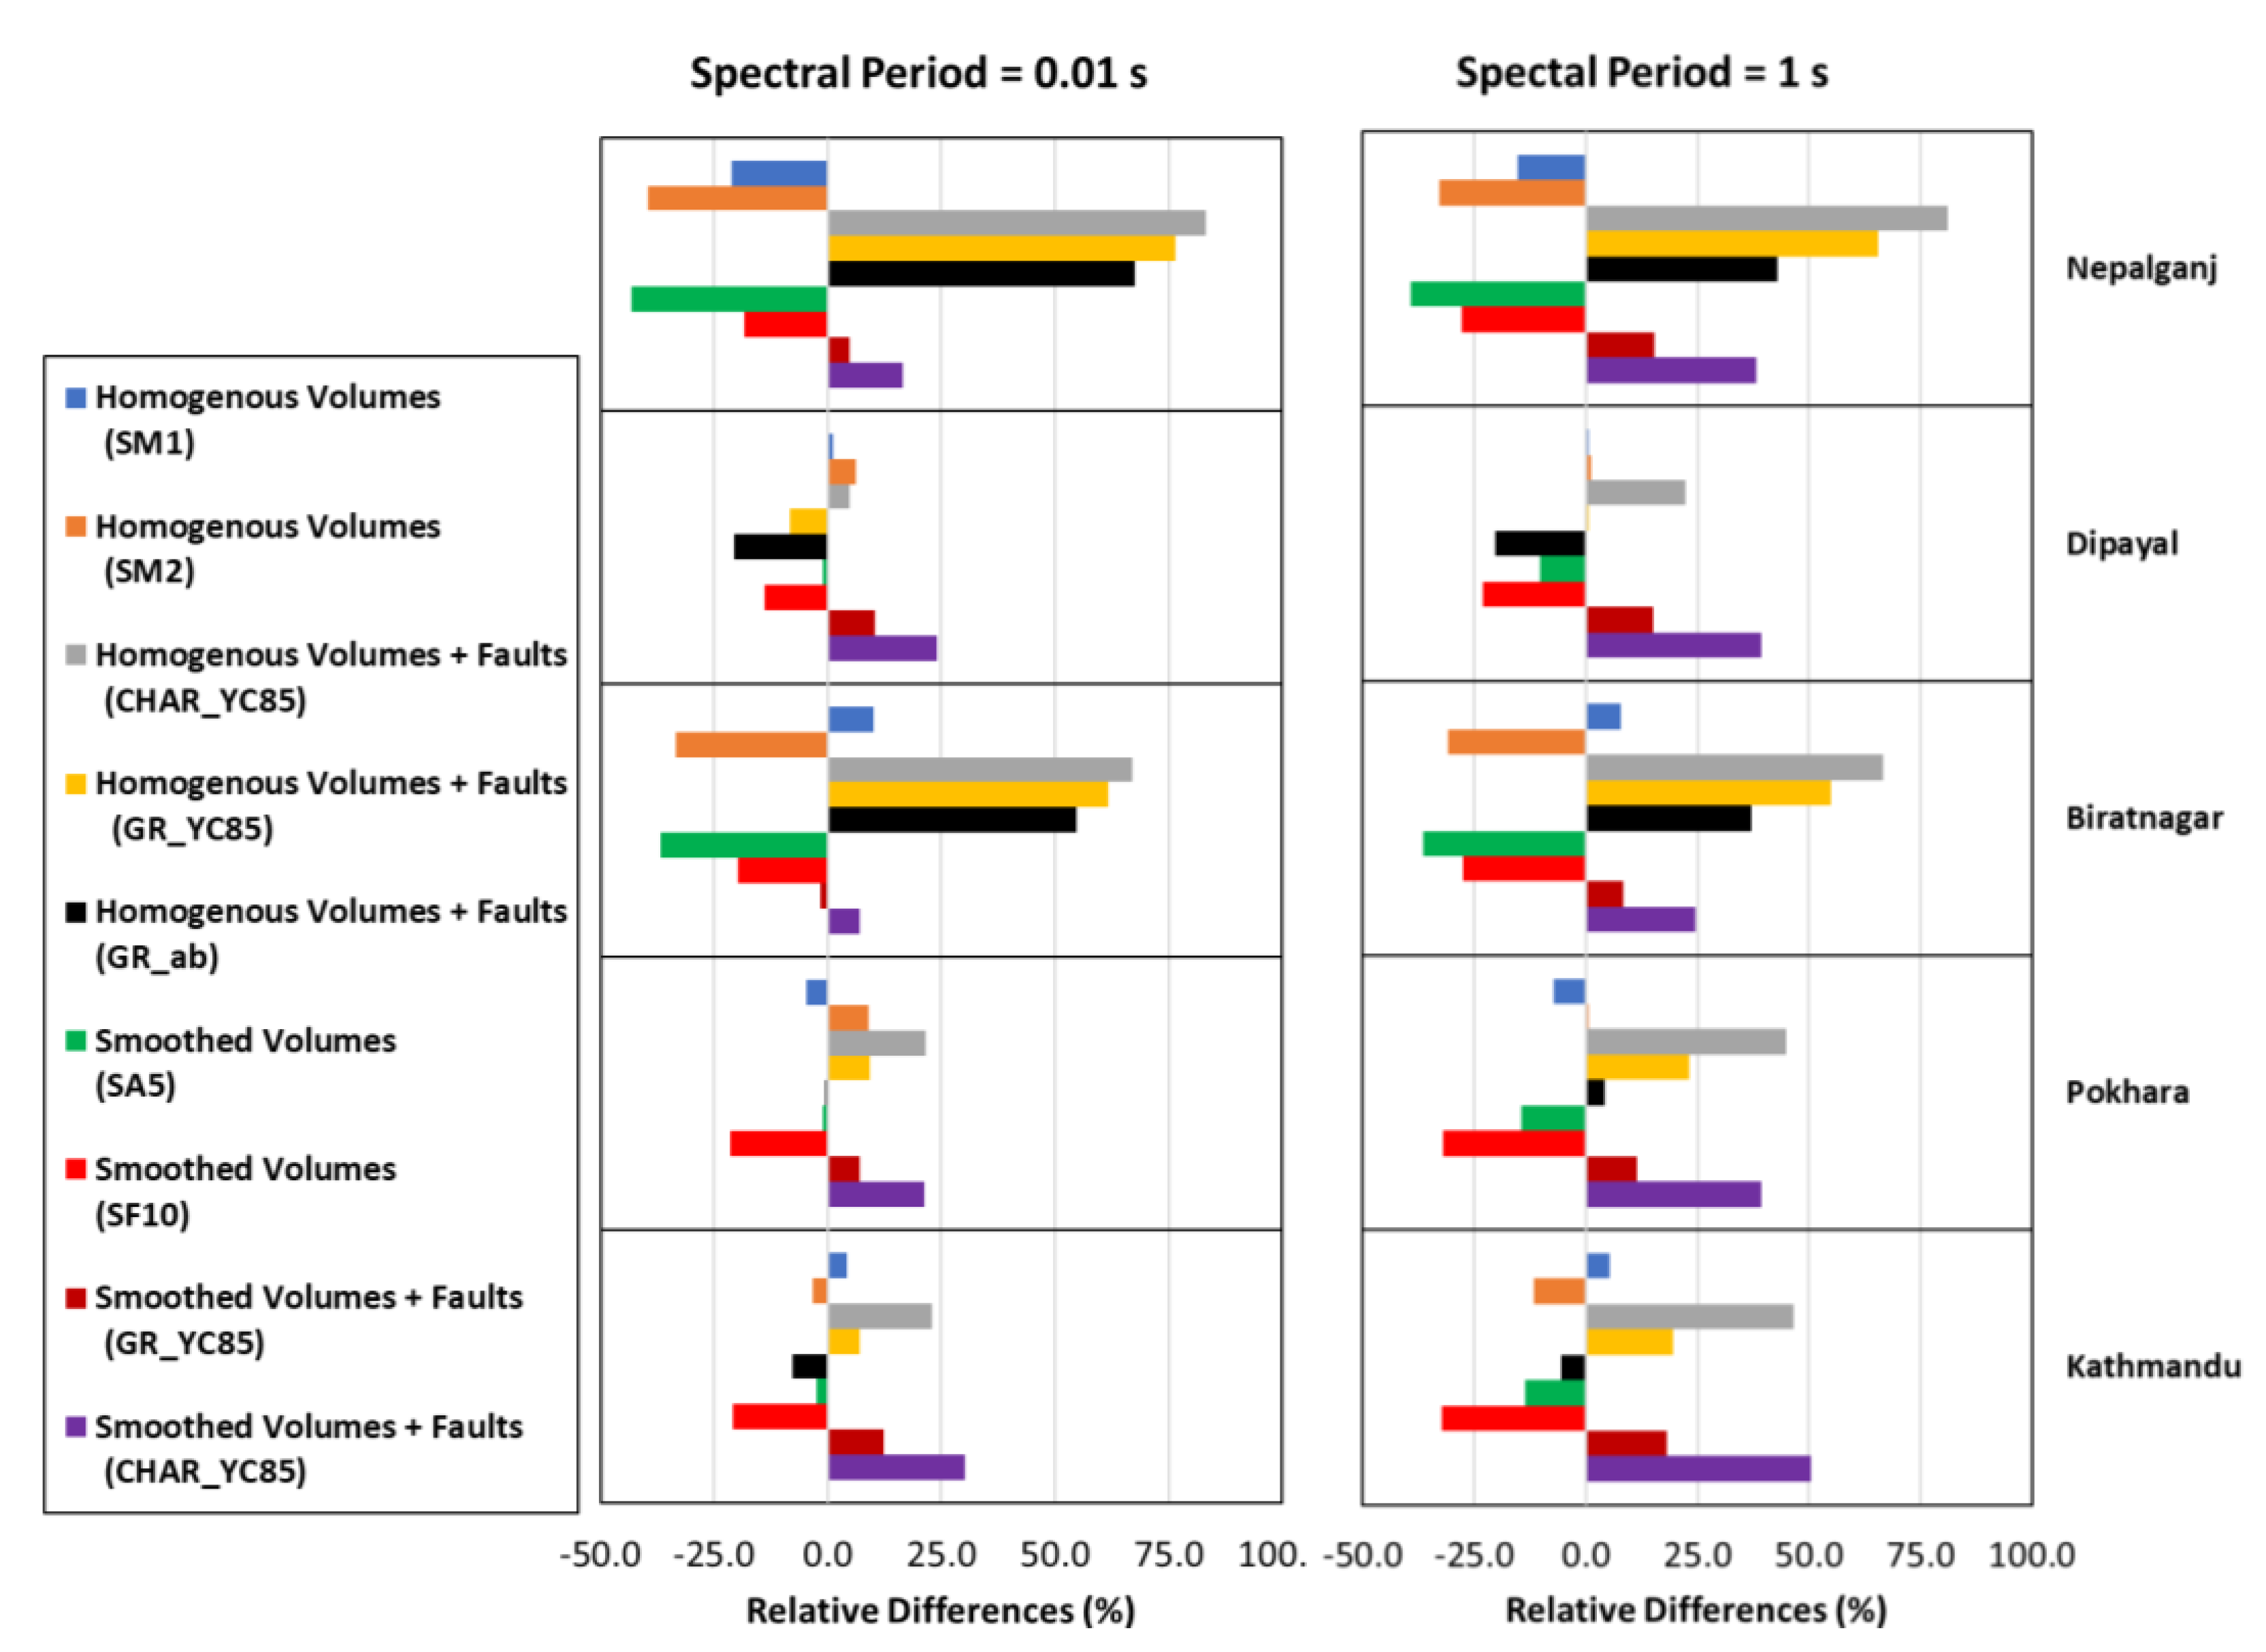
The results of the sensitivity test are shown for the return periods of 475 years (Figure 12). We chose to make sensitivity analyses based on a tornado plot which allows us to visualize the sensitivity of all SSC branches introduced and for different sites in the same figure. The different seismicity models introduce significant variability, of about ±25% to ±50% depending on the site. In general, regardless of the site and spectral periods, the models integrating the major fault sources (SM3F and SM4F in the logic tree) lead to higher results compared to the average of the models. The homogenous volume models without individual faults (SM1 and SM2) are either close to the center of the distribution or lower compared to the models integrating the thrust faults. Similarly, the smoothing models without individual faults (SA5 and SF10) lead to lower results compared to the average of all the models.
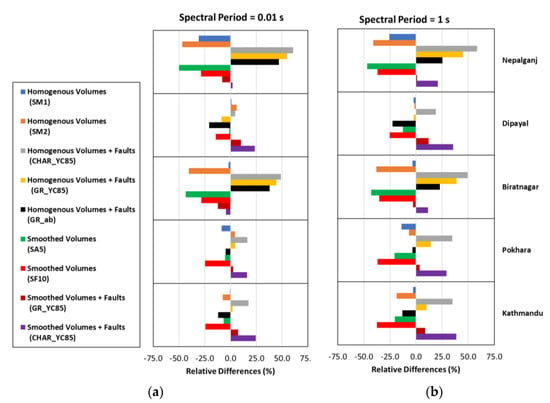
Figure 12.
Sensitivity analysis of the spectral accelerations from the SSC models. Relative difference of each mean UHS to the unweighted average of all SSCs considered at return period of 475 years and for five sites considered. (a) Spectral period of 0.01 s; (b) spectral period of 1 s.
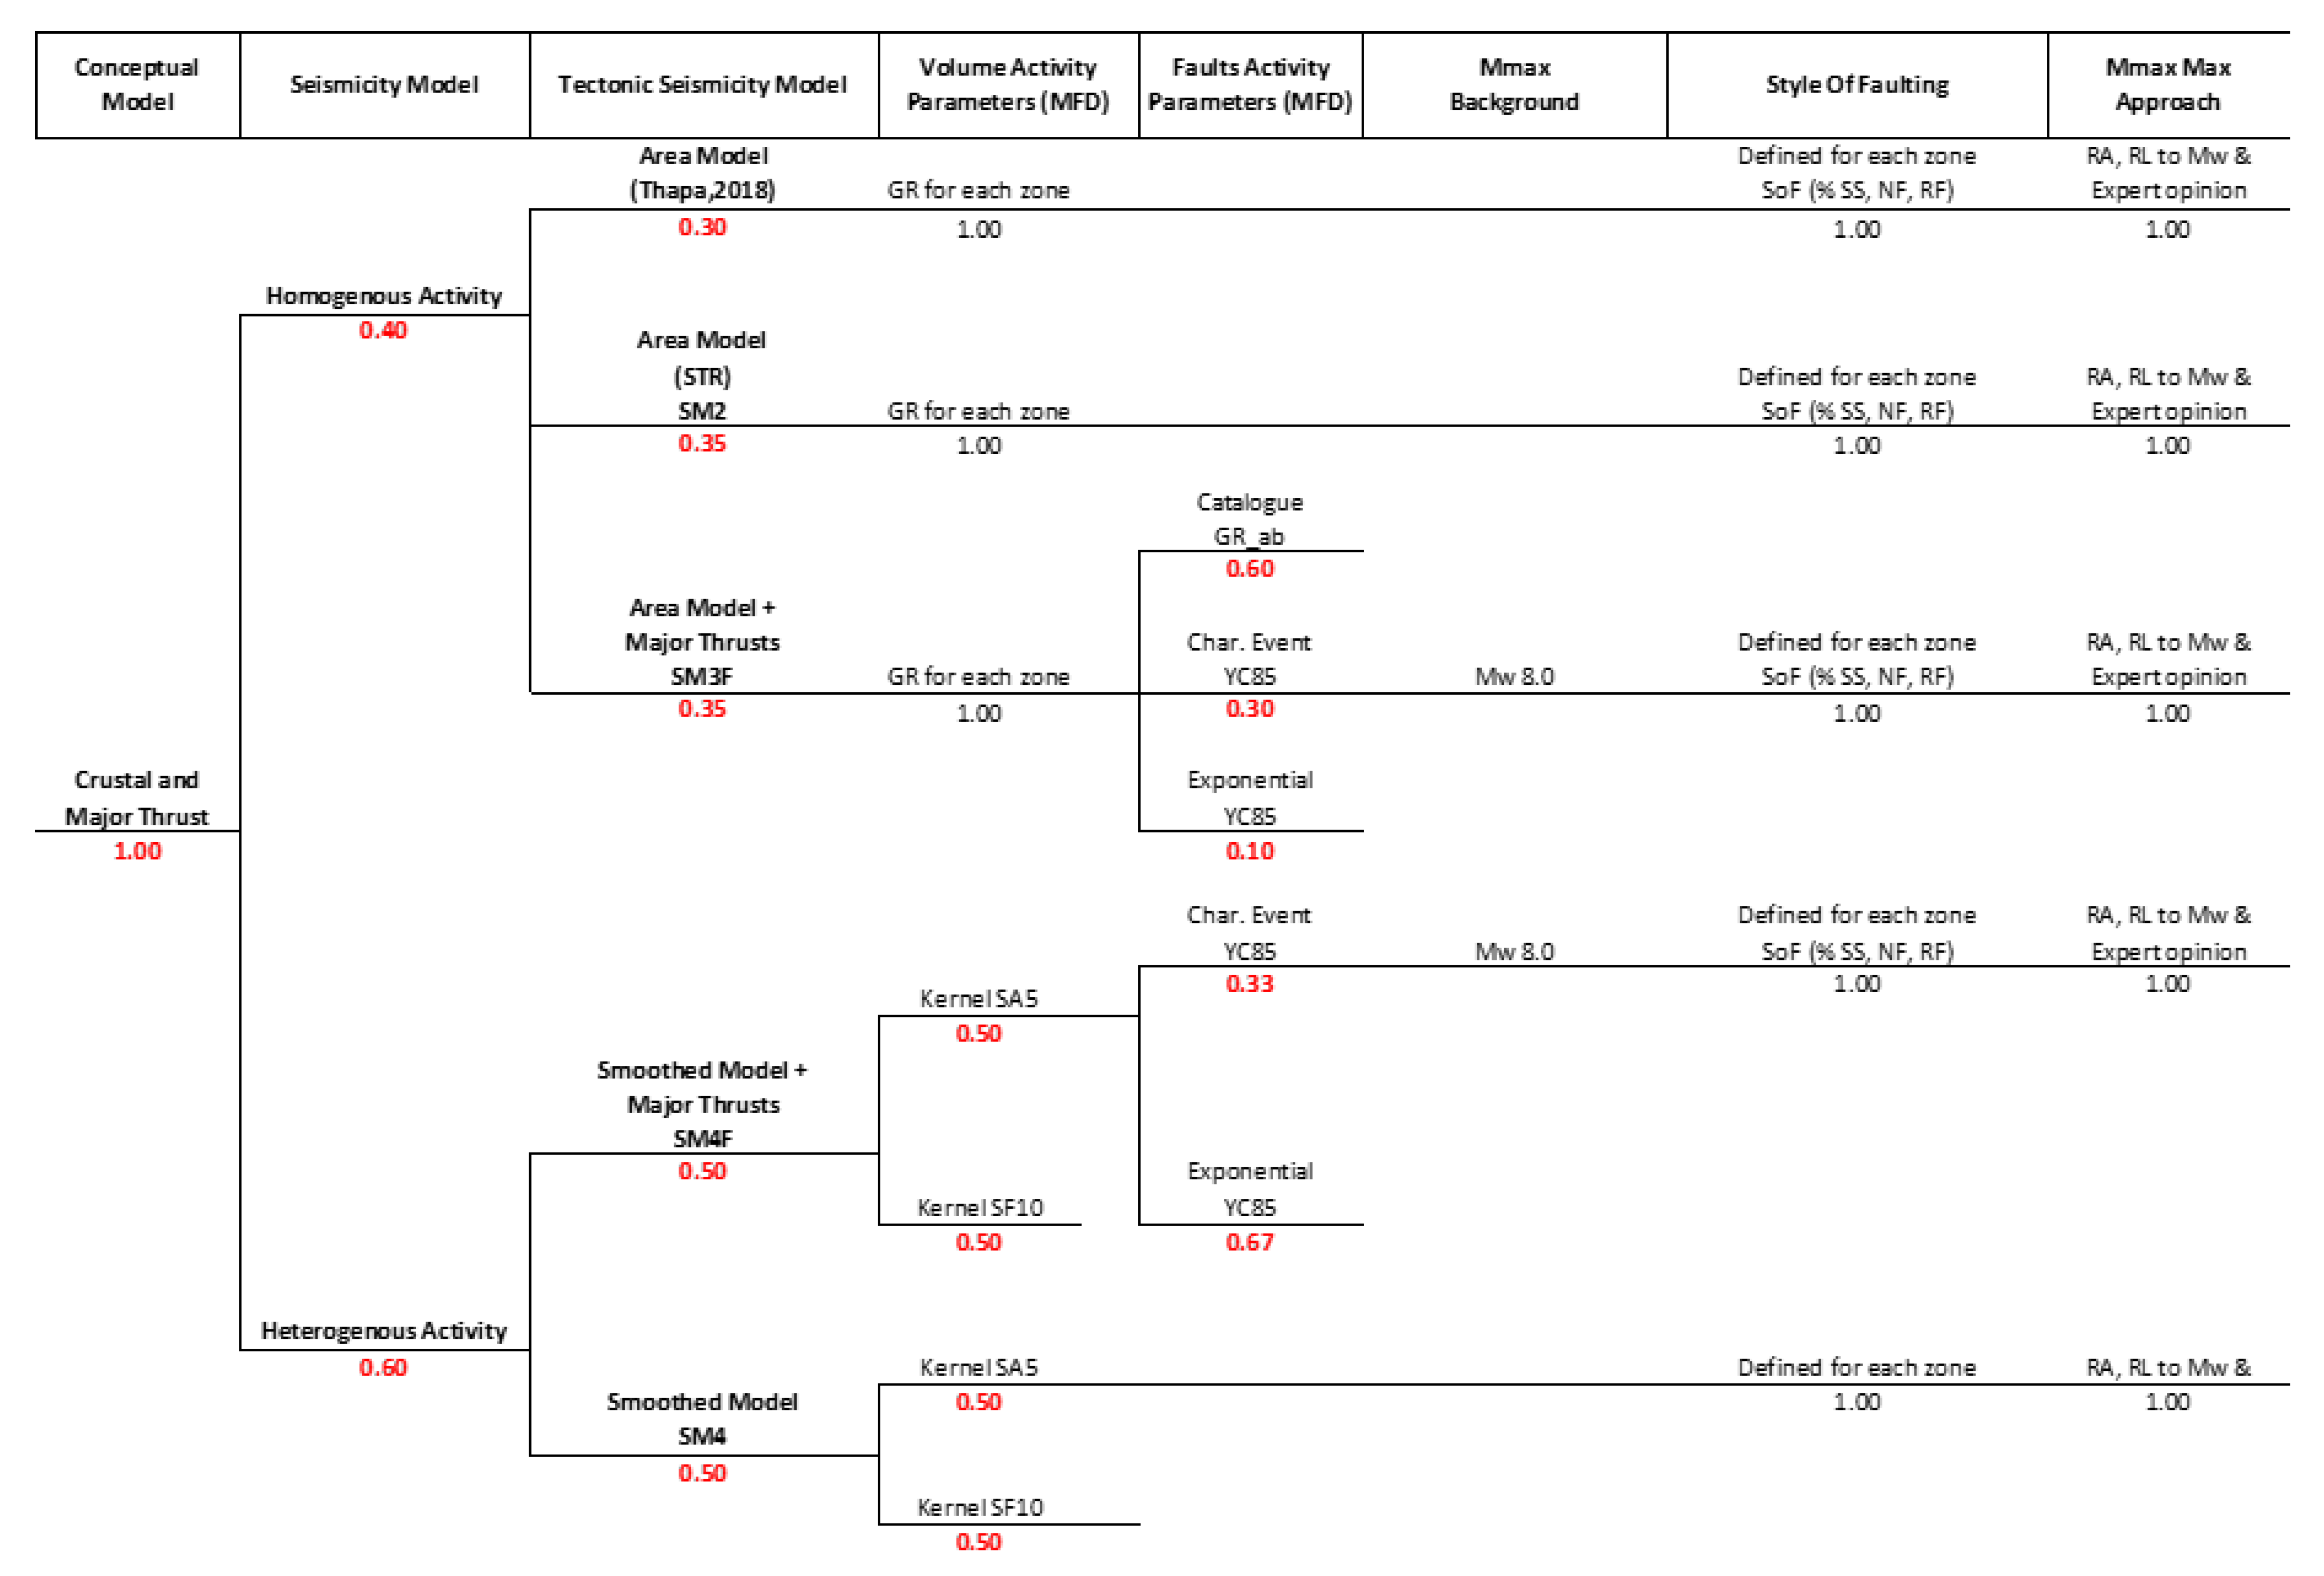
The application of a logic tree allows the capturing of epistemic uncertainties in different input models [108,109] by deploying alternative models in the seismic hazard estimation. The SSC logic tree (Figure 13) was built by selecting and weighing the conceptual models (models in volume source zones, models by fault, and smoothed models), then by selecting and weighing the models within each of the conceptual models.
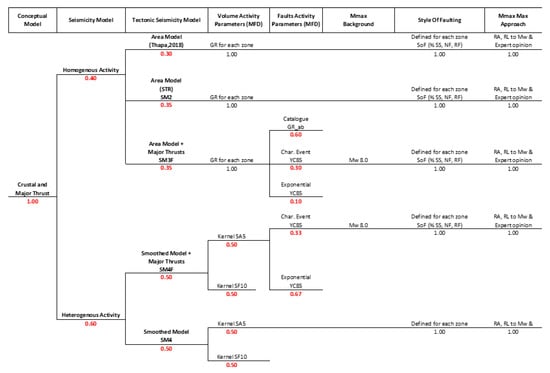
Figure 13.
Logic tree adopted for the seismotectonic model in seismic hazard calculation and treatment of uncertainties. Red numbers are the weight assigned to the different branches.
In the study area, seismicity catalogs seem to better capture the local variability of seismicity. We, therefore, attribute a slightly higher weight of 60% to the heterogenous or smoothed models compared to the 40% for homogenous models. The decision on the weights assigned to homogenous or smoothed models is clearly a subjective choice of experts. We believe that the seismicity catalog is relatively complete for a statistically significant time (about 800 years) at least for large magnitude events (Mw > 7.5/8.0). However, we included the SM1 model already, which is based on the seismicity patterns. Hence, as a balance, we decided to adopt 60–40% in favor of a heterogeneous model.
In the sub-branches concerning the homogenous models, a higher weight of 35% each is adopted for models developed within the framework of this study (SM2 and SM3F) since it relies on both seismicity distribution and division of the seismotectonic units by large active structures among which the SM3F introduces a clearer distinction based on the seismicity distribution of the background and major thrusts. The zones in the SM1 model were developed mostly based on seismicity patterns only. For this reason, it was decided to assign a lower weight (30%) to SM1 compared to SM2 and SM3F (35% each one).
The sub-branches concerning the recurrence activity of the faults in SM3F constitute three alternative models. The recurrence model derived from the exponential Gutenberg–Richter parameter of the background zone, SM3F_GR_ab model is given the highest weight (60%) among others because we believe that the seismicity sample is relatively more representative of the actual seismicity compared to the other two models namely characteristic (SM3F_CHAR_YC85) and exponential model (SM3F_GR_YC85) based on [90] which are based on slip rates that remain highly uncertain. The YC85 exponential model (SM3F_GR_YC85) is assigned the lowest weight of 10% since, in the sensitivity analysis, it closely follows the seismic hazard levels attained by SM3F_GR_ab for which we assigned the highest weight.
Regarding the smoothed models, the two kernels (SA5 and SF10) are introduced with equal weighting. An equal weight is assigned between the smoothed models with (SM4F) or without (SM4) individual thrust faults. Similarly, the sub-branches concerning the recurrence activity of the faults in SM4F (for which the background seismicity adopted is from the gridded approach), constitute two models namely the characteristic (SM4F_CHAR_YC85) and exponential model (SM4F_GR_YC85) based on [90]. We give higher weight (2/3) to the exponential model (SM4F_GR_YC85) mainly because the exponential model seems to be more consistent with the bulk of results obtained from all other SSC models considered.
7. Results and Discussion
Results of the probabilistic seismic hazard assessment are presented in the form of uniform hazard spectra (UHS) for horizontal components after post-processing the seismic hazard curves obtained for a series of combinations of the SSC and GMC interpretations and 200 samples of Monte Carlo exploration in seismic parameters (GR parameters, magnitude, hypocentral depth, style of faulting, etc.). The PSHA calculations were carried out with a minimum magnitude of integration of 5.0, considering the high seismic activity of the target region. The PSHA calculation was performed using the SEISTER in-house SHA toolbox.
7.1. UHS at Five Selected Locations
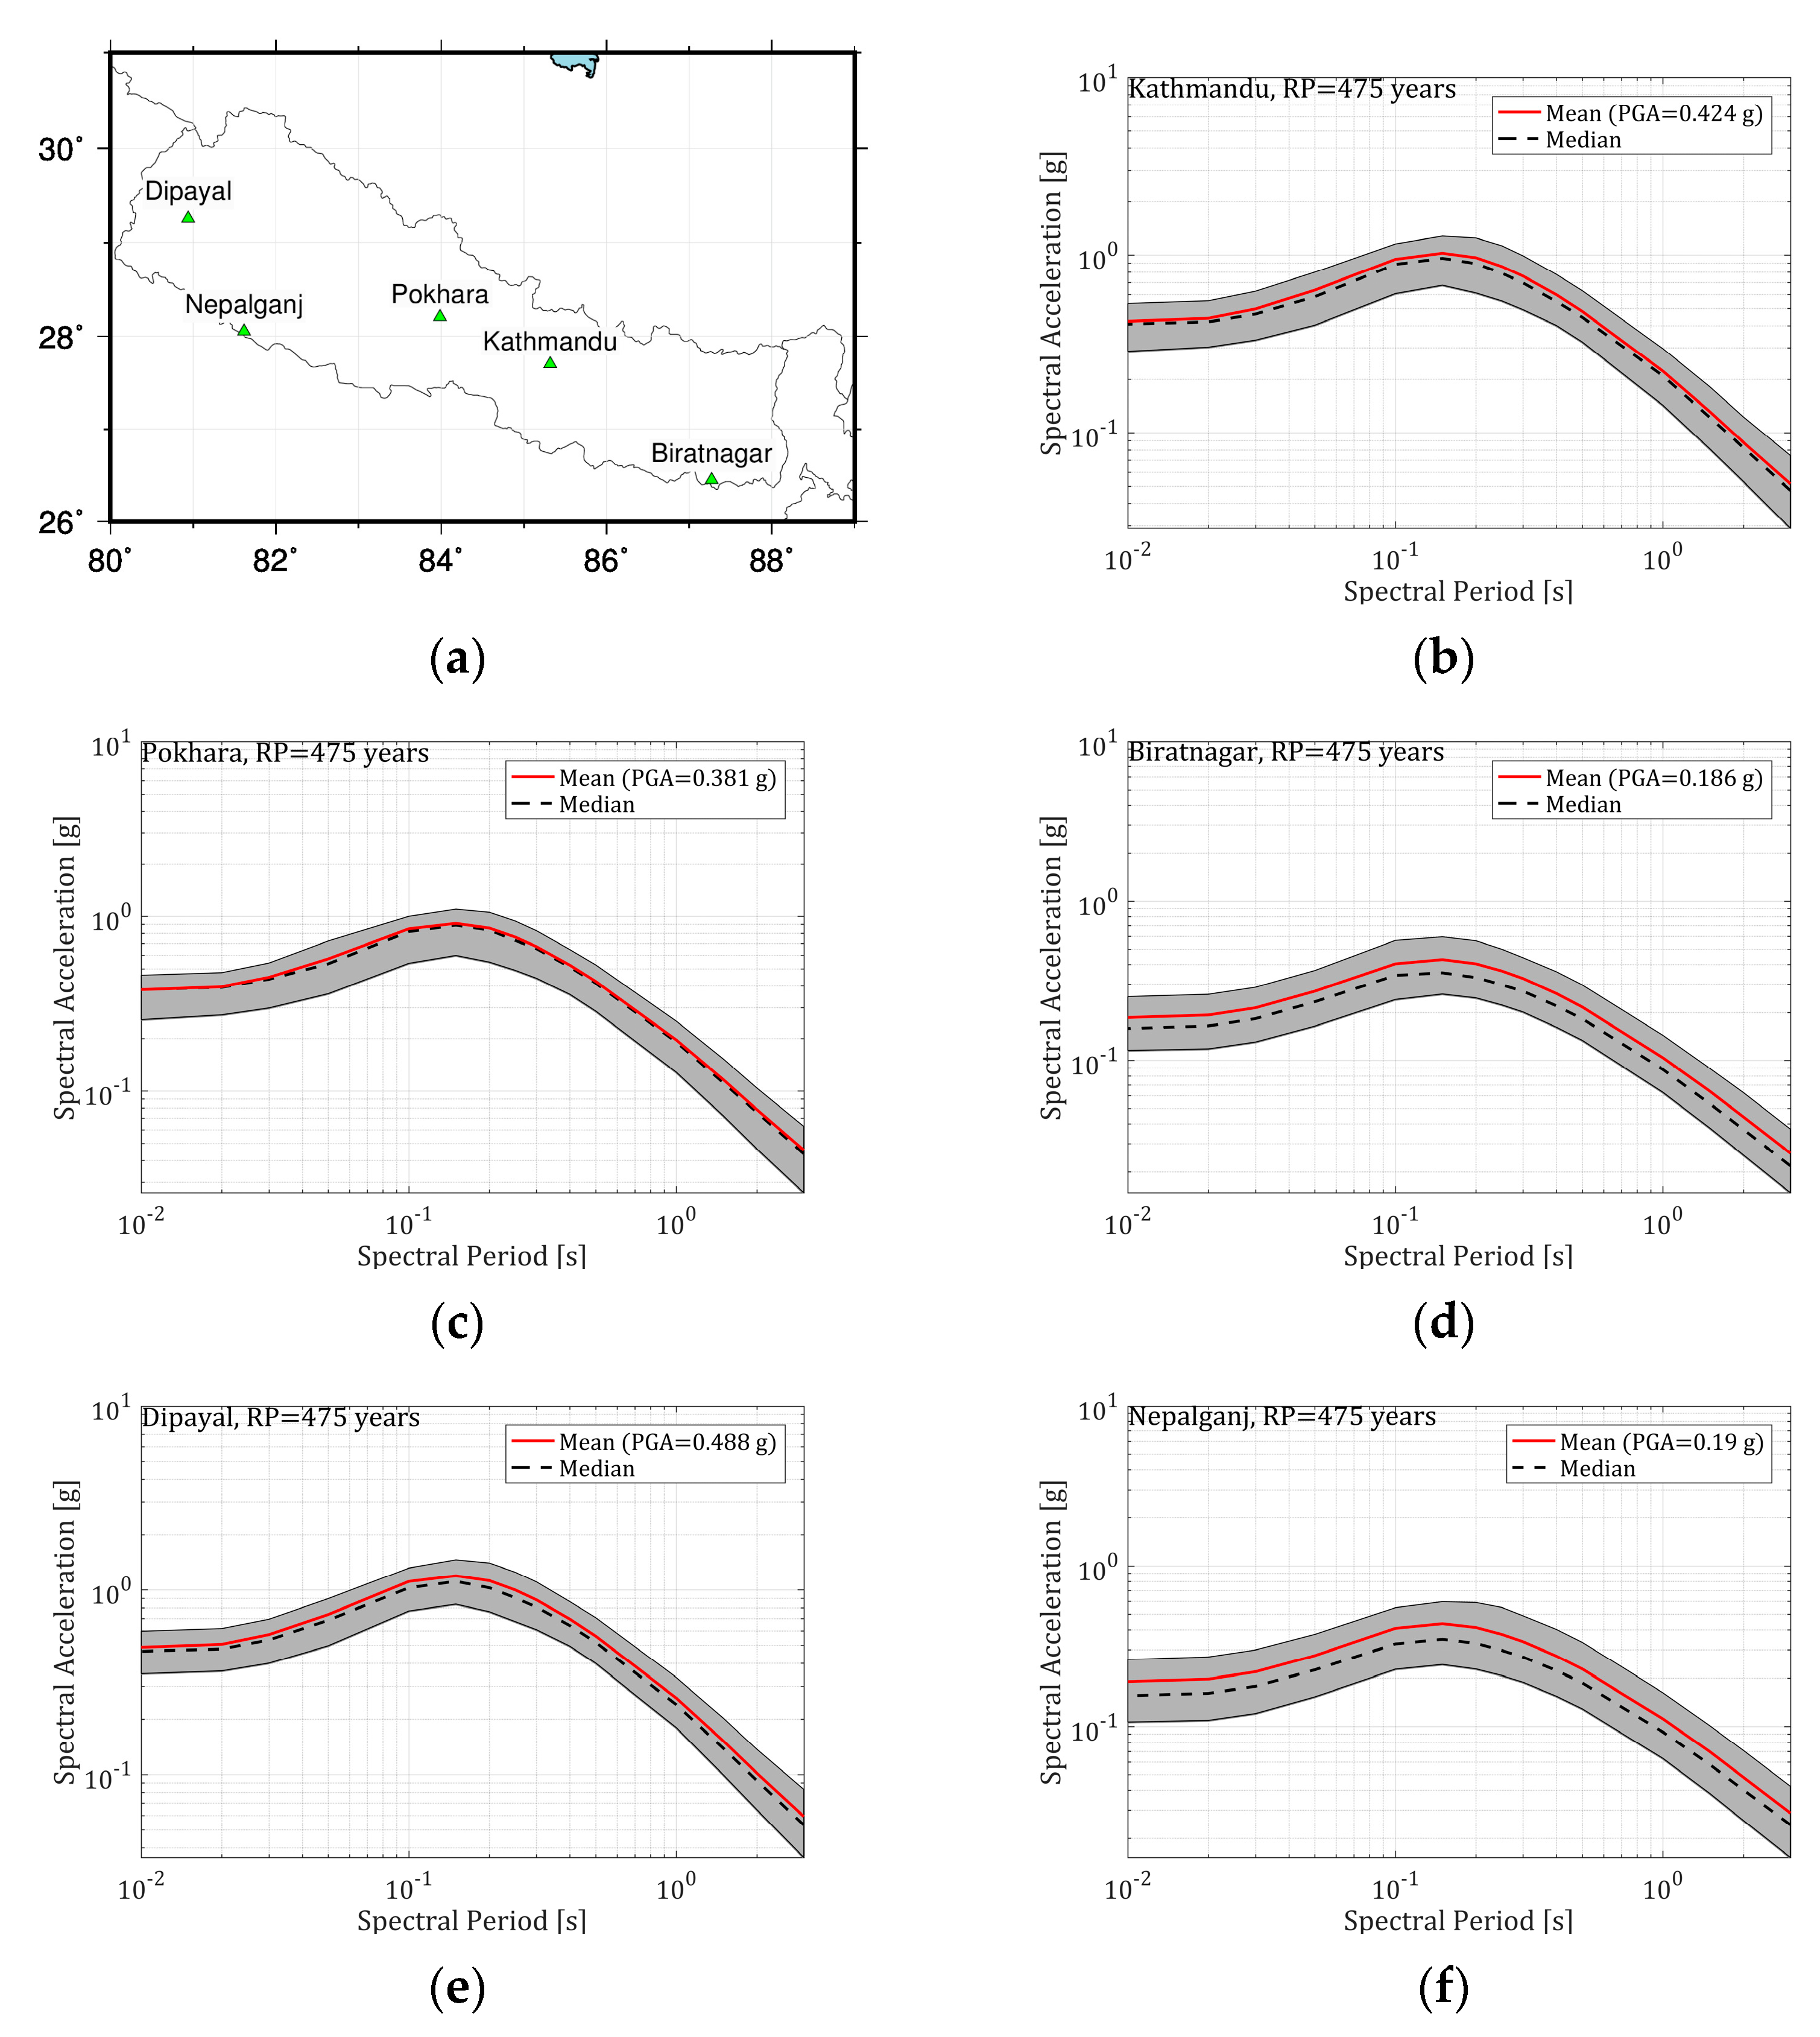
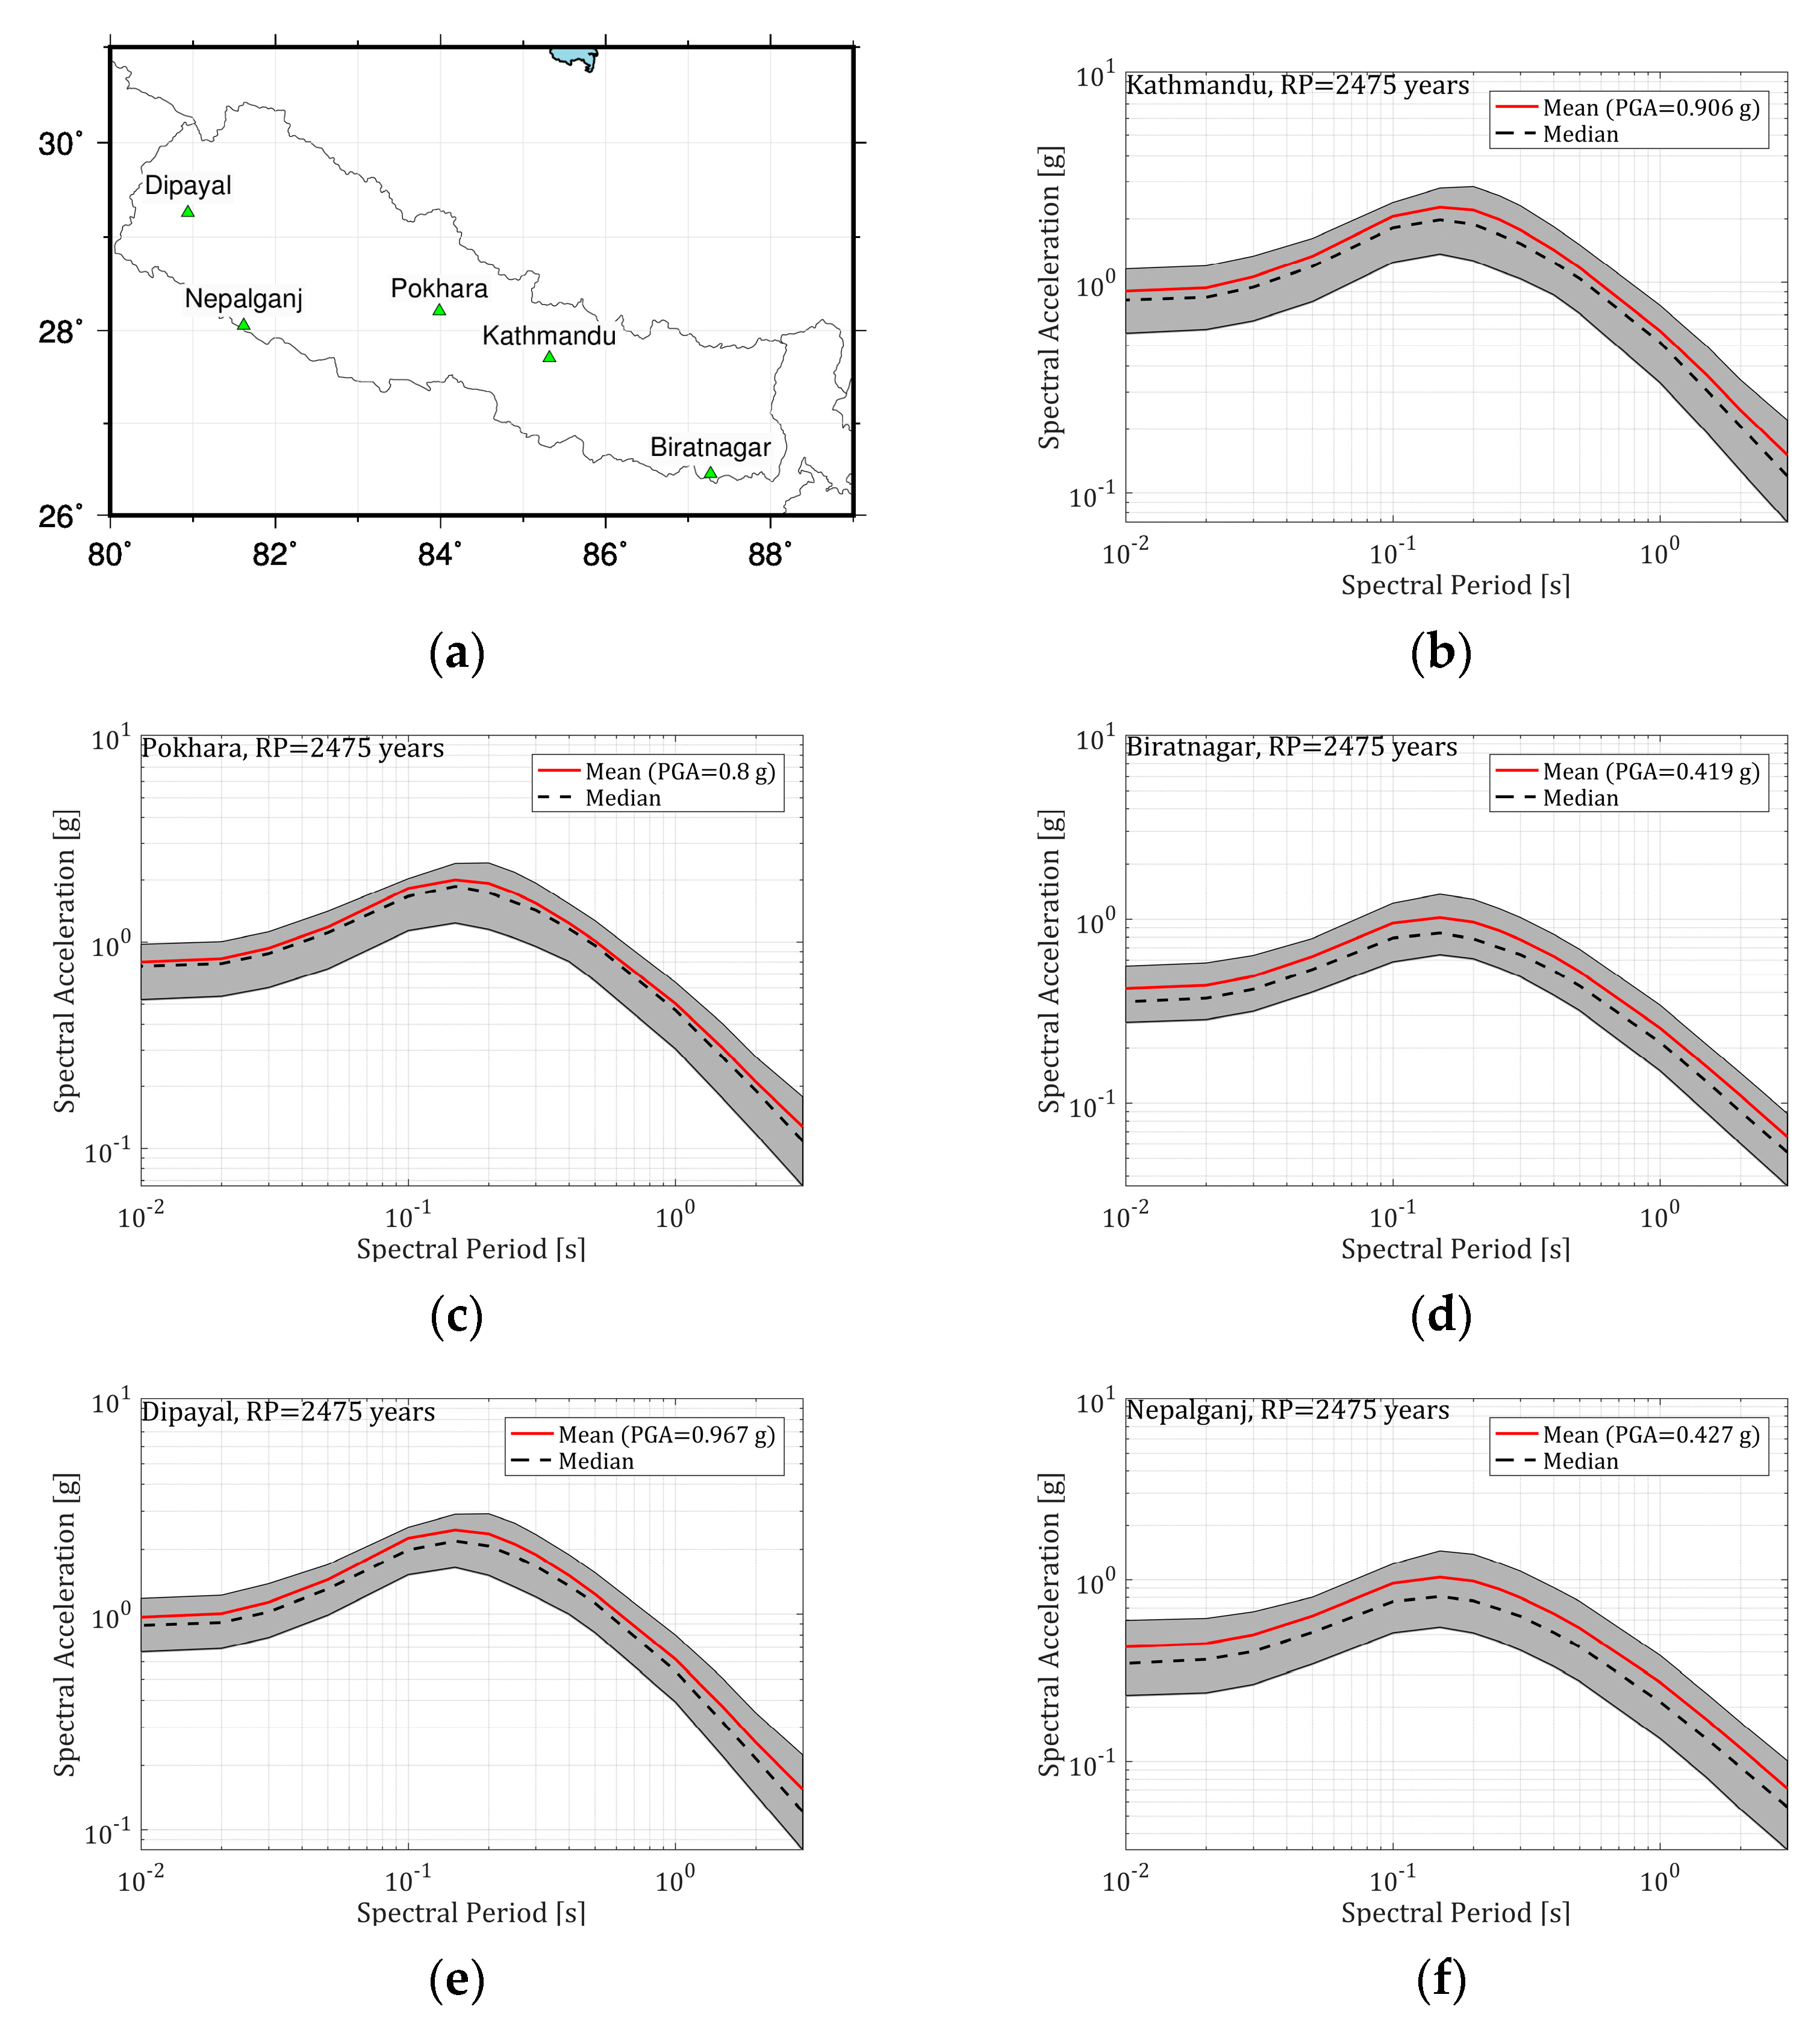
The uniform hazard spectra (UHS) (Figure 14 and Figure 15) obtained at both return periods considered (475 and 2475 years) show that the highest seismic hazard among the five locations considered is obtained for the northwestern town of Dipayal while the lowest is obtained for the southern city of Biratnagar.
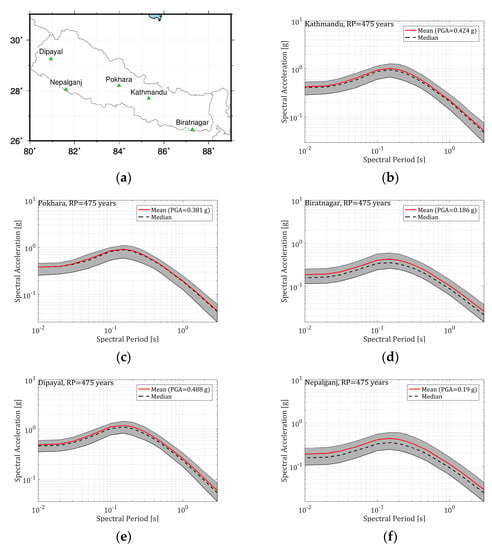
Figure 14.
(a) Map showing considered 5 locations and UHS and the centiles of the 5 selected cities of Nepal at return period of 10% exceedance probability in 50 years (return period of 475 years) considering the site condition of (Vs,30 = 760 m/s) for (b) Kathmandu; (c) Pokhara; (d) Biratnagar; (e) Dipayal, and (f) Nepalganj. Note that the graph is in log–log scale. The grey shaded area represents the range of UHS between centile 16 and 84%.
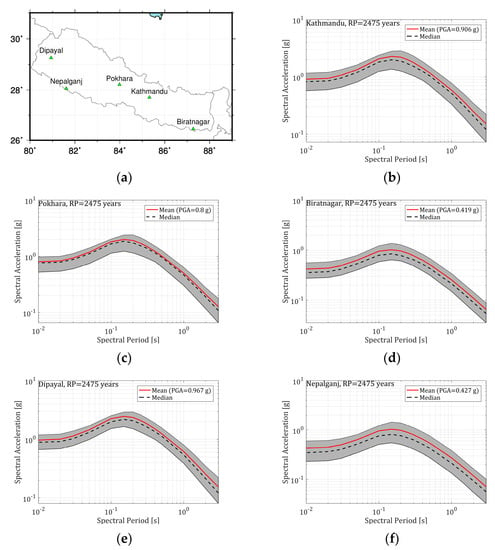
Figure 15.
(a) Map showing considered 5 locations and UHS and the centiles of the 5 selected cities of Nepal at return period of 2% exceedance probability in 50 years (return period of 2475 years) considering the site condition of (Vs,30 = 760 m/s) for (b) Kathmandu; (c) Pokhara; (d) Biratnagar; (e) Dipayal, and (f) Nepalganj. Note that the graph is in log–log scale. The grey-shaded area represents between centile 16 and 84%.
At a 475-year return period and considering Vs,30 of 760 m/s, the mean PGA obtained among the studied sites varies from 0.186 g at Biratnagar to 0.488 g at Dipayal. The mean PGA obtained at Kathmandu, Pokhara, and Nepalganj are 0.424 g, 0.381 g, and 0.190 g, respectively. Similarly, at a 2475-year return period, the mean PGA obtained among the studied sites varies from 0.419 g at Biratnagar to 0.967 g at Dipayal. The mean PGA obtained at Kathmandu, Pokhara, and Nepalganj is 0.906 g, 0.8 g, and 0.427 g, respectively. At both return periods and all sites, the consistency of the mean and median (the mean lies slightly above the median) demonstrates the well-balanced logic tree adopted. We note that these seismic hazard levels are closely coherent with the seismic hazard levels obtained in some of the previous studies, e.g., [15].
The uncertainty coefficients computed based on an equation [110] that considers the centiles 16 and 84% for UHS obtained at Kathmandu are at 52.6 and 63.1% for the 475- and 2475-year return periods, respectively. This relatively large uncertainty coefficient reflects the large degree of uncertainty integrated through SSC and GMM models. Moreover, it also reflects the uncertainties propagated in various seismic parameters like maximum magnitude, depth, style of faulting, etc.
The evaluation of the relative impact of the SSC logic tree scheme (Figure 16) demonstrates that regardless of the site considered, the SSC models integrating the major faults lead to a higher mean compared to the obtained weighted mean. On the other hand, the smoothed models and homogenous volume models lie relatively below the weighted average. Thus, the weighting scheme seems to balance the possible underestimation or overestimation due to various SSC models. Moreover, we observe that the cities located in the foreland areas (i.e., the less active region of Nepal) display larger variability compared to that region with higher seismic hazards.
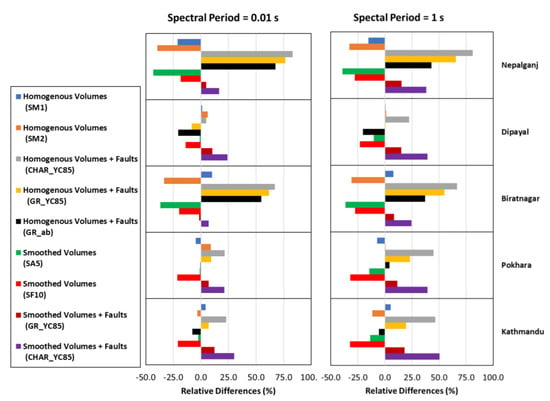
Figure 16.
Relative difference of each mean of SSCs to the weighted average based on the final logic tree at return period of 475 years and for five locations considered, (a) spectral period of 0.01 s; (b) spectral period of 1 s.
7.2. Comparison of PSHA Results
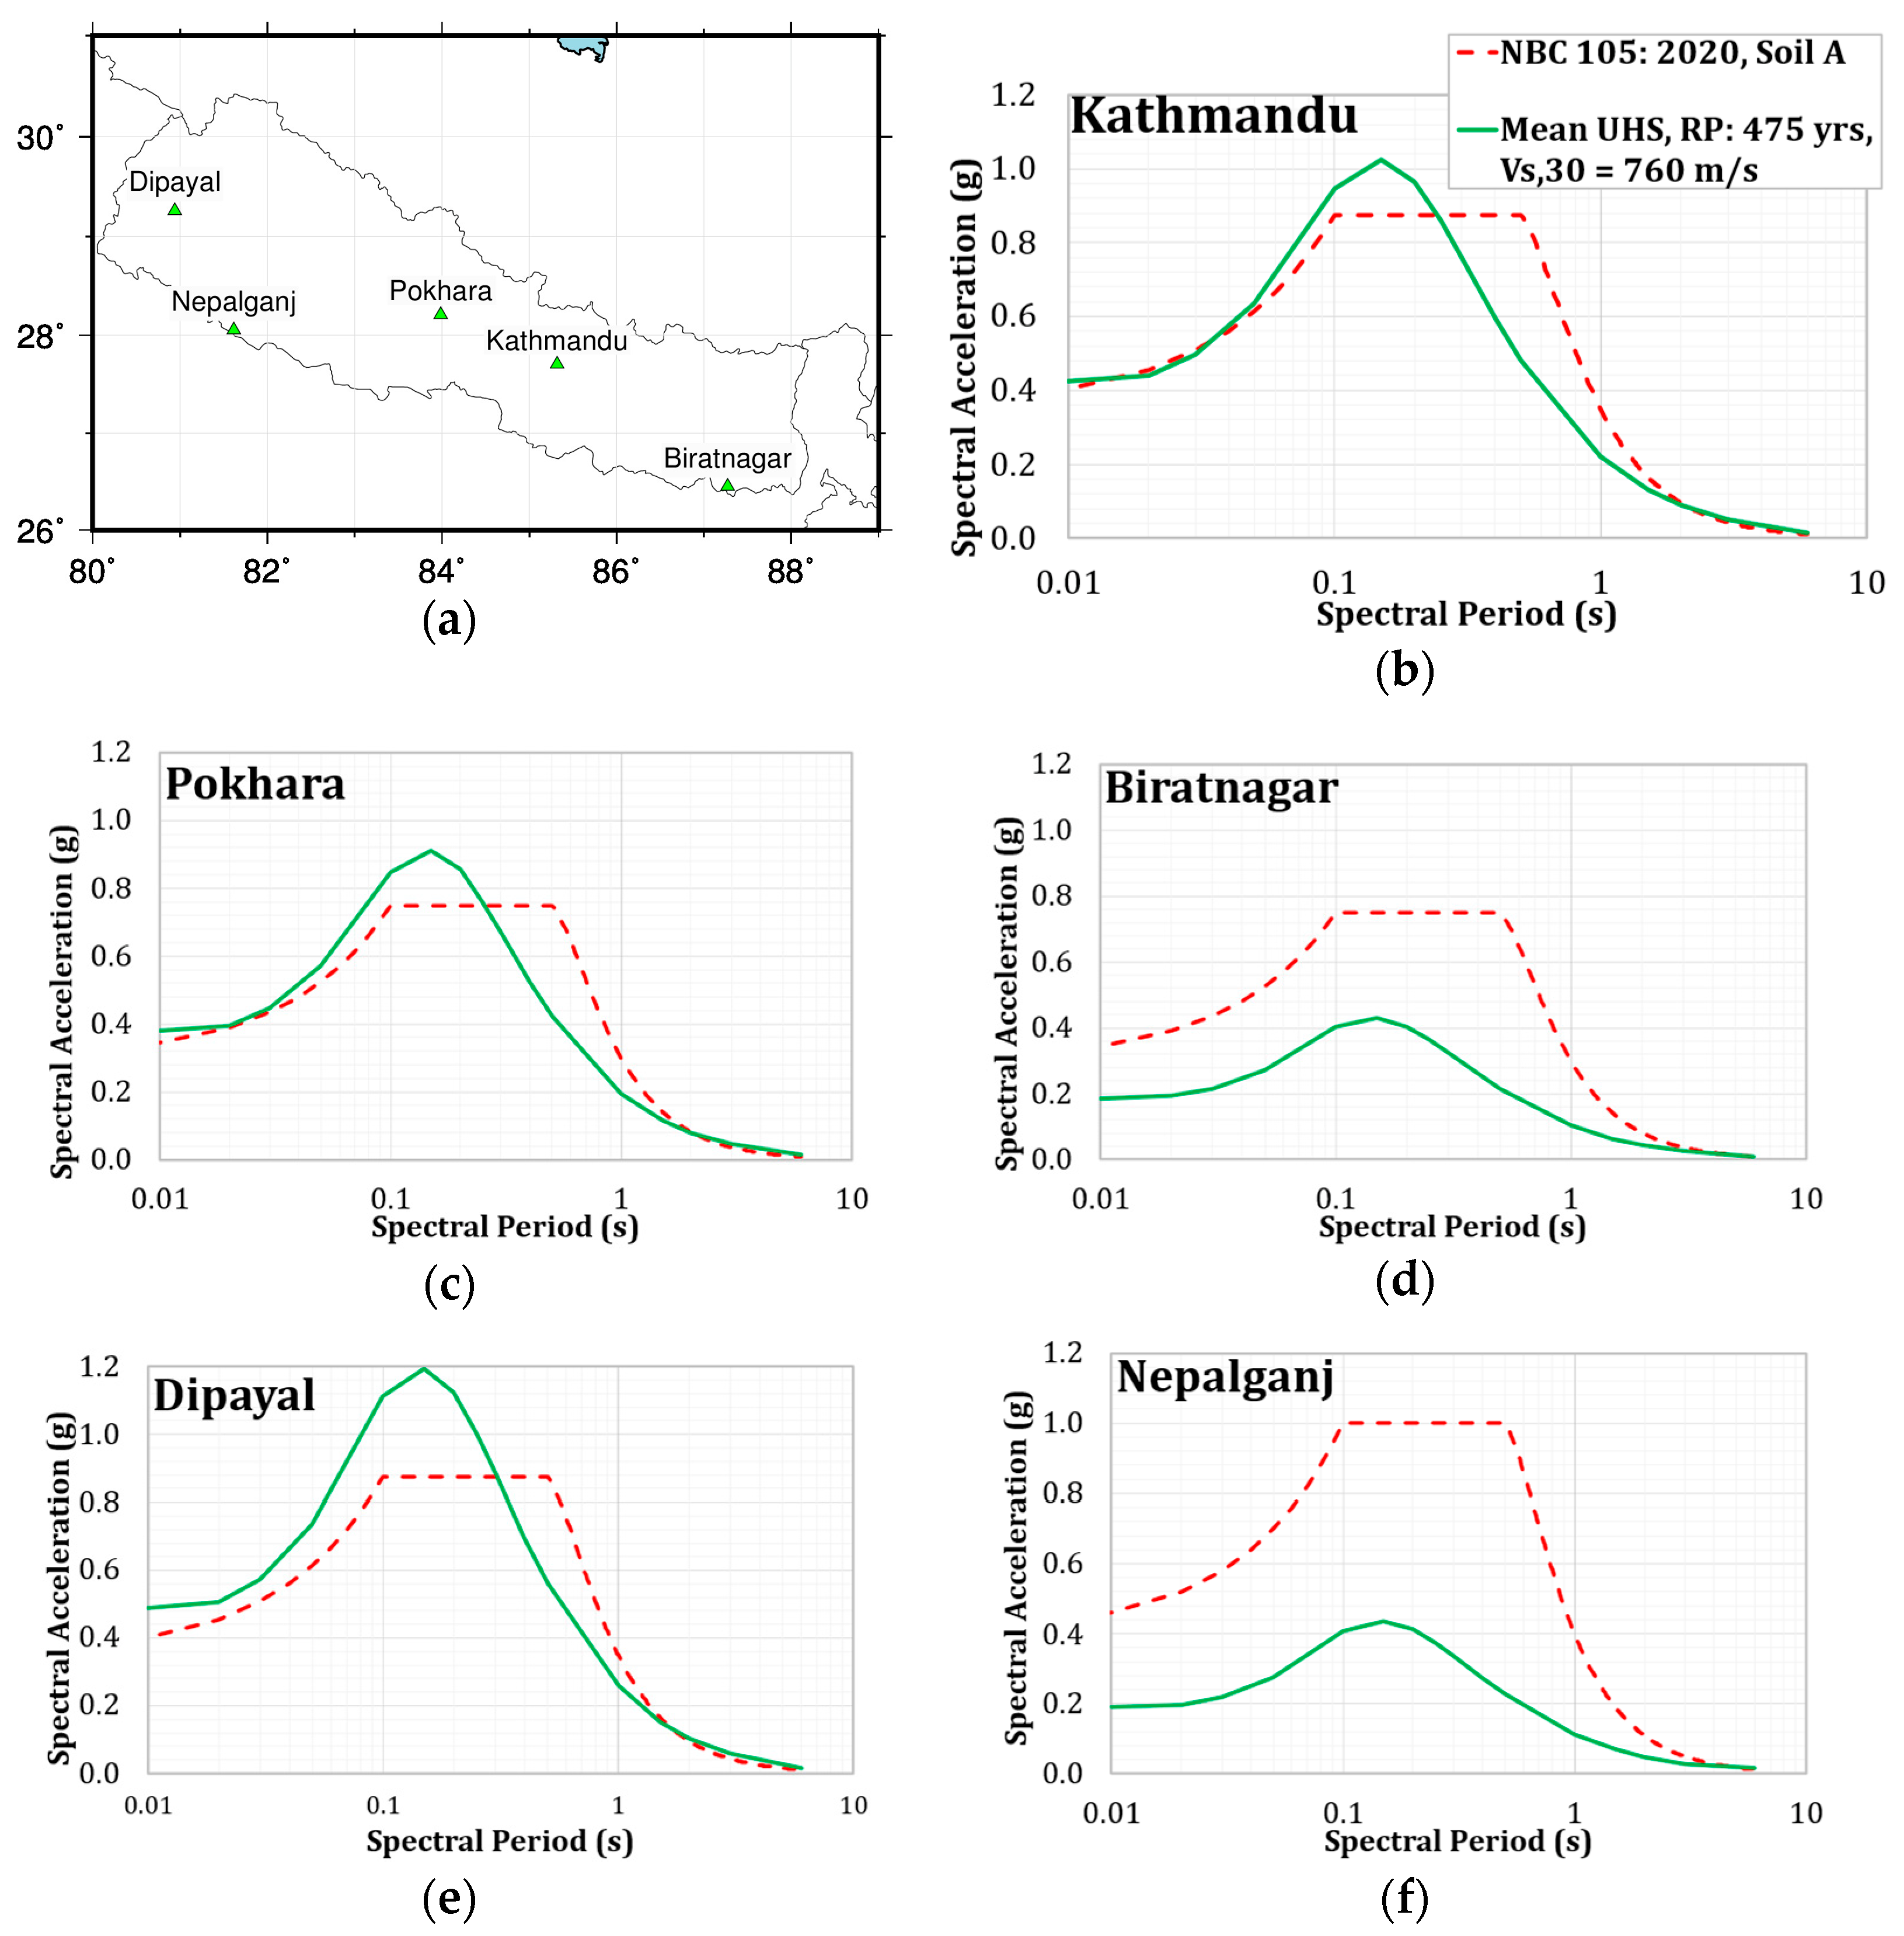
The mean UHS results obtained in this PSHA study considering standard rock condition with Vs,30 of 760 m/s are compared with the design response proposed in NBC105: 2020 for Soil Class A sites. The comparison shows notable discrepancies and differences in terms of seismic hazard levels and the shape of spectra.
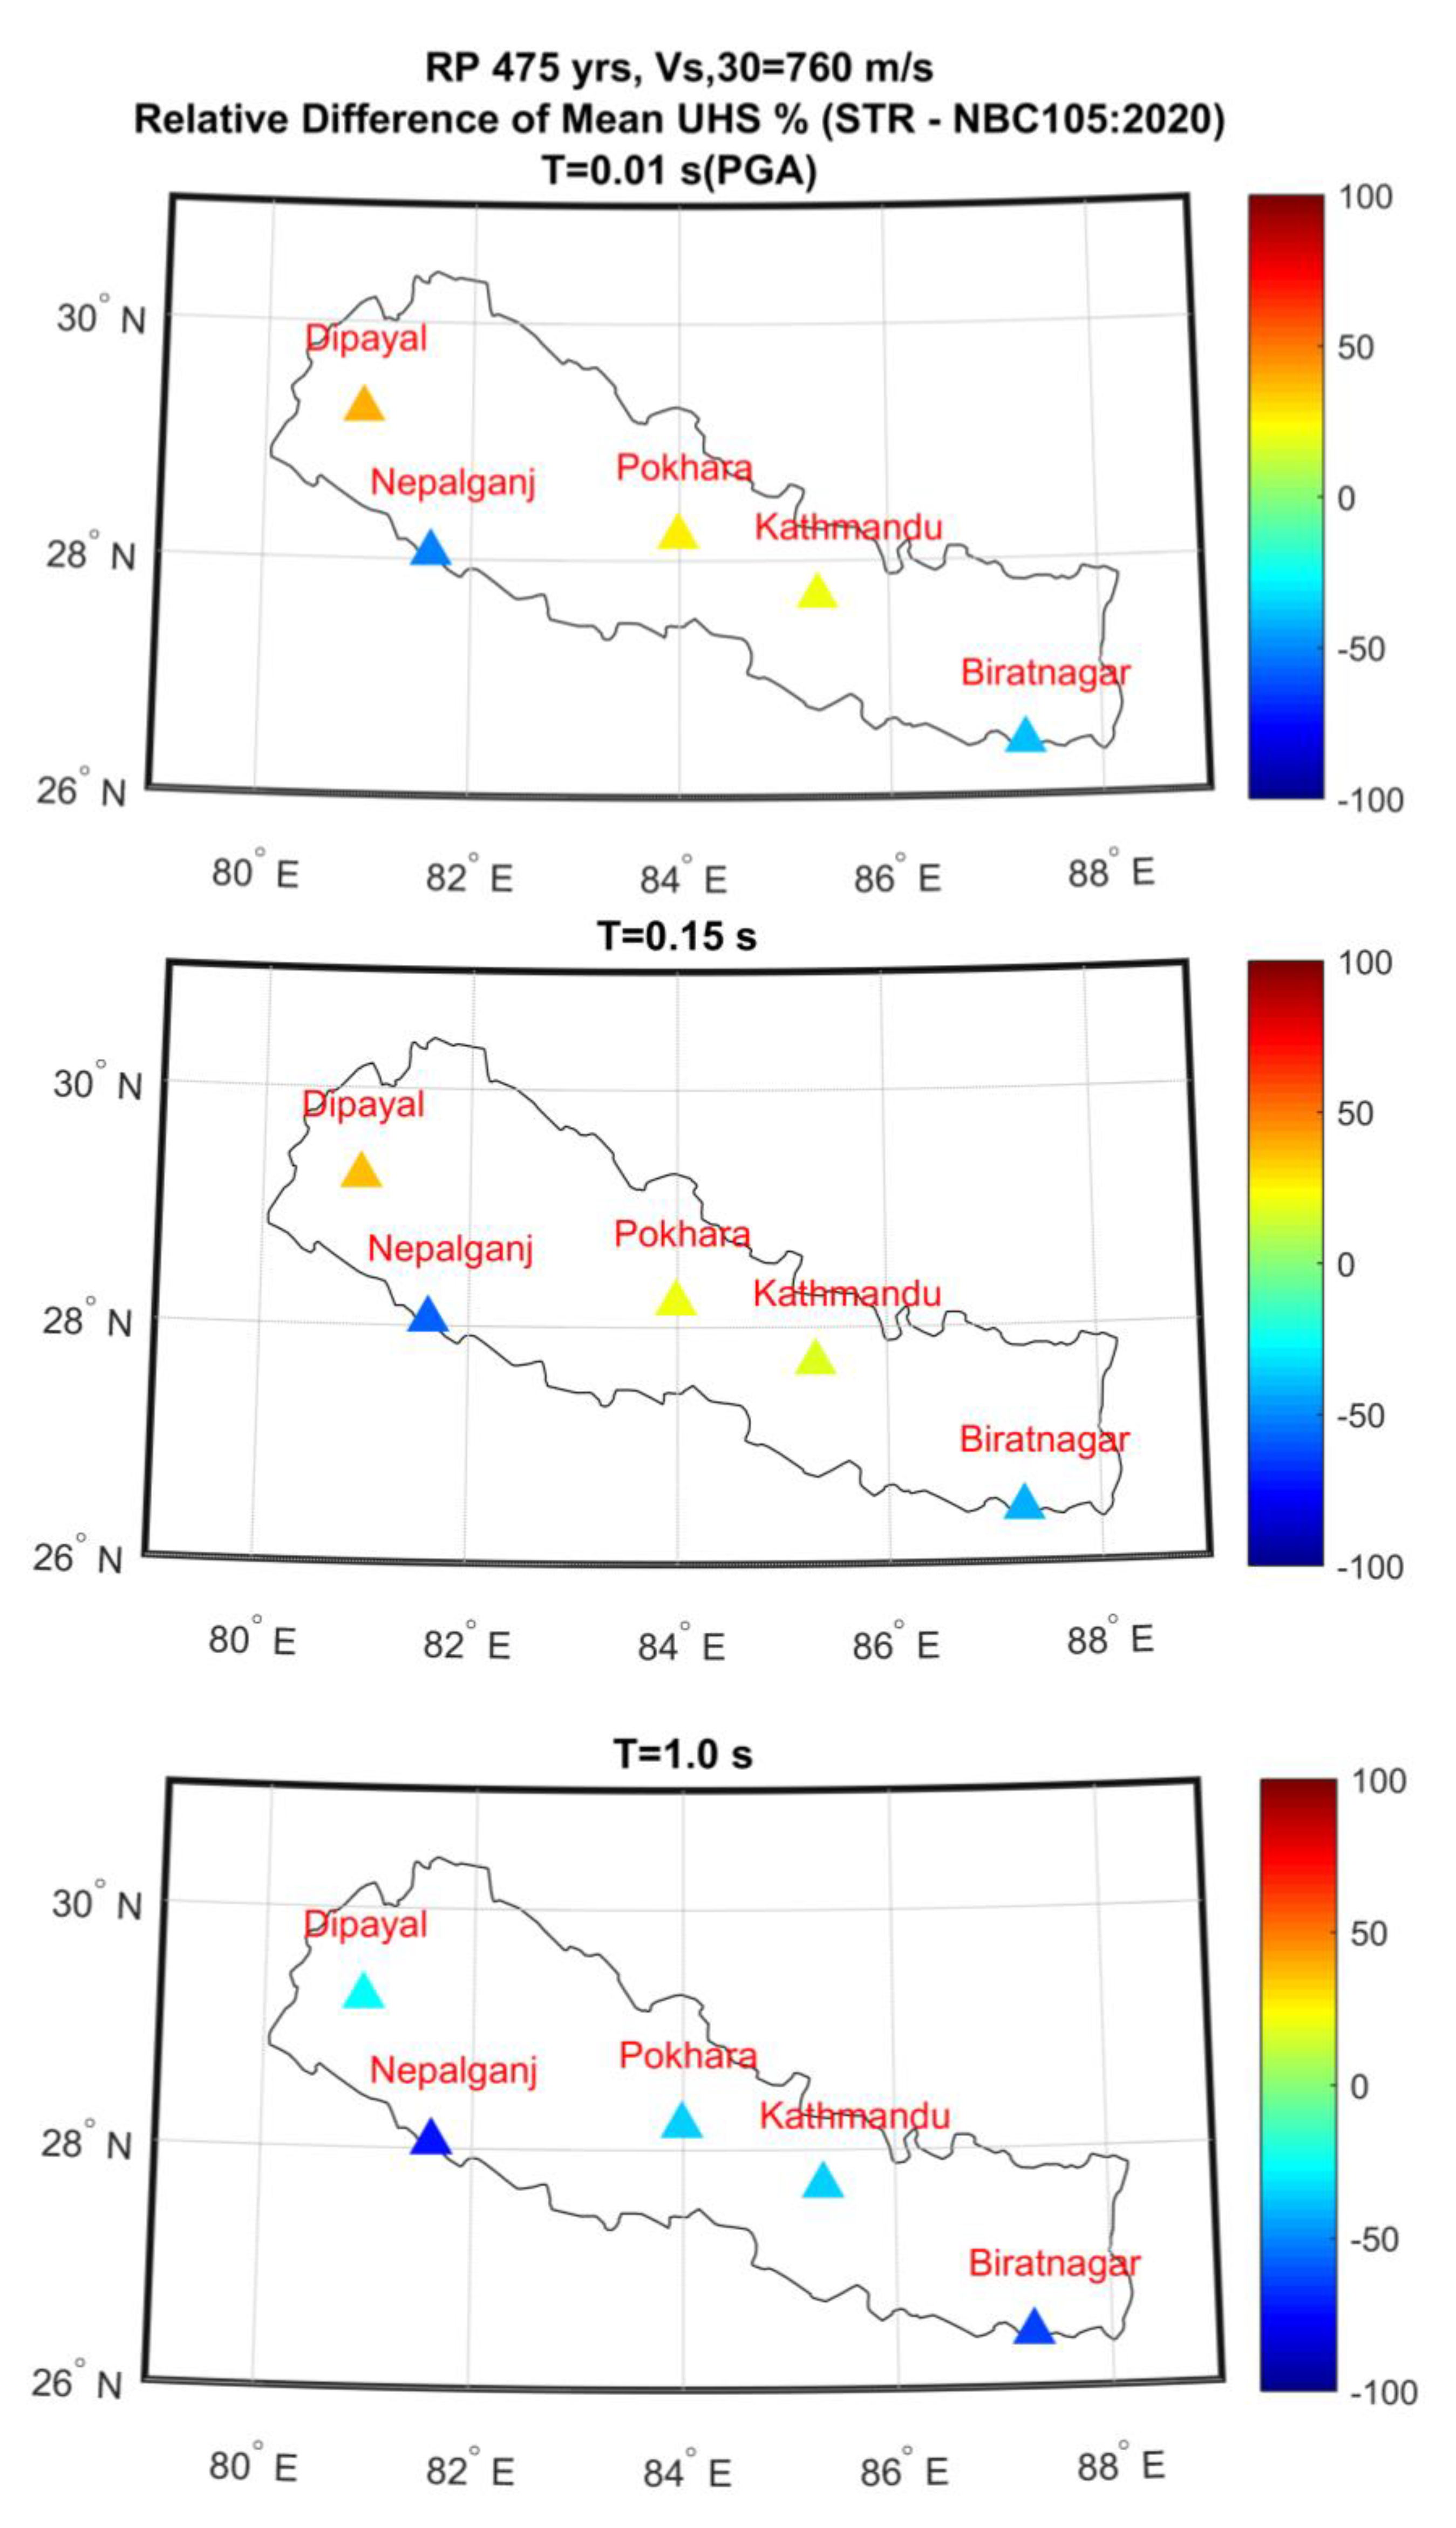
Firstly, at a 475-year return period considering standard soil condition with Vs,30 of 760 m/s (Figure 17, Figure 18 and Figure 19), the comparison of mean UHS shows that the levels recommended in NBC105: 2020 Soil A are quite different for all the sites considered. In the case of the city of Kathmandu, Bhaktapur, and Dipayal (sites that lie effectively north of MFT), this difference is more pronounced at the plateau (notably at spectral periods between 0.1 and 0.3 s). Seismic hazard levels in this study are up to 37% higher at a spectral period of 0.15 s for the city of Dipayal. While for the longer spectral period (0.3 to 2 s) the seismic hazard levels obtained are lower for all sites (up to 65% for site Biratnagar at spectral period of 1 s). Furthermore, the mean UHS, obtained in this study for the site locations which lie south of the MFT and MBT (Biratnagar and Nepalganj), is significantly below or completely enveloped by design spectra recommended by NBC105:2020 for the whole range of spectral periods.
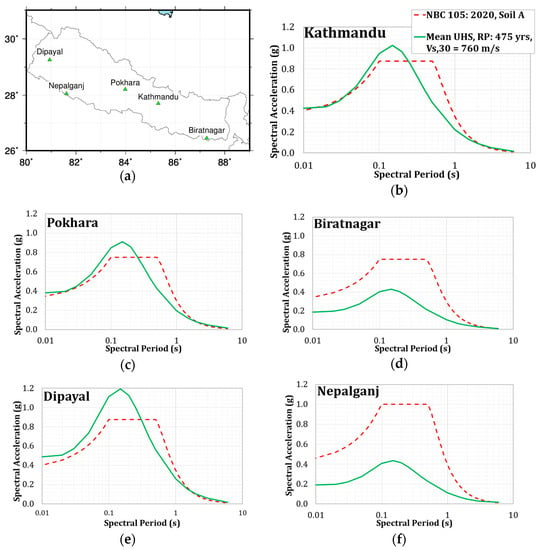
Figure 17.
(a) Map showing 5 considered locations and mean UHS at return period of 475 years for 5 selected locations obtained in this study considering the site condition of (Vs,30 = 760 m/s) obtained in this study (solid green lines) compared with NBC105: 2020 design spectrum for Soil A (dashed red lines) (b) Kathmandu; (c) Pokhara; (d) Biratnagar; (e) Dipayal; (f) Nepalganj. Note that the x-axis is in log scale.
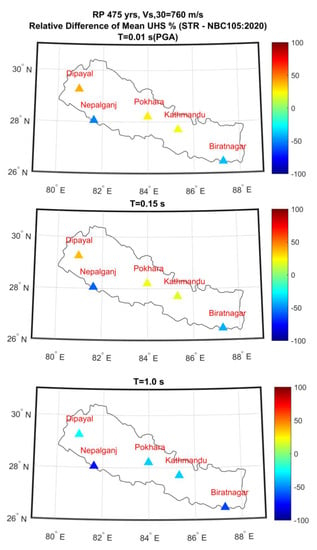
Figure 18.
Relative difference (%) in terms of mean spectral acceleration parameters between the current study (STR) and the levels recommended in Nepal Building Code, NBC105: 2020. Return periods of 475 considering Vs,30 of 760 m/s or soil A for NBC105:2020 for five sites selected for comparison for spectral periods PGA (0.01 s), 0.15 s and 1.0 s. Note that, for the ease of comparison only, the calculation performed at spectral period, T = 0.01 s, is regarded as peak ground acceleration (PGA).
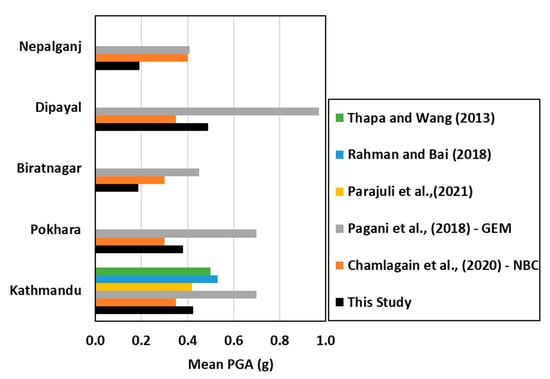
Figure 19.
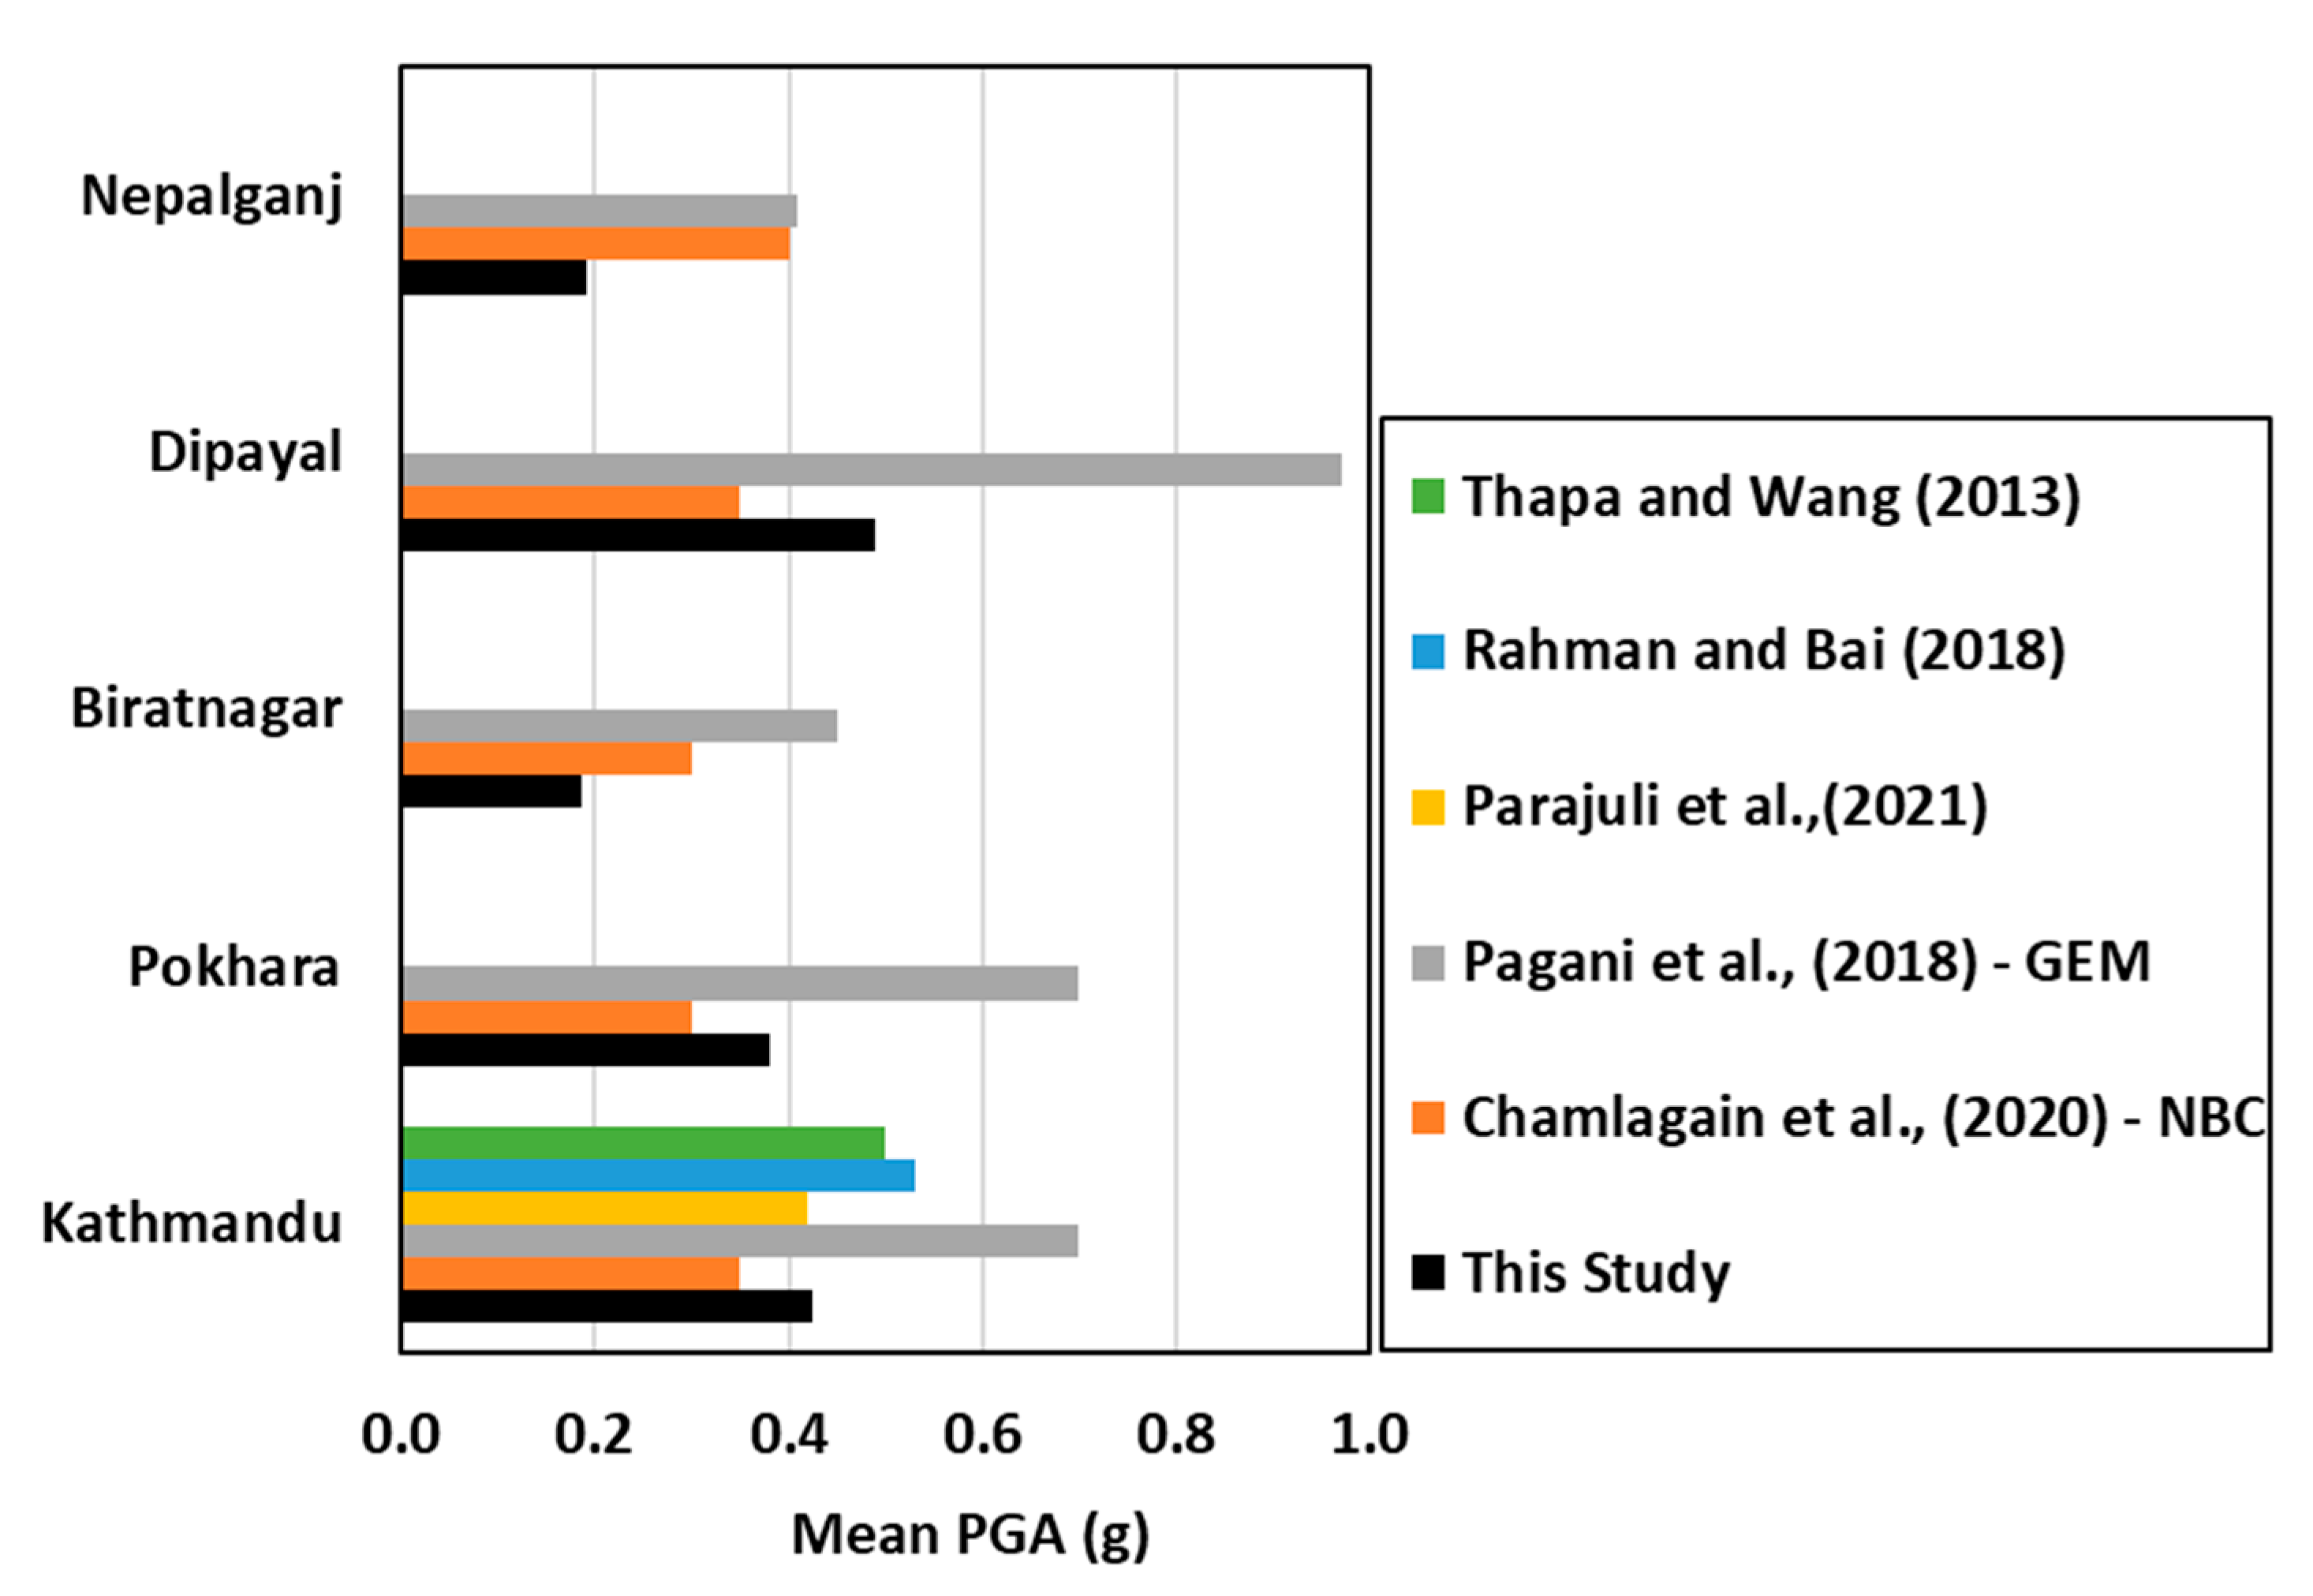
Comparison of mean PGA at 475-year return period, considering standard rock condition (Vs,30 = 760 m/s) compared with previous studies including NBC105:2020 [6,8,10,12,15]. Note that, for ease of comparison only, the calculation performed at spectral period, T = 0.01 s, is regarded as peak ground acceleration (PGA).
In other words, the results obtained in this study highlight the possibility that NBC105: 2020 design spectrum could have underestimated the seismic hazard levels in the high seismicity region and overestimated them in the relatively lower seismic hazard region, for both return periods considered in this study. The differences in results obtained in this study with respect to that of NBC105:2020 could be most likely related to differences in SSC and GMM models considered in these studies. The singular SSC model used without alternative SSC models might have led to systematic bias in seismic hazard estimates obtained in study by [6] which was eventually adopted to derive design spectra for NBC105:2020.
The comparison of seismic hazard levels obtained at a 475-year return period, Vs,30 of 760 m/s (Figure 19), to recent studies, shows that regardless of the locations considered, seismic hazard levels from GEM [12] are above the results obtained in this study and the difference is more significant for the sites which lie north of the MFT (for example Kathmandu, Pokhara, Dipayal). The possible reason for these discrepancies in the results obtained in this study with respect to results in the GEM [12] could be associated with the use of very different seismic source models and methods used to take into account the uncertainties in the SSC model, which could have led to possible bias in the estimates. Moreover, the strategy for use of ground motion models (ACR or subduction type) could also have led to significant differences. For the same return period, at Kathmandu, the mean seismic hazard levels obtained in [15] are very close to the one obtained in this study. Similarly, the comparison with [8,10] shows that the seismic hazard levels are in the same order of magnitude but slightly above the seismic hazard levels obtained in this study.
7.3. Seismic Hazard Maps
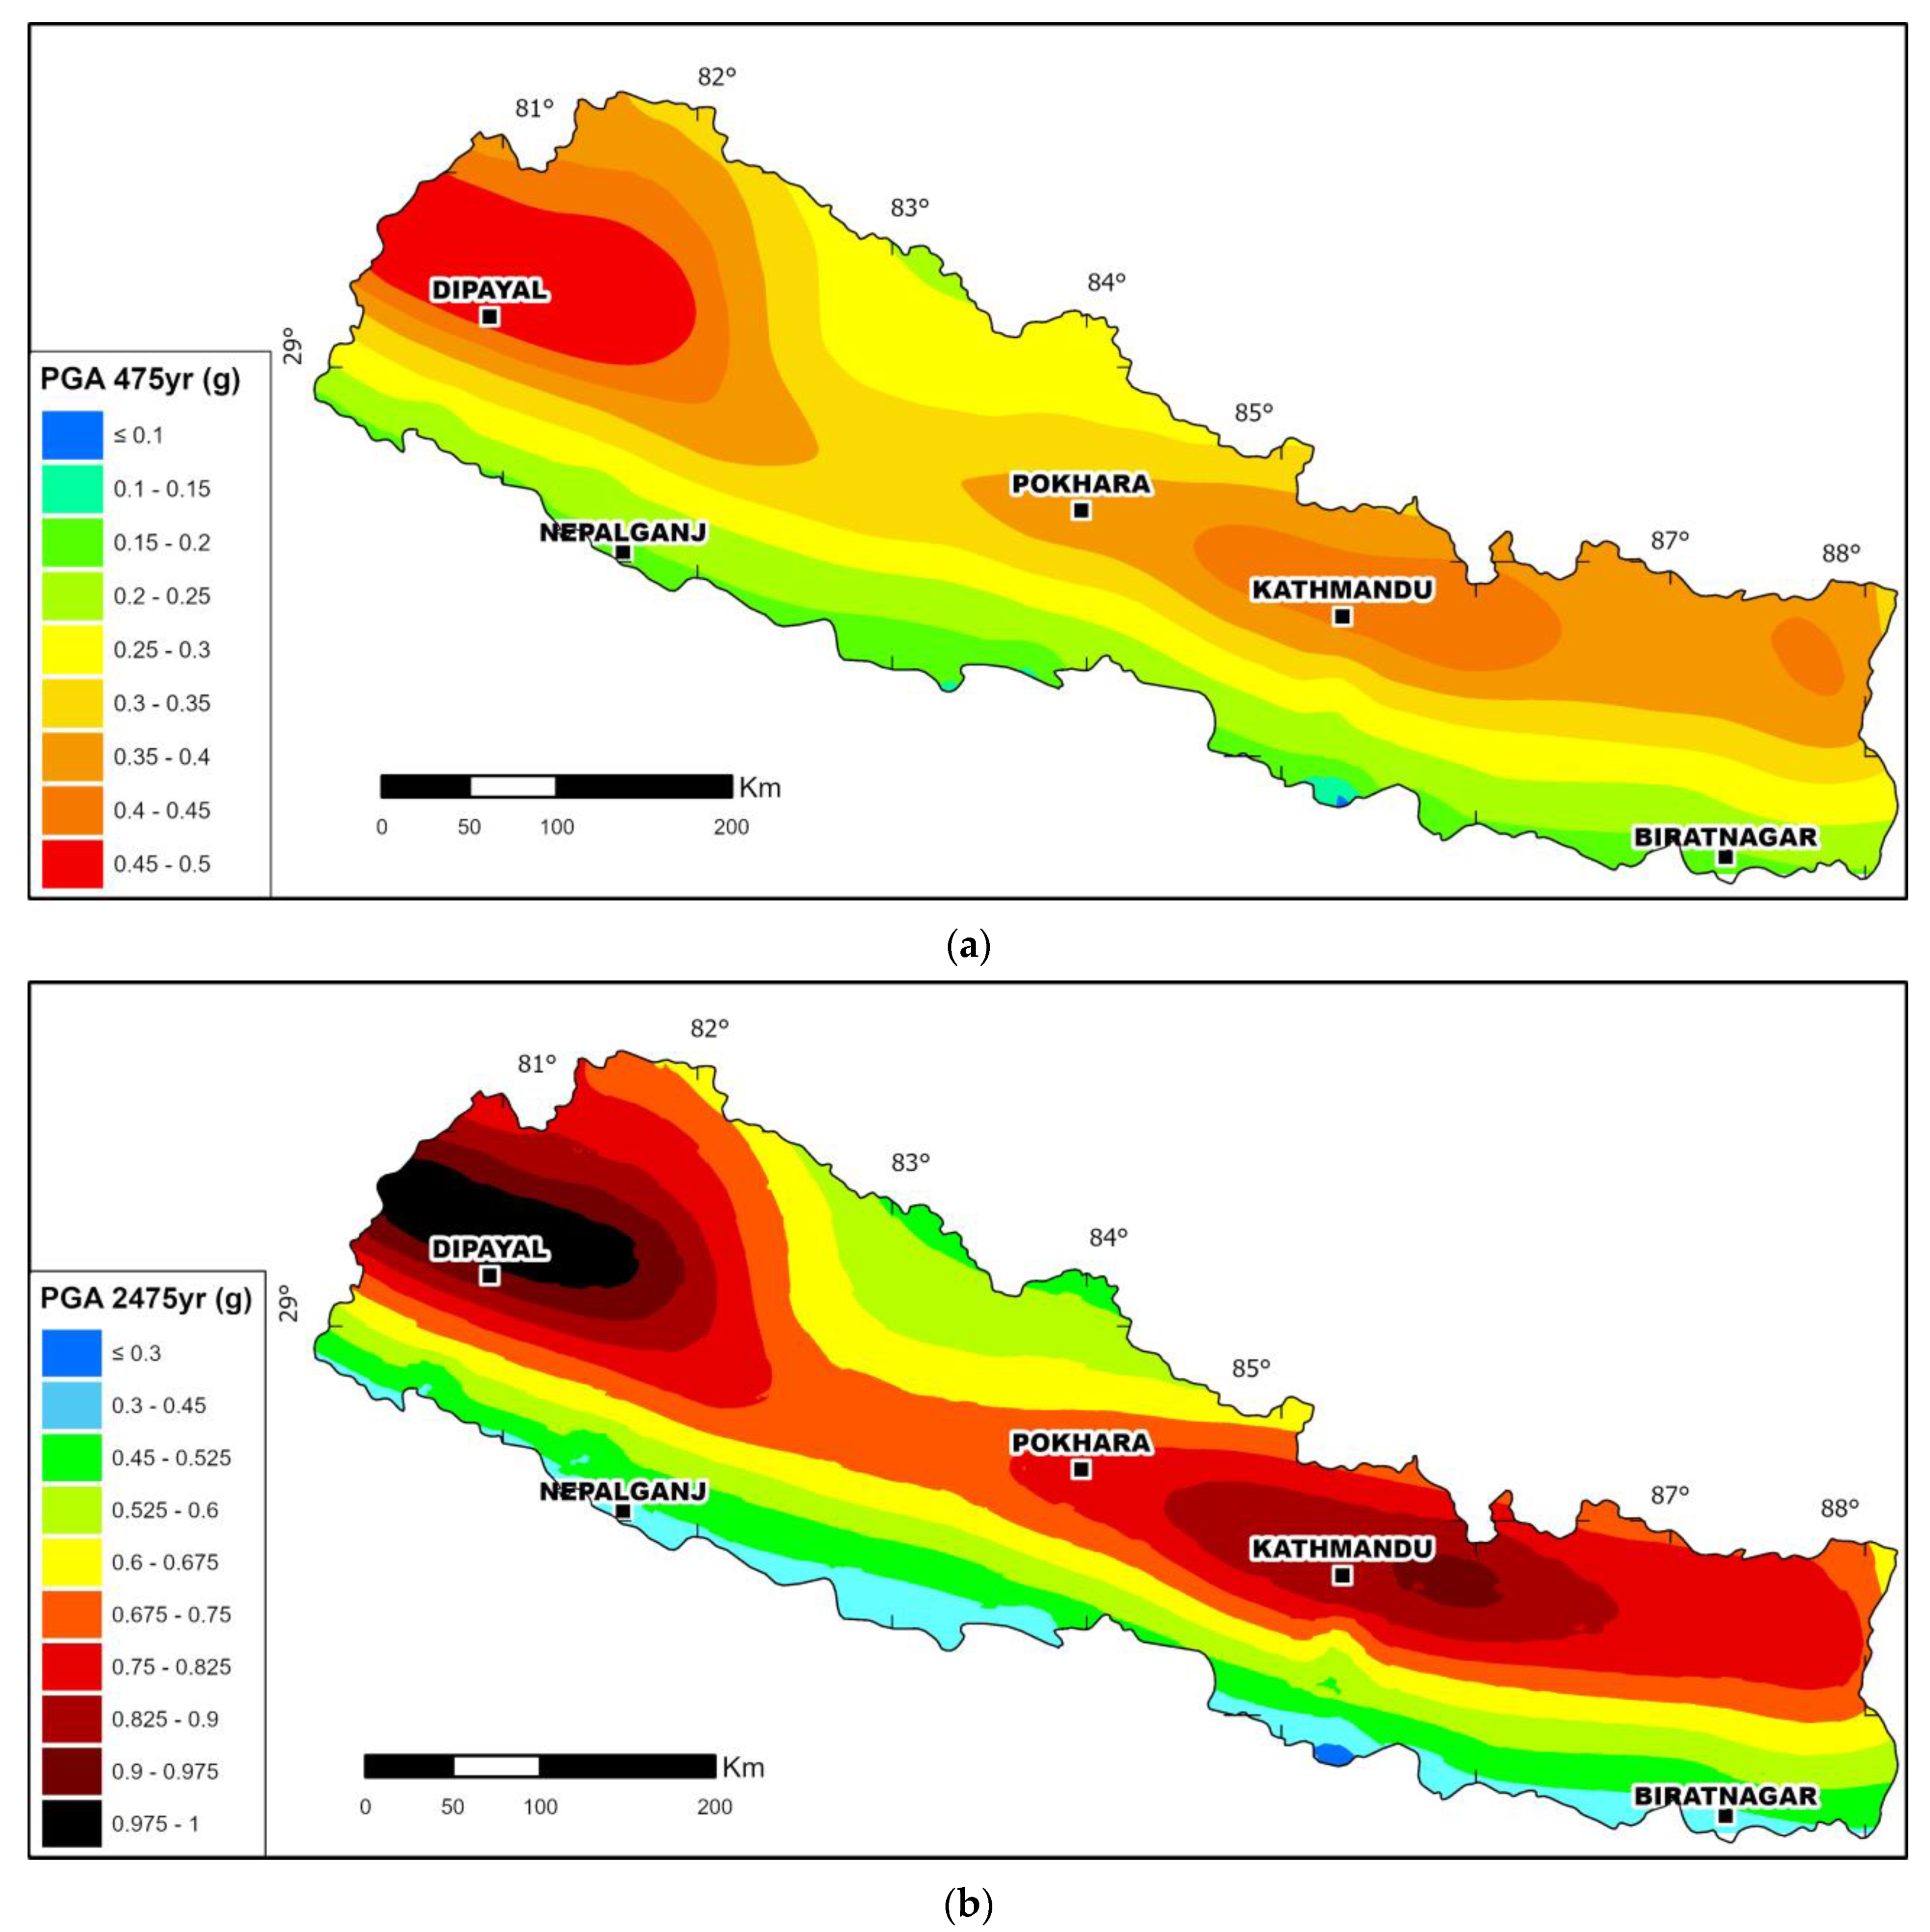
The PGA values have been calculated using a grid of 20 km × 20 km, for Soil A condition (Vs,30 = 760 m/s) at a 475- and 2475-year return period (Figure 20a). At a 475-year return period (10% probability of exceedance in 50 years), the value of PGA varies from ~0.1 g in the south to 0.5 g in the northern part of Nepal. As expected, the highest values of ground motions are found in the far northwest of Nepal where they exceed 0.45 g, and in the north-eastern edge where they range from 0.45 to 0.50 g. Conversely, a medium to low seismic hazard is observed in the central region of Nepal with PGA values ranging from 0.25 g to 0.35 g. The PGA value is relatively lower (<0.25 g) in Southern and Far North Nepal than in any region of the country. The PGA distribution for 2475 years return period (2% probability of exceedance in 50 years) is shown in Figure 20b. The pattern of the distribution is relatively the same as for the 475-year return period and the PGA values range from 0.3 g to ~1 g. The northwestern area concentrates the highest seismic hazard with ground motion exceeding 0.9 g while the eastern region has slightly lower values of 0.7 g to 0.9 g. These seismic hazard levels are coherent and in the same order of magnitude with some recent studies [8,15].
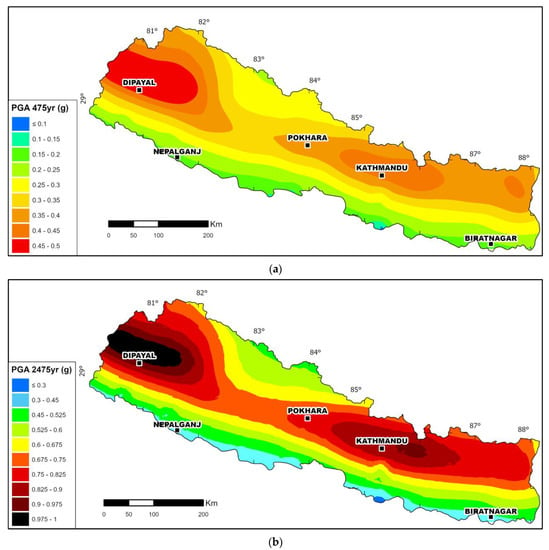
Figure 20.
Seismic hazard maps of Nepal showing the peak ground acceleration (PGA) distribution at standard bedrock (i.e., Vs30 = 760 m/s) level. (a) PGA with 10% probability of exceedance in 50 years. (b) PGA with 2% probability of exceedance in 50 years. Note that the color scales are different between (a) and (b).
These results are consistent with the structural and geological fabrics observed in Nepal and show a spatial distribution strongly controlled by the MFT and the MBT that concentrate the highest seismic hazard along an ~WNW–ESE thrust–parallel axis. At depth, the MHT geometry varies from west to east with a slightly structural change at the 83° E longitude (see the MHT geometry and depth contour in Figure 1) that coincides with the medium to low PGA values of the central part. In addition, the highest seismic hazard areas seem to correspond to abrupt changes in the dip of the ramp as in the west where the patch of high seismic hazard coincides to the transition zone between the deeper ramp of the decollement and the mid-slope flat. At the northern tip of Nepal, the decrease in the PGA values for both return periods coincides with the supposed transitional coupling/decoupling zone of the MHT [27,36,69].
8. Conclusions and Perspectives
An updated probabilistic seismic hazard model covering the entirety of Nepal is presented. The PSHA methodology and its components adopted in this study represent an improvement with respect to previous PSHA for Nepal. The seismic hazard model is the result of recent advances in research and development of geological and seismological data for Nepal, in particular concerning seismicity catalog, geometry, and seismicity parameters for the MHT and MBT. We considered the available data and methods systematically, and we propose alternative source models while also considering previous models in a logic-tree framework. This allowed us to consider the range of epistemic uncertainty prevailing in the identification and characterization of the seismic sources.
The seismicity catalog and the strategy adopted to merge the different source catalogs in this study are an improvement in the context of seismic hazard studies conducted for Nepal. The compilation and construction of the catalog was elaborated in the perspective to continue the efforts towards a comprehensive and homogenized catalog utilizable for seismic hazard studies in the region.
This study shows that consideration of alternative source models can lead to very different seismic hazard assessments. Sensitivity analyses demonstrate that the SSC models integrating faults lead to higher seismic hazard levels followed by homogenous volumes and smoothed volumes models. The logic-tree scheme was constructed based on evaluation of sensitivity analysis establishing a rationale of weighting schemes for the models and considering the epistemic uncertainties. The PSHA maps obtained in this study are quite similar (in same order of magnitude) to the results obtained in other studies [8,15]. In line with these studies [8,15], our results confirm that the foreland basin at the southern belt of Nepal (including, e.g., Biratnagar and Nepalganj cities) is a low seismic hazard region as well as the northern boundary at the vicinity of Tibetan Plateau. The latter likely reflects the decrease in the fault coupling of the MHT interface related to the downdip brittle/ductile transition. Moreover, the central part of Nepal, north of the MFT, is one of the most active regions including important cities like Katmandu and Pokhara. Indeed, the seismic hazard is concentrated along an WNW–ESE elongated band, sub-parallel to the main thrust axis, with highest PGA values laterally distributed in the southeastern and northwesternmost regions with a relatively lower seismic hazard area between them. The seismic hazard spatial distribution in this study may reflect the E–W variation of the MHT geometry consistently with geologic reconstruction and geodetic observations [5,19,27] such as (i) the 83° E structural change in orientation observed along the MFT and MBT fault traces leading to low seismic hazard area, (ii) the changes in the dip of the decollement at depth with high seismic hazard associated to mid-crustal ramp allowing highest fault coupling [69] and/or (iii) the presence of duplex structure and basement rocks stacked precluding slip on the MHT [19]. Since the seismicity sample presents relatively small completeness periods and the paleo seismological context is only barely known, it is not excluded that the low seismic hazard area may reflect a long-term moment deficit [1,27,29]. In any case, the geometrical and rheological variation along the MHT interface seems to have a strong influence on the seismic hazard distribution in Nepal (with respect to standard rock condition) and confirms the need of integrating geological structures and physical factors (e.g., fault coupling, stress rate, rheological transition) to PSHA studies in tectonically active regions.
The comparison of mean UHS obtained In this study with the design spectra NBC105: 2020 adopted based on the study by [6] shows critical differences and discrepancies. This comparative evaluation shows that the seismic hazard levels recommended in NBC105: 2020 for the locations situated south of MFT/MBT surface traces (like Biratnagar, Nepalganj) are possibly overestimated while the seismic hazard levels recommended for many other major cities (like Kathmandu and Pokhara which lie north of the MFT/MBT) might have been significantly underestimated, especially at spectral periods of interest which concerns majority of building typology prevalent in Nepal, i.e., small to mid-size buildings. The possible reason for this discrepancy could be related to the fact that PSHA study [6] conducted for the purpose of NBC105:2020 relies on a singular source model, limited GMMs, and the method (for example in recurrence models for fault sources) might have led to bias in seismic hazard estimates.
In this study, several limitations have been identified and might be considered for future seismic hazard assessment. Indeed, limited effort was devoted at this stage to the construction of the GMM, for which a simple multi-GMM approach has been adopted as in previous studies. Further studies should be devoted to a more comprehensive assessment of the uncertainties in ground motion estimates for Nepal. In addition, the inclusion of the individual crustal faults once the fault databases are further consolidated would help to better constrain the seismic hazard estimates. Future research should also focus on making critical evaluation of the empirical site amplification factors using locally recorded strong motion data to consolidate the most applicable factors. The contradiction in the seismic hazard levels recommended by NBC105: 2020 with the ones obtained in this study and in several recent studies [8,15] should be addressed through a future comprehensive research. Indeed, the seismic hazard levels recommended through a building code guideline must be well scrutinized and consolidated to ensure the safe design of new buildings or reinforcements of existing ones. The consideration of locally developed ground motion models, individual crustal faults, and consolidation of the MHT fault system parameters could be a way forward to consider for the future seismic hazard studies in the region.
Supplementary Materials
The following supporting information can be downloaded at: https://www.mdpi.com/article/10.3390/geosciences13080220/s1, Figure S1: Distribution of epicentral location sources through different time periods of history; Figure S2: Completeness analysis, cumulative number of earthquakes as a function of time (red circles), inter-event variance (black dashed line), best estimate is shown as green dashed line, gray shade represents the lower to upper estimates; Table S1: Seismicity pa-rameters for seismic source zones of SM1; Table S2: Seismicity parameters for seismic source zones of SM2; Table S3: Seismicity parameters for seismic source zones of SM3F; Table S4: GMMs selected in the Ground Motion Characterization (GMC) logic-tree and synthesis of validity domains for Active Shallow Crustal Region (ASCR); Table S5: GMMs selected in the Ground Motion Characterization (GMC) logic-tree and synthesis of validity domains for Himalayan Collision Domain (Subduction Interface Type).
Author Contributions
Conceptualization, S.M. and A.P.; methodology, S.M. and A.P.; software, D.B. and G.A.; validation, D.B., G.A., S.M., A.P. and C.M.; formal analysis, S.M., A.P. and C.M.; investigation, A.P. and S.M.; resources, S.M., A.P. and C.M.; data curation, S.M. and A.P.; writing—original draft preparation, S.M. and A.P.; writing—review and editing, S.M., A.P., C.M., Y.B., G.A., K.H. and H.S.; visualization, S.M., A.P. and D.B.; supervision, C.M., D.B. and G.A.; project administration, C.M.; funding acquisition, C.M., D.B. and G.A. All authors have read and agreed to the published version of the manuscript.
Funding
This research received no external funding.
Data Availability Statement
We ensure that data shared are in accordance with consent provided by participants on the use of confidential data. The data presented in this study are available in the Supplementary Materials and are available on request from the corresponding author.
Acknowledgments
We would like to be thankful to Francois Vaysse and Romain Leroux-Mallouf from the TEGG team (Électricité de France—EDF) for allowing us to publish these data. The software of ArcGis Pro, Matlab and GMT (https://www.generic-mapping-tools.org/; accessed on 15 April 2023) have been used for the edition of the maps. The hazard calculations were made using the software suite SHA-toolbox developed internally by Seister. It was validated by conducting the tests developed in a project sponsored by the Pacific Earthquake Engineering Research (PEER) Centre’s Lifelines Program and documented in “Verification of Probabilistic Seismic Hazard Analysis Computer Programs” by [111,112], so called the “PEER tests”.
Conflicts of Interest
The authors declare no conflict of interest.
References
- Ader, T.; Avouac, J.-P.; Liu-Zeng, J.; Lyon-Caen, H.; Bollinger, L.; Galetzka, J.; Genrich, J.; Thomas, M.; Chanard, K.; Sapkota, S.N. Convergence Rate across the Nepal Himalaya and Interseismic Coupling on the Main Himalayan Thrust: Implications for Seismic Hazard. J. Geophys. Res. Solid Earth 2012, 117, 4403–4419. [Google Scholar] [CrossRef]
- Bollinger, L.; Sapkota, S.N.; Tapponnier, P.; Klinger, Y.; Rizza, M.; Van der Woerd, J.; Tiwari, D.R.; Pandey, R.; Bitri, A.; Bes de Berc, S. Estimating the Return Times of Great Himalayan Earthquakes in Eastern Nepal: Evidence from the Patu and Bardibas Strands of the Main Frontal Thrust. J. Geophys. Res. Solid Earth 2014, 119, 7123–7163. [Google Scholar] [CrossRef]
- Lavé, J.; Avouac, J.P. Active Folding of Fluvial Terraces across the Siwaliks Hills, Himalayas of Central Nepal. J. Geophys. Res. Solid Earth 2000, 105, 5735–5770. [Google Scholar] [CrossRef]
- Hossler, T.; Bollinger, L.; Sapkota, S.N.; Lavé, J.; Gupta, R.M.; Kandel, T.P. Surface Ruptures of Large Himalayan Earthquakes in Western Nepal: Evidence along a Reactivated Strand of the Main Boundary Thrust. Earth Planet. Sci. Lett. 2016, 434, 187–196. [Google Scholar] [CrossRef]
- Elliott, J.R.; Jolivet, R.; González, P.J.; Avouac, J.-P.; Hollingsworth, J.; Searle, M.P.; Stevens, V.L. Himalayan Megathrust Geometry and Relation to Topography Revealed by the Gorkha Earthquake. Nat. Geosci. 2016, 9, 174–180. [Google Scholar] [CrossRef]
- Chamlagain, D.; Niroula, G.P.; Maskey, P.N.; Bista, M.K.; Tamrakar, M.R.; Gautam, B.K.; Ojha, S.; Dhakal, R.P.; Acharya, I.P. Probabilistic Seismic Hazard Assessment of Nepal for Revision of National Building Code (NBC)-105. In Proceedings of the 17th World Conference on Earthquake Engineering (17WCEE), Sendai, Japan, 13–18 September 2020. [Google Scholar]
- Pradhan, P.M.; Timalsina, S.P.; Bhatt, M.R. Probabilistic Seismic Hazard Analysis for Nepal. Lowl. Technol. Int. 2020, 22, 75–80. [Google Scholar]
- Rahman, M.M.; Bai, L. Probabilistic Seismic Hazard Assessment of Nepal Using Multiple Seismic Source Models. Earth Planet. Phys. 2018, 2, 327–341. [Google Scholar] [CrossRef]
- Stevens, V.L.; Shrestha, S.N.; Maharjan, D.K. Probabilistic Seismic Hazard Assessment of Nepal. Bull. Seismol. Soc. Am. 2018, 108, 3488–3510. [Google Scholar] [CrossRef]
- Thapa, D.; Wang, G. Probabilistic Seismic Hazard Analysis in Nepal. Earthq. Eng. Eng. Vib. 2013, 12, 577–586. [Google Scholar] [CrossRef]
- NBC105: 2020 Nepal National Building Code, Seismic Design of Buildings in Nepal; Government of Nepal: Kathmandu, Nepal, 2020.
- Pagani, M.; Garcia-Pelaez, J.; Gee, R.; Johnson, K.; Poggi, V.; Silva, V.; Simionato, M.; Styron, R.; Viganò, D.; Danciu, L.; et al. The 2018 Version of the Global Earthquake Model: Hazard Component. Earthq. Spectra 2020, 36, 226–251. [Google Scholar] [CrossRef]
- Nath, S.K.; Thingbaijam, K.K.S. Probabilistic Seismic Hazard Assessment of India. Seismol. Res. Lett. 2012, 83, 135–149. [Google Scholar] [CrossRef]
- Hoste-Colomer, R.; Bollinger, L.; Lyon-Caen, H.; Adhikari, L.B.; Baillard, C.; Benoit, A.; Bhattarai, M.; Gupta, R.M.; Jacques, E.; Kandel, T. Lateral Variations of the Midcrustal Seismicity in Western Nepal: Seismotectonic Implications. Earth Planet. Sci. Lett. 2018, 504, 115–125. [Google Scholar] [CrossRef]
- Parajuli, H.R.; Bhusal, B.; Paudel, S. Seismic Zonation of Nepal Using Probabilistic Seismic Hazard Analysis. Arab. J. Geosci. 2021, 14, 2090. [Google Scholar] [CrossRef]
- Cornell, C.A. Engineering Seismic Risk Analysis. Seism. Soc. 1968, 58, 1583–1606. [Google Scholar] [CrossRef]
- Martin, C.; Ameri, G.; Baumont, D.; Carbon, D.; Senfaute, G.; Thiry, J.-M.; Faccioli, E.; Savy, J. Probabilistic Seismic Hazard Assessment for South-Eastern France. Bull. Earthq. Eng. 2018, 16, 2477–2511. [Google Scholar] [CrossRef]
- Zanetti, L.; Chiffi, D.; Petrini, L. Philosophical Aspects of Probabilistic Seismic Hazard Analysis (PSHA): A Critical Review. Nat. Hazards 2023, 117, 1193–1212. [Google Scholar] [CrossRef]
- Dal Zilio, L.; Hetényi, G.; Hubbard, J.; Bollinger, L. Building the Himalaya from Tectonic to Earthquake Scales. Nat. Rev. Earth Environ. 2021, 2, 251–268. [Google Scholar] [CrossRef]
- Klootwijk, C.T.; Conaghan, P.J.; Powell, C.M. The Himalayan Arc: Large-Scale Continental Subduction, Oroclinal Bending and Back-Arc Spreading. Earth Planet. Sci. Lett. 1985, 75, 167–183. [Google Scholar] [CrossRef]
- Liou, J.G.; Tsujimori, T.; Zhang, R.Y.; Katayama, I.; Maruyama, S. Global UHP Metamorphism and Continental Subduction/Collision: The Himalayan Model. Int. Geol. Rev. 2004, 46, 1–27. [Google Scholar] [CrossRef]
- O’Brien, P.J. Eclogites and Other High-Pressure Rocks in the Himalaya: A Review. Geol. Soc. Lond. Spec. Publ. 2019, 483, 183–213. [Google Scholar] [CrossRef]
- Soret, M.; Larson, K.P.; Cottle, J.; Ali, A. How Himalayan Collision Stems from Subduction. Geology 2021, 49, 894–898. [Google Scholar] [CrossRef]
- Zheng, T.; He, Y.; Ding, L.; Jiang, M.; Ai, Y.; Mon, C.T.; Hou, G.; Sein, K.; Thant, M. Direct Structural Evidence of Indian Continental Subduction beneath Myanmar. Nat. Commun. 2020, 11, 1944. [Google Scholar] [CrossRef] [PubMed]
- DeCelles, P.G.; Gehrels, G.E.; Quade, J.; Ojha, T.P.; Kapp, P.A.; Upreti, B.N. Neogene Foreland Basin Deposits, Erosional Unroofing, and the Kinematic History of the Himalayan Fold-Thrust Belt, Western Nepal. Geol. Soc. Am. Bull. 1998, 110, 2–21. [Google Scholar] [CrossRef]
- Harvey, J.E.; Burbank, D.W.; Bookhagen, B. Along-Strike Changes in Himalayan Thrust Geometry: Topographic and Tectonic Discontinuities in Western Nepal. Lithosphere 2015, 7, 511–518. [Google Scholar] [CrossRef]
- Lindsey, E.O.; Almeida, R.; Mallick, R.; Hubbard, J.; Bradley, K.; Tsang, L.L.H.; Liu, Y.; Burgmann, R.; Hill, E.M. Structural Control on Downdip Locking Extent of the Himalayan Megathrust. J. Geophys. Res. Solid Earth 2018, 123, 5265–5278. [Google Scholar] [CrossRef]
- Wang, M.; Shen, Z.-K. Present-Day Crustal Deformation of Continental China Derived from GPS and Its Tectonic Implications. J. Geophys. Res. Solid Earth 2020, 125, e2019JB018774. [Google Scholar] [CrossRef]
- Stevens, V.L.; Avouac, J.P. Interseismic Coupling on the Main Himalayan Thrust. Geophys. Res. Lett. 2015, 42, 5828–5837. [Google Scholar] [CrossRef]
- Li, S.; Wang, Q.; Yang, S.; Qiao, X.; Nie, Z.; Zou, R.; Ding, K.; He, P.; Chen, G. Geodetic Imaging Mega-Thrust Coupling beneath the Himalaya. Tectonophysics 2018, 747–748, 225–238. [Google Scholar] [CrossRef]
- Avouac, J.-P. Mountain Building, Erosion, and the Seismic Cycle in the Nepal Himalaya. Adv. Geophys. 2003, 46, 1–80. [Google Scholar]
- Lavé, J.; Yule, D.; Sapkota, S.; Basant, K.; Madden, C.; Attal, M.; Pandey, R. Evidence for a Great Medieval Earthquake (∼1100 AD) in the Central Himalayas, Nepal. Science 2005, 307, 1302–1305. [Google Scholar] [CrossRef]
- Sapkota, S.N.; Bollinger, L.; Klinger, Y.; Tapponnier, P.; Gaudemer, Y.; Tiwari, D. Primary Surface Ruptures of the Great Himalayan Earthquakes in 1934 and 1255. Nat. Geosci. 2013, 6, 71–76. [Google Scholar] [CrossRef]
- Bilham, R.; Mencin, D.; Bendick, R.; Bürgmann, R. Implications for Elastic Energy Storage in the Himalaya from the Gorkha 2015 Earthquake and Other Incomplete Ruptures of the Main Himalayan Thrust. Quat. Int. 2017, 462, 3–21. [Google Scholar]
- Dal Zilio, L.; Jolivet, R.; van Dinther, Y. Segmentation of the Main Himalayan Thrust Illuminated by Bayesian Inference of Interseismic Coupling. Geophys. Res. Lett. 2020, 47, e2019GL086424. [Google Scholar]
- Michel, S.; Jolivet, R.; Rollins, C.; Jara, J.; Dal Zilio, L. Seismogenic Potential of the Main Himalayan Thrust Constrained by Coupling Segmentation and Earthquake Scaling. Geophys. Res. Lett. 2021, 48, e2021GL093106. [Google Scholar]
- Bollinger, L.; Tapponnier, P.; Sapkota, S.N.; Klinger, Y. Slip Deficit in Central Nepal: Omen for a Repeat of the 1344 AD Earthquake? Earth Planets Space 2016, 68, 12. [Google Scholar] [CrossRef]
- Gansser, A. The Geodynamic History of the Himalaya. Zagros Hindu Kush Himalaya Geodyn. Evol. 1981, 3, 111–121. [Google Scholar]
- Robinson, D.M.; DeCelles, P.G.; Garzione, C.N.; Pearson, O.N.; Harrison, T.M.; Catlos, E.J. Kinematic Model for the Main Central Thrust in Nepal. Geology 2003, 31, 359–362. [Google Scholar] [CrossRef]
- Nakata, T. Active Faults of the Himalaya of India and Nepal. Geol. Soc. Am. Spec. Pap. 1989, 232, 243–264. [Google Scholar]
- Searle, M.P.; Law, R.D.; Godin, L.; Larson, K.P.; Streule, M.J.; Cottle, J.M.; Jessup, M.J. Defining the Himalayan Main Central Thrust in Nepal. J. Geol. Soc. 2008, 165, 523–534. [Google Scholar]
- Hodges, K.V.; Hurtado, J.M.; Whipple, K.X. Southward Extrusion of Tibetan Crust and Its Effect on Himalayan Tectonics. Tectonics 2001, 20, 799–809. [Google Scholar] [CrossRef]
- Murphy, M.A.; Taylor, M.H.; Gosse, J.; Silver, C.R.P.; Whipp, D.M.; Beaumont, C. Limit of Strain Partitioning in the Himalaya Marked by Large Earthquakes in Western Nepal. Nat. Geosci. 2014, 7, 38–42. [Google Scholar] [CrossRef]
- Pettenati, F.; Sirovich, L.; Bjerrum, L.W. Fault Sources and Kinematics of the 1897 Mw 8.1 Assam and the 1934 Ms 8.2 Nepal Earthquakes Retrieved by KF-NGA Inversion and Their Seismotectonic Implications. Bull. Seismol. Soc. Am. 2017, 107, 2480–2489. [Google Scholar] [CrossRef]
- Kumar, S.; Wesnousky, S.G.; Rockwell, T.K.; Briggs, R.W.; Thakur, V.C.; Jayangondaperumal, R. Paleoseismic Evidence of Great Surface Rupture Earthquakes along the Indian Himalaya. J. Geophys. Res. Solid Earth 2006, 111, 3304–3323. [Google Scholar] [CrossRef]
- Bilham, R. Himalayan Earthquakes: A Review of Historical Seismicity and Early 21st Century Slip Potential. Geol. Soc. Lond. Spec. Publ. 2019, 483, 423–482. [Google Scholar] [CrossRef]
- Albini, M.; Musson, R.M.W.; Capera, A.A.G.; Locati, M.; Rovida, A.; Stucchi, M.; Vigano, D. Global Historical Earthquake Archive and Catalogue (1000–1903); GEM Technical Report 2013-01; GEM Foundation: Pavia, Italy, 2013. [Google Scholar]
- Di Giacomo, D.; Engdahl, E.R.; Storchak, D.A. The ISC-GEM Earthquake Catalogue (1904–2014): Status after the Extension Project. Earth Syst. Sci. Data 2018, 10, 1877–1899. [Google Scholar] [CrossRef]
- Storchak, D.A.; Di Giacomo, D.; Engdahl, E.R.; Harris, J.; Bondár, I.; Lee, W.H.K.; Bormann, P.; Villaseñor, A. The ISC-GEM Global Instrumental Earthquake Catalogue (1900–2009): Introduction. Phys. Earth Planet. Inter. 2015, 239, 48–63. [Google Scholar] [CrossRef]
- Engdahl, E.R.; van der Hilst, R.; Buland, R. Global Teleseismic Earthquake Relocation with Improved Travel Times and Procedures for Depth Determination. Bull. Seismol. Soc. Am. 1998, 88, 722–743. [Google Scholar] [CrossRef]
- Ekström, G.; Nettlesa, M.; Dziewońskib, A.M. The Global CMT Project 2004–2010: Centroid-Moment Tensors for 13,017 Earthquakes. Phys. Earth Planet. Inter. 2012, 200–201, 1–9. [Google Scholar] [CrossRef]
- ISC International Seismological Center. Available online: http://www.isc.ac.uk (accessed on 22 March 2023).
- National Earthquake Monitoring & Research Center. Available online: http://www.seismonepal.gov.np/ (accessed on 24 March 2023).
- USGS United States Geological Survey. Global Earthquake Catalogues Covering the Period 1979–2019. Available online: https://earthquake.usgs.gov/earthquakes/search/ (accessed on 22 March 2023).
- Official Website of National Center of Seismology. Available online: https://riseq.seismo.gov.in/riseq/earthquake (accessed on 22 March 2023).
- Storchak, D.A.; Di Giacomo, D.; Bondar, I.; Engdahl, E.R.; Harris, J.; Lee, W.H.K.; Villasenor, A.; Bormann, P. Public Release of the ISC-GEM Global Instrumental Earthquake Catalogue (1900–2009). Seismol. Res. Lett. 2013, 84, 810–815. [Google Scholar] [CrossRef]
- Scordilis, E.M. Empirical Global Relations Converting MS and Mb to Moment Magnitude. J. Seismol. 2006, 10, 225–236. [Google Scholar] [CrossRef]
- Castellaro, S.; Mulargia, F.; Kagan, Y.Y. Regression Problems for Magnitudes. Geophys. J. Int. 2006, 165, 913–930. [Google Scholar] [CrossRef]
- Fuller, W.A. Measurement Error Models, W.A. Fuller, John Wiley & Sons, New York, 1987. ISBN 0–471–86187–1. $44.95, Pp. Xxiii + 440. J. Appl. Econom. 1987, 3, 315–317. [Google Scholar] [CrossRef]
- Kumar, R.; Yadav, R.B.S.; Castellaro, S. Regional Earthquake Magnitude Conversion Relations for the Himalayan Seismic Belt. Seismol. Res. Lett. 2020, 91, 3195–3207. [Google Scholar] [CrossRef]
- Gasperini, P.; Lolli, B.; Castellaro, S. Comment on “Earthquake Magnitude Conversion Problem” by Ranjit Das, H.R. Wason, Gabriel Gonzalez, M.L. Sharma, Deepankar Choudhury, Conrad Lindholm, Narayan Roy, and Pablo Salazar. Bull. Seismol. Soc. Am. 2023, 113, 1366–1369. [Google Scholar] [CrossRef]
- Gardner, J.K.; Knopoff, L. Is the Sequence of Earthquakes in Southern California, with Aftershocks Removed, Poissonian? Bull. Seismol. Soc. Am. 1974, 64, 1363–1367. [Google Scholar] [CrossRef]
- Uhrhammer, R. Characteristics of Northern and Central California Seismicity. Earthq. Notes 1986, 57, 21. [Google Scholar]
- Hakimhashemi, A.H.; Grünthal, G. A Statistical Method for Estimating Catalog Completeness Applicable to Long-Term Nonstationary Seismicity Data. Bull. Seismol. Soc. Am. 2012, 102, 2530–2546. [Google Scholar] [CrossRef]
- Thapa, D.R. Seismicity of Nepal and the Surrounding Region. Bull. Dep. Geol. 2018, 20, 83–86. [Google Scholar] [CrossRef]
- Baillard, C.; Lyon-Caen, H.; Bollinger, L.; Rietbrock, A.; Letort, J.; Adhikari, L.B. Automatic Analysis of the Gorkha Earthquake Aftershock Sequence: Evidences of Structurally Segmented Seismicity. Geophys. J. Int. 2017, 209, 1111–1125. [Google Scholar] [CrossRef]
- Cattin, R.; Avouac, J.P. Modeling Mountain Building and the Seismic Cycle in the Himalaya of Nepal. J. Geophys. Res. Solid Earth 2000, 105, 13389–13407. [Google Scholar] [CrossRef]
- Duvall, M.J.; Waldron, J.W.; Godin, L.; Najman, Y. Active Strike-Slip Faults and an Outer Frontal Thrust in the Himalayan Foreland Basin. Proc. Natl. Acad. Sci. USA 2020, 117, 17615–17621. [Google Scholar] [CrossRef] [PubMed]
- Hubbard, J.; Almeida, R.; Foster, A.; Sapkota, S.N.; Bürgi, P.; Tapponnier, P. Structural Segmentation Controlled the 2015 Mw 7.8 Gorkha Earthquake Rupture in Nepal. Geology 2016, 44, 639–642. [Google Scholar] [CrossRef]
- Laporte, M.; Bollinger, L.; Lyon-Caen, H.; Hoste-Colomer, R.; Duverger, C.; Letort, J.; Riesner, M.; Koirala, B.P.; Bhattarai, M.; Kandel, T. Seismicity in Far Western Nepal Reveals Flats and Ramps along the Main Himalayan Thrust. Geophys. J. Int. 2021, 226, 1747–1763. [Google Scholar] [CrossRef]
- Sheehan, A.F.; de la Torre, T.; Monsalve, G.; Schulte-Pelkum, V.; Bilham, R.; Blume, F.; Bendick, R.; Wu, F.; Pandey, M.R.; Sapkota, S. Earthquakes and Crustal Structure of Himalaya from Himalayan Nepal-Tibet Seismic Experiment (HIMNT). J. Nepal Geol. Soc. 2008, 38, 1–8. [Google Scholar] [CrossRef]
- Stöcklin, J. Geology of Nepal and Its Regional Frame: Thirty-Third William Smith Lecture. J. Geol. Soc. 1980, 137, 1–34. [Google Scholar] [CrossRef]
- Berger, A.; Jouanne, F.; Hassani, R.; Mugnier, J.L. Modelling the Spatial Distribution of Present-Day Deformation in Nepal: How Cylindrical Is the Main Himalayan Thrust in Nepal? Geophys. J. Int. 2004, 156, 94–114. [Google Scholar] [CrossRef]
- Cotton, F.; Campillo, M.; Deschamps, A.; Rastogi, B.K. Rupture History and Seismotectonics of the 1991 Uttarkashi, Himalaya Earthquake. Tectonophysics 1996, 258, 35–51. [Google Scholar] [CrossRef]
- Stevens, V.L.; Avouac, J.-P. Determination of Mmax from Background Seismicity and Moment Conservation. Bull. Seismol. Soc. Am. 2017, 107, 2578–2596. [Google Scholar] [CrossRef]
- Stevens, V.L.; Avouac, J.-P. Millenary Mw > 9.0 Earthquakes Required by Geodetic Strain in the Himalaya. Geophys. Res. Lett. 2016, 43, 1118–1123. [Google Scholar] [CrossRef]
- Bai, L.; Klemperer, S.L.; Mori, J.; Karplus, M.S.; Ding, L.; Liu, H.; Li, G.; Song, B.; Dhakal, S. Lateral Variation of the Main Himalayan Thrust Controls the Rupture Length of the 2015 Gorkha Earthquake in Nepal. Sci. Adv. 2019, 5, eaav0723. [Google Scholar] [CrossRef]
- Hazarika, P.; Kumar, M.R.; Srijayanthi, G.; Raju, P.S.; Rao, N.P.; Srinagesh, D. Transverse Tectonics in the Sikkim Himalaya: Evidence from Seismicity and Focal-Mechanism Data. Bull. Seismol. Soc. Am. 2010, 100, 1816–1822. [Google Scholar] [CrossRef]
- Meade, B.J. The Signature of an Unbalanced Earthquake Cycle in Himalayan Topography? Geology 2010, 38, 987–990. [Google Scholar] [CrossRef]
- Mugnier, J.-L.; Gajurel, A.; Huyghe, P.; Jayangondaperumal, R.; Jouanne, F.; Upreti, B. Structural Interpretation of the Great Earthquakes of the Last Millennium in the Central Himalaya. Earth-Sci. Rev. 2013, 127, 30–47. [Google Scholar] [CrossRef]
- Gutenberg, B.; Richter, C.F. Magnitude and Energy of Earthquakes. Ann. Geophys. 1956, 9, 1–15. [Google Scholar]
- EPRI. Technical Report: Central and Eastern United States Seismic Source Characterization for Nuclear Facilities; U.S. Nuclear Regulatory Commission: Washington, DC, USA, 2012.
- Weichert, D.H. Estimation of the Earthquake Recurrence Parameters for Unequal Observation Periods for Different Magnitudes. Bull. Seismol. Soc. Am. 1980, 70, 1337–1346. [Google Scholar] [CrossRef]
- Johnston, A.C.; Coppersmith, K.J.; Kanter, L.R.; Cornell, C.A. The Earthquakes of Stable Continental Regions: Assessment of Large Earthquake Potential; EPRI: Palo Alto, CA, USA, 1994; Volume 1. [Google Scholar]
- Bilham, R.; Larson, K.; Freymueller, J. GPS Measurements of Present-Day Convergence across the Nepal Himalaya. Nature 1997, 386, 61–64. [Google Scholar] [CrossRef]
- Jouanne, F.; Mugnier, J.L.; Sapkota, S.N.; Bascou, P.; Pecher, A. Estimation of Coupling along the Main Himalayan Thrust in the Central Himalaya. J. Asian Earth Sci. 2017, 133, 62–71. [Google Scholar] [CrossRef]
- Jouanne, F.; Mugnier, J.L.; Pandey, M.R.; Gamond, J.F.; Le Fort, P.; Serrurier, L.; Vigny, C.; Avouac, J.P. Oblique Convergence in the Himalayas of Western Nepal Deduced from Preliminary Results of GPS Measurements. Geophys. Res. Lett. 1999, 26, 1933–1936. [Google Scholar] [CrossRef]
- Bollinger, L.; Avouac, J.P.; Beyssac, O.; Catlos, E.J.; Harrison, T.M.; Grove, M.; Goffé, B.; Sapkota, S. Thermal Structure and Exhumation History of the Lesser Himalaya in Central Nepal: Thermal Structure of the Lesser Himalaya. Tectonics 2004, 23. [Google Scholar] [CrossRef]
- Mishra, R.L.; Singh, I.; Pandey, A.; Rao, P.S.; Sahoo, H.K.; Jayangondaperumal, R. Paleoseismic Evidence of a Giant Medieval Earthquake in the Eastern Himalaya. Geophys. Res. Lett. 2016, 43, 5707–5715. [Google Scholar] [CrossRef]
- Youngs, R.R.; Coppersmith, K.J. Implications of Fault Slip Rates and Earthquake Recurrence Models to Probabilistic Seismic Hazard Estimates. Bull. Seismol. Soc. Am. 1985, 75, 939–964. [Google Scholar] [CrossRef]
- Woo, G. Kernel Estimation Methods for Seismic Hazard Area Source Modeling. Bull. Seismol. Soc. Am. 1996, 86, 353–362. [Google Scholar] [CrossRef]
- Helmstetter, A.; Kagan, Y.Y.; Jackson, D.D. High-Resolution Time-Independent Grid-Based Forecast for M ≥ 5 Earthquakes in California. Seismol. Res. Lett. 2007, 78, 78–86. [Google Scholar] [CrossRef]
- Douglas, J. Ground Motion Predication Equations 1964–2021; Department of Civil and Environmental Engineering, University of Strathclyde: Glasgow, UK, 2022. [Google Scholar]
- Singh, S.K.; Srinagesh, D.; Srinivas, D.; Arroyo, D.; Pérez-Campos, X.; Chadha, R.K.; Suresh, G.; Suresh, G. Strong Ground Motion in the Indo-Gangetic Plains during the 2015 Gorkha, Nepal, Earthquake Sequence and Its Prediction during Future Earthquakes. Bull. Seismol. Soc. Am. 2017, 107, 1293–1306. [Google Scholar] [CrossRef]
- Basu, J.; Podili, B.; Raghukanth, S.T.G.; Srinagesh, D. Ground Motion Parameters for the 2015 Nepal Earthquake and Its Aftershocks. Nat. Hazards 2023, 116, 2091–2134. [Google Scholar] [CrossRef]
- Bajaj, K.; Anbazhagan, P. Determination of GMPE Functional Form for an Active Region with Limited Strong Motion Data: Application to the Himalayan Region. J. Seismol. 2018, 22, 161–185. [Google Scholar] [CrossRef]
- Cotton, F.; Scherbaum, F.; Bommer, J.J.; Bungum, H. Criteria for Selecting and Adjusting Ground-Motion Models for Specific Target Regions. J. Seismol. 2006, 10, 137–156. [Google Scholar] [CrossRef]
- Bommer, J.J.; Douglas, J.; Scherbaum, F.; Cotton, F.; Bungum, H.; Fäh, D. On the Selection of Ground-Motion Prediction Equations for Seismic Hazard Analysis. Seismol. Res. Lett. 2010, 81, 783–793. [Google Scholar] [CrossRef]
- Asimaki, D.; Mohammadi, K.; Mason, H.B.; Adams, R.K.; Rajaure, S.; Khadka, D. Observations and Simulations of Basin Effects in the Kathmandu Valley during the 2015 Gorkha, Nepal, Earthquake Sequence. Earthq. Spectra 2017, 33, 35–53. [Google Scholar] [CrossRef]
- Atkinson, G.M. Empirical Ground-Motion Relations for Subduction-Zone Earthquakes and Their Application to Cascadia and Other Regions. Bull. Seismol. Soc. Am. 2003, 93, 1703–1729. [Google Scholar] [CrossRef]
- Abrahamson, N.A.; Silva, W.J.; Kamai, R. Summary of the ASK14 Ground Motion Relation for Active Crustal Regions. Earthq. Spectra 2014, 30, 1025–1055. [Google Scholar] [CrossRef]
- Boore, D.; Stewart, J.; Seyhan, E.; Atkinson, G.M. NGA-West2 Equations for Predicting PGA, PGV, and 5% Damped PSA for Shallow Crustal Earthquakes. Earthq. Spectra 2014, 30, 1057–1085. [Google Scholar] [CrossRef]
- Campbell, K.W.; Bozorgnia, Y. NGA-West2 Ground Motion Model for the Average Horizontal Components of PGA, PGV, and 5%-Damped Linear Acceleration Response Spectra. Earthq. Spectra 2014, 30, 1087–1115. [Google Scholar] [CrossRef]
- Zhao, J.X.; Liang, X.; Jiang, F.; Xing, H.; Zhu, M.; Hou, R.; Zhang, Y.; Lan, X.; Rhoades, D.A.; Irikura, K.; et al. Ground-Motion Prediction Equations for Subduction Interface Earthquakes in Japan Using Site Class and Simple Geometric Attenuation Functions. Bull. Seismol. Soc. Am. 2016, 106, 1518–1534. [Google Scholar] [CrossRef]
- Chiou, B.; Youngs, R.R. Update of the Chiou and Youngs NGA Model for the Average Horizontal Component of Peak Ground Motion and Response Spectra. Earthq. Spectra 2014, 30, 1117–1153. [Google Scholar] [CrossRef]
- Zhao, J.X.; Zhou, S.; Zhou, J.; Zhao, C.; Zhang, H.; Zhang, Y.; Gao, P.; Lan, X.; Rhoades, D.; Fukushima, Y.; et al. Ground-Motion Prediction Equations for Shallow Crustal and Upper-Mantle Earthquakes in Japan Using Site Class and Simple Geometric Attenuation. Bull. Seismol. Soc. Am. 2016, 106, 1552–1569. [Google Scholar] [CrossRef]
- Abrahamson, N.; Gregor, N.; Addo, K. BC Hydro Ground Motion Prediction Equations for Subduction Earthquakes. Earthq. Spectra 2016, 32, 23–44. [Google Scholar] [CrossRef]
- Bommer, J.J.; Abrahamson, N.A. Why Do Modern Probabilistic Seismic-Hazard Analyses Often Lead to Increased Hazard Estimates? Bull. Seismol. Soc. Am. 2006, 96, 1967–1977. [Google Scholar] [CrossRef]
- Sabetta, F.; Lucantoni, A.; Bungum, H.; Bommer, J.J. Sensitivity of PSHA Results to Ground Motion Prediction Relations and Logic-Tree Weights. Soil Dyn. Earthq. Eng. 2005, 25, 317–329. [Google Scholar] [CrossRef]
- Douglas, J.; Ulrich, T.; Bertil, D.; Rey, J. Comparison of the Ranges of Uncertainty Captured in Different Seismic-Hazard Studies. Seismol. Res. Lett. 2014, 85, 977–985. [Google Scholar] [CrossRef]
- Thomas, P.; Wong, I.; Abrahamson, N. Verification of Probabilistic Seismic Hazard Analysis Computer Programs; Pacific Earthquake Engineering Research Center, University of California: Berkeley, CA, USA, 2010. [Google Scholar]
- Hale, C.; Abrahamson, N.; Bozorgnia, Y. Probabilistic Seismic Hazard Analysis Code Verification; Pacific Earthquake Engineering Research Center Headquarters at the University of California: Berkeley, CA, USA, 2018. [Google Scholar]
Disclaimer/Publisher’s Note: The statements, opinions and data contained in all publications are solely those of the individual author(s) and contributor(s) and not of MDPI and/or the editor(s). MDPI and/or the editor(s) disclaim responsibility for any injury to people or property resulting from any ideas, methods, instructions or products referred to in the content. |
© 2023 by the authors. Licensee MDPI, Basel, Switzerland. This article is an open access article distributed under the terms and conditions of the Creative Commons Attribution (CC BY) license (https://creativecommons.org/licenses/by/4.0/).

