Article

Determination of Dynamic Properties of Fine-Grained Soils at High Cyclic Strains

by
Syed Samran Ali Shah
1,2,*,
Abdul Rahim Asif
2,
Waqas Ahmed
2,
Ihtisham Islam
2,3,
Muhammad Waseem
4,
Hammad Tariq Janjuhah
3,* and
George Kontakiotis
5
1
School of Computing and Engineering, University of West London, London W5 5RF, UK
2
National Centre of Excellence in Geology, University of Peshawar, Peshawar 25120, Pakistan
3
Department of Geology, Shaheed Benazir Bhutto University, Sheringal, Upper Dir 18050, Pakistan
4
Department of Civil Engineering, University of Engineering and Technology, Peshawar 25000, Pakistan
5
Department of Historical Geology-Paleontology, Faculty of Geology and Geoenvironment, School of Earth Sciences, National and Kapodistrian University of Athens, Panepistimiopolis, Zografou, 15784 Athens, Greece
*
Authors to whom correspondence should be addressed.
Geosciences 2023, 13(7), 204; https://doi.org/10.3390/geosciences13070204
Submission received: 8 June 2023 / Revised: 29 June 2023 / Accepted: 29 June 2023 / Published: 4 July 2023

Abstract

:
Shear modulus (SM) and damping ratio (DR) are significant in seismic design and the performance of geotechnical systems. The evaluation of soil reactions to dynamic loads, such as earthquakes, blasts, train, and traffic vibrations, necessitates the estimation of dynamic SM and DR. The aim of this research is to determine the cyclic parameters of unsaturated soils in and around Peshawar, and how these properties depend upon the varied confining pressures and shear strains. Undisturbed samples were collected using Shelby tubes from five boreholes at different locations along Jamrud Road, Peshawar. The index properties (grain size distribution, plasticity index, and specific gravity) and dynamic properties of these samples were determined. Three samples of 100 mm in height and 50 mm in diameter were obtained from each Shelby tube. After preparing and mounting the sample in the triaxial cell, the sample is first saturated by increasing the cell and back pressures in increments of 50 kPa until the value of Skempton’s pore pressure parameter (B) reaches ≥ 0.96. Samples were consolidated at confining pressures of 150, 200, and 300 kPa, then subjected to cyclic shear strains of 0.2, 1, 2, 2.5, and 5%. Shear stress–strain hysteresis loops were plotted, and the values of SM and DR were calculated for each cycle. Generally, at shear strains of 0.2 and 1%, the slope of the loops is steep, and gradually becomes gentler at higher strains of 2, 2.5, and 5%. It is found that, with an increasing number of cycles, the SM and DR decrease. The SM decreases with increasing shear strain, whereas the DR increases at shear strains of 0.2–1%, then decreases for strains of 2, 2.5, and 5%. The confining pressure has more influence at a shear strain of 0.2–1%, while little effect has been observed at a shear strain of 2.2–5%. The values of SM are higher at higher confining pressures at a given shear strain. The results show higher stress values during the initial cycles because of the greater effective stress that developed in response to shear strain while, with an increase in the number of cycles, the pore water pressure gradually increases, thereby reducing the effective stress and weakening the bonds between soil particles. In dynamics, when the confining pressure increases, particles are closer to contact, so the travel paths of waves increase. The energy loss will increase, so DR will decrease.

1. Introduction

Geotechnical engineers are concerned with the assessment and design of earthquake-resilient structures. The general concern about seismic site effects, which can amplify earthquake movements of soil deposits, has increased after several natural disasters caused loss of lives and economic damage. The case of the earthquake in Mexico City in 1985 exemplifies the consequences of site amplification [1]. After the succession of different amplification events, it is now recognized that human and material losses could be avoided by better understanding soil behavior under dynamic loading conditions. Therefore, the assessment of dynamic deformation characteristics of soil is critical for computing the seismic response in any region [2]. Dynamic shear modulus, damping, and soil density are the main variables that control the seismic response of a soil layer [3]. Indeed, seismic site response analysis uses dynamic shear modulus and damping as input parameters to assess soil stresses and strains, as well as the displacements and accelerations when a soil deposit undergoes dynamic effects caused by an earthquake [4]. The dynamic response of soil during an earthquake has increased the demand for calculating the dynamic properties, both at large and small shear strains [5].
The soil characterization of a region holds importance in the application of ground response analysis (GRA). In the absence of the dynamic response of the regional soils, it is common practice to use the standard dynamic models for GRA [3,6,7]. However, Kumar et al. [8] showed that cohesionless and fine-grained soils of an area can exhibit substantially different dynamic behaviors as compared to the standard models for similar soils. The shear modulus, SM (representing the soil stiffness), and damping ratio, DR (percentage of energy loss per cycle of vibration) are largely affected by the shear strain, confining stresses, and the number of cycles [8]. The soil behaves as an elastic material at low shear strain (around 10−6) and plastic at large shear strain (≥0.01%), and generally demonstrates low SM and high DR with an increase in shear strain [9].
Many field, laboratory tests and numerical models have been developed to measure soil shear modulus for a particular strain level [2,10,11,12,13,14]. The cyclic triaxial test (CT) is a common laboratory procedure to measure the dynamic properties of the material at different strain levels. The cyclic triaxial test measures the dynamic young modulus and damping at high strain levels by applying a vertical cyclic load on a cylindrical sample. Usually, to measure the complete relationship between dynamic shear modulus, damping, and strain, it is necessary to determine the dynamic properties using a cyclic triaxial test [15]. The cyclic triaxial test offers numerous advantages in the assessment of soil behavior under dynamic loading conditions. It provides a realistic simulation of complex loading scenarios, enabling a more accurate representation of soil responses to earthquakes, vibrations, and other dynamic forces. The test directly measures the shear modulus, a crucial parameter for understanding soil stiffness and its response to cyclic loading. Additionally, it allows the estimation of the damping ratio, which quantifies energy dissipation in soils. The test’s versatility makes it applicable to various soil types, facilitating comprehensive soil characterization. Many researchers around the world have determined the SM and DR by performing undrained CT tests on various soils. Undrained and partially drained CT tests on normally consolidated Champlain clay in Rigaud, Quebec, Canada, and found that the clay would undergo wide settlement and serious damage to bearing capacity, or perhaps fail when loaded under cyclic conditions [8,16,17,18,19,20,21]. While aggregate content and shear strain have a greater influence on DR, it is less affected by the number of cycles. Mohtar et al. [10] carried out a cyclic triaxial test to measure strain-dependent SM, in which they found that SM has low values at higher shear strain. Similar results were also obtained by Thirugnanasampanther [22] who performed small and large strains to investigate the SM and DR of clays and Fraser River sand. Test results show that the shear strength of clays is influenced by consolidation stress, over-consolidation ratio, and clay content.
Kumar et al. [8] performed strain-controlled CT tests on sands for a strain range of 0.015%–4.5%, at a loading frequency of 1 Hz. The specimens were prepared at relative densities of 30–90% and confining pressures of 50–150 kPa. They found that the SM was lower with increasing shear strain, while the values of DR reached a peak value at a strain of 0.5%, 1%, and the values of DR decreased at a higher strain level. This is typically different from that observed in the DR from previous studies [3,23,24,25]. For most studies, tests were conducted up to a strain of 1%. Few researchers measured the DR above 1% strain [26,27].
Considering the need to recognize the cyclic behavior of unsaturated soils, and to provide more comprehensive experimental data in this field, the aim of this research is to determine the cyclic parameters of unsaturated soils (shear modulus and damping ratio). Therefore, further comprehensive studies are needed to fully clarify the effects of the cyclic triaxial test in identifying the dynamic properties of the regional silty clayey soil in and around Peshawar city. Only limited literature is available about the dynamic characterization of soils in this region (Peshawar). This research provides documentation of the dynamic response of the fine-grained soil available in the region, something which has not been investigated before.

2. Study Area

Peshawar is the capital city of the Khyber Pakhtunkhwa province of Pakistan and has an important background in the history of the Indian subcontinent. It is located at 710◦43.40 N, 330◦93.70 E, in the western Himalayan region. Peshawar is characterized by high seismicity rates due to its proximity to the active plate boundary between the Indian and Eurasian plates, which are converging at a rate of 37–42 mm yr−1 (Chen et al., 2000). The faults influencing the region of Peshawar are the Main Mantle Thrust (MMT), Hazara-Kashmir Syntax, Punjal fault, and faults with reverse faulting mechanisms in the Kohat ranges. Most of the earthquakes that affect Peshawar have their origin in the Hindu Kush region of Afghanistan or the northern areas of Pakistan [28,29,30]. The Hazara-Kashmir syntax is connected to the Punjal fault, Jhelum fault, and Main Boundary Thrust (MBT) [31,32,33]. It is a very active fault and contributes to most of the seismicity of Peshawar. The Muzaffarabad earthquake (2005) occurred on this fault, and it is one of the highest magnitude earthquakes ever recorded in this region [34]. The Punjal fault originates from the Hazara-Kashmir syntax and extends towards the Peshawar region in the westward direction. The Kohat region lies on the southern border of the Peshawar region and contains many faults with reverse faulting mechanisms. This fault does not have much high seismicity; however, its distance relative to Peshawar is very small, and it may affect the Peshawar region. All the above-mentioned faults contribute to the seismicity of the Peshawar region. Therefore, due to the high seismicity, the testing was performed at high cyclic strains. The estimation of dynamic properties (SM and DR) of soils from Jamrud Road, Peshawar has never been assessed before. The study presents the dynamic properties of the typically available cohesive soil from Jamrud Road, Peshawar, which can be useful for the proper assessment of GRA in this region.

3. Material and Methods

3.1. Soil Description

Undisturbed samples were collected using Shelby tubes from five boreholes at different locations along Jamrud Road, Peshawar. The index properties (grain size distribution, plasticity index, and specific gravity) and dynamic properties (SM and DR) of these samples were determined. The moisture content of the samples obtained from the five different locations ranged from 11.6 to 15.9%, and the PI values from 4.4 to 6.97. This shows that the soil has low plasticity as, according to the ASTM standard D-4318, soils having a PI below 7 are regarded as low plastic. Similarly, the specific gravity values range from 2.68 to 2.72.
Based on the grain size distribution and plasticity index, the soil samples were classified according to the Unified Soil Classification System (USCS), based on ASTM D 2487. The passing percentage from the No. 200 sieve was more than 50% for all five samples; therefore, the soils are classified as fine-grained. The group symbol for all soil was CL-ML, and the soil type was sandy silty clay. The overall results of index properties and soil classifications are given in Table 1.
The results of the sieve and hydrometer analysis are shown in Figure 1 as a curve that shows how the sizes of the grains vary.

3.2. Testing Apparatus

The cyclic triaxial apparatus involves a laboratory testing method to determine the SM and DR in strain-controlled conditions. The DYNATRIAX Cyclic Triaxial apparatus (Control group n.d) has full automation that controls all the test parameters to perform a cyclic triaxial (CT) test (Figure 2). This consists of a 100 kN Tritech compression frame, an air receiver, a pneumatic actuator having a maximum displacement of 50 mm, a compact dynamic controller unit (CDC), solenoid (on/off) valves, and a computer, as shown in Figure 3. The system is controlled by the CDC, to which all the components are connected. The DYNATRIAX software is connected to the CDC via a high-speed communications and control network. Commands sent from the software are used by the CDC unit to manage the movement of the actuator and triaxial frame, the adjustment of pressures to the triaxial cell, the opening and closing of the pressure lines, and the flow direction of the volume change device.

3.3. Testing Procedure

The soil samples were extracted by the cutting of Shelby tubes (ASTM-D3999 (2012)) in suitable sections to remove the samples with minimal disturbance. Samples were obtained by inserting a sampler with a diameter of 50 mm and a height of 100 mm to obtain the required sample. The way the specimen is mounted within the cyclic triaxial cell significantly impacts the test outcomes. The correct alignment and preparation of the specimen play a crucial role in ensuring accurate and representative measurements. The mounting procedure directly affects factors such as stress distribution, boundary conditions, and the specimen’s response to cyclic loading. Any errors or inadequacies during specimen installation can introduce stress concentrations, boundary effects, and non-uniform stress distribution, potentially distorting the measured response. Thus, careful attention must be given to aligning the specimen, achieving proper saturation, and applying suitable confining pressure, to minimize such effects and obtain reliable and representative results in cyclic triaxial testing.
After carefully preparing and mounting the sample in the triaxial cell, the sample is first saturated by increasing the cell and back pressures in increments of 50 kPa until the value of Skempton’s pore pressure parameter (B) reaches ≥ 0.96. The B-value is given as
  B   p a r a m e t e r = Δ u Δ σ c
where,
Δu = change in Pore Water Pressure
Δσc = change in Cell Pressure
After the completion of saturation, to consolidate the specimen, a uniform applied back pressure (BP) was maintained and the cell pressure (CP) was increased until the difference between the CP and the BP was equal to the desired consolidation pressure. The sample was isotropically consolidated at the three different confining pressures of 150, 200, and 300 kPa. Once the sample was consolidated, it was then subjected to an undrained cyclic shear stage. This stage was performed according to ASTM D-3999, and the sample was sheared cyclically at five different shear strains (0.2, 1, 2, 2.5, and 5%) at a confining pressure of 150, 200, and 300 kPa (Table 2). The varied parameters were the confining pressure and shear strain to find out how these dynamic properties depend on these parameters. Each test was performed with 40 cycles of strain-controlled loadings at a loading frequency of 1 Hz.

4. Results and Discussion

4.1. Undrained Cyclic Shear

The consolidated specimens underwent strain-controlled CT examinations. Forty cycles of strain-controlled loading were performed on each test specimen. Figure 3a–d displays the response obtained at a shear strain of 1% and a cell pressure of 150 kPa. Figure 3b illustrates the exponential decrease in deviator stress with increasing cycle number, which is related to the deformation of the soil specimen. As shown in Figure 3c, the degradation of the soil’s damping ratio and shear stiffness with increased loading cycles (N) is represented by the fluctuation of deviator stress with axial strain (hysteresis loops). Figure 3d, which depicts the rise in excess pore water pressure (PWP) generation, shows that the excess PWP ratio gradually increased to 1 throughout the cyclic loading. As PWP increases in saturated soil under undrained cyclic loading, inter-granular forces decrease, lowering effective stress and soil stiffness [35]. Several cyclic tests were performed at different peak axial strain (ε) levels, and the results were the same for all samples. These tests were then used to measure the dynamic properties of the soils.
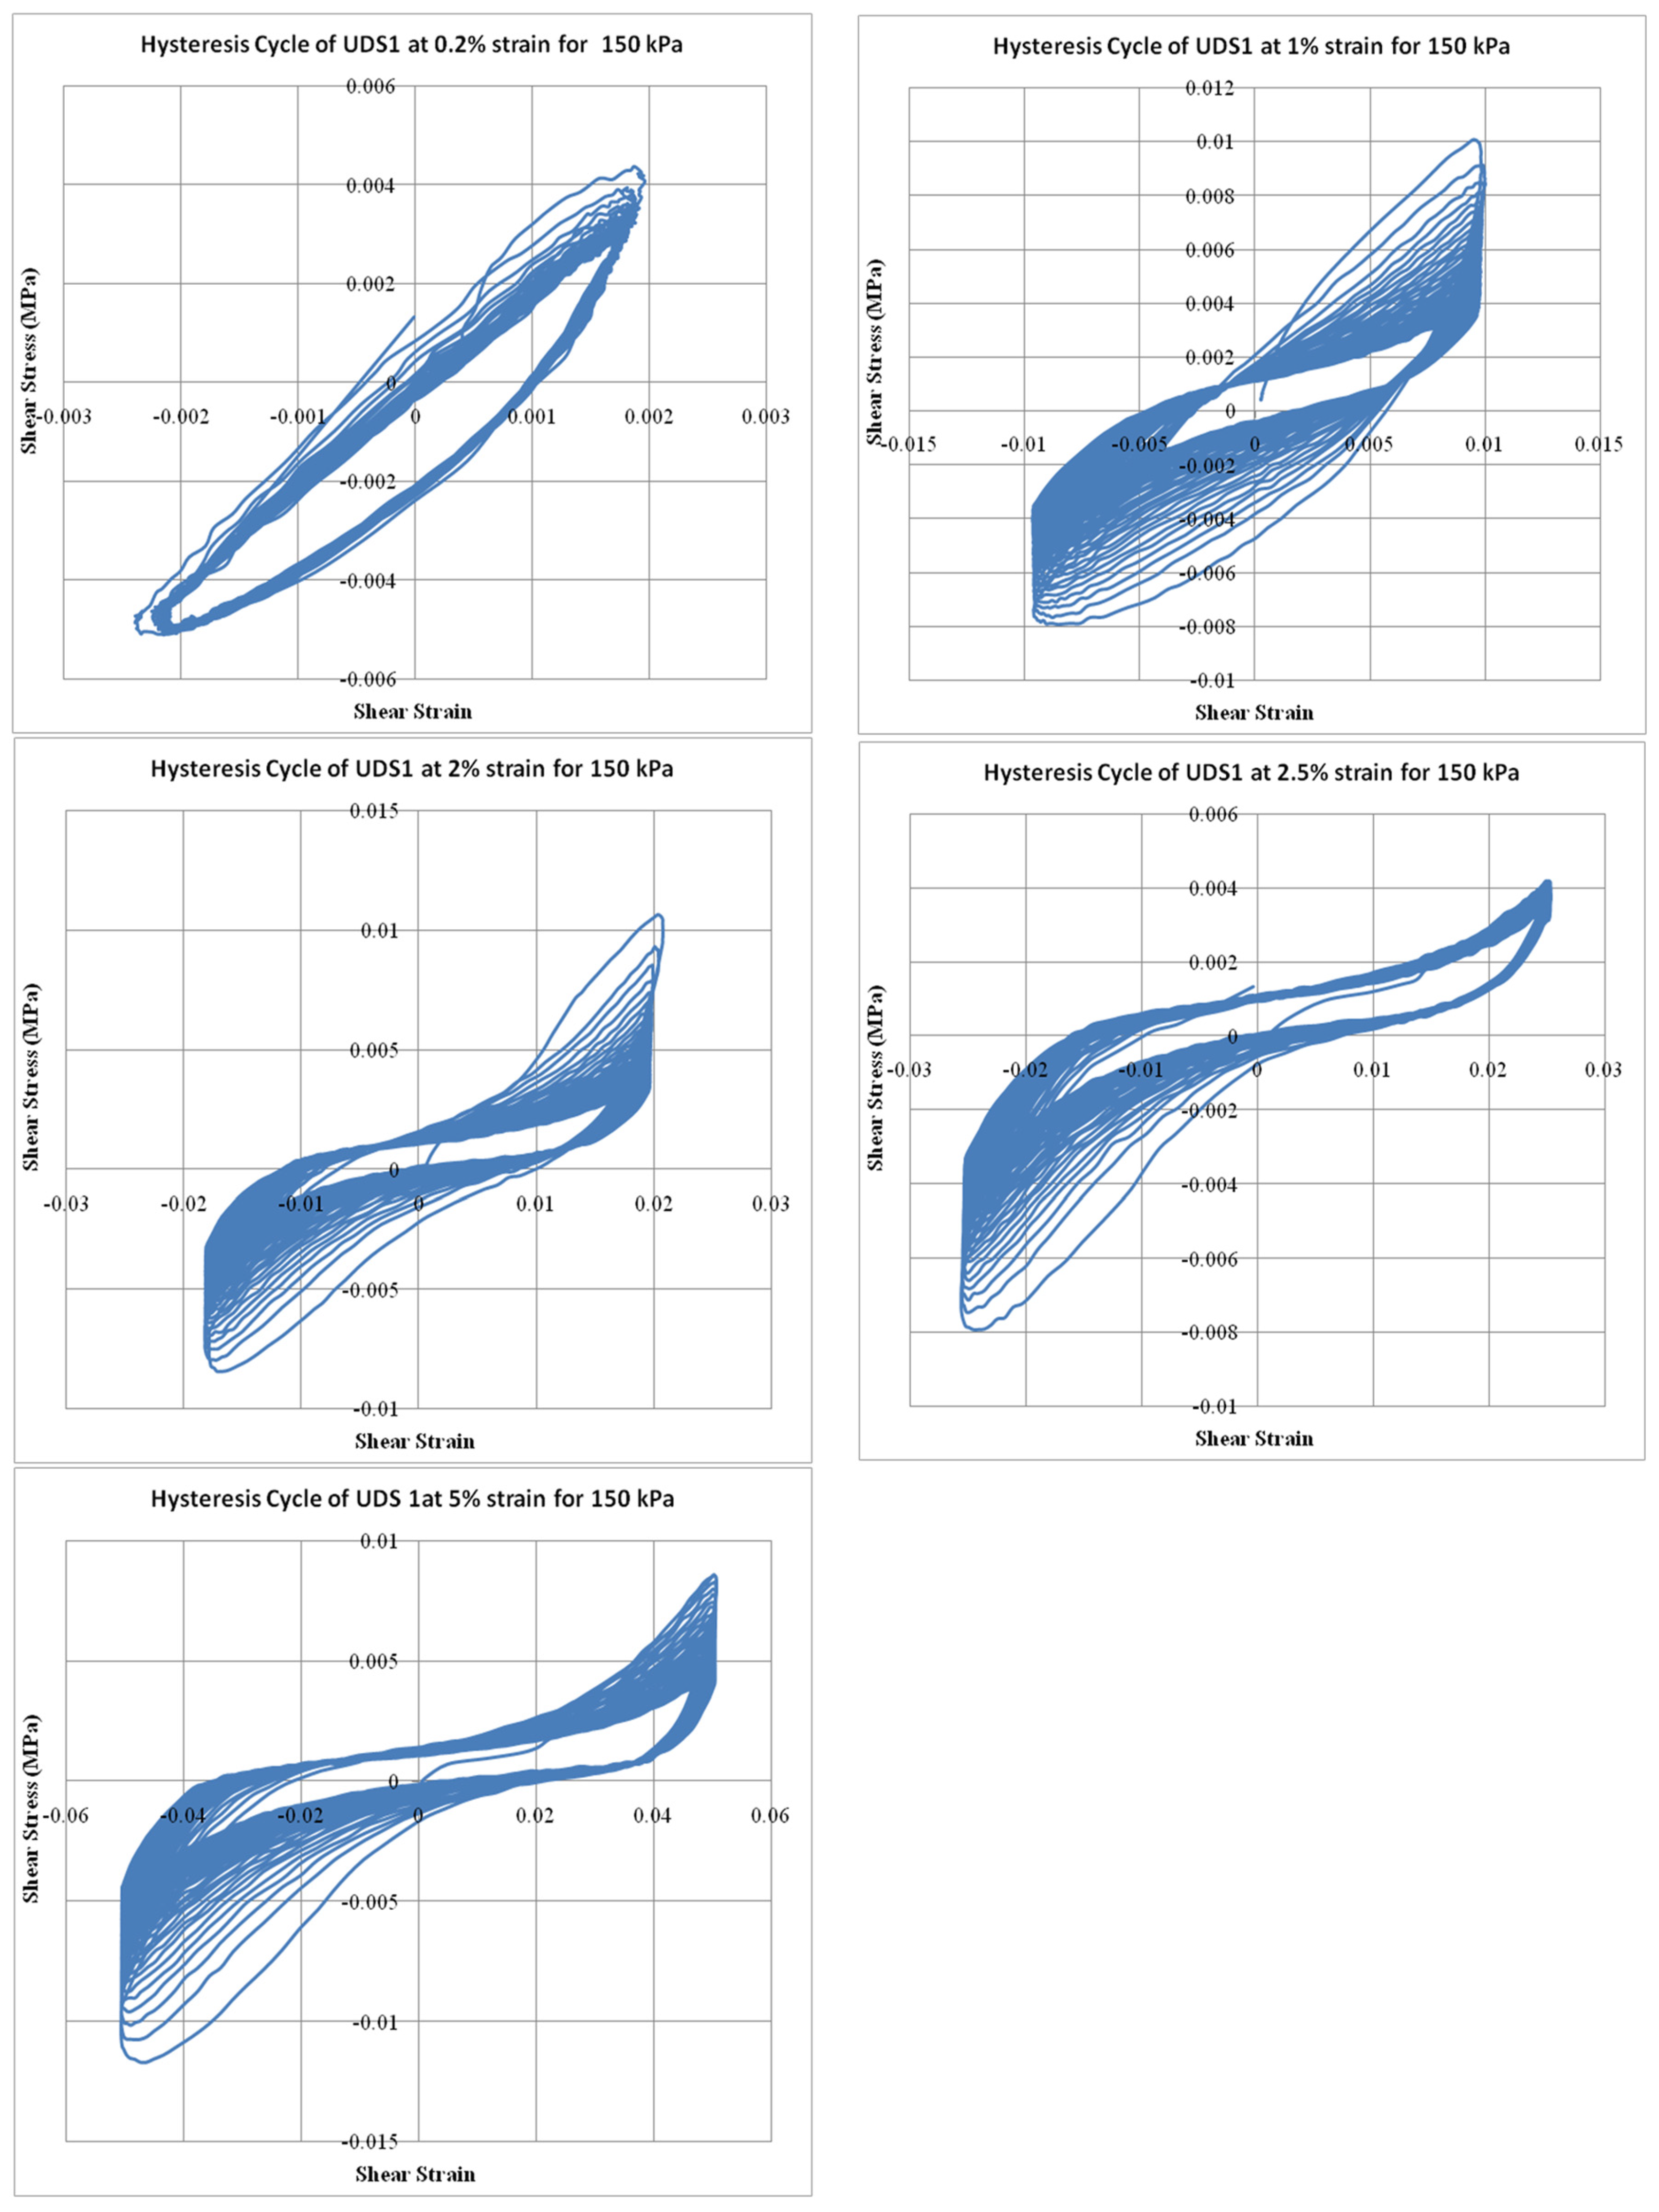
The graph of shear stress vs. shear strain is generally called the hysteresis loop. The shear stress vs. shear strain hysteresis loop was plotted, where the shear stress was calculated by load per unit area whereas the shear strain was calculated by a change in displacement per unit height of the sample. Figure 4 shows hysteresis loops of UDS 1 for 150 kPa at shear strains of 0.2, 1, 2, 2.5, and 5%, with the shear strain plotted on the horizontal axis and shear stress on the vertical axis. Generally, at shear strains of 0.2 and 1%, the slope of the loops is steep and gradually becomes gentle at higher strains of 2, 2.5, and 5%. The results show higher stress values during the initial cycles because of greater effective stress developed in response to shear strain while, with the increase in number of cycles, the pore water pressure gradually increases, thereby reducing the effective stress and weakening the bonds between soil particles. This trend is consistent for all the hysteresis loops of five samples at all confining pressures.

4.2. Shear Modulus and Damping Ratio

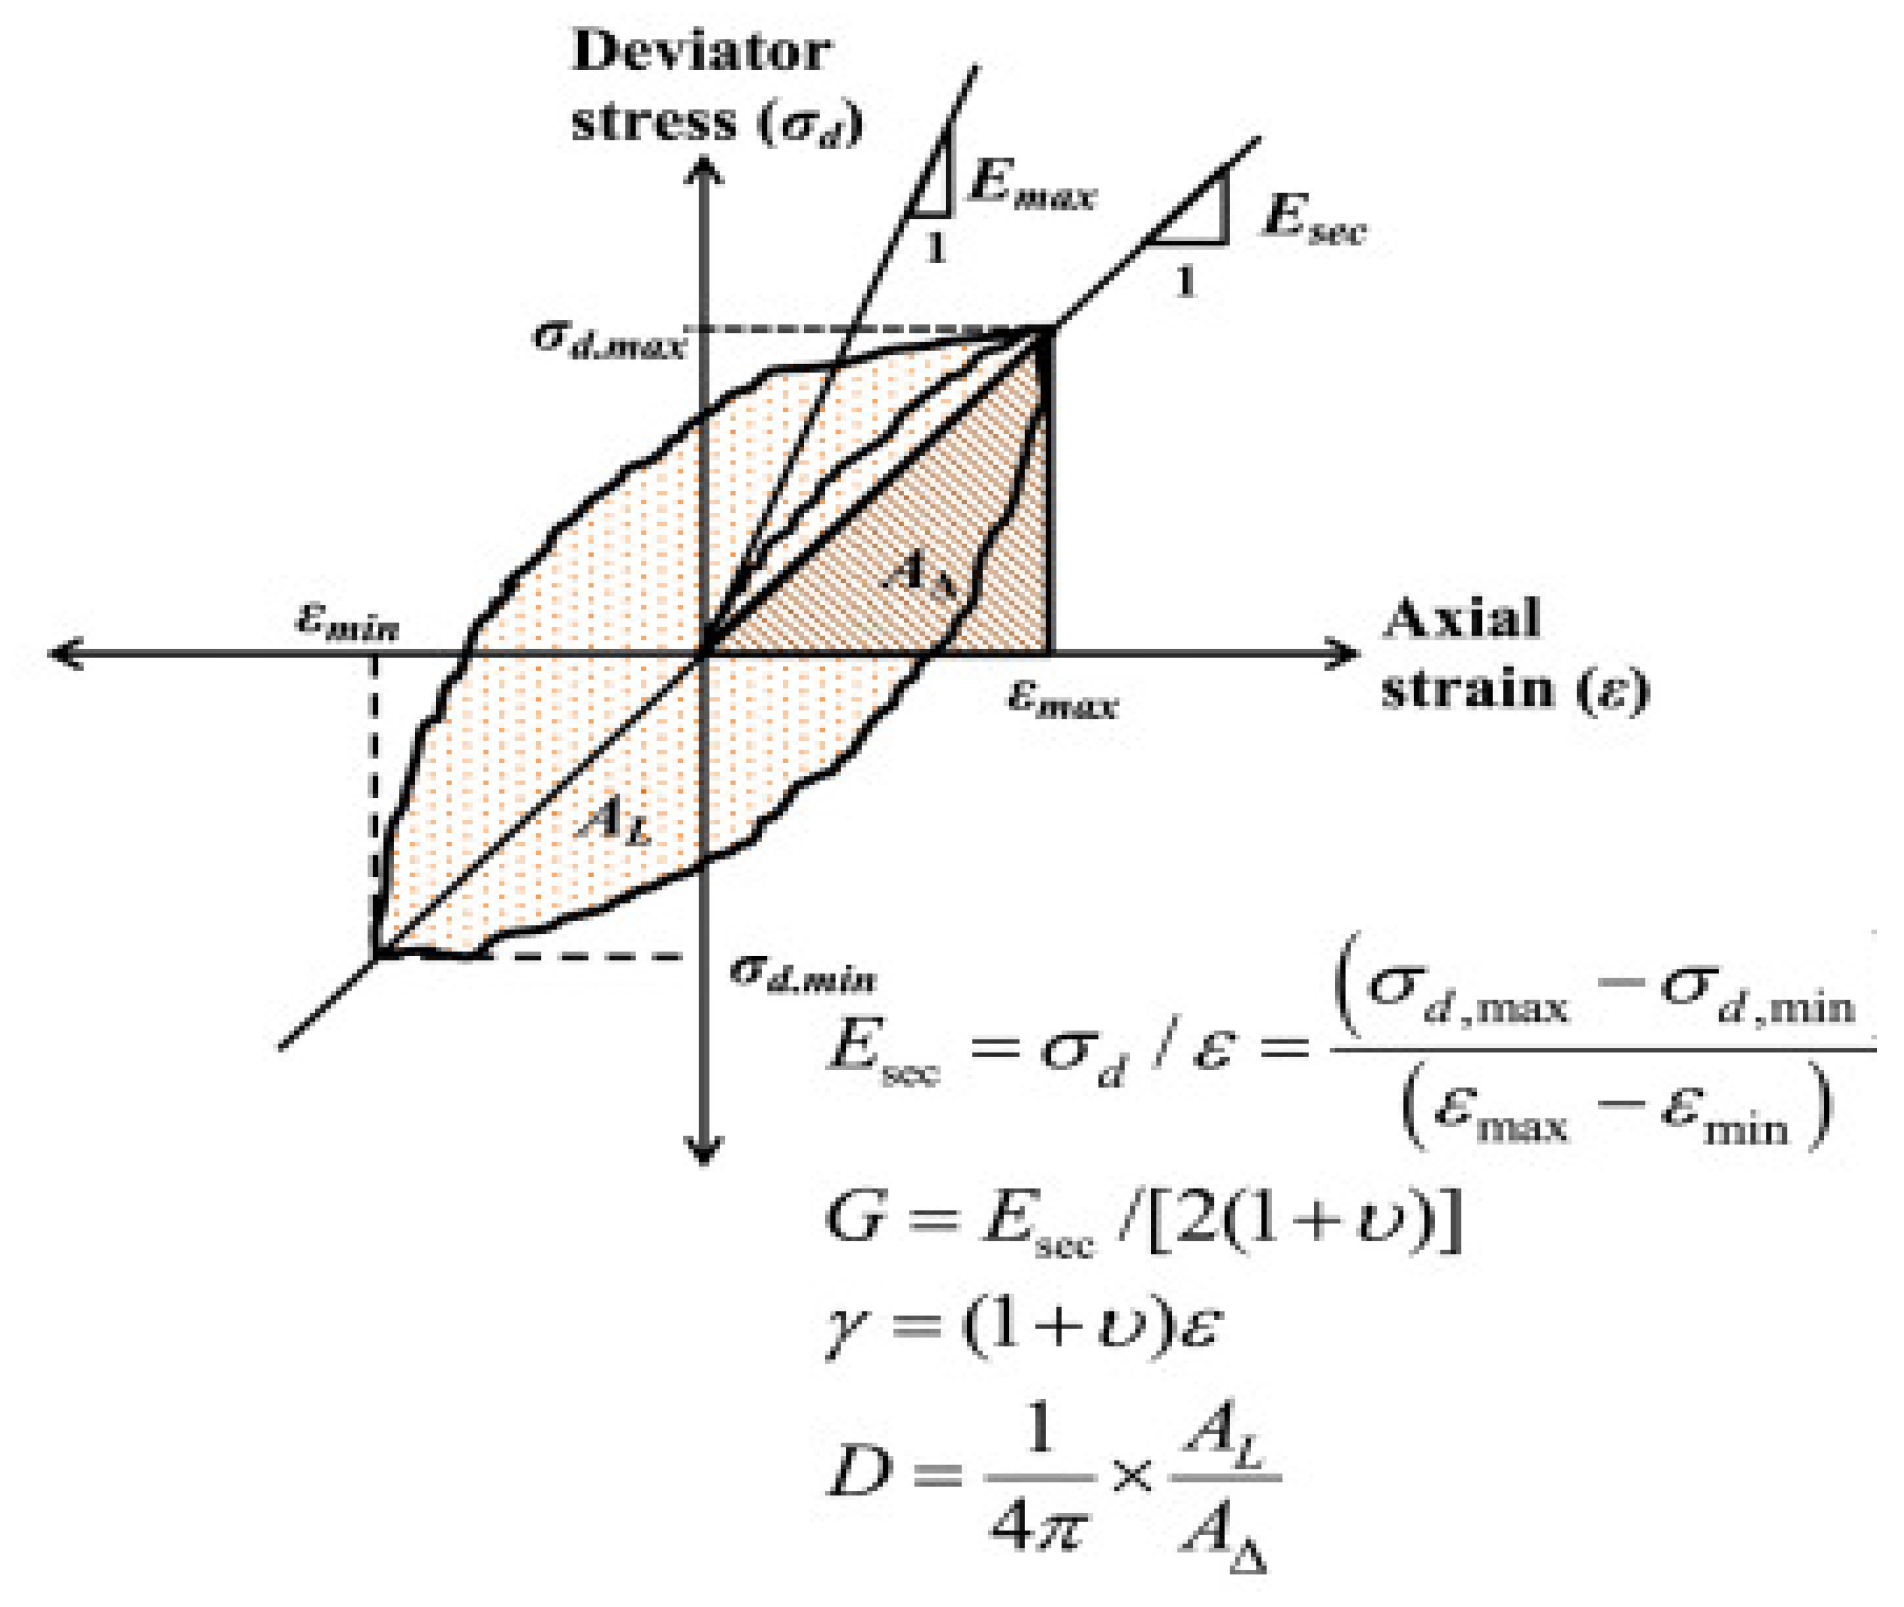
The values of SM and DR were calculated by the DYNATRIAX software during the tests for each cycle and were further processed in Python (phycharm and matplotlib) to generate their graphs against the number of cycles and shear strain. The DYNATRIAX software produced the shear modulus and damping ratio. Figure 5 depicts a symmetrical hysteresis loop (SHL), illustrating the conventional approach for calculating dynamic properties [30]. In this method, the dynamic shear modulus (G) is determined using the secant Young’s modulus (Esec), which is obtained by connecting the peak compressive and tensile stress–strain points. The damping ratio is derived from the stored strain energy within the triangle in the first quadrant, considering the symmetrical nature of the loading cycle. The SM was calculated from the secant Young’s modulus (E), measured by the slope of the line joining the points of peak stress–strain points, while the DR was calculated from the stored strain energy by the triangle (Figure 6).
These values were calculated for 40 cycles, so for further processing, the average values of SM and DR of all five samples were obtained for shear strains of 0.2, 1, 2, 2.5, and 5%, and confining pressures of 150, 200, and 300 kPa (Table 3 and Table 4).
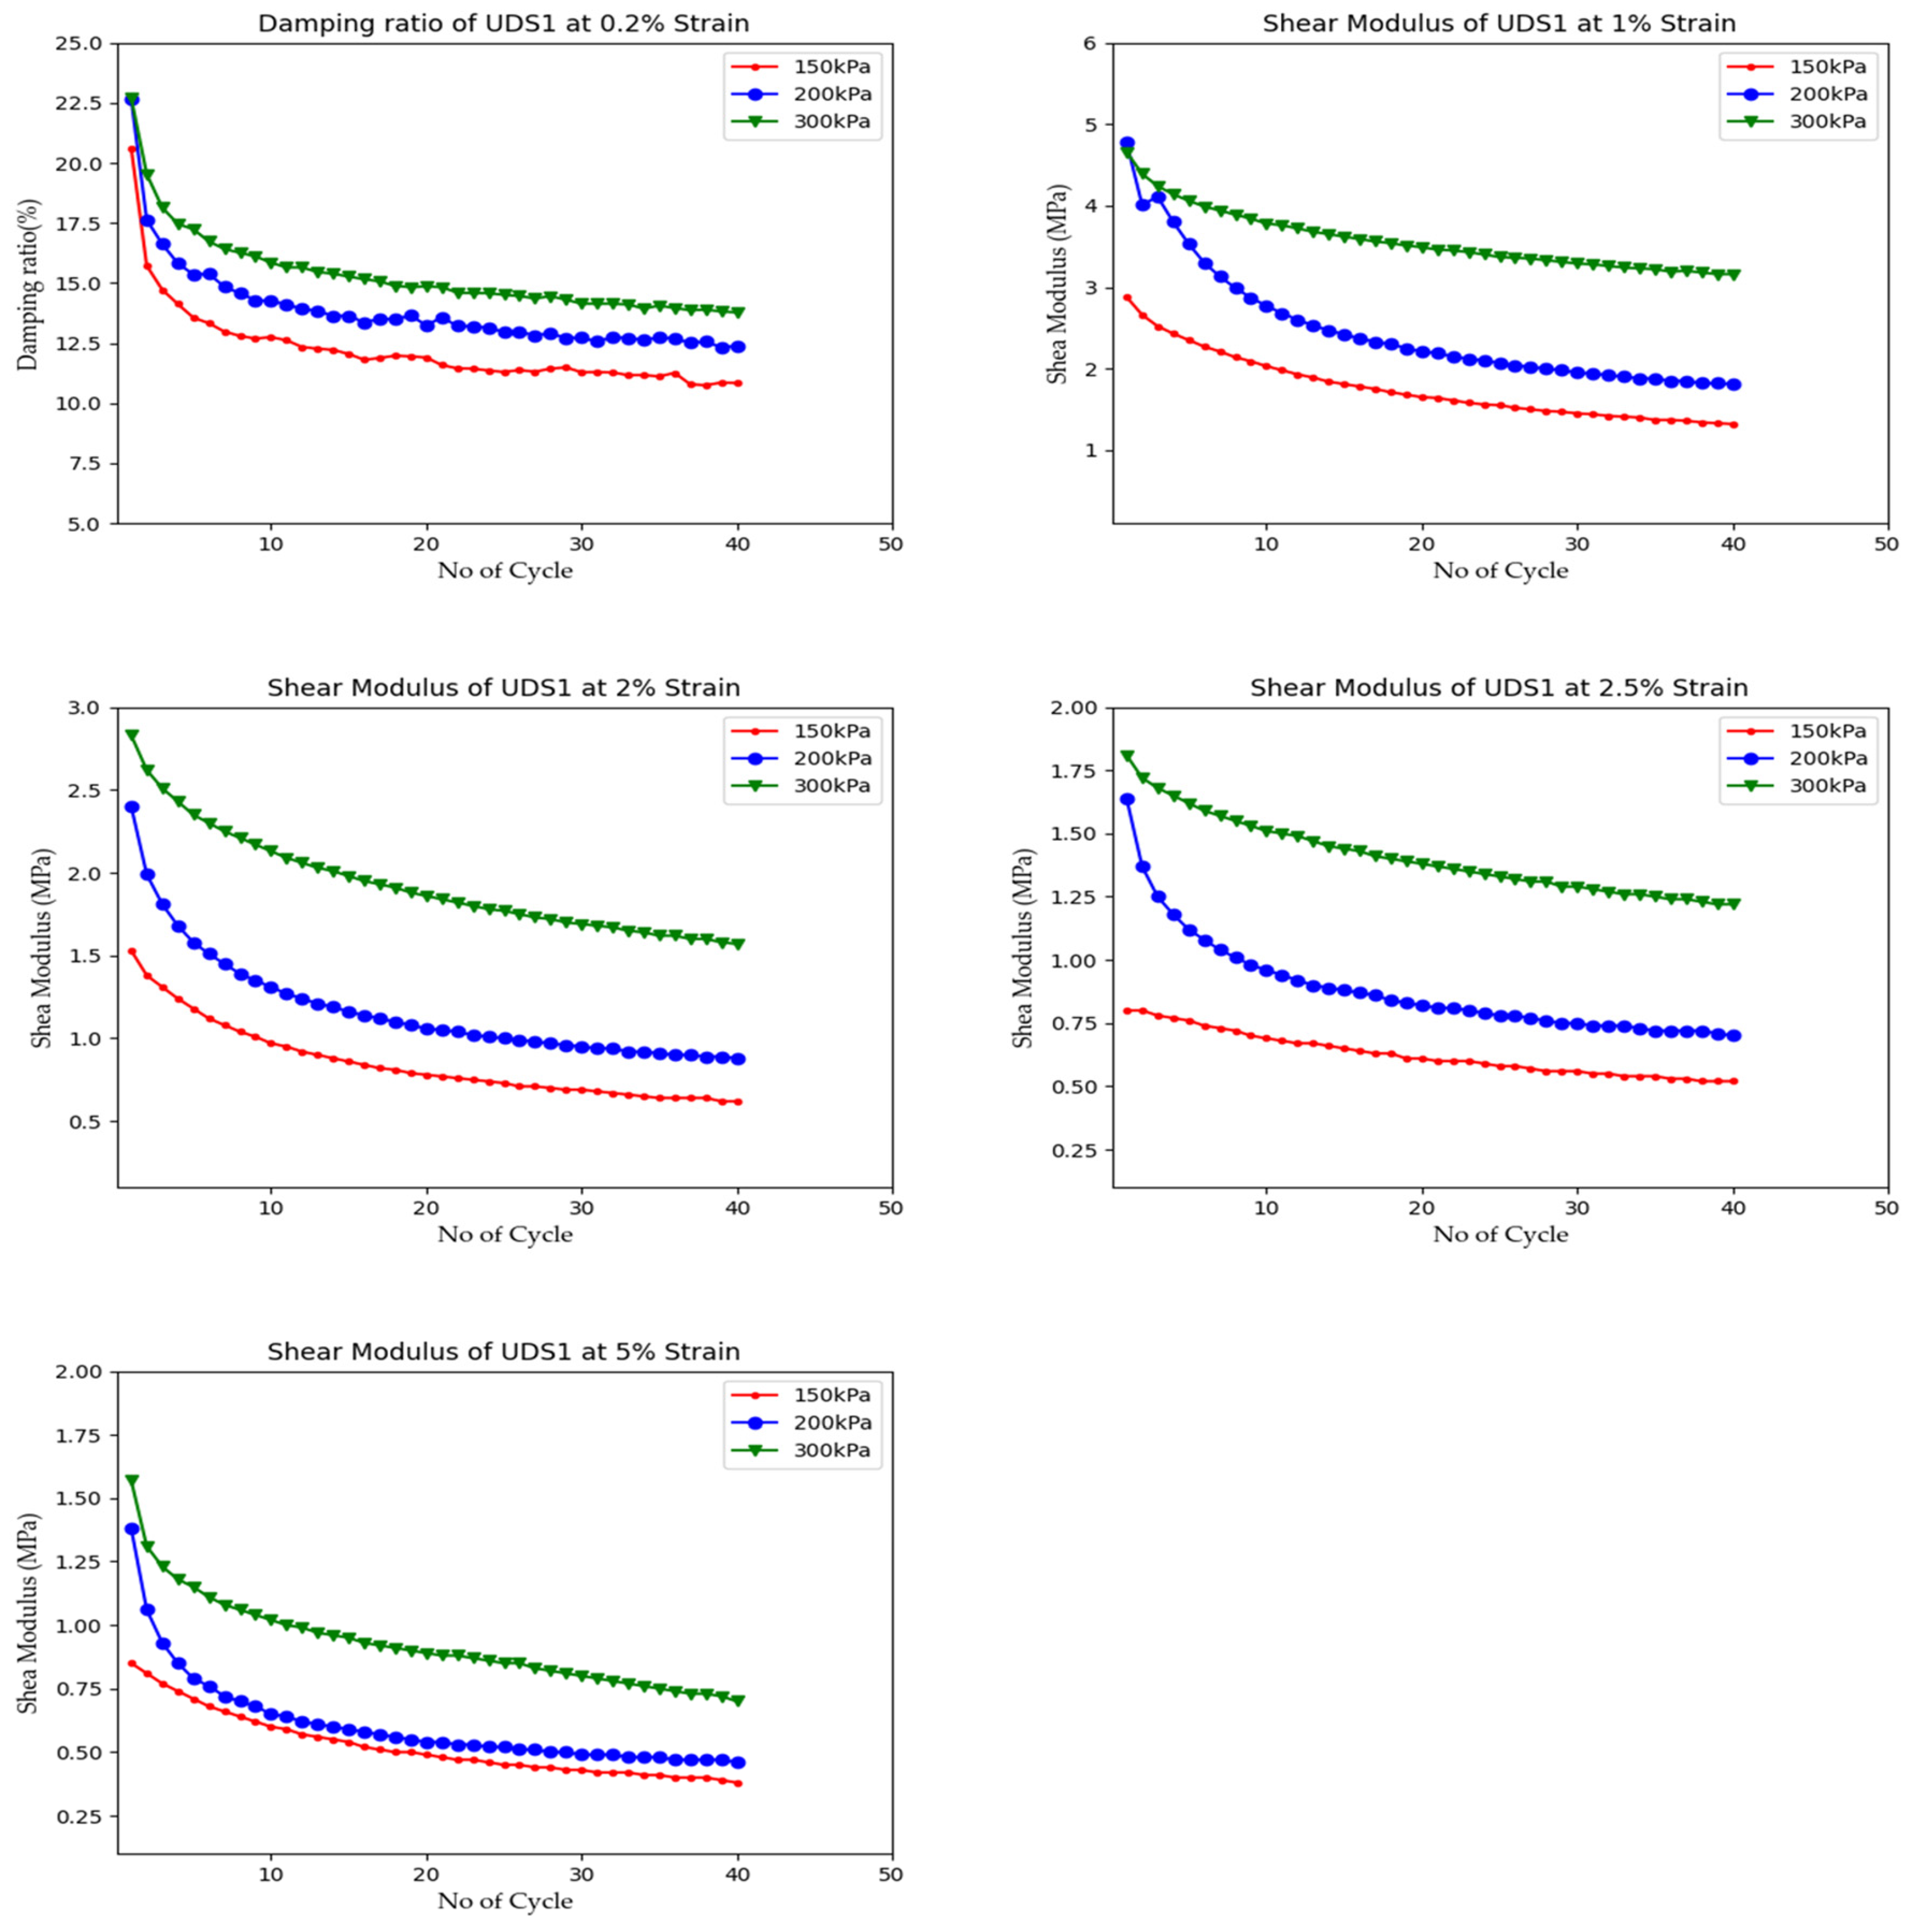
The SMs and DRs were plotted to generate graphs with the number of cycles at prescribed shear strains and confining pressures. The values of SM and DR decreased with an increase in the number of cycles after the initial cycles, due to the development of pore water pressure and the reduction of effective stresses. In Figure 6 and Figure 7, at 1% strain of UDS 1 at 150 kPa, the initial value of SM, 2.88 MPa, was reduced to 1.23 MPa, and the DR from 19.55% to 11.34%. Similar trends were observed for all other samples.

4.3. Effect of Shear Strain on SM and DR

Generally, the SM tends to decrease and the DR to increase as shear strain amplitude increases [10,24,36]. This is because, at higher values of shear strain, the strength of soil reduces to resist deformation, and more energy is released to yield high deformation. Similar results are also reported by Ghayoomi et al. [37] and Kumar et al. [8].
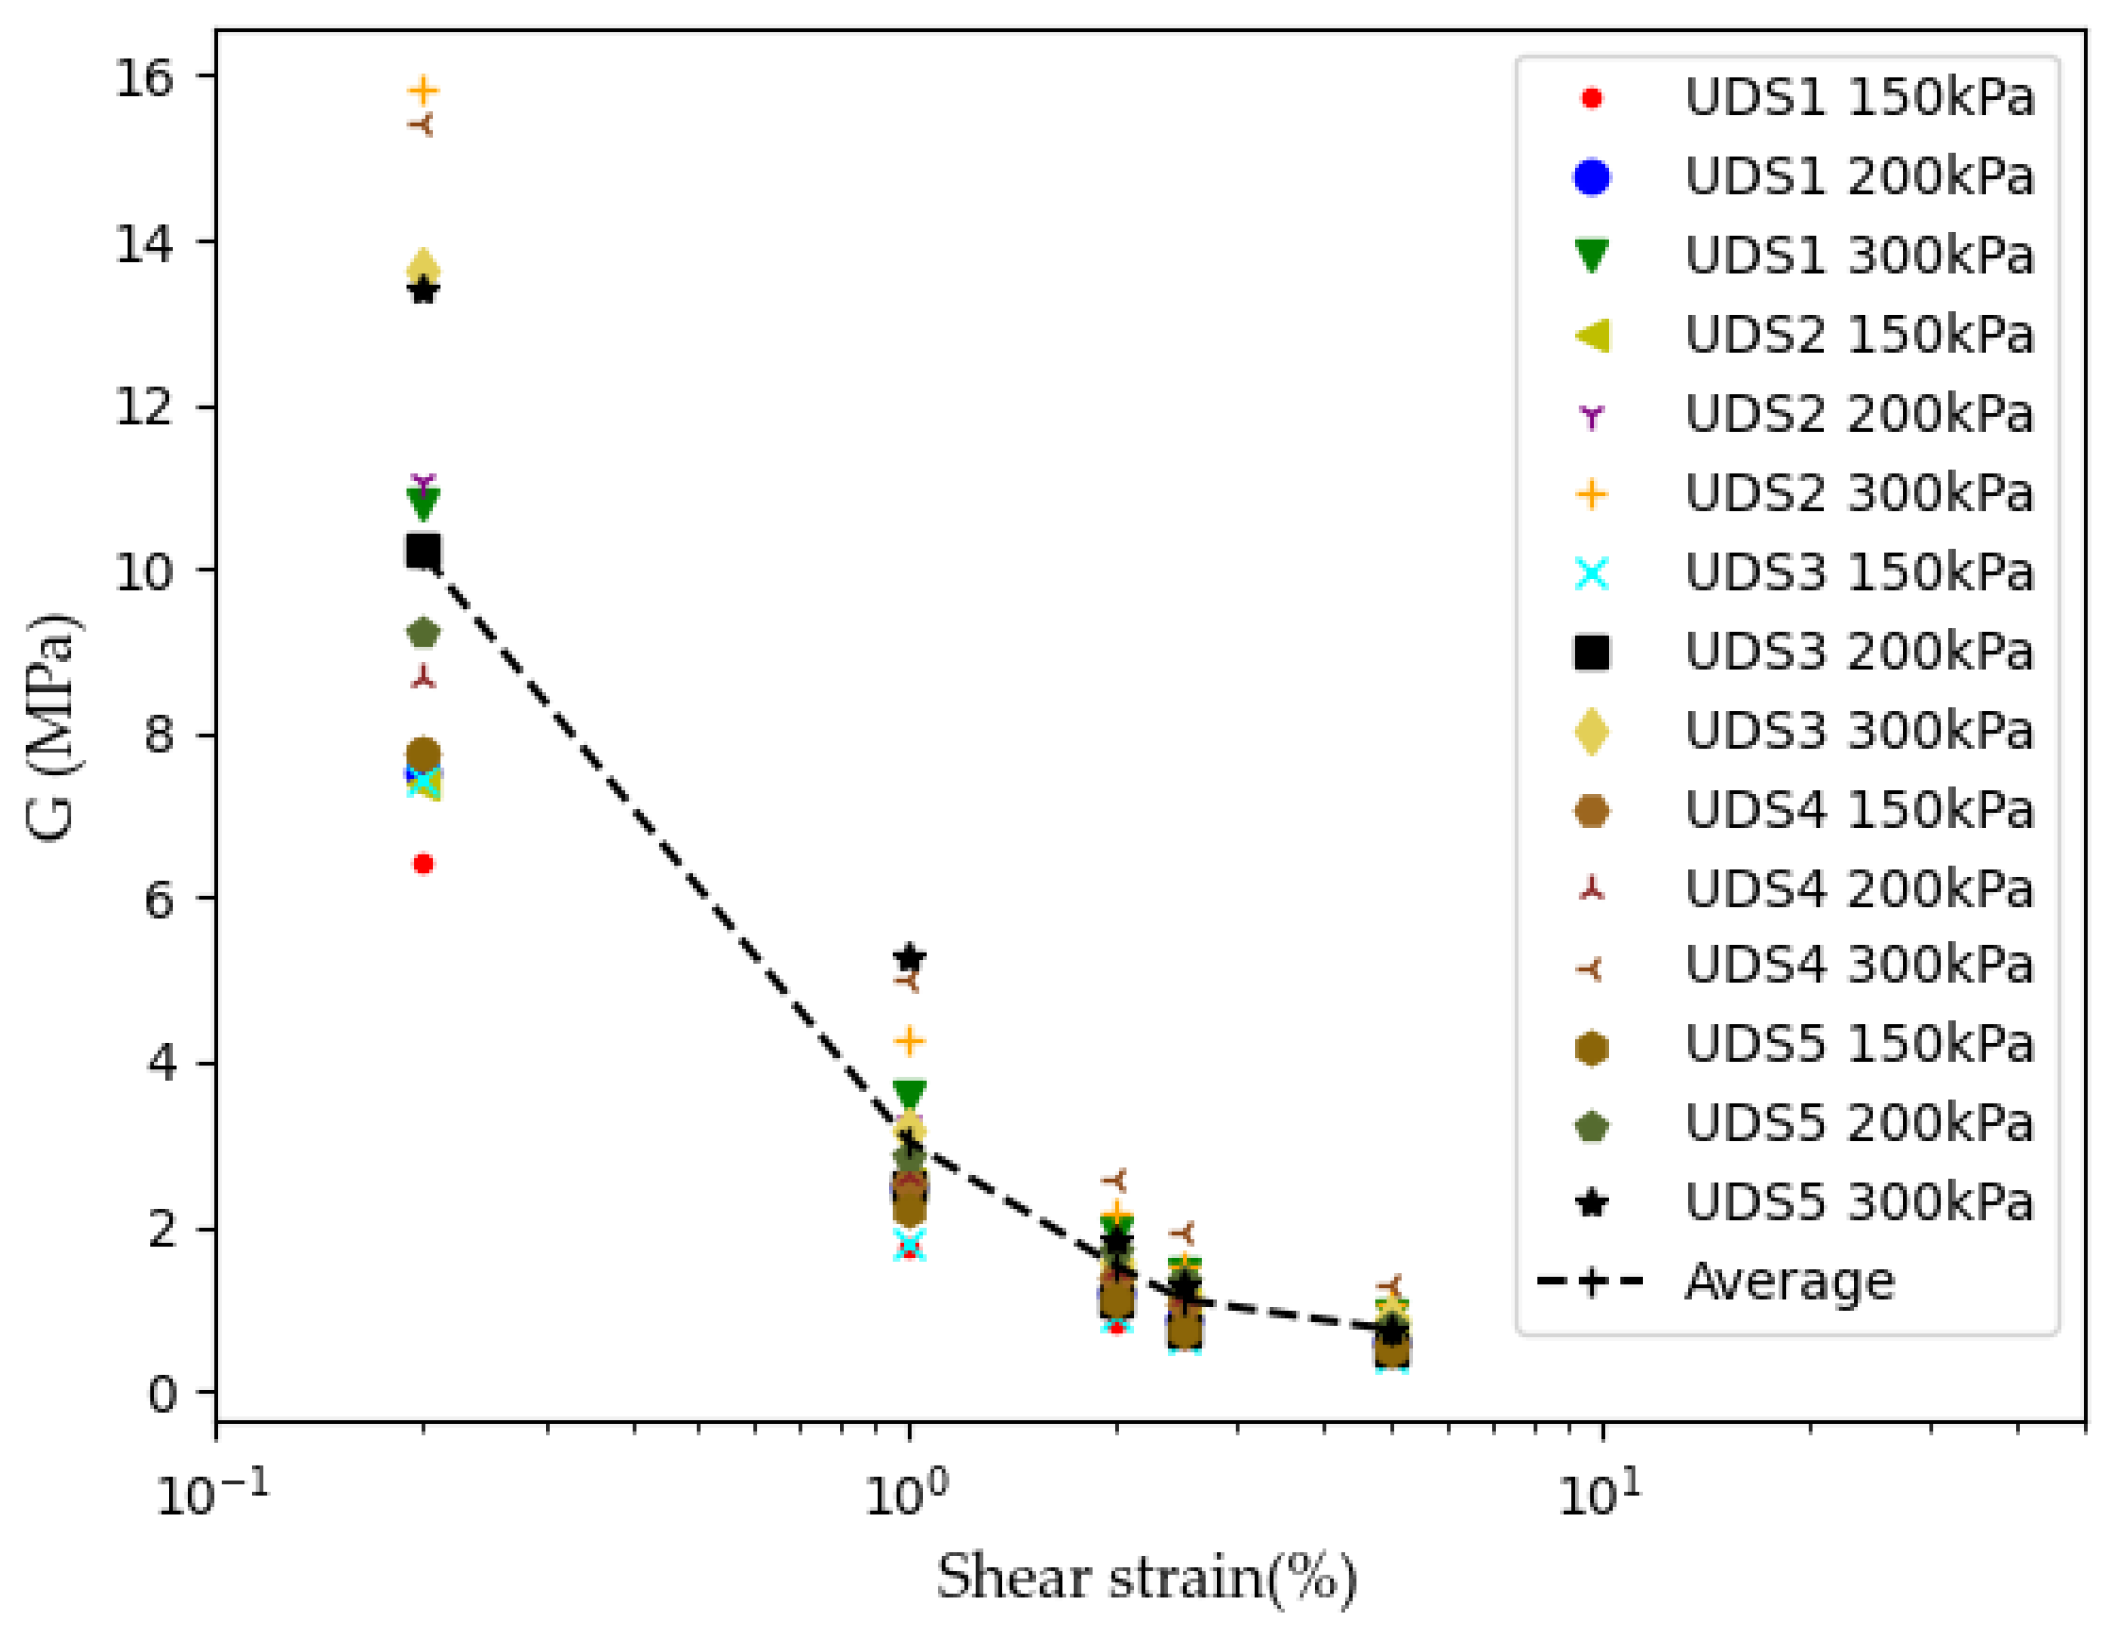
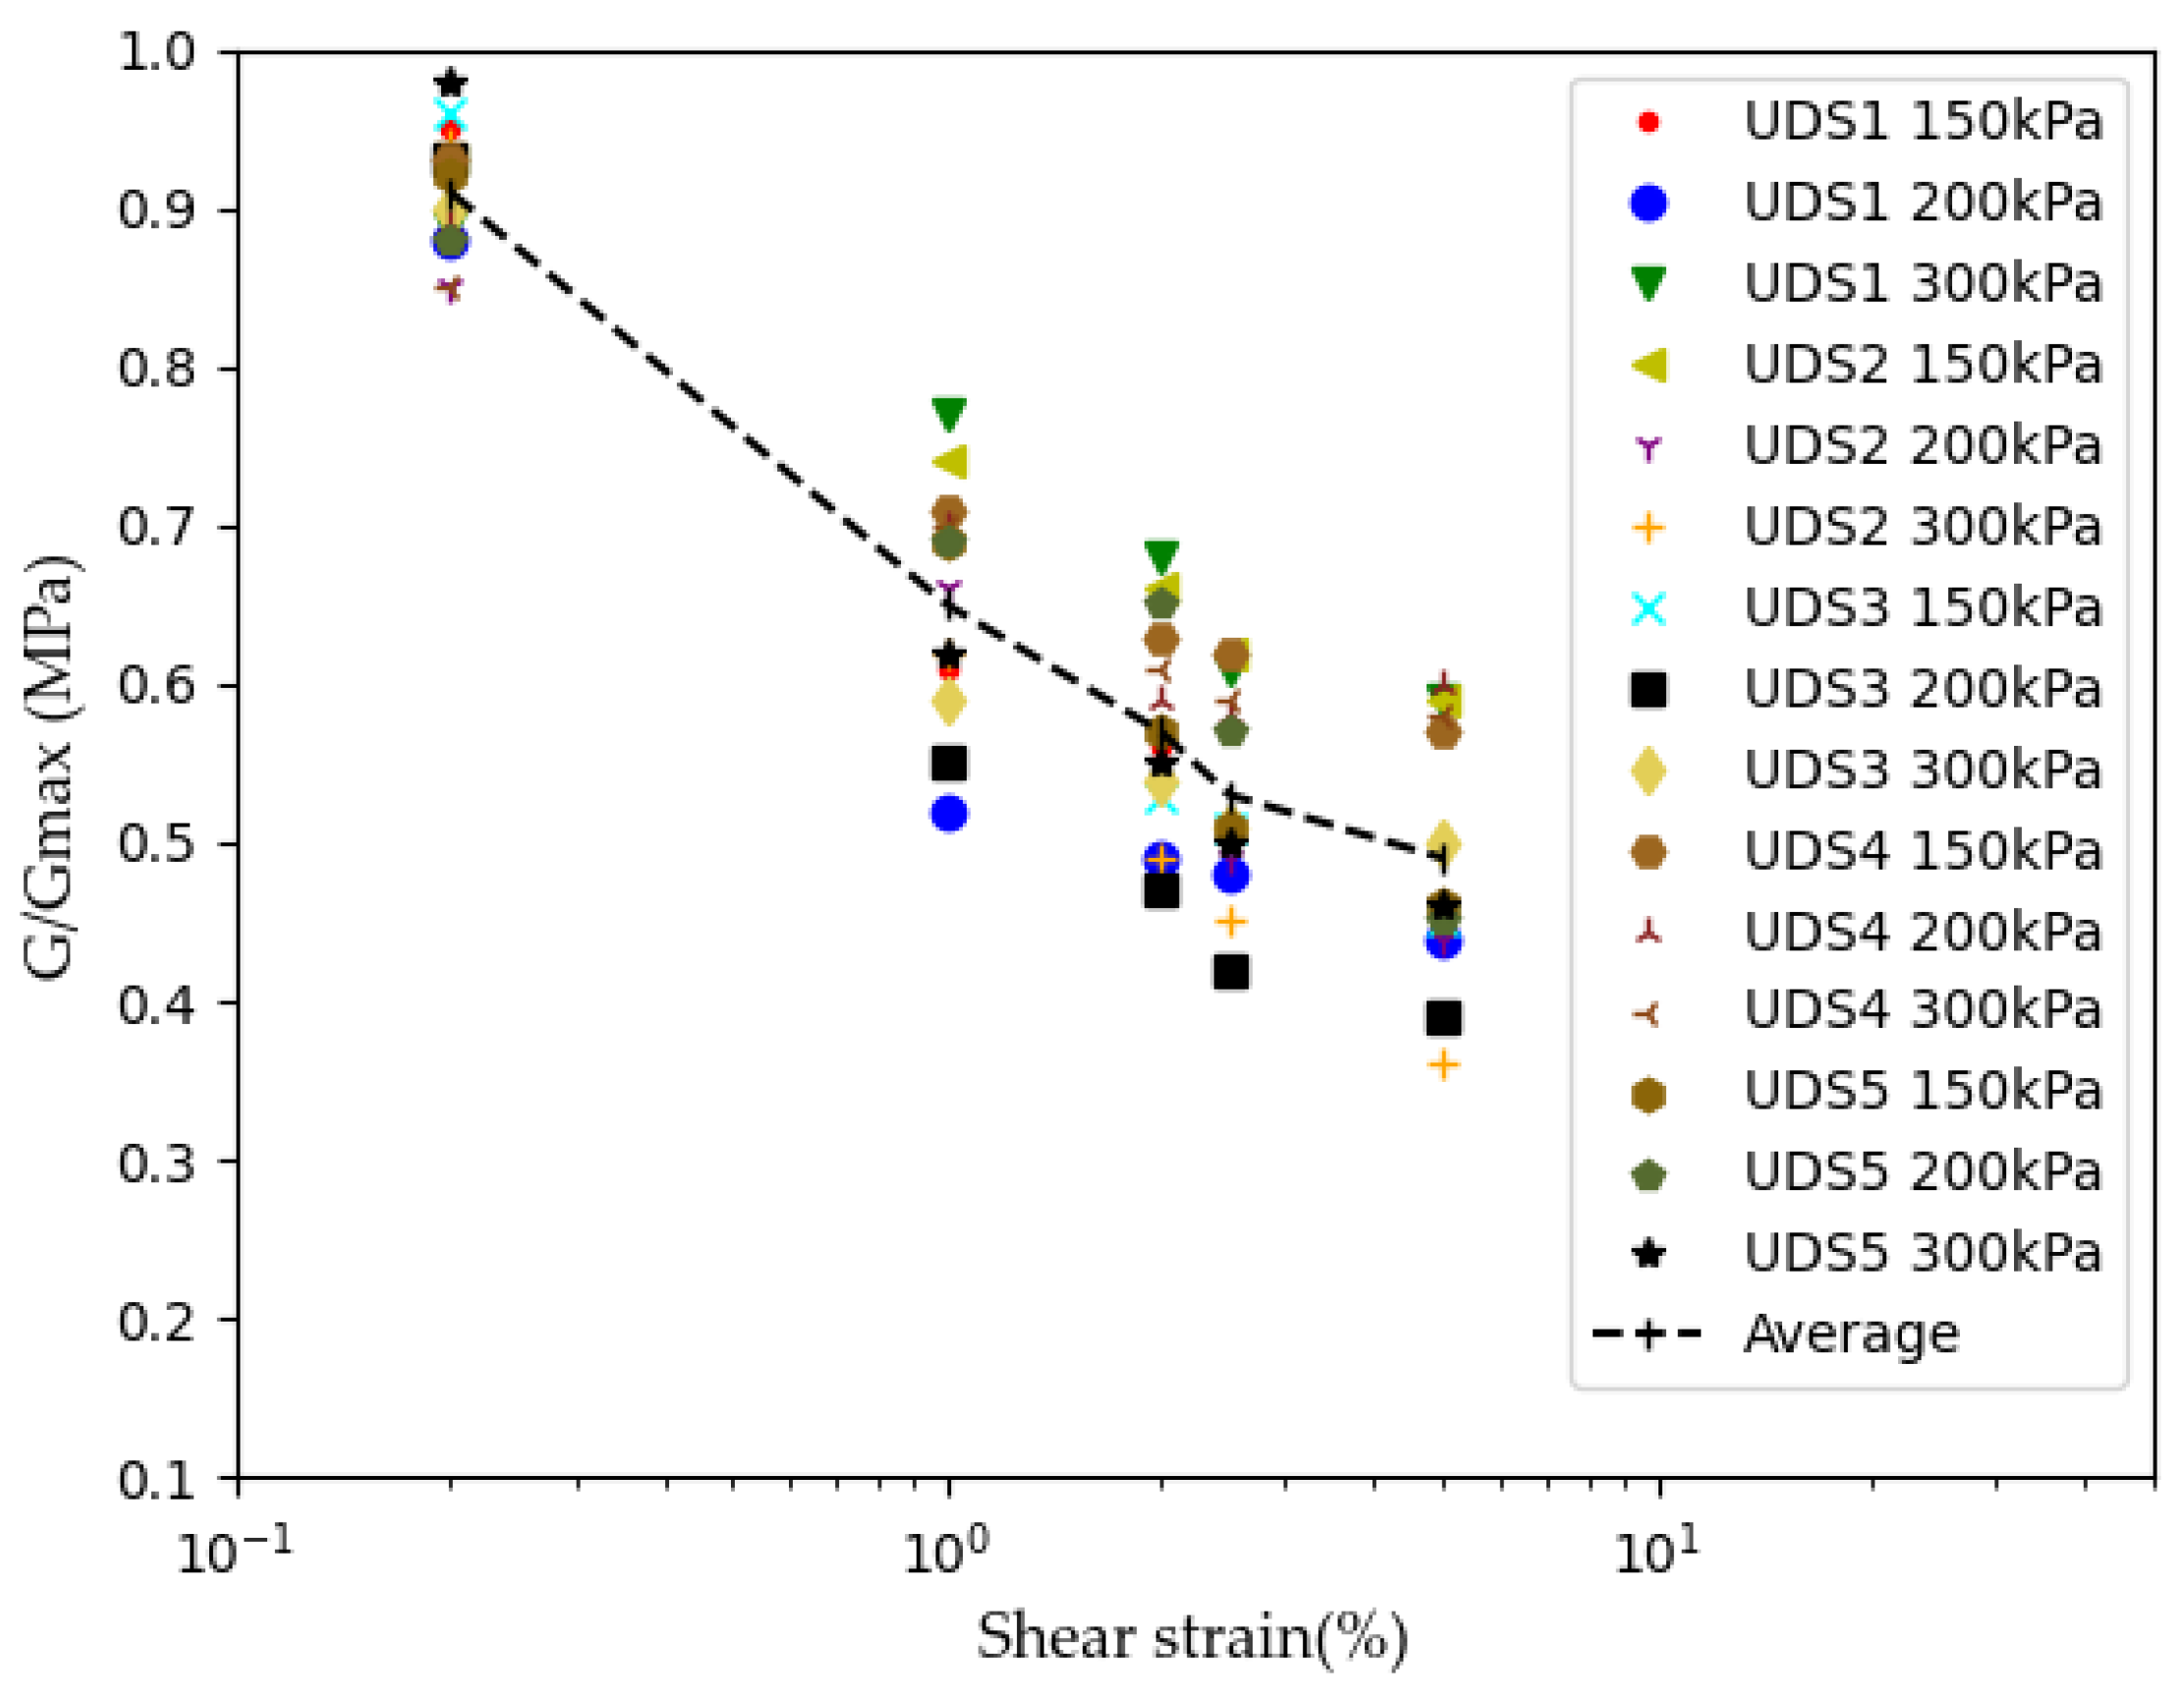
The average values of SM and DR were plotted with the shear strains of all samples at confining pressures of 150, 200, and 300 kPa. At 150 kPa, the average values of SM of UDS1 at shear strains of 0.2 to 5% were 10.61 to 0.52 MPa, which shows the values of SM decreased with an increase in shear strain (Figure 8). The modulus reduction curve (G/Gmax) is plotted as shown in Figure 9. A modulus reduction curve is used to represent the degradation of shear modulus with shear strain in terms of a reduction in modulus ratio (G/Gmax). For the present study, the values of Gmax are given in Table 3. It can be observed that, at low strain levels, the values of G/Gmax have very close values irrespective of the confining pressure, while the values change for different samples. The DR is increased from 0.25% strain to 1% strain and then decreases to a strain of 2, 2.5, and 5% as shown in Figure 10.
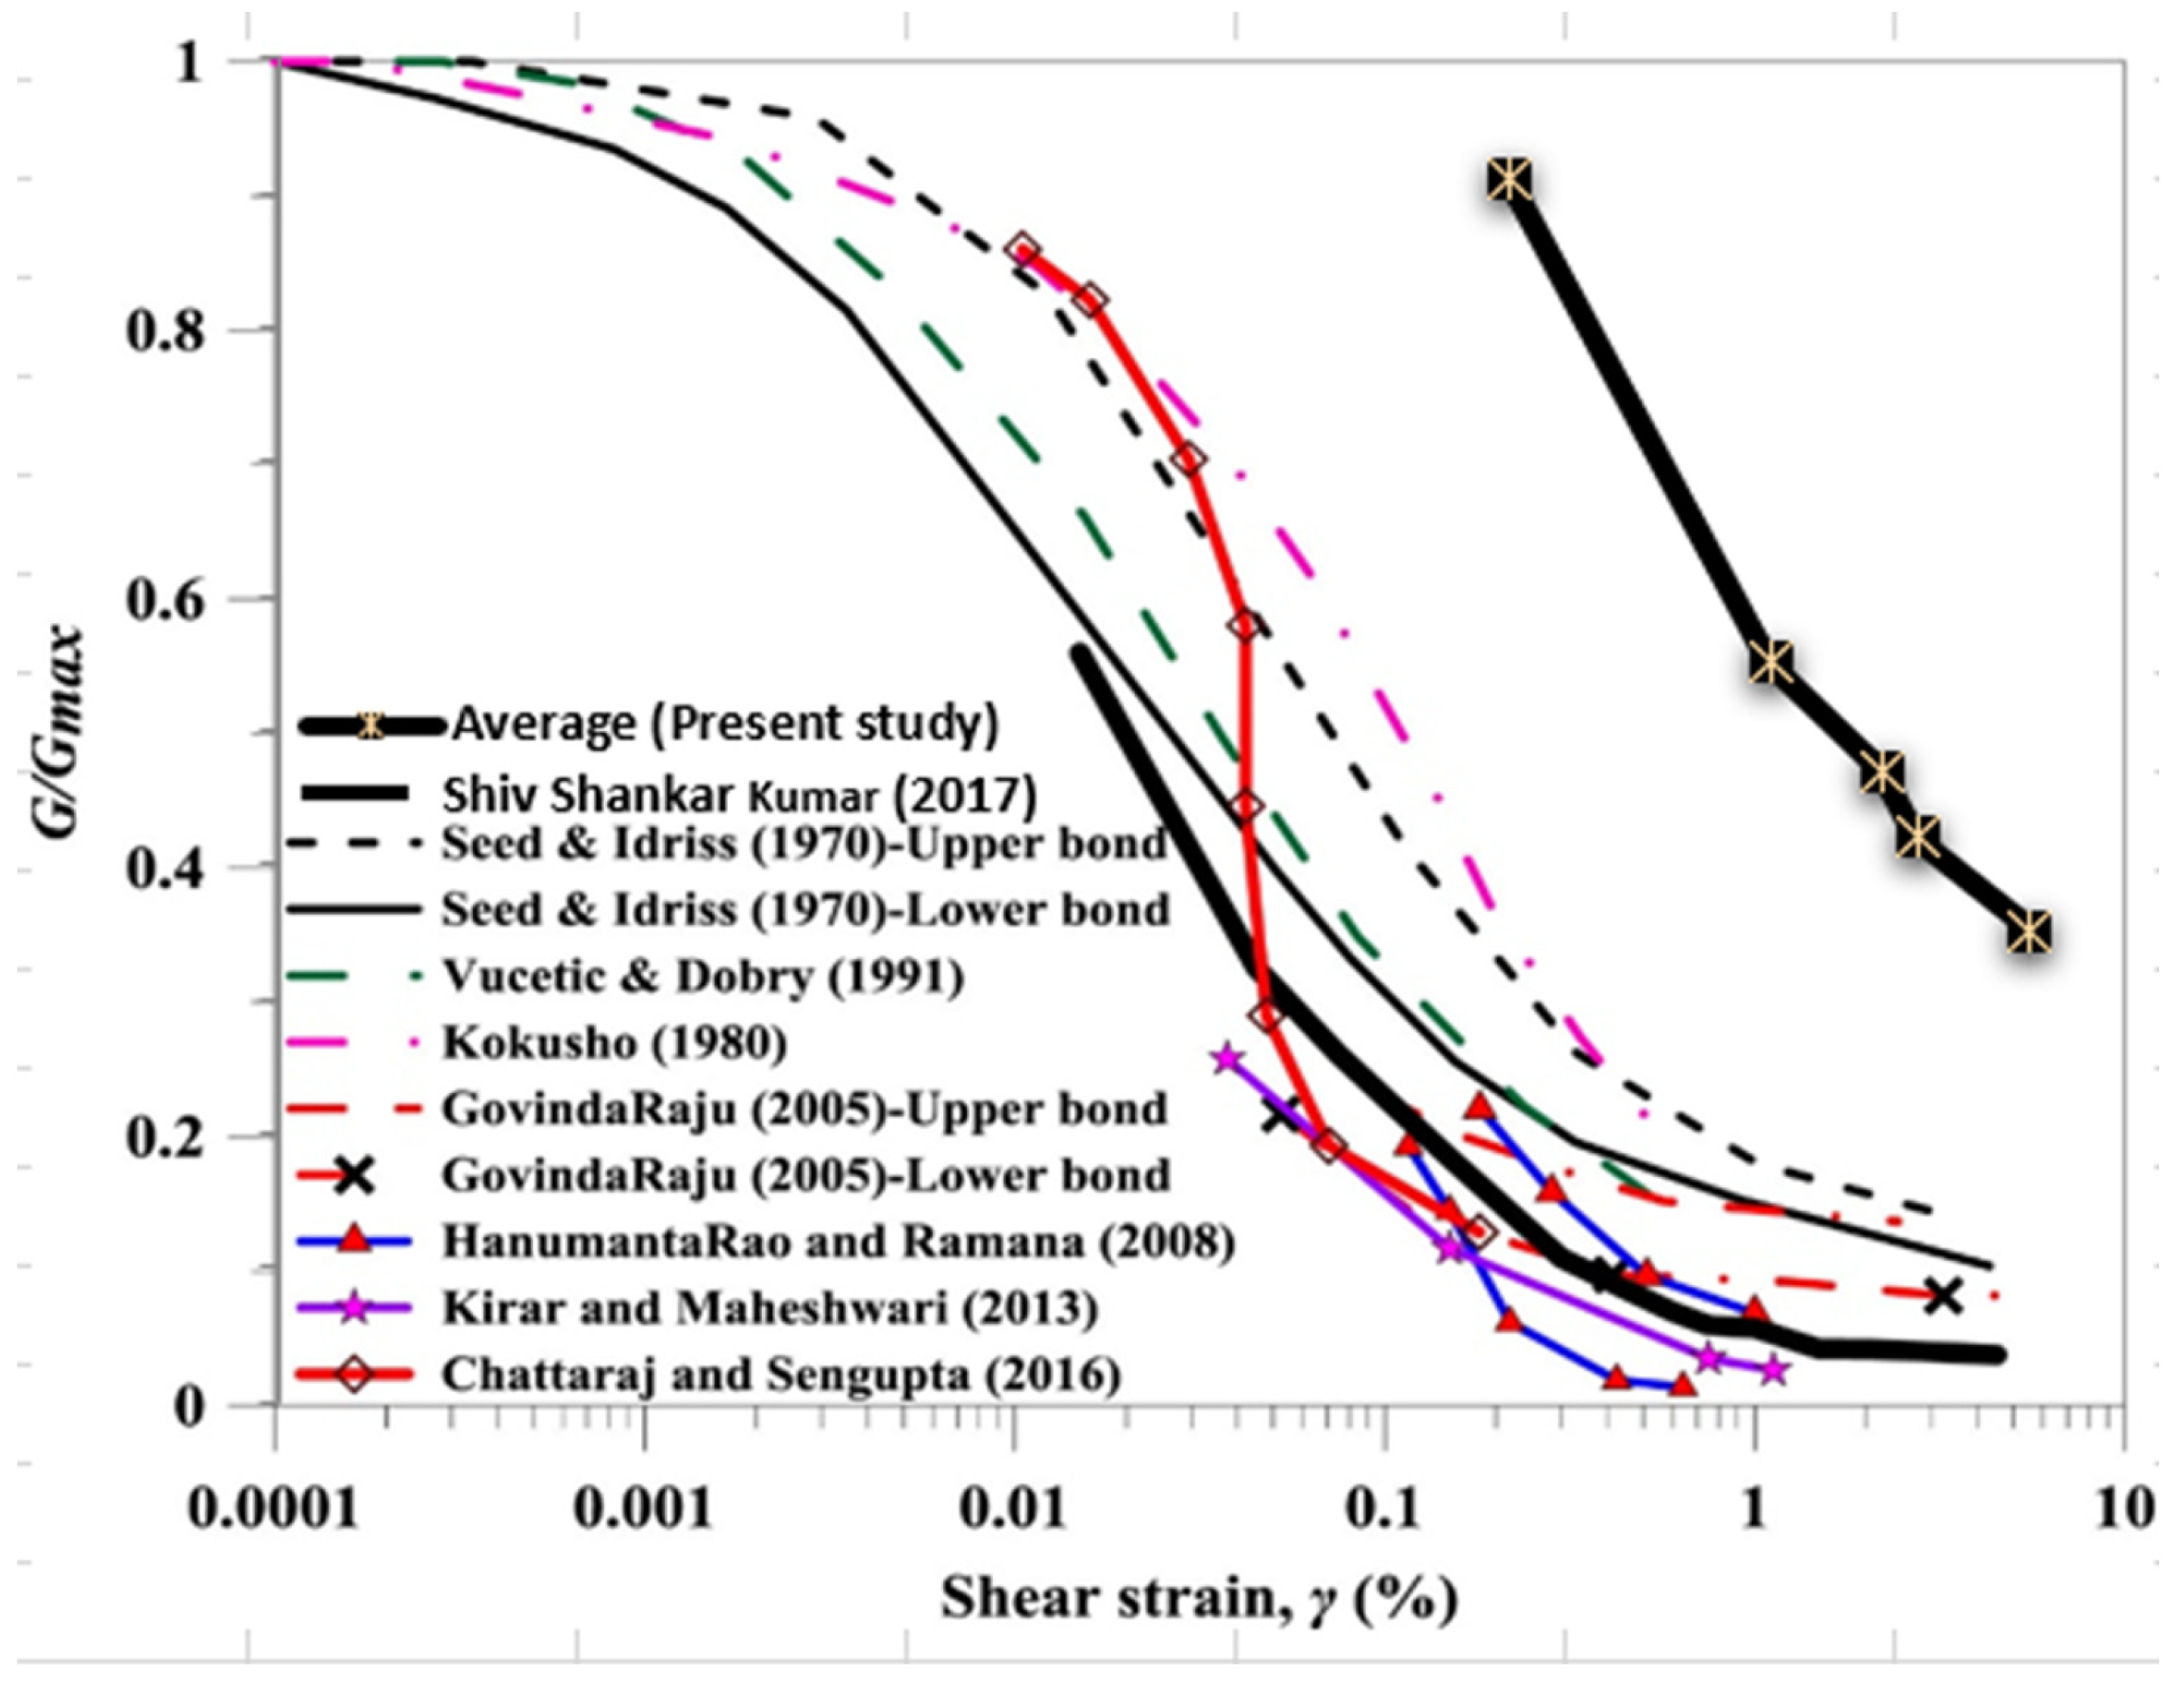
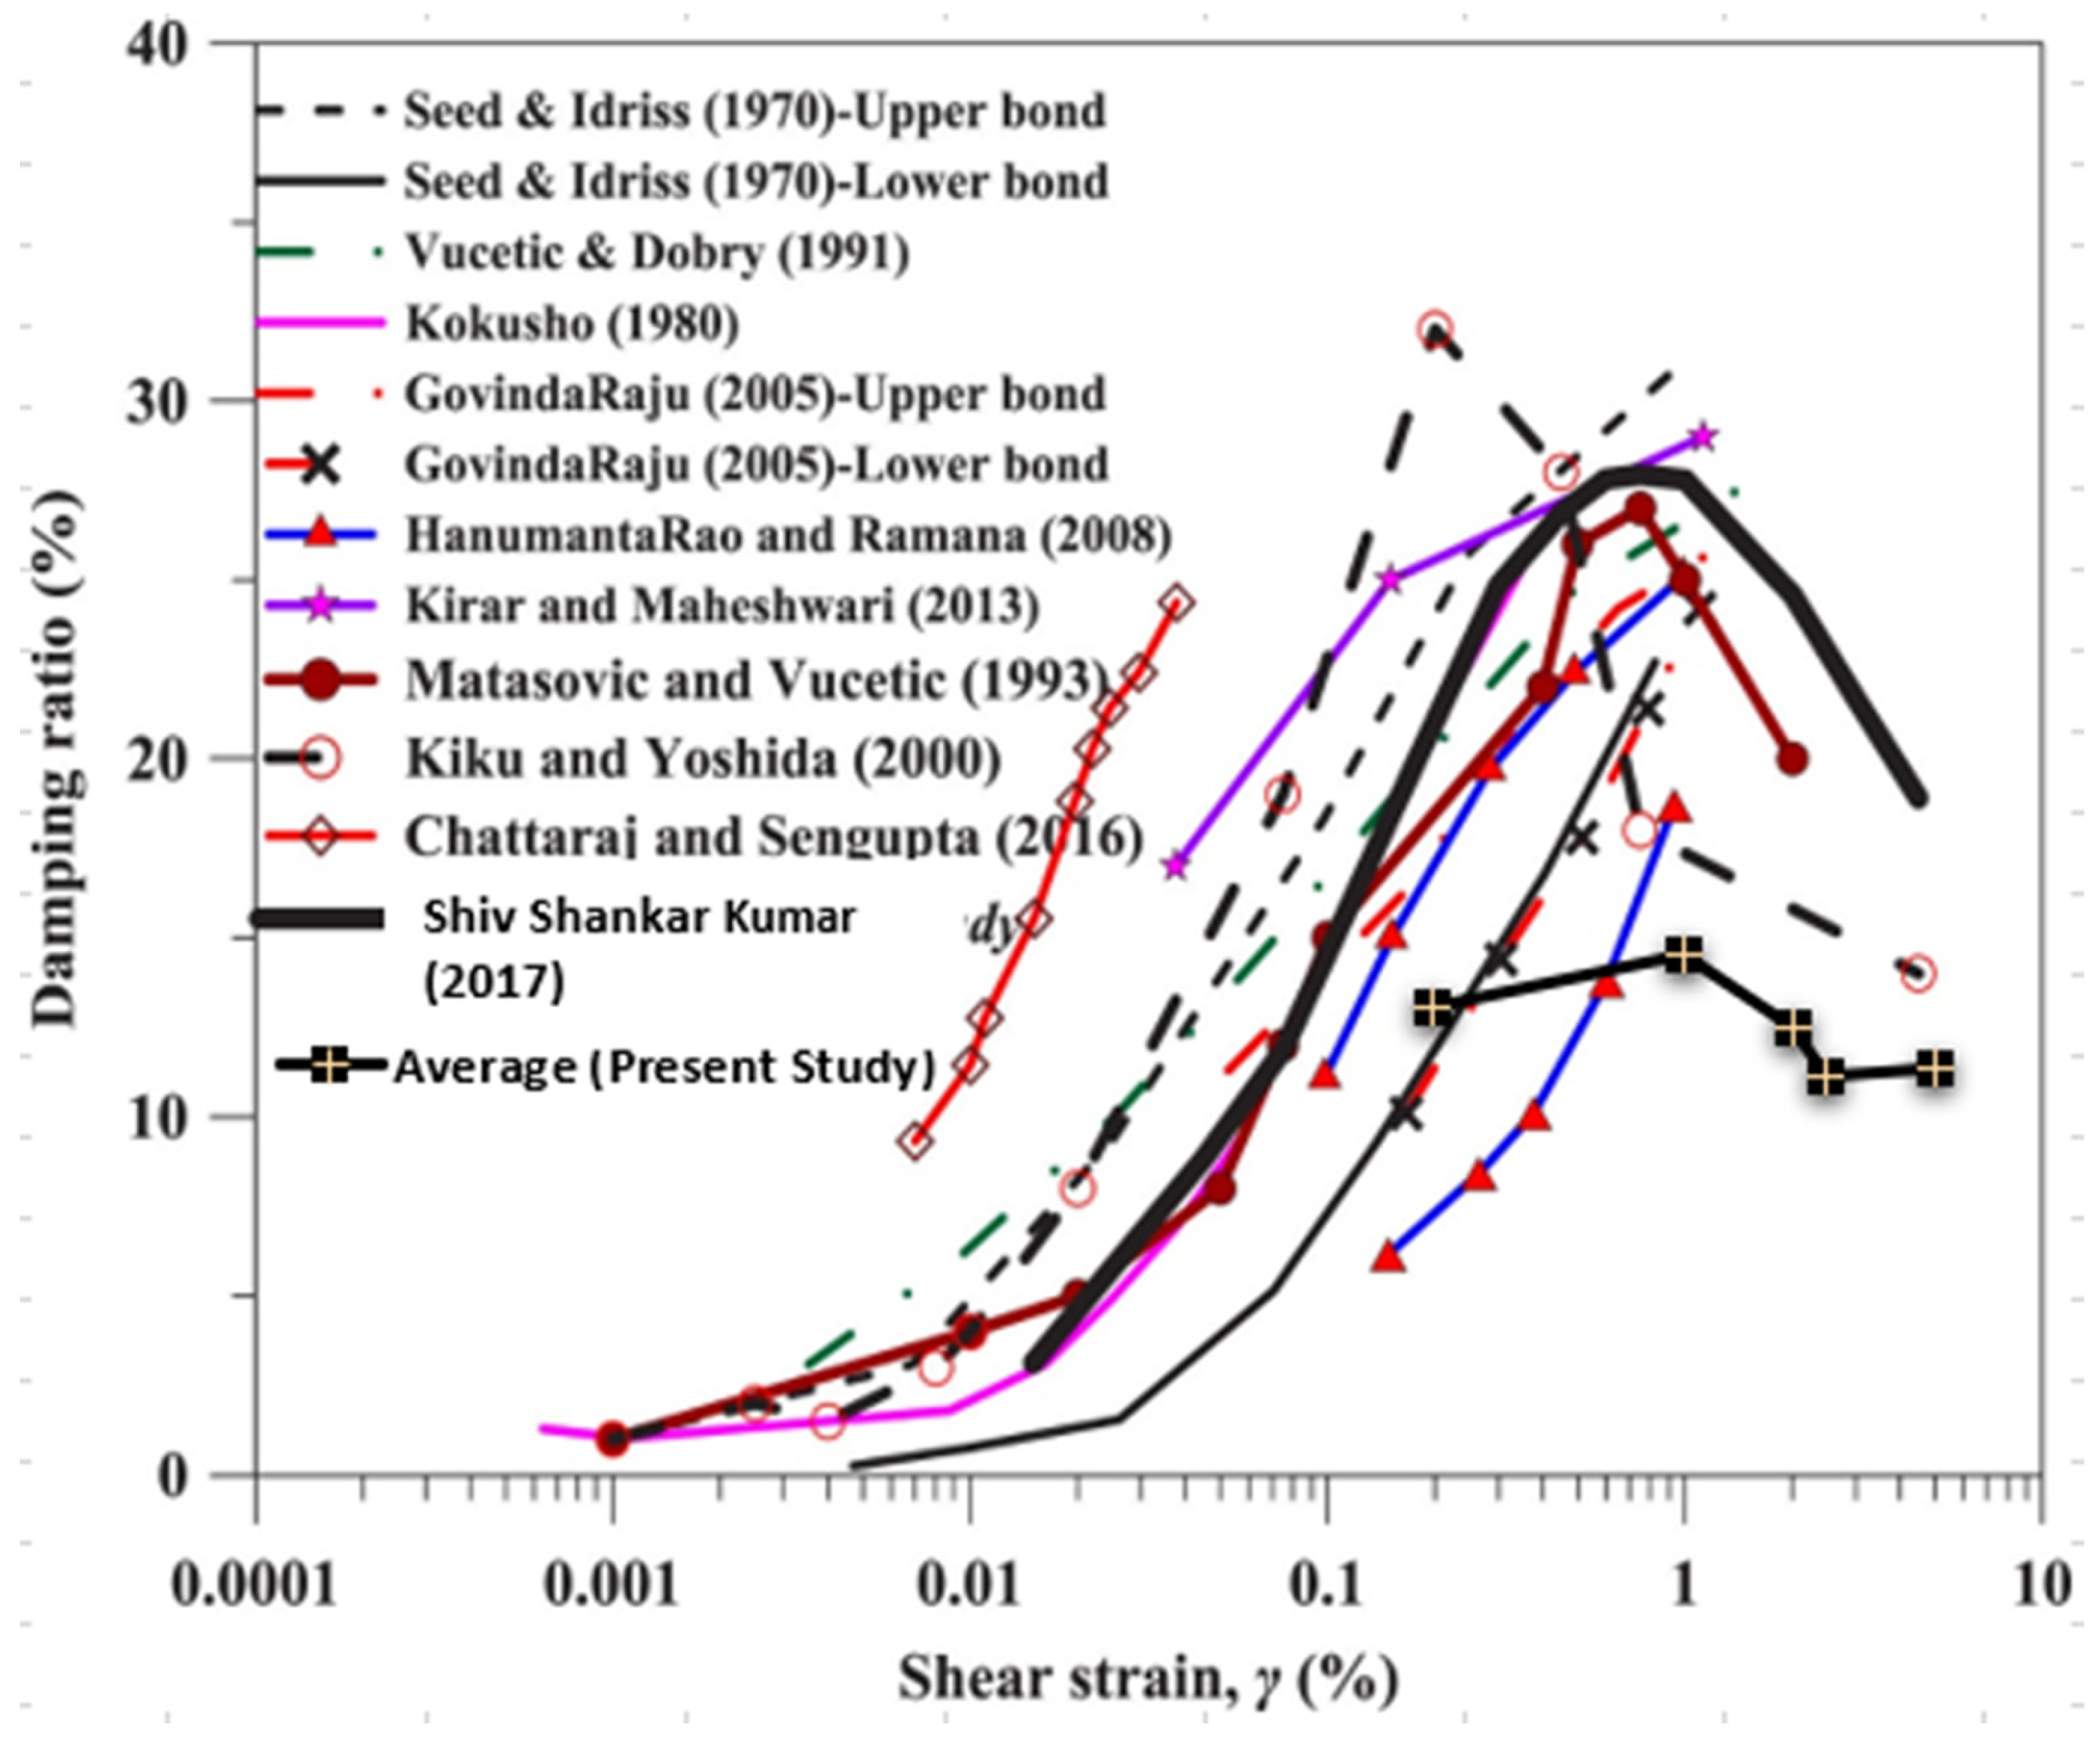
Several studies have been conducted, including works by Hardin and Drnevich [23], Ishihara [24], and Seed et al. [25]. In most of these studies, tests were carried out up to a strain of 1%. However, a limited number of researchers have measured the DR above 1% strain [25,26]. This is because of the rise of pore water pressure at a higher strain, which reduces the inter-granular forces, resulting in a decrease in effective stresses, so the damping ratio is also decreased. The comparison of the shear modulus and damping ratio for various researchers is given in Figure 11 and Figure 12.
The trend of the curve is the same, but the values of each point are different from those of another researcher because it is obvious that different soils behave differently and have different values of DR at varying parameters. As in this research, the soil type is sandy silty clay, and the parameters are 150, 200 and 300 kPa confining pressure and the strain rates are 0.2, 1, 2, 2.5, and 5%, while other researchers worked on different types of soil and at different confining pressures, and it was already mentioned that the dynamic properties are different for different soils at varying parameters. The variations in curve shapes and values of shear modulus and damping ratio among different soils can be attributed to factors such as soil composition, soil structure, stress history, saturation level, soil fabric, and differences in testing methodology. Variances in particle sizes, mineralogy, compaction, and stress conditions lead to diverse mechanical properties. Additionally, variations in water content, consolidation history, and testing protocols contribute to differences in shear modulus and damping ratio values. Understanding these factors is essential for accurate geotechnical analysis and design, as it allows for the consideration of the specific behavior of each soil type under different loading conditions.

5. Conclusions

The research findings suggest that strain-controlled cyclic triaxial testing, conducted according to ASTM D-3999, on subsoil samples along Jamrud Road in Peshawar yielded valuable insights. The samples were classified as sandy silty clay (CL-ML) based on the USCS and exhibited low plasticity. The shear stress vs. shear strain hysteresis loops demonstrated a trend of becoming gentler with increasing shear strain. The value of SM decreased with higher shear strain, while DR initially increased up to 1% strain, then decreased for higher strains. The effect of confining pressure was more pronounced at lower strains (0.01% and 0.2%), while it was less significant at higher strains (1%, 2%, 2.5%, and 5%). These findings provide important implications for future studies and the understanding of subsoil behavior.

Author Contributions

Conceptualization, S.S.A.S. and W.A.; methodology, S.S.A.S., W.A. and A.R.A.; software, S.S.A.S.; validation, W.A., S.S.A.S., I.I. and M.W.; formal analysis, S.S.A.S. and A.R.A.; investigation, S.S.A.S., W.A., A.R.A., I.I., H.T.J. and G.K.; resources, S.S.A.S.; data curation, W.A. and S.S.A.S.; writing—original draft preparation, S.S.A.S. and A.R.A.; writing—review and editing, S.S.A.S., W.A., A.R.A., I.I., M.W., H.T.J. and G.K.; visualization, W.A., S.S.A.S., A.R.A., I.I., H.T.J. and G.K.; supervision, W.A.; funding acquisition, G.K. All authors have read and agreed to the published version of the manuscript.

Funding

This research received no external funding.

Data Availability Statement

The data used in this research work are available upon request from the corresponding author(s).

Acknowledgments

The National Centre of Excellence in Geology is acknowledged for providing laboratory facilities during this research work.

Conflicts of Interest

The authors declare no conflict of interest.

References

  1. Celebi, M.; Prince, J.; Dietel, C.; Onate, M.; Chavez, G. The culprit in Mexico City—Amplification of motions. Earthq. Spectra 1987, 3, 315–328. [Google Scholar] [CrossRef]
  2. Neagu, C.; Arion, C. Dynamic laboratory investigation for soil seismic response. In Proceedings of the 15th World Conference on Earthquake Engineering, Lisbon, Portugal, 24–28 September 2012; Volume 15, pp. 1–7. [Google Scholar]
  3. Vucetic, M.; Dobry, R. Effect of soil plasticity on cyclic response. J. Geotech. Eng. 1991, 117, 89–107. [Google Scholar] [CrossRef]
  4. Villacreses, J.P.; Caicedo, B.; Caro, S.; Yépez, F. A novel procedure to determine shear dynamic modulus and damping ratio for partial saturated compacted fine-grained soils. Soil Dyn. Earthq. Eng. 2020, 131, 106029. [Google Scholar] [CrossRef]
  5. Sitharam, T.G.; GovindaRaju, L.; Murthy, S.B. Evaluation of liquefaction potential and dynamic properties of silty sand using cyclic triaxial testing. Geotech. Test. J. 2004, 27, 1–7. [Google Scholar]
  6. Darendeli, M.B. Development of a New Family of Normalized Modulus Reduction and Material Damping Curves. Ph.D. Thesis, University of Texas, Austin, TX, USA, 2001. [Google Scholar]
  7. Roblee, C.; Chiou, B. A proposed geoindex model for design selection of non-linear properties for site response analyses. In International Workshop on Uncertainties in Nonlinear Soil Properties and Their Impact on Modeling Dynamic Soil Response; PEER Headquarters: Sacramento, CA, USA, 2004. [Google Scholar]
  8. Kumar, S.S.; Krishna, A.M.; Dey, A. Evaluation of dynamic properties of sandy soil at high cyclic strains. Soil Dyn. Earthq. Eng. 2017, 99, 157–167. [Google Scholar] [CrossRef]
  9. Dinesh, S.V.; Sitharam, T.G.; Vinod, J.S. Dynamic properties and liquefaction behaviour of granular materials using discrete element method. Curr. Sci. 2004, 87, 1379–1387. [Google Scholar]
  10. Mohtar, C.S.E.; Drnevich, V.P.; Santagata, M.; Bobet, A. Combined resonant column and cyclic triaxial tests for measuring undrained shear modulus reduction of sand with plastic fines. Geotech. Test. J. 2013, 36, 1–9. [Google Scholar] [CrossRef] [Green Version]
  11. Okur, D.V.; Ansal, A. Stiffness degradation of natural fine grained soils during cyclic loading. Soil Dyn. Earthq. Eng. 2007, 27, 843–854. [Google Scholar] [CrossRef]
  12. Rienzo, F.; Oreste, P.; Pelizza, S. Subsurface geological-geotechnical modeling to sustain underground civil planning. Eng. Geol. 2008, 96, 187–204. [Google Scholar] [CrossRef]
  13. Aloisio, A.; Totani, F.; Totani, G. Experimental dispersion curves of non-penetrable soils from direct dynamic measurements using the seismic dilatometer (SDMT). Soil Dyn. Earthq. Eng. 2021, 143, 106616. [Google Scholar] [CrossRef]
  14. Tafili, M.; Duque, J.; Ochmański, M.; Mašín, D.; Wichtmann, T. Numerical inspection of Miner’s rule and drained cyclic preloading effects on fine-grained soils. Comput. Geotech. 2023, 156, 105310. [Google Scholar] [CrossRef]
  15. Kramer, S.L. Geotechnical Earthquake Engineering; Hall, W.J., Ed.; Prentice Hall: London, UK, 1996. [Google Scholar]
  16. Ansal, A.M.; Iyisan, R.; Yildirim, H.T. The cyclic behaviour of soils and effects of geotechnical factors in microzonation. Soil Dyn. Earthq. Eng. 2001, 21, 445–452. [Google Scholar] [CrossRef]
  17. Cao, Y.L.; Law, K.T. Energy dissipation and dynamic behaviour of clay under cyclic loading. Can. Geotech. J. 1992, 29, 103–111. [Google Scholar] [CrossRef]
  18. Gaitán-Serrano, J.F.; Ortiz-Pulido, M.P.; Camacho-Tauta, J.F. Shear modulus reduction curves of guayuriba sand by cyclic triaxial and bender element tests. In Proceedings of the Third International Conference on GEOMATE, Nagoya, Japan, 13–15 November 2013; pp. 1–6. [Google Scholar]
  19. Konrad, J.M.; Wagg, B.T. Undrained cyclic loading of anisotropically consolidated clayey silts. J. Geotech. Eng. 1993, 119, 929–949. [Google Scholar] [CrossRef]
  20. Li, L.L.; Dan, H.B.; Wang, L.Z. Undrained behavior of natural marine clay under cyclic loading. Ocean. Eng. 1996, 38, 1792–1805. [Google Scholar] [CrossRef]
  21. O’Reilly, M.P.; Brown, S.F.; Overy, R.F. Cyclic loading of silty clay with drainage periods. J. Geotech. Eng. 1991, 117, 354–362. [Google Scholar] [CrossRef]
  22. Thirugnanasampanther, S. Cyclic Behaviour and Dynamic Properties of Soils Under Simple Shear Loading. Ph.D. Thesis, University of East London, London, UK, 2016. [Google Scholar]
  23. Hardin, B.O.; Drnevich, V.P. Shear modulus and damping in soils: Measurement and parameter effects. J. Soil Mech. Found. 1972, 98, 603–624. [Google Scholar] [CrossRef]
  24. Ishihara, K. Liquefaction and flow failure during earthquakes. Geotechnique 1993, 43, 351–415. [Google Scholar] [CrossRef]
  25. Seed, H.B.; Robert, T.; Wong, I.; Idriss, M.; Tokimatsu, K. Moduli and Factors for Dynamic Analyses of Cohesion Less Soils; University of California: Berkeley, CA, USA, 1984. [Google Scholar]
  26. Brennan, A.J.; Thusyanthan, N.I.; Madabhushi, S.P.G. Evaluation of shear modulus and damping in dynamic centrifuge tests. J. Geotech. Geoenviron. Eng. 2005, 131, 1488–1497. [Google Scholar] [CrossRef] [Green Version]
  27. Kiku, H.; Yoshida, N. Dynamic deformation property tests at large strains. Earthq. Eng. 2000, 1748, 1–13. [Google Scholar]
  28. Hussain, A.; Yeat, R.S. Active faulting in the southern Peshawar basin, Pakistan. Geol. Bull. Univ. Peshawar 2002, 35, 113–124. [Google Scholar]
  29. Janjuhah, H.T.; Ishfaque, M.; Mehmood, M.I.; Kontakiotis, G.; Shahzad, S.M.; Zarkogiannis, S.D. Integrated Underground Mining Hazard Assessment, Management, Environmental Monitoring, and Policy Control in Pakistan. Sustainability 2021, 13, 13505. [Google Scholar] [CrossRef]
  30. Yasir, M.; Ahmed, W.; Islam, I.; Sajid, M.; Janjuhah, H.T.; Kontakiotis, G. Composition, Texture, and Weathering Controls on the Physical and Strength Properties of Selected Intrusive Igneous Rocks from Northern Pakistan. Geosciences 2022, 12, 273. [Google Scholar] [CrossRef]
  31. Bilal, A.; Mughal, M.S.; Janjuhah, H.T.; Ali, J.; Niaz, A.; Kontakiotis, G.; Antonarakou, A.; Usman, M.; Hussain, S.A.; Yang, R. Petrography and Provenance of the Sub-Himalayan Kuldana Formation: Implications for Tectonic Setting and Palaeoclimatic Conditions. Minerals 2022, 12, 794. [Google Scholar] [CrossRef]
  32. Mateen, A.; Wahid, A.; Janjuhah, H.T.; Mughal, M.S.; Ali, S.H.; Siddiqui, N.A.; Shafique, M.A.; Koumoutsakou, O.; Kontakiotis, G. Petrographic and Geochemical Analysis of Indus Sediments: Implications for Placer Gold Deposits, Peshawar Basin, NW Himalaya, Pakistan. Minerals 2022, 12, 1059. [Google Scholar] [CrossRef]
  33. Zaheer, M.; Khan, M.R.; Mughal, M.S.; Janjuhah, H.T.; Makri, P.; Kontakiotis, G. Petrography and Lithofacies of the Siwalik Group in the Core of Hazara-Kashmir Syntaxis: Implications for Middle Stage Himalayan Orogeny and Paleoclimatic Conditions. Minerals 2022, 12, 1055. [Google Scholar] [CrossRef]
  34. Khwaja, A.A.; Jan, M.Q. The 8 October 2005 Muzaffarabad earthquake: Preliminary seismological investigations and probabilistic estimation of peak ground accelerations. Curr. Sci. 2008, 1158–1166. [Google Scholar]
  35. Seed, H.B.; Idriss, K.M. Soil moduli and damping factors for dynamic response analyses. Report No. EERC 70-10. Earthq. Eng. Res. Cent. 1970. [Google Scholar]
  36. Shafiee, A.; Ghate, R. Shear Modulus and Damping Ratio in Aggregate-Clay Mixtures: An Experimental Study Versus ANNs Prediction. J. Appl. Sci. 2008, 8, 3068–3082. [Google Scholar] [CrossRef] [Green Version]
  37. Ghayoomi, M.; Suprunenko, G.; Mirshekari, M. Cyclic Triaxial Test to Measure Strain-Dependent Shear Modulus of Unsaturated Sand. Int. J. Geomech. 2017, 17, 11. [Google Scholar] [CrossRef] [Green Version]
  38. Kokusho, T. Cyclic Triaxial Test of Dynamic Soil Properties for Wide Strain Range. Soils Found. 1980, 20, 45–60. [Google Scholar] [CrossRef] [PubMed] [Green Version]
  39. Govindaraju, L. Liquefaction and Dynamic Properties of Sandy Soils. Unpublished. Ph.D. Thesis, Department of Civil Engineering, Indian Institute of Science, Bangalore, India, 2005. [Google Scholar]
  40. Hanumantharao, C.; Ramana, G.V. Dynamic soil properties for microzonation of Delhi, India. J. Earth Syst. Sci. 2008, 117, 719–730. [Google Scholar] [CrossRef]
  41. Chattaraj, R.; Sengupta, A. Liquefaction potential and strain dependent dynamic properties of Kasai River sand. Soil Dyn. Earthq. Eng. 2016, 90, 467–475. [Google Scholar] [CrossRef]
  42. Kirar, B.; Maheshwari, B.K. Effects of Silt Content on Dynamic Properties of Solani Sand. In Proceedings of the 7th Conference of the International Conference on Case Histories in Geotechnical Engineering, Chicago, IL, USA, 29 April–4 May 2013. [Google Scholar]
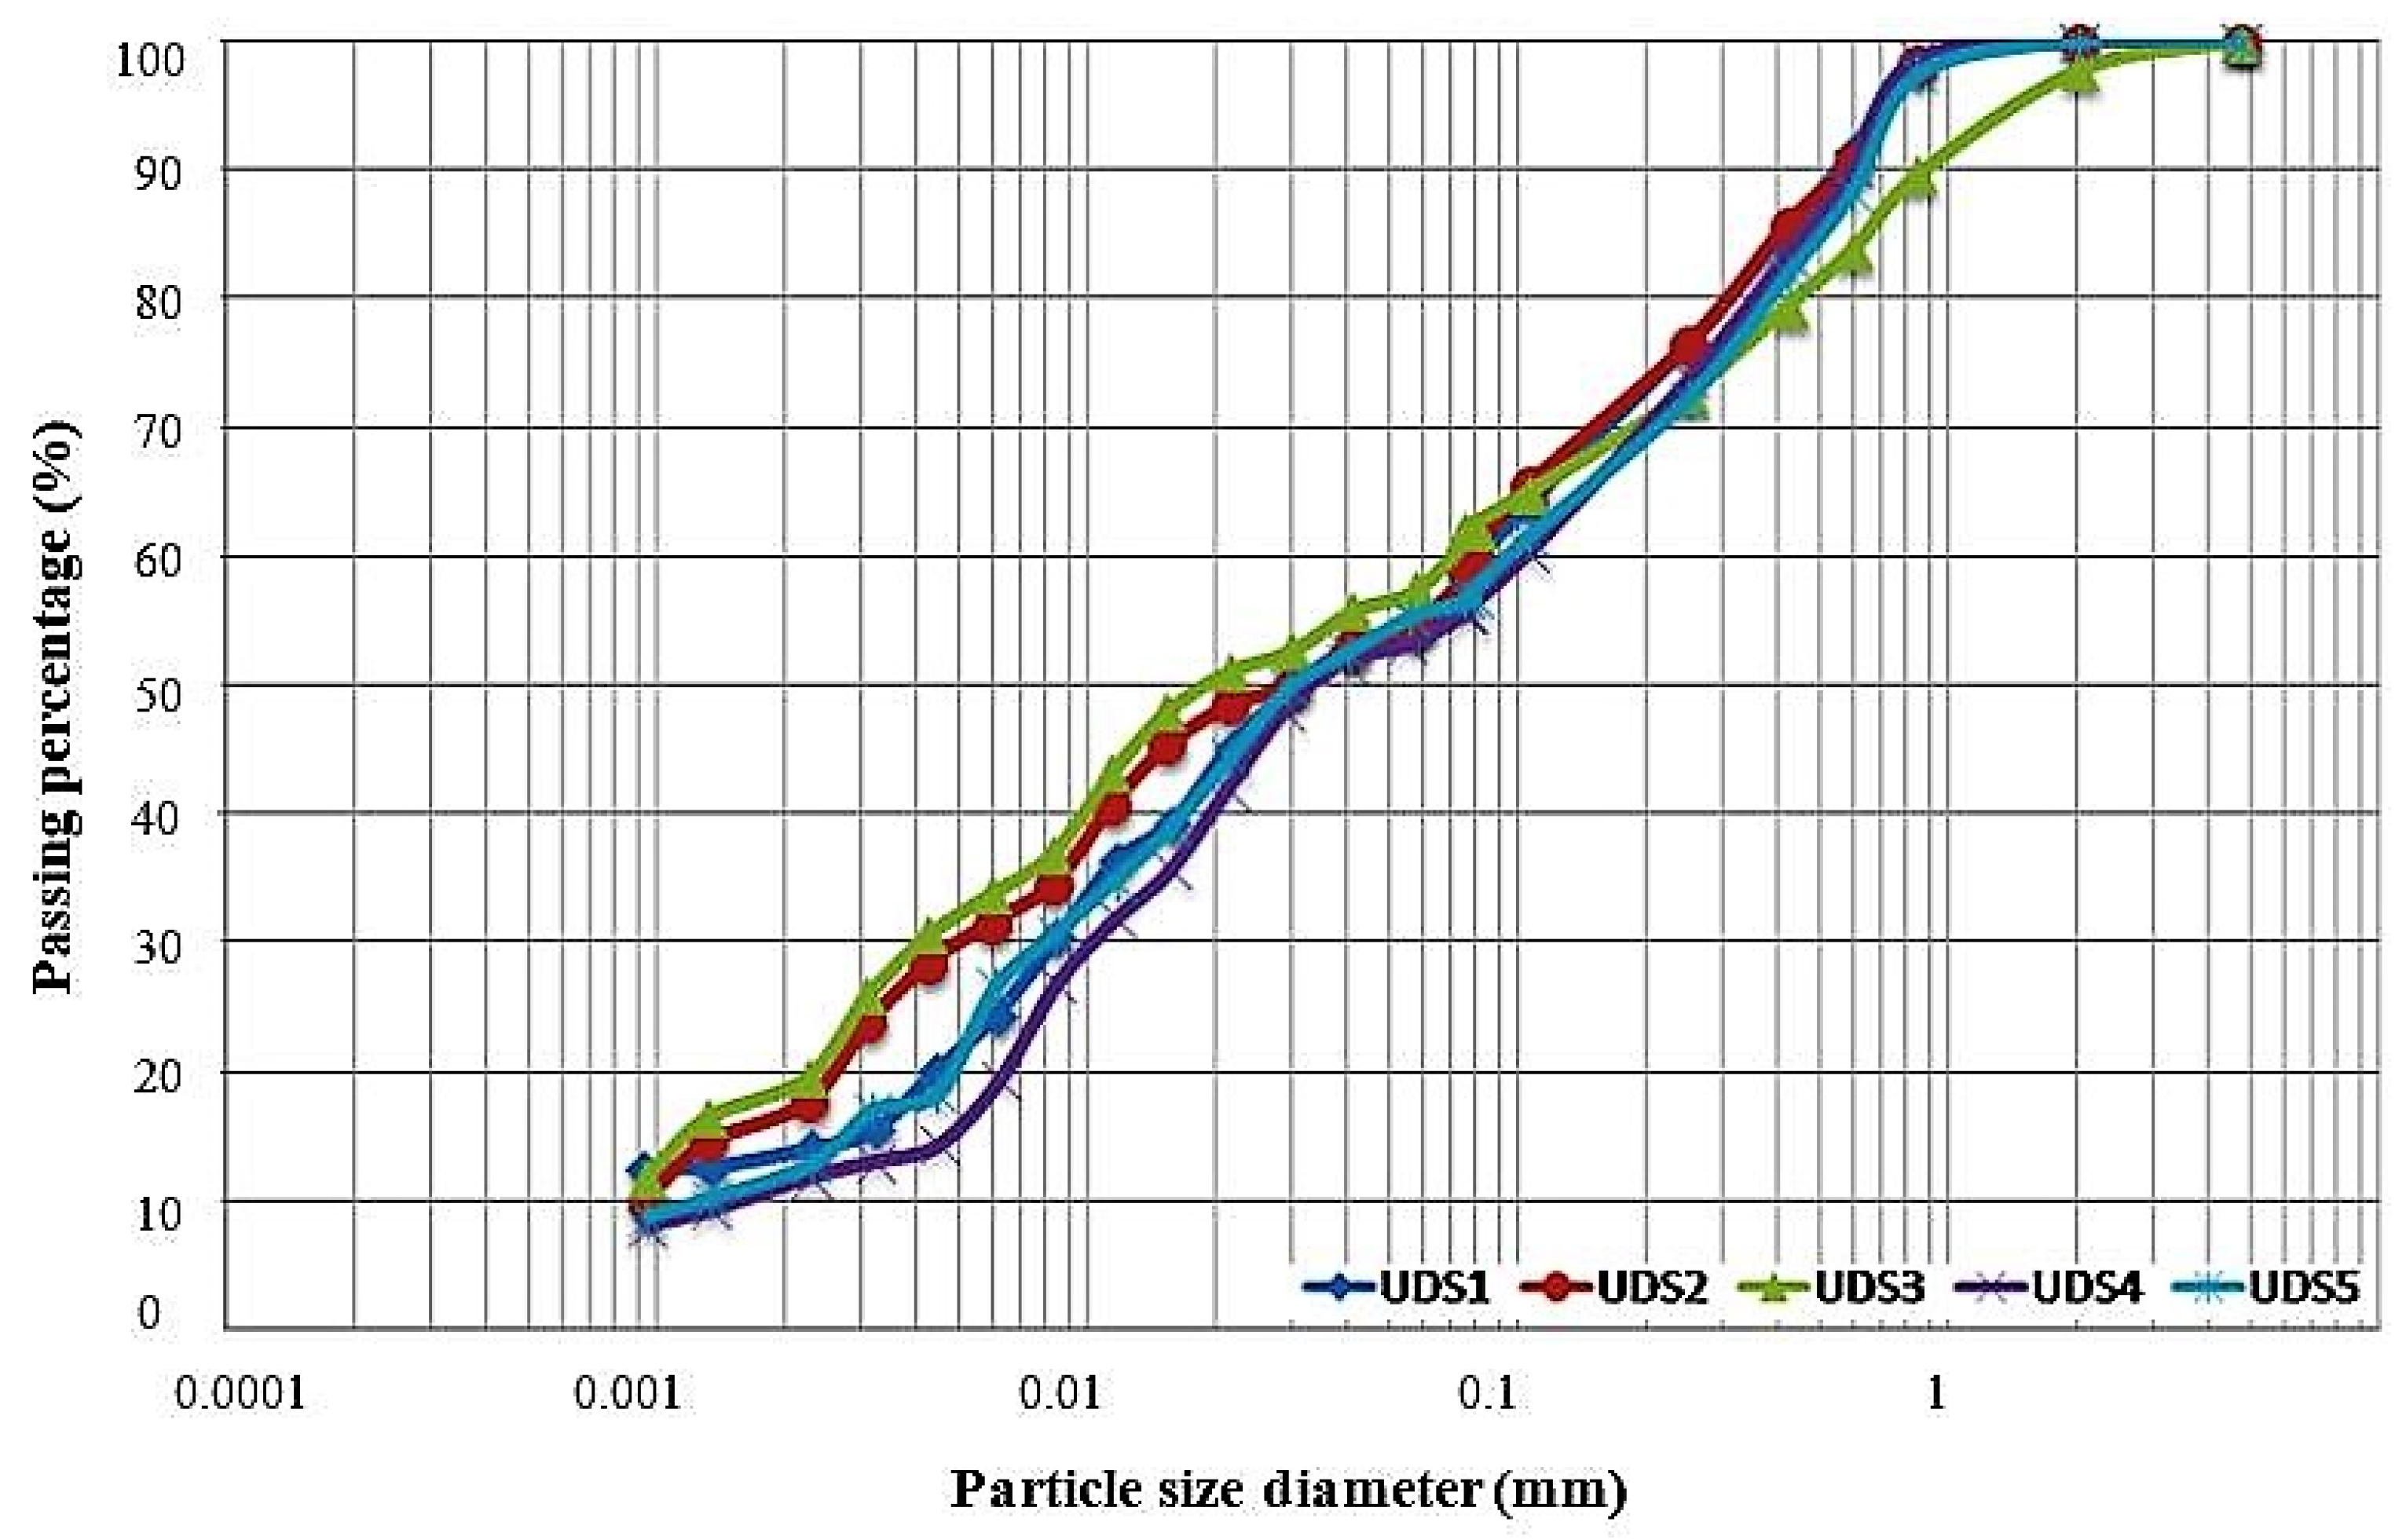
Figure 1. Grain size distribution curve of soil samples from each Borehole.
Geosciences 13 00204 g001
Figure 2. The Cyclic Triaxial setup and its parts.
Geosciences 13 00204 g002
Figure 3. Test result plot at 1% strain, frequency 1 Hz, and C.P 150 kPa. (a) Axial Strain vs. N. (b), Deviator stress vs. N. (c), Stress vs. strain. (d), Excess PWP ratio vs. N.
Geosciences 13 00204 g003aGeosciences 13 00204 g003b
Figure 4. Hysteresis loops of shear stress vs. shear strain of UdS1 for 150 kPa.
Geosciences 13 00204 g004
Figure 5. Symmetrical hysteresis to calculate shear modulus and damping ration [8].
Geosciences 13 00204 g005
Figure 6. The values of SM vs. number of cycles of UDS1 at different confining pressures.
Geosciences 13 00204 g006
Figure 7. The values of DR vs. number of cycles of UDS1 at different confining pressures.
Geosciences 13 00204 g007
Figure 8. Shear modulus vs. shear strain of all the samples.
Geosciences 13 00204 g008
Figure 9. Modulus degradation curve G/Gmax vs. shear strain of all the samples.
Geosciences 13 00204 g009
Figure 10. Damping ratio vs. shear strain of all the samples.
Geosciences 13 00204 g010
Figure 11. The value of G/Gmax of different soils from the available literature [3,8,35,38,39,40,41,42].
Geosciences 13 00204 g011
Figure 12. The value of DR of different soils from the available literature [3,8,35,38,39,40,41,42].
Geosciences 13 00204 g012
Table 1. Summary of index properties and soil classifications.
SampleMoisture Content (%)Specific GravityLiquid Limit (LL)(%)Plastic Limit (PL)(%)Plasticity Index
LL-PL
Passing Percentage
No. 200
Group SymbolSoil Type
UDS114.82.6822.917.195.7158.6CL-MLSandy Silty Clay
UDS215.82.7023.6716.76.9759.3CL-MLSandy Silty Clay
UDS315.92.7221.717.34.462.1CL-MLSandy Silty Clay
UDS411.62.6926.0822.034.0555.6CL-MLSandy Silty Clay
UDS512.32.6929.724.45.356.7CL-MLSandy Silty Clay
Table 2. Testing program to perform the cyclic triaxial test.
SampleConfining Pressure, kPaStrains %
UDS1UDS1a1500.2, 1, 2, 2.5 and 5
UDS1b200
UDS1c300
UDS2UDS2a1500.2, 1, 2, 2.5 and 5
UDS2b200
UDS2c300
UDS3UDS3a1500.2, 1, 2, 2.5 and 5
UDS3b200
UDS3c300
UDS4UDS4a1500.2, 1, 2, 2.5 and 5
UDS4b200
UDS4c300
UDS5UDS5a1500.2, 1, 2, 2.5 and 5
UDS5b200
UDS5c300
Table 3. Average and Gmax values of shear modulus.
G(Avg.)Gmax
Strains(%)0.2122.550.2122.55
UDS16.431.770.850.630.526.762.881.531.231.20
UDS27.402.521.431.080.767.953.392.161.731.29
UDS37.461.810.940.670.407.813.321.761.300.90
UDS47.752.511.401.040.578.363.522.211.680.99
UDS57.782.231.110.750.518.433.231.931.471.11
UDS17.522.471.180.890.618.594.782.401.831.38
UDS211.083.281.571.110.8213.005.012.902.251.85
UDS310.252.471.110.720.5011.054.492.371.701.29
UDS48.682.621.471.150.789.743.732.471.991.31
UDS59.242.851.721.340.8010.534.112.642.351.78
UDS110.813.571.931.410.9312.194.662.832.311.57
UDS215.824.262.151.541.0716.896.884.343.432.96
UDS313.653.151.571.130.8615.165.382.882.201.74
UDS415.435.022.561.921.3018.187.194.233.272.23
UDS513.405.271.841.290.7213.728.523.352.581.56
Table 4. Average values of DR (%) at 150, 200, and 300 KPa.
Strains(%)0.2122.55
150 kPa
UDS112.4013.2411.0510.4111.27
UDS213.1914.4312.7011.1210.47
UDS312.2213.5411.5910.099.23
UDS412.2114.0112.4711.0711.06
UDS513.2015.3012.6710.8810.82
200 kPa
UDS19.8414.4713.4213.4315.76
UDS213.6314.7312.0810.349.59
UDS313.8514.2611.319.749.73
UDS413.4514.3712.8111.5111.72
UDS513.7613.9212.3411.3111.62
300 kPa
UDS112.9715.6114.4113.0413.17
UDS213.7814.8712.7311.2311.80
UDS315.3315.2511.979.929.41
UDS412.6814.5313.2912.6514.77
UDS512.7915.3612.4210.8710.04
Disclaimer/Publisher’s Note: The statements, opinions and data contained in all publications are solely those of the individual author(s) and contributor(s) and not of MDPI and/or the editor(s). MDPI and/or the editor(s) disclaim responsibility for any injury to people or property resulting from any ideas, methods, instructions or products referred to in the content.