Article

Groundwater Quality Variations in Multiple Aquifers: A Comprehensive Evaluation for Public Health and Agricultural Use

by
Jeerapong Laonamsai
1,2,*,
Veeraphat Pawana
1,
Phupha Chipthamlong
1,
Phornsuda Chomcheawchan
1,
Kiattipong Kamdee
3,
Bounhome Kimmany
4 and
Phongthorn Julphunthong
1,5
1
Department of Civil Engineering, Faculty of Engineering, Naresuan University, Phitsanulok 65000, Thailand
2
Water Resources Research Center, Faculty of Engineering, Naresuan University, Phitsanulok 65000, Thailand
3
Thailand Institute of Nuclear Technology, Nakonnayok 26120, Thailand
4
Department of Meteorology and Hydrology, Faculty of Water Resources, National University of Laos, Vientiane 01010, Laos
5
Research Center for Academic Excellence in Applied Physics, Faculty of Science, Naresuan University, Phitsanulok 65000, Thailand
*
Author to whom correspondence should be addressed.
Geosciences 2023, 13(7), 195; https://doi.org/10.3390/geosciences13070195
Submission received: 25 May 2023 / Revised: 22 June 2023 / Accepted: 26 June 2023 / Published: 27 June 2023
(This article belongs to the Topic Groundwater Pollution Control and Groundwater Management)

Abstract

:
Understanding hydrological and hydrochemical processes is crucial for the effective management and protection of groundwater resources. This study conducted a comprehensive investigation into hydrochemical processes and variations in groundwater quality across five distinct aquifers in Phra Nakhon Si Ayutthaya, Thailand: Bangkok (BKK), Phra Pradaeng (PPD), Nakhon Luang (NKL), Nonthaburi (NTB), and Sam Khok (SK). Utilizing various diagrams, the findings revealed that high levels of sodium and salinity in shallow aquifers (BKK and PPD) were found which can impede soil permeability and have potential consequences on crop yields. The presence of four distinct types of groundwater—Na-Cl, Na-HCO3, Ca-Cl, and Ca-HCO3—suggests the influence of rock weathering, mineral dissolution, and ion exchange reactions with the surrounding geological formations, controlling the chemistry in the groundwater basin. The research also highlights concerns regarding groundwater quality, particularly elevated concentrations of heavy metals (e.g., Zn, Hg, Pd, Fe, and Mn) exceeding safe drinking water guidelines established by the World Health Organization (WHO) in certain samples. The evaluation of water suitability for consumption and irrigation using the Water Quality Index (WQI) and Wilcox diagram reveals a predominance of “poor” or “unsuitable” categorizations. Untreated sewage discharge and fertilizer usage were identified as the primary anthropogenic activities affecting hydrochemical processes in groundwater. These findings emphasize the need for continuous monitoring, appropriate management, and remediation efforts to mitigate potential hazards.

1. Introduction

Groundwater is particularly valued for its relatively pure nature compared to surface water [1,2]. This water resource plays a crucial role in the domestic, agricultural, and industrial sectors [3,4], especially during the post-monsoon season. However, aquifers are increasingly facing threats of contamination as a result of factors such as industrial growth and urbanization, leading to health risks [5,6,7,8,9]. Given these threats, it is imperative to establish regular processes for monitoring water quality. Consequently, the identification and mitigation of associated health risks become urgent tasks for environmental and medical geochemists [7,10,11].
Geogenic sources, such as rock leaching and weathering, and anthropogenic activities, like metal mining, smelting, fossil fuel combustion, pesticide use, and sewage sludge, have led to the accumulation of heavy metals in the soil and groundwater, including arsenic and lead [12,13,14]. Prolonged exposure to these metals through drinking water can result in various health issues, such as cancer, neurological disorders, developmental problems, and organ damage. Additionally, certain geological formations may contain radioactive elements like uranium or radon, which can seep into groundwater, increasing the risk of cancer and radiation-related health problems [15]. Natural pollutants, like fluoride, can also be present in groundwater due to chemical processes along its hydrogeological path [13]. Elevated fluoride levels in groundwater can cause dental and skeletal fluorosis. Geogenic pollutants can increase the salinity and mineral content of groundwater, negatively impacting plant growth and crop yield. Excessive salts, boron, selenium, and heavy metals can be toxic to plants, inhibiting nutrient uptake, photosynthesis, and causing cellular damage, ultimately leading to stunted growth, reduced crop quality, and crop failure [16].
Industrial processes and waste disposal are significant sources of heavy metal release into the environment [17,18,19,20]. Areas with high industrial concentrations often face water pollution as heavy-metal-containing wastewater infiltrates aquifers [21]. Health risks associated with heavy metal exposure include growth retardation and cancer development [22,23]. Ingestion or inhalation of lead-contaminated water or soil can cause neurological damage, developmental issues, anemia, and impaired kidney function [24]. Prolonged exposure to cadmium-contaminated water or crops can result in kidney damage, lung disease, and an increased risk of cancer [24]. Consumption of mercury-contaminated water or fish can lead to neurological damage, impaired cognitive function, and developmental issues in children. Chromium (Cr), released by metal plating, tanneries, and stainless-steel production, poses particular harm, increasing the risk of lung cancer, respiratory issues, liver damage, and skin problems [25,26]. Arsenic in groundwater poses health risks, including skin lesions, cardiovascular diseases, neurological effects, and an increased risk of cancer [7,10,24]. Arsenic accumulation in crops hampers growth, reduces yield, and poses a food safety risk [25].
In Phra Nakhon Si Ayutthaya, Thailand, there is significant concern regarding industrial and agricultural pollution. As a major rice-producing area, intensive agriculture in this region can result in the leaching of agrochemicals, such as pesticides and fertilizers, into groundwater, leading to water contamination and elevated nitrate levels, which pose risks to human health and the environment [27,28]. Industrial activities and urban development also contribute to groundwater pollution, with industrial effluents often containing heavy metals and other hazardous substances, while urban runoff carries pollutants such as oils, heavy metals, and chemicals into groundwater sources. Additionally, naturally occurring geogenic contaminants, such as arsenic or fluoride, can be present in elevated levels in groundwater [14], posing health risks if consumed. Therefore, a large population in the area is at risk of consuming contaminated water. Monitoring environmental hazards over time is crucial for understanding changes in contamination levels.
The objective of this study is to assess the impact of industrialization and agricultural practices, particularly fertilizer use, on groundwater quality in rapidly developing industrial regions. The research aims to answer the following question: What are the main hydrochemical characteristics and variations in groundwater quality across multiple aquifers in Phra Nakhon Si Ayutthaya, Thailand, and how do these variations affect public health and agricultural use? The central focus of this investigation is to examine the pressure exerted on the region’s geological resources, specifically groundwater, due to the increasing use of fertilizers and the expansion of industrial zones. Various industries are assumed to gradually introduce pollutants into the environment, significantly affecting groundwater quality. The assumption is that these harmful substances can permeate into groundwater and contaminate the food chain, potentially leading to health complications if the water is consumed without treatment. This research aims to thoroughly analyze pollution levels and identify the most critical contaminants as a starting point. The study’s objectives include raising awareness and implementing proactive measures to mitigate potential health risks based on the continuous assessment of pollution impacts.

2. Materials and Methods

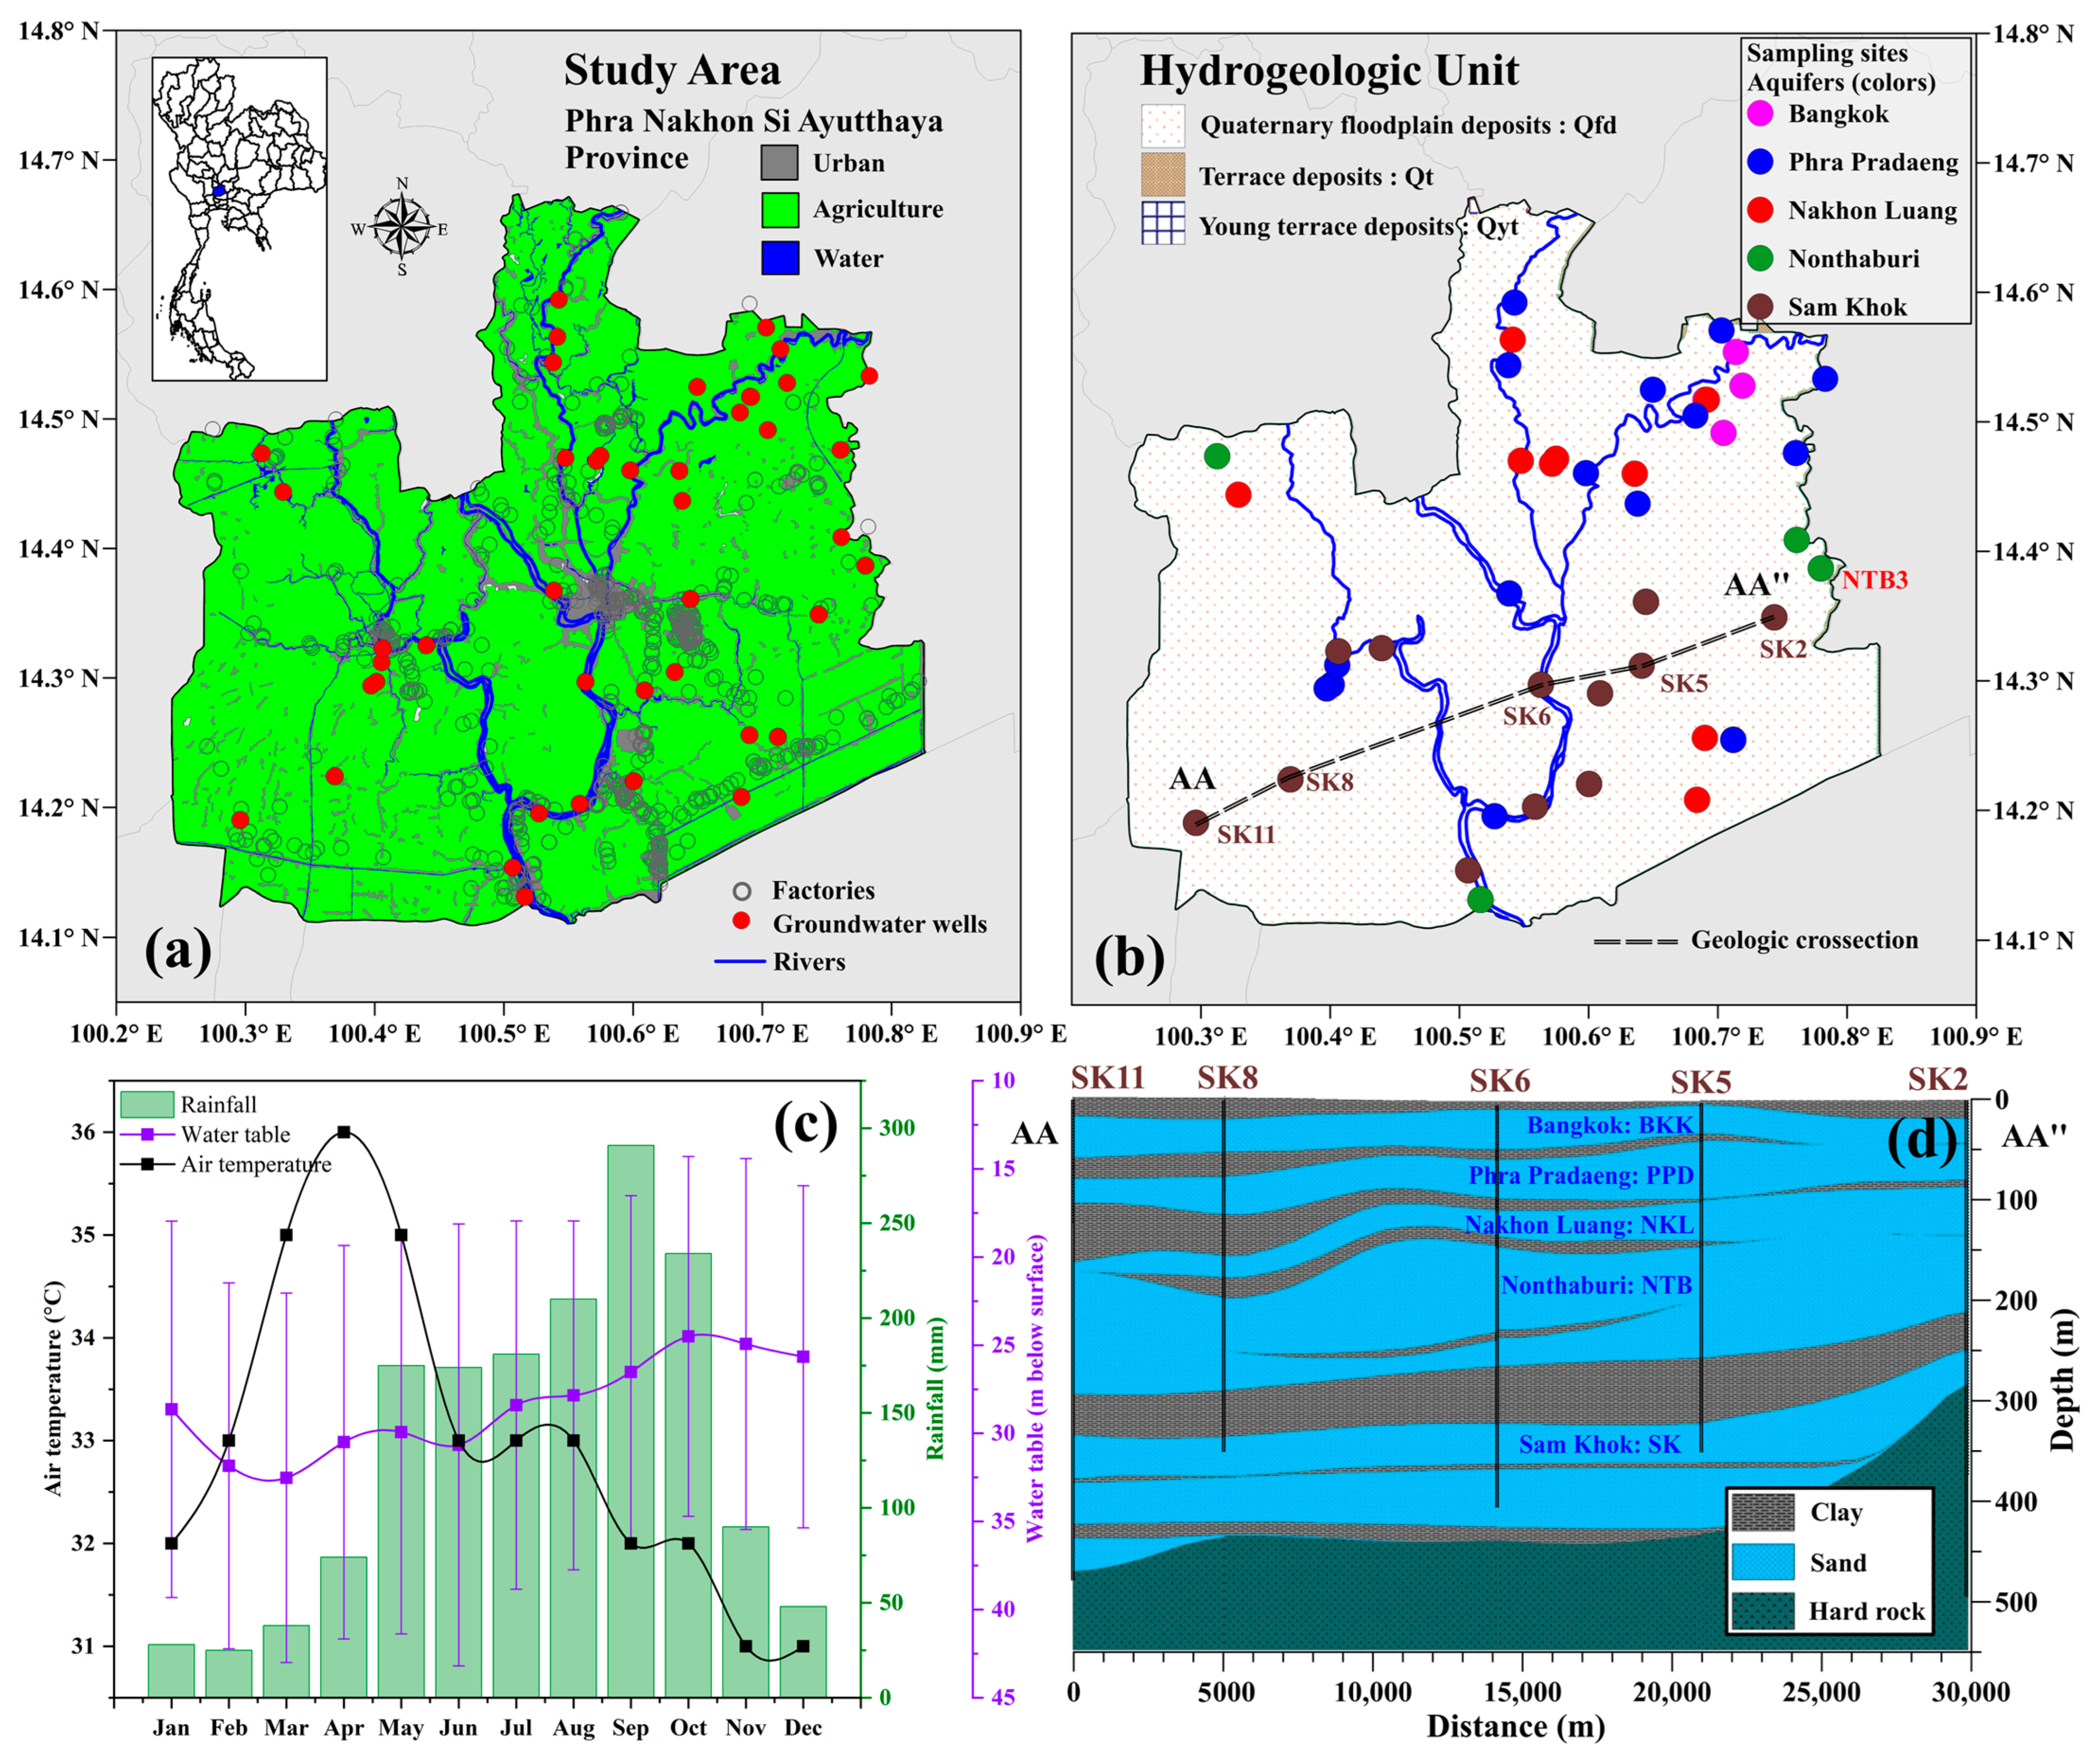
2.1. Study Area and Climate Conditions

The study area is located in Phra Nakhon Si Ayutthaya Province (Figure 1a), situated in the quaternary floodplains (Qfd) of central Thailand (Figure 1b), approximately 76 km north of the coast. The province lies between longitudes 100.2° E and 100.8° E and latitudes 14.1° N and 14.7° N, sharing its borders with several other provinces.
A total of 92 wells distributed over the area were observed. It covers an area of approximately 2501 km2. Phra Nakhon Si Ayutthaya, like much of Thailand, experiences a tropical monsoon climate [30,31]. The region has three primary seasons: summer from March to May, the rainy season from June to October, and winter from November to February. Summer temperatures can reach up to 35–40 °C, while during the winter, they typically range between 20 and 30 °C. The average annual rainfall (1993–2022) is approximately 1215 to 1432 mm, with heavy rain falling during the monsoon season, peaking around September (Figure 1c). Monthly rainfall can significantly vary, with minimal precipitation in summer and potentially over 200 mm per month at the height of the rainy season. Groundwater levels in the region are typically high (averaging 26.51 ± 9.77 m below the earth’s surface) due to the flat topography and abundant rainfall. However, these levels can fluctuate throughout the year in response to rainfall patterns, with a one-month lag time [27], and extraction for irrigation and other uses. The water table tends to be at its highest at the end of the rainy season and gradually declines through summer until it is recharged by the rains again.
This study area, predominantly flat, is characterized by the central river basin of the Chao Phraya River, a significant waterway for both transportation and irrigation. Numerous smaller rivers and canals branching off from the Chao Phraya River have created a fertile, well-irrigated area, ideal for agriculture. The region’s alluvial soils, combined with its tropical monsoon climate, support a variety of agricultural activities, with rice and coconut farming being the most prevalent. This area is also a vital hub of industry. Major industrial estates include the Rojana Industrial Park, Hi-Tech Industrial Estate, and Bang Pa-In Industrial Estate, hosting a variety of manufacturing units ranging from automotive, electronics, leather, and textile industries to food processing and packaging units. While the province is extensively utilized for agriculture (64%) and industry, there is also a significant amount of land used for residential areas, especially in and around urban centers. However, the province faces environmental challenges related to land use and industrialization, such as water pollution due to untreated industrial waste, soil degradation, and urban encroachment onto agricultural and natural lands [32].

2.2. Hydrogeological Settings

The hydrogeology of Phra Nakhon Si Ayutthaya, situated within the floodplain deposits of the Chao Phraya River basin, comprises a complex and distinct layered aquifer system (Figure 1d). This system consists of vertically arranged aquifers, each with its own unique properties and varying degrees of hydraulic interconnectivity [33]. The shallowest layer, known as the Bangkok aquifer (BKK), extends up to 50 m and primarily consists of alluvial deposits from the Holocene age. The BKK aquifer serves as the primary source of groundwater for domestic and agricultural purposes [34]. Below the BKK aquifer lies the Phra Pradaeng aquifer (PPD), situated between 51 and 100 m. Composed of older alluvial deposits from the Pleistocene age, the PPD aquifer functions as a significant water storage unit [34,35]. The Nakhon Luang aquifer (NKL), which extends from 101 to 150 m, consists of Tertiary sediments, both marine and non-marine, and is typically confined due to overlying impermeable layers [36]. The Nonthaburi aquifer (NTB) follows, ranging from 151 to 200 m and composed of late Pleistocene age sand and clay layers [36]. The hydrological characteristics of the NTB aquifer can vary widely. Lastly, the deepest layer is the Sam Khok aquifer (SK), stretching from 201 to 350 m and composed of early Tertiary marine sediments [36]. These aquifers receive recharge from rainfall and river infiltration, and they discharge into the rivers and canals [3]. Groundwater flow generally follows the surface topography, moving from the north and northeast toward the Chao Phraya River [37].

2.3. Sampling Collection

Water quality testing is a complex process involving multiple steps. Any missed or incorrectly executed step can compromise the entire test, making careful planning and understanding of the test’s specific objectives essential [38]. This study conforms to the standard procedures delineated by the American Public Health Association (APHA) [39] and the United States Salinity Laboratory (USSL) [40], ensuring precise groundwater sampling and analysis. In this specific study, the research involved collecting groundwater samples from hand-dug wells and boreholes dispersed across the province’s industrial areas. During the dry season (November 2022), a total of 92 samples were gathered from these industrial estates, supplemented by additional samples from agricultural regions within the same surrounding area (Figure 1a,b). Borehole distribution across each aquifer of the study area encompasses eighteen boreholes (20% of total boreholes) in the BKK aquifer, nineteen boreholes (21% of total boreholes) in the PPD aquifer, fifteen boreholes (16% of total boreholes) in the NTB aquifer, twenty-three boreholes (25% of total boreholes) in the NKL aquifer, and seventeen boreholes (18% of total boreholes) in the SK aquifer. Physical and chemical analysis samples were collected using a 2.5 L low-density polyethylene bottle. A separate 1 L container, immediately supplemented with 2 mL of concentrated HNO3 on-site, was utilized for metal content analysis. Prior to use, the containers designated for sampling underwent meticulous cleaning, rinsed five times with distilled water. The entire process employed chemicals of analytical grade.

2.4. Hydrogeochemical Analyses

On-site, immediate measurements were captured for appearance, pH, temperature (°C), electrical conductivity (μS/cm), and total dissolved solids (mg/L) of the water. Every sample received an accurate label, preparing it for subsequent laboratory analysis. Rigorous precautions were instituted to avoid contamination during the collection process. For instance, pH meter calibration using distilled water secured trustworthy readings. Likewise, sample bottles underwent meticulous rinsing, initially with distilled water, then with the water sample itself before collection.
A comprehensive assessment of water quality involved evaluating a wide range of parameters. These parameters included pH, temperature, electrical conductivity (EC), chloride (Cl), fluoride (F), total dissolved solids (TDS), nitrate (NO3), sulfate (SO4), phosphate (PO4), carbonate (CO3), bicarbonate (HCO3), calcium (Ca), magnesium (Mg), sodium (Na), potassium (K), and several heavy metals such as arsenic (As), cadmium (Cd), nickel (Ni), lead (Pb), selenium (Se), chromium (Cr), zinc (Zn), mercury (Hg), iron (Fe), and manganese (Mn). Established instrumental techniques and standard analytical methods were employed to identify and measure these physical and chemical parameters [39]. Ion chromatography mass spectrometry (IC) was used to analyze primary ions, while an atomic absorption spectrophotometer (AAS) was utilized for trace and heavy metal evaluation. The analytical error for both methods was kept below 5% and 10%, respectively. The data collected on various water quality parameters and heavy metals were then compared against the drinking water quality guidelines set by the World Health Organization (WHO) to ensure compliance [41].
Numerous scientific studies have documented various methodologies for evaluating groundwater quality [42,43,44]. These methodologies utilize the physical and chemical characteristics of water and have been applied in different settings to determine its suitability for drinking. The Water Quality Index (WQI) method, which employs a weighted arithmetic index, has been widely used in many studies to assess water potability [42,43,44,45]. This investigation followed a similar approach, integrating the weighted arithmetic index method along with traditional graphical methods such as Stiff [46], Durov [47], Wilcox [48], and USSL diagrams [40].
Additionally, a ternary plot was conducted to analyze the chemical properties of groundwater. This plot illustrates the distribution of major cations (Na, K, and Ca) and anions (Cl, SO4, and carbonate alkalinity) [49,50]. Carbonate alkalinity (Alkc, meq/L) represents the combined concentration of CO3 and HCO3 ions. Furthermore, a binary diagram of Cl and SO4+AlkC was utilized to provide information about the total ionic salinity (TIS, Σmeq/L). By comparing the position of each groundwater sample with the iso-Σmeq/L lines (lines with a slope of −1), the TIS value could be observed [51].
The World Health Organization’s guidelines for drinking water [41] served as a reference point against which the computed WQIs were measured. The WQI offers a simplified summary of water quality based on various chemical parameters and can be calculated using the following equation:
WQI = Σ (Wi × qi)
In this formula, “Wi” represents the relative weight of each parameter, and “qi” denotes the sub-index for each parameter (Table 1). The Wi is usually assigned based on the perceived importance (wi/Σwi, Table 1) of each parameter for water quality. The assigned weight (wi) to each parameter (between 1 and 5) was considered based on its relative importance to the overall quality of groundwater [52].
The sub-index or qi is typically computed by comparing the measured value (Ci) for each parameter with its respective guideline or standard (Si). Each qi was calculated using the following equation:
qi = (Ci/Si) × 100
where Ci is the observed concentration (mg/L) of each parameter in the groundwater sample, and Si is the standard guideline value (mg/L) for that parameter as set by a recognized authority, such as the World Health Organization (WHO) [41]. The resulting qi values are then scaled and summed to obtain the overall WQI. A WQI exceeding 300 indicates that the water is unsuitable for drinking [53].
Groundwater quality for irrigation applications was evaluated using various tools. The methodologies incorporated the United States Salinity Laboratory (USSL) diagram [40], the Wilcox diagram [48], and electrical conductivity (EC) values. Additionally, the calculation of essential agricultural indices, namely the sodium adsorption ratio (SAR) [40] and the sodium percentage (%Na) [54], was carried out. The SAR was calculated using the following equation:
SAR = [Na+]/√([Ca2+] + [Mg2+])/2
Here, the concentrations of sodium (Na+), calcium (Ca2+), and magnesium (Mg2+) are measured in milliequivalents per liter (meq/L). The sodium percentage (%Na) was computed using the following formula:
%Na = [Na+] × 100/([Ca2+] + [Mg2+] + [Na+] + [K+])
In this formula, potassium (K+) concentration is also considered, with all ion concentrations measured in meq/L. These methods, incorporated in the study for determining the suitability of water for irrigation, have been regarded as effective strategies in assessing the aptness of water for irrigation applications [54].

3. Results and Discussion

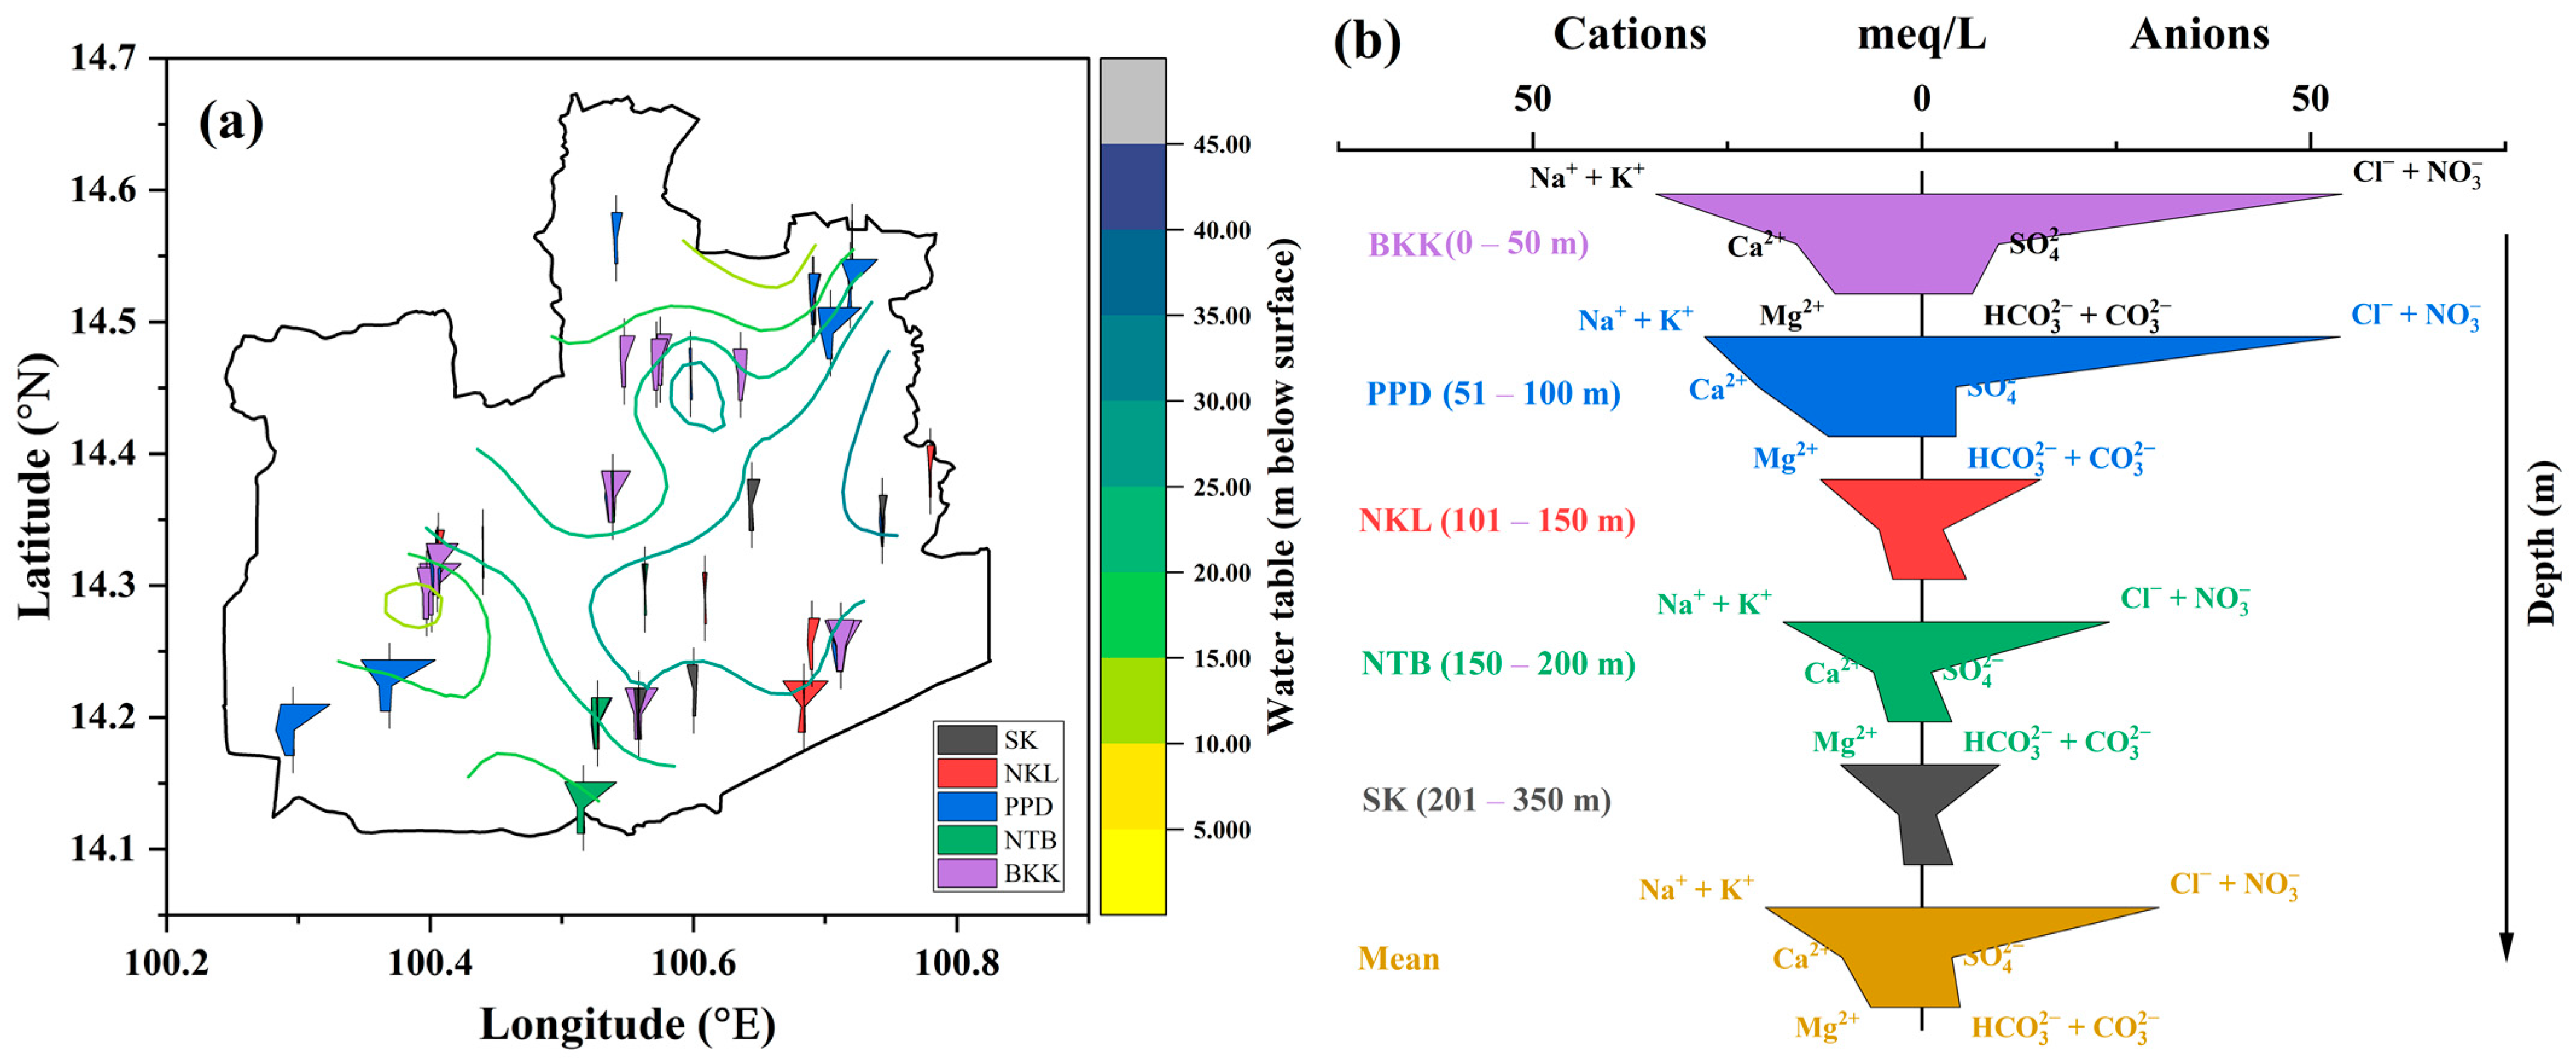
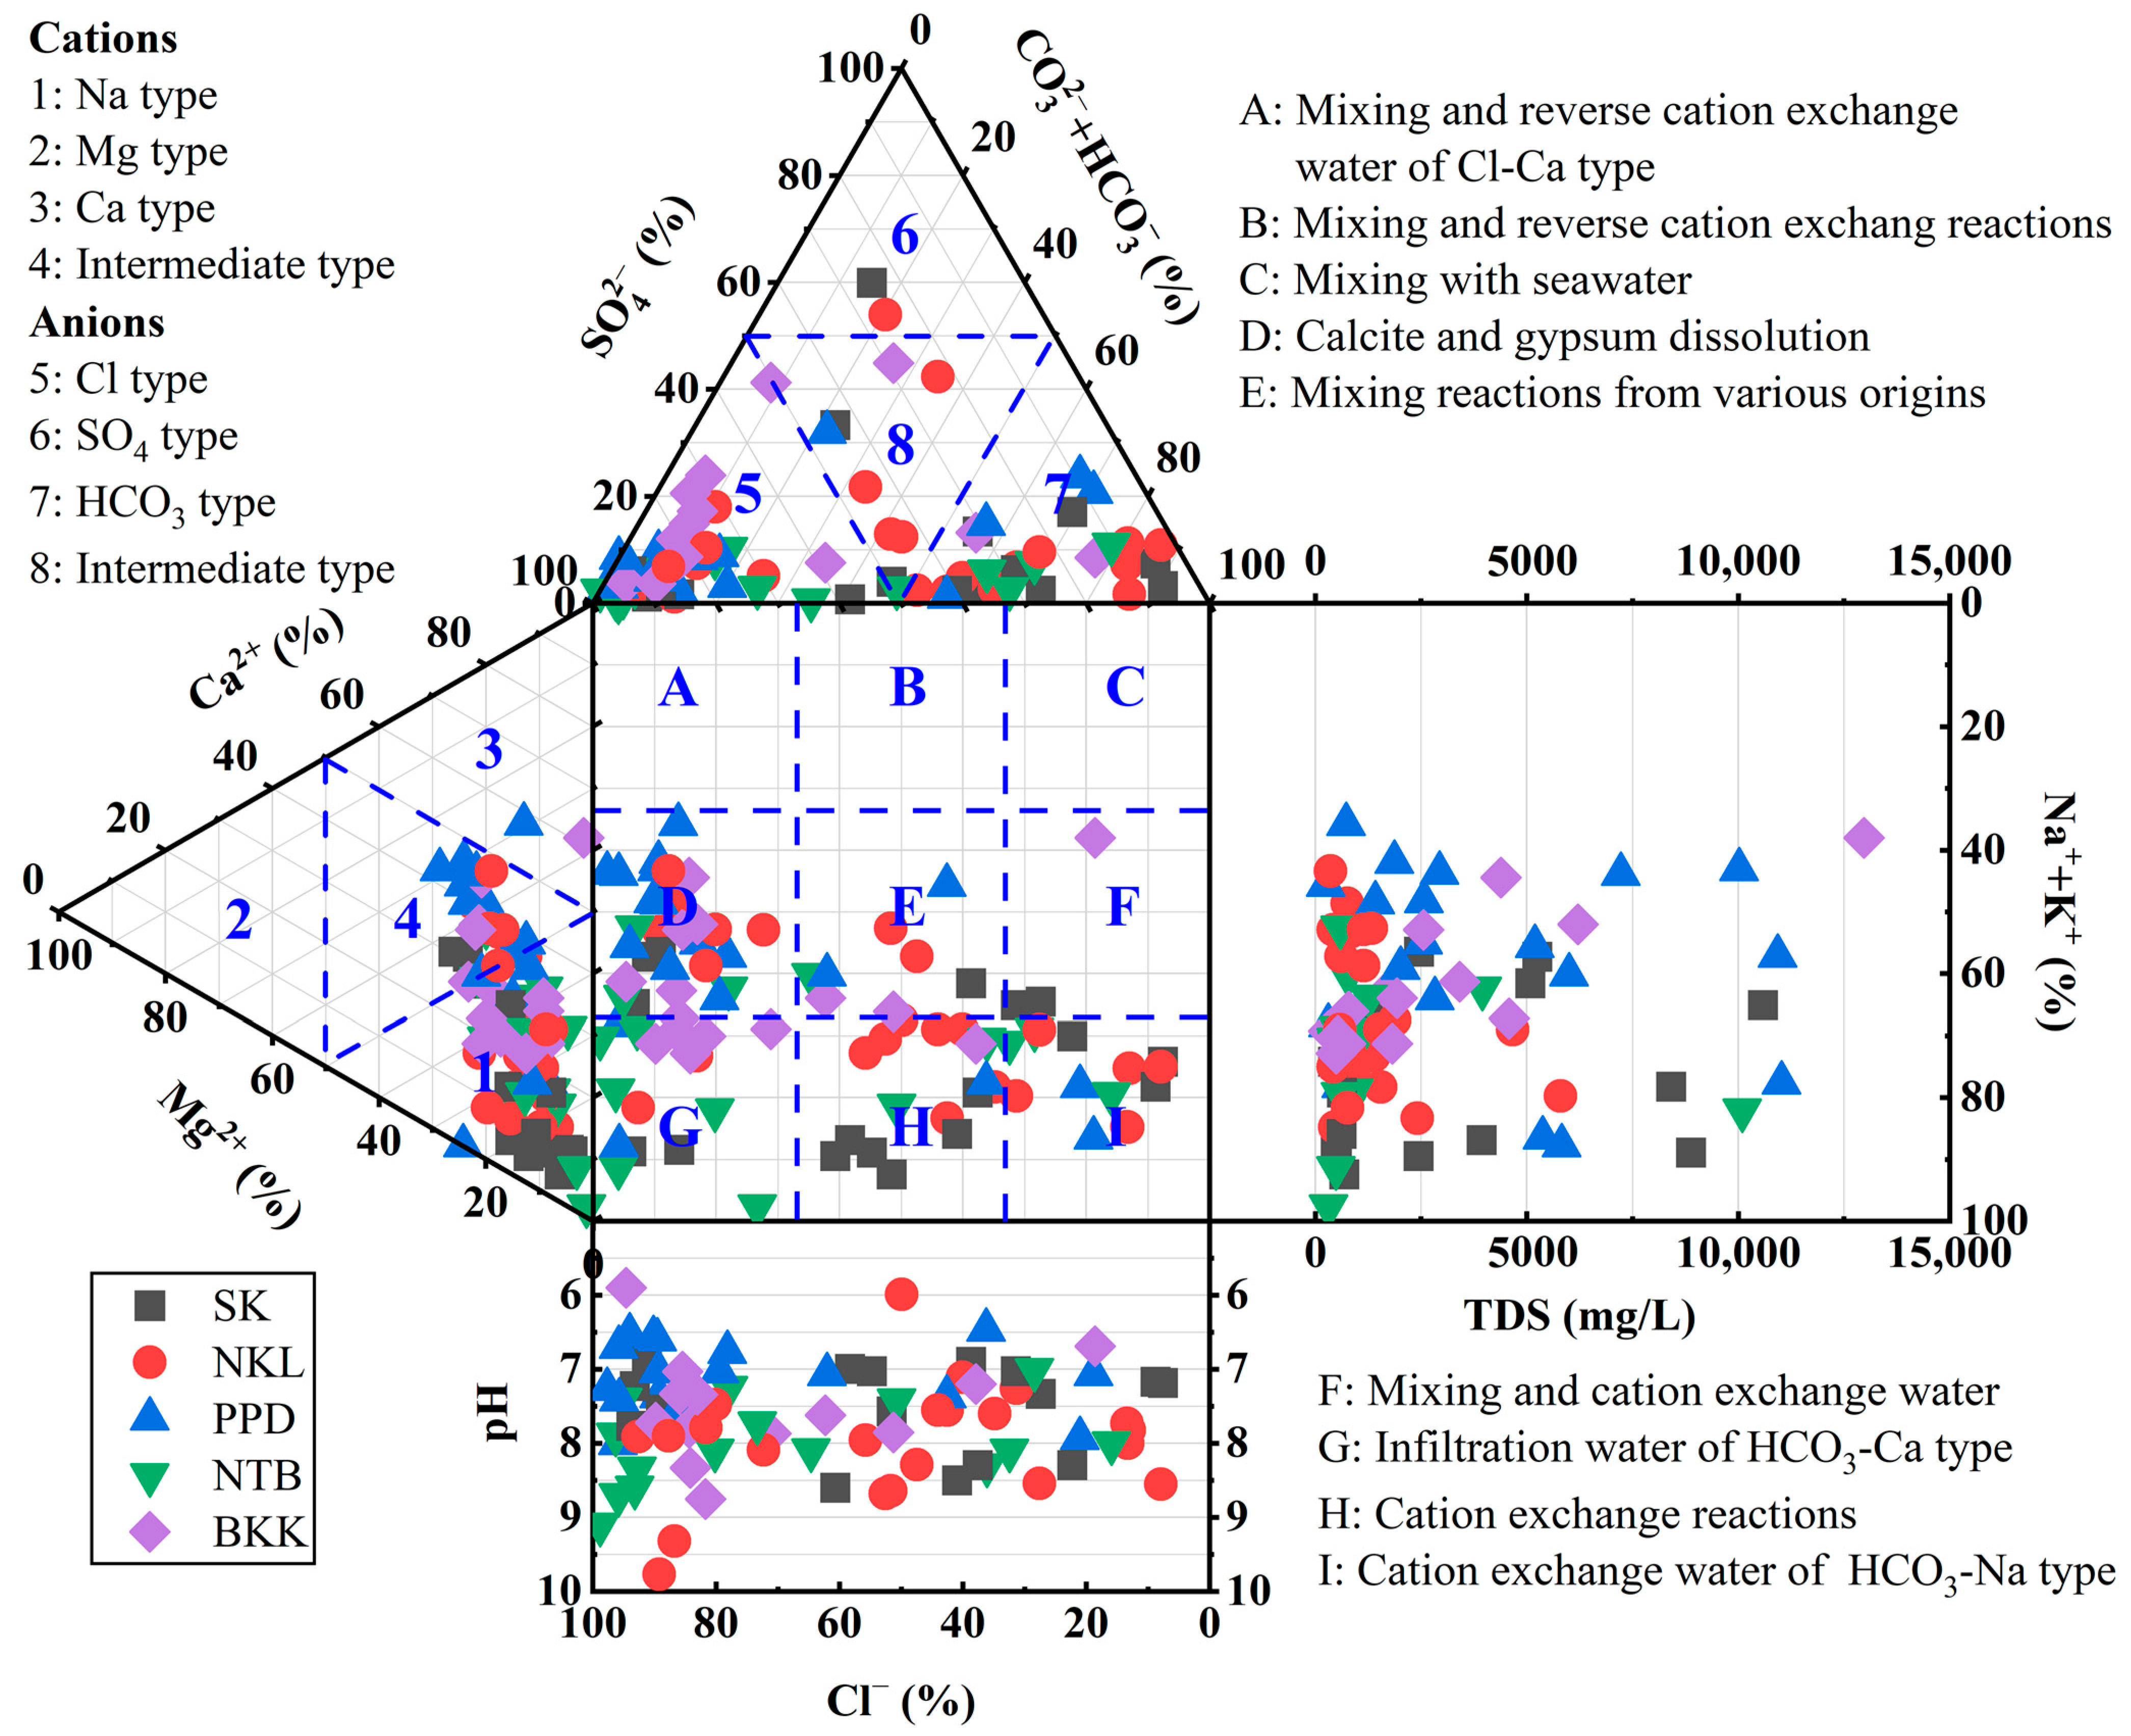
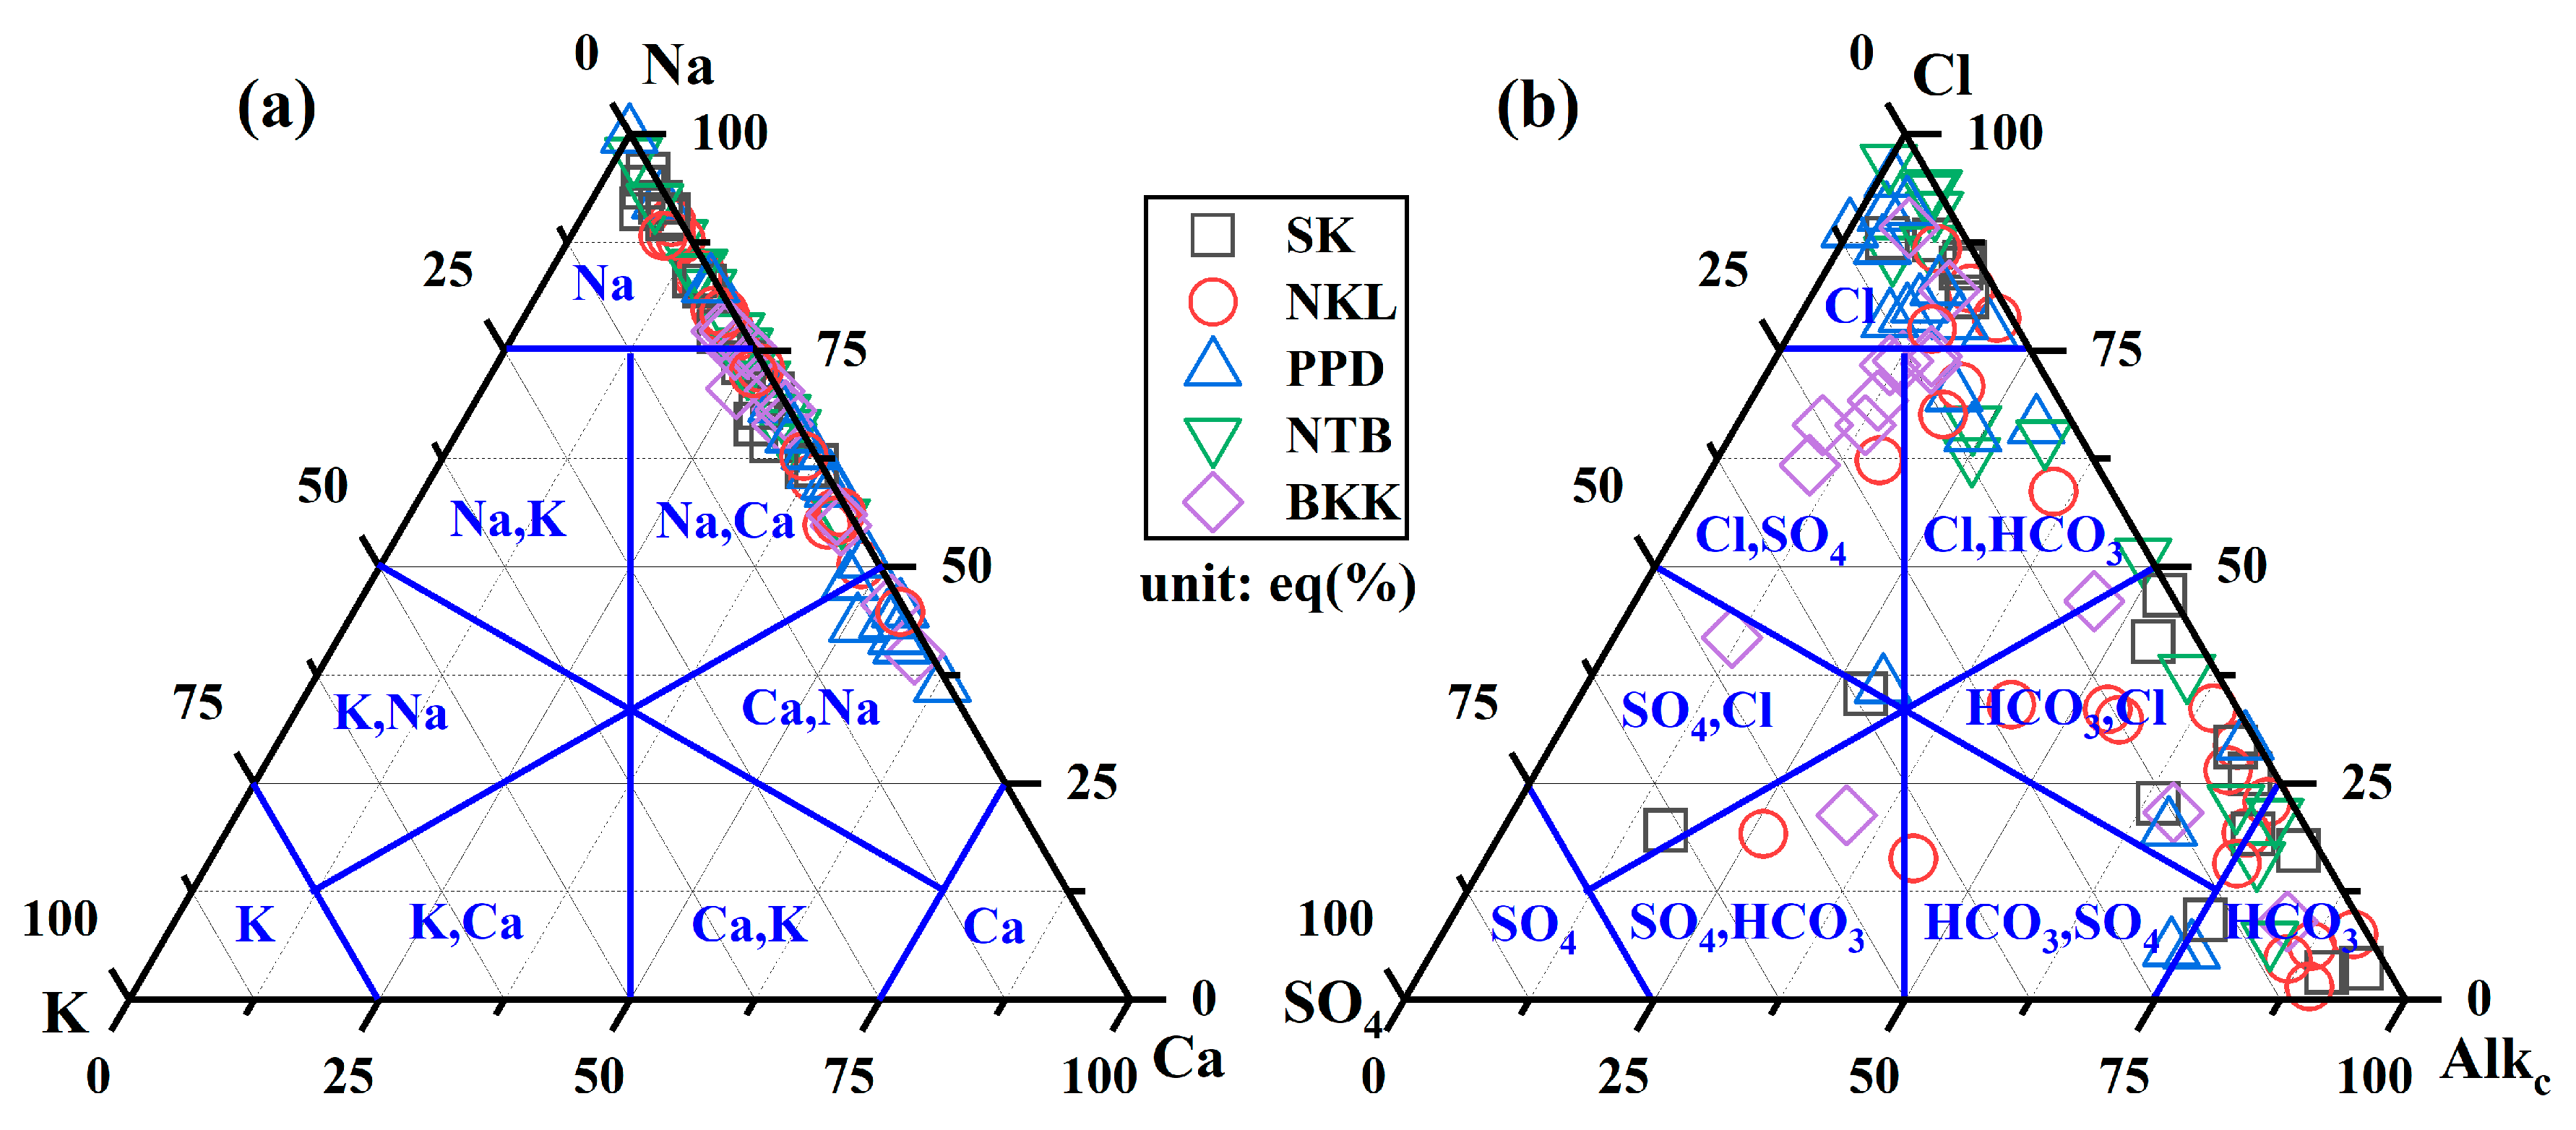
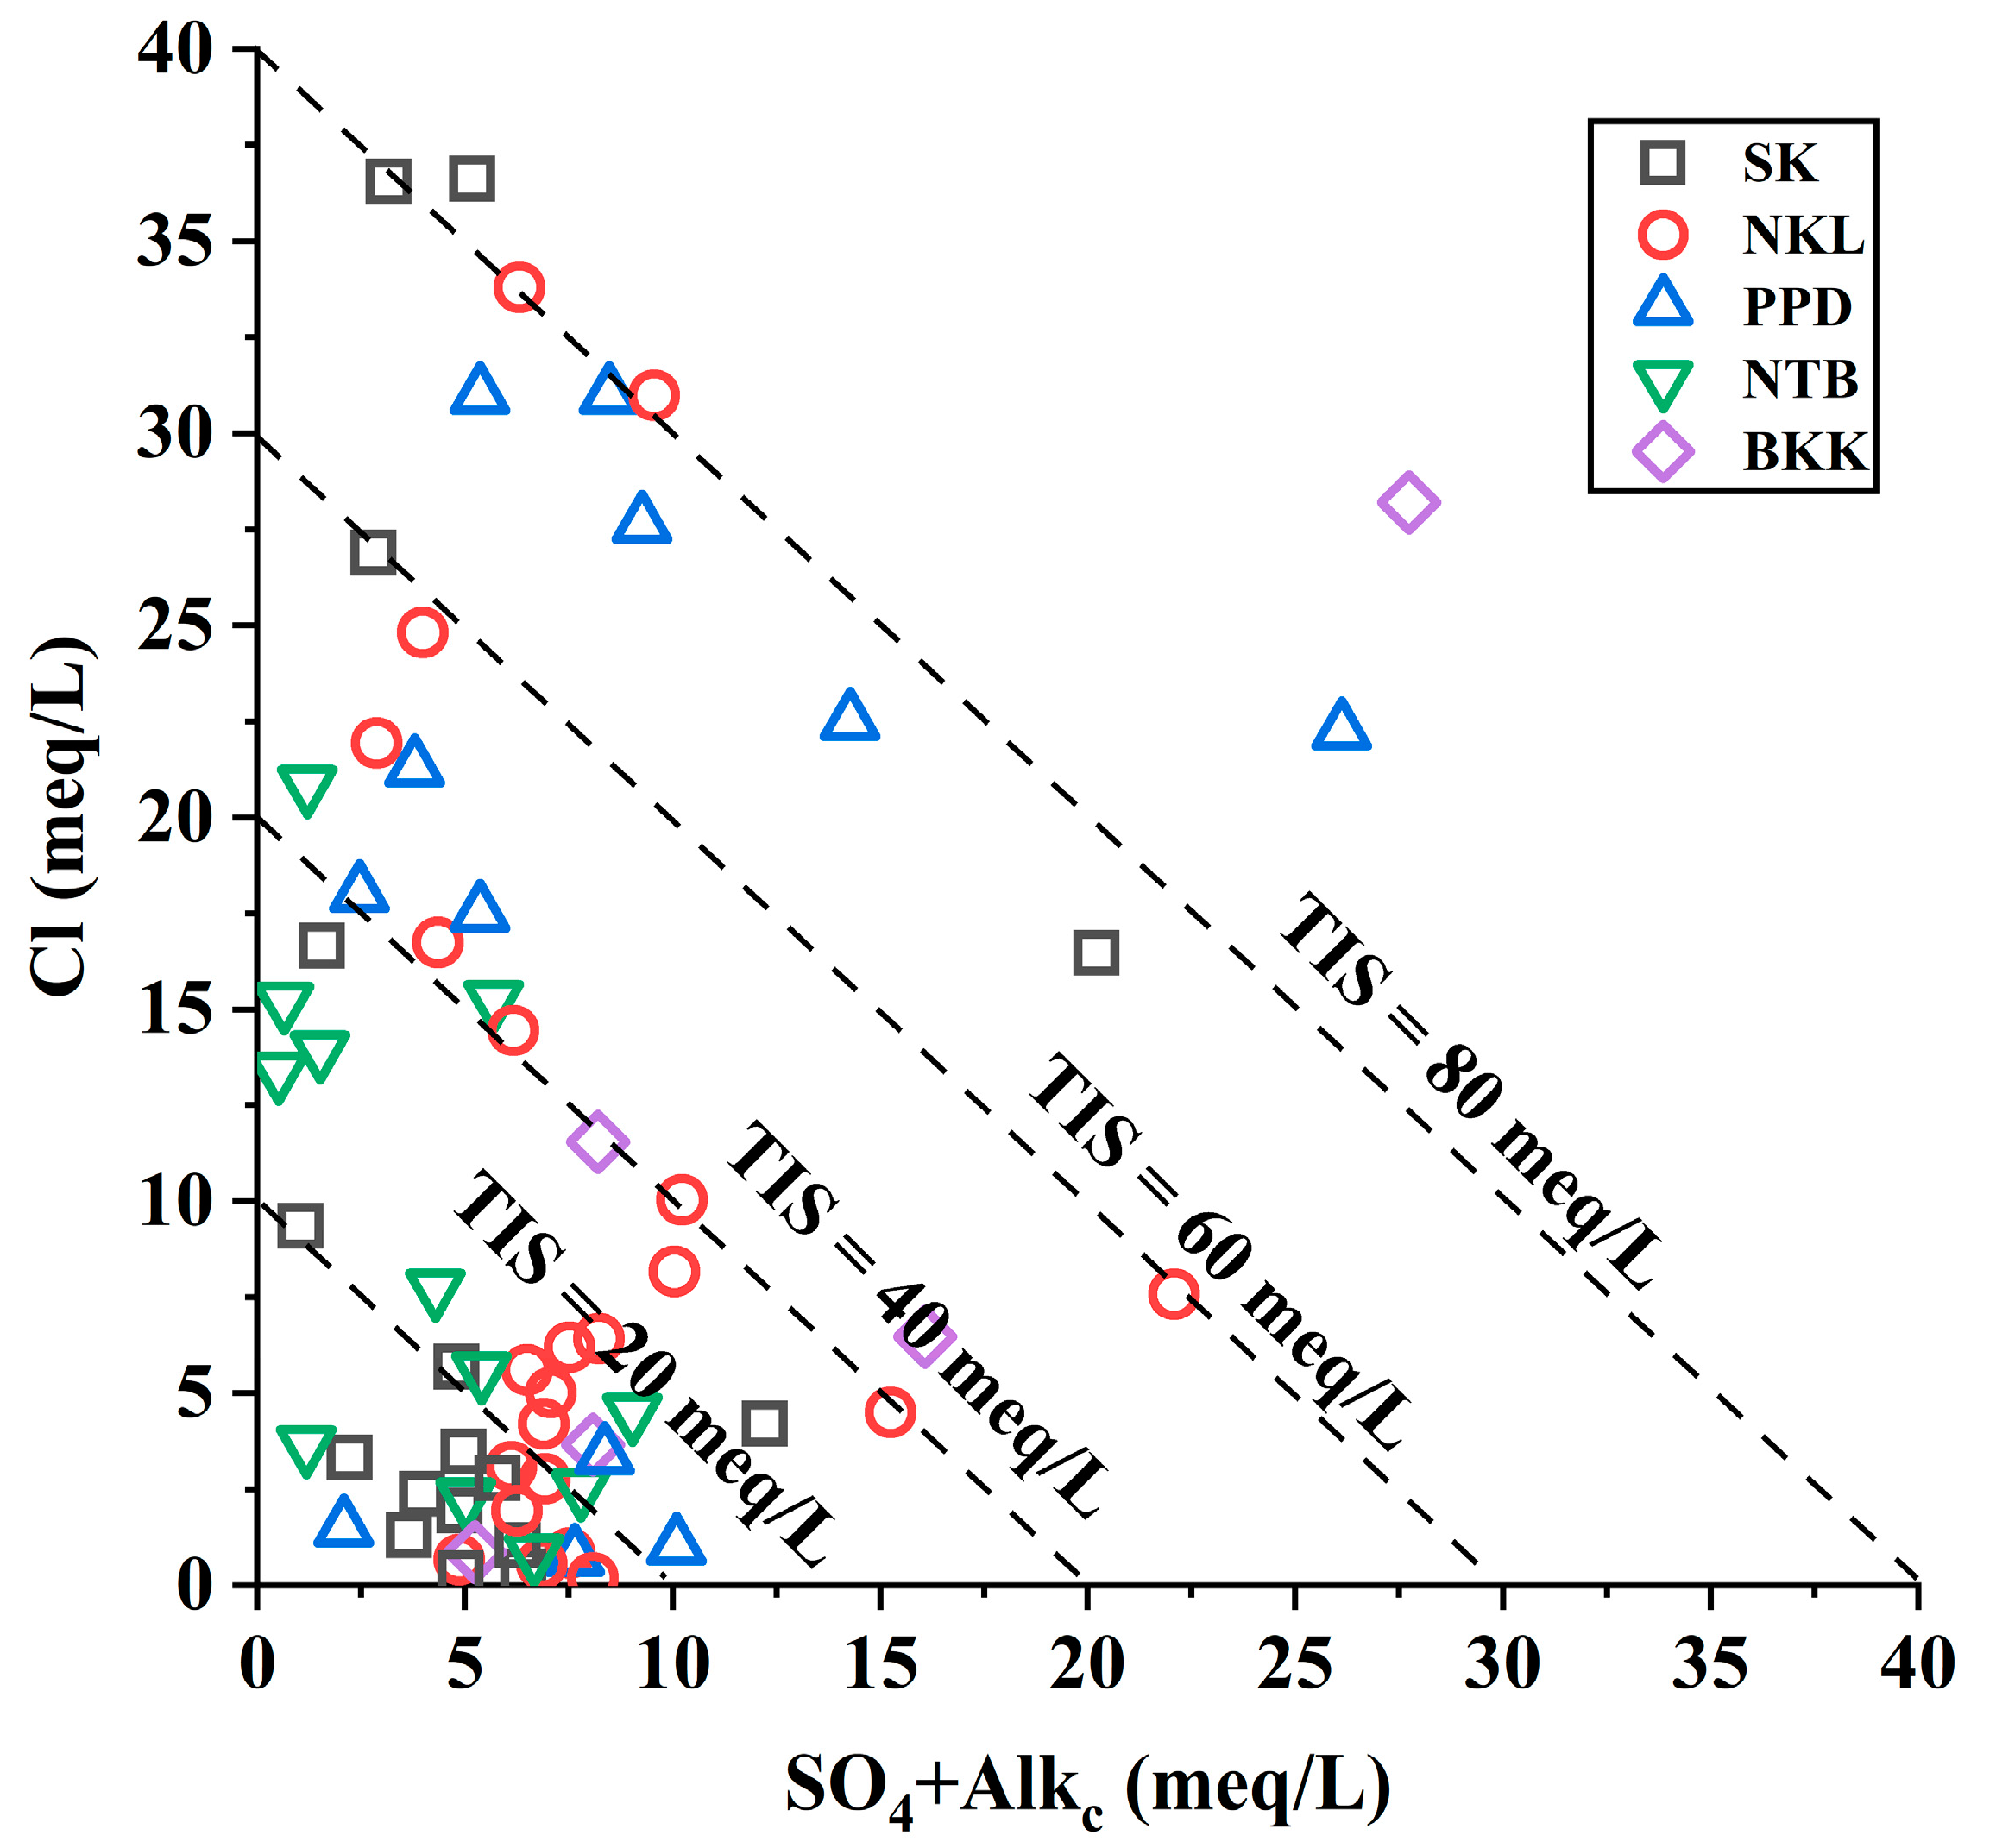
3.1. Hydrochemical Facies in Groundwater

Groundwater levels, influenced by aquifer type and geographic location, can vary from a few meters to over 40 m below the surface (Figure 2a). The Sam Khok (SK) aquifer typically exhibited deeper groundwater depths (ranging from 3.50 m to 41.38 m below the earth’s surface, with an average of 27.59 ± 11.56 m), suggesting the presence of elevated bedrock or less permeable soil layers [55]. The Nakhon Luang (NKL) aquifer showed profound levels, but certain areas had shallower readings (with an average of 21.44 ± 8.06 m), indicating varying geological conditions or recharge rates. The Phra Pradaeng (PPD) aquifer displayed a spectrum of water levels (ranging from 4.04 m to 44.77 m, with an average of 17.81 ± 12.03 m), hinting at diverse geological situations. Conversely, the Nonthaburi (NTB) and Bangkok (BKK) aquifers predominantly revealed shallower groundwater depths. The NTB aquifer presented a range of levels (from 5.06–34.76 m, with an average of 21.44 ± 8.06 m) but trended toward deeper ones in certain locations (Figure 2a), while the BKK aquifer consistently reflects shallower levels (averaging 13.85 ± 11.99 m), implying regions of high permeability or superior recharge rates [35].
Geographic location, such as longitude 100.64° E and latitude 14.46° N, also plays a significant role, as different aquifers exhibited varied water levels (Figure 2b), indicating complex geological settings. However, it is important to note that these observations are general, and specific geological factors, hydrological conditions, and human interventions can greatly influence groundwater levels [37]. Differences in extraction rates, aquifer characteristics (permeability and porosity), and rainfall patterns and evaporation can contribute to variations in groundwater depths between aquifers [56].
The physical properties of groundwater showed variations across different aquifers. The BKK aquifer showed variability in electrical conductivity (EC), ranging from 712.46 to 11,266.21 μS/cm (averaging 7398.31 ± 3523.96 μS/cm), with some wells recording high levels of total dissolved solids (TDS, maximum 7323.04 mg/L). The PPD aquifer also showed high TDS levels at certain sites (12,275.90 mg/L), potentially indicating pollution or high mineral content. The NKL aquifer exhibited considerable variations in pH levels (5.99–9.77 with an average of 8.01 ± 0.88), suggesting diverse water quality. The NTB aquifer had a low pH value in one site (3.1), indicating a more acidic environment influenced by local soil composition or biological activities. Lastly, the SK aquifer demonstrated varied EC values, ranging from 572.91 to 3778 μS/cm with a mean of 1536.22 ± 1142.50 μS/cm.
There was a significant variation in calcium (Ca) concentration, ranging from very low to high values across different aquifers (Figure 2b). The Ca ranged between 1.0 mg/L (NTB aquifer) and 1640.0 mg/L (BKK aquifer) with an average value of 175.84 ± 258.08 mg/L (Table 2). A wide variation was also found for magnesium (Mg) concentration (0.7–487.78 mg/L). The overall average Mg was 53.55 ± 101.52 mg/L. The maximum Mg was observed at the PPD aquifer (487.78 mg/L), while the minimum value was found at the NTB aquifer (0.7 mg/L). Higher concentrations of Ca and Mg ions usually indicate the presence of limestone and dolomite in the geological substrate [57]. This could be the case for the samples from the PPD aquifer, which show very high concentrations of both calcium and magnesium. These ions are also important indicators of water hardness [58], with higher concentrations leading to harder water.
The sodium (Na) concentration varied significantly between aquifers (Figure 2b), with an average of 446.78 ± 507.81 mg/L. The maximum was found in the PPD aquifer (2888.89 mg/L), while the BKK aquifer had the minimum Na concentration (26.0 mg/L), reflecting differences in the composition and sources of groundwater [59]. Variations in mineralization were also observed in groundwater, as indicated by distinct potassium (K) levels (Table 2). The maximum K was 60.0 mg/L (NKL), and the minimum K was 1.0 mg/L, found at the PPD aquifer. The Na and K ions are commonly found in igneous and metamorphic rocks, as well as in clays [60]. High concentrations of Na ion, such as in some samples from PPD, could also signify a large input from such rocks or from seawater intrusion.
Chloride (Cl) concentration showed a broad variation, ranging from 7.2 mg/L (NKL aquifer) to 9548.8 mg/L (BKK aquifer), indicating different levels of salinity and potential sources such as seawater intrusion or anthropogenic activities [35]. Furthermore, there was also a significant variation in sulfate (SO4) concentration (0.0–1109.33 mg/L, Table 2), reflecting differences in geological formations and groundwater flow patterns. Extremely high levels of Cl and SO4, like those found in the samples from PPD and BKK, could suggest contamination from industrial effluents, sewage, or possible seawater intrusion [61].
Moreover, the bicarbonate (HCO3) concentration varied from zero to 788.0 mg/L in the SK aquifer, which can be influenced by factors such as carbonate rock dissolution and groundwater recharge [62]. Different hydrochemical conditions can also result in varying carbonate (CO3) concentrations (0.0–219.67 mg/L), but these were generally low (Figure 2b). The HCO3 and CO3 ions are associated with limestone and are a significant component of temporary hardness in water [58]. Therefore, high HCO3 and CO3 levels, such as in the samples from the NKL aquifer, could indicate the presence of limestone in the aquifer. Additionally, high nitrate (NO3) concentration indicates potential sources such as agricultural activities or contamination in the BKK aquifer (21.5 mg/L) (Table 2 and Figure 2b). NO3 is also associated with agricultural runoff, especially from fertilizer use and wastewater treatment plants [63]. Higher concentrations, as seen in some samples from PPD and BKK, could suggest contamination from these sources. Long-term exposure to high levels of nitrates is harmful to human health, particularly for infants and pregnant women [63]. Conversely, it was not found in the deeper aquifers (NTB and SK).

3.2. Groundwater Characterization

To interpret and identify the prominent ionic elements and water mixtures in the local aquifer, the results relied on a series of traditional graphical presentations of the hydrochemical data. A well-recognized methodology to categorize groundwater types according to their ionic constituents comes from Durov [47] (Figure 3). The Durov diagram shows all 58 samples lying in Zone 1, implying a Na predominance among the cations and Cl and HCO3 predominance in Zone 5 and Zone 7, respectively, for the anions. The high percentages of Na + K could suggest the influence of saltwater intrusion or water–rock interactions [60,61]. However, there was no correlation between TDS and Na+K, and the pH in groundwater did not vary based on Cl ions. A high concentration of Cl suggests the influence of evaporation, sewage pollution, or saltwater intrusion [35]. Additionally, many samples showed CO3+HCO3 as the dominant anion. High bicarbonate can indicate groundwater that is influenced by carbonate minerals and is common in groundwater, which can be further affected by soil CO2 [64]. In addition to saltwater intrusion, a suggestion from the Durov plot is that calcite and gypsum dissolution (Zone D, Figure 3) and cation exchange serve as the principal hydrochemical processes affecting groundwater chemistry in the area under study. This could also be due to the infiltration of water from bicarbonate minerals (Zone G, Figure 3) [47].
The hydrochemical aspects presented by the Durov diagram are confirmed in the ternary plots of cations and anions (Figure 4). Displayed in the cation field (Figure 4a) is an enrichment in Na (average 68.72 ± 16.08 eq%) and Ca (average 30.50 ± 15.99 eq%), with Cl (average 58.82 ± 29.81 eq%) and HCO3 (average 30.97 ± 27.87 eq%) prevailing in the anion field (Figure 4b). Four types of groundwater can be discerned: the Na-Cl type, represented by 50 samples; the Na-HCO3 type, represented by 8 samples; the Ca-Cl type, represented by 7 samples; and a mixed type, represented by only 17 samples. The Na-Cl type was the most common type of groundwater in the investigated area, which signifies a high sodium and chloride concentration. Sodium and chloride can occur naturally in groundwater from the dissolution of salt deposits and the weathering of rocks containing sodium-bearing minerals [60]. However, high Na and Cl levels might be indicative of anthropogenic influences such as wastewater, septic system, or agricultural effluents, especially in coastal regions where seawater intrusion may be a factor [65]. The Na-HCO3 groundwater type indicates a longer residence time with more water–rock interactions [66], which can lead to an increase in sodium and bicarbonate ions. This type was also associated with more alkaline conditions [67], and the weathering of silicate minerals like feldspar or clay minerals lead to the Na-HCO3 type of groundwater [68]. The industrial effects could be found in the Ca-Cl type. In addition to the dissolution of minerals like gypsum and anhydrite (for calcium) and halite (for chloride), anthropogenic factors like industrial effluents or agricultural runoff contribute to the calcium or chloride levels in this type of groundwater [69]. The last group is the fresh water type dominated by Ca-HCO3 composition (Figure 3 and Figure 4) suggesting the dissolution of Ca-rich phases and ionic exchange controlling the geochemical processes, particularly occurring in metabasaltic and carbonatic rocks [20,70].
Furthermore, the groundwater type differs between aquifers (BKK, PPD, NKL, NTB, and SK) and shows different dominant ions, indicating diverse geological formations and sources of the water, as well as different levels of interaction with rocks and soil. These findings should be validated by other potentially comprehensive hydrogeochemical analyses (e.g., stable isotopes, trace elements) to confirm the sources of major ions.
When considering the salinity, the water samples were plotted on total ionic salinity (TIS, meq/L) (Figure 5). A TIS between 5 and 100 meq/L is observed. The binary diagram of Cl versus SO4+AlkC shows that the groundwater in the BKK and PPD aquifers had high salinity greater than 60 meq/L with an average value of 70.26 ± 41.38 meq/L for BKK and 62.32 ± 60.66 meq/L for PPD. This high salinity in shallow groundwater indicates the salinization from sea water flowing upstream along the Chao Phraya River. Conversely, salinity was generally low (<30 meq/L) in the deeper groundwater aquifers (deeper than 100 m depth) such as NKL, NTB, and SK. In addition to variation in depth, TIS also differed between groundwater basins in Thailand. The groundwater in southern Thailand has reported that their TIS was between 0.007 and 0.12 meq/L depending on the geological and geographical settings [71]. Compared to other regions, a TIS of 20–80 meq/L was reported for the groundwater in the industrial areas of Shaying River Basin, China [72]. The high salinity of groundwater is also the result of natural processes such as the interaction with soluble evaporite. Conversely, lower-TIS groundwater (<45 meq/kg) was observed in Mozambique [50]. Their groundwater was not mixed with saline water.

3.3. Groundwater Quality for Human Consumption

The heavy metal concentration (mg/L) varied between aquifers across the study area (Figure 6). Compared to the World Health Organization’s (WHO) drinking water standards [41] (Table 1), the concentrations of several heavy metals (as shown in Appendix A, Table A1), notably zinc (0–140 mg/L, averaged 8.01 ± 22.20 mg/L), mercury (0–1.02 mg/L, averaged 0.17 ± 0.29 mg/L), lead (0–0.159 mg/L, averaged 0.0031 ± 0.017 mg/L), manganese (0–830 mg/L, averaged 132.59 ± 186.02 mg/L), and iron (0–580 mg/L, averaged 27.70 ± 91.13 mg/L) in certain groundwater samples, significantly exceed the WHO’s standard [41] for safe drinking water (Figure 6). These findings indicate potential public health risks if the water is consumed without proper treatment. However, the contaminants might come from various sources, including agricultural runoff, industrial waste, and natural mineral deposits [73]. It is also worth noting the wide range of concentrations for each metal across different locations (Figure 6). This suggests significant spatial variability in the groundwater’s heavy metal contamination, which could be due to variations in local geology, the influence of human activities such as agricultural and industrial activities [17,21], or both.
Natural sources of zinc (Zn) in groundwater include the dissolution and weathering of Zn-containing rocks and minerals present in the Earth’s crust [11,74]. In groundwater, the Zn concentration is usually below 0.010–0.040 mg/L [74,75]. Extremely high Zn in the study area might be released from the use of Zn-containing materials like rubber tires in vehicle industries [11]. The presence of Zn in groundwater can have implications for both human health and crop production [76]. Zn is an essential micronutrient for human health, and its deficiency can lead to various health problems [77,78]. Conversely, excessive Zn intake can also be harmful [26,77,79]. In terms of crop production, Zn plays a vital role in several plant physiological functions and is necessary for optimal growth and development. Zn deficiency in soil–crop systems is widespread globally, particularly in calcareous, high-pH, eroded, and land-leveled soils [76]. The findings suggest reducing groundwater use or using iron oxide [80] and zeolite [81] in situ adsorption barriers. Concentrations of dissolved zinc were strongly reduced due to inserting the iron oxide or zeolite permeable barriers.
Industrial activities like leather manufacturing, mining, and chemical manufacturing can release mercury (Hg) into the environment [11,82]. The Hg can transform into methylmercury, a highly toxic form that can accumulate in fish and contaminate water bodies [83]. Consuming Hg-contaminated water or fish can cause neurological damage, impaired cognitive function, and developmental issues in children [82,84]. To reduce Hg below standard limits [41], the use of synthetic chelating ligands such as K2BDET could reduce mercury concentrations [85]. Ingesting or inhaling lead (Pb)-contaminated water or soil released from battery manufacturing and paint production can lead to neurological damage, developmental issues in children, anemia, and impaired kidney function [24]. Lead can also accumulate in crops, affecting their growth and quality [86]. According to the literature report, the 5 g/L of kaolin-supported nanoscale zero-valent iron can remove Pb from wastewater within 60 min [87,88].
The manufacturing can also introduce manganese (Mn) and iron (Fe) into the environment through wastewater discharges [89]. High levels of Mn in drinking water can lead to health issues such as neurological effects, including cognitive and behavioral changes [90]. It can also cause manganism, a condition similar to Parkinson’s disease, characterized by movement disorders. High concentrations of Mn in groundwater can also lead to a condition called manganese toxicity, which affects various crops, including rice, soybeans, and wheat [91]. Symptoms of manganese toxicity in plants include leaf chlorosis, stunted growth, and reduced crop yield [25,92]. In general, Fe is an essential nutrient for the human body, but excessive iron concentrations in drinking water can pose health risks. High Fe levels may cause gastrointestinal issues, such as stomach pain, nausea, and diarrhea [91]. Additionally, Fe can affect the taste, odor, and appearance of water, making it less appealing for consumption [25]. However, Fe and Mn can be removed from groundwater by a process that combines oxidation and microfiltration [93,94]. Furthermore, industries such as mining, metal smelting, and wood preservation might cause arsenic (As) contamination in groundwater [14], posing significant health risks. Prolonged exposure to arsenic can lead to skin lesions, cardiovascular diseases, and neurological effects [7,25,63]. Previous research has documented that using coconut husk carbon can remove As concentration with a metal adsorption capacity of 159 mg/g [95].
Hydrochemical characterization, being the initial phase in assessing water quality, identified the concentration of individual parameters in this study (Figure 2, Figure 3, Figure 4, Figure 5 and Figure 6). It also evaluated groundwater quality by comparing the results to WHO guidelines [41] (Table 1). The Water Quality Index (WQI), however, takes on a critical role in assessing the overall groundwater quality. It provides a comprehensive view of the influence of groundwater’s chemical parameters on its quality. Using the water quality classification model [53], the general evaluation of groundwater for drinking purposes was derived (Table 3). The result revealed that none of the samples fell into the “excellent water (WQI < 50)” or “good water (51 < WQI < 100)” categories. A significant proportion of samples, notably all from all aquifers, displayed WQI values that would categorize them as “poor water (101 < WQI < 200)” and even beyond (Table 3). In fact, many values exceeded 300 (84% of all samples), indicating that they could be classified as “unsuitable water” for drinking. A few samples showed WQI values that were close to or within the lower end of the “poor water” category, or in a few isolated cases, below 100 (13% of all samples). However, the majority of samples are not classified as suitable for drinking according to the classification scheme by Sahu and Sikdar [53]. The spatial distribution of these groundwater types (Figure 2a) as depicted by the WQI values (Table 3) suggests that groundwater quality varies significantly within the study area, with many areas posing potential health risks if the water is consumed. Although some samples contained heavy metals below the WHO standard limits (Figure 6), continuous monitoring and mitigation measures are recommended due to the harmful effects of long-term low-concentration exposure. The local health and environment authorities should investigate further to identify the sources of these heavy metals and consider appropriate treatment and remediation measures. The result suggests that the use of nanoscale zero-valent iron and in situ permeable barriers such as iron oxide, zeolite, chelation, and microfiltration is necessary to improve water quality before consumption [80,81,87,88,96].

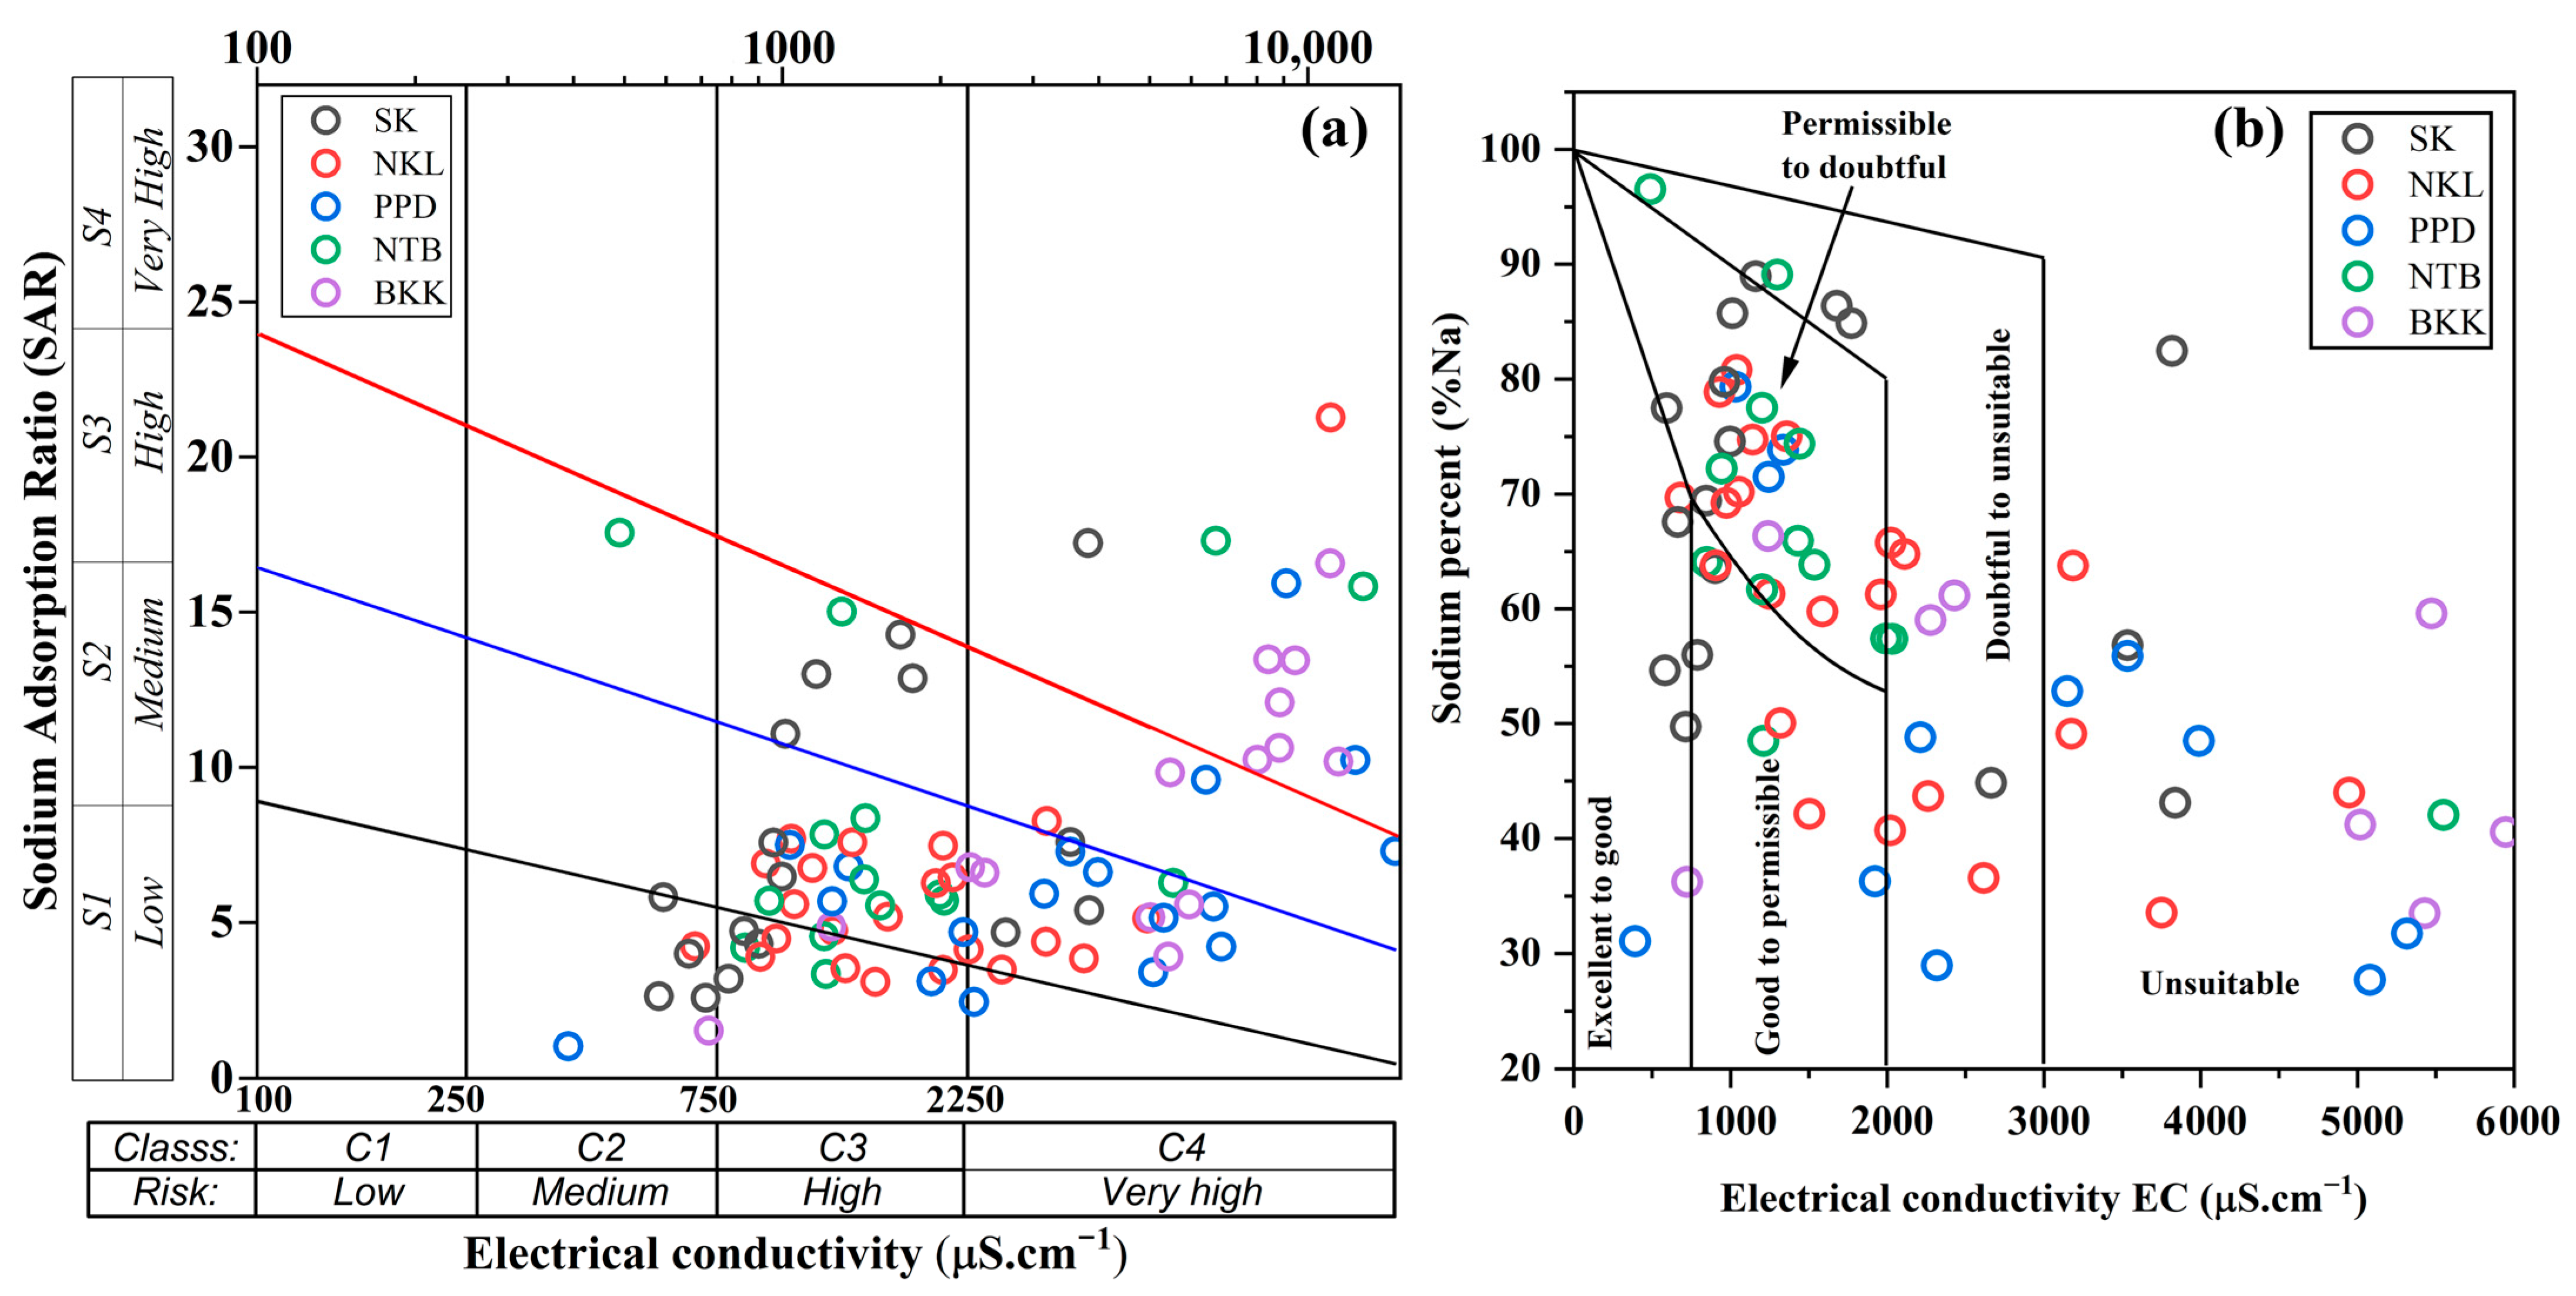
3.4. Groundwater Quality for Irrigation Purposes

The sodium adsorption ratio (SAR) is a measure of the suitability of water for use in agricultural irrigation, as determined by the concentrations of solids dissolved in the water [40]. The results for the SAR were plotted with the EC value, ranging from 391 µS/cm to 19,181 µS/cm. EC, or electrical conductivity, is a measure of the water’s ability to conduct electricity, which indicates the number of dissolved salts or substances in the water [86] (Figure 7a). High values of EC denote high salinity, which is not favorable for most crops [86]. Irrigation with high-salinity water can result in salt accumulation in the root zone, impacting plant growth and yield. Crops vary in their tolerance to salinity [16]. In Phra Nakhon Si Ayutthaya Province, most agricultural crops consist of rice and coconut. Both rice and coconut trees have moderate salinity tolerance. For rice, the threshold EC is about 3000 μS/cm, and for coconut, it is slightly higher [16].
The SAR values fell in the range of 1.03–21.28 (averaged 7.38 ± 4.36) for all the samples and were typically found to be in the range of 1.03–5.92 for the groundwater deeper than 100 m (NKL, NTB, and SK aquifers). This indicates a sodium hazard class of S1 (Figure 7a) and excellent water quality [97]. Groundwater with SAR values greater than 6 is observed to have permeability problems [40,98], indicating that sodium salts dominate, which can result in soil swelling and decreased permeability [66,97], impeding the uptake of water by crops.
Furthermore, the samples were also assessed for sodium hazard or sodium percent (%Na) [54] (Figure 7b). It represents the sodium content of the water as a percentage. High sodium content in irrigation water can cause degradation of soil structure, resulting in reduced water infiltration capacity [54,65]. This could further lead to lower yields due to waterlogging and decreased aeration [98]. The %Na ranged between 27.72 and 96.53 with an average value of 59.04 ± 16.25 for all samples (Figure 7b). Values less than 20% indicate excellent water quality. In this study, only 12 sites fell within the standard range of 20–40%, classifying the samples as good-quality water [48]. When the sodium range is high, Na can be absorbed by clay particles and displace Mg and Ca ions [99]. When Na in water is displaced with Mg and Ca ions in the soil, it can reduce soil permeability and result in poor internal soil drainage. This can restrict the movement of air and water in the soils and such soils generally become hard when dry [98].
For groundwater shallower than 200 m depth (BKK, PPD, NKL, and NTB aquifers), these aquifers showed relatively high variability in EC, SAR, and %Na. Some of the values were quite high, particularly in the BKK and PPD aquifers, suggesting that irrigation water from these aquifers could have significant impacts on soil properties and crop yields [86]. The high salinity (EC) and sodium content (%Na) could contribute to soil degradation [48], while high SAR values could cause problems with soil structure and water uptake [40]. It appears that the groundwater in many of these aquifers may not be suitable for irrigation without some form of treatment or management, especially for salt-sensitive crops. The high salinity and sodicity could negatively affect soil health and, as a consequence, crop health and productivity, including rice and coconut. However, for the deeper groundwater (SK aquifer), this aquifer had generally lower values of EC, SAR, and %Na. Irrigation water from this aquifer might have less severe impacts on soil properties and crop yields, although some measurements still suggest potential issues, especially regarding the SAR and %Na. Furthermore, the actual impact would also depend on other factors such as the specific crop variety, the soil type, the extent of rainfall (which can help leach salts), and the farmers’ management practices [86].
Several studies have examined the impact of nitrogen (N), phosphorus (P), and potassium (K) fertilizers, also known as NPK, on soil and groundwater quality. These nutrients are essential for crop growth, but their leaching into groundwater can disrupt ecosystems and agriculture. In the study area, the concentrations of nitrate (NO3), a component of N, in groundwater compared to phosphates (PO4) and potassium (K) were observed due to their mobility and abundance. A study proposed a diagram illustrating the correlation between these ions in the groundwater (Figure 8). The plot highlighted areas with varying degrees of contamination, revealing that factors such as the source and amount of fertilizer, the relative proportion of NPK, and aquifer properties can influence contamination levels.
Nonlinear patterns were observed in specific samples (Figure 8), pointing to several agricultural areas or watersheds impacted by fertilizer pollution. The slope of this line can change based on the origin of the fertilizer, the quantity applied, and the relative NPK composition. The composition of recharged water moving through the vadose zone was found to vary depending on fertilizer application, linked to diverse cropping patterns. Shifts in farming methods and the varied properties of aquifers could influence NO3 distribution in agricultural watersheds [63]. The slope might also indicate a variation in nitrate levels corresponding to minor increases in potash or phosphate values. It is noteworthy that highly soluble nitrate and nitrite (NO2) have greater mobility and form weaker bonds with soil particles [100]. NO3 originates from the oxidation of ammonia, which increases due to nitrogen fertilizer application [63,100,101]. The oxidation process depletes oxygen levels, hastening the migration of nitrogen compounds to the water table through the vadose layer [102]. The groundwater’s vulnerability to fertilizers was particularly evident in Phra Nakhon Si Ayutthaya due to its shallow water table and sedimentary formations. Sixty-four percent of the area is being cultivated more than once, primarily during the Ayutthaya one rice season in August. Therefore, nitrate, phosphate, and potassium impacts are still significant in the BKK aquifer (Figure 8) during the sampling period in January 2022.
Comparison with other regions revealed that aquifer properties, cropping patterns, and fertilizer use affect irrigation suitability [38,46,97,103]. For instance, groundwater from confined aquifers (SK aquifer) demonstrated better irrigation properties than unconfined aquifers (BKK and PPD aquifers). This suggests a higher contamination risk in unconfined aquifers. High sodium absorption ratio (SAR) values in the BKK aquifer (Figure 7a) are associated with the overexploitation of groundwater, excessive agrochemical use, and greater evapotranspiration during dry seasons, resulting in high salinity, deeming the water unsuitable for irrigation [38,97]. Other contributing factors to water quality for irrigation include natural weathering, bedrock leaching, and climate variability [104].

4. Conclusions

This research explores the hydrochemical facies and characteristics of groundwater from five distinct aquifers. Groundwater physical and chemical properties, such as electrical conductivity (EC), pH, and total dissolved solids (TDS), exhibit remarkable differences across aquifers, hinting at diverse water quality and potential pollution or high mineral content. The varying concentration of elements like Ca, Mg, Na, K, Cl, SO4, HCO3, CO3, NO3, and heavy metals in the groundwater reveals different geological and hydrological conditions, potential contamination sources, and water hardness levels. Furthermore, the quality of groundwater was evaluated for human consumption and agricultural irrigation purposes. Notably, heavy metal concentrations, such as zinc, mercury, lead, manganese, and iron, significantly exceeded the World Health Organization’s (WHO) standards for safe drinking water in certain groundwater samples, signaling potential public health risks. Most samples were classified as “poor” or “unsuitable” for drinking, according to the Water Quality Index (WQI), indicating considerable groundwater quality variability within the study area. The likely sources of contamination include agricultural runoff, industrial waste, and natural mineral deposits. The research emphasizes the importance of continuous monitoring and remediation measures to ensure water safety. The treatment technologies such as nanoscale zero-valent iron and in situ permeable reactive barriers such as iron oxide, zeolite, chelation, and microfiltration should be employed for pollutant removal before consumption. The findings conclude that continuous monitoring, effective management practices, and treatment measures are critical for preserving groundwater quality. This work thus provides a comprehensive understanding of groundwater quality across diverse aquifers, emphasizing the need for strategic measures to safeguard water safety and sustainability.

Author Contributions

Conceptualization, J.L., P.J. and V.P.; methodology, J.L., P.C. (Phupha Chipthamlong) and B.K.; software, V.P. and P.J.; validation, J.L., P.C. (Phornsuda Chomcheawchan) and K.K.; formal analysis, K.K. and B.K.; investigation, J.L. and B.K.; resources, J.L., P.J. and K.K.; data curation, V.P. and P.C. (Phupha Chipthamlong); original manuscript writing, J.L. and P.C. (Phornsuda Chomcheawchan); manuscript review and editing, K.K., P.J. and P.C. (Phornsuda Chomcheawchan); visualization, V.P. and P.C. (Phupha Chipthamlong); supervision, B.K.; project administration, B.K.; funding acquisition, J.L. and P.J. All authors have read and agreed to the published version of the manuscript.

Funding

This research was funded by Naresuan University, Grant Number: R2566C003.

Data Availability Statement

Not applicable.

Acknowledgments

The authors acknowledge the Department of Groundwater Resources and the Royal Irrigation Department for supporting the hydrogeological data and their technical support.

Conflicts of Interest

The authors declare no conflict of interest.

Appendix A

Table A1. Heavy metal concentration (mg/L) in groundwater across different aquifers in Phra Nakhon Si Ayutthaya collected in November 2022.
ElementsValues (mg/L)Aquifers
BKKPPDNKLNTBSKOverall
AsMax0.01580.02530.03290.00540.00330.0329
Min0.00000.00000.00000.00000.00000.0000
Mean0.00280.00210.00470.00190.00170.0028
StdDev0.00400.00580.00830.00170.00140.0053
ZnMax18.000040.0000140.0000120.000091.0000140.0000
Min0.00000.00000.00000.00000.00000.0000
Mean1.45495.33169.791512.78449.10007.8058
StdDev4.442611.674029.296629.464921.104521.8650
HgMax1.02000.89900.74300.00020.00031.0200
Min0.00000.00000.00000.00000.00000.0000
Mean0.38400.26690.17730.00010.00010.1663
StdDev0.35270.34930.28340.00010.00010.2913
NiMax0.01200.01000.51600.04250.00690.5160
Min0.00000.00000.00000.00000.00000.0000
Mean0.00320.00150.02520.00510.00250.0085
StdDev0.00330.00270.10700.01030.00240.0537
PbMax0.01400.00180.00550.00570.15900.1590
Min0.00000.00000.00000.00000.00000.0000
Mean0.00210.00010.00140.00150.01030.0030
StdDev0.00440.00040.00150.00170.03720.0166
MnMax562.0000415.0000490.0000830.0000325.0000830.0000
Min0.19100.10000.20000.00000.10000.0000
Mean98.113272.0928164.5378187.4125115.9472128.3652
StdDev203.6324131.9233189.1197252.4662121.7922184.3860
CdMax0.00060.00240.00090.00070.00090.0024
Min0.00000.00000.00000.00000.00000.0000
Mean0.00020.00030.00040.00030.00030.0003
StdDev0.00020.00060.00030.00030.00030.0003
FeMax580.0000160.0000320.0000540.000055.0000580.0000
Min0.50000.00000.04600.10000.20000.0000
Mean61.744422.595923.365842.14066.625029.8712
StdDev153.397946.068067.7370133.202414.156293.2930
BaMax0.66800.90901.11760.54360.53751.1176
Min0.00000.00000.00000.00000.00000.0000
Mean0.10050.13820.14770.14200.07960.1232
StdDev0.15640.25630.22790.17150.13050.1958
SeMax0.00180.00180.00410.01300.00800.0130
Min0.00000.00000.00000.00000.00000.0000
Mean0.00040.00020.00150.00310.00220.0014
StdDev0.00070.00060.00120.00410.00250.0024
CrMax0.00240.00240.00380.00820.00330.0082
Min0.00000.00000.00000.00000.00000.0000
Mean0.00050.00030.00160.00180.00160.0012
StdDev0.00100.00080.00130.00210.00130.0014
Note: Bangkok aquifer (BKK, 0–50 m depth), Phra Pradaeng aquifer (PPD, 51–100 m depth), Nakhon Luang aquifer (NKL, 101–150 m depth), Nonthaburi aquifer (NTB, 151–200 m depth), and Sam Khok aquifer (SK, 201–350 m depth).

References

  1. Arya, S.; Kumar, V.; Sharma, S. Analysis of water quality parameters of groundwater in and around Diamond Cement Industry, Jhansi, Central India. Int. J. Curr. Res. 2012, 4, 75–77. [Google Scholar]
  2. Kaviarasan, M.; Geetha, P.; Soman, K.P. GIS-based ground water quality monitoring in Thiruvannamalai District, Tamil Nadu, India. In Proceedings of the International Conference on Soft Computing Systems: ICSCS 2015, Chennai, India, 20–21 April 2015; pp. 685–700. [Google Scholar]
  3. Putthividhya, A.; Laonamsai, J. Assessment of Surface and Ground-water Interactions using Stable Isotope Fingerprinting Technique in Thailand. In Proceedings of the World Environmental and Water Resources Congress, Austin, TX, USA, 17–21 May 2015; pp. 464–474. [Google Scholar]
  4. Babiker, I.S.; Mohamed, M.A.A.; Hiyama, T. Assessing groundwater quality using GIS. Water Resour. Manag. 2007, 21, 699–715. [Google Scholar] [CrossRef]
  5. Zhang, Y.; Wu, J.; Xu, B. Human health risk assessment of groundwater nitrogen pollution in Jinghui canal irrigation area of the loess region, northwest China. Environ. Earth Sci. 2018, 77, 273. [Google Scholar] [CrossRef]
  6. Raza, M.; Hussain, F.; Lee, J.-Y.; Shakoor, M.B.; Kwon, K.D. Groundwater status in Pakistan: A review of contamination, health risks, and potential needs. Crit. Rev. Environ. Sci. Technol. 2017, 47, 1713–1762. [Google Scholar] [CrossRef]
  7. Shankar, S.; Shanker, U. Arsenic contamination of groundwater: A review of sources, prevalence, health risks, and strategies for mitigation. Sci. World J. 2014, 2014, 304524. [Google Scholar] [CrossRef]
  8. Ullah, R.; Malik, R.N.; Qadir, A. Assessment of groundwater contamination in an industrial city, Sialkot, Pakistan. Afr. J. Environ. Sci. Technol. 2009, 3, 429–446. [Google Scholar]
  9. Dawood, F.; Akhtar, M.M.; Ehsan, M. Evaluating urbanization impact on stressed aquifer of Quetta Valley, Pakistan. Desalin. Water Treat. 2021, 222, 103–113. [Google Scholar] [CrossRef]
  10. Rapant, S.; Krčmová, K. Health risk assessment maps for arsenic groundwater content: Application of national geochemical databases. Environ. Geochem. Health 2007, 29, 131–141. [Google Scholar] [CrossRef]
  11. Li, P.; Karunanidhi, D.; Subramani, T.; Srinivasamoorthy, K. Sources and consequences of groundwater contamination. Arch. Environ. Contam. Toxicol. 2021, 80, 1–10. [Google Scholar] [CrossRef] [PubMed]
  12. Kumar, M.; Borah, P.; Devi, P. Priority and emerging pollutants in water. In Inorganic Pollutants in Water; Elsevier: Amsterdam, The Netherlands, 2020; pp. 33–49. [Google Scholar]
  13. Fuoco, I.; Marini, L.; De Rosa, R.; Figoli, A.; Gabriele, B.; Apollaro, C. Use of reaction path modelling to investigate the evolution of water chemistry in shallow to deep crystalline aquifers with a special focus on fluoride. Sci. Total Environ. 2022, 830, 154566. [Google Scholar] [CrossRef]
  14. Alarcón-Herrera, M.T.; Gutiérrez, M. Geogenic arsenic in groundwater: Challenges, gaps, and future directions. Curr. Opin. Environ. Sci. Health 2022, 27, 100349. [Google Scholar] [CrossRef]
  15. Cho, B.W.; Choo, C.O. Geochemical behavior of uranium and radon in groundwater of Jurassic granite area, Icheon, Middle Korea. Water 2019, 11, 1278. [Google Scholar] [CrossRef] [Green Version]
  16. Shannon, M.C.; Grieve, C.M. Tolerance of vegetable crops to salinity. Sci. Hortic. 1998, 78, 5–38. [Google Scholar] [CrossRef]
  17. Barakat, M.A. New trends in removing heavy metals from industrial wastewater. Arab. J. Chem. 2011, 4, 361–377. [Google Scholar] [CrossRef] [Green Version]
  18. Fu, Z.; Xi, S. The effects of heavy metals on human metabolism. Toxicol. Mech. Methods 2020, 30, 167–176. [Google Scholar] [CrossRef]
  19. Mohankumar, K.; Hariharan, V.; Rao, N.P. Heavy metal contamination in groundwater around industrial estate vs residential areas in Coimbatore, India. J. Clin. Diagn. Res. JCDR 2016, 10, BC05. [Google Scholar] [CrossRef]
  20. Mehmood, A.; Qadir, A.; Ehsan, M.; Ali, A.; Raza, D.; Aziz, H. Hydrogeological studies and evaluation of surface and groundwater quality of Khyber Pakhtunkhwa, Pakistan. Desalin. Water Treat. 2021, 244, 41–54. [Google Scholar] [CrossRef]
  21. Bhutiani, R.; Kulkarni, D.B.; Khanna, D.R.; Gautam, A. Geochemical distribution and environmental risk assessment of heavy metals in groundwater of an industrial area and its surroundings, Haridwar, India. Energy Ecol. Environ. 2017, 2, 155–167. [Google Scholar] [CrossRef] [Green Version]
  22. Chanpiwat, P.; Lee, B.-T.; Kim, K.-W.; Sthiannopkao, S. Human health risk assessment for ingestion exposure to groundwater contaminated by naturally occurring mixtures of toxic heavy metals in the Lao PDR. Environ. Monit. Assess. 2014, 186, 4905–4923. [Google Scholar] [CrossRef]
  23. Rehman, K.; Fatima, F.; Waheed, I.; Akash, M.S.H. Prevalence of exposure of heavy metals and their impact on health consequences. J. Cell. Biochem. 2018, 119, 157–184. [Google Scholar] [CrossRef]
  24. Rezaei, H.; Zarei, A.; Kamarehie, B.; Jafari, A.; Fakhri, Y.; Bidarpoor, F.; Karami, M.A.; Farhang, M.; Ghaderpoori, M.; Sadeghi, H. Levels, distributions and health risk assessment of lead, cadmium and arsenic found in drinking groundwater of Dehgolan’s villages, Iran. Toxicol. Environ. Health Sci. 2019, 11, 54–62. [Google Scholar] [CrossRef]
  25. Ghosh, G.C.; Khan, M.J.H.; Chakraborty, T.K.; Zaman, S.; Kabir, A.H.M.E.; Tanaka, H. Human health risk assessment of elevated and variable iron and manganese intake with arsenic-safe groundwater in Jashore, Bangladesh. Sci. Rep. 2020, 10, 5206. [Google Scholar] [CrossRef] [Green Version]
  26. Batayneh, A.T. Toxic (aluminum, beryllium, boron, chromium and zinc) in groundwater: Health risk assessment. Int. J. Environ. Sci. Technol. 2012, 9, 153–162. [Google Scholar] [CrossRef]
  27. Laonamsai, J.; Ichiyanagi, K.; Patsinghasanee, S. Isotopic temporal and spatial variations of tropical rivers in Thailand reflect monsoon precipitation signals. Hydrol. Process. 2021, 35, e14068. [Google Scholar] [CrossRef]
  28. Laonamsai, J.; Putthividhya, A. Preliminary assessment of groundwater and surface water characteristics in the upper Chao Phraya River Basin land using a stable isotope fingerprinting technique. In Proceedings of the World Environmental and Water Resources Congress, West Palm Beach, FL, USA, 22–26 May 2016; pp. 367–386. [Google Scholar]
  29. Venter, Z.S.; Barton, D.N.; Chakraborty, T.; Simensen, T.; Singh, G. Global 10 m Land Use Land Cover Datasets: A Comparison of Dynamic World, World Cover and Esri Land Cover. Remote Sens. 2022, 14, 4101. [Google Scholar] [CrossRef]
  30. Peel, M.C.; Finlayson, B.L.; McMahon, T.A. Updated world map of the Köppen-Geiger climate classification. Hydrol. Earth Syst. Sci. 2007, 11, 1633–1644. [Google Scholar] [CrossRef] [Green Version]
  31. Laonamsai, J.; Ichiyanagi, K.; Kamdee, K.; Putthividhya, A.; Tanoue, M. Spatial and temporal distributions of stable isotopes in precipitation over Thailand. Hydrol. Process. 2021, 35, e13995. [Google Scholar] [CrossRef]
  32. Tevapitak, K.; Helmsing, A.H.J.B. The interaction between local governments and stakeholders in environmental management: The case of water pollution by SMEs in Thailand. J. Environ. Manag. 2019, 247, 840–848. [Google Scholar] [CrossRef] [PubMed]
  33. Phien-wej, N.; Giao, P.H.; Nutalaya, P. Land subsidence in bangkok, Thailand. Eng. Geol. 2006, 82, 187–201. [Google Scholar] [CrossRef]
  34. Stoecker, F.; Babel, M.S.; Gupta, A.D.; Rivas, A.A.; Evers, M.; Kazama, F.; Nakamura, T. Hydrogeochemical and isotopic characterization of groundwater salinization in the Bangkok aquifer system, Thailand. Environ. Earth Sci. 2013, 68, 749–763. [Google Scholar] [CrossRef]
  35. Gupta, A.D. Simulated Salt-Water Movement in the Nakhon Luang Aquifer, Bangkok, Thailand. Groundwater 1985, 23, 512–522. [Google Scholar] [CrossRef]
  36. Nutalaya, P.; Yong, R.N.; Chumnankit, T.; Buapeng, S. Land subsidence in Bangkok during 1978–1988. Sea-Level Rise Coast. Subsid. Causes Conseq. Strateg. 1996, 2, 105–130. [Google Scholar]
  37. Putthividhya, A.; Laonamsai, J. SWAT and MODFLOW modeling of spatio-temporal runoff and groundwater recharge distribution. In Proceedings of the World Environmental and Water Resources Congress, Sacramento, CA, USA, 21–25 May 2017; pp. 51–65. [Google Scholar]
  38. Deborah, C. Water Quality Assessments: A Guide to Use of Biota, Sediments and Water in Environmental Monitoring; UNESCO/WHO/UNEP: Cambridge, UK, 1996. [Google Scholar]
  39. Miner, G. Standard methods for the examination of water and wastewater. Am. Water Work. Assoc. J. 2006, 98, 130. [Google Scholar] [CrossRef]
  40. Richards, L.A. Diagnosis and Improvement of Saline and Alkali Soils; LWW: Philadelphia, PA, USA, 1954; Volume 78. [Google Scholar]
  41. World Health Organization. Guidelines for Drinking-Water Quality: Incorporating the First and Second Addenda; World Health Organization: Geneva, Switzerland, 2022. [Google Scholar]
  42. Rabeiy, R.E. Assessment and modeling of groundwater quality using WQI and GIS in Upper Egypt area. Environ. Sci. Pollut. Res. 2018, 25, 30808–30817. [Google Scholar] [CrossRef] [PubMed]
  43. Magesh, N.S.; Chandrasekar, N. Evaluation of spatial variations in groundwater quality by WQI and GIS technique: A case study of Virudunagar District, Tamil Nadu, India. Arab. J. Geosci. 2013, 6, 1883–1898. [Google Scholar] [CrossRef]
  44. Unigwe, C.O.; Egbueri, J.C. Drinking water quality assessment based on statistical analysis and three water quality indices (MWQI, IWQI and EWQI): A case study. Environ. Dev. Sustain. 2023, 25, 686–707. [Google Scholar] [CrossRef]
  45. Ram, A.; Tiwari, S.K.; Pandey, H.K.; Chaurasia, A.K.; Singh, S.; Singh, Y.V. Groundwater quality assessment using water quality index (WQI) under GIS framework. Appl. Water Sci. 2021, 11, 46. [Google Scholar] [CrossRef]
  46. Loh, Y.S.A.; Akurugu, B.A.; Manu, E.; Aliou, A.-S. Assessment of groundwater quality and the main controls on its hydrochemistry in some Voltaian and basement aquifers, northern Ghana. Groundw. Sustain. Dev. 2020, 10, 100296. [Google Scholar] [CrossRef]
  47. Ravikumar, P.; Somashekar, R.K.; Prakash, K.L. A comparative study on usage of Durov and Piper diagrams to interpret hydrochemical processes in groundwater from SRLIS river basin, Karnataka, India. Elixir Earth Sci 2015, 80, 31073–31077. [Google Scholar]
  48. Wilcox, L. Classification and Use of Irrigation Waters; US Department of Agriculture: Washington, DC, USA, 1955. [Google Scholar]
  49. Cioni, R.; Marini, L. A Thermodynamic Approach to Water Geothermometry; Springer: Berlin/Heidelberg, Germany, 2020. [Google Scholar]
  50. Procesi, M.; Marini, L.; Cinti, D.; Sciarra, A.; Basile, P.; Mazzoni, T.; Zarlenga, F. Preliminary fluid geochemical survey in Tete Province and prospective development of geothermics in Mozambique. Geotherm. Energy 2022, 10, 2. [Google Scholar] [CrossRef]
  51. Tonani, F.B.; Nagao, K.; Moore, J.; Natale, G.; Sperry, T. Water and gas geochemistry of the Cove-Fort Sulphurdale geothermal system. In Proceedings of the Twenty-Third Workshop on Geothermal Reservoir Engineering, Stanford, CA, USA, 26–28 January 1998; pp. 26–28. [Google Scholar]
  52. Chegbeleh, L.P.; Aklika, D.K.; Akurugu, B.A. Hydrochemical characterization and suitability assessment of groundwater quality in the Saboba and Chereponi Districts, Ghana. Hydrology 2020, 7, 53. [Google Scholar] [CrossRef]
  53. Sahu, P.; Sikdar, P.K. Hydrochemical framework of the aquifer in and around East Kolkata Wetlands, West Bengal, India. Environ. Geol. 2008, 55, 823–835. [Google Scholar] [CrossRef]
  54. Sadashivaiah, C.; Ramakrishnaiah, C.R.; Ranganna, G. Hydrochemical analysis and evaluation of groundwater quality in Tumkur Taluk, Karnataka State, India. Int. J. Environ. Res. Public Health 2008, 5, 158–164. [Google Scholar] [CrossRef] [PubMed]
  55. Sinsakul, S. Late quaternary geology of the lower central plain, Thailand. J. Asian Earth Sci. 2000, 18, 415–426. [Google Scholar] [CrossRef]
  56. Laonamsai, J.; Ichiyanagi, K.; Patsinghasanee, S.; Kamdee, K.; Tomun, N. Application of Stable Isotopic Compositions of Rainfall Runoff for Evaporation Estimation in Thailand Mekong River Basin. Water 2022, 14, 2803. [Google Scholar] [CrossRef]
  57. Stanienda, K.J. Carbonate phases rich in magnesium in the Triassic limestones of the eastern part of the Germanic Basin. Carb. Evaporites 2016, 31, 387–405. [Google Scholar] [CrossRef] [Green Version]
  58. Krawczyk, W.E.; Ford, D.C. Correlating specific conductivity with total hardness in limestone and dolomite karst waters. Earth Surf. Process. Landf. 2006, 31, 221–234. [Google Scholar] [CrossRef]
  59. Ahmed, A.A.; Shabana, A.R.; Saleh, A.A. Using hydrochemical and isotopic data to determine sources of recharge and groundwater evolution in arid region from Eastern Desert, Egypt. J. Afr. Earth Sci. 2019, 151, 36–46. [Google Scholar] [CrossRef]
  60. Bucher, K.; Grapes, R. Petrogenesis of Metamorphic Rocks; Springer Science & Business Media: Berlin/Heidelberg, Germany, 2011. [Google Scholar]
  61. Park, S.-C.; Yun, S.-T.; Chae, G.-T.; Yoo, I.-S.; Shin, K.-S.; Heo, C.-H.; Lee, S.-K. Regional hydrochemical study on salinization of coastal aquifers, western coastal area of South Korea. J. Hydrol. 2005, 313, 182–194. [Google Scholar] [CrossRef]
  62. Li, P.; Qian, H.; Wu, J.; Zhang, Y.; Zhang, H. Major ion chemistry of shallow groundwater in the Dongsheng Coalfield, Ordos Basin, China. Mine Water Environ. 2013, 32, 195. [Google Scholar] [CrossRef]
  63. Hosono, T.; Nakano, T.; Shimizu, Y.; Onodera, S.i.; Taniguchi, M. Hydrogeological constraint on nitrate and arsenic contamination in Asian metropolitan groundwater. Hydrol. Process. 2011, 25, 2742–2754. [Google Scholar] [CrossRef]
  64. Lucena, J.J. Effects of bicarbonate, nitrate and other environmental factors on iron deficiency chlorosis. A review. J. Plant Nutr. 2000, 23, 1591–1606. [Google Scholar] [CrossRef]
  65. Ebrahimi, M.; Kazemi, H.; Ehtashemi, M.; Rockaway, T.D. Assessment of groundwater quantity and quality and saltwater intrusion in the Damghan basin, Iran. Geochemistry 2016, 76, 227–241. [Google Scholar] [CrossRef]
  66. Chae, G.-T.; Yun, S.-T.; Kim, K.; Mayer, B. Hydrogeochemistry of sodium-bicarbonate type bedrock groundwater in the Pocheon spa area, South Korea: Water–rock interaction and hydrologic mixing. J. Hydrol. 2006, 321, 326–343. [Google Scholar] [CrossRef]
  67. Schofield, S.; Jankowski, J. Hydrochemistry and isotopic composition of Na–HCO3-rich groundwaters from the Ballimore region, central New South Wales, Australia. Chem. Geol. 2004, 211, 111–134. [Google Scholar] [CrossRef]
  68. Chidambaram, S.; Karmegam, U.; Sasidhar, P.; Prasanna, M.V.; Manivannan, R.; Arunachalam, S.; Manikandan, S.; Anandhan, P. Significance of saturation index of certain clay minerals in shallow coastal groundwater, in and around Kalpakkam, Tamil Nadu, India. J. Earth Syst. Sci. 2011, 120, 897. [Google Scholar] [CrossRef]
  69. Nihalani, S.A.; Behede, S.N.; Meeruty, A.R. Groundwater suitability determination near solid waste dump site at Pune. Sustain. Water Resour. Manag. 2022, 8, 64. [Google Scholar] [CrossRef]
  70. Vespasiano, G.; Muto, F.; Apollaro, C. Geochemical, geological and groundwater quality characterization of a complex geological framework: The case study of the Coreca area (Calabria, South Italy). Geosciences 2021, 11, 121. [Google Scholar] [CrossRef]
  71. Williams, M.; Fordyce, F.; Paijitprapapon, A.; Charoenchaisri, P. Arsenic contamination in surface drainage and groundwater in part of the southeast Asian tin belt, Nakhon Si Thammarat Province, southern Thailand. Environ. Geol. 1996, 27, 16–33. [Google Scholar] [CrossRef]
  72. Li, B.; Song, X.; Yang, L.; Yao, D.; Xu, Y. Insights onto Hydrologic and Hydro-Chemical Processes of Riparian Groundwater Using Environmental Tracers in the Highly Disturbed Shaying River Basin, China. Water 2020, 12, 1939. [Google Scholar] [CrossRef]
  73. Alloway, B.J. Sources of heavy metals and metalloids in soils. Heavy Met. Soils Trace Met. Met. Soils Bioavailab. 2013, 22, 11–50. [Google Scholar]
  74. Nriagu, J.O. Zinc in the Environment. Part I: Ecological Sycling; John Wiley & Sons: New York, NY, USA, 1980. [Google Scholar]
  75. Nordberg, G.F.; Nordberg, M.; Costa, M. Toxicology of metals: Overview, definitions, concepts, and trends. Handb. Toxicol. Met. 2022, 1–14. [Google Scholar] [CrossRef]
  76. Das, S.; Green, A. Zinc in Crops and Human Health. In Biofortification of Food Crops; Singh, U., Praharaj, C.S., Singh, S.S., Singh, N.P., Eds.; Springer India: New Delhi, India, 2016; pp. 31–40. [Google Scholar]
  77. Wagner, S.E.; Burch, J.B.; Hussey, J.; Temples, T.; Bolick-Aldrich, S.; Mosley-Broughton, C.; Liu, Y.; Hebert, J.R. Soil zinc content, groundwater usage, and prostate cancer incidence in South Carolina. Cancer Causes Control 2009, 20, 345–353. [Google Scholar] [CrossRef] [Green Version]
  78. Haglund, B.; Ryckenberg, K.; Selinus, O.; Dahlquist, G. Evidence of a Relationship Between Childhood-Onset Type I Diabetes and Low Groundwater Concentration of Zinc. Diabetes Care 1996, 19, 873–875. [Google Scholar] [CrossRef]
  79. Nriagu, J.O. Zinc in the Environment. Part II: Health Effects; John Wiley & Sons: New York, NY, USA, 1980. [Google Scholar]
  80. Krok, B.; Mohammadian, S.; Noll, H.M.; Surau, C.; Markwort, S.; Fritzsche, A.; Nachev, M.; Sures, B.; Meckenstock, R.U. Remediation of zinc-contaminated groundwater by iron oxide in situ adsorption barriers—From lab to the field. Sci. Total Environ. 2022, 807, 151066. [Google Scholar] [CrossRef]
  81. Vukojević Medvidović, N.; Nuić, I.; Ugrina, M.; Trgo, M. Evaluation of Natural Zeolite as a Material for Permeable Reactive Barrier for Remediation of Zinc-Contaminated Groundwater Based on Column Study. Water Air Soil Pollut. 2018, 229, 367. [Google Scholar] [CrossRef]
  82. Ghezzi, L.; Arrighi, S.; Giannecchini, R.; Bini, M.; Valerio, M.; Petrini, R. The legacy of mercury contamination from a past leather manufacturer and health risk assessment in an urban area (Pisa Municipality, Italy). Sustainability 2022, 14, 4367. [Google Scholar] [CrossRef]
  83. González-Fernández, B.; Menéndez-Casares, E.; Meléndez-Asensio, M.; Fernández-Menéndez, S.; Ramos-Muñiz, F.; Cruz-Hernández, P.; González-Quirós, A. Sources of mercury in groundwater and soils of west Gijón (Asturias, NW Spain). Sci. Total Environ. 2014, 481, 217–231. [Google Scholar] [CrossRef]
  84. Khattak, S.A.; Rashid, A.; Tariq, M.; Ali, L.; Gao, X.; Ayub, M.; Javed, A. Potential risk and source distribution of groundwater contamination by mercury in district Swabi, Pakistan: Application of multivariate study. Environ. Dev. Sustain. 2021, 23, 2279–2297. [Google Scholar] [CrossRef]
  85. Blue, L.Y.; Van Aelstyn, M.A.; Matlock, M.; Atwood, D.A. Low-level mercury removal from groundwater using a synthetic chelating ligand. Water Res. 2008, 42, 2025–2028. [Google Scholar] [CrossRef]
  86. Shalhevet, J. Using water of marginal quality for crop production: Major issues. Agric. Water Manag. 1994, 25, 233–269. [Google Scholar] [CrossRef]
  87. Fu, F.; Dionysiou, D.D.; Liu, H. The use of zero-valent iron for groundwater remediation and wastewater treatment: A review. J. Hazard. Mater. 2014, 267, 194–205. [Google Scholar] [CrossRef] [PubMed]
  88. Zhang, X.; Lin, S.; Lu, X.-Q.; Chen, Z.-l. Removal of Pb(II) from water using synthesized kaolin supported nanoscale zero-valent iron. Chem. Eng. J. 2010, 163, 243–248. [Google Scholar] [CrossRef]
  89. Ahmad, W.; Alharthy, R.D.; Zubair, M.; Ahmed, M.; Hameed, A.; Rafique, S. Toxic and heavy metals contamination assessment in soil and water to evaluate human health risk. Sci. Rep. 2021, 11, 17006. [Google Scholar] [CrossRef]
  90. Levy, B.S.; Nassetta, W.J. Neurologic effects of manganese in humans: A review. Int. J. Occup. Environ. Health 2003, 9, 153–163. [Google Scholar] [CrossRef]
  91. Rajmohan, N.; Elango, L. Distribution of iron, manganese, zinc and atrazine in groundwater in parts of Palar and Cheyyar river basins, South India. Environ. Monit. Assess. 2005, 107, 115–131. [Google Scholar] [CrossRef]
  92. Podgorski, J.; Araya, D.; Berg, M. Geogenic manganese and iron in groundwater of Southeast Asia and Bangladesh—Machine learning spatial prediction modeling and comparison with arsenic. Sci. Total Environ. 2022, 833, 155131. [Google Scholar] [CrossRef] [PubMed]
  93. Guo, Y.; Huang, T.; Wen, G.; Cao, X. The simultaneous removal of ammonium and manganese from groundwater by iron-manganese co-oxide filter film: The role of chemical catalytic oxidation for ammonium removal. Chem. Eng. J. 2017, 308, 322–329. [Google Scholar] [CrossRef]
  94. Ellis, D.; Bouchard, C.; Lantagne, G. Removal of iron and manganese from groundwater by oxidation and microfiltration. Desalination 2000, 130, 255–264. [Google Scholar] [CrossRef]
  95. Babel, S.; Kurniawan, T.A. Various treatment technologies to remove arsenic and mercury from contaminated groundwater: An overview. Proc. Southeast Asian Water Environ. 2005, 1. [Google Scholar] [CrossRef]
  96. Hashim, M.A.; Mukhopadhyay, S.; Sahu, J.N.; Sengupta, B. Remediation technologies for heavy metal contaminated groundwater. J. Environ. Manag. 2011, 92, 2355–2388. [Google Scholar] [CrossRef] [PubMed]
  97. Kumar, S.K.; Rammohan, V.; Sahayam, J.D.; Jeevanandam, M. Assessment of groundwater quality and hydrogeochemistry of Manimuktha River basin, Tamil Nadu, India. Environ. Monit. Assess. 2009, 159, 341–351. [Google Scholar] [CrossRef] [PubMed]
  98. Saleh, A.; Al-Ruwaih, F.; Shehata, M. Hydrogeochemical processes operating within the main aquifers of Kuwait. J. Arid Environ. 1999, 42, 195–209. [Google Scholar] [CrossRef]
  99. Anandakumar, S.; Subramani, T.; Elango, L. Major ion groundwater chemistry of Lower Bhavani River Basin, Tamil Nadu, India. J. Appl. Geochem. 2009, 11, 92–101. [Google Scholar]
  100. Kaçaroğlu, F.; Günay, G. Groundwater nitrate pollution in an alluvium aquifer, Eskişehir urban area and its vicinity, Turkey. Environ. Geol. 1997, 31, 178–184. [Google Scholar] [CrossRef]
  101. Srivastav, A.L. Chemical fertilizers and pesticides: Role in groundwater contamination. In Agrochemicals Detection, Treatment and Remediation; Elsevier: Amsterdam, The Netherlands, 2020; pp. 143–159. [Google Scholar]
  102. Squillace, P.J.; Scott, J.C.; Moran, M.J.; Nolan, B.T.; Kolpin, D.W. VOCs, pesticides, nitrate, and their mixtures in groundwater used for drinking water in the United States. Environ. Sci. Technol. 2002, 36, 1923–1930. [Google Scholar] [CrossRef] [Green Version]
  103. Boateng, T.K.; Opoku, F.; Acquaah, S.O.; Akoto, O. Groundwater quality assessment using statistical approach and water quality index in Ejisu-Juaben Municipality, Ghana. Environ. Earth Sci. 2016, 75, 489. [Google Scholar] [CrossRef]
  104. Czarnecki, S.; Düring, R.A. Influence of long-term mineral fertilization on metal contents and properties of soil samples taken from different locations in Hesse, Germany. Soil 2015, 1, 23–33. [Google Scholar] [CrossRef] [Green Version]
Figure 1. (a) Study area representing land use (source: LULC 2020 [29]). (b) Site samplings from various aquifers (e.g., Bangkok aquifer (BKK, 0–50 m depth), Phra Pradaeng aquifer (PPD, 51–100 m depth), Nakhon Luang aquifer (NKL, 101–150 m depth), Nonthaburi aquifer (NTB, 151–200 m depth), and Sam Khok aquifer (SK, 201–350 m depth)). (c) Mean monthly (1993–2022) rainfall (mm), mean monthly (1993–2022) air temperature (°C), and mean monthly (2013–2022) water table (m below earth surface) provided by the Thailand Department of Groundwater and the Department of Water Resources. (d) Geological cross section surveyed by the Thailand Department of Groundwater in 2022.
Geosciences 13 00195 g001
Figure 2. (a) Stiff diagram map (in meq/L unit) showing the spatial distribution of main cations (Na+ + K+, Ca2+, and Mg2+) and anions (Cl + NO3−, SO42−, and HCO3 + CO32−) in groundwater in 2022. Colors represent groundwater aquifers. Contour lines show average water table during 2013–2022. (b) Stiff diagram for mean main ions (meq/L) in each aquifer and for overall groundwater samples. Colors in Stiff indicate groundwater aquifers (e.g., Bangkok aquifer (BKK, 0–50 m depth), Phra Pradaeng aquifer (PPD, 51–100 m depth), Nakhon Luang aquifer (NKL, 101–150 m depth), Nonthaburi aquifer (NTB, 151–200 m depth), and Sam Khok aquifer (SK, 201–350 m depth)).
Geosciences 13 00195 g002
Figure 3. Durov diagram showing hydrogeological processes in Phra Nakhon Si Ayutthaya Province in 2022. Colors indicate groundwater aquifers (e.g., Bangkok aquifer (BKK, 0–50 m depth), Phra Pradaeng aquifer (PPD, 51–100 m depth), Nakhon Luang aquifer (NKL, 101–150 m depth), Nonthaburi aquifer (NTB, 151–200 m depth), and Sam Khok aquifer (SK, 201–350 m depth)).
Geosciences 13 00195 g003
Figure 4. Ternary diagram for (a) cations (Na, K, and Ca) and (b) anions (SO4, Cl, and Alkalinity). Colors indicate groundwater aquifers (e.g., Bangkok aquifer (BKK, 0–50 m depth), Phra Pradaeng aquifer (PPD, 51–100 m depth), Nakhon Luang aquifer (NKL, 101–150 m depth), Nonthaburi aquifer (NTB, 151–200 m depth), and Sam Khok aquifer (SK, 201–350 m depth)).
Geosciences 13 00195 g004
Figure 5. Total ionic salinity (TIS) diagram. Colors indicate groundwater aquifers (e.g., Bangkok aquifer (BKK, 0–50 m depth), Phra Pradaeng aquifer (PPD, 51–100 m depth), Nakhon Luang aquifer (NKL, 101–150 m depth), Nonthaburi aquifer (NTB, 151–200 m depth), and Sam Khok aquifer (SK, 201–350 m depth)).
Geosciences 13 00195 g005
Figure 6. Heavy metal concentration in milligrams per liter (mg/L) of groundwater in various aquifers in Phra Nakhon Si Ayutthaya, Thailand, in 2022. Colors indicate groundwater aquifers (e.g., Bangkok aquifer (BKK, 0–50 m depth), Phra Pradaeng aquifer (PPD, 51–100 m depth), Nakhon Luang aquifer (NKL, 101–150 m depth), Nonthaburi aquifer (NTB, 151–200 m depth), and Sam Khok aquifer (SK, 201–350 m depth)).
Geosciences 13 00195 g006
Figure 7. (a) USSL diagram showing sodium adsorption ratio (SAR) and electrical conductivity (EC, μS/cm) at sampling stations. (b) Wilcox diagram showing sodium percent (%Na) and electrical conductivity (EC, μS/cm) at sampling stations. Colors in plots indicate groundwater aquifers (e.g., Bangkok aquifer (BKK, 0–50 m depth), Phra Pradaeng aquifer (PPD, 51–100 m depth), Nakhon Luang aquifer (NKL, 101–150 m depth), Nonthaburi aquifer (NTB, 151–200 m depth), and Sam Khok aquifer (SK, 201–350 m depth)).
Geosciences 13 00195 g007
Figure 8. Bivariate plot between NO3 and K+ and PO43− showing the influence of fertilizer on the groundwater quality of the study area aquifer [41]. Colors indicate groundwater aquifers (e.g., Bangkok aquifer (BKK, 0–50 m depth), Phra Pradaeng aquifer (PPD, 51–100 m depth), Nakhon Luang aquifer (NKL, 101–150 m depth), Nonthaburi aquifer (NTB, 151–200 m depth), and Sam Khok aquifer (SK, 201–350 m depth)).
Geosciences 13 00195 g008
Table 1. Standards, weights, and relative weights used for WQI computation.
ParametersWHO (2022) Standard (Si, mg/L)Weight (wi, mg/L)Relative Weight (Wi, mg/L)
pH8.540.0533
TDS100040.0533
Ca10020.0267
Mg5020.0267
Na20030.0400
K2020.0267
HCO335020.0267
SO425030.0400
Cl25030.0400
NO35020.0267
PO4540.0533
F150.0667
As0.0150.0667
Zn520.0267
Pb0.0150.0667
Hg0.00650.0667
Fe0.330.0400
Mn0.440.0533
Cr0.0550.0667
Cd0.00350.0667
Ni0.0250.0667
Total751
Table 2. Concentration of cations and anions in groundwater across different aquifers.
IonsConcentration (mg/L)
Maximum (Aquifer)Minimum (Aquifer)AverageStandard Deviation
Ca1640.0 (BKK)1.0 (PPD)219.53258.08
Mg487.78 (PPD)0.7 (SK)46.97101.52
Na2888.89 (PPD)26.0 (BKK)590.62507.81
K60.0 (NKL)1.0 (PPD)10.9410.99
Cl9548.8 (BKK)7.2 (NTB)834.171463.07
SO41109.33 (BKK)0.0 (PPD)343.88254.79
HCO3788.0 (SK)0.0 (PPD)309.47142.52
CO3370.25 (NKL)0.0 (PPD)216.8311.10
NO321.5 (BKK)0.0 (NTB and SK)2.6811.69
Bangkok aquifer (BKK, 0–50 m depth), Phra Pradaeng aquifer (PPD, 51–100 m depth), Nakhon Luang aquifer (NKL, 101–150 m depth), Nonthaburi aquifer (NTB, 151–200 m depth), and Sam Khok aquifer (SK, 201–350 m depth).
Table 3. Water Quality Index (WQI).
AquifersWater Quality Index (WQI)
MaxMinMean
BKK14,314282590
PPD5752221659
NKL9251552761
NTB11,443233314
SK4414261775
Average9035312419
Bangkok aquifer (BKK, 0–50 m depth), Phra Pradaeng aquifer (PPD, 51–100 m depth), Nakhon Luang aquifer (NKL, 101–150 m depth), Nonthaburi aquifer (NTB, 151–200 m depth), and Sam Khok aquifer (SK, 201–350 m depth). Excellent water (WQI < 50), good water (51 < WQI < 100), poor water (101 < WQI < 200), unsuitable water for drinking (WQI > 300) [53].
Disclaimer/Publisher’s Note: The statements, opinions and data contained in all publications are solely those of the individual author(s) and contributor(s) and not of MDPI and/or the editor(s). MDPI and/or the editor(s) disclaim responsibility for any injury to people or property resulting from any ideas, methods, instructions or products referred to in the content.

