1. Introduction
In recent years, heavy rainfall events have caused, in many German cities, considerable damage to properties and, in some cases, even personal injuries to locals [
1], and are also affecting several other countries across the world due to the nature of their precipitations, which are also characterized by small spatial extent and short duration, resulting in unpredictable flash floods most of the time [
2,
3,
4].
In the past, heavy precipitation in conjunction with low-pressure areas [
5,
6,
7] has already led to enormous losses that had to be absorbed by the insurance industry [
8,
9,
10].
Until 2021, in Germany, Elvira and Friederike were the two storms that had created the most damages according to the insurance industry [
11]. However, these were clearly exceeded by the extreme precipitation recorded with recent storm Bernd, which caused heavy rainfall in eastern Belgium and western Germany between 13 and 18 July 2021 when, over a period of 24 h, these areas received as much rain as they usually do in a month and, unfortunately, as a result of the flash flood, more than 220 people died [
12]. According to estimates provided by the German insurance industry, more than 200,000 insured properties were affected and the total loss expenditure was predicted to be at least €6.5 billion [
12]. Thus, Bernd caused the largest natural disaster to date in connection with extreme precipitation and once again this unfortunate event demonstrates the sensitivity of settlement areas to such heavy rainfall events. The precipitation initially led to urban flash floods and the overflowing of smaller watercourses. As the duration of the event and the rainfall continued, larger watercourses such as the Ahr, Emscher, Ruhr and Wupper also overflowed their banks. Due to the large-scale, persistent heavy rainfall, orographic conditions and saturated soils, this combination led to a potentiation of the damage effect. To provide a clearer picture of the magnitude of the damages caused by Bernd,
Table 1 shows an exemplary selection of the major heavy rainfall events and the associated claims expenditure for the insurance industry in Germany. To enable a classification of the extent of damage, other heavy rainfall events from the past are also shown in
Table 1, and the results displayed confirm the extent of the damage caused by Bernd. For further information, please refer to [
13,
14].
Unfortunately, current climate change projections indicate a future increase in such heavy rainfall events in terms of frequency and intensity [
15,
16,
17,
18,
19,
20,
21,
22,
23,
24,
25,
26,
27]. An important link between rising global temperatures and the increase in heavy rainfall events is the thermodynamic Clausius-Clapeyron relationship [
28,
29,
30,
31,
32,
33,
34]. According to the associated equation, rising temperatures usually lead to a change in the water vapor absorption of the air. For each degree of temperature increase, the air can absorb about seven percent more water vapor. This development is favored by rising evaporation rates because of increasing temperatures worldwide, therefore, the heavy rainfall events are predicted to increase in the future.
Full protection against such events is not possible yet. Urban drainage and the associated municipal flood protection are therefore somewhere between drainage comfort and flood protection. The core task of urban drainage is to cope with frequent precipitation events with return periods of 1 to 5 years [
35,
36,
37,
38]. Such precipitation events are regarded as design rainfall for the sewage system, with the aim of ensuring that there is no overflow. Thus the drainage comfort to be provided by the municipality has clear limits. This applies to rain events with a low probability of occurrence or a large magnitude, which exceed the design specifications for drainage systems [
39,
40,
41,
42,
43]. Special municipal flood prevention is then necessary for such events and risk assessments are a crucial element of this flood prevention because the primary goal is to limit the expected damage.
Flooding itself can be understood as a temporary inundation of land not normally covered with water; however, there are multiple types of flooding. Fluvial flooding is based on the existence of a body of water from which the flooding of the surrounding areas (rivers) originates. The floods thus occur because of the outflow of the surface water body. In large catchments, long-lasting precipitation evenly distributed in time and space leads to pronounced flooding. However, especially in small catchments with an area of around 100 km
2, heavy rainfall events can also lead to an interaction between surface runoff and the flowing water. Adjacent areas can also be flooded for a brief time [
44]. Pluvial flooding is one of the most difficult to predict against and, for this scenario, precipitation-generated surface runoff can be identified as the main cause. Heavy rainfall events lead to high water levels and flow velocities at the surface due to their high precipitation intensities, small spatial extent and high precipitation amounts. During heavy rainfall events, drainage systems are usually at their hydraulic capacity limits, so that surface runoff can no longer be drained or collected. Wild surface runoff is the result [
45]. Overloading, overflow and sewer-induced flooding occur if wastewater in a drainage system no longer flows in the gravity flow but under pressure, but does not yet rise to the surface, which is also considered as overloading. If the water level reaches or exceeds a certain reference level, the condition of overflow is reached. The reference level can be selected between the sewer apex and the ground surface, and at the same time correspond to the backwater level of the municipal drainage statutes. As a rule, the ground level of the manhole cover is selected as the relevant reference level. If this level is exceeded, water will leak onto the surface, especially onto the road surfaces. The curb of the road space can thus still be used as a retention space. In this system state, no damage is caused by surface water penetration into buildings. Furthermore, in the system state of flooding, surface runoff is prevented from entering the sewer system or, equivalent to overflow, water escapes at the surface. However, because of further exceedance of the reference level and of the street space, surface infiltration into buildings is to be expected if no suitable protective measures are in place [
46]. In all the systems stated (overload, overflow, sewer-induced flooding), damage can occur in the connected buildings below the reference level because of backwater, provided there are no backwater protections in the private network.
Thus, to be able to counter the dangers from heavy rainfall events, it is first of fundamental importance to know their cause and characterize the basis for hazard prevention and municipal heavy rainfall risk management, which is required worldwide [
47,
48,
49], adopting techniques such as early warning systems [
50].
The hazards from heavy rainfall arise from the large surface runoffs previously mentioned and their interaction with the sewer network. Surface runoff and the resulting flooding have two basic characteristics that can cause hazards: the depth of flooding and the flow velocity. These properties are significantly influenced by the runoff-relevant characteristics of the terrain, such as terrain slope, settlement and open space structures, development type, the structures and the drainage system’s discharge capacity [
51,
52,
53,
54].
An overview of the potential hazards for human health as well as for infrastructures and objects depending on flow velocity and flooding depths is provided in the following
Table 2. It is worth mentioning that the hazards due to heavy rainfall are not only induced by the flow velocity or the flooding depths, but also by the combination of both.
Absolute, complete protection against heavy rain and its consequences is not possible. The reduction of the potential damage and the risk of danger are therefore becoming increasingly important to identify and enable targeted, suitable precautionary measures across the world. During the last few years, the focus has been on technical protective measures, however, purely technical options are being replaced by a holistic, integrative heavy rainfall risk management [
55,
56,
57,
58]. This considers both technical, structural protective measures for the drainage and retention of water, as well as suitable pre- and aftercare measures, and primarily takes place at the municipal level. The foundation of this communal task is formed by the heavy rain hazard maps. The detailed representation gives all actors involved the opportunity to protect themselves in the best conceivable way against the negative consequences of heavy rain, to reduce damage to buildings and infrastructures and to save human lives. For prevention, knowledge of flood areas, flow paths and neuralgic points in the settlement area is indispensable [
59,
60,
61].
Whereas in the past, in Germany, the heavy rain hazard maps were put out to tender by the municipalities and published on their own responsibility; in 2021 there was a change in the way the information was published. The Federal Agency for Cartography and Geodesy (BKG) has published the Heavy Rain Hazard Information Map for the federal state of North Rhine-Westphalia (NRW) as a whole, across all municipalities. North Rhine-Westphalia is thus the first sub-region in Germany in which such a cross-municipal heavy rainfall map has been published. Other federal states are to follow in the future, so that a uniform Germany-wide heavy rain hazard map is created. Municipalities that do not yet have their own heavy rain hazard maps are recommended to use the Heavy Rain Hazard Information Map as a first valuable tool for flash-flood risk management and to use the information it contains regarding flooding depths and flow velocities for hazard prevention. On the other hand, municipalities that already have their own heavy rain hazard maps are thus given a supplementary opportunity to check the plausibility of their own maps and thus gain further insights into potential hazard areas in the urban area. Other important sources of information for comprehensive information gathering can include municipal general drainage plans, sewer network calculations and online map services. On-site inspections can additionally check the accuracy of the results in the heavy rain hazard maps [
62,
63]. Deviations between the simulation and the in-situ situation cannot be ruled out, as the simulation only represents an image of reality and thus errors in the simulation are unavoidable [
64,
65,
66,
67].
With the publication of the state-wide heavy rainfall map, however, the municipalities are immediately confronted with new challenges. The municipal duty of precaution, which the municipalities have towards the citizens, not only includes the precaution of hazard prevention, but also the precaution of information. Only if citizens are aware of the hazards can they take responsibility for their own private precautions against heavy rainfall. Considering the German legislation, every person is obliged to this private precaution to a reasonable extent. From this, in turn, a duty of information disclosure by the municipalities can be concluded [
68].
As a result of the publication of the heavy rainfall maps, the municipalities can expect an increased need for consultation with other departments, committees, politicians and, finally, the public. At the same time, the lack of specialized personnel is already leading to an increased workload of the existing municipal staff with the daily tasks of urban drainage. Therefore, there is no scope for measures in heavy rainfall risk management, which have only a comparatively small effect in the short term because municipalities tend to optimize the limited available human and financial resources for the momentary issues. To support municipalities in this process, it is important to identify and initiate the first most urgent measures after receiving or publishing the heavy rain hazard map.
Thus, to address this gap, this paper is therefore intended to provide an insight into the first most urgent measures, to present a methodical procedure for analyzing existing maps and to illustrate which methodology can be used to further narrow down the most urgent measures in municipalities to their own needs and requirements, considering individual criteria.
2. Materials and Methods
The following section explains the chosen methodological approach. The aim of this procedure is to develop the necessary tools (list of measures, ranking methodology) so that German municipalities can prioritize and rank the necessary immediate measures (<100 days) based on the information that can be gathered for the heavy rain hazard maps. In Germany, a 100-day timeframe is a typical political threshold in the public debate, up to which sufficient action is expected at the latest and at which it is also checked in the public debate whether sufficient action has been taken. Accordingly, this threshold was also used by the network operators involved to categorize the measures.
The ranking of these 100-day measures is to be independently conducted by the municipality based on a multi-criteria evaluation. The methodological procedure is divided into the following steps (
Figure 1):
- Development of the catalogue of measures (literature research).
- Prioritize measures (short-term measures recommendation) (100 days): Transfer the catalogue of measures into a list of short-term (100 days), medium-term (<18 months) and long-term measures in consultation with five selected wastewater utilities.
- Add degree of implementation to prioritization (implementation recommendation): further subdivision of the short-term measures depending on the implementation status of the five selected drainage system companies and listing of all measures with implementation status “high” (implementation recommendation).
- Confirm implementation recommendation: comparison with experiences from the municipal network of drainage system companies KomNetAbwasser (a municipal initiative of more than 80 wastewater utilities) through anonymized query (“mentimeter”) of the degree of implementation in the context of a members’ online meeting. If necessary, the list of measures is adjusted.
- Development of a ranking procedure: use of the AHP (analytic hierarchy process) method to derive a time-based 100-day action plan from the list of short-term measures, together with the five wastewater companies as well as the sample municipality of the case study.
- Implementation/validation of all previous steps in a sample municipality and thus develop a 100-day action plan for this case study.
2.1. Development of the Catalogue of Measures
The basis of all the following methodological steps is an extensive literature search on measures for protection against heavy rain. The measures identified in the literature are transformed into questions so that they can be answered later by the wastewater companies. The questionnaire divides the measures into the following categories. Two exemplary questions are presented for each category. The result is a catalogue of all possible protective measures.
Organizational:
Risk communication and public relations:
Risk:
Action planning and implementation:
Have vulnerable localities, neuralgic points and critical infrastructures been prioritized?
Do control lists exist for immediate measures to be taken when severe weather warnings are received?
River water:
Based on the response to these questions, it is possible to draw conclusions about the corresponding measures that can be derived from it. In this way, a complete catalogue of all measures is created.
Since the focus of this paper is on dealing with heavy rainfall, reference is also made to previous work conducted on this topic [
69]. Furthermore, this category is only to be answered by the municipalities if flash-flood risks according to the European Flood Risk Management Directive are present in the urban area.
2.2. Prioritize Measures
The overall catalogue developed in work-step 2.1 is then to be converted into so-called “lists of measures” in consultation with five selected wastewater companies. In this way, a total of three lists of measures are created, which classify all of the measures in terms of time, considering the experiences of the employees. The catalogue of measures is thus transferred into the lists of short-term, medium-term and long-term measures. If the respective measure is to be put into practice or implemented within 100 days, this corresponds to a “short-term” measure. Periods between 101 days and 18 months are considered “medium-term”. If the measures require more than 18 months, this corresponds to a “long-term” classification.
The aim is to strengthen the exchange of municipal experience. Municipalities that are in the initial stages of heavy rainfall prevention should benefit from the experience of the selected municipalities.
Table 3 shows an overview of the municipalities participating in the survey. To provide an initial orientation, the length of the sewer network and the number of inhabitants are also shown. Furthermore,
Table 3 also shows initial information from the municipal case study, to which the findings will be applied later.
The selected drainage system companies surveyed, Rheda-Wiedenbrück, Duisburg, Emmerich, Schwerte and Bochum, are all members of the municipal network of the drainage system companies [
70]. The selected municipalities offer a broad spectrum in terms of both sewer network length and the number of inhabitants. Thus, a wide range of experiences from smaller municipalities, such as the city of Schwerte, as well as from large cities such as Bochum, can be included. The drainage system companies surveyed have already implemented various projects in the past and can look back on many years of experience in dealing with heavy rain. For example, Rheda-Wiedenbrück has already participated as a leading municipality in the research project: “Dealing with heavy rainfall events in sewer operations” [
71]. In Duisburg, the pilot project “Regenagentur Duisburg” was initiated by bundling all competences of urban drainage, climate impact adaptation and heavy rainfall management [
72]. In the selection, Emmerich represents a municipality that is affected by river floods, due to the short spatial distance to the Rhine, as well as by heavy rain floods. Emmerich also participated in the research project [
71]. Schwerte also has many years of experience in dealing with heavy rainfall and runs extensive citizen information programmes. Bochum can be described as one of the leading municipalities in climate impact adaptation in the Ruhr metropolitan region. In particular, the “sponge city” principle is actively applied here.
2.3. Add Degree of Implementation to Prioritisation (Implementation Recommendation)
After a temporal classification has been made by the five drainage system companies in the previous step, the short-term measures identified in this way are to be further prioritized by the five selected drainage system companies depending on the implementation status. For this purpose, the respective implementation status in these municipalities is considered.
If a measure is already being implemented in the municipality, this indicates its high importance for dealing with the consequences of heavy rainfall. The short-term measures identified in the previous section can thus be further differentiated in terms of their urgency (degree of implementation). A further evaluation scheme is used for this purpose:
If the short-term measure is being implemented in one of the five municipalities or has already been successfully implemented, it receives three points. If it has not been implemented but is only classified as a short-term measure, it receives one point. If a measure has been implemented in all five municipalities or municipal drainage companies, the total number of points for this measure is 15. The measure then has the highest priority for implementation.
The minimum score therefore corresponds to five points, i.e., the measure was only classified in terms of time, but not implemented in any municipality. It thus has a low priority within the short-term measures.
As a result, the ten short-term measures with the highest degree of implementation are identified. For these, it is assumed that they are to be implemented with the highest priority by a municipality after receiving the heavy rain hazard map. The scale classification of short-term measures (<100 d), further prioritization considering the implementation status in the surveyed five wastewater companies, included a category labelled as “high” (15 points), one called “medium” (13–11 points) and a final one named “low” (9–5 points).
2.4. Confirm Implementation Recommendation
For the validation and classification of the entire catalogue of measures, as well as the most urgent, short-term immediate measures developed after receipt of the heavy rain hazard map, the experiences of the municipal network of wastewater companies (KomNetAbwasser) were considered. The aim of this network is to support each other in technical issues and in the operation of wastewater facilities. The participating municipalities represent a total of over 6.7 million inhabitants. Furthermore, a total of about 30,000 km of wastewater and stormwater sewers to be serviced belong to the area of responsibility of these municipalities. To calculate these values, freely available information from the websites of the respective municipal drainage companies was used. Missing information regarding the sewer network lengths was determined by calculating the average length of the sewer network per 1000 inhabitants (km per thousand inhabitants). This value is then accordingly multiplied by the number of inhabitants of the participating municipality if no information on the sewer network length is available.
The plausibility check (validation) of the results obtained is conducted within the framework of the so-called “wastewater consultation hour”. The KomNetAbwasser consultation hour serves to provide information, discussion and exchange of experience. Employees of the municipal drainage companies participating in the network are invited to attend (online meetings). Invitations for the wastewater consultation hour are sent out weekly via an e-mail distribution list. This distribution list contains the contacts of over 450 employees from the municipal drainage companies. Participation in the wastewater consultation hour is voluntary. In this case, employees from 19 different wastewater companies took part in the survey. These participants expressed great interest in the topic and the need for advice on dealing with heavy rainfall. Using the survey tool “Mentimeter” [
73], there was a basic qualitative agreement between the most urgent measures, the implementation recommendation and the experiences of the participants in the wastewater consultation.
The result of this process is a total of ten validated measures with a high priority. According to the experience of the wastewater companies, these measures should be implemented within 100 days.
2.5. Development of a Ranking Procedure
To be able to work out a 100-day action plan from these measures, a ranking procedure is developed. For this purpose, criteria for decision-making were developed in a structured discussion process both in the “wastewater consultation hour” and with the employees of the municipal case study. Particularly in the municipal case study, the dialogue showed that personnel capacities must be considered as a limiting factor for the implementation of measures. As a result, the existing or deployed staff should be relieved of their current tasks and responsibilities as little as possible.
The employees of the municipal case study and the interviewed wastewater companies, through the criteria “Additional Costs” and “Resource Commitment” for the ranking procedure, are both aspects that are captured in the discussion processes with the participants of the wastewater consultation. The AHP method [
74] is then used for further multi-criteria decision analysis. This decision-making process, referred to in the following as AHP analysis, has advantages due to its suitability for use in political committees.
This multi-attribute decision model is based on the analysis and evaluation of existing data and information. Based on defined criteria, decisions can be made through a multi-criteria evaluation of alternatives [
75].
The starting point is a defined goal, which is characterized by various criteria. In the course of decision-making, alternative courses of action are evaluated because of their individual criteria and, finally, a preferential alternative is identified by comparing them. The main prerequisite for decision-making by means of AHP is that the decision-maker has precise preferences regarding the benefit to be interpreted, the weighting and the characteristics of the criteria. The classical AHP represents a theory for decision support such as utility analysis. Particularly in poorly structured decision-making situations, the AHP serves to hierarchically order and evaluate complex facts. Since the analysis of the criteria under consideration is characterized by subjective feelings on the part of the decision-maker, it is fundamentally not possible to represent the decision-making process by means of a general closed mathematical model.
The procedure itself serves to support decision-making by structuring the facts. The overarching goal of the AHP is to determine the optimal alternative course of action from a multitude of possibilities. This is made possible for the decision-maker through the step-by-step determination of a standardized utility value and the subsequent comparison of the alternative courses of action. The entire analysis is conducted in one step, so that a rapid solution can be found through the AHP analysis. Through the method, both qualitative and quantitative information can be analyzed and combined for decision-making. For the comparison of the decision alternatives, the nine-point rating scale according to (Saaty, 2001) can be used to weight the criteria and alternatives of the decision process. The rating scale is shown in
Table 4.
For further explanations, especially of the mathematical foundations of the Analytic Hierarchy Process (AHP), reference can be made to [
74,
75,
76,
77,
78].
For the AHP analysis in the municipal case study (see
Section 4), the programme “DEMUS—Decision Management for Underground Infrastructure” was used. This decision tool was developed and programmed as part of the dissertation by [
79]. The software is based on the AHP analysis. DEMUS makes it possible to make a transparent and comprehensible decision based on two successive steps. First, all criteria of the decision problem and their relevance to each other must be determined. Then, the criteria are to be evaluated regarding the alternatives. In addition to the evaluation scale already presented according to [
74] (cf.
Table 4), it is also possible to use quantitative data. The same applies to risks of the decision problem. For further, more detailed explanations of the programme, please refer to [
79].
2.6. Implementation/Validation
Finally, the results are applied in a municipal application example. Due to the confidentiality agreement, however, the municipality cannot be named in more detail at this point.
For implementation, a selection of measures is made from the confirmed implementation recommendation, as not all measures can be immediately implemented due to limited personnel and financial capacities. This selection is determined for the municipal case study based on own preferences and is to be understood as a 100-day action plan for this specific case study.
In addition, the first implementation steps will be further specified. An analysis of the heavy rain hazard maps and a plausibility check of the map information will be conducted. The analysis is based on freely available (open source) data sources. In particular, the following sources should be highlighted at this point:
Municipal heavy rain hazard map
“Information Map” Heavy Rain Hazards NRW [
80].
Other open-source map services, especially Google Maps
Web presence of the municipality in the case study
ELWAS-Web (electronic water management network system for water management administration in NRW) [
82].
4. Case Study
In the following, the measures to be implemented within 100 days are identified in a municipal case study using the developed prioritization rule and an AHP analysis.
4.1. Situation
The municipal case study is in the western Münsterland, in the north-west of the federal state of North Rhine-Westphalia. In terms of landscape, the area is characterized by the so-called “Münsterländer Parklandschaft”, a comparatively flat terrain. This denotes intensive agricultural use on small-parcel arable land interrupted by small woods and rampart hedges [
83,
84] The municipality in the case study consists of two districts, each representing the central settlement area, with both districts being about four kilometers apart.
Table 8 provides a brief tabular overview of selected characteristics of the municipal case study.
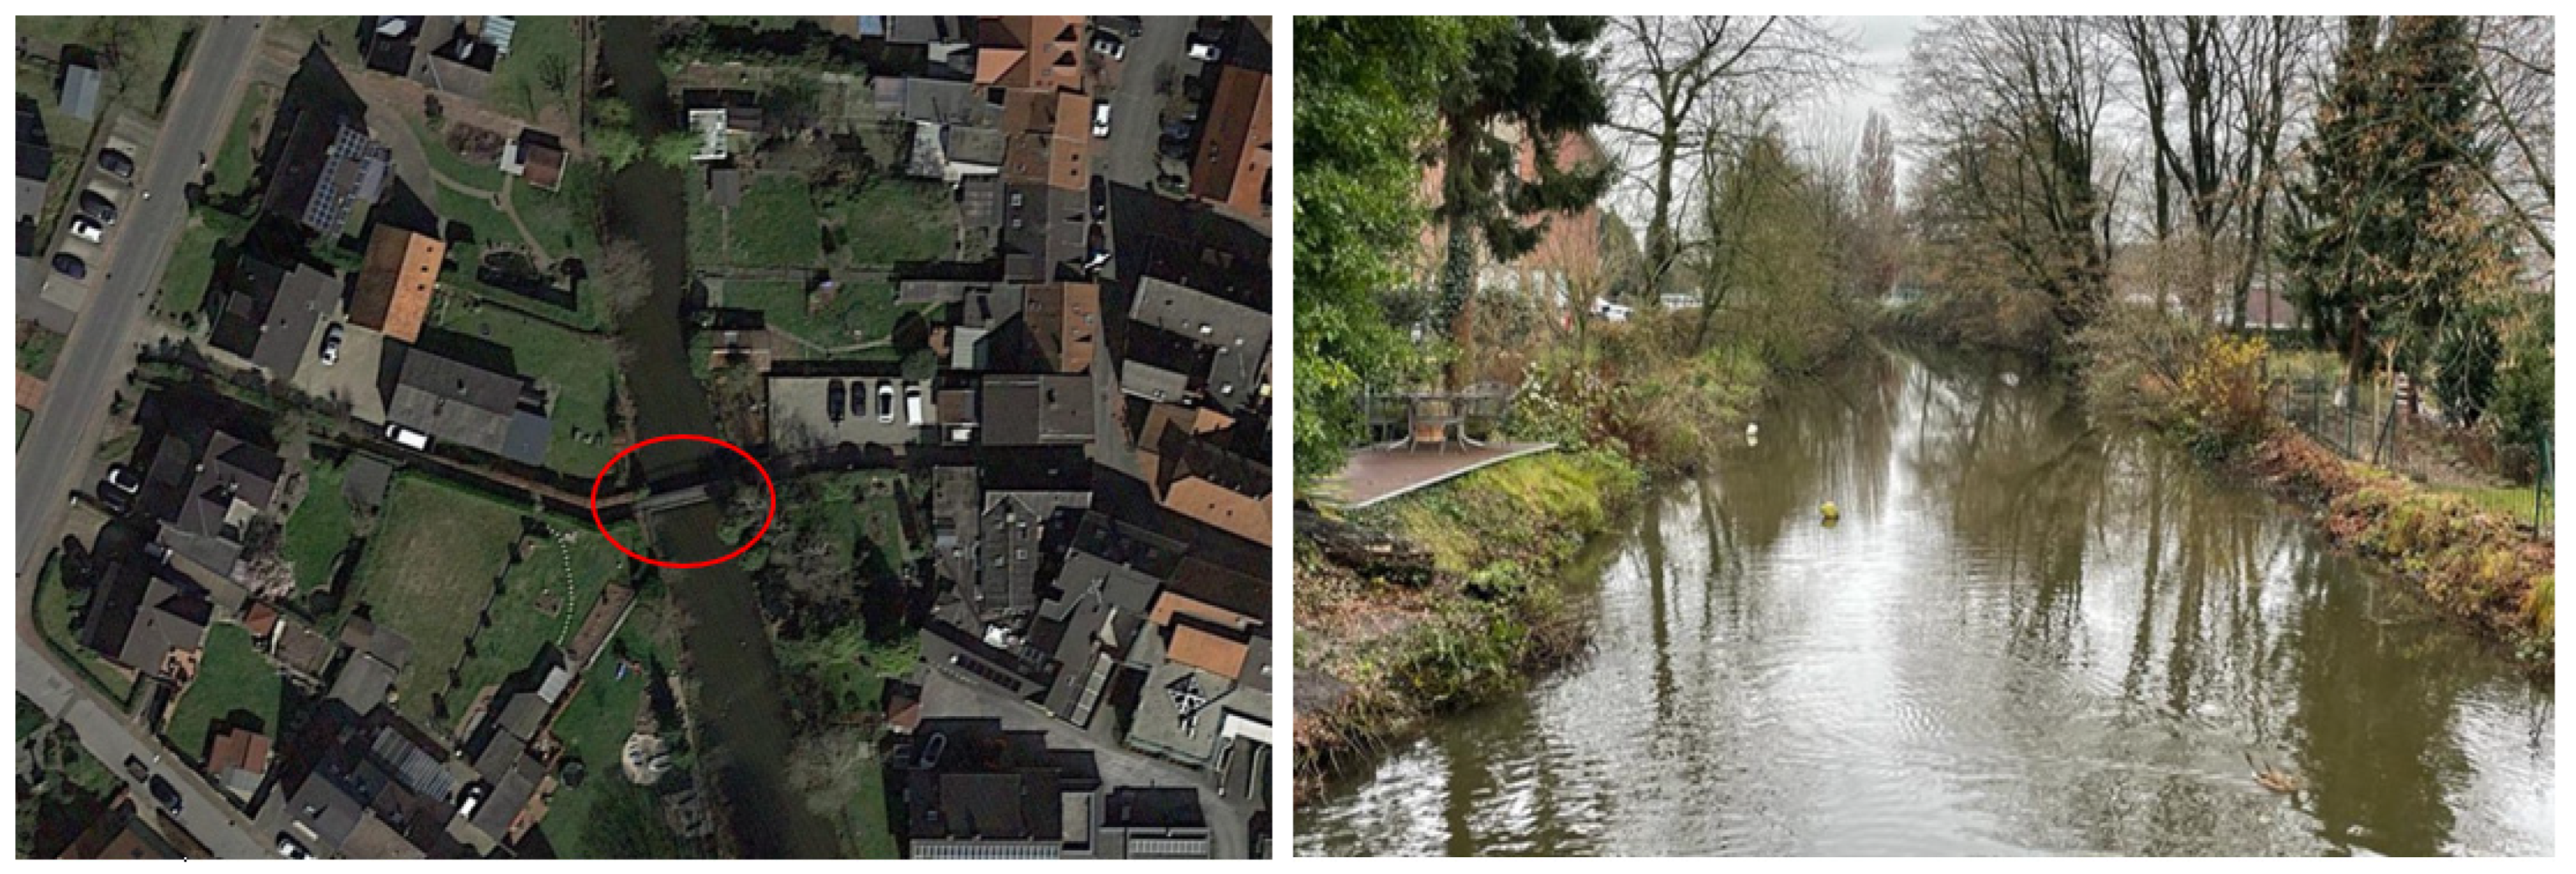
In both districts, there is the risk that waters can lead to flooding on the settlement area already from an HQ100, especially due to the short spatial distance between the flash flood risks and the built-up area. As a result of two heavy rainfall events in 2016, flooding occurred in the entire urban area of the case study, both in the vicinity of the flash-flood risks (fluvial flooding) and far away from them (flash-flood flooding). A spatial classification of flash-flood risks and adjacent buildings is shown in the following example in
Figure 2.
In the municipality of the case study, protection against river floods is already a high priority. With the development of a heavy rain hazard map, the risk management has also begun. This heavy rain hazard map displays the heavy rain scenarios 2 and 3 according to [
85] for the area of the municipality (2: 42.5 mm in 1 h, 3: 90 mm in 1 h). Unlike the state-wide heavy rain hazard map, however, information is only available on the flood depths, but not on the flow velocities.
4.2. Selection of Measures of the Implementation Recommendation
Based on the implementation recommendation, the measures to be implemented in the next 100 days were selected in cooperation with the municipal officials. The publication of the maps to the citizens was classified as a measure that has already been implemented. Further information on the correct handling of the maps can be found on the website of the municipal drainage company.
In a discussion process with the stakeholders, the measures were further narrowed down with a view to the total capacities available. Finally, of the ten priority measures in the implementation recommendation, the following four measures (alternatives) were selected as feasible within 100 days and stored for the AHP analysis (prioritization) using the DEMUS software:
Information for citizens
Interdepartmental exchange
Clarification of responsibilities
Plausibility check of the map information
The criteria additional costs and resource commitment already presented in
Section 3.3 were used as further prioritization criteria. These were assessed by the municipality’s staff as shown in
Table 9. In the case study, the criterion “additional costs” is more important than the criterion “resource commitment”.
Taking this weighting into account, the evaluation of alternatives 1 to 4 is conducted in the pair comparison (
Table 10).
As with the pairwise comparisons in
Table 9 regarding weighting criteria, the pairwise comparisons in
Table 10 were developed by municipal staff through a discussion process. The dominance of alternative 4 “
plausibility check of the map information” can already be clearly seen. This alternative is significantly more important than the other alternatives in terms of the “
resource commitment” criterion, but especially in terms of the “
additional costs” criterion.
This total weighting is based on determination of intrinsic values calculations and a program-specific fuzzification [
79]. Fundamentally, the total weights from the pairwise comparisons can be interpreted as follows.
The total weight indicates how important each alternative is with respect to the objective. The overall weight is determined by multiplying the scores of the alternatives in the matrix by the weights of the associated criteria. An alternative with a higher total weighting has a higher priority than one with a lower total weighting.
After all pairwise comparisons have been conducted, the results can be presented in DEMUS [
79] in a ranking taking into account the municipality-specific preferences. In the case study, the following ranking of the action alternatives resulted:
Plausibility check of the map information (priority: 0.698)
Interdepartmental exchange (priority: 0.166)
Information for citizens (Priority: 0.078)
Clarification of responsibilities (Priority: 0.059)
The plausibility check of map information is thus of outstanding importance for the example municipality. In this case study, the heavy rainfall map was divided into a grid (approx. 60 fields) and possible flooding focal points were identified for the individual grid fields and characterized by their flooding depths and flow velocities. In addition, the flood hazard maps [
86] and the elevation profiles [
82] were used to identify points of overflow from the watercourse, as well as flow paths on the site. The findings were summarized in a total of 19 risk notes (RH) for the urban area. The risk notes summarize the most valuable information for the area at risk of flooding and provide initial orientation for possible risk reduction measures.
Table 11 shows as an example risk notes no. 5 from the municipal case study.
To supplement the risk information with interactions with the sewer network, further information from sewer network calculations can also be included, such as network areas in the urban area at risk of flooding (sewer-induced flooding). In addition, areas that are not included in terrain models, such as subways or culverts, should be identified and, if necessary, considered in further calculations
4.3. Benefits
The nineteen risk notes and the hazard assessments are now available to those in charge of urban drainage as a concrete localization of focal points for action. They delimit the measures that will be necessary in the long term and form the basis for further coordination with the property owners concerned. In addition, for the first time, they provide a basis for concretely estimating the future implementation costs in the municipality, especially in the citizens’ advisory service, and also for substantiating a corresponding increase in personnel resources. A corresponding job advertisement is currently being prepared and has already been approved by the responsible bodies.
4.4. Discussion
The entire procedure has fundamentally proven itself in the case study. However, many aspects were only recorded very roughly. This was especially true for the number and gradation of decision criteria. Greater detail here would also allow for better individualisation of the decision-making process.
The availability of the data required for the heavy rainfall analysis can be assessed as very good throughout for the North Rhine-Westphalia area under consideration, especially with regard to the critical terrain data. Moreover, these data are available free of charge and in high quality. However, it should be noted that these data are only snapshots. Changes in terrain or land use, as well as changes in the predicted precipitation scenarios, can fundamentally call the validity of calculations into question.
The calculation tools used were commercial software that fully met the requirements. The project did not reveal any need for additional development.
Ultimately, however, the greatest obstacle to actually implementing the identified measures was the willingness of the municipal administration (especially the municipal drainage companies) to accept this catalogue of actions as a work assignment and to present it to the supervisory bodies in the municipality. Concerns may play a role here in that the task is assigned, but the necessary personnel capacities are not approved. Since the individual results of the work discussed here were also subject to a confidentiality agreement, this also facilitated the withholding of information.
5. Conclusions
Damage from floods has dramatically increased during recent decades across Europe and worldwide, particularly in low- and middle-income countries, and as previously mentioned, it is expected to increase in the future due to anthropogenic climate change [
87,
88,
89,
90,
91]. To address flood threat in Europe, the European Flood Directive (Directive 2007/60/EC, 2007) required the Member States to perform flood risk assessment and mapping, and to draft flood risk management plans (FRMPs). Flood mapping incorporates uncertainties regarding the natural phenomena (flooding) and those associated with the data and modelling. By having uncertainty linked with the information provided within the maps, there could be a lack of knowledge which reduces the ability to select the correct measures to reduce the impact of the natural phenomenon.
Thus, the Federal Agency for Cartography and Geodesy (BKG) in Germany published a cross-municipal heavy rainfall hazard map for the federal state of North Rhine-Westphalia in October 2021 in order to support municipalities that have already been active in the past in the context of heavy rainfall risk management, and are in possession of their own heavy rainfall hazards and risk maps so that they could use the state map for plausibility checks. However, drainage system companies that do not yet have such maps are confronted with an extensive need for advice from politicians, administrators and citizens immediately after publication.
With the publication of the state-wide heavy rainfall hazard map, prevention, post-event care, communication and action planning, therefore, become the focus of all stakeholders. However, the basis for successful heavy rainfall risk management is the most comprehensive knowledge possible regarding existing flooding hotspots in the urban area in order to develop suitable measures to reduce the risk of flooding. The municipalities are faced with the conflict between the obligation of municipal flood prevention to provide a certain level of drainage comfort and, at the same time, to make the best possible use of limited human and financial resources, and it is crucial to gain the most accurate information from hazard maps. Thus, this paper presented a methodical procedure for dealing with the available maps provided by local authorities in support of local municipalities in Germany.
Both the validated implementation recommendation and the AHP analysis of the municipal case study showed that the plausibility check of the map information is one of the most important, urgent measures after receiving the heavy rain hazard map, regardless of whether the map was produced by the municipality itself or by external bodies. Due to small deviations between reality and model, deviations could already occur in the modelling or simulation. Surface structural differences can have a major influence on surface runoff. Flooding situations can thus be further intensified, but also reduced. Another example of the plausibility check to be conducted is a differentiated consideration of piping and culverts. Depending on their size, they can unintentionally throttle runoff during heavy rainfall or, through relocation, no longer allow runoff. Such mechanisms can also unintentionally change flooding situations. Obtained results must be treated with some reservation due to the limited number of independent examinations (five municipality companies plus one more detailed case study).
As a permanent task, flood and heavy rainfall prevention will continue to present politics, the population and water management with tasks to be solved in the coming years. Citizens must be more involved in this process and communication. Since floods also occur away from watercourses, they often may not be aware of this danger; appropriate education and information work must then be promoted. Finally, it is essential to remember that flood-risk mapping is generally based on historically recorded water levels, but significant exceedances of earlier maximums may occur for: (i) climate change; (ii) for natural or artificial changes of the hydrological characteristics of creeks and rivers; (iii) for the land use change and regulation of riverbanks and creek banks; iv) for the unsatisfactory state of drainage systems. Therefore, municipalities should also regularly update their database to keep track of the changes linked with these factors.


