Article

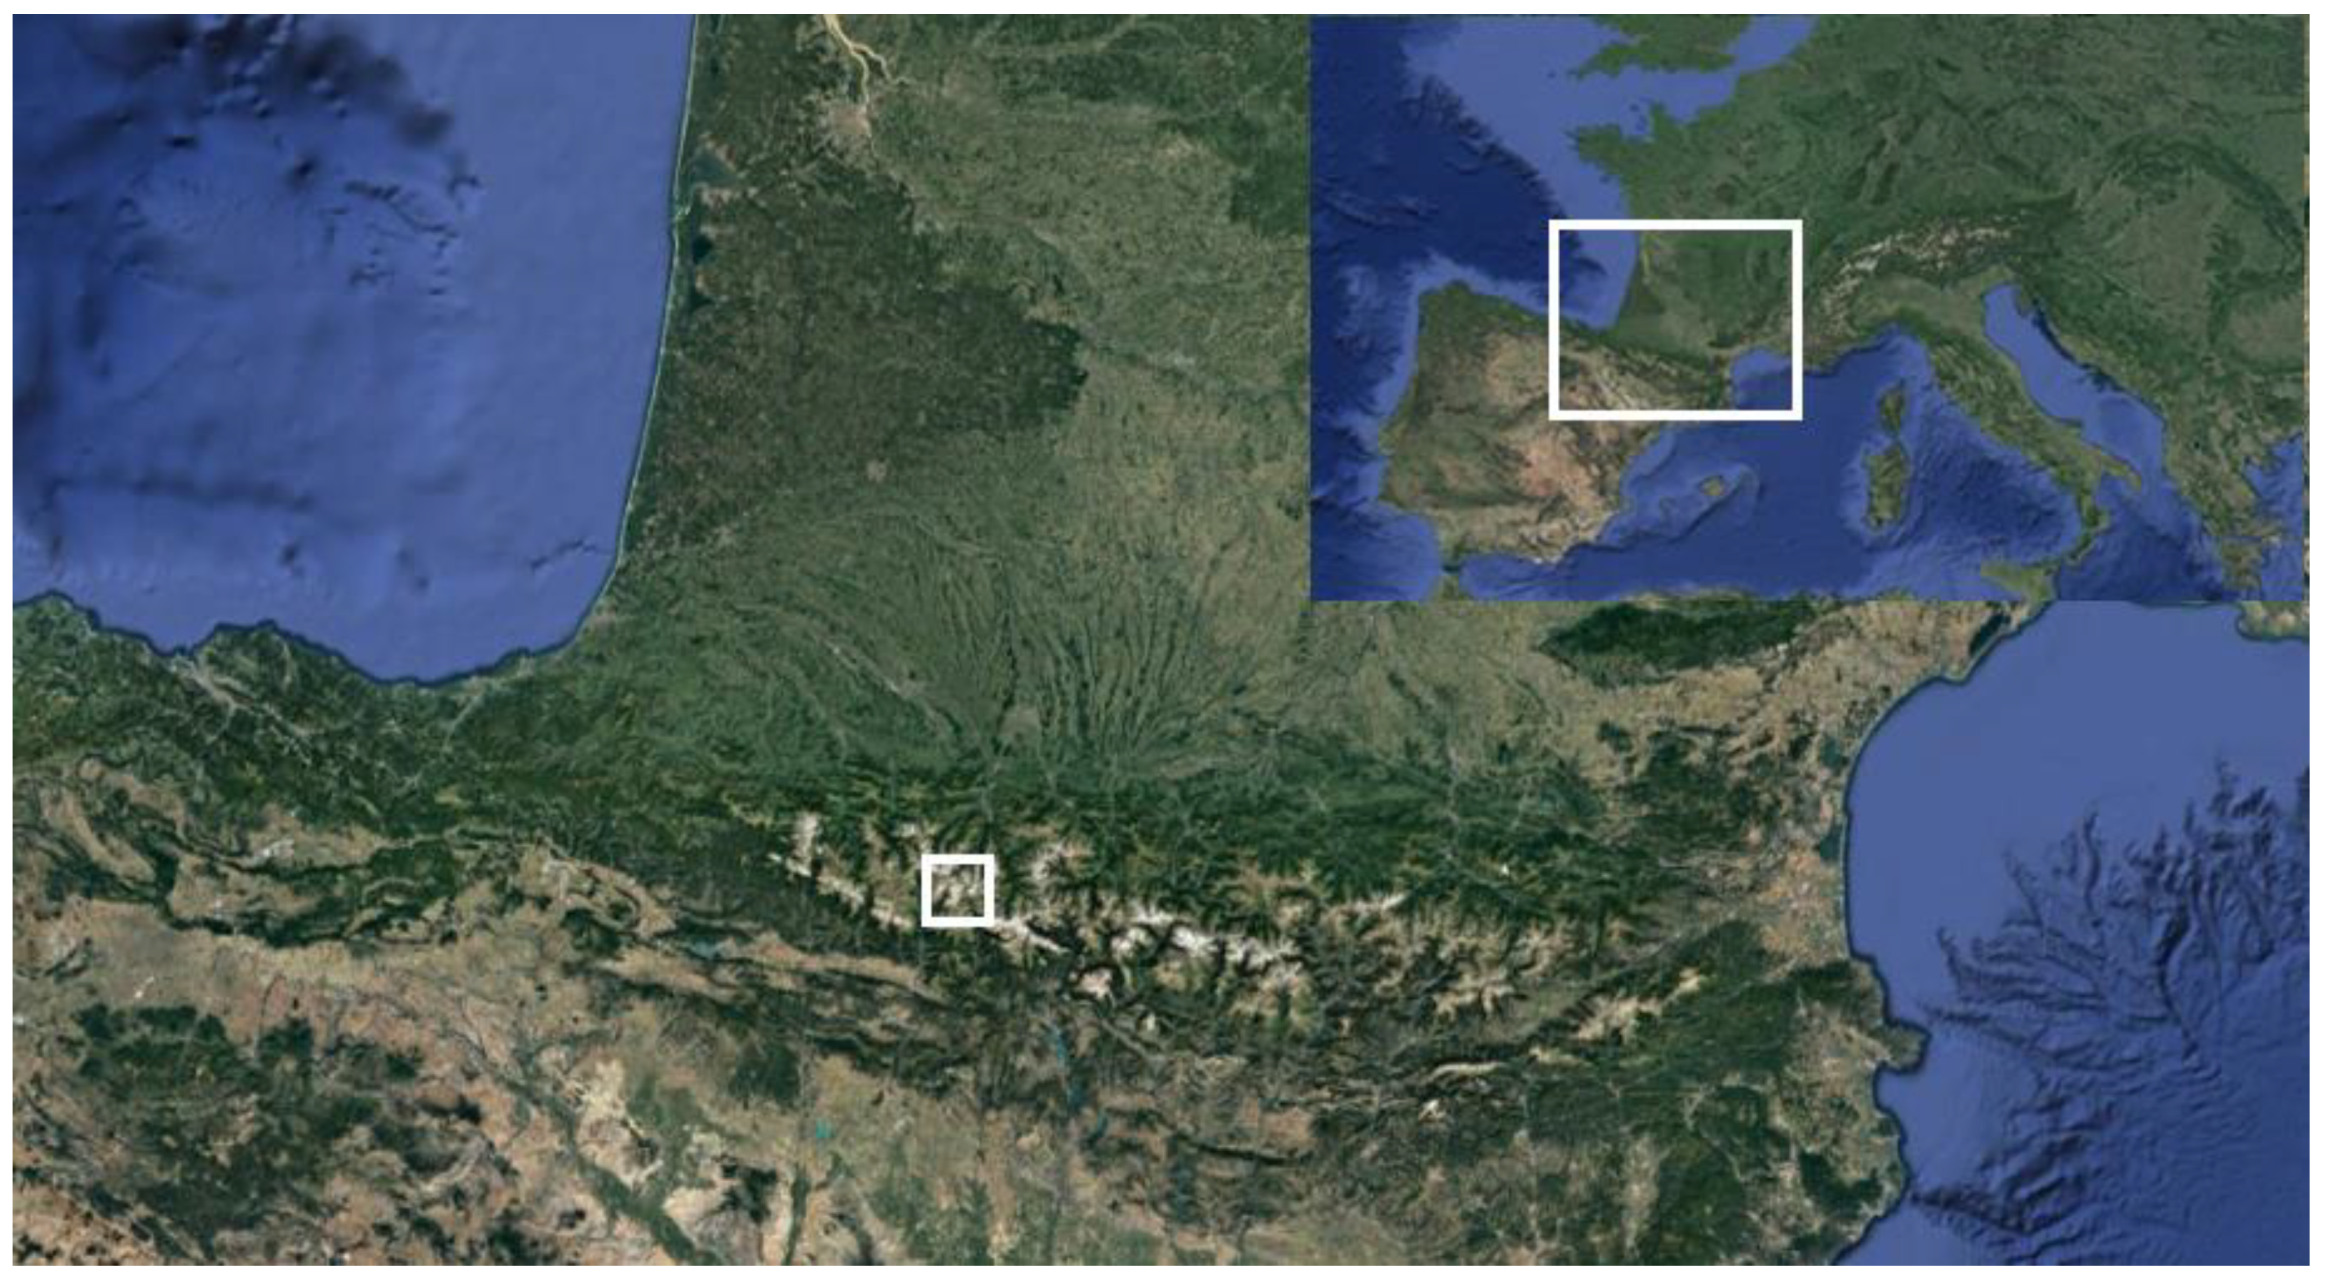
The Infierno Glacier (Pyrenees, Aragon, Spain): Evolution 2016–2022

by
Luis Cancer-Pomar
1,*,
Gonzalo Fernández-Jarne
2,3,
José Antonio Cuchí
4 and
Javier del Valle-Melendo
3,5
1
Department of Physical Geography and CEACTEMA, University of Jaén, 23071 Jaén, Spain
2
Department of Geography, St. Ignatius of Loyola High School, 31004 Pamplona, Spain
3
Department of Geography, National University of Distance Education (UNED), 28015 Madrid, Spain
4
Polytechnic School of Huesca, University of Zaragoza, 22007 Huesca, Spain
5
Centro Universitario de la Defensa de Zaragoza, 50090 Zaragoza, Spain
*
Author to whom correspondence should be addressed.
Geosciences 2023, 13(2), 40; https://doi.org/10.3390/geosciences13020040
Submission received: 1 December 2022 / Revised: 27 January 2023 / Accepted: 27 January 2023 / Published: 30 January 2023
(This article belongs to the Special Issue Mountain Glaciers, Permafrost, and Snow)

Abstract

:
The Infierno Glacier is located in Aragon (Spain), Pyrenees Mountain range, the only one in this country that still preserves white glaciers. These are the southernmost glaciers in Europe and are currently in rapid decline. The work analyzes the evolution of the glacier between 2016 and 2022 and provides data, for this period, which lacked this information, in an area bordering the glacial ice survival. In addition to the observations on the glacier itself, the variables (precipitation, temperature, snow volume and thickness) that allow an understanding of this evolution are studied. The results show a setback of the glacier (thickness losses: 4.6 m; front retreat; 14.9 m). The evolution has frequent trend changes, linked to the interannual climatic irregularity characteristic of the Pyrenees. The main explanatory factor is the thermal increase. The thermal anomalies with respect to the average reference values have increased, in this period, by +0.55 °C. The year 2022 has been particularly warm and has recorded the greatest losses for this glacier. With respect to precipitation, it has an irregular behavior and shows a tendency to decrease (−9% in the same period). This work has the additional interest of analyzing a glacier in the terminal phase, which if current trends continue, evolves into dead ice.

1. Introduction

The Pyrenees Mountain range, southern slope, is the home to the only remaining glaciers in Spain. All of them are located in the region of Aragon, province of Huesca. Its environmental interest is enormous since they are the most southern glaciers of Europe. They are in a situation that is limited for ice persistence due to different factors, such as the strong Mediterranean influences on the climate environment, the southern latitude (between 42°37′ and 42°50′ N) and moderate altitudes, with the Aneto Peak (3404 m a.s.l.) being the culminating point. In the last decades, due to temperature increases, glaciers are experiencing fast losses of surface and volume. Assuming that these climatic conditions will continue, these ice masses will completely disappear soon. The first reviews of these glaciers were published in the early nineteenth century and are due to enlightened explorers [1]. Later, at the mid-end of the nineteenth and early twentieth centuries, naturalists, geographers and geologists presented them [2,3,4,5,6,7]. Later, in the last decades of the 20th century, there was a surge of interest in the glaciers of this range, when several authors carried out specific studies and general surveys [8,9,10,11,12,13,14,15,16,17,18,19,20].
The retreat of the Spanish Pyrenean glaciers is all too evident. Their estimated surface area in the mid-19th century, at the end of the Little Ice Age, was 1291 ha [21]. In 1980, 641 ha were measured, representing a loss of 50%. In 2012 there were just 160 ha left, distributed among 10 small glaciers, representing a 75% of loss in three decades. Altogether, the loss of surface area between the mid-19th century and 2012 was 87.5% [16]. For the glaciers of the French side of this mountain range, the global data are similar [22,23,24]. For 2016, 242 ha are calculated on both sides of the Pyrenees (Spain + France), distributed between 19 glaciers [17]. In recent years, the strongly negative trend has continued, with the glacier area decreasing by more than 20% between 2011 and 2020 [25]. The retreat of the Infierno Glacier follows guidelines according to the general behavior of the Pyrenees. More precise data are specified below.
This evolution can be related to the one observed in the French Alps, located at a more northerly latitude and altitudes above 4000 m a.s.l., which have lost over 40% of their surface area since the end of the Little Ice Age and up to the beginning of the 21st century [26]. The general loss from 1980 to the middle of the last decade is between 25% and 40%, with significant variations depending on sectors [27,28,29], similar values to those registered in the Italian Alps [30,31]. Mass loss rates in the Alps, although high, are much lower than those reported for the Pyrenees.
The western sector of the Spanish Pyrenean glaciers is located in the upper valley of the Gállego River. This is a mountainous area with several peaks over 3000 m a.s.l. in altitude (Balaitus, 3151 m a.s.l., Infierno, 3082 m a.s.l., etc.), in which the Infierno Glacier is located (Figure 1). The coordinates UTM of the central point of this glacier are datum ETRS89. H. 30. X: 724170; Y: 4740446; Z: 2798 a.s.l.
The Infierno Massif is made up of metamorphic materials, mainly limestone, quartzite and marbles from the Devonian, which overlie the Cauterets-Panticosa granitic batholith. The Infierno Glacier is located in a deep cirque on the north-northeast slope, between the Central (3082 m a.s.l.) and Western (3075 m a.s.l.) peaks of the Infierno and flanked by two ridges that separate it from two other glacial cirques (Figure 2). Very close to the glacier there are several patches of dead ice (from some ancient glaciers that disappeared in recent decades) and a large rock glacier of 14 ha. In addition to the general works of Pyrenean glaciology mentioned above, the Infierno Glacier has been specifically studied [33,34,35,36].
This glacier is now a small mass of ice that has experienced a significant shrinkage: from 40 ha in the Little Ice Age to 14 ha in 1980 [16]. Since this date, the shrinkage has continued at an accelerated rate, reaching just 5.52 ha at the end of the summer of 2022, between 2929 m a.s.l. and 2698 m a.s.l. elevations, with an average slope value close to 50%. The length of the ice mass is 477 m, with a maximum width of 231 m. These measurements have been assessed by means of images captured from drones, in which we can see a profile that is becoming more concave every year, which indicates significant losses of thickness. The cross-slope profiles of the glacier, also made from drone images, confirm this view. The lower level is the lowest of all the Spanish Pyrenean glaciers. At present, despite its small surface and its concave and beveled appearance, some rims and crevasses persist. The surface measured in 2022 is smaller than the one the glacier had in the immediate previous years (7.06 ha at the end of summer 2020), as can be seen in Figure 3. 2022 was a catastrophic year for Pyrenean glaciers, with extremely high temperatures in crucial months for their evolution, notably between May and August, resulting in early fusion of the snow cover and strong ablation of the glacier ice. The high temperatures, with values well above the reference averages, have extended throughout October [37,38], as has similarly occurred in other European mountain ranges, such as in the Alps.
Owing to the mountain range location, between the Cantabrian and Mediterranean seas, the climatic conditions reflect the transition from an Atlantic to a Mediterranean climate altered by the altitude and locally modified by the orientation. There are no meteorological data for the glacier altitude in this area. Establishing the altitude-temperature correlations analyzed for other sites in the High Pyrenees [39,40], an approximate annual average temperature of 0 °C and precipitation over 2300 mm in the central area of the Infierno Glacier, at the 2850 m a.s.l. can be estimated according to the logarithmic correlation calculated [41]. Around 65% of this precipitation would fall in the form of snow, which makes it possible to calculate an annual snow accumulation on the glacier of 1516 mm of equivalent water.
Along with the significant areal loss that the glacier has experienced in recent decades, over the past few years a progressive covering of rocks from the surrounding cirque has been observed. This covering has partially affected the surface of the ice, largely in its eastern third and in its middle-bottom side, as well as in other quite dispersed sectors. The average percentage of debris-covered glaciers, which varies every year, can be considered around 1/4–1/3 of the surface of the glacier and is certainly increasing over the last few years, some of which have far exceeded these values. This phenomenon might be related to the progressive melting of permafrost at these altitudes and increasing periglacial processes (Figure 4). It is acknowledged that some centimeters of debris cover isolate the ice and reduce the melting process [42,43,44,45,46]. Despite this, these types of glaciers are becoming thinner, their velocity is modified, and it has been observed that there is compression of the ice through the weight of the debris cover [47]. This dynamic leads to expecting an evolution of the Infierno Glacier, or part of it, towards a debris-covered glacier, as noted in a previous publication [35]; a fact that we are able to confirm now, five years later. Either way, despite a general trend, some years a snow bed almost completely covers the debris cover. This was the case, for example, in 2018.
In the last years, the surface of the glacier may be considered divided into four sectors when it reaches the annual minimums, normally in the last days of August to early September, the usual summer-autumn transition dates at these high Pyrenean altitudes. The four sectors indicated are presented below, with their approximate percentage value. 1: High area of snow/firn accumulation, which marks the area above the equilibrium line (20%). 2 and 3: Intermediate area of outcropping ice (30–40%) and debris-covered glacier (30–40%). 4: Low area with lower slope and covered with firn (10%). This division into subunits is the most common in recent years of observations. However, the significant inter-annual variability in the state of the glacier causes frequent changes from year to year into this structuring “type”, which is strongly influenced by the changing volume of the protective snow cover at the indicated dates. This can be seen in Figure 5, with just one year difference (2020–2021).
The Infierno Glacier is part of a Protected Natural Space (“Natural Monuments of the Pyrenean Glaciers”) since 1990, due to its high scientific, cultural and landscaping interest with the aim to protect those ice mass surroundings [48]. We would like to emphasize the idea that the study of the Infierno Glacier is of great scientific interest. It entails studying a glacier set in the Pyrenees Mountain range, where the most southerly glaciers in Europe are located. Many of them have already been lost. The few remaining Pyrenean glaciers are absolutely unique ice masses.
Our starting hypothesis is well known today: these are glaciers in rapid retreat and are expected to have an end in sight. As they are located in the south of Europe, within a physical space and climatically limited conditions for the existence of these ice masses, the aim of this study is to validate this hypothesis by means of an “in situ” study of the Infierno Glacier. This paper synthesizes the results in the last years the glacier has been monitored (between 2016 and 2022) and analyzes its evolution in relation to climatic, hydrological and nivological data.
At the present time, and according to the trend observed in recent years, we may be witnessing the last phase of this ice mass as a glacier, before it can become a simple dead glacier-snow patch.

2. Materials and Methods

For the study of the Infierno Glacier, annual monitoring campaigns have been carried out. This period of seven years (2016–2022) has great glaciological interest in this case because it presents significant fluctuations in the thickness and length of the ice mass. This development was supported by detailed meteorological, hydrological and snow data. The research has been carried out by this team from 1998 until the end of 2022. Results from previous years, since 1998, have been already published [36].
The Tables and the Figures mentioned in this section have been organized as follows:
-
Table 1, Figure 6 and Figure 7: location of information data points and control points (Section 2).
-
Table 2, Figure 8, Figure 9, Figure 10, Figure 11, Figure 12 and Figure 13: meteorological and nivological variables (Section 3.1 and Section 3.2).
-

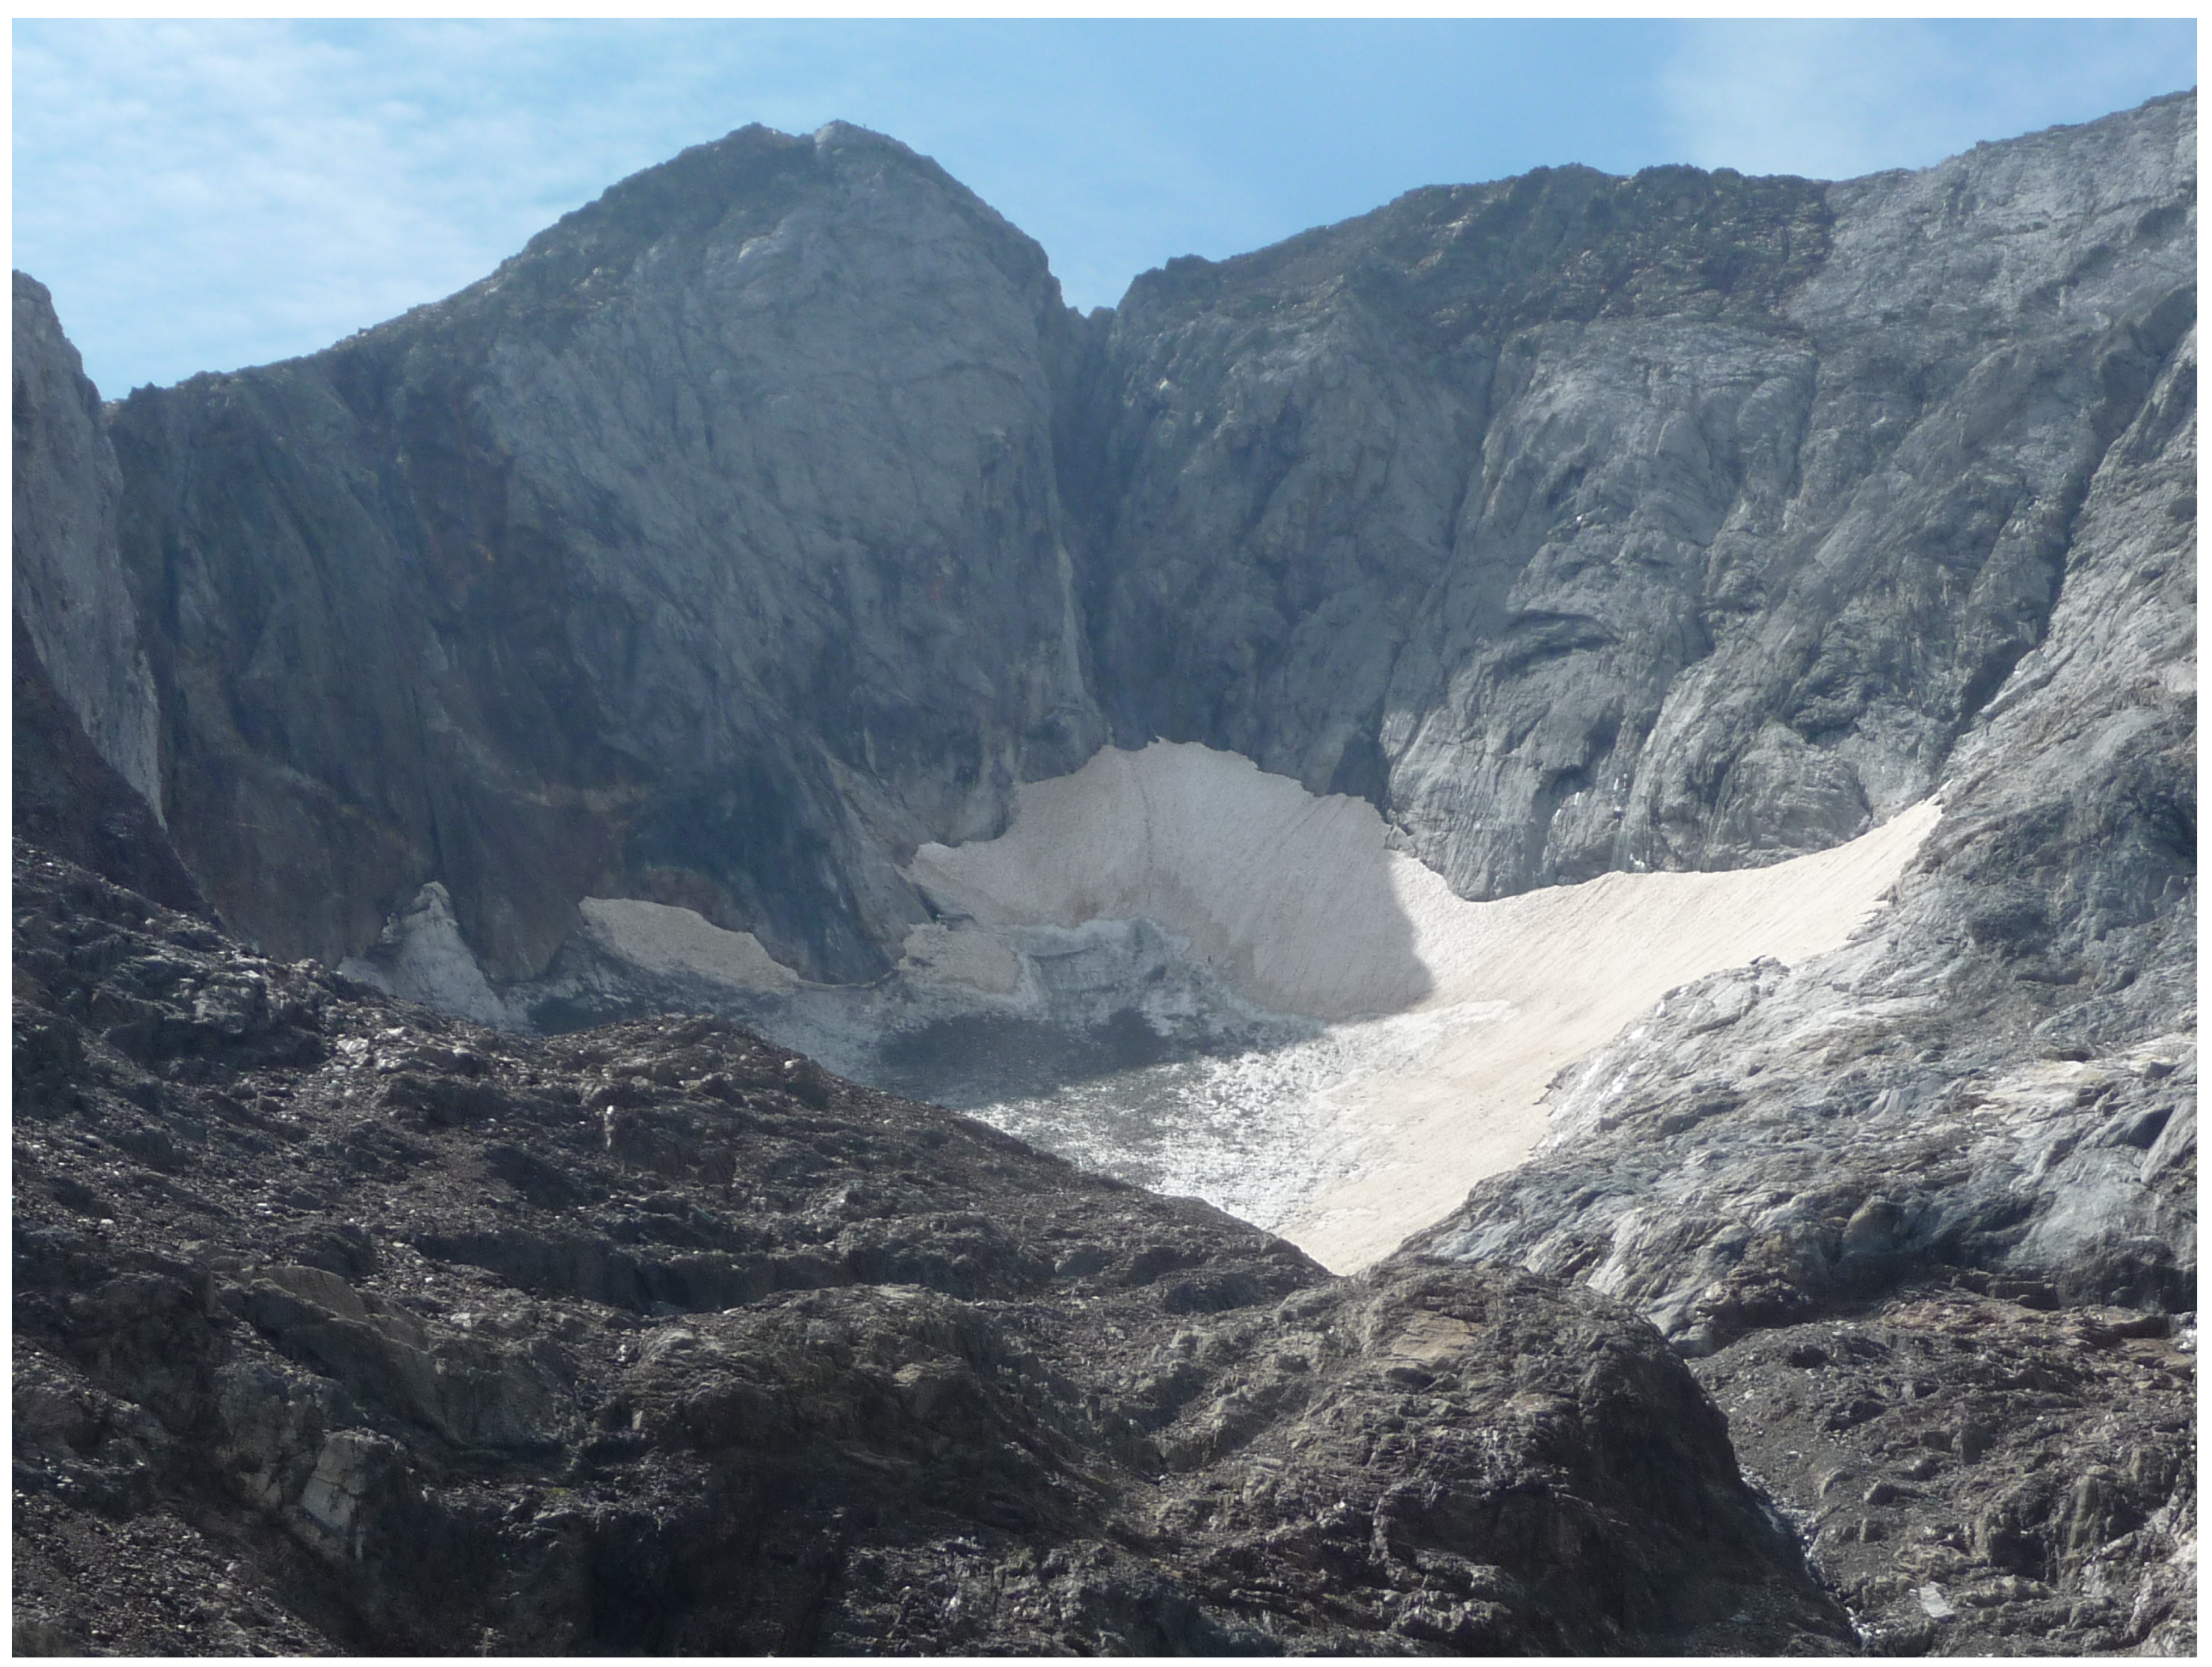
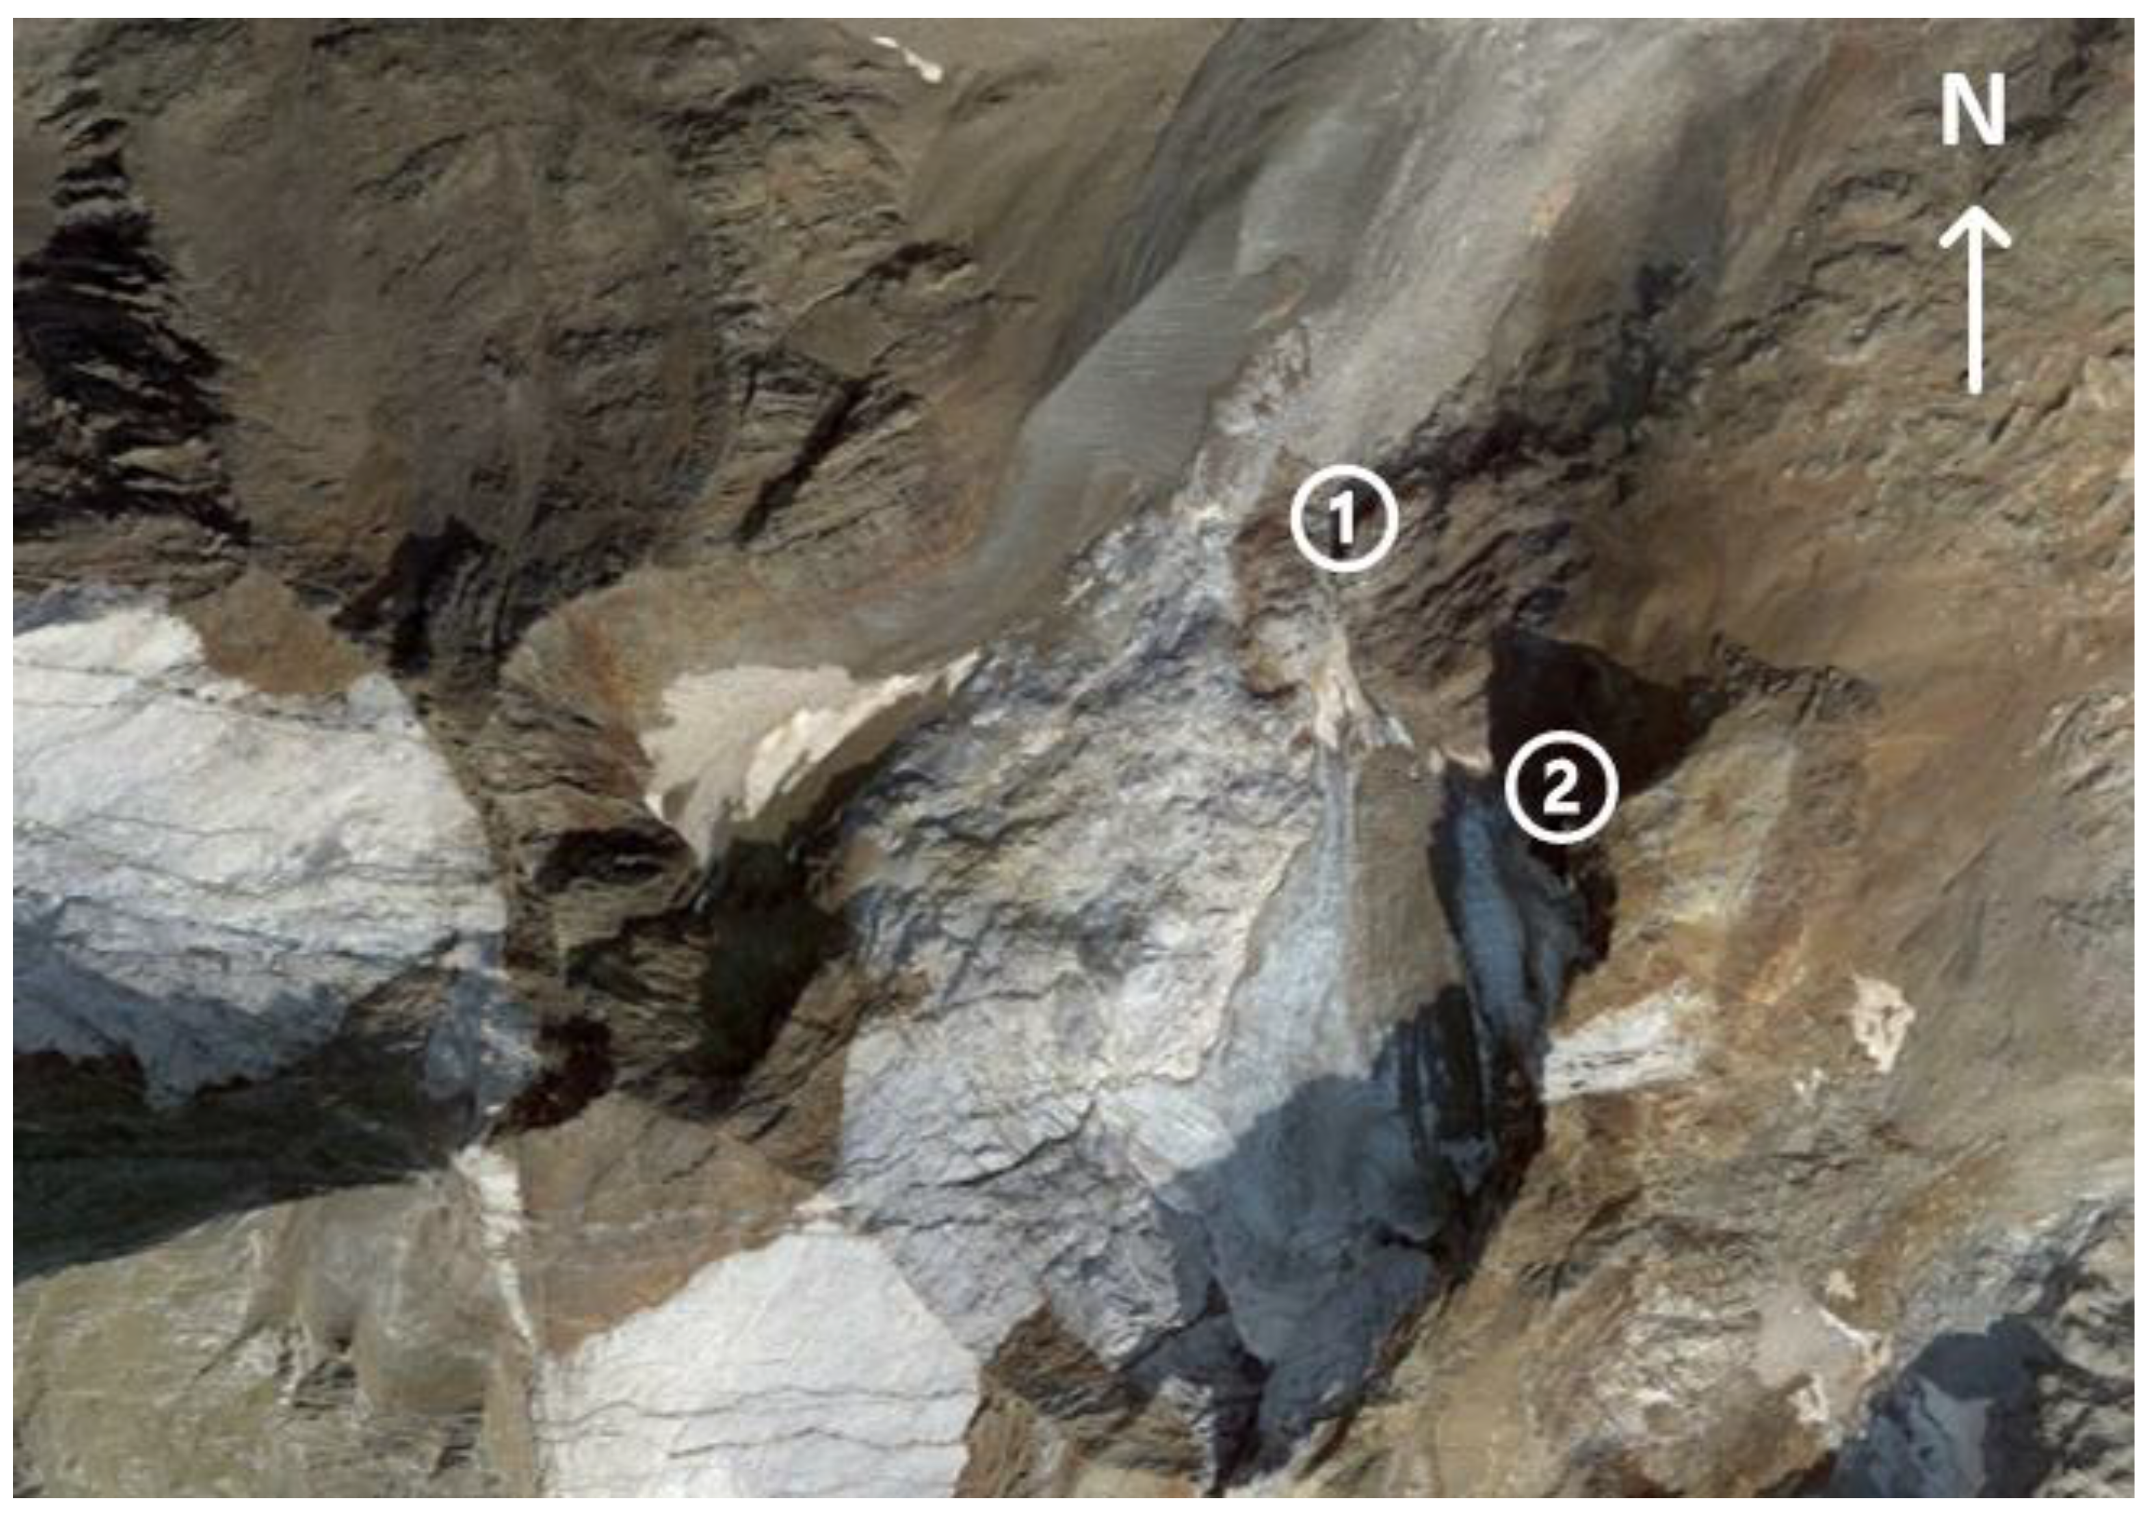
2.1. Measurements on the Glacier

The glaciological observations and measurements carried out in situ on the Infierno Glacier are a key part of this study. For this purpose, the glacier was visited yearly between 1998 and 2022. In the first year, 1998, two topographic control stations were set up using fixed measurement positions installed on stable rocks on the sides of the ice mass. These stations enable us to estimate the glacier fluctuations (ice plus snow cover, if any). In the indicated period, the measurements were taken in the days of climatic transition from summer to autumn, when the ice masses reach the annual minimum, and immediately before the coming autumn brings fresh snow precipitation to these high altitudes.
The characteristics of the glacier, embedded in a basin, with a steep longitudinal slope, surrounded at the head by cliffs and ending in a narrow gorge, have conditioned the study of its evolution. Rocks fall in the summer and snow avalanches in winter, both on the glacier and at its access, have only allowed systematic topography measurements in the lower zone of the glacier. Attempts to install poles to perform mass balances have failed. Sometimes they were swept away by avalanches of stones, others were covered and knocked down by heavy snow.
The distance to the glacier surface from the control stations is carried out by simple topographic methods (by tape and altimetry). The forms of the basin into which this glacier fits and its small interannual variations (it is a glacier of very reduced dimensions) allow the use of these methods.
One of the stations is located at the end of the glacier (“glacier front monitoring station”). This one can be ice or firn, in years with heavy snow. Its measurements indicate the longitudinal changes of this front, which in previous years was embedded in a narrow fracture canyon (less than 5 m wide), but in 2022 it receded, and it is above. For the present article, the glacier front in 2015 has been taken as zero value (ETRS89. H. 30. X: 724181; Y: 4740722; Z: 2677 a.s.l.).
The second station is located on the right-eastern side of the hollow ("lateral glacier monitoring station"), at the height of its lower third (ETRS89. H. 30. X: 724201; Y: 4740675; Z: 2717 a.s.l.) and the measurements taken from here are used to evaluate the variations in glacier thickness. This second checkpoint was chosen as appropriate for our objectives and for the safety reasons already explained. Year by year, we have seen that the measurements taken from here consistently reflect the changes in the glacier, in relation to the meteorological and nivological conditions of the previous year. Some auxiliary points have been used in snowy years.
These measurement results and the annual variations are shown in Table 3 and Figure 16, Figure 17 and Figure 18.

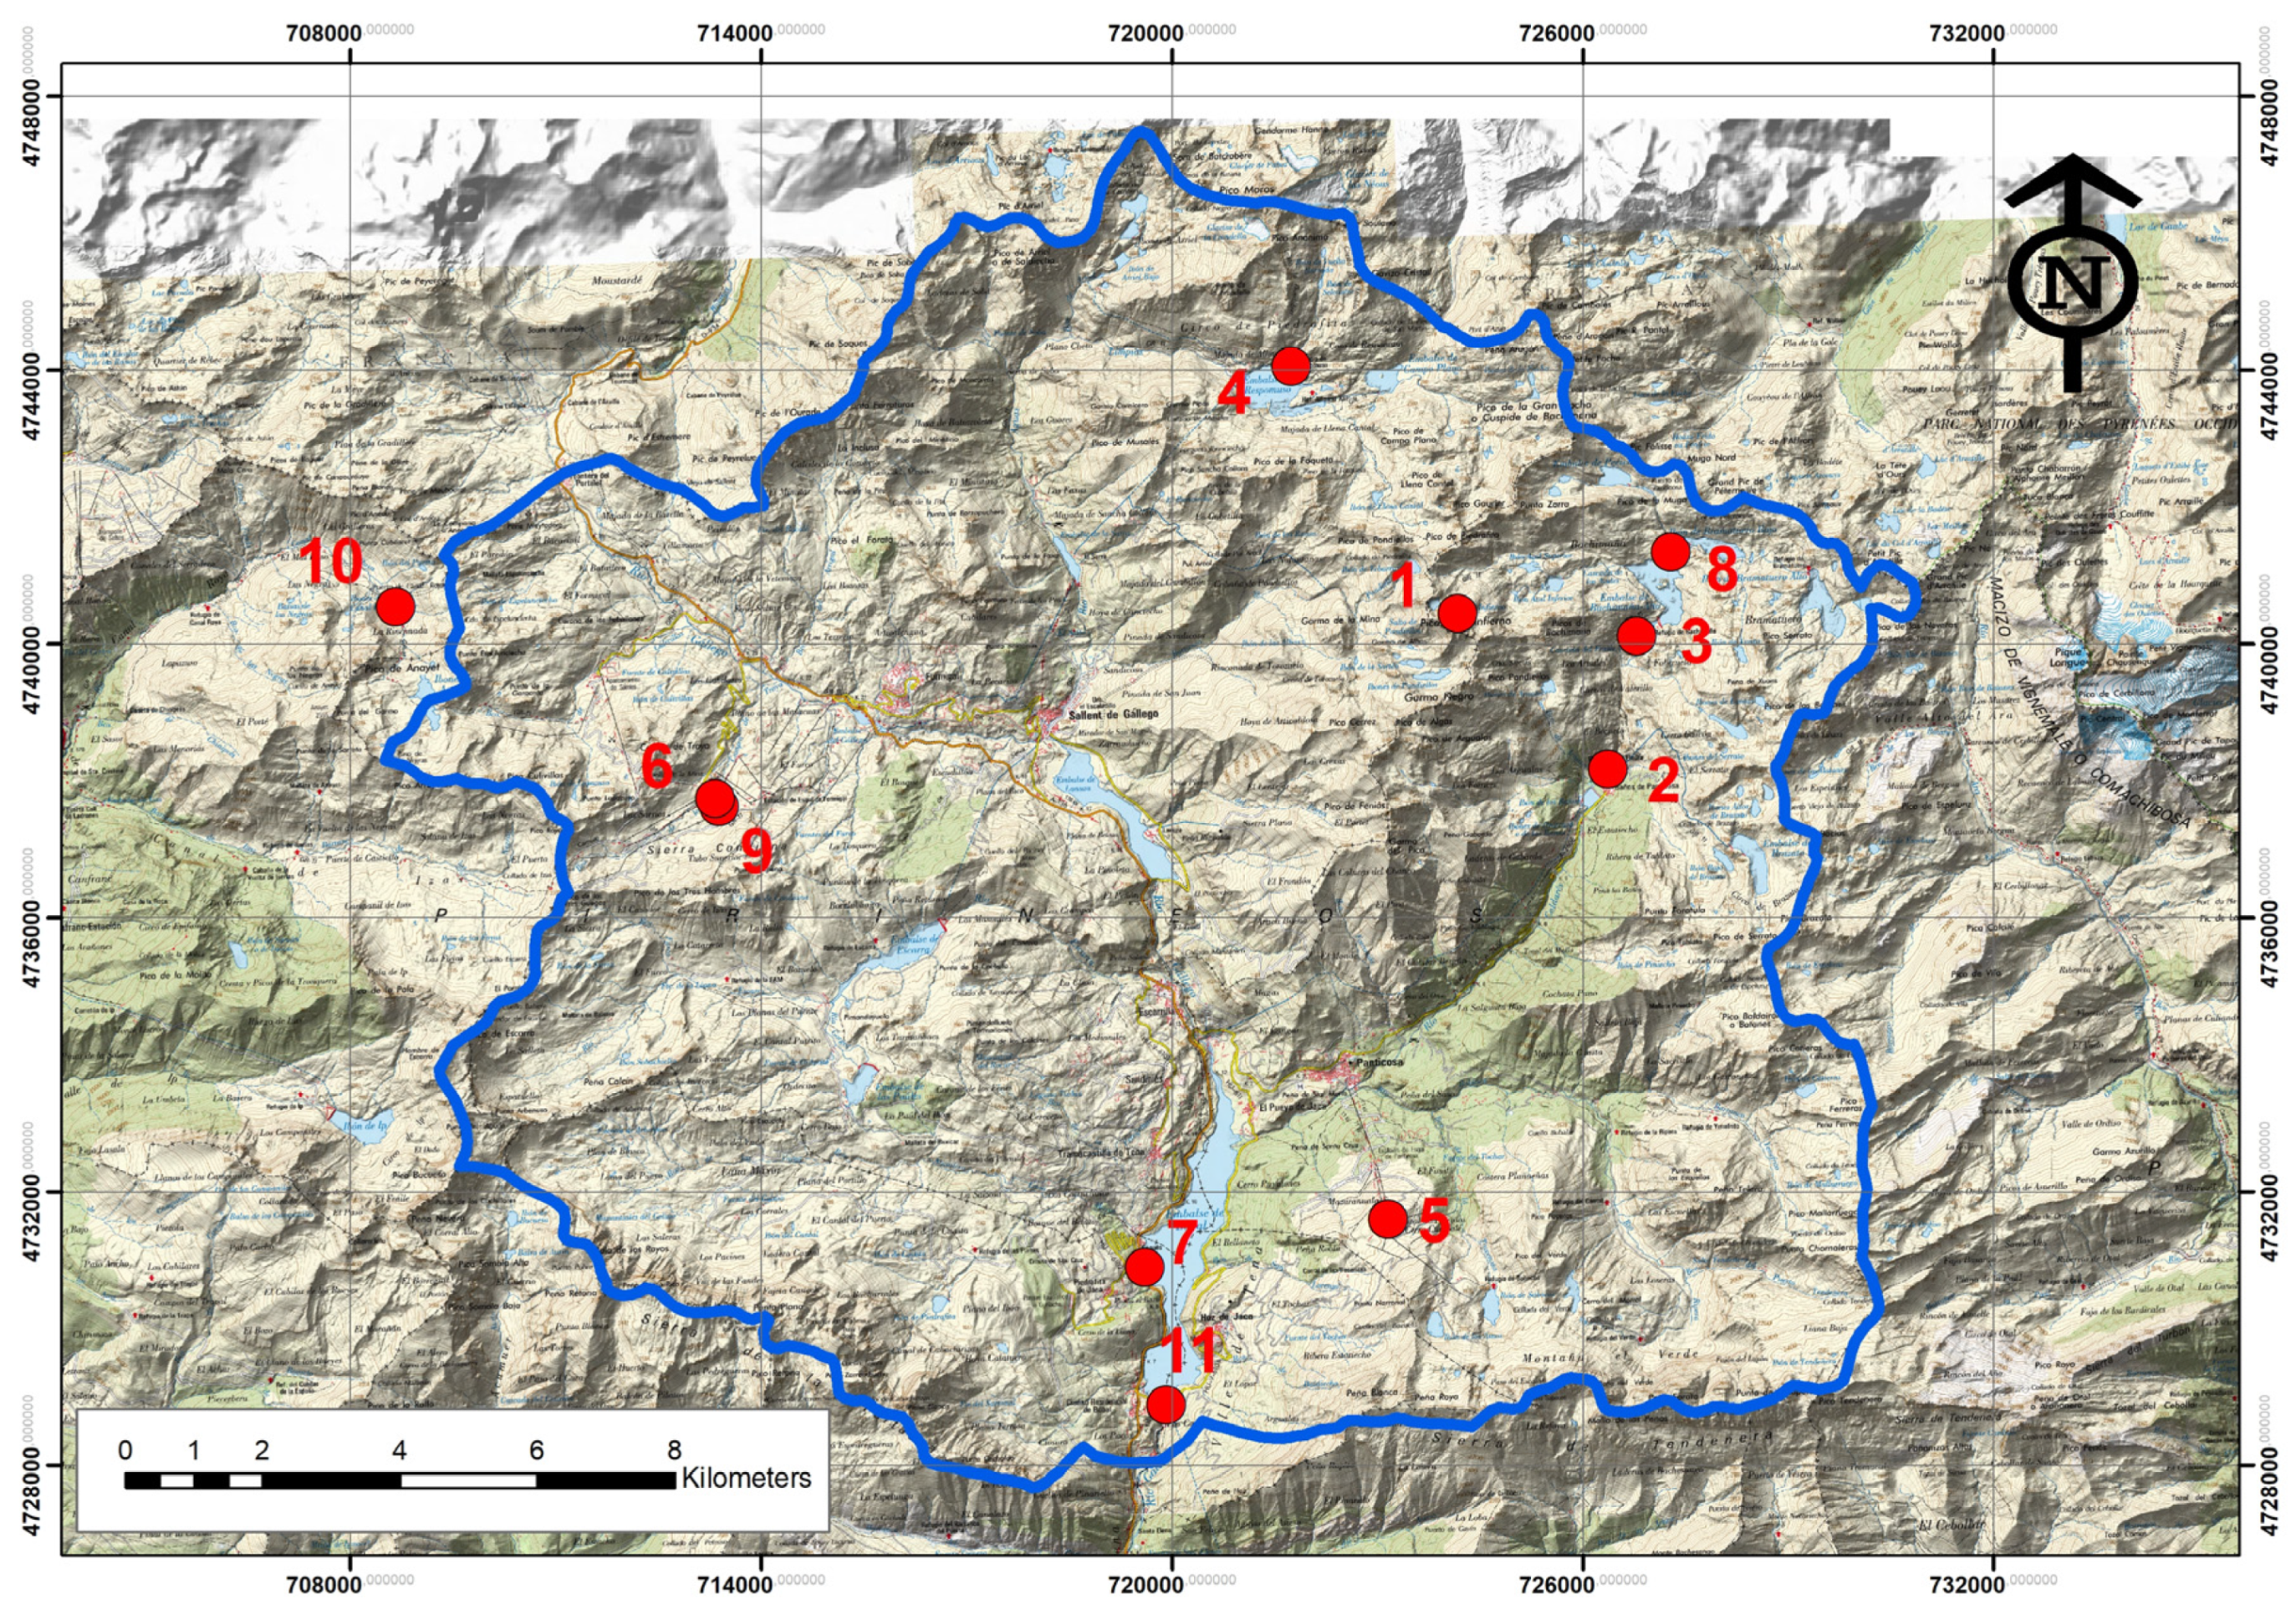
2.2. Meteorological, Hydrological and Snow Data Complementary

In the Infierno Glacier and in its immediate surroundings, there are no weather stations. For safety and economic reasons, it has not been possible to install a weather station near the glacier. In order to relate the evolution of the glacier with the meteorology, hydrology and snow data were selected from official Spanish agencies, from nearby measurement stations.
The categories of basic numerical reference data used, and their source, are listed below:
-
Meteorological data: Agencia Estatal de Meteorología (AEMET)-(State Meteorological Agency of Spain) [37,38].
-
Hydrological data: Confederación Hidrográfica del Ebro-Sistema Automático de Información Hidrológica (CHE-SAIH)-(Hydrographic Confederation of the Ebro Basin-Automatic Hydrological Information System) [49].
-
Snow data: CHE-SAIH [49] and AEMET [50].
From these sources, we have used the following proxy data as working tools:
-
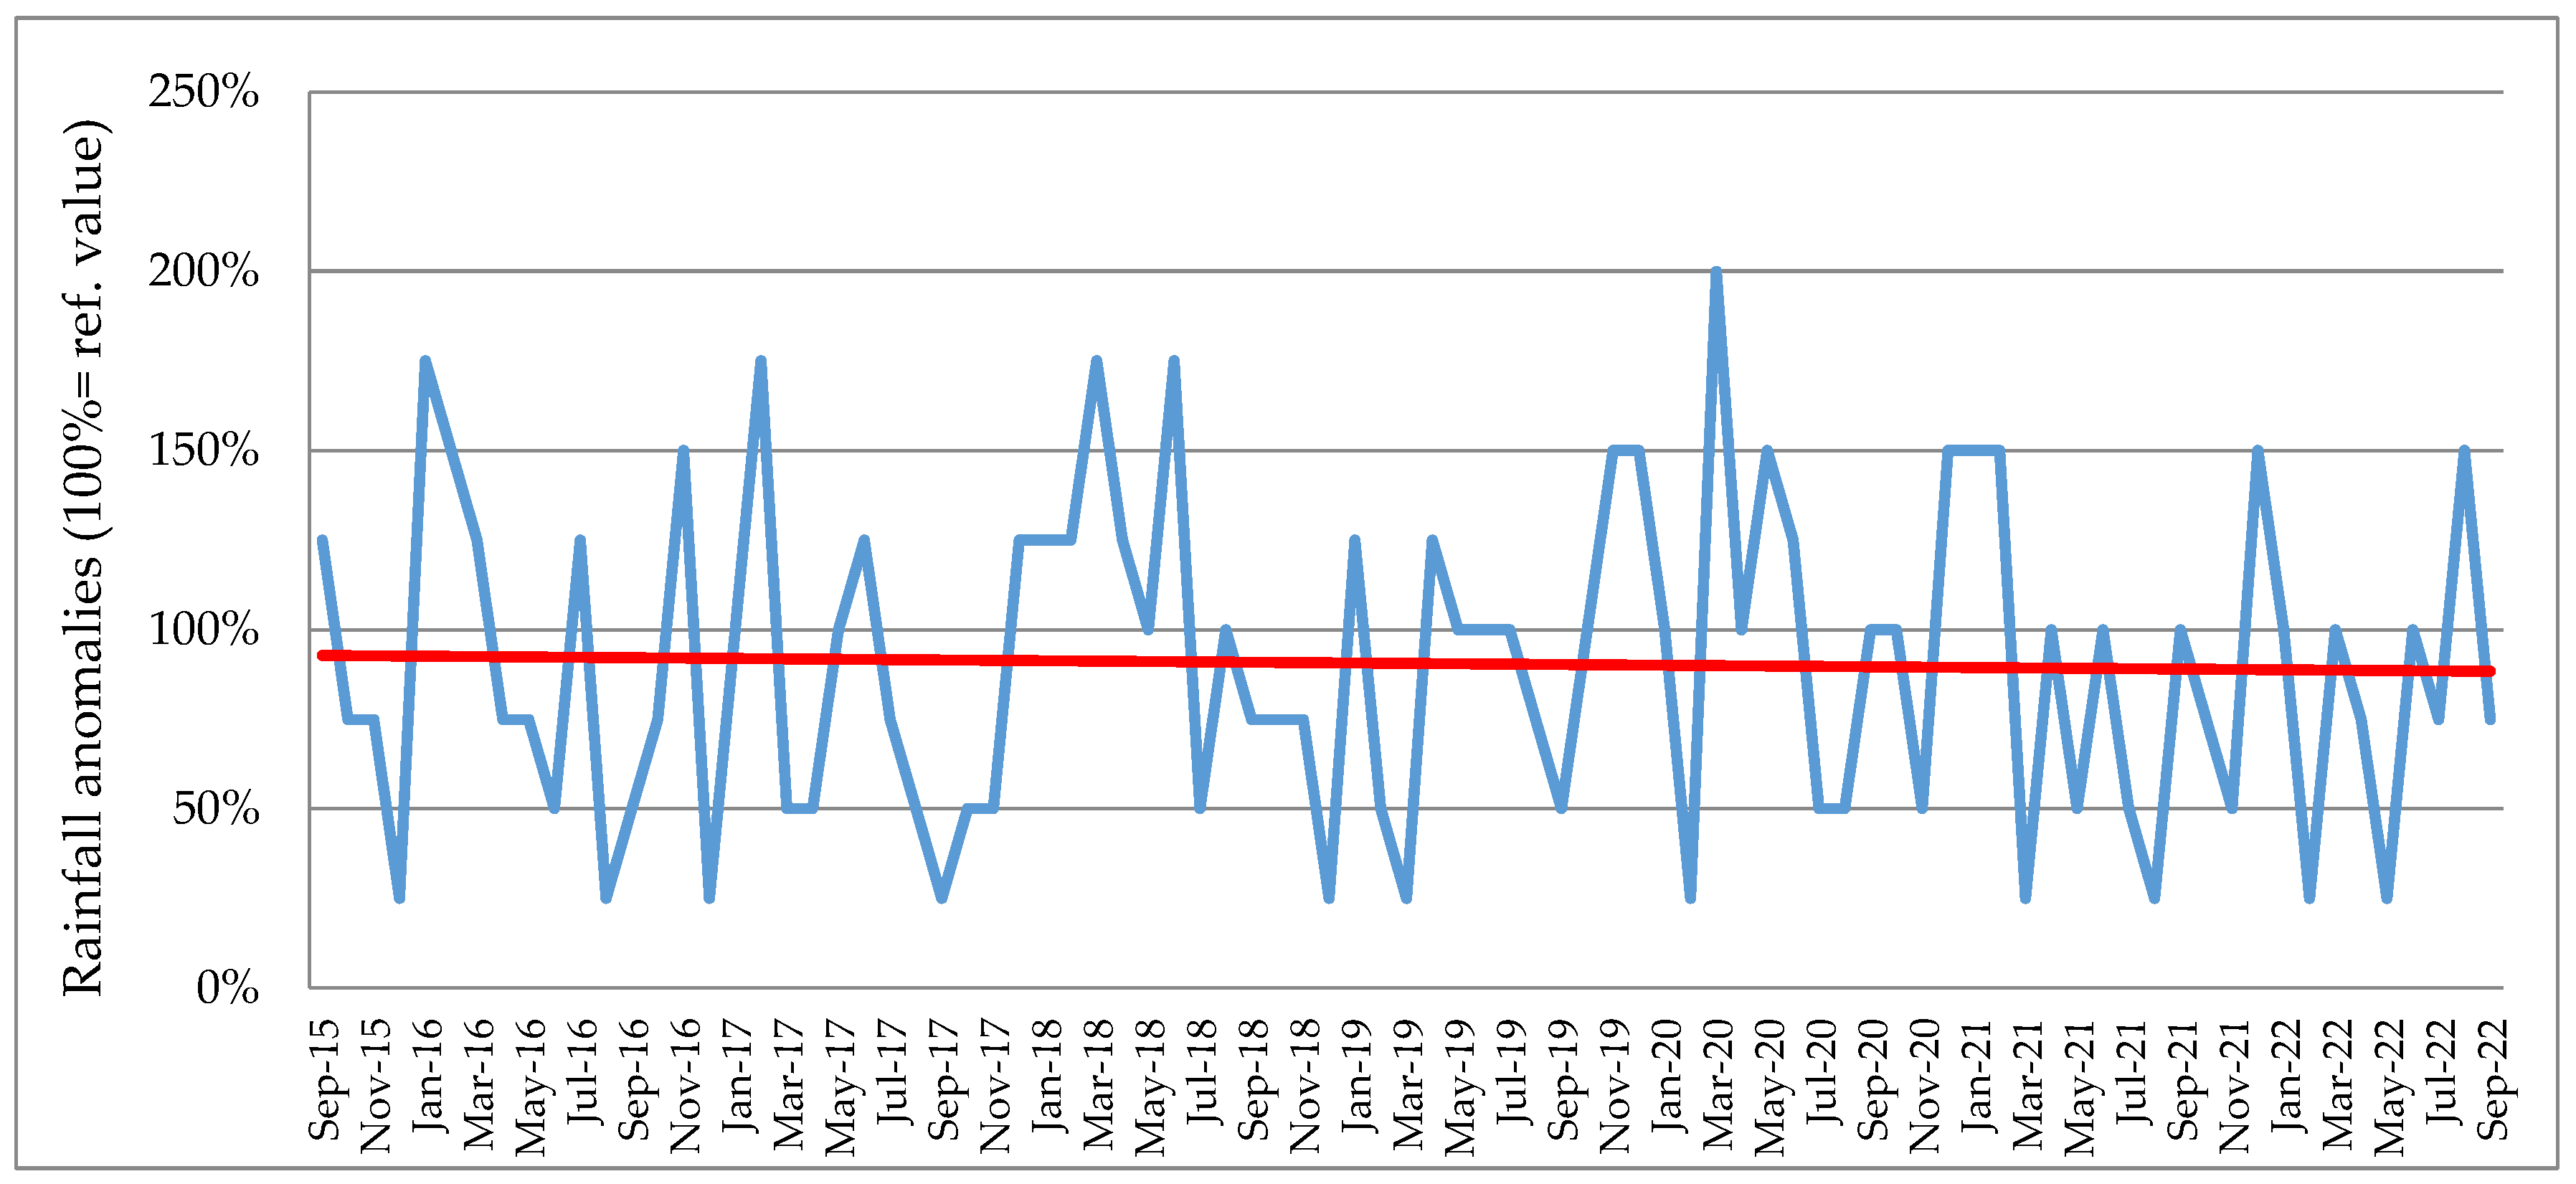
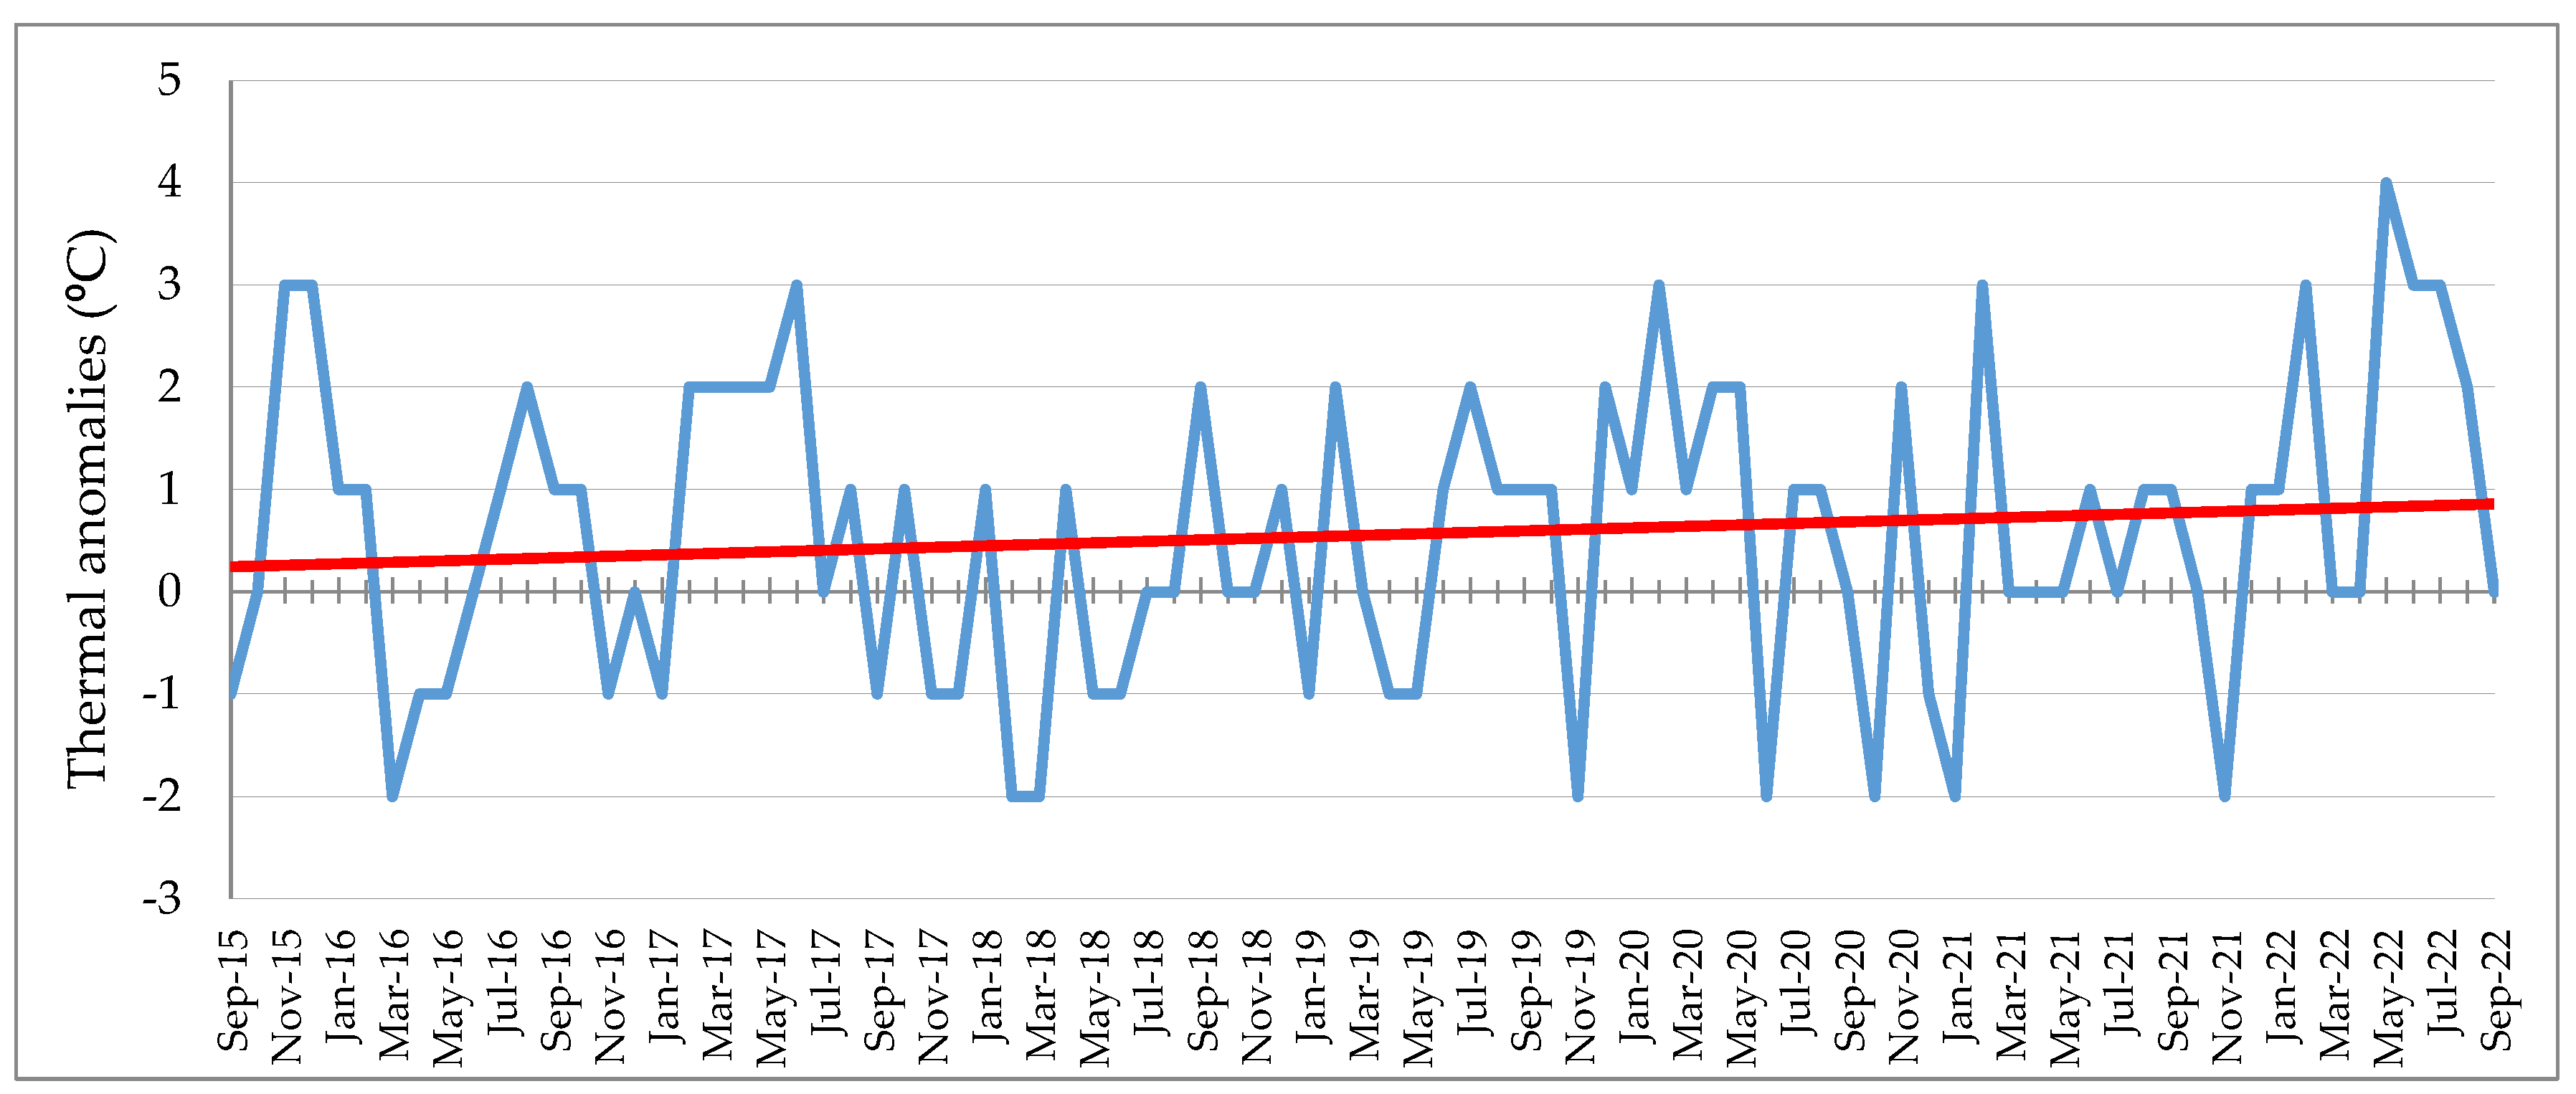
Rainfall and thermal anomalies, accumulated snow volumes and persistence of snow cover. In all cases, the territorial reference framework is the upper basin of the Gállego River, up to the Búbal Reservoir (where the Infierno Glacier is located).
-
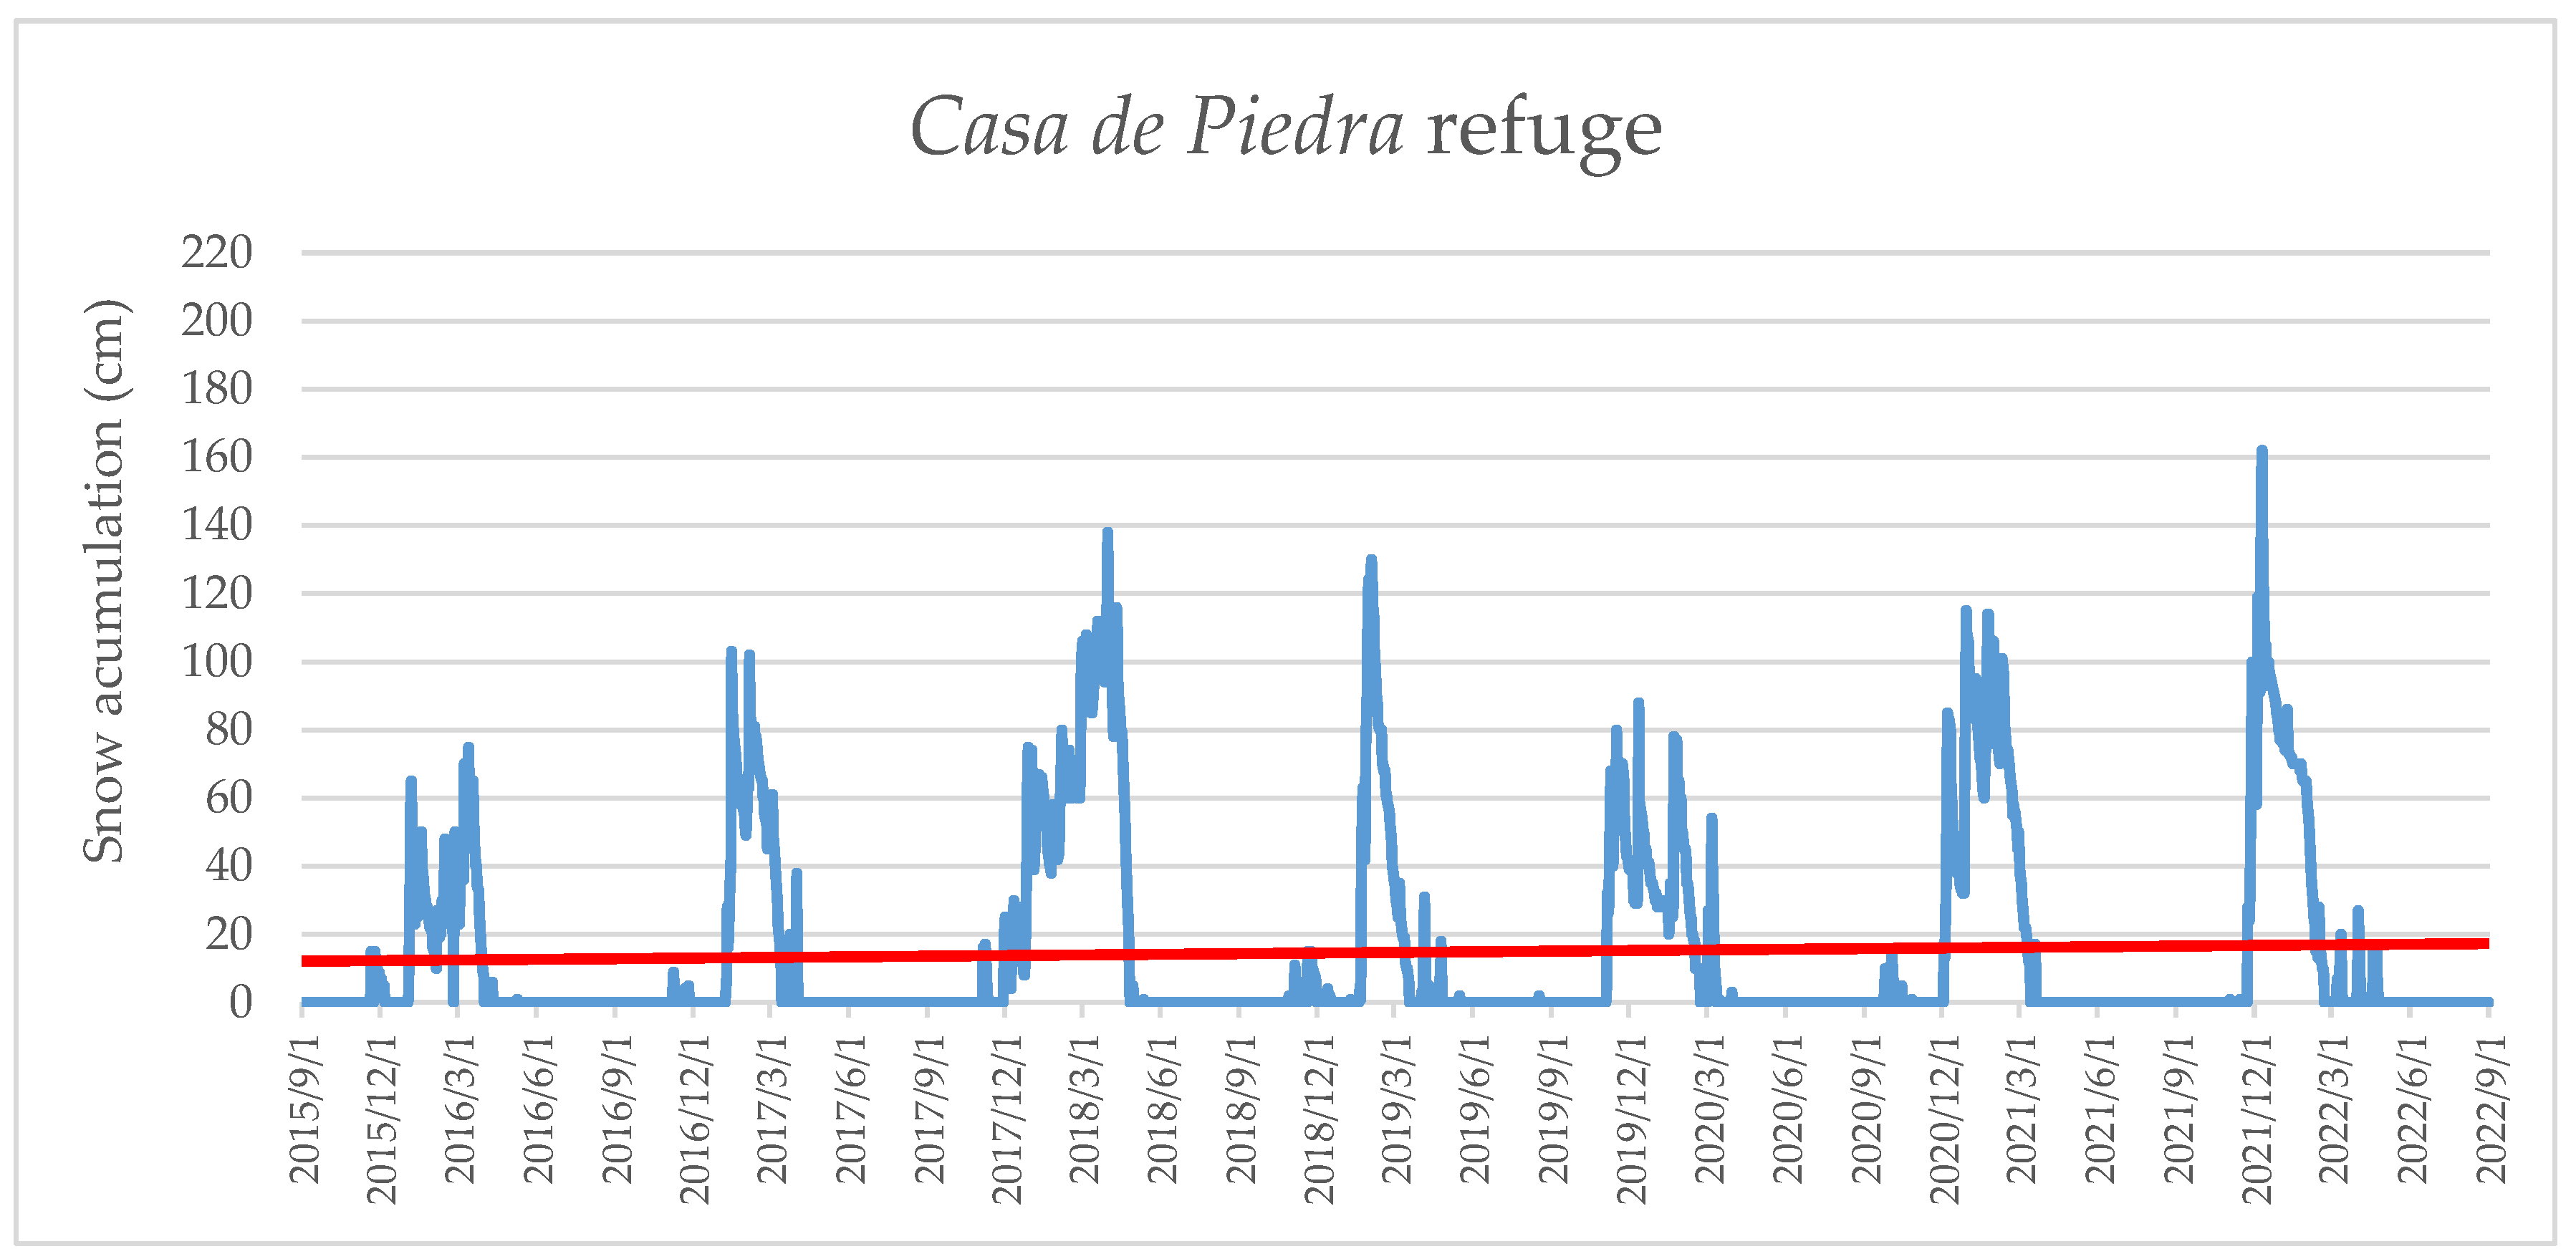
Evolution of snow cover thicknesses, in two mountain refuges close to the glacier, as well as in the upper basin of the Gállego River.
The period analyzed for these variables is from September 2015 to September 2022.
Rainfall and temperature evolution and monthly deviations from the reference values period 1981/2010 (DRV, Deviation from Reference Values, from here), are shown in Figure 8 and Figure 9. The data come from the monthly climate summaries issued by AEMET [37,38].
The volumes of snow accumulation (daily volume, expressed in hm3 of water equivalent) and its evolution over the hydrological years (1 October to 30 September), allow for approximating the snow accumulation rates on the glacier (Figure 10). The persistence of snow cover should be considered another essential variable for the analysis of glacier behavior. Table 2 shows the duration of the annual period with more than 10 hm3. The data have been taken from the CHE-SAIH [49] and have been obtained by three automatic snow sensors in the upper basin of the Gállego River and processed using the Aster model [51,52]. This temporal duration can be cross-checked with the snow accumulation volume. The result is shown in Figure 11.
A complementary nivological variable is the evolution of the snowpack of layer thickness. Based on hydrological years, daily snow thickness has been obtained from the two closest mountain refuges: Bachimaña refuge (ETRS89. H. 30. X: 726786; Y: 4740112; Z: 2200 a.s.l.) and Casa de Piedra refuge (ETRS89. H. 30. X: 726363; Y: 4738169; Z: 1636 a.s.l.), which also serve as support points in the access to the glacier. These data are managed by AEMET [50] and the results are shown in Figure 12 and Figure 13.
A summary of locations of weather stations and snow sensors in the upper Gállego River basin up to the Búbal Reservoir (source of the data used in this article), as well as the Infierno Glacier monitoring stations, is presented in Table 1. In addition, Figure 6 and Figure 7 show their locations on a cartographic and aerial view basis.
Table 1. Location of weather stations and snow sensors in the upper Gállego River basin up to the Búbal Reservoir, and Infierno Glacier monitoring stations. All UTM coordinates, ETRS89. Topographic zone: H30.
NameTypeAgencyXYZ
Casa de Piedra refugeWeather stationAEMET726,3634,738,1691636
Bachimaña refugeWeather stationAEMET726,7864,740,1122200
Respomuso refugeWeather stationAEMET721,7434,744,0612143
Panticosa PetrososWeather stationAEMET723,1554,744,0611850
Formigal SarriosWeather stationAEMET713,332473,7381800
Biescas-Búbal ReservoirWeather stationAEMET719,6024,730,8941100
BachimañaAutom. snow sensor CHE-SAIH727,2814,741,3452220
Formigal SarriosAutom. snow sensorCHE-SAIH713,3844,737,6241800
Canal RoyaAutom. snow sensorCHE-SAIH708,6594,740,5401971
Búbal dam719,9124,728,8791075
Infierno Glacier, central point724,1704,740,4462798
Infierno Glacier, reference frontal point724,1814,740,7222677
Infierno Glacier, reference lateral point724,2014,740,6652717
Figure 6. Upper basin of the Gállego River, up to the Búbal Reservoir (blue line). 1: Infierno Glacier; 2: Casa de Piedra weather station; 3: Bachimaña weather station; 4: Respomuso weather station; 5: Panticosa-Petrosos weather station; 6: Sarrios-Formigal weather station; 7: Biescas-Búbal Reservoir weather station; 8: Bachimaña automatic snow sensor; 9: Sarrios-Formigal automatic snow sensor; 10: Canal Roya automatic snow sensor; 11: Búbal Reservoir dam. Cartographic base: IGN (WMS) [53].
Geosciences 13 00040 g006
Figure 7. Infierno Glacier and surroundings. 8 September 2017. Glacier monitoring stations. 1: Glacier front monitoring station; 2: Glacier lateral monitoring station. Source: Google Earth [54].
Geosciences 13 00040 g007

3. Results

3.1. Climatic Analysis

Figure 8 and Figure 9 show the inter- and intra-annual rainfall and thermal irregularity, characteristic of the climate in the southern slope of the Central Pyrenees. Its detail allows us to appreciate the rhythms of the different hydrological years.

3.1.1. Rainfall Analysis

Figure 8 reflects very pronounced DRVs, ranging from 25% to 200% (over 100% mean value, period 1981–2010), with values from 50% to 150–175% being very common. The lowest DRV values (25%), related to drier conditions, are spread over most of the years but increase from 2021. The highest DRV values (175%), related to wetter conditions, only occur from 2016 to 2018, although the peak (200%) is obtained later, in 2020. The DRV trend line was declining, with a variation of −9%, within a period of seven years.
Figure 8. Rainfall anomalies in the upper Gállego River basin. September 2015–September 2022 (over 1981–2010 reference period, as determined by AEMET for these comparisons). Trend line (red). Data source and methodology: AEMET [37,38,55].
Geosciences 13 00040 g008

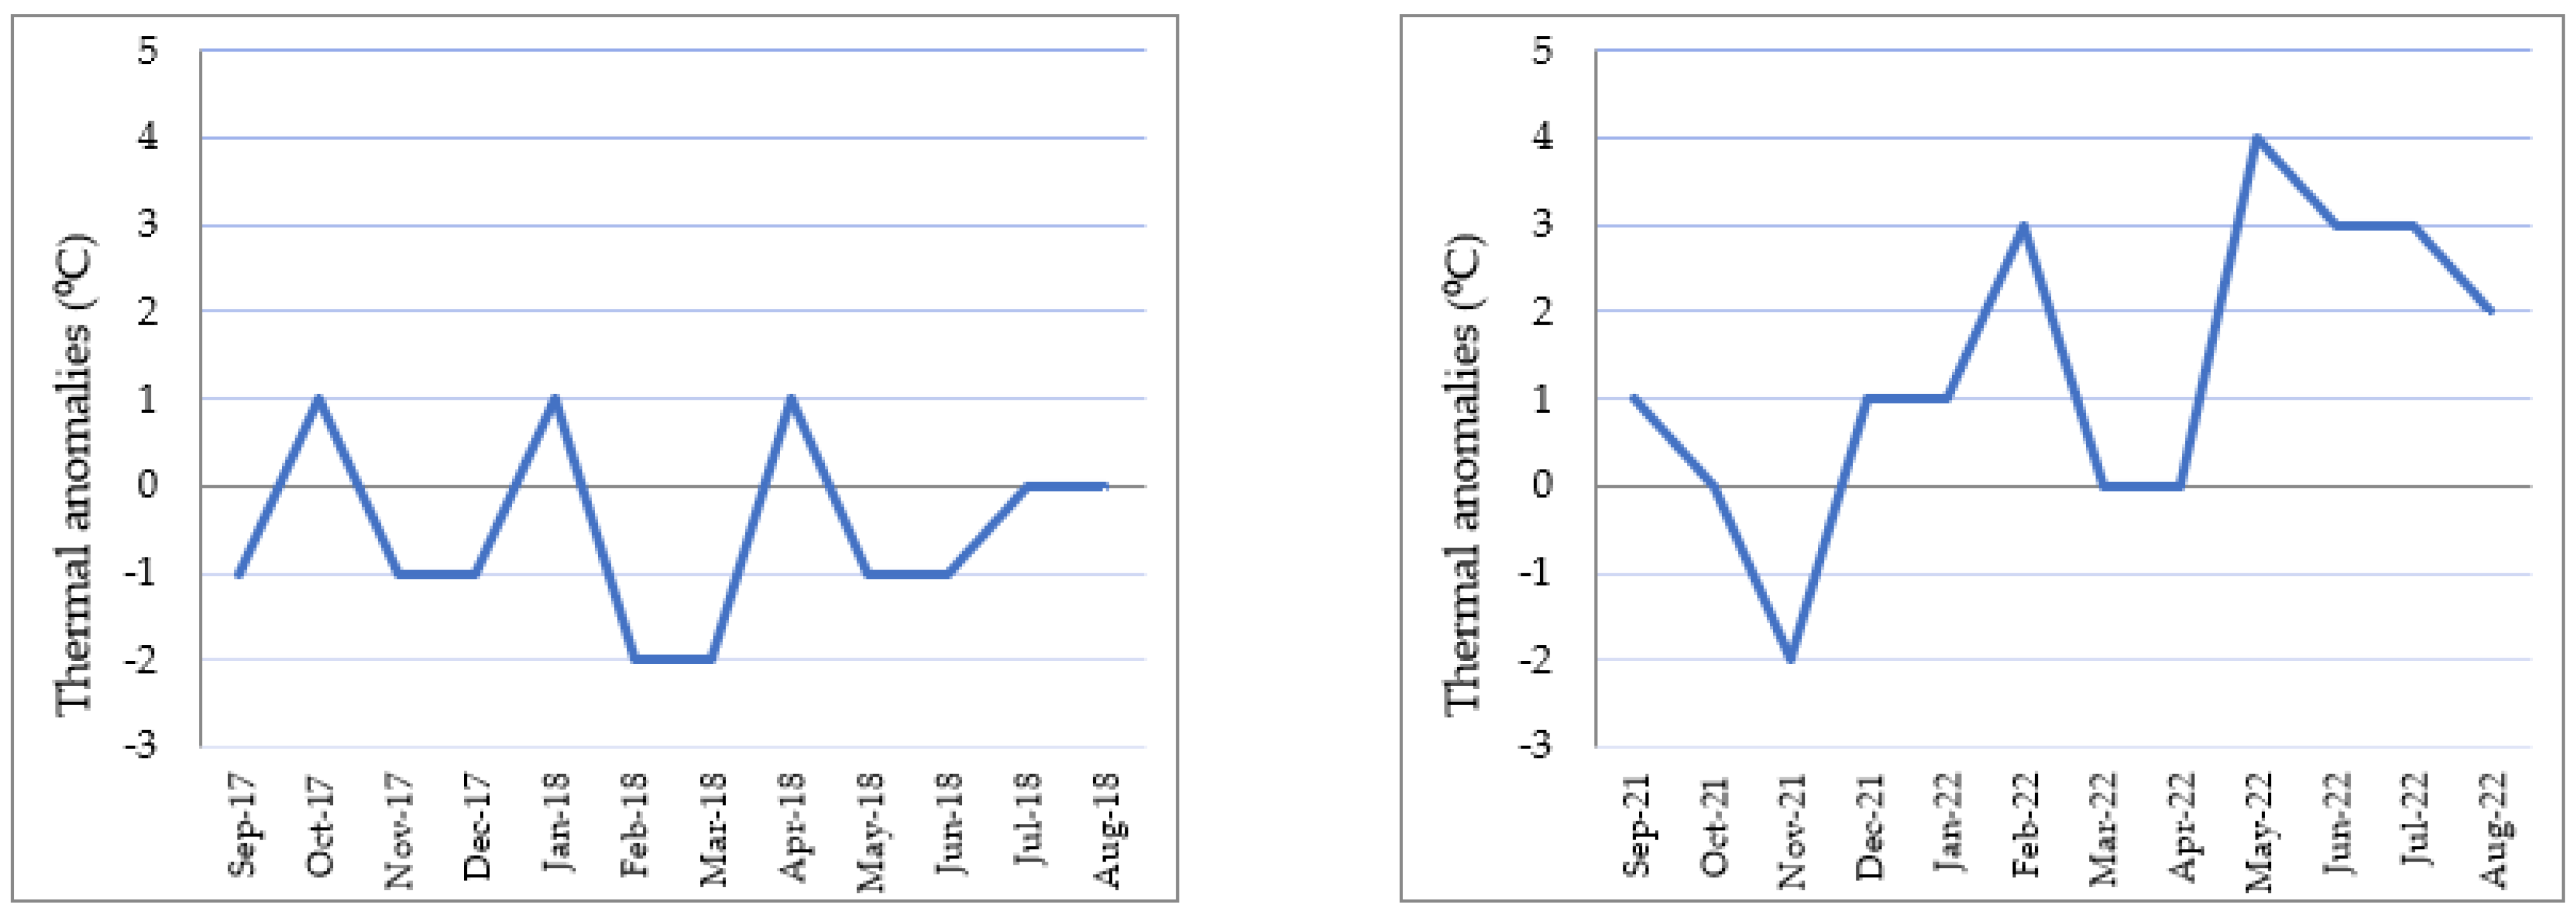
3.1.2. Temperature Analysis

Figure 9 is very expressive: the months with positive thermal DRV are much more abundant than the months with negative DRV. Moreover, the positive DRV are of greater importance than negative ones. Among the positive DRV, the value DRV +3 °C appears on several occasions, and in one case (May 2022), DRV +4 °C is reached (a record in our series). DRV +2 °C and +1 °C are very abundant. In the case of negative DRV, the values are more moderate. There is no DRV -3 °C, the top values are DRV −2 °C, which are repeated with some frequency (although to a lesser extent than DRV +2 °C). Moreover, DRV −1 °C are also less frequent than DRV +1 °C. The DRV trend line is clearly upward, with a variation that reaches +0.55 °C over a period of seven years. This evolution is very negative for the survival of the Infierno Glacier, as it increases the energy available for nival and glacial ice ablation [56].
Figure 9. Thermal anomalies in the upper Gállego River basin. September 2015–September 2022 (over 1981-2010 reference period, as determined by AEMET for these comparisons). Trend line (red). Data source and methodology: AEMET [37,38,57,58].
Geosciences 13 00040 g009

3.2. Snow Analysis

The gaphs included in this subsection have been prepared which refer to snow volumes (measured in equivalent volumes of water) in the upper Gállego River basin, up to the Búbal Reservoir, and to snow column thicknesses in the two mountain refuges detailed above.
The volumes and thicknesses of snow in these graphs indicate variations of great magnitude, which are the result of different interrelated meteorological variables: dates and volumes of snowfall and liquid precipitation, as rain is a factor that accelerates snowmelt, temperatures, their respective behaviors throughout the year, dates on which certain meteorological events occur (such as heat or cold waves), episodes of intense precipitation or prolonged droughts. In short, these graphs are indicative of the remarkable interannual climatic irregularity of this mountain range, as already indicated.

3.2.1. Snow Volumes

Figure 10 shows the snow volumes in the upper basin of the Gállego River. Its detail allows us to appreciate the variations in the different hydrological years, between 2015/2016 and 2021/2022. Three periods can be roughly discriminated: (a) 2015/2016 and 2016/2017; (b) 2017/2018 to 2019/2020; (c) 2020/2021 and 2021/2022.
In the first period, the maximum snow volumes are of the order of 120 hm3. In the second, there are the two positive years in our series (2017/2018 and 2019/2020), with values exceeding 180 hm3 and 160 hm3, respectively, but separated by a year (2018/2019) in which a volume of 100 hm3 is narrowly exceeded. Finally, the third period is very similar to the first one. The trend line indicates an increase in snow volumes in the upper basin of the Gállego River, within the period analyzed. The years 2018 and 2020, which are symmetrically in the middle of the time series, explain this upward trend, while four years of the seven included in this time series show very stable values.
The general trend of precipitation shows a decreasing trend in precipitation (Figure 8). This difference with respect to the variable volumes of snow with an upward trend is due to the fact that during the period of our study, the driest months have been mainly registered over the summer. On the contrary, there have been significant cases of cold months (with snow precipitation), in which precipitation has been recorded well above normal values.
Figure 10. Evolution of daily snow, as equivalent water volume (hm3), in the upper Gállego River basin (up to the Búbal Reservoir), from September 2015 until September 2022. Trend line (red). Data source and methodology: CHE-SAIH [49,51,52].
Geosciences 13 00040 g010

3.2.2. Periods with Heavy Snow Volumes

In addition to Figure 10, Table 2 shows complementary data: the number of days with uninterrupted snow volumes greater than 10 hm3 (equivalent volume of water), the dates of the beginning and end of this period, the maximum value reached for each hydrological year and the date on which this value occurs. Normally, this reference value is exceeded between November and June, but as in the other variables analyzed above, there is marked interannual variability with two years in which the start of the period is delayed until December and one in which the end is brought forward to May. The start dates range from 5 November 2019 to 9 December 2017. As for the end dates, they range from 29 May 2022 to 28 June 2016. In 2019/2020, with 235 days, the start date is the earliest in the series (November 5) and the end date is the second latest (June 26). In 2021/2022, with 184 days, the start date is the third latest in the series (November 27) and the final is the earliest (May 29).
Table 2. Start and end dates of uninterrupted volumes of more than 10 hm3 of snow (equivalent water volume) in the upper Gállego River basin (up to the Búbal Reservoir), by hydrological years 2015/2016 to 2021/2022. It includes number of days for each hydrological year, value and date of maximum accumulation. Data source and methodology: CHE-SAIH [49,51,52].
Hydrologic
Year
StartEndTotal
Days
Date of Maximum and Volume of Equivalent Water (hm3)
2015–2016November 25June 28217March 21
119.9 hm3
2016–2017November 21June 9201March 6
121.7 hm3
2017–2018December 9June 21195April 13
184.1 hm3
2018–2019November 6 June 17224February 5 to 12
105.6 hm3
2019–2020November 5June 26 235March 9
168.7 hm3
2020–2021December 5June 13191February 27
123.2 hm3
2021–2022November 27May 29 184March 13
128.5 hm3
The number of days with snow volumes greater than 10 hm3 (equivalent water volume) has greater interannual stability than the nivological variable of snow volume. This conclusion is derived from their respective analyses by hydrological years (Figure 10 and Table 2). The visual comparison of both variables is shown in Figure 11, in which the number of days and volumes of more than 10 hm3 are compared. Years with very little snow volume, such as 2018/2019, present a greater volumetric variation with respect to the years with higher snow volumes, than those derived from the respective comparisons referring to the number of days with more than 10 hm3. There is also the paradox that there is not always a direct relationship between these two variables. There are years with large volumes of snow, but which have a moderate number of days with more than 10 hm3, such as 2017/2018. There is also the opposite situation. The reasons have to do with the rainfall and thermal rhythms of each hydrological year. All this is reflected in the interannual behavior of the Infierno Glacier.
Figure 11. Comparative study between the evolution of snow volume and the number of days with snow volume higher than 10 hm3, in the upper Gállego River basin (up to the Búbal Reservoir), by hydrological years. 2015/2016 to 2021/2022. Base data: daily snow volumes, expressed in hm3 (equivalent water volume). Blue: snow volume; red: number of days. Data source and methodology: CHE-SAIH [49,51,52].
Geosciences 13 00040 g011

3.2.3. Thickness of the Snowpack

Another nivological variable of great glaciological interest is the evolution of the thickness of the snowpack. For its study in the upper Gállego River basin, data have been taken from meteorological stations that systematically measure this variable and that have an acceptably long time series of data. The chosen stations are two, located in mountain refuges owned by the Aragonese Mountaineering Federation, whose meteorological data are managed by AEMET. The two stations are located in the fluvial basin of the Caldarés River, a tributary of the Gállego River at its headwaters: Casa de Piedra refuge (1636 m a.s.l.) and Bachimaña refuge (2200 m a.s.l.). Figure 12 and Figure 13 show data, respectively, from both stations. Their detail allows us to appreciate the rhythms of the different hydrological years, between 2015/2016 and 2021/2022.
Despite the geographical proximity of the two stations (only 2.25 km in a straight line), they show annual rhythms that are not always homogeneous, with both similarities and differences depending on the year. Such behavior should not be surprising: on the one hand, there is notable variation in the elevation between the two refuges, close to 600 m; on the other hand, are the topographic characteristics of their respective enclaves. Casa de Piedra refuge occupies the bottom of a deep glacial cirque; Bachimaña refuge is more exposed to strong winds and snow sweep. The varied nivological conditions of the Pyrenees and their pronounced interannual variability have been studied in different studies [59,60,61,62,63].
The inter and intra-annual evolution of snow thicknesses for the indicated period in the two stations certifies important variations both in maximum thicknesses and in the shape of the curve. There are years in which high thicknesses of snow are reached, but which quickly melt (as in 2021/2022); in other years, with lower thicknesses, snow persistence is more prolonged (as in the cases of 2017/2018 or 2019/2020). The trend of snow thicknesses for this period is slightly upwards (in accordance with the trend of snow volumes, Figure 10).
Figure 12. Evolution of snowpack thickness at the Casa de Piedra refuge, weather station (1636 m a.s.l.). September 2015–September 2022. Trend line (red). Base data: daily snow depth. Data source: AEMET [50].
Geosciences 13 00040 g012
Figure 13. Evolution of snowpack thickness at the Bachimaña refuge, weather station (2200 m a.s.l.). September 2015–September 2022. Trend line (red). Base data: daily snow depth. Data source: AEMET [50].
Geosciences 13 00040 g013
The variables presented in the preceding subsections (precipitation and temperature anomalies, snow volumes, snow thickness), are detailed in terms of their annual behavior in Section 3.3, “Glacier evolution”, below.

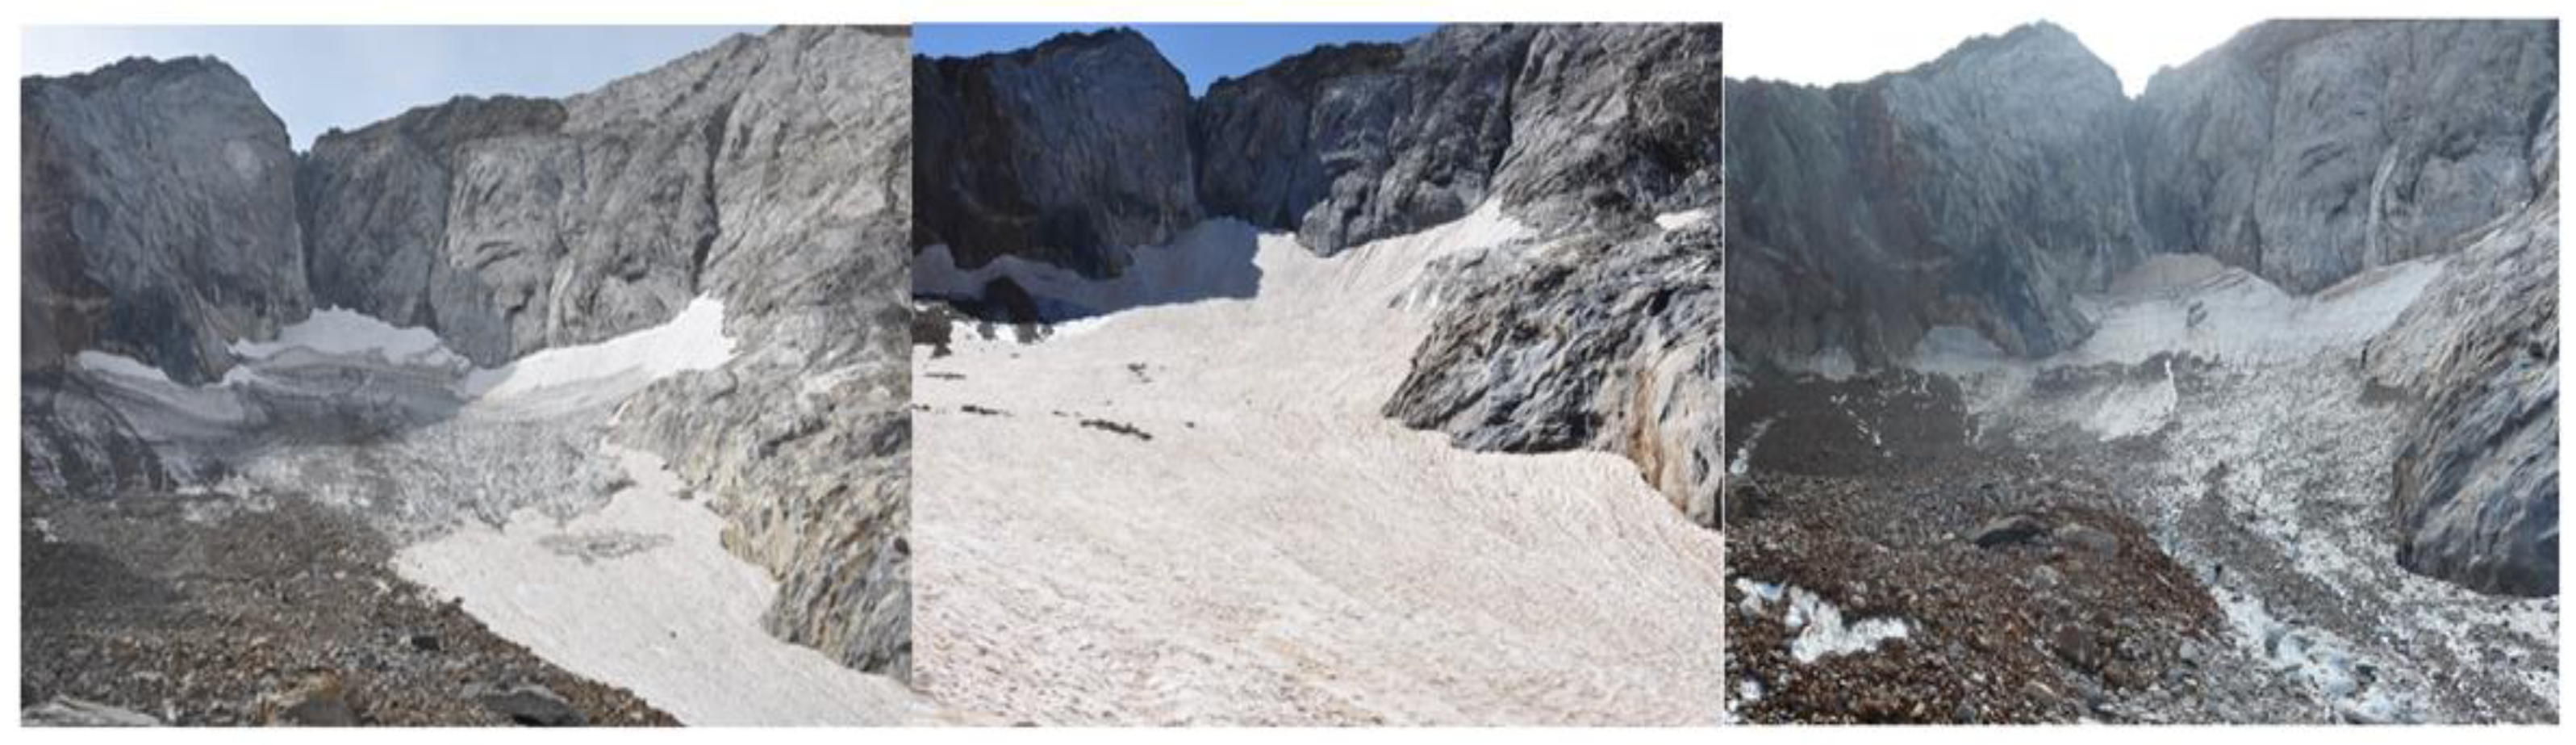
3.3. Glacier Evolution

Glacier evolution has been measured through the two monitoring stations described in Section 2.1: Glacier front monitoring station and Glacier lateral monitoring station. These data (retreats/advances of the glacier front and losses/gain of thickness at the lateral station) have been analyzed in relation to the monthly climatological summaries of AEMET [37,38] and with the snow data series of CHE-SAIH [49] and AEMET [50], as detailed in Figure 8, Figure 9, Figure 10, Figure 11, Figure 12 and Figure 13 and Table 2. We have presented below the evolution of the glacier during the period 2016–2022. The starting data (“zero” position) are the situation of the previous year, 2015. Representative photos of glacier state variations are shown in Figure 14 and Figure 15. The evolution of the Infierno Glacier can be seen in Table 3 and Figure 16, Figure 17 and Figure 18 (Section 3.3.2).
The mentions of the seasons of the year are referred to as the climatic seasons, not astronomical ones. For the present work, season months are grouped into seasons: Spring (March to May); Summer (June to August); Fall (September to November); Winter (December to February).

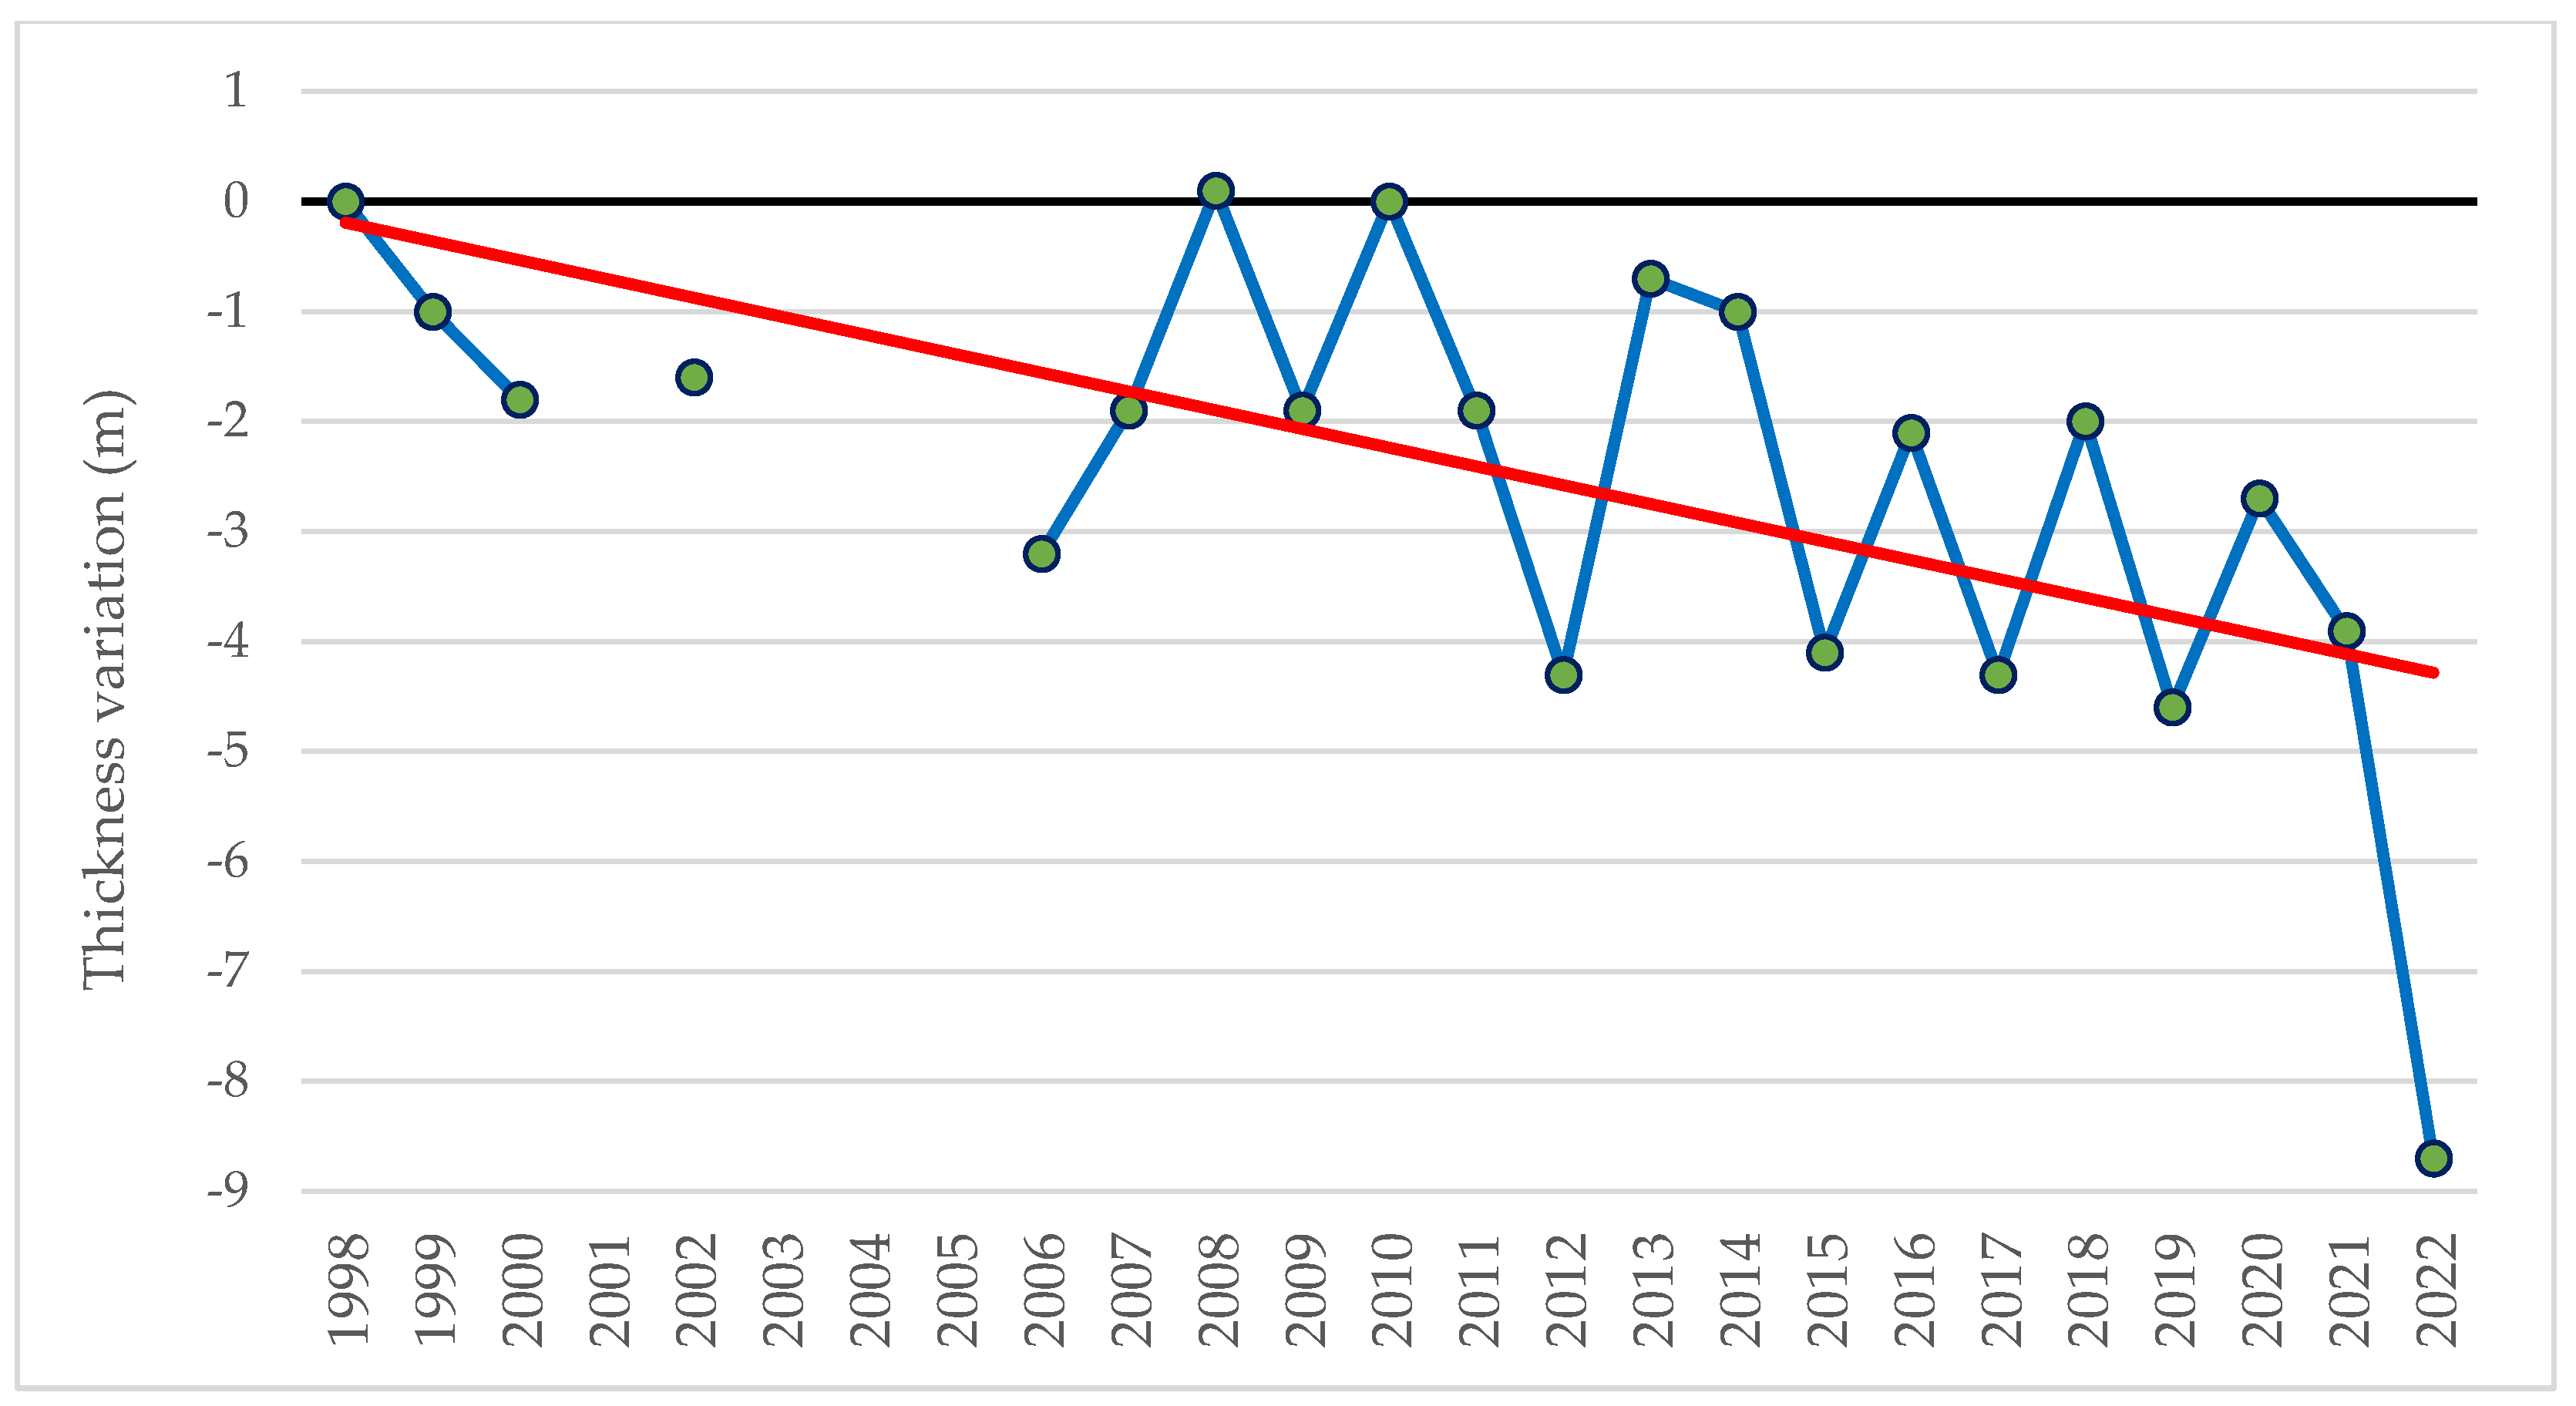
3.3.1. 1998–2015 Period

Before analyzing the 2016–2022 period, we should point out that, as mentioned in Section 2 (Materials and Methods), we have monitored the evolution of the Infierno Glacier from 1998 to 2022. We have briefly pointed out here that during this 25-year period, there have been numerous fluctuations and interesting changes in trend, with predominantly years of retreat and also years of advance. However, the overall result is a clear recession. In 2022, the glacier front retreated 38.8 m with respect to the 1998 position, while the thickness loss at the side station was 8.7 m (Figure 18). The evolution data for the period 1998–2015 indicated 2006, 2012 and 2015 as the years of greatest losses, while the most outstanding positive balances occurred in 2013 and 2014 [36], years in which the glacial ice remained protected by continuous snow cover until the end of summer and the beginning of the climatic fall (first days of September).
However, 2015 showed a very negative evolution for the Infierno Glacier. In 2015 (date of measurements: September 5), the positive balance gained in the previous two years was lost. The ice was exposed on most of the glacier surface and there were significant retreats in the glacier front and thickness losses (−3.1 m) laterally, compared to 2014 (date of measurements: September 3). Previously to September 2015, the period from March to July was dry, even very dry, with little snowfall and low snow accumulation. The same period, extended until August, was also very warm (April, May and July, extraordinarily warm, +3 °C of DRV). All this caused particularly intense melting processes of the snow cover and of the glacier ice itself. This dismal year for the evolution of the Infierno Glacier was in line with the situation of other Pyrenean glaciers. The Maladeta Glacier may serve as a comparative reference: in that year, it presented the third most negative mass balance since 1991/1992 [64].

3.3.2. 2016–2022 Period

Between 2016 and 2020, the dynamic of the glacier shows a strong interannual irregularity. There was a continuous succession, year after year, of trend changes. A positive year was systematically followed by a negative one and vice versa.
Year 2016. Date of measurements: September 3.
The situation was better than in 2015. The glacier gained (+18.4 m and +2 m, compared to our “year zero”, in frontal and lateral measurements, respectively). The January–March quarter was very wet (150% DRV), although the rest of the spring proved dry (75% DRV). The March–May period was cold (March, very cold, −2 °C DRV), followed by a normal June and warm July and August (August, very warm, +2 °C DRV). The rainfall behavior of the winter and early spring, with heavy snow inflows, as well as low temperatures and a normal June (which delayed snowmelt), even though the summer was warm, explain the gain of the glacier compared to a previous very negative year.
The values of snow thicknesses in the mountain refuges were in accordance with these rainfall and thermal rhythms. In Casa de Piedra refuge, the greatest thickness of the entire 2015/2016 hydrological year was reached in mid-March; so were the volumes of accumulated snow in the upper basin of the Gállego River, which reached its highest values for the hydrological year between late February and mid-May, recording a moderate maximum value (119.9 hm3), but with the particularity that was reached on March 21, the second latest date in our series, with a secondary maximum in mid-April. This behavior was reflected in the number of days (217) with a snow volume higher than 10 hm3 for the hydrological year, the third highest value of our study period, highlighting that the final day in which this value was reached was very late (June 28, the most advanced of our series), so that in the full climatic summer, there were still important volumes of snow stored at high altitudes.
Year 2017. Date of measurements: September 2.
It was a negative year for the glacier, with marked losses compared to 2016. The glacier front retreated (−12 m), and the loss of thickness at the side station was strong (−2.2 m). Relative to “year zero” 2015, the position was, respectively, +6.4 m and −0.2 m. November 2016 and February 2017 proved to be very wet, with strong snow accumulation (150% and 175% DRV, respectively), although, in between, December was extraordinarily dry (25% DVR) and January, normal. On the other hand, the period from November to January was predominantly cold (November and January, −1 °C DRV). However, the subsequent months were adverse for the glacier: spring was dry (close to 70% DRV), while February and the whole spring were very warm (+2 °C DRV), followed by an extraordinarily warm early summer (June, +3 °C DRV), normal July and warm August. As a result, there was little snowfall since March, accompanied by high temperatures that caused snowmelt at high altitudes from mid-spring, accelerated by a very warm start to the summer. All this explains the situation of the glacier being significantly worse than in the previous year.
Snow thicknesses in the mountain refuges reflected this meteorological behavior. At the Casa de Piedra refuge, snow thicknesses were higher than in the previous year in January and February, but in March the opposite happens, with a strong decrease in snow cover. In the Bachimaña refuge, the decrease in snow cover in April was much faster than in 2016. The accumulated snow volumes in the upper basin of the Gállego River were also in line with these behaviors. The moderate maximum value (121.7 hm3), was reached early (March 6), with rapid declines from the first decade of April. This corresponded with the number of days (201) with a snow volume higher than 10 hm3 for the hydrological year, but especially with an end date for this value, June 9, which was 19 days earlier than that of the previous year, indicative of faster snowmelt processes.
Year 2018. Date of measurements: September 1
In this year, the negative values of 2017 changed, and the glacier had net gains at its two monitoring stations (+29.7 m at the front station and +2.3 m at the side station, compared to 2017). The comparative balance with “year zero” 2015 was as follows: +36.1 m and +2.1 m, respectively. Winter 2017/2018, spring and early summer were very wet, predominantly wet months since December (125% DRV), with March and June reaching 175% DRV. A similar period, from November to June, was cold on average. Only January and April had above-average temperatures (+1°C DRV). However, all the others were cold (−1 °C DRV), with February and March being very cold (−2 °C DRV). The rest of the summer (July and August) was not hot either, with normal temperatures (0 °C DRV). The coincidence from late autumn to early summer of a long wet and cold period caused significant snowfall and late melting of snow. This resulted in a positive glacial evolution.
Figure 10, allusive to the snow volume in the upper basin of the Gállego River, corroborates this assessment, with 2017/2018 being the best year in our series, with maximum values of volumes that exceed the average by 30%, reaching the top (184.1 hm3) on April 13, the latest in the time series. This very good year of snowpack reserves has no correspondence with the number of days (195) with a snow volume higher than 10 hm3 for the hydrological year, a low value in the series as a whole, which has its explanation in the initial date on which it was reached, December 9, the latest in this series of years, due to a very dry September–November quarter (40% DRV), with weak snowfall. On the other hand, the final date for the 10 hm3 value, June 21, is among the latest in the series. The snow thicknesses in the reference mountain refuges were in agreement with the data presented so far. The Casa de Piedra refuge showed clearly higher values than in previous years, with a maximum at the end of March and high accumulations until the third week of April. The Bachimaña refuge, on the other hand, presented higher values than in any other year of the series, in a period that went from the beginning of March to the middle of April. Figure 14 shows the state of the glacier on 1 September 2018.
Figure 14. Detail of the Infierno Glacier; 1 September 2018. Most of the surface is covered with firn.
Geosciences 13 00040 g014
Year 2019. Date of measurements: August 31.
This year turned out to be very negative for the evolution of the glacier. Everything gained in 2018 and more was lost. In the frontal station, there was a big retreat (−32.9 m), and in the lateral, the loss of thickness was also strong (−2.6 m) in both cases with respect to 2018. The balance with the “year zero” 2015 indicates a thickness loss (−0.5 m), leaving the frontal measurement at +3.2 m. These are the worst records since 2016, remaining even, in the case of the lateral thickness measurement, below the “year zero”, which corroborates a negative trend that, despite its notable irregularities, is evident.
In the fall, winter and early spring of the 2018/2019 hydrological year, almost all months were dry. Indeed, between September and March, only January was wet (125% DRV), the others were dry and even extraordinarily dry (December and March, 25% DRV; February, 50% DRV). The rest of spring and summer was predominantly normal. During the autumn, winter and spring, temperatures were very variable, with normal, cold and warm months, without following clear patterns. However, summer was warm to very warm (July, +2 °C DRV; June and August, +1 °C DRV). The predominance of dry months in key periods for snow inflows and the melting derived from a warm summer, led to the negative situation described.
The snow volume in the upper basin of the Gállego River was in accordance with these weak snow inflows, with the lowest values of all our series. In addition, the date on which the annual maximum was reached was the earliest of the entire series (February 5 to 12, with a poor 105.6 hm3). From here, a progressive decrease in volume began which only slightly went up again in some phases of April, to fall again rapidly from the end of this month. As for the period with a snow volume above 10 hm3, the values recorded were surprising in the first reading, since they covered 224 days, a large number for this variable, which was due to a very premature start (November 6, the second earliest in the series). Although October and November were on average dry (75% DRV in both cases), from mid-October and during the first week of November there were several episodes of intense precipitation, accompanied by low temperatures, which were snowy at medium and high altitudes. Thus, on November 6, in the refuges of Bachimaña and Casa de Piedra, snow precipitations of 40.5 mm and 38 mm were recorded, leaving thicknesses of 26 cm and 42 cm, respectively (the lower value of the Bachimaña refuge was due to its windy location). This episode, together with those that have occurred since mid-October, explains the early date on which the aforementioned value of 10 hm3 was reached.
It should be added in this respect that, subsequently, snow volume was very scarce in the upper Gállego River basin. It did not reach 26 hm3 until December 14 (on that date, in the 2016/2017 hydrological year, which was also negative for the glacier, there were already 40 hm3; while in the 2017/2018 hydrological year, it was considered as positive for the glacier, on November 30 it had already reached 67 hm3). The snow thicknesses recorded in the mountain refuges and their rates of evolution certify the above data. The Bachimaña refuge yielded the lowest thickness values of all our series, which were also reached very early at the end of January, to drop rapidly in February and March. There were only slight recoveries at the beginning of April, to drop again to values close to 0 cm during the rest of the spring. The Casa de Piedra refuge reached a normal maximum value, similar to that of other years, but at a very early date (beginning of February), starting a rapid decline since then.
Year 2020. Date of measurements: August 31.
The year 2020 again represented a change in the behavior of the glacier in relation to the previous year. It advanced at the front station (+11.3 m) and gained thickness at the side station (+1.9 m), compared to 2019. Its comparative position with respect to “year zero” 2015 was as follows: +14.5 m (frontal) and +1.4 m (lateral). In the 2019/2020 hydrological year, after a normal October, November and December were very wet (150% DRV), as was March (200% DRV), with January normal, but February proved extra dry (25% DRV). After a normal April, May and June were again very wet (150% and 125% DRV, respectively). There were, therefore, strong snow inflows from late autumn to late spring. On the other hand, the thermal rhythms showed a clear predominance of warm months during a long stretch spanning autumn, winter and spring. Except for November, which was very cold (−2 °C DRV), the other months were warm or very warm (+2 °C December, April and May; February +3 °C DRV). However, June was very cold (−2 °C DRV), although the rest of the summer was warm (+1 °C DRV). Despite the high temperatures, heavy precipitation during many months (snow, at these high altitudes) caused high accumulations of snow on the glacier.
A key to this positive year for the glacier was the thermal and rainfall behavior of the months of May and June. The first month had high precipitation and was very warm; at the glacier’s heights most of the precipitation was snow, and the first fortnight was the wettest. Moreover, June was very cold. That is to say, in May there was still snow accumulation on the glacier and in June the losses were weak.
The rainfall and thermal rhythms just described were reflected in the snow volume in the upper Gállego River basin, which reached 168.7 hm3 (the second highest value in our series). It is interesting to add that the number of days in which the 10 hm3 of water reserve in the form of snow was exceeded in this basin was very high (235), with this being the highest value of the series, which was due to the date (5 November) on which this volume was reached, being the earliest date of all our series for this variable. In addition, the final date for this volume, June 26, was also very late, the second in the series. The result was the presence of important volumes of snow at high altitudes at the beginning of the climatic summer.
The snow thickness curves in the mountain refuges were in accordance with the previous data. The Bachimaña refuge was characterized by the width of the period of maximum snow volume, from the beginning of November to the beginning of March, with maximum thicknesses in the range of the good years of our series. The case of the Casa de Piedra refuge was different. The curve was more irregular, with maximums between the beginning of November and the end of January (but with frequent changes of rhythm), and modest values of maximum thicknesses. This was undoubtedly influenced by the moderate altitude of this refuge where, despite the numerous snowfalls recorded, the high temperatures during most of the months of the hydrological year caused rapid snowmelt.
After the five-year period 2016–2020 just analyzed, characterized by annual trend changes, we enter the last two years of our study period (2021 and 2022). Both present very negative dynamics for the evolution of the glacier.
Year 2021. Date of measurements: September 5.
Ice losses at both monitoring stations were strong and much of the previous year’s gains were lost. The glacier retreated at the front station (−11.7 m) and lost thickness at side station (−1.2 m), with respect to 2020. Its comparative measurements with our “year zero” 2015 gave these values: +2.8 m frontal and +0.2 m lateral. The 2020/2021 hydrological year was characterized by strong contrasts in monthly precipitation values. After a normal October and very dry November (50% DRV), there were three consecutive very wet months with high snow input: December, January and February (150% DRV). In contrast, spring was dry. Only April was normal, but March and May were extremely-very dry (25% DRV and 50% DRV, respectively). After a normal June, the rest of the summer was very dry. As for temperatures, after a very warm late autumn (November, +2 °C DRV), winter started cold (December and January, −1 °C DRV and -2 °C DRV, respectively), but February was extraordinarily warm (+3 °C DRV). Spring was normal in temperatures, but summer was warm, with June and August +1 °C DRV. The negative behavior of the glacier was explained by the low snowfall in spring and the rapid summer melting.
The hydrological year yielded normal values in snow reserves, with a maximum of 123.2 hm3, which was reached early on February 27, although it remained at similar values over a long period from February 10 to March 25. This was undoubtedly due to the strong winter with high snow inflow and subsequent accumulation. On the other hand, it was the second worst year of the series in terms of the number of days (191) with snow volume higher than 10 hm3. In fact, the starting date on which this value was reached was the second latest in the series (December 5, derived from a very dry November), while the final date was somewhat early (June 13). Snow thicknesses in the mountain refuges were in accordance with the precipitation rates described. Maximum values were reached between the end of December and the end of February for the Bachimaña refuge, while in the Casa de Piedra refuge, the final date of the maximum values was brought forward to the first decade of February, due to the high temperatures of this month and the greater effect of these on the moderate elevation of this refuge.
Year 2022. Date of measurements: 30 August.
The last year of our series of observations has been, by far, the most negative one for the evolution of the glacier, with a strong retreat at the front station (−17.7 m) and a heavy thickness loss at the side station (−4.8 m), from the previous year. Taking as reference our “year zero” 2015, the losses have been the largest (−14.9 m and −4.6 m, respectively). If we focus the analysis on the worst year of our series from 2016 to 2021, which was 2019 for the lateral station, the glacier has lost −4.1 m of thickness. These are dramatic values, which not only affect this glacier but the whole Pyrenean Mountain range. The result for the Infierno Glacier is a considerable reduction in surface area, being 5.52 ha at our measurement date (30 August 2022), when only two years earlier, on date 31 August 2020, it was 7.06 ha (Figure 3).
The 2021/2022 hydrological year was predominantly dry, although with several wet and normal months on key dates for snow inflows. After a dry autumn, the winter was, on average, normal, but with notable internal variations. December started out very wet (150% DRV) and January was normal. However, February was extra dry (25% DRV). Moreover, in early spring, March was normal. The rest of the spring was dry (May, extra dry, 25% DRV). There were three months (December, January and March) with slightly above-average snow inflow. The result was that snow volumes in the upper basin of the Gállego River reached normal maximums for our series (128.5 hm3) on March 13, in the usual range for this variable, and that remained at relatively high values until the end of April, and began a rapid decline during May, to the point that at the end of this month, less than 10 hm3 remained. The number of days with snow volume higher than 10 hm3 was in accordance with this behavior. The result was 184 days, the lowest in our series, due to a late start date (27 November, after a dry autumn) and an end date that was the earliest in the series (29 May), a date that is explained by the low precipitation in April and May and by the very high temperatures of this month.
The main factor explaining the very negative year 2022 was undoubtedly thermal. The very high temperatures in key months for the evolution of the glacier are behind the result explained above. In the hydrological year as a whole, there was only one month below the average (November, very cold, −2 °C DRV). After the very cold November, the whole winter was warm (December and January, +1° DRV), but February reached extraordinary values (+3 °C DRV). The spring began normally (March and April), followed by an ultra-warm May (+4 °C DRV). The summer continued with extraordinary hot values (June and July, +3 °C DRV; August, +2 °C DRV). That is, between May and August, without interruption, it was between +4 °C and +2 °C DRV. These very high and persistent temperatures caused rapid melting of the glacier snow cover and, once lost, of the glacier ice itself. Besides, rainfall contributed to the melting: August was not only very hot, but also very wet (150% DRV), and liquid precipitation on the glacier ice accelerated its melting.
The evolution of snow thicknesses in the mountain refuges supports the behavior of the preceding variables. The highest values were reached in mid-December, due to intense precipitation between the end of November and mid-December. The Casa de Piedra refuge exceeded 320 mm (not all in the form of snow, there were days of rain), giving high thicknesses for the moderate elevation of this refuge: more than 100 cm between 9 and 18 December, with a peak of 162 cm on the 11th. The Bachimaña refuge had a similar behavior (peak, 160 cm, December 8). This was in accordance with a very wet December (150% DRV). However, this positive start to the winter season in terms of snow accumulation was quickly truncated. January was a normal month, but from the first ten days of February onwards, at the Casa de Piedra refuge, the thicknesses were less than 20 cm, except for occasional moments. The curve of maximums is very narrow, indicative of rapid melting due to the adverse rainfall and thermal conditions described above. The Bachimaña refuge maintained acceptable thicknesses until mid-March (the altitude factor is noticeable), with a curve in which there were alternating losses and gains. However, from this moment on, except for an occasional increase (April 23, 46 cm), the losses were sharp, quickly reaching zero from the beginning of May.
Figure 15 shows the state of the glacier on 30 August 2022.
Figure 15. Mid-upper sector of the Infierno Glacier. 30 August 2022. Debris-covered glacier progress. Ice emerges.
Geosciences 13 00040 g015
Table 3. Evolution of the Infierno Glacier, period 2016–2022. References over position in 2015 and over the previous year. Data in meters. Glacier front: longitudinal variation. Lateral glacier: thickness variation. Reference to surface prevalence of ice or firn.
DateGlacier Front Monitoring Station
(Reference Value 2015 = 0)
Glacier Front Monitoring Station
(Over Previous Year)
Glacier Lateral Monitoring Station
(Reference Value 2015 = 0)
Glacier Lateral Monitoring Station
(Over Previous Year)

Ice/Firn
(Dominance)
2015/09/050000ice
2016/09/03+18.4+18.4+2+2firn
2017/09/02+6.4−12−0.2−2.2ice
2018/09/01+36.1+29.7+2.1+2.3firn
2019/08/31+3.2−32.9−0.5−2.6ice
2020/08/31+14.5+11.3+1.4+1.9firn
2021/09/05+2.8−11.7+0.2−1.2firn
2022/08/30−14.9−17.7−4.6−4.8ice
Figure 16. Evolution of the Infierno Glacier (Glacier front monitoring station). Period 2016–2022. Longitudinal variation, data in meters. References on position in 2015 and trend line (red).
Geosciences 13 00040 g016
Figure 17. Evolution of the Infierno Glacier (Glacier lateral monitoring station). Period 2016–2022. Thickness variation, data in meters. References on position in 2015 and trend line (red).
Geosciences 13 00040 g017
To complement the evolution of the analyzed period (2016–2022) shown in Figure 16 and Figure 17, Figure 18 shows the general evolution of the Infierno Glacier over a longer time period, since the first year of observations in 1998, to 2022. Data for the period 1998–2015 have been already published [36]. This figure presents the glacier thickness variation (data from the glacier lateral monitoring station), because they best reflect the evolution of the glacier, as will be explained in Section 4 (Discussion). The figure shows a clearly negative trend line, although, during this 25-year period of observations, fluctuations are a constant, with strong interannual irregularity.
Figure 18. Evolution of the Infierno Glacier (Glacier lateral monitoring station). Period 1998–2022. Thickness variation, data in meters. References on position in 1998 and trend line (red). Years 2001 and 2002 to 2005: without data due to logistical problems or recent previous snowfalls that invalidated measurements.
Geosciences 13 00040 g018

4. Discussion

The evolution of the Infierno Glacier shows a negative trend in the period 2016–2022. The loss of 4.6 m in thickness and 14.9 m in length with respect to the “year zero” of our work, 2015, is significant (Table 3 and Figure 16 and Figure 17). However, if we extend the comparison to 1998, when we started measurements on this glacier, the values are even more striking: loss of 8.7 m in thickness (Figure 18) and 38.8 m in length.
This negative dynamic has not followed a regular pattern. On the contrary, trend changes have been the norm. Between 2016 and 2020, each year has had the opposite behavior with respect to the previous one. A year of gains followed a year of losses. Only in 2021 and 2022 did the loss trend remain stable. This has much to do with the inter-annual (and intra-annual) climatic irregularity characteristic of the climate of much of the Spanish Pyrenees, also of the upper basin of the Gállego River, where the glacier is located, with strong Mediterranean influences. The years in which the glacier has had gains with respect to the immediately preceding one have been 2016, 2018 and 2020. The years of losses were 2017, 2019, 2021 and 2022.
The annual evolution of the glacier has been analyzed according to the meteorological conditions. Two years are particularly significant, as they represent the extremes in the highly variable behavior of the glacier. They are 2018 and 2022. The first is the one with the greatest gains in our series; the second, is the one with the greatest losses. The year 2018 had a very wet long period (winter, spring and early summer). This period, including November, was also cold, with the rest of the summer being normal in temperature. The coincidence from late autumn to early summer of a long wet and cold period led to significant snow accumulation and late snowmelt. The result was a positive mass balance. In the case of 2022, conditions were very different. There was no serious deficit of snow accumulation, as several months of the winter and spring had normal or even high precipitation. Others in the same period, however, were very dry. However, the key factor this year was the high temperatures (with extraordinary values) during many months: winter, late spring, and summer. The result was rapid snowmelt, followed by mass loss of glacial ice, with the most pronounced negative glacier balance of our entire series.
Several graphs help to understand this very different behavior between 2018 and 2022. For the respective hydrological years, the precipitation curves according to DRV values are significant, with records well above average in 2018 since December, being clearly lower in 2022 (Figure 19). As for temperature DRV values, while low records predominate in 2018, the positive deviation for 2022 since December is extraordinary, with a gradual increase as the hydrological year progresses (Figure 20).
Another key variable to understand these 2018–2022 differences is the volume of snowpack reserves in the upper basin of the Gállego River (Figure 21). In the former, it is difficult to reach high volumes in the vicinity of 100 hm3 until the beginning of February, but then very high values are reached, exceeding 180 hm3, and in early June still exceed 40 hm3. In 2022 on the other hand, 100 hm3 are reached one month earlier, but the maximum is just over 120 hm3. Moreover, although the values remain acceptable until the end of April, the decline is very rapid, and from the beginning of June, the reserve is zero. Some significant data help to understand the differences: 13 April 2018: 184 hm3; 13 April 2022: 113 hm3. 15 May 2018: 100 hm3; 15 May 2022: 54 hm3.
As a final variable in our 2018–2022 comparison, we include snow thicknesses at the Casa de Piedra mountain refuge (Figure 22). Recall that it is located at a moderate altitude, which makes it difficult for the snowpack to persist for prolonged periods. Despite this, in 2018, from the end of December to the third week of April, 40 cm are exceeded. The maximum value, although high (138 cm, March 31) is, however, lower than that of 2022 (162 cm on December 11). However, the former is reached well into spring, while the latter is at the beginning of winter. In 2022 at the beginning of February, it drops below 40 cm, a value that is not recovered again during the whole season and decreases rapidly.
Complementary data for the analysis of the evolution of the Infierno Glacier are the confirmation of the last date of each hydrological year in which snow volume of more than 10 hm3 is still measured in the upper basin of the Gállego River, up to the Búbal Reservoir (Table 2). In the 2016/2022 period, this date was in June, except for one year (2021/2022), the year of the greatest glacier retreat, when it was on May 29. We can appreciate that in the three years of positive evolution (2016, 2018, 2020), that date occurs at the end of the month (June 28, 21 and 26, respectively). However, in the years of negative evolution, the date is earlier (between the end of May and mid-June), according to CHE-SAIH data [49].
A very important aspect of the analysis of the evolution of the Infierno Glacier is the comparison between the values recorded at the two monitoring stations: frontal and lateral (Table 3 and Figure 16 and Figure 17). There are logical coherences between the two, but also some differences. In this regard, we should point out several interesting details.
The years that offer advances in the front glacier with regard to their respective preceding years (2016, 2018 and 2020), have been characterized by an aspect of the glacier that still retained firn on an important part of its surface, on the dates of the climatic summer-autumn transit. This was reflected in the lateral glacier, with increases in thickness between +1.9 and +2.3 m, also in regard to their respective preceding years (not so much of glacier ice, but firn).
In the case of the years that have recorded net losses in the terminal front, with respect to their preceding years (2017, 2019, 2021 and 2022), it should be noted that the comparison with our “year zero” 2015 yields mostly positive values in the first three years. The only year with a decline with respect to 2015 is 2022. However, the side station measurements do not follow an identical pattern. In all the years noted, there are thickness losses relative to 2015 (except in 2021, with a negligible gain, +0.2 m). The losses in 2017 and 2019 are minor (−0.2 and −0.5 m, respectively), with the loss in 2022 being much larger (−4.6 m). These data confirm the progressive ablation of the glacier ice mass. From this, we can infer that the evolution measured at the glacier lateral monitoring station seems to us to be more in line with the real behavior of the Infierno Glacier, showing a negative trend. The frontal position, on the other hand, is more conditioned by variations in snow cover, with greater interannual variability.
The decline of the Infierno Glacier is not only found in the progressive ablation of the glacier ice mass but it is also found in the process of glacier transformation towards a debris-covered glacier as observed in recent years. Between 2016 and 2022, there are obvious changes. In 2016, approximately 40% of the glacier surface was covered by debris. It was possible to differentiate between 30% of continuous coverage and another 10% with more irregular coverage.
On the other hand, in 2022 the situation was very different. Most of the glacier was covered by debris. Approximately 40% of its surface was completely covered, concentrated in the eastern sector. In the rest of the glacier, its presence is more irregular but also significant, so that most of the surface of the glacier was covered with more or less density and thickness, by debris. The ice emerges predominantly in only 25–30% of the glacier surface, in the upper area and discontinuous sectors of the western part.
However, despite a dominant dynamic, some years a snow bed covers almost completely the debris cover. This happened in 2018. Figure 23 shows these notable differences between three years: 2016, 2018 and 2020.
It is interesting in this respect, to relate two evolutionary variables: the loss of glacier surface and the percentage of cover by debris. To exemplify this fact, we compare two years: 2020 and 2022 (Figure 3).
The year 2020 was a year of positive balance for the glacier. Its area was 7.07 ha and appears partially covered by debris (40% sum of continuous and discontinuous debris coverage). However, 2022 was a year of a very negative balance. Its area was 5.52 ha, and we saw, above, that approximately 70% of its surface had been covered by debris (sum continuous and discontinuous debris coverage). That is, between these years, a loss of 1.54 ha of the glacier surface is observed, while the debris surface increased by 30%.
This evolution is very significant, but we should not forget that in the evolution of the Infierno Glacier, the changes in the trend are very frequent.

5. Conclusions

The Infierno Glacier presents a clear negative dynamic during the 2016/2022 period, within the general context of the Pyrenean glaciers.
There is a remarkable correlation between the annual climatic conditions (temperatures and precipitation recorded in weather stations near the glacier) and the behavior of the glacier. It can be affirmed that the latter has very variable rhythms between successive years. In the study area, thermal and rainfall anomalies are common, both intra and inter-annual. This behavior is directly reflected in the glacier and explains the interesting variations between the years analyzed.
The thermal anomalies (DRV) show a clear upward trend in this seven year period. The thermal value has increased by +0.55 °C. With regard to precipitation, anomalies (DRV) show very irregular trends. Precipitation data show a decreasing trend (−9% in the same period), having rainfalls a higher influence than snowfalls (with an upward trend of the snow volumes).
The temperature is the factor that best explains the losses suffered by the Infierno Glacier, as may be seen throughout our 2016/2022 series, but especially in the last year, 2022, with an exceptionally warm late spring and summer. The result is that the glacier lost 4.6 m in thickness with respect to 2015 (and 8.7 m with respect to 1998, the year when our work on this glacier began). The decline is also observed in the transformation of this glacier or part of it, in recent years, towards a debris-covered glacier. This phenomenon might be related to the progressive melting of permafrost at these altitudes and increasing periglacial processes.
The analysis of snow volume rates and monthly thermal irregularities has allowed us to understand the behavior of the glacier each year. There are winters with heavy snowfall, followed by warm springs and summers, which make these winter snow thicknesses disappear rapidly, resulting in the retreat of the glacier. In a different sense, heavy snowfall in late spring can explain a positive year for the glacier, sometimes being more decisive than winter snowfall, because it helps to protect the ice mass during the period of high summer temperatures (although it is difficult to transform it into ice and incorporate it into a positive balance of glacier ice).

Author Contributions

Conceptualization, methodology, writing original draft, supervision, L.C.-P.; review and editing, L.C.-P., G.F.-J., J.A.C.; collected data, G.F.-J.; data curation, G.F.-J.; investigation, L.C.-P., G.F.-J., J.A.C., J.d.V.-M.; analyzed and interpreted results, L.C.-P., G.F.-J. All authors have read and agreed to the published version of the manuscript.

Funding

This research received no external funding.

Data Availability Statement

Not applicable.

Acknowledgments

We are grateful for the support of the Board the “Natural Monuments of the Pyrenean Glaciers”, the drive and fundamental participation of Fernando Lampre-Vitaller in the “Infierno Glacier” project since its inception in 1998, the collaboration of Carlos Martín since 2020 with his images captured from drones and its field support, the availability of Peio Oria Iriarte, AEMET delegate, for the facilities to obtain the meteorological data of the Pyrenean refuges, the collaboration of Pablo Dolz Millán in cartographic matter, the help of friends who have accompanied us to many of our climbs to the glacier, especially to Mª Dolores Giménez Banzo and Pilar García Martínez, the attention and information of the guards of the Casa de Piedra and Bachimaña refuges. The authors thank the three anonymous reviewers for their constructive and valuable comments on the earlier version of this manuscript. The authors also thank the editors of Geosciences for the improvements incorporated in this paper during the editing process.

Conflicts of Interest

The authors declare no conflict of interest.

References

  1. Ramond, L.F. Voyages au Mont-Perdu et dans la Partie Adjacent des Hautes-Pyrénées; Belin: Paris, France, 1801; 392p. [Google Scholar]
  2. Reclus, É. Les Pyrenées. Guides Joanne; Hachette: Paris, France, 1861. [Google Scholar]
  3. Mallada, L. Breve reseña geológica de la provincia de Huesca. An. Soc. Esp. Hist. Nat. 1875, IV, 169–232. [Google Scholar]
  4. Mallada, L. Descripción Física y Geológica de la Provincia de Huesca. Memorias de la Comisión del Mapa Geológico de España; Imprenta y Fundición de Manuel Tello: Madrid, Spain, 1878; 439p. [Google Scholar]
  5. Beraldi, H. Cent Ans aux Pyrénées; Impr. de L. Danel: Paris, France, 1898. [Google Scholar]
  6. Russell, H. Souvenirs D’Un Montagnard; Vignancour: Pau, France, 1908; 738p. [Google Scholar]
  7. Schrader, F. Pyrénées. I. Courses et Ascensions; Édouard Privat: Toulouse, France, 1936; 350p. [Google Scholar]
  8. Arenillas, M.; Martínez Costa, R.; Martínez de Pisón, E. El estado de los glaciares españoles en 1991. Ería 1992, 28, 176–182. [Google Scholar]
  9. Arenillas, M.; Martínez de Pisón, E.; Martínez Costa, R.; Navarro, J. Los glaciares actuales y la nieve en el Pirineo español. In Las Huellas Glaciares de las Montañas Españolas; Gómez Ortiz, A., Pérez Alberti, A., Eds.; Universidade de Santiago de Compostela: Santiago de Compostela, Spain, 1998; pp. 329–346. [Google Scholar]
  10. Chueca, J.; Lampre-Vitaller, F. Los glaciares del Alto Aragón; Instituto de Estudios Altoaragoneses: Huesca, Spain, 1994; Available online: https://www.iea.es/documents/449827/510304/Los+glaciares+en+el+Altoarag%C3%B3n.pdf/be9c8cec-5ae2-5f1a-d259-d205e16cd79f?t=1565776207735 (accessed on 1 September 2022).
  11. Martínez de Pisón, E.; Arenillas, M. Los glaciares actuales del Pirineo Español. In La Nieve en el Pirineo Español; Ministerio de Obras Públicas y Urbanismo: Madrid, Spain, 1998; pp. 29–98. [Google Scholar]
  12. Julián, A.; Chueca, J.; Peña, J.L.; López, I.; Lapeña, A. Dinámica de los glaciares del Pirineo aragonés: Resultado de la campaña glaciológica del año 1999. Boletín Glaciológico Aragonés 2001, 2, 13–36. Available online: https://www.cervantesvirtual.com/nd/ark:/59851/bmcht309 (accessed on 1 September 2022).
  13. Biarge, F.; Chueca, J.; Julián, A. Los glaciares pirenaicos aragoneses. Evolución. Fotografías 1880–1999. Boletín Glaciológico Aragonés. 2002. Available online: https://dialnet.unirioja.es/servlet/articulo?codigo=5199448 (accessed on 1 September 2022).
  14. Mora, J.; Arenillas, M.; Cobos, G.; Navarro, J. Évolution récente des glaciers des Pyrénées espagnoles. Houille Blanche 2006, 3, 65–70. [Google Scholar] [CrossRef]
  15. González Trueba, J.J.; Martín Moreno, R.; Serrano, E. Little Ice Age, glaciation and current glaciers in the Iberian Península. Holocene 2008, 18, 551–568. [Google Scholar] [CrossRef]
  16. Lampre-Vitaller, F. Situación Actual de Los Glaciares Pirenaicos Aragoneses; Patronato de los Monumentos Naturales de los Glaciares Pirenaicos: Zaragoza, Spain, 2016; (Unpublished report). [Google Scholar]
  17. Rico, I.; Izagirre, E.; Serrano, E.; López-Moreno, J.I. Current glacier area in the Pyrenees: An updated assessment. Pirineos 2017, 172, e029. [Google Scholar] [CrossRef] [Green Version]
  18. Camins, J. Pirineos, Glaciares Desde el Aire. Inventario y Catalogación. 2017; Besa & Keops: Igualada, Spain, 2018; 96p. [Google Scholar]
  19. García Ruiz, J.M.; López Moreno, J.I. Los glaciares cuaternarios y actuales: Agentes de la evolución del relieve y ejemplos de los grandes cambios climáticos. In Del Pirineo al Estudio de las Montañas del Mundo: 75 Aniversario del Instituto Pirenaico de Ecología; Lasanta Martínez, T., Pueyo, Y., Eds.; CSIC: Madrid, Spain, 2018; pp. 165–175. [Google Scholar]
  20. Sánchez Miravalles, A.; Cortada Ibañez, U.; Vasiljevic, R. Los glaciares pirenaicos. Tierra Tecnol. 2020, 56. [Google Scholar] [CrossRef]
  21. Lampre-Vitaller, F. Los glaciares del Pirineo aragonés. In Proceedings of the IV Seminario del Geoparque del Sobrarbe, Boltaña, Spain, 22–24 October 2010; pp. 6–20, Geoparque del Sobrarbe, (Internal Report). [Google Scholar]
  22. René, P. Glaciers des Pyrénées. Le Réchauffement Climatique en Images; Cairn Éditions: Pau, France, 2013; 167p. [Google Scholar]
  23. René, P. Le suivi des glaciers dans les Pyrénées françaises. Météo 2014, 85, 27–34. [Google Scholar] [CrossRef] [Green Version]
  24. René, P. Les Glaciers Des Pyrénées Francaises: Cycle Glaciaire 2015-16; Association Moraine: Luchon, France, 2016. [Google Scholar]
  25. Vidaller, I.; Revuelto, J.; Izaguirre, E.; Alonso González, A.; Gascoin, S.; René, P.; Berthier, E.; Rojas, F.; Rico Lozano, I.; Moreno, A.; et al. La respuesta heterogénea de los glaciares pirenaicos entre 2011 y 2020, Geotemas, 18, Vitoria-Gasteiz, Spain, 5–7 July 2021. In Abstracts of the X Congreso Geológico de España; García de Madinabeitia, N., Pérez López, A., Cambeses, A., Eds.; Sociedad Geológica de España: Salamanca, Spain, 2021. [Google Scholar]
  26. Francou, B.; Vincent, C. Les Glaciers À L’épreuve Du Climat; IRD Éditions et Belin: Paris, France, 2007; 274p. [Google Scholar] [CrossRef]
  27. Gardent, M. Inventaire et Retrait des Glaciers dans les Alpes Françaises Depuis la fin du Petit Âge Glaciaire. Ph.D. Thesis, Université de Grenoble, Grenoble, France, 2014; 443p. [Google Scholar]
  28. Schoeneich, P. Tournée IGS-SAO 2016. La Bérade-vallée du Vénéon. 25–28 Août 2016; International Glaciological Society, Section des Alpes Occidentales: Cambridge, UK, 2016; (Internal Report). [Google Scholar]
  29. Vincent, C.; Peyaud, V.; Laarman, O.; Six, D.; Gilbert, A.; Gillet-Chaulet, F.; Berthier, E.; Morin, S.; Verfaillie, D.; Rabatel, A.; et al. Déclin des deux plus grands glaciers des Alpes françaises au cours du XXIe siècle: Argentière et Mer de Glace. Météo 2019, 106, 49–58. [Google Scholar] [CrossRef]
  30. Smiraglia, C.; Diolauti, G. (Eds.) Il Nuovo Catastro dei Ghiacciai Italiani; Università degli Studi di Milano: Milano, Italy, 2016. [Google Scholar]
  31. Diolaiuti, A.G.; Azzoni, R.S.; D’Agata, C.; Maragno, D.; Fugazza, D.; Vagliasindi, M.; Mortara, G.; Perotti, L.; Bondesan, A.; Carton, A.; et al. Present extent, features and regional distribution of Italian glaciers. Houille Blanche 2019, 5–6, 159–175. [Google Scholar] [CrossRef]
  32. Google Earth. Available online: https://earth.google.com/web/@42.73405383,0.31819818,2035.37666317a,423366.71437651d,35y,0h,0t,0r (accessed on 23 January 2023).
  33. Serrano, E. Geomorfología del Alto Gállego. Pirineo Aragonés; Institución Fernando el Católico: Zaragoza, Spain, 1984; 501p. [Google Scholar]
  34. Serrano, E. Glacial evolution of the Upper Gállego valley (Panticosa mountains and ribera de Biescas, Aragonese Pyrenees, Spain). Pirineos 1991, 138, 83–104. [Google Scholar] [CrossRef]
  35. Cuchí, J.A.; Cancer-Pomar, L.; del Valle-Melendo, J.; Lampre-Vitaller, F.; Fernández-Jarne, G. Evolución reciente del glaciar del Infierno (Panticosa, Huesca). Lucas Mallada 2017, 19, 323–340. Available online: https://revistas.iea.es/index.php/LUMALL/article/view/2694 (accessed on 1 September 2022).
  36. Cancer-Pomar, L.; Cuchí, J.A.; Lampre-Vitaller, F.; del Valle-Melendo, J.; Fernández-Jarne, G. Observations glaciologiques (1998–2015) sur le glacier d’Infierno (Pyrénées, Espagne). La Houille Blanche 2020, 1, 84–91. [Google Scholar] [CrossRef]
  37. AEMET. Resúmenes climatológicos. España. Gobierno de España, Ministerio para la Transición Ecológica y el Reto Demográfico. Agencia Estatal de Meteorología. Available online: http://www.aemet.es/es/serviciosclimaticos/vigilancia_clima/resumenes (accessed on 1 September 2022).
  38. AEMET. Resúmenes climatológicos. Aragón. Gobierno de España, Ministerio para la Transición Ecológica y el Reto Demográfico. Agencia Estatal de Meteorología. Available online: http://www.aemet.es/es/serviciosclimaticos/vigilancia_clima/resumenes?w=1&k=arn (accessed on 1 September 2022).
  39. Lampre-Vitaller, F. Clima de alta montaña y sistemas morfoclimáticos fríos en el macizo de La Maladeta (PirineoAragonés). Treb. De La Soc. Catalana De Geogr. 2001, 52, 195–231. [Google Scholar]
  40. Cancer-Pomar, L.; Lampre-Vitaller, F.; del Valle-Melendo, J. Análisis de los primeros datos de la estación meteorológica del Aneto (3.050 m, macizo de la Maladeta, Pirineo aragonés). Su interés glaciológico. In Clima, sociedad y medio ambiente; Cuadrat Prats, J.M., Saz Sánchez, M.A., Vicente Serrano, S.M., Lanjeri, S., de Luis Arrillaga y, M., González-Hidalgo, J.C., Eds.; Asociación Española de Climatología: Madrid, Spain, 2006; pp. 541–551. [Google Scholar]
  41. Del Valle-Melendo, J. La precipitación media anual en el sector alto de la cuenca del Cinca (Pirineo aragonés, España). Pirineos 1997, 149–150, 121–144. [Google Scholar] [CrossRef] [Green Version]
  42. Östrem, G. Ice Melting under a Thin Layer of Moraine, and the Existence of Ice Cores in Moraine Ridges. Geogr. Ann. 1959, 41, 228–230. [Google Scholar] [CrossRef]
  43. Mattson, L. Ablation on Debris Covered Glaciers: An Example from the Rakhiot Glacier, Punjab, Himalaya. Proc. Int. Assoc. Hydrol. Sci. 1993, 218, 289–296. [Google Scholar]
  44. Nicholson, L.; Benn, D.I. Properties of Natural Supraglacial Debris in Relation to Modelling Sub-debris Ice Ablation. Earth Surf. Process. Landf. 2013, 38, 490–501. [Google Scholar] [CrossRef]
  45. Evatt, G.W.; Abrahams, I.D.; Heil, M.; Mayer, C.; Kingslake, J.; Mitchell, S.L.; Fowler, A.C.; Clark, C.D. Glacial melt under a porous debris layer. J. Glaciol. 2015, 61, 825–836. [Google Scholar] [CrossRef] [Green Version]
  46. Herreid, S. What can thermal imagery tell us about glacier melt below rock debris? Front. Earth Sci. 2021, 9, 681059. [Google Scholar] [CrossRef]
  47. Anderson, L.S.; Armstrong, W.H.; Anderson, R.S.; Scherler, D.; Petersen, E. The Causes of debris-covered glacier thinning: Evidence for the importance of ice dynamics from Kennicott glacier, Alaska. Front. Earth Sci. 2021, 9, 680995. [Google Scholar] [CrossRef]
  48. Lampre-Vitaller, F. Monumento Natural de los Glaciares Pirenaicos. Colección Espacios Naturales Protegidos; Gobierno de Aragón, Departamento de Agricultura y Medio Ambiente: Zaragoza, Spain, 2003. [Google Scholar]
  49. CHE-SAIH. Evolución de la Nieve Acumulada en la Cuenca del Alto Gállego. Gobierno de España, Ministerio para la Transición Ecológica y el Reto Demográfico. Confederación Hidrográfica del Ebro-Sistema Automático de Información Hidrológica. Available online: https://www.chebro.es/parte-semanal-de-nieve (accessed on 1 September 2022).
  50. AEMET. Datos Diarios de Acumulación Nival; Internal Report; Refugios de Montaña Pirenaicos, Gobierno de España, Ministerio para la Transición Ecológica y el Reto Demográfico, Agencia Estatal de Meteorología: Madrid, Spain, 2022. [Google Scholar]
  51. CHE-SAIH. Gestión y Previsión en Cuencas de Alta Montaña (Modelo *ASTER). Gobierno de España, Ministerio para la Transición Ecológica y el Reto Demográfico. Confederación Hidrográfica del Ebro-Sistema Automático de Información Hidrológica. Available online: https://portal.chebro.es/en/web/guest/modelo-aster (accessed on 1 September 2022).
  52. SPESA. Modelo ASTER. Modelo Hidrológico Pluviométrico-Nival de Simulación y Previsión. Manual de Usuario; SPESA Ingeniería S.A.: Zaragoza, Spain, 2022; 152p, Available online: https://www.spesa.es/paginas/basededatos/ASTER_Manual_Usuario.pdf (accessed on 1 September 2022).
  53. IGN. Instituto Geográfico Nacional (WMS). Available online: https://www.ign.es/web/ide-servicios-web#:~:text=La%20tecnolog%C3%ADa%20de%20sotfware%20utilizada%20en%20la%20creac (accessed on 12 January 2023).
  54. Google Earth. Available online: https://earth.google.com/web/@42.78489809,-0.25776536,2747.3942544a,1803.91737911d,35y,0h,0t,0r (accessed on 23 January 2023).
  55. AEMET. Comportamiento de las Precipitaciones en España y periodos de Sequía (periodo 1961–2018). Gobierno de España, Ministerio para la Transición Ecológica y el Reto Demográfico. Agencia Estatal de Meteorología. (Internal Report). Available online: https://www.aemet.es/es/conocermas/recursos_en_linea/publicaciones_y_estudios/publicaciones/detalles/NT32_AEMET (accessed on 1 September 2022).
  56. Bonsoms, J.; López-Moreno, J.I.; González, S.; Oliva, M. Increase of the energy available for snow ablation in the Pyrenees (1959–2020) and its relation to atmospheric circulation. Atm. Res. 2022, 275, 106228. [Google Scholar] [CrossRef]
  57. Téllez Jurado, B. Seguimiento de las anomalías diarias de la temperatura media en Cataluña. In Proceedings of the XXXIV Jornadas Científicas de la Asociación Meteorológica Española, Teruel, Spain, 29 February–4 March 2016; Agencia Estatal de Meteorología (AEMET): Madrid, Spain, 2016. ISBN 978-84-617-5240-9. Available online: https://repositorio.aemet.es/bitstream/20.500.11765/6148/1/xxxivjornadasame-seguimientoanomaliastemperatura.pdf (accessed on 1 September 2022).
  58. AEMET. Análisis de las Temperaturas en España en el Periodo 1961–2018. Gobierno de España, Ministerio para la Transición Ecológica y el Reto Demográfico. Agencia Estatal de Meteorología. (Internal Report). Available online: https://www.aemet.es/es/conocermas/recursos_en_linea/publicaciones_y_estudios/publicaciones/detalles/NT31_AEMET (accessed on 1 September 2022).
  59. López-Moreno, J.I. Recent variations of snowpack depth in the Central Spanish Pyrenees. Arct. Antarct. Alp. Res. 2005, 37, 253–260. [Google Scholar] [CrossRef]
  60. Añel, J.A.; López-Moreno, J.I.; Otto, F.E.; Vicente Serrano, S.M.; Schaller, N.; Massey, N.; Buisán, S.; Allen, M.R. The extreme snow accumulation in the western Spanish Pyrenees during winter and spring 2013. Bull. Am. Meteorol. Soc. 2014, 95, S73–S76. [Google Scholar]
  61. Buisán, S.T.; López-Moreno, J.; Saz, M.A.; Kochendorfer, J. Impact of weather type variability on winter precipitation, temperature and annual snowpack in the Spanish Pyrenees. Clim. Res. 2016, 69, 79–92. [Google Scholar] [CrossRef]
  62. Navarro, F.; López-Moreno, J.L. Spatio-temporal analysis of snowfall events in the Spanish Pyrenees and their relationship to atmospheric circulation. Cuad. Inv. Geográf. 2017, 43, 233–254. [Google Scholar] [CrossRef]
  63. López-Moreno, J.I.; Soubeyroux, J.M.; Gascoin, S.; Alonso-Gonzalez, E.; Durán-Gómez, N.; Lafaysse, M.; Vernay, M.; Carmagnola, C.; Morin, S. Long-term trends (1958–2017) in snow cover duration and depth in the Pyrenees. Int. J. Clim. 2020, 40, 6122–6136. [Google Scholar] [CrossRef]
  64. CHE. Determinación del Balance Anual de Masa y Movimiento del Hielo en el Glaciar de la Maladeta. Año Hidrológico 2014–2015; Gobierno de España, Ministerio de Agricultura, Alimentación y Medio Ambiente. Confederación Hidrográfica del Ebro: Zaragoza, Spain, 2015; 59p, (Internal Report. Informe Técnico del Programa ERHIN: Evaluación de los Recursos Hídricos procedentes de la Innivación). [Google Scholar]
Figure 1. Location of the Infierno Glacier. Pyrenees Mountain range, northern part of the Huesca province (Aragon, Spain). The small box marks the situation of the Upper Gállego River basin. Source: Google Earth [32].
Geosciences 13 00040 g001
Figure 2. View of the Infierno Massif, northeastern face. Infierno Glacier (central position), former eastern glacier (left) and former western glacier (right), now dead ice-snow patches. 20 September 2018.
Geosciences 13 00040 g002
Figure 3. Drone photography of the Infierno Glacier, 31 August 2020, outline in blue. In yellow, outline of the glacier on 30 August 2022. Glacier head is at the bottom of the photo. Photo and composition by C. Martín.
Geosciences 13 00040 g003
Figure 4. Mid-upper sector of the Infierno Glacier. The eastern sector shows a progressive transition to a debris-covered glacier. 5 September 2021.
Geosciences 13 00040 g004
Figure 5. Drone photography of the Infierno Glacier, 31 August 2020 (left) and 5 September 2021 (right). Snow-firn cover is very different between two successive years. Photos by C. Martín.
Geosciences 13 00040 g005
Figure 19. Rainfall anomalies in the upper Gállego River basin. Hydrological year 2017/2018 (left) and 2021/2022 (right). Over reference period 1981–2010, as determined by AEMET for these comparisons. Data source and methodology: AEMET [37,38,55].
Geosciences 13 00040 g019
Figure 20. Thermal anomalies in the upper Gállego River basin. Hydrological year 2017/2018 (left) and 2021/2022 (right). Over reference period 1981–2010, as determined by AEMET for these comparisons. Data source and methodology: AEMET [37,38,57,58].
Geosciences 13 00040 g020
Figure 21. Evolution of snow volume in the upper Gállego River basin (up to the Búbal Reservoir). Hydrological year 2017/2018 (left) and 2021/2022 (right). Base data, daily snow volumes, expressed in hm3 (equivalent volume of water). Data source and methodology: CHE-SAIH [49,51,52].
Geosciences 13 00040 g021
Figure 22. Evolution of snowpack thickness at the Casa de Piedra refuge, weather station (1636 m a.s.l.). Hydrological year 2017/2018 (left) and 2021/2022 (right). Base data: daily snow depth. Data source: AEMET [50].
Geosciences 13 00040 g022
Figure 23. Detail of the Infierno Glacier. 3 September 2016 (left), 1 September 2018 (center), 30 August 2022 (right). Significant differences in the percentage of debris-covered glacier.
Geosciences 13 00040 g023
Disclaimer/Publisher’s Note: The statements, opinions and data contained in all publications are solely those of the individual author(s) and contributor(s) and not of MDPI and/or the editor(s). MDPI and/or the editor(s) disclaim responsibility for any injury to people or property resulting from any ideas, methods, instructions or products referred to in the content.

