Brief Report

Teleseismic P-Wave Attenuation Beneath the Arabian Plate

1
Geology Department, Faculty of Sciences, Taibah University, Al-Madinah al-Munawwarah P.O. Box 344, Saudi Arabia
2
Graduate School of Science and Engineering, Ibaraki University, 2-1-1 Bunkyo, Mito 310-8512, Japan
3
Disaster and Crises Center, Saudí Geological Survey (SGS), Jeddah 21514, Saudi Arabia
*
Author to whom correspondence should be addressed.
Geosciences 2023, 13(11), 343; https://doi.org/10.3390/geosciences13110343
Submission received: 26 August 2023 / Revised: 10 October 2023 / Accepted: 26 October 2023 / Published: 9 November 2023
(This article belongs to the Section Natural Hazards)

Abstract

:
In order to prove that the Arabian Plate is a tectonically active region even in its shield areas, we obtained the attenuation structure t p * of the upper mantle beneath the Arabian Plate by applying the spectral inversion method to the newly established seismic network in Saudi Arabia operated by the Saudi Geological Survey (SGS). The data sets consisted of good quality vertical components of the teleseismic events for more than 4400 spectral ratios. The result showed significant and diverse t p * structures between the eastern and western regions of the Arabian Plate. High t p * was the predominant feature underneath the Arabian Shield (western Arabia) and low t p * within the Arabian Platform (eastern Arabia). The obtained t P * values range from −1.0 s to 1.0 s. The observed high t p * patterns followed a line from north to south through the Arabian Shield along the Red Sea margin. The high t p * distribution closely followed the volcanic region, in particular the Makka–Madina–Nafud Volcanic (MMNV) line. The maximum t p * values were observed in the southern region of the Arabian Shield, at the southern part of the Red Sea, where the African and Arabian Plates diverge. The observed high t p * will be attributed to the previously revealed low-velocity anomaly and thermal activities beneath the Arabian Shield, and it is also correlated with the topography (high elevation) in the region.

1. Introduction

Various methods using different seismic phases have been used to determine the attenuation parameter, Q, for the Arabian Plate [1,2,3,4,5]. These include L g attenuation tomography [5], the L g P g amplitude ratio tomography method, the two-station method [3,4,6], and the back-projection method [7]. These methods all show variations in the attenuation in the upper mantle using both surface and body waves that are consistent with local, regional and global scale studies and indicate that the upper 200–300 km of the mantle beneath the oceans and tectonically active regions is generally more attenuating than the mantle beneath stable continental shields [8,9,10,11,12,13,14,15,16,17,18,19,20,21,22].
However, this is not the case for the Arabian Plate, in particular, the Arabian Shield. Previous seismic attenuation results based on studies of P, S and Lg waves have revealed that a high attenuation zone exits underneath the Arabian Shield along the Red Sea margin at upper mantle depths [2,3,4,5]. Consistent with past seismic work in the region were anomalously low seismic velocities observed beneath the Shield region [23,24,25,26,27,28,29,30,31,32,33,34,35], suggesting the presence of a thermal anomaly and showing that the Arabian Plate is a more active tectonic shields than some of the others. In this study, we utilized datasets that come primarily from the Saudi National Seismic Network (SNSN) operated by the Saudi Geological Survey (SGS) [36] from 2006 to 2009. The datasets consist of good quality vertical component seismograms. We applied to it a spectral inversion method [20,22] and thereby obtained the distribution of attenuation parameter t p * in this region. It is worth mentioning that this is the first attempt to apply this method to Saudi Arabian seismic data operated by the SGS. We compared the results with the low velocity anomaly previously reported, as well as the seismicity and volcanism in this region.

2. Data

SNSN is a seismic network with state-of-the-art Very Small Aperture Terminal (VSAT) technology in the Arabian Plate (Saudi Arabia) operated by the Saudi National Seismic Network (SNSN) of the SGS, which has allowed researchers to use the data with confidence. Here, we used seismic data recorded by the SNSN from the period of 2006 to 2009 for 49 stations. The station locations of the SNSN are shown in Figure 1. The installed SGS broadband stations consist of Nanometrics Trillium 40 seismometers, 24-bit Trident digitizers, GPS receivers, and Cygnus VSAT transceivers (Figure 2). Each seismic station is powered by a 320-watt solar array. Three channels (Z, N and E) are digitized with a sampling rate of 100 Hz. The VSAT telemetry is ideal and affordable for seismic stations located in remote areas of Saudi Arabia that do not have high-speed Internet access or a commercial power supply. The current VSAT is a private or closed system that uses time-domain multiple access (TDMA) for satellite channel sharing on the ARABSAT-2B and UDP/IP communications protocol for data transmissions and commands to remote stations. Data from the remote sites are transmitted to the satellites and then to the SGS master station (HUB) in Jeddah [36].
The datasets record the earthquakes that occurred around the globe. From the datasets, we selected the best high quality waveforms. We selected the data for a total of 20 teleseismic events. The datasets consist of well-recorded vertical component seismograms from deep teleseismic earthquakes (>200 km) at distances ranging from 30 to 90 (Figure 3 and Figure 4). Here, the P-waves turn below the 660 km discontinuity and above the heterogeneous D " region, in which the vertical gradients are well understood [20]. The advantage of using the P-wave portions from deep earthquakes is their relatively short durations, lack of complications from surface wave reflections (i.e., p P and s P ) and lack of attenuation by the uppermost mantle in the source region [20].
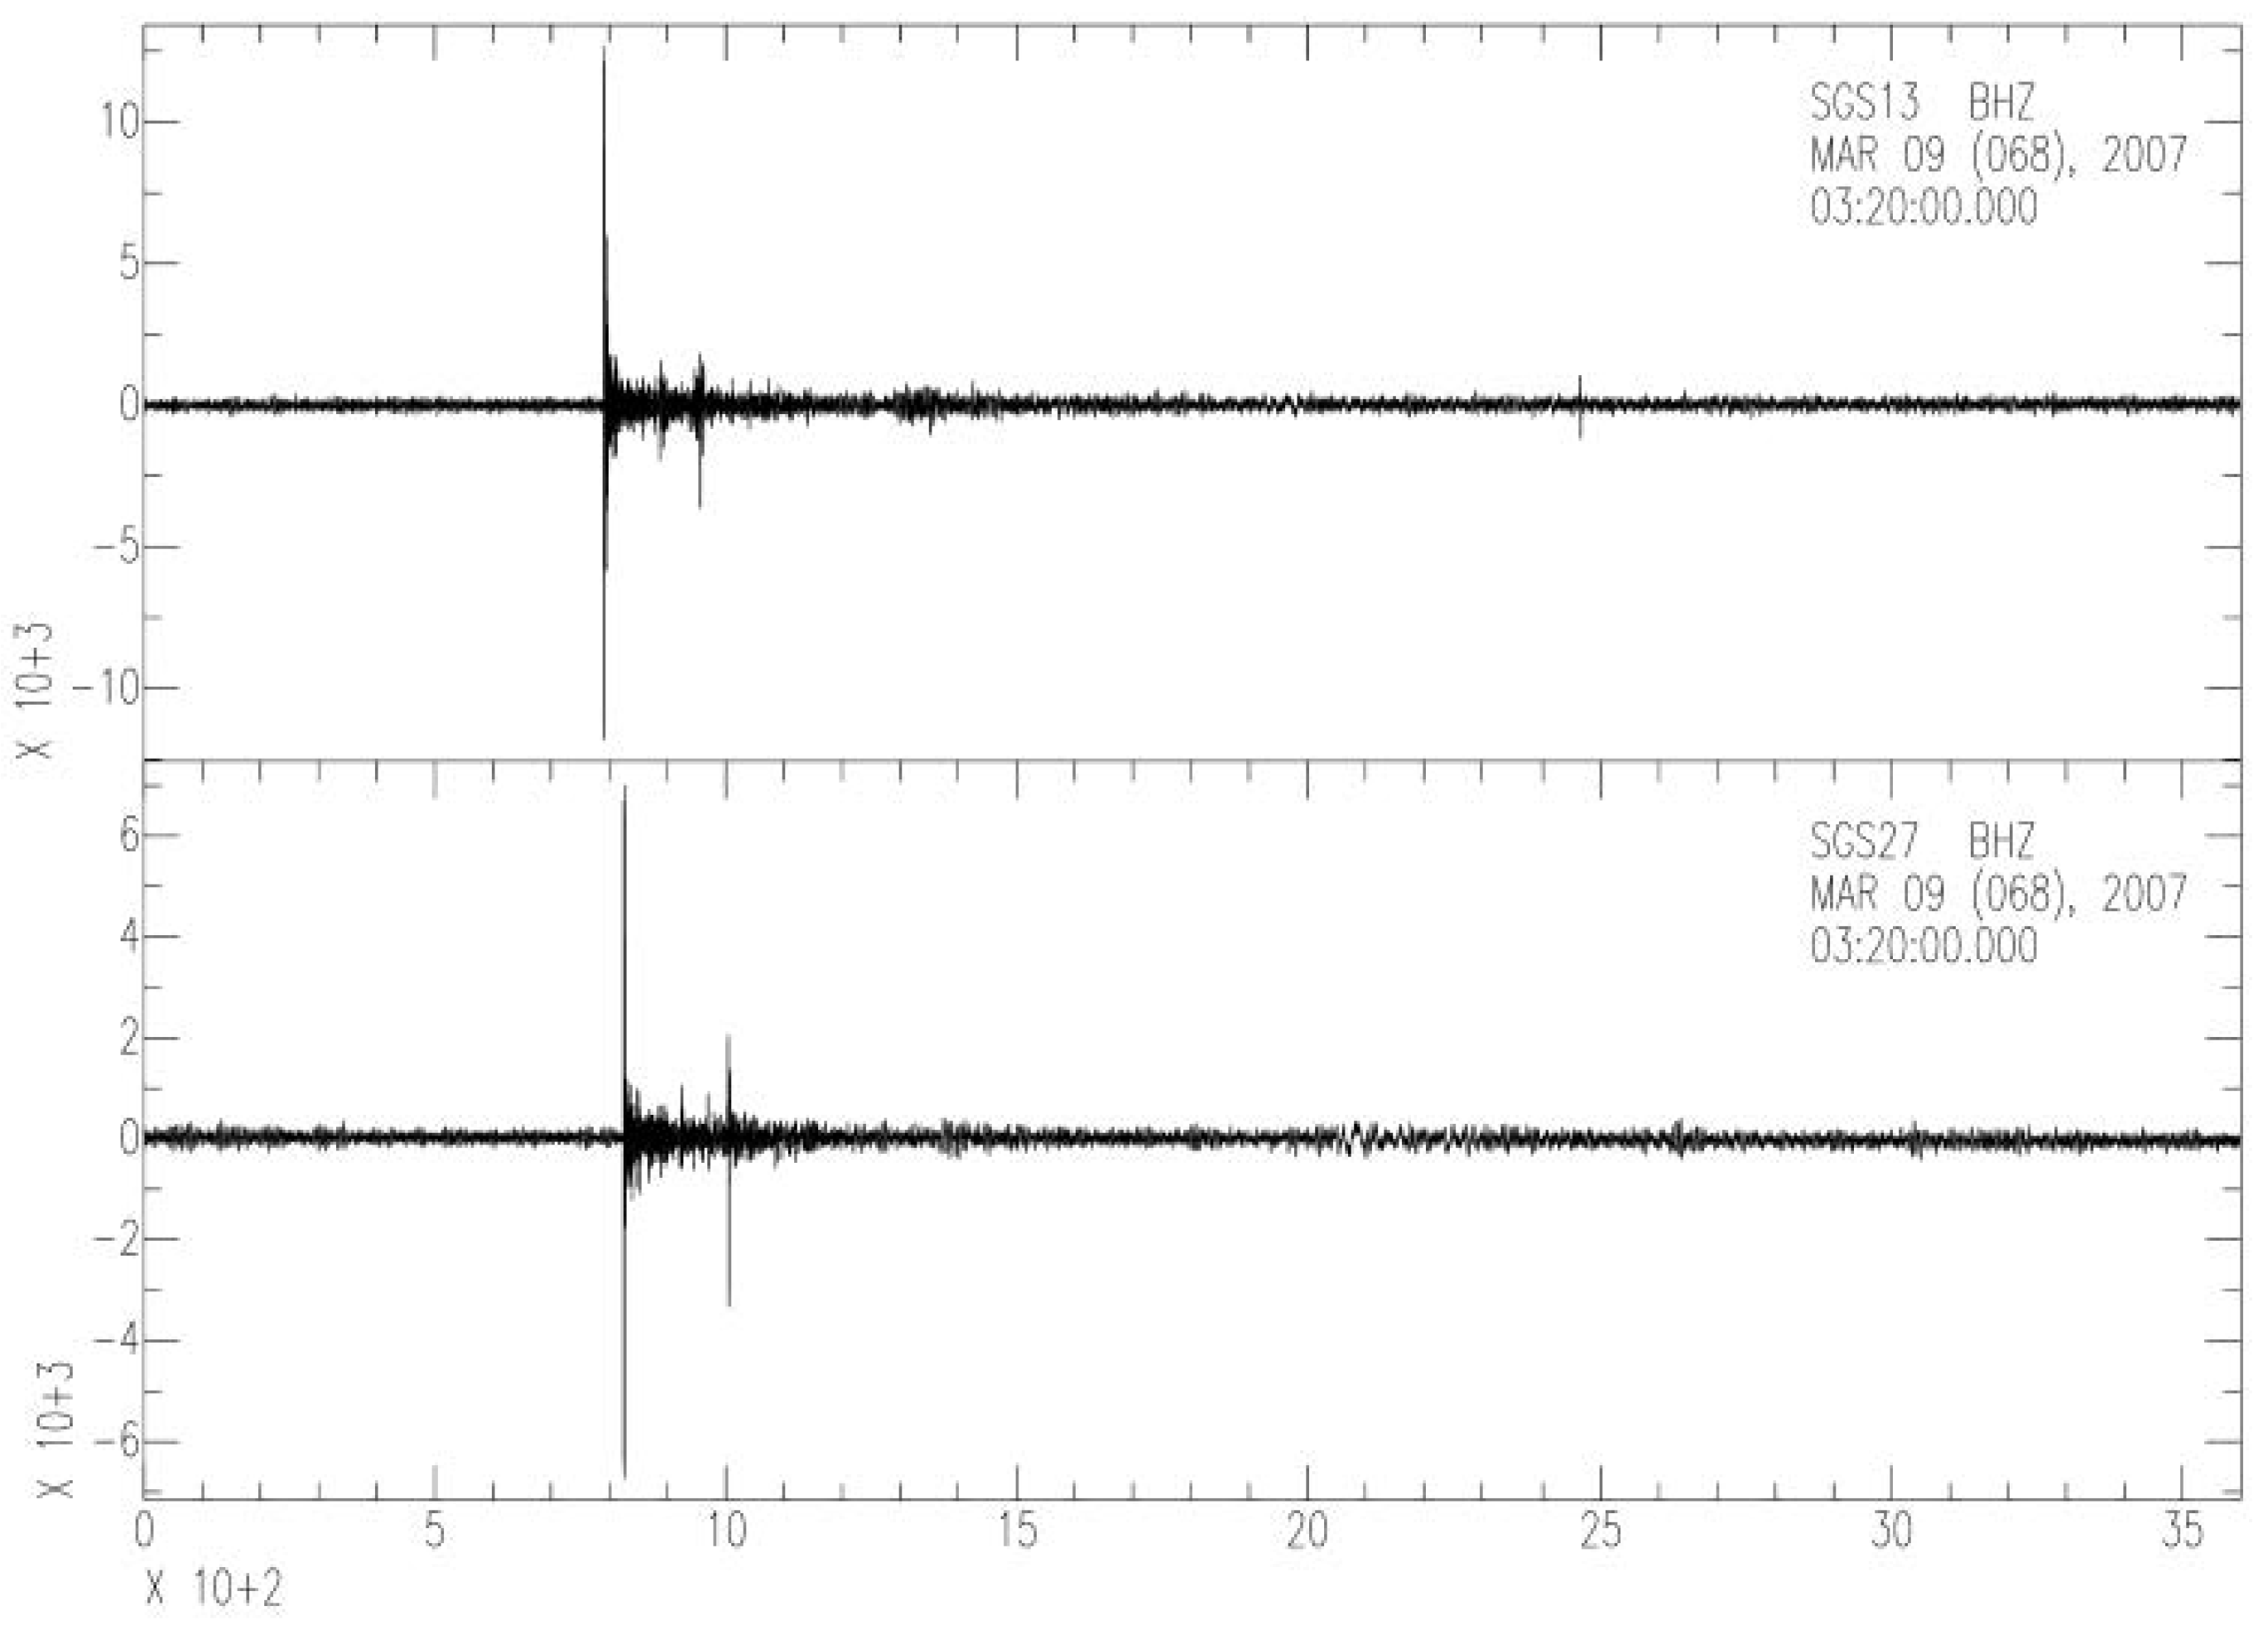
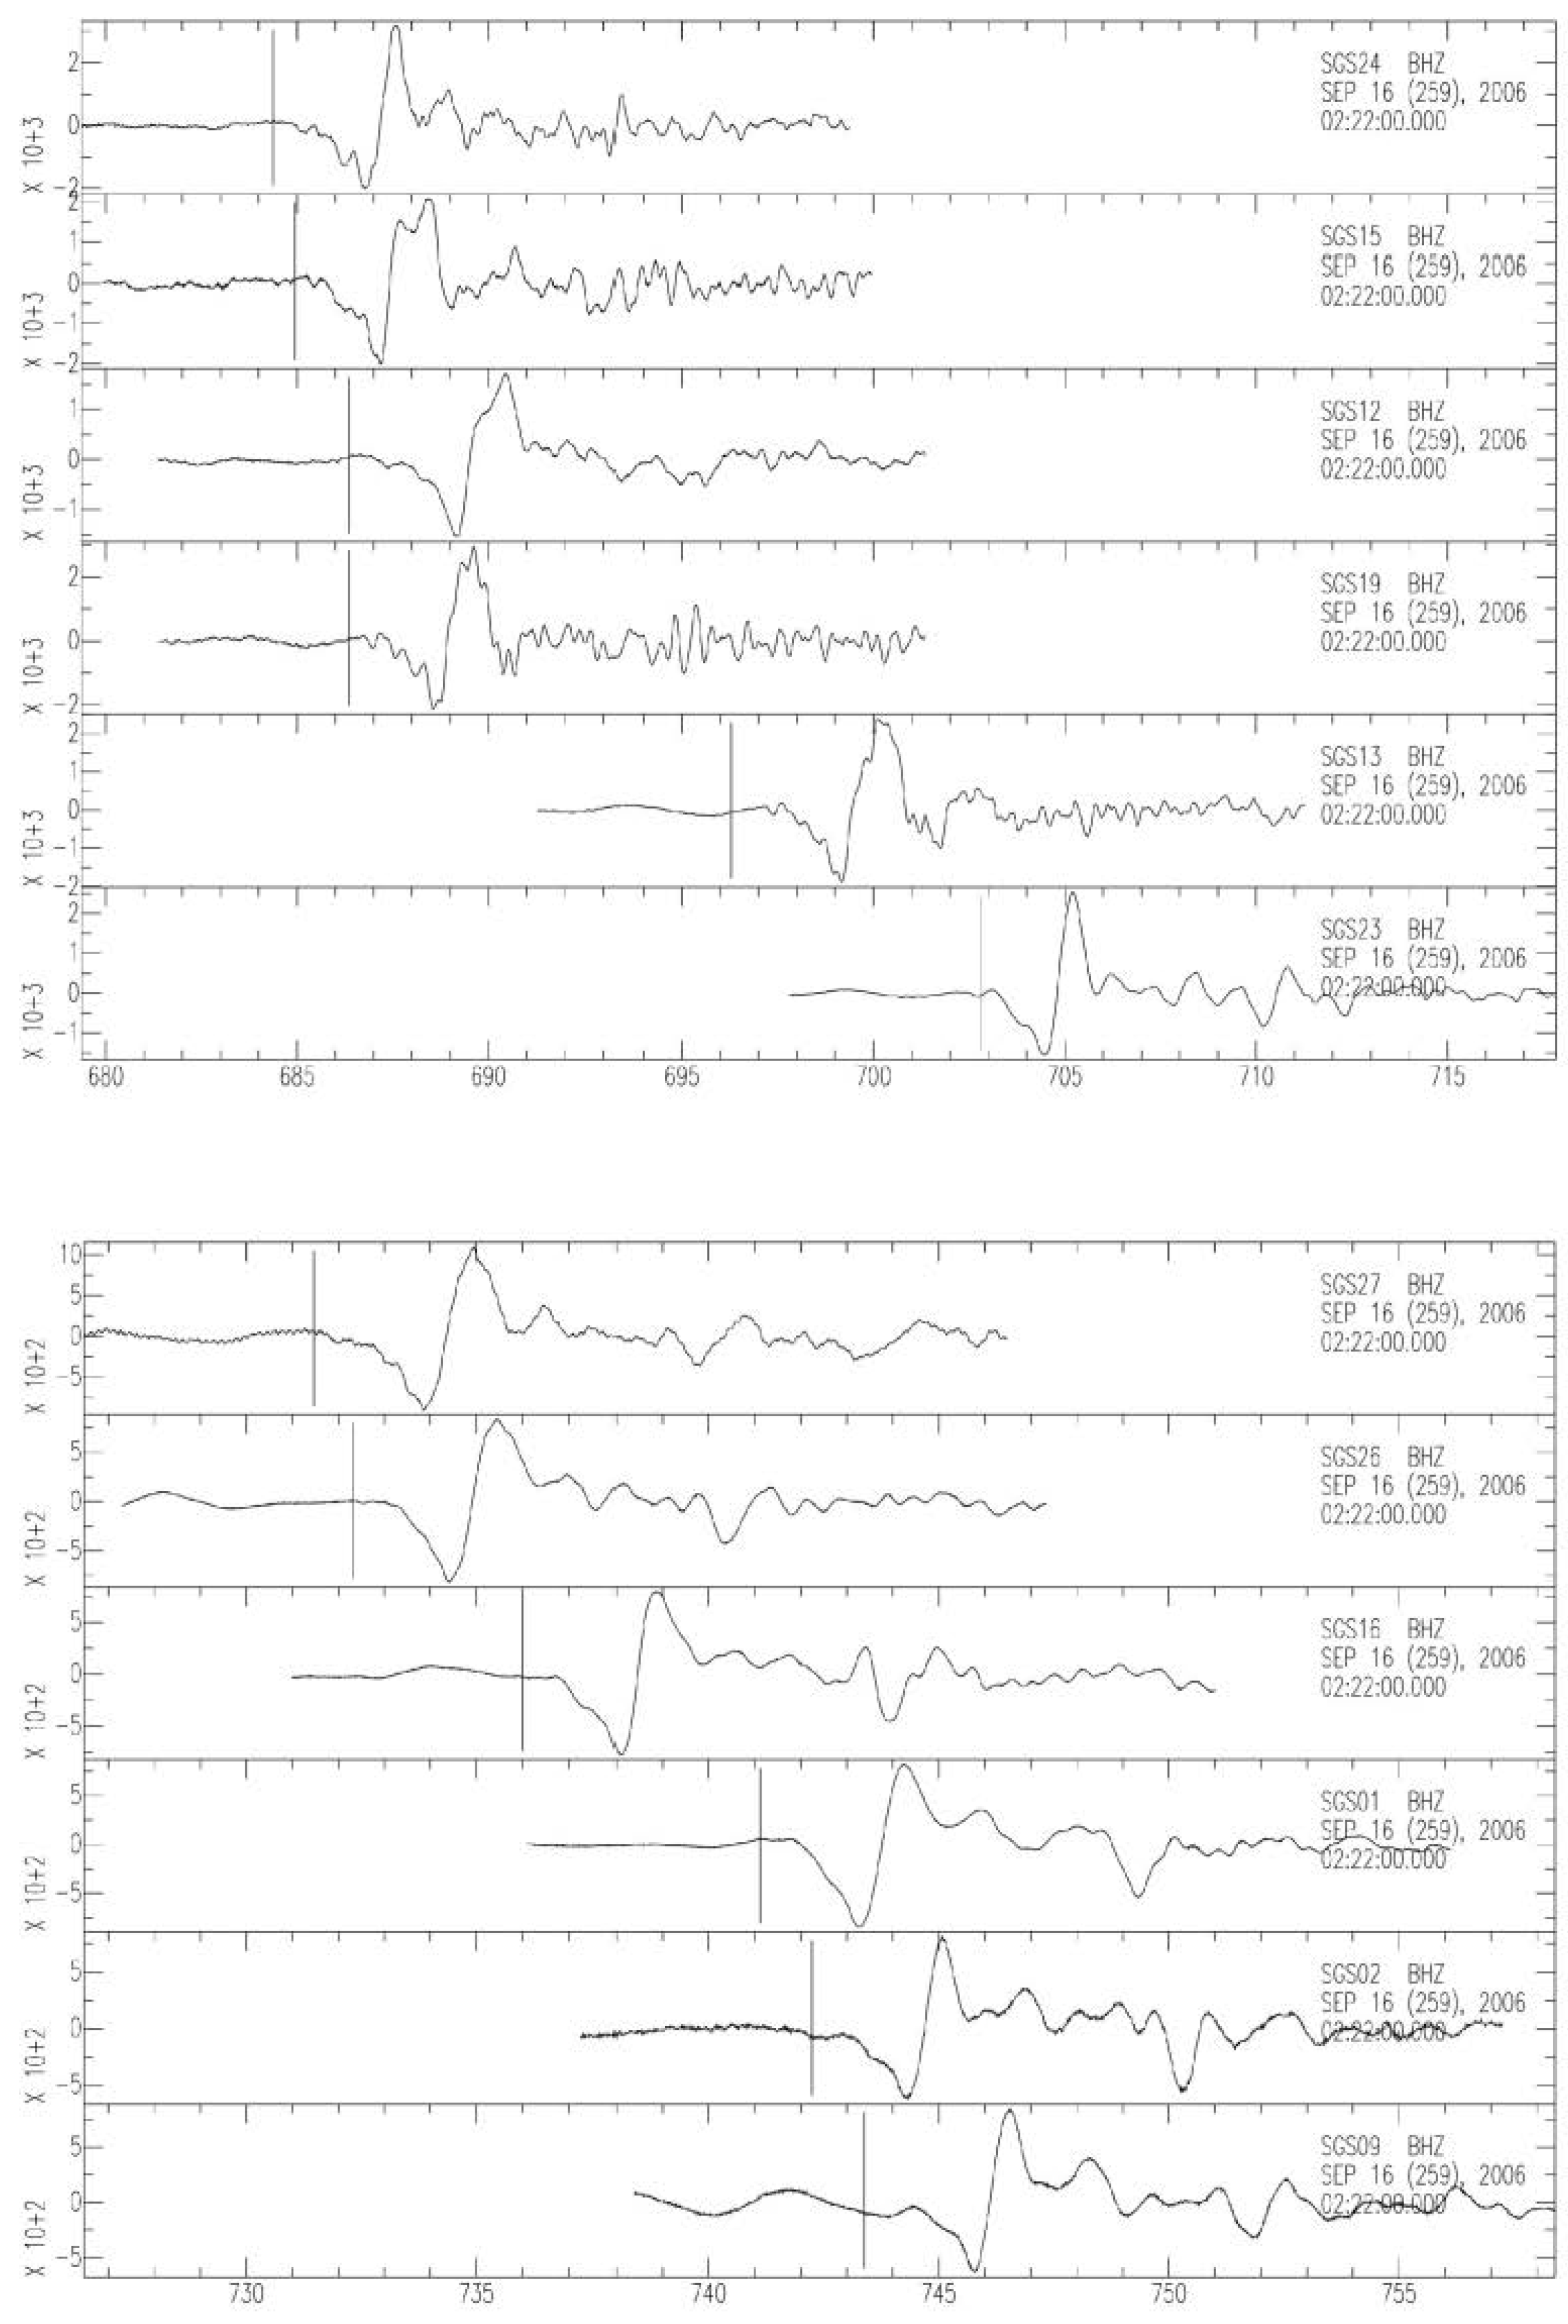
Examples of selected teleseismic waveforms are illustrated in Figure 5. The selected P-wave portions were limited with 15-second time windows for further data analysis and to increase the efficiency of the analysis procedures. Figure 6 shows examples of the P-waves with manually picked arrivals of the onset phase motion. In these figures, the recorded vertical components from eastern and western Arabia are shown for the same event. One can notice that the recorded P-wave from the eastern Arabian stations carried additional energy compared to the waveforms recorded at western Arabian stations. This is direct observation evidence showing that the effect of the attenuation could play a major role in seismic observation within the Arabian Plate.

3. Methodology

We followed the same data process used by [20,22]. We briefly review the methodology, which is based on an assumption that the observed amplitude spectrum of body wave A i j ( f ) for the event observed at the j t h station can be written as
A i j ( f ) = S i ( f ) exp ( π f t j * )
where S i ( f ) is the source amplitude spectrum, and t j * is the t * for this station, which is defined as a total travel time divided by the attenuation factor Q along the ray path [37]:
t * = r a y d t Q
We then take the ratio of the amplitude spectra of teleseismic P-waves between the two stations j and k for the same event i as:
R j k ( f ) = A i k ( f ) A i k ( f )
By applying (1) to (3), we obtain
ln R j k ( f ) = π f t p j k *
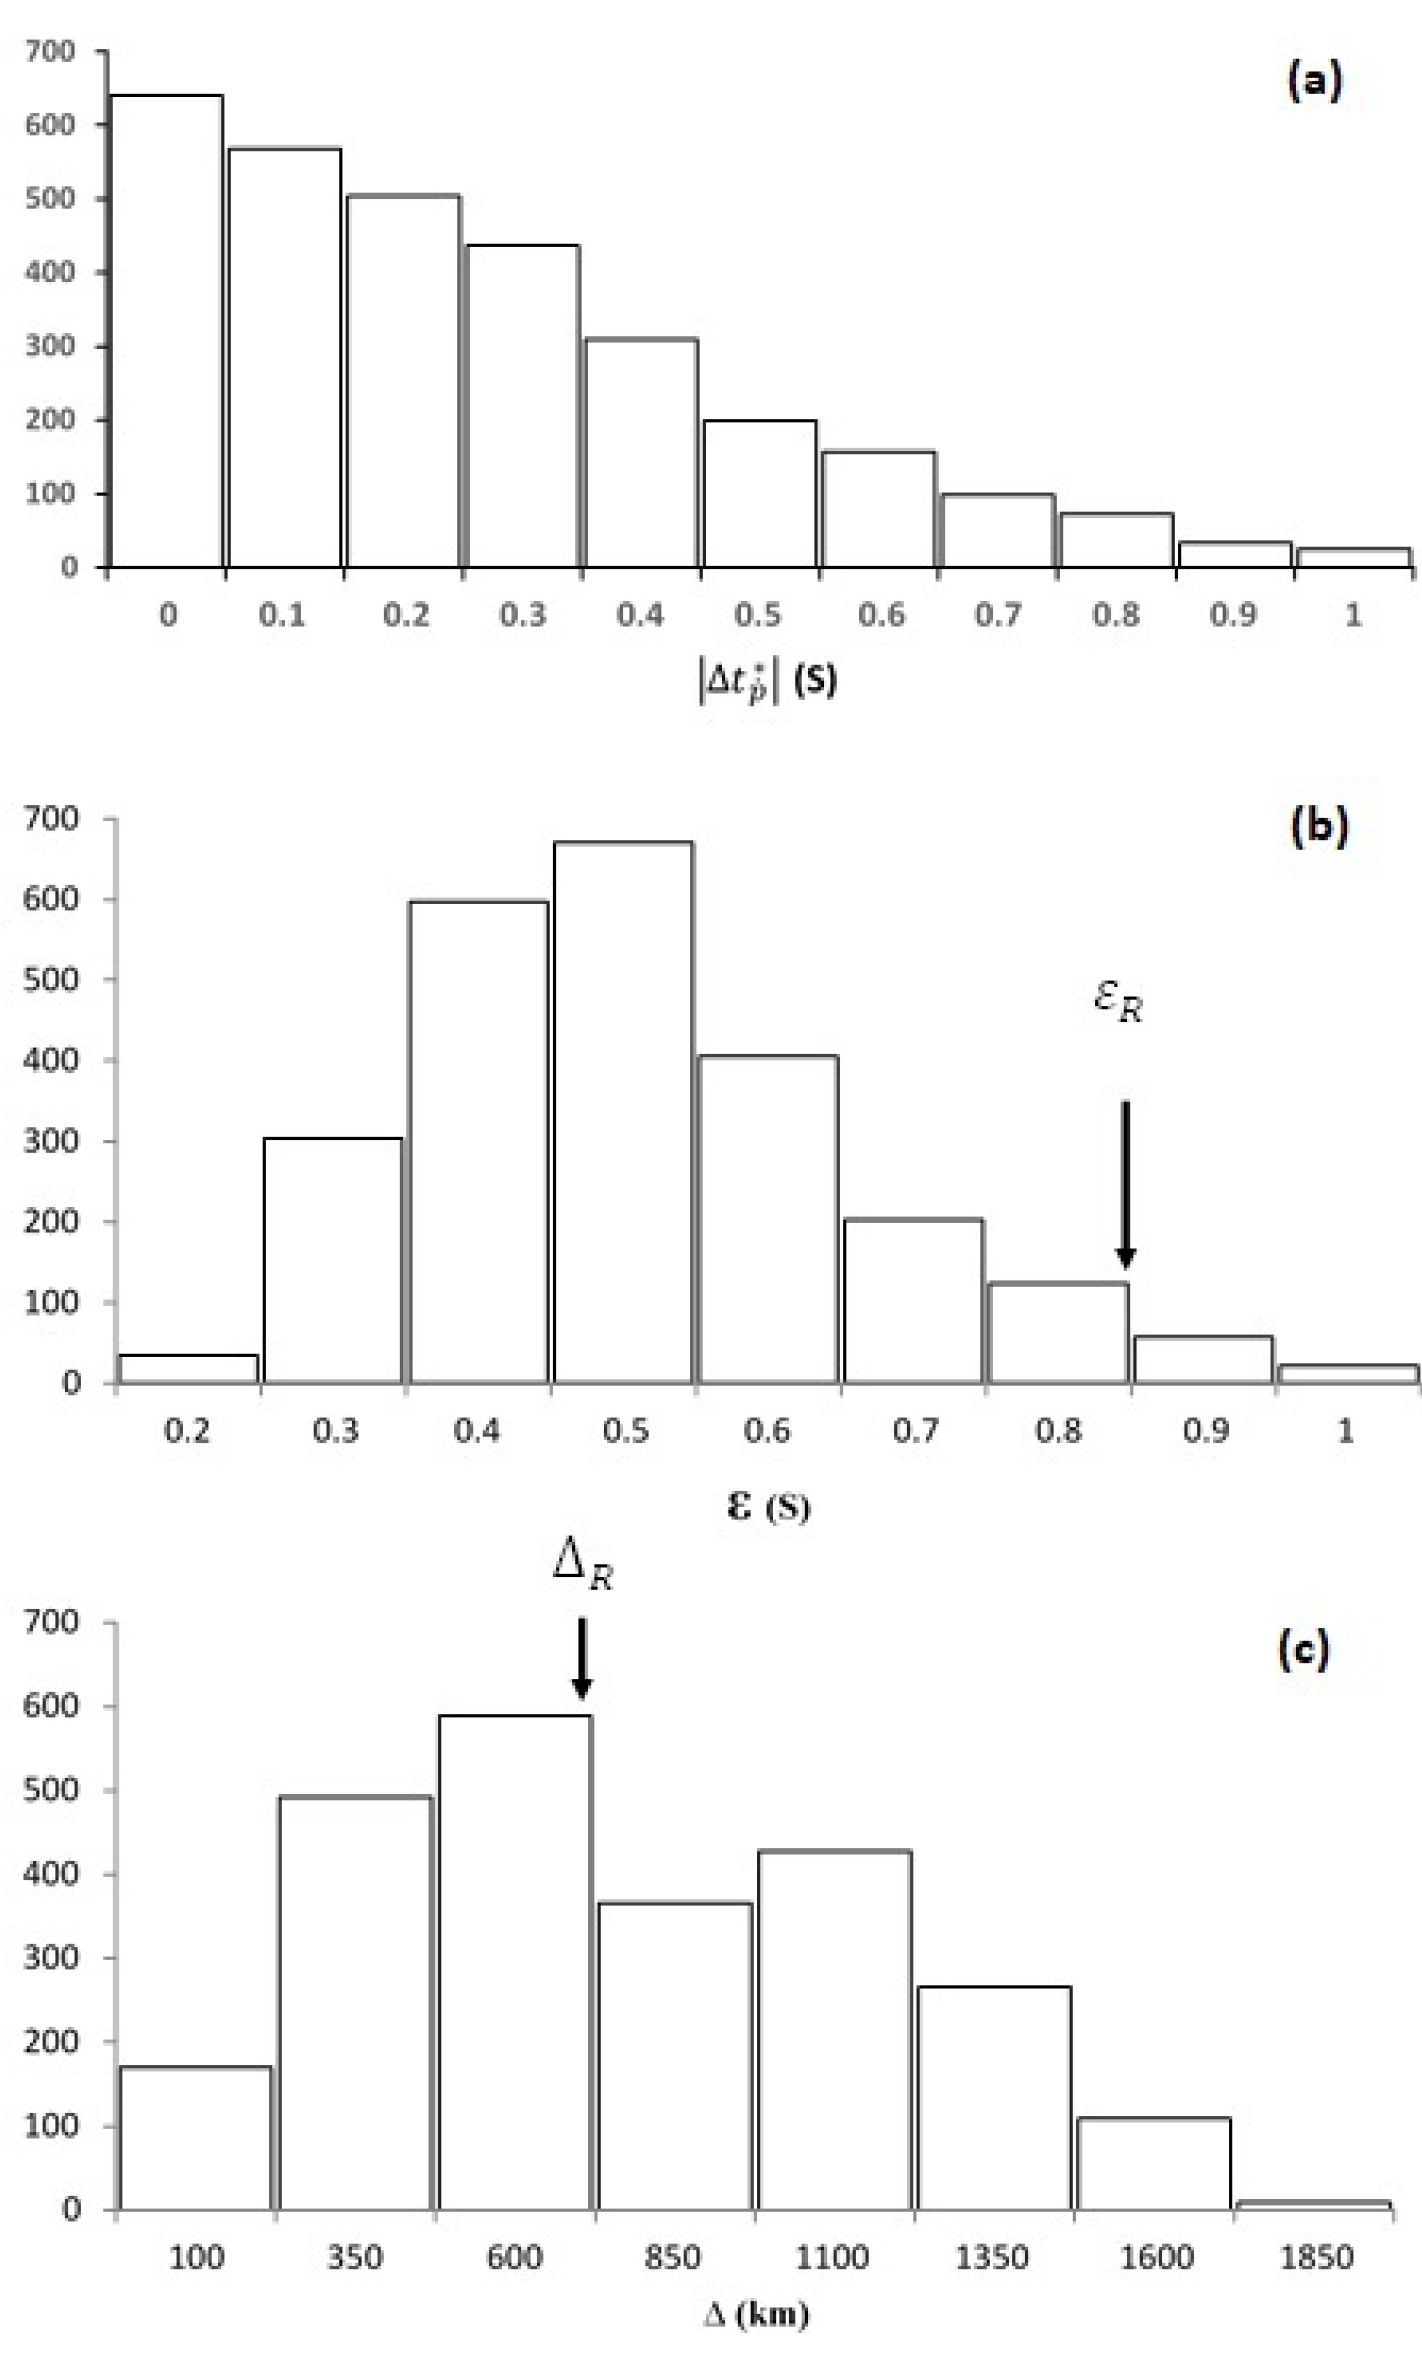
where Δ t p j k * = t P j * t P k * is the differential attenuation between two stations, and is determined as the measurement of the slopes of the best fitting lines. The ratios were smoothed by applying a moving average and then linearly regressed by the least square method. We successfully constructed datasets of spectral ratios for more than 4400 station pairs using data from different earthquakes at various azimuths. We assumed two weighting factors on the data: the 2 σ uncertainty, or the fitting error from the regression line ( ε j k ); and the interstation distance or station separation ( Δ j k ). Figure 7a–c shows the absolute values of | Δ t P * | , the measurement uncertainty ( 2 σ error) and the interstation separation between seismic stations within the Arabian Plate, respectively.
A set of linear equations to estimate t P * was constructed:
w j k ( t P j * t P k * ) = w j k Δ t p j k *
where the weighting factor w j k is:
w j k = exp [ ( ε j k ε R ) 2 ] exp [ ( Δ j k Δ R ) 2 ]
In the equation, we denoted 2 σ error by ε j k and the interstation distances by Δ j k . This includes the combination of the two constraints implemented for the 2 σ error in the Δ t P * measurements and the interstation distances. The first term in the constraint function in (6) reduces the weighting of the measurements with the highest 2 σ uncertainty, and the second constraint reduces the weighting of measurements for largely separated stations. We selected our 2 σ uncertainty reference values ε R to be 0.8 s, and we defined the station separation references values ( Δ R ) to be 715 km (Figure 7b,c). Furthermore, since the absolute values could not be constructed in the spectral method, we constrained the average values of t P * to be zero:
j = 1 49 t P * = 0
Thus, only the relative variations in t P * were estimated and then used for the inversions. We solved these linear equations (Equations (5) and (7)) with the standard least squares inversions method as G m = d , where m and d are vectors composed of t P j * and Δ t P j k * , to obtain the t P j * ( j = 1 , 2 , 3 , , 49 ) .

4. Results

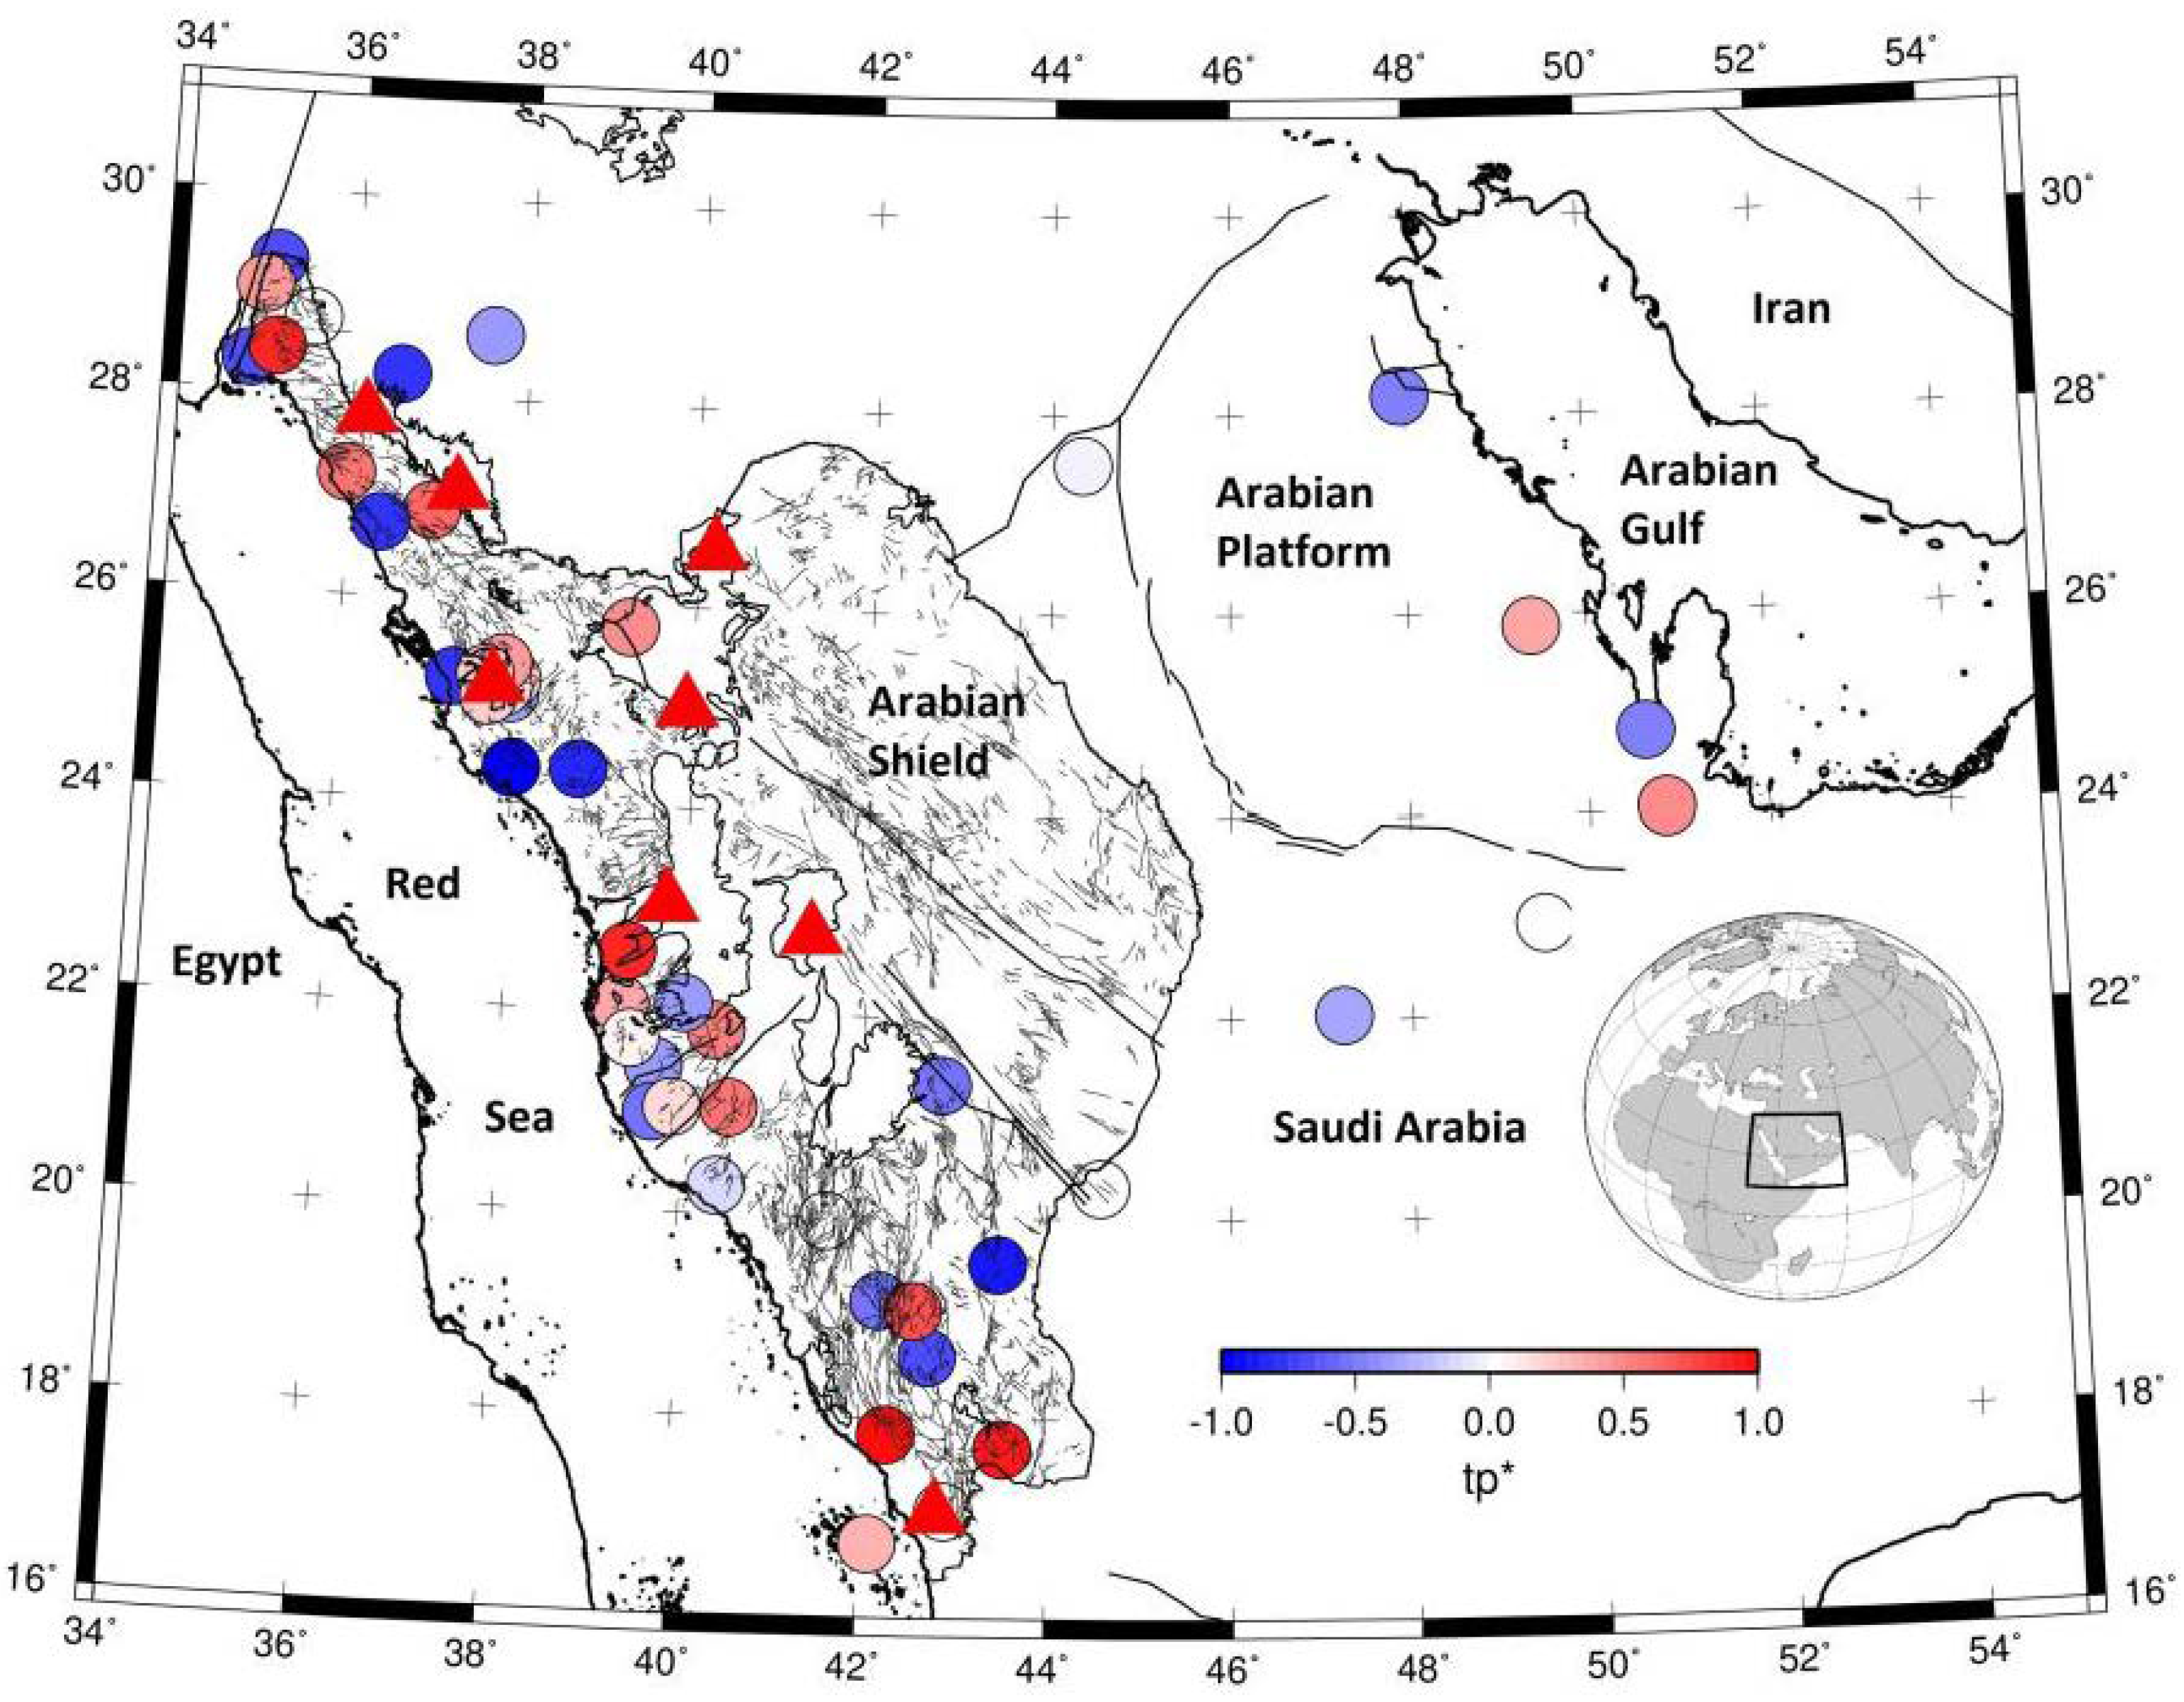
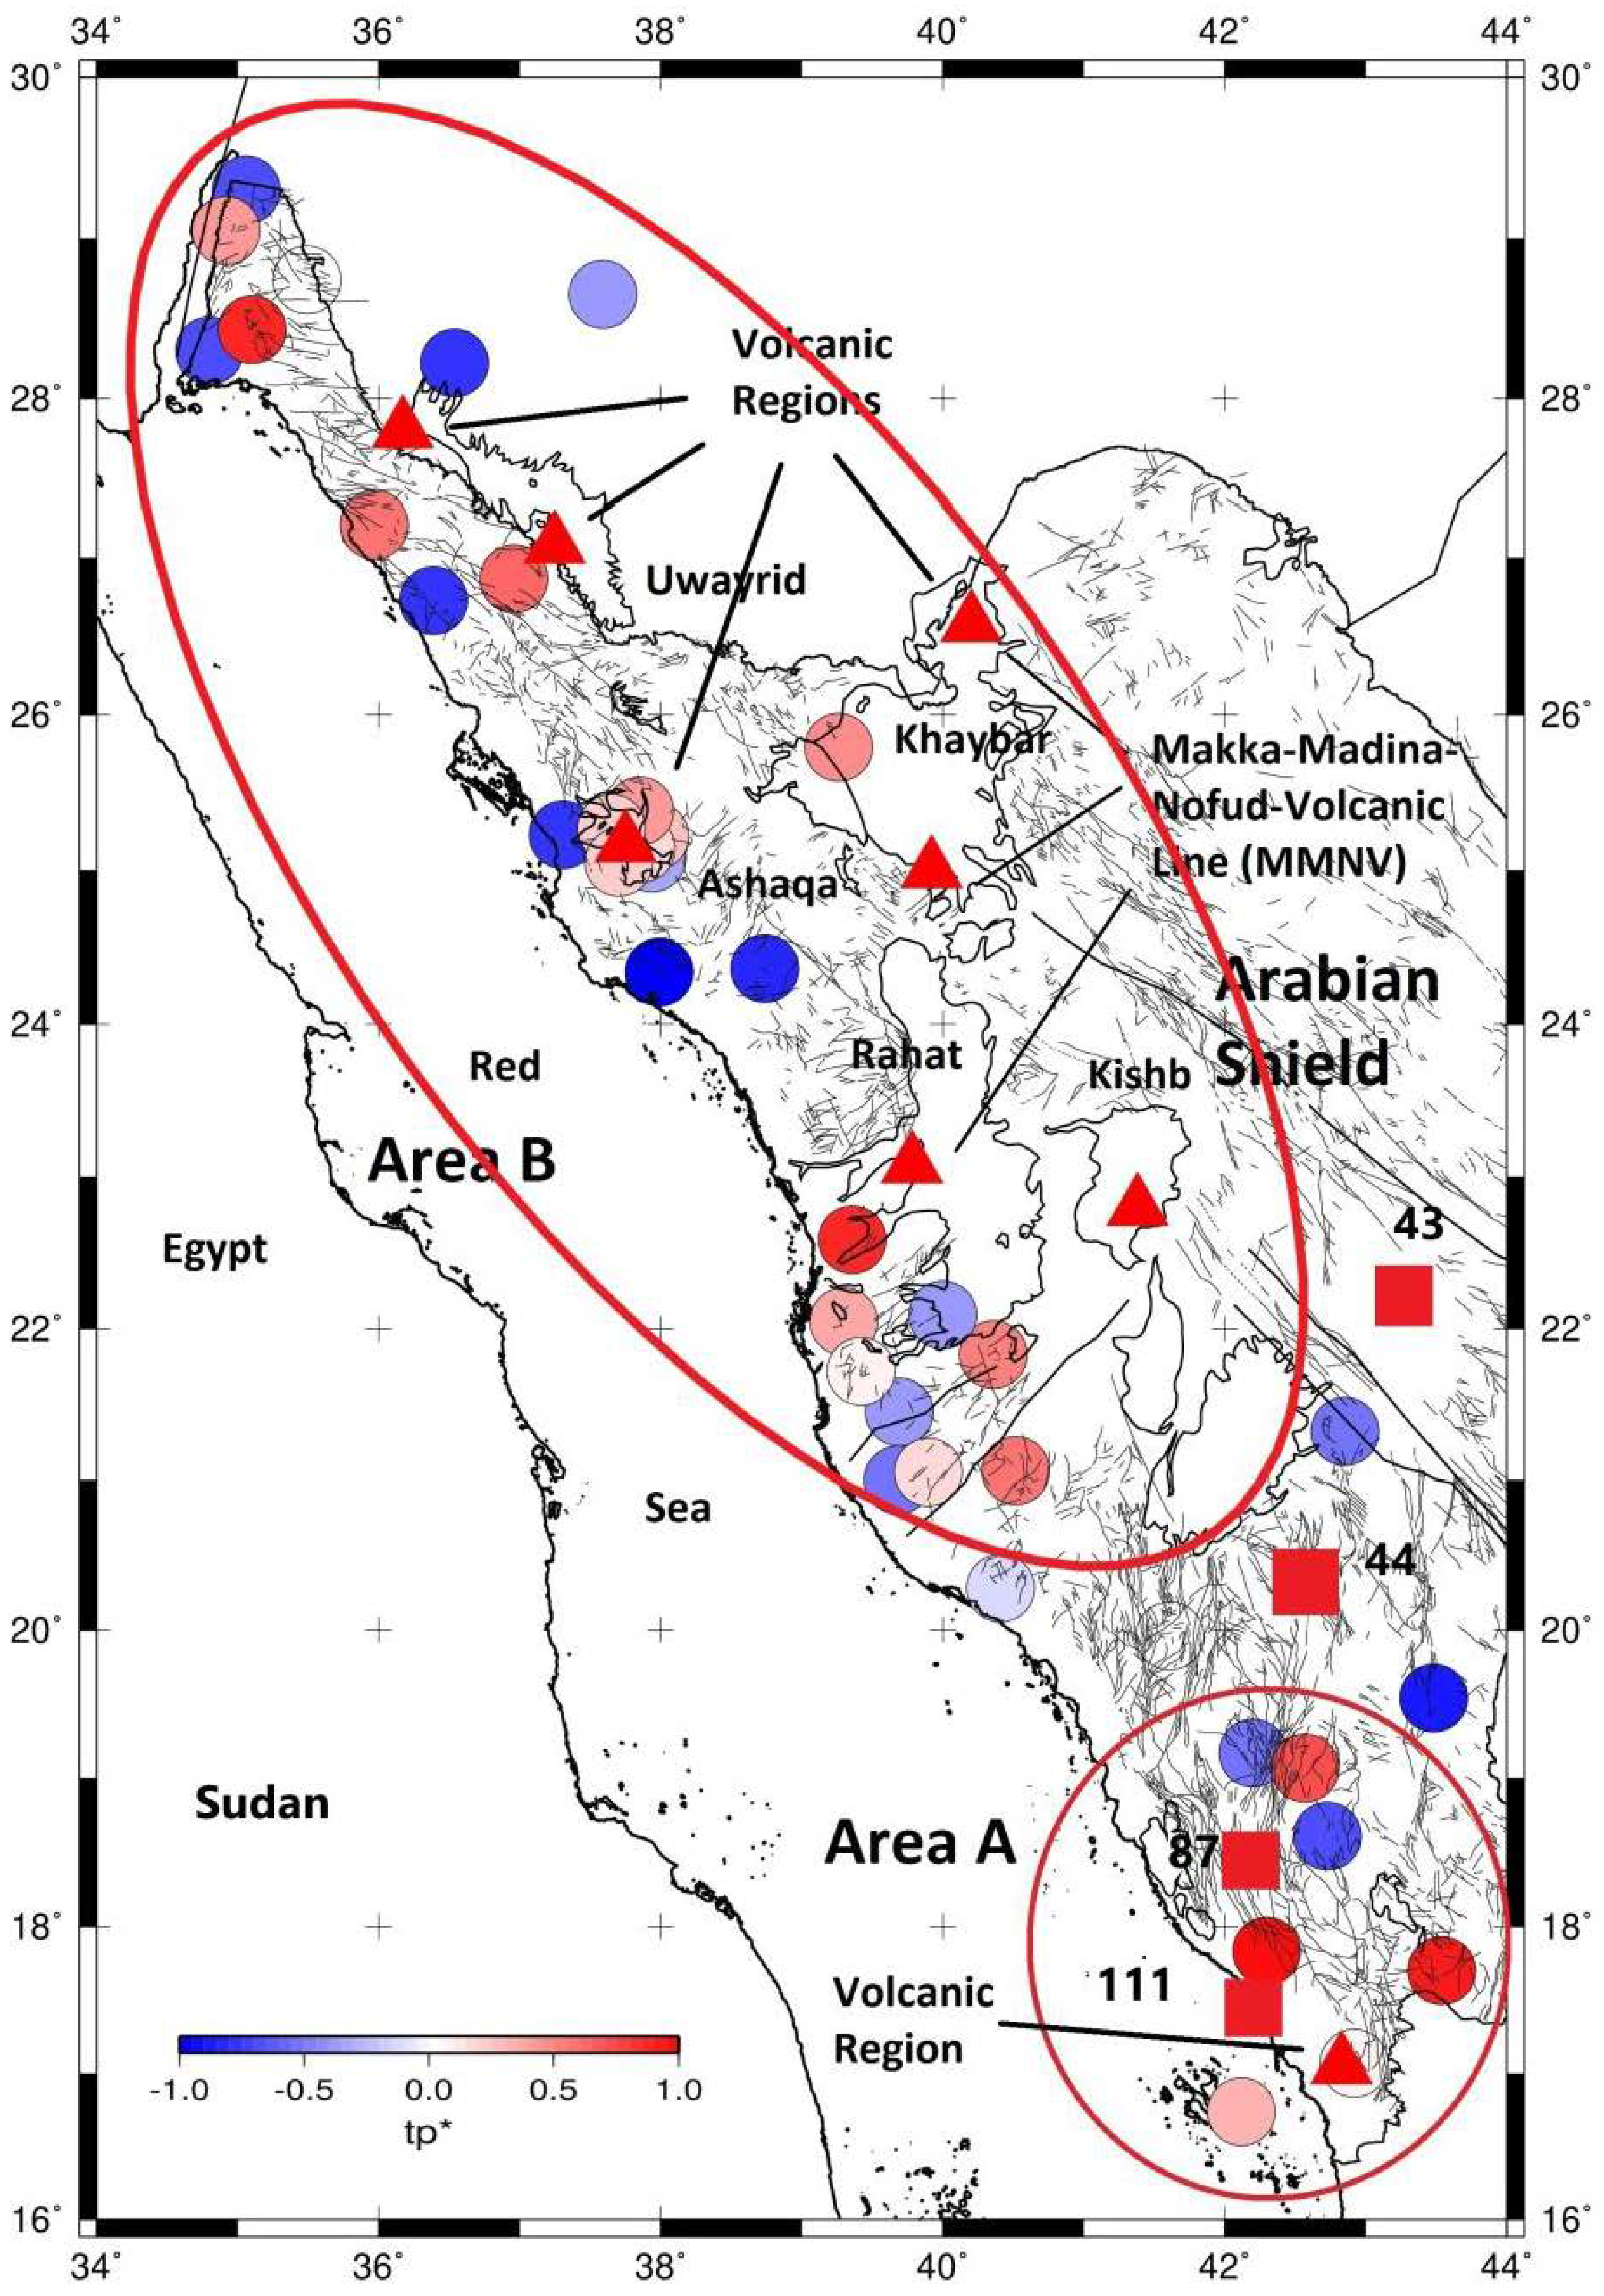
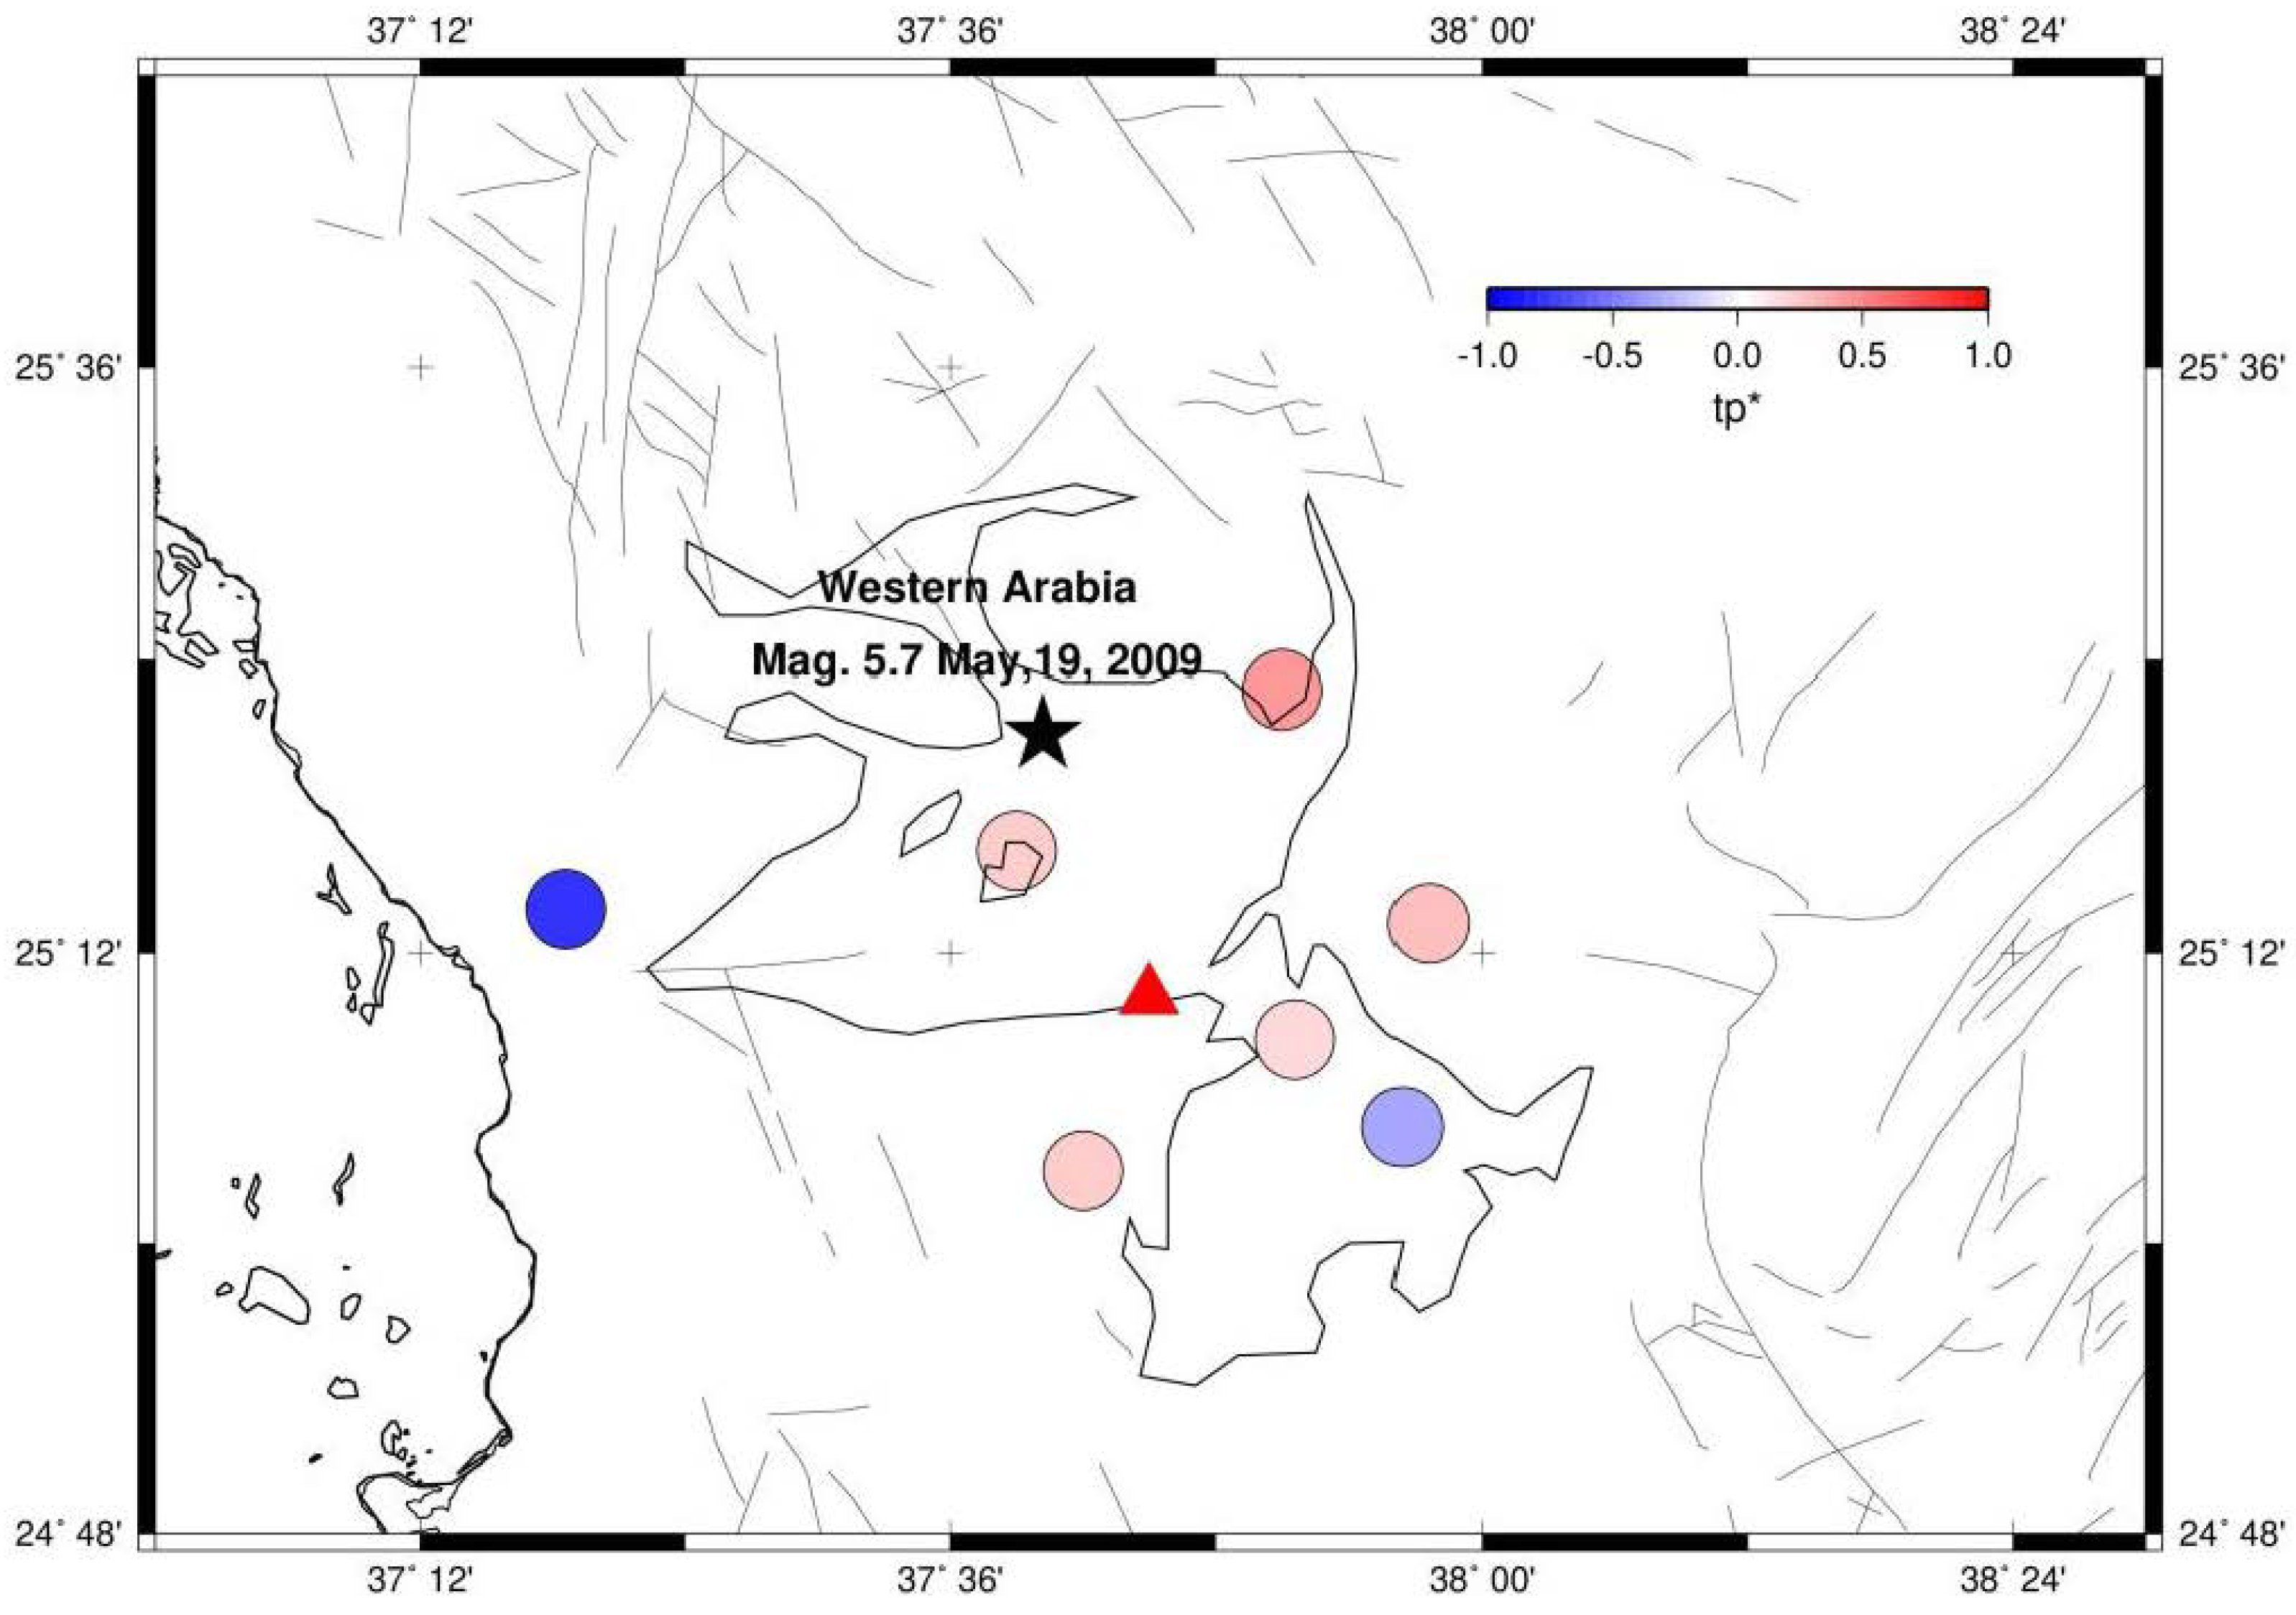
Figure 8 shows t P * values obtained for the 49 stations in the Arabian Plate. In general the results show high t P * for the Shield and low t P * for the Platform area. The results show significant spatial variation in t P * among the stations and, especially, show distinct t P * variations within the Arabian Shield, predominantly along the volcanic region. The obtained t P * pattern generally trends S–N beneath the Arabian Shield. Figure 9 shows the distributions of the t P * for the western part of the Arabian Plate (Arabian Shield) along the Red Sea coast. We obtained the highest t P * values in the southern parts of the Arabian Shield (area A). Here, the main observed feature from our results is the area of high t P * values that is most clearly revealed beneath the southern part of the Arabian Shield, and extends to central and northern parts of the Shield. Obviously, high t P * are sparsely distributed within the volcanic regions along the Arabian Shield upward to the Gulf of Aqaba (north of the Shield) (area B). Moreover, Figure 9 also shows the heat flow measurements taken along a line within the Arabian Shield [38]. The highest observed temperatures (330 K) were found in the southern part of the Arabian Shield. We also found a high t P * value at Harrat Lunayyir, which is locally known as the Ashaqah lava field. The last recorded earthquake of magnitude M W 5.7 in this region occurred on 19 May 2009. Figure 10 shows a closer view of the t P * distribution results of the Harrat Lunayyir (Ashaqah) lava field. These findings of high t P * patterns were also consistent with the broad low velocity region obtained from the previous seismic work in the region as stated in the previous section. This will be discussed more in the following section.

5. Discussion

Since most of the seismic stations are located in the west of the Arabian Plate (Arabian Shield), we are going to confine our discussion to this area. As we stated in the preceding section, Figure 8 shows the obtained results of t P * for the entire Arabian Plate, whereas Figure 9 shows a closer view of t P * values for the Arabian Shield. The results were consistent with the previous seismic studies in that they revealed low seismic velocities in the upper mantle beneath the Shield [23,24,25,26,27,28,29,30,31,32,33,34]).
Other global and regional tomographic studies [26,40,41] suggest that the low seismic velocities could extend from shallow upper mantle depths downward across the transition zone and into the lower mantle. Recently, Hwang et al. (2011) [21] obtained the attenuation of P and S body waves using globally distributed stations. Their results showed high t P * and t S * within the Arabian Plate, and in particular they showed high t P * in the Arabian Shield along the Red Sea margin. This is also consistent with their calculated t Q * from surface wave Q model and thermal interpretation of S20RTS t T * [40].
The observed high t P * in the Arabian Shield along the Red Sea margin is also correlated with the topography of this region, especially in the southern part of the Shield in Asir Province (elevation 3000 m) (Figure 9, area A). We attribute this correlation to the closer location of the seismic stations to the Afar Triple Junction where three rift systems converge [42]. Bohannon et al. (1989) [43] advocated the process how the rifting caused the uplift near the rift flank; the rifting started as lithospheric stretching, followed by the upwelling of rocks from the asthenosphere and lithospheric mantle, the production of partial melt, and the enhanced erosion of the lithospheric mantle beneath the continent. The resultant density decrease explains the uplift. The same process would explain the high t P * beneath the uplifted area, where the partially melted rocks must be attenuative.
There is also a reasonable correlation between the location of high t P * , low velocity anomaly under the Shield and the Cenozoic volcanic regions. The high t P * zones in the central and northern region of the Shield correlate spatially with a series of eruptive centers called the Makka–Madina–Nafud Volcanic (MMNV) line (Figure 9). The high t P * values located in area A represent the oldest volcanic rocks in the Shield (c. 20–30 Ma) [44,45,46], which were contemporaneous with flood basalt volcanism in Yemen, Afar, and the Ethiopian Plateau, as well as the initiation of rifting in the Red Sea (Figure 8 and Figure 9, area A). The younger volcanic rocks (c. 12 Ma to present) [47,48] are found in the central and northern parts of the Shield (Figure 8 and Figure 9, area B).
We also find a region of high t P * in the area where the last significant earthquake occurred in western Arabia (19 May 2009, M W 5.7), at the Ashaqah lava fields in the northwestern Arabian Shield (Figure 10). This earthquake frightened the local people and was reported by the media since that was nearly the largest and first earthquake felt in the region. Thus, the results obtained in the Arabian Plate are consistent with the previously reported results for central Japan [22], in which we have detected a high t P * within the volcanic and seismic regions.
Most of the previous work attributes the observed low velocity within the Arabian Shield to the presence of thermal perturbation in the upper mantle [3,6,7,33,34,35,39,49]. Thus, the high t P * and low velocity region could be assigned to a mantle thermal anomaly (330 K), which is associated with the Cenozoic uplift of the volcanic centers on the Shield. Heat flow measurements from the Shield (Figure 9) [38] are similar to the global average for Precambrian terrains [50,51,52] suggesting that the thermal anomaly in the lithospheric mantle indicated by the seismic and petrologic observation has not yet propagated to the surface [39]. The maximum estimated temperature of 330 K [39] would explain the high t P * and the low velocity anomaly, suggesting the presence of partial melts in the upper mantle beneath the Arabian Shield which is consistent with the presence of Holocene volcanic activity.
Further evidence for thermally perturbated upper mantle beneath the Arabian Shield shown by Chang et al. (2011) [34], who imaged the low-velocity upper mantle beneath the Arabian region using a tomographic method with the inversion of seismic travel times and a compilation of seismic data. They found low velocities beneath the southern Arabian Shield and Red Sea (Gulf of Aden), which is consistent with active spreading. Moreover, studies of shear wave splitting [49,53] showed an N–S fast polarization direction for shear-waves across the Shield. Both studies [34,49] have explained their results by flow in the mantle in the direction of the plate motion; consequently, Hansen et al. (2006) [49] attributed the pattern to a combination of plate and density driven flow in the asthenosphere. The density driven flow is believed to be caused by a warm material from the Afar hotspot flowing to the northwest channeled by a thinner lithosphere under the Red Sea and the western edge of the Shield. Note that estimates of the plate motion show that the Arabian Plate is moving in a northeasterly direction [54,55].

6. Conclusions

We estimated the t P * distribution within the Arabian Plate by using the spectral inversion method [20,22] from teleseismic body wave spectra recorded by SNSN operated by the SGS. A total of more than 4400 station pairs were used to obtain t P * . The obtained t P * values range from −1.0 s to 1.0 s. High t P * was observed within the Arabian Shield (western Arabia) and low t P * at the Arabian Platform stations (eastern Arabia). We found the maximum t P * at the southern part of the Red Sea and Arabian Shield. The observed high t P * closely correlates with the previously observed low velocity thermal anomaly and topography of the Arabian Plate. The present study reconfirmed that the Arabian Plate is tectonically active region, especially in the Arabian Shield.

Author Contributions

Conceptualization, K.M. and J.K.; methodology, J.K. and T.M.; software, T.M. and J.K.; validation, J.K. and T.M.; formal analysis, T.M.; data curation, T.M. and J.K.; writing—original draft preparation, T.M.; writing—review and editing, T.M. and J.K.; visualization, T.M., J.K., K.M. and H.Z.; supervision, J.K. and K.M. All authors have read and agreed to the published version of the manuscript.

Funding

This research received no external funding.

Data Availability Statement

Data are contained within the article.

Acknowledgments

We would like to thank the data supplier, the SNSN of the Saudí Geological Survey (SGS), and the seismic data centers staff for their kind assistance and help. Special thanks goes to Khaled Al Damegh from King Abdulaziz City for Science and Technology (KACST), Riyadh, SA. Thanks, are also due to the anonymous reviewers of this paper.

Conflicts of Interest

The authors declare no conflict of interest.

References

  1. Mokhtar, T.A.; Herrmann, R.; Russell, D. Seismic velocity and Q model for the shallow structure of the Arabian shield from short-period Rayleigh waves. Geophysics 1988, 53, 1379–1387. [Google Scholar] [CrossRef]
  2. Seber, D.; Mitchell, B. Attenuation of surface waves across the Arabian Peninsula. Tectonophysics 1992, 204, 137–150. [Google Scholar] [CrossRef]
  3. Sandvol, E.; Al-Damegh, K.; Calvert, A.; Seber, D.; Barazangi, M.; Mohamad, R.; Gök, R.; Türkelli, N.; Gürbüz, C. Tomographic imaging of Lg and Sn propagation in the Middle East. Pure Appl. Geophys. 2001, 158, 1121–1163. [Google Scholar] [CrossRef]
  4. Al-Damegh, K.; Sandvol, E.; Al-Lazki, A.; Barazangi, M. Regional seismic wave propagation (Lg and Sn) and Pn attenuation in the Arabian Plate and surrounding regions. Geophys. J. Int. 2004, 157, 775–795. [Google Scholar] [CrossRef]
  5. Pasyanos, M.E.; Matzel, E.M.; Walter, W.R.; Rodgers, A.J. Broad-band Lg attenuation modelling in the Middle East. Geophys. J. Int. 2009, 177, 1166–1176. [Google Scholar] [CrossRef]
  6. Cong, L.; Mitchell, B. Seismic velocity and Q structure of the Middle Eastern crust and upper mantle from surface-wave dispersion and attenuation. Pure Appl. Geophys. 1998, 153, 503–538. [Google Scholar] [CrossRef]
  7. Cong, L.; Mitchell, B. Lg coda Q and its relation to the geology and tectonics of the Middle East. Pure Appl. Geophys. 1998, 153, 563–585. [Google Scholar] [CrossRef]
  8. Sheehan, A.F.; Solomon, S.C. Differential shear wave attenuation and its lateral variation in the North Atlantic region. J. Geophys. Res. Solid Earth 1992, 97, 15339–15350. [Google Scholar] [CrossRef]
  9. Romanowicz, B. A global tomographic model of shear attenuation in the upper mantle. J. Geophys. Res. Solid Earth 1995, 100, 12375–12394. [Google Scholar] [CrossRef]
  10. Bhattacharyya, J.; Masters, G.; Shearer, P. Global lateral variations of shear wave attenuation in the upper mantle. J. Geophys. Res. Solid Earth 1996, 101, 22273–22289. [Google Scholar] [CrossRef]
  11. Baqer, S.; Mitchell, B. Regional variation of Lg coda Q in the continental United States and its relation to crustal structure and evolution. Pure Appl. Geophys. 1998, 153, 613–638. [Google Scholar] [CrossRef]
  12. Billien, M.; Lévêque, J.J.; Trampert, J. Global maps of Rayleigh wave attenuation for periods between 40 and 150 seconds. Geophys. Res. Lett. 2000, 27, 3619–3622. [Google Scholar] [CrossRef]
  13. Roth, E.G.; Wiens, D.A.; Dorman, L.M.; Hildebrand, J.; Webb, S.C. Seismic attenuation tomography of the Tonga-Fiji region using phase pair methods. J. Geophys. Res. Solid Earth 1999, 104, 4795–4809. [Google Scholar] [CrossRef]
  14. Reid, F.; Woodhouse, J.; Van Heijst, H. Upper mantle attenuation and velocity structure from measurements of differential S phases. Geophys. J. Int. 2001, 145, 615–630. [Google Scholar] [CrossRef]
  15. Selby, N.D.; Woodhouse, J.H. The Q structure of the upper mantle: Constraints from Rayleigh wave amplitudes. J. Geophys. Res. Solid Earth 2002, 107, ESE 5-1–ESE 5-11. [Google Scholar] [CrossRef]
  16. Warren, L.M.; Shearer, P.M. Mapping lateral variations in upper mantle attenuation by stacking P and PP spectra. J. Geophys. Res. Solid Earth 2002, 107, ESE 6-1–ESE 6-11. [Google Scholar] [CrossRef]
  17. Gung, Y.; Romanowicz, B. Q tomography of the upper mantle using three-component long-period waveforms. Geophys. J. Int. 2004, 157, 813–830. [Google Scholar] [CrossRef]
  18. Lawrence, J.F.; Shearer, P.M.; Masters, G. Mapping attenuation beneath North America using waveform cross-correlation and cluster analysis. Geophys. Res. Lett. 2006, 33, L07315. [Google Scholar] [CrossRef]
  19. Dalton, C.A.; Ekström, G.; Dziewoński, A.M. The global attenuation structure of the upper mantle. J. Geophys. Res. Solid Earth 2008, 113, B09303. [Google Scholar] [CrossRef]
  20. Hwang, Y.K.; Ritsema, J.; Goes, S. Spatial variations of P wave attenuation in the mantle beneath North America. J. Geophys. Res. Solid Earth 2009, 114, B06312. [Google Scholar] [CrossRef]
  21. Hwang, Y.K.; Ritsema, J.; Goes, S. Global variation of body-wave attenuation in the upper mantle from teleseismic P wave and S wave spectra. Geophys. Res. Lett. 2011, 38, L06308. [Google Scholar] [CrossRef]
  22. Merghelani, T.; Kawahara, J.; Miyashita, K. P wave attenuation structure beneath the Kanto district and surrounding area, Japan. Arab. J. Geosci. 2013, 6, 1991–1999. [Google Scholar] [CrossRef]
  23. Sandvol, E.; Seber, D.; Barazangi, M.; Vernon, F.; Mellors, R.; Al-Amri, A. Lithospheric seismic velocity discontinuities beneath the Arabian Shield. Geophys. Res. Lett. 1998, 25, 2873–2876. [Google Scholar] [CrossRef]
  24. Mellors, R.J.; Camp, V.E.; Vernon, F.L.; Al-Amri, A.M.; Ghalib, A. Regional waveform propagation in the Arabian Peninsula. J. Geophys. Res. Solid Earth 1999, 104, 20221–20235. [Google Scholar] [CrossRef]
  25. Rodgers, A.J.; Walter, W.R.; Mellors, R.J.; Al-Amri, A.M.; Zhang, Y.S. Lithospheric structure of the Arabian Shield and Platform from complete regional waveform modelling and surface wave group velocities. Geophys. J. Int. 1999, 138, 871–878. [Google Scholar] [CrossRef]
  26. Debayle, E.; Lévêque, J.J.; Cara, M. Seismic evidence for a deeply rooted low-velocity anomaly in the upper mantle beneath the northeastern Afro/Arabian continent. Earth Planet. Sci. Lett. 2001, 193, 423–436. [Google Scholar] [CrossRef]
  27. Villasenor, A.; Ritzwoller, M.; Levshin, A.; Barmin, M.; Engdahl, E.; Spakman, W.; Trampert, J. Shear velocity structure of central Eurasia from inversion of surface wave velocities. Phys. Earth Planet. Inter. 2001, 123, 169–184. [Google Scholar] [CrossRef]
  28. Kumar, M.R.; Ramesh, D.; Saul, J.; Sarkar, D.; Kind, R. Crustal structure and upper mantle stratigraphy of the Arabian shield. Geophys. Res. Lett. 2002, 29, 130-1–130-4. [Google Scholar] [CrossRef]
  29. Benoit, M.H.; Nyblade, A.A.; VanDecar, J.C.; Gurrola, H. Upper mantle P wave velocity structure and transition zone thickness beneath the Arabian Shield. Geophys. Res. Lett. 2003, 30, 1531. [Google Scholar] [CrossRef]
  30. Julià, J.; Ammon, C.J.; Herrmann, R.B. Lithospheric structure of the Arabian Shield from the joint inversion of receiver functions and surface-wave group velocities. Tectonophysics 2003, 371, 1–21. [Google Scholar] [CrossRef]
  31. Al-Lazki, A.I.; Sandvol, E.; Seber, D.; Barazangi, M.; Turkelli, N.; Mohamad, R. Pn tomographic imaging of mantle lid velocity and anisotropy at the junction of the Arabian, Eurasian and African plates. Geophys. J. Int. 2004, 158, 1024–1040. [Google Scholar] [CrossRef]
  32. Al-Damegh, K.; Sandvol, E.; Barazangi, M. Crustal structure of the Arabian plate: New constraints from the analysis of teleseismic receiver functions. Earth Planet. Sci. Lett. 2005, 231, 177–196. [Google Scholar] [CrossRef]
  33. Tkalčić, H.; Pasyanos, M.E.; Rodgers, A.J.; Gök, R.; Walter, W.; Al-Amri, A. A multistep approach for joint modeling of surface wave dispersion and teleseismic receiver functions: Implications for lithospheric structure of the Arabian Peninsula. J. Geophys. Res. Solid Earth 2006, 111, B11311. [Google Scholar] [CrossRef]
  34. Chang, S.J.; Merino, M.; Van der Lee, S.; Stein, S.; Stein, C.A. Mantle flow beneath Arabia offset from the opening Red Sea. Geophys. Res. Lett. 2011, 38, L04301. [Google Scholar] [CrossRef]
  35. Chang, S.J.; Van der Lee, S. Mantle plumes and associated flow beneath Arabia and East Africa. Earth Planet. Sci. Lett. 2011, 302, 448–454. [Google Scholar] [CrossRef]
  36. Endo, E.; Zahran, H.; Nofal, H.; Hadidy, S. The Saudi national seismic network. Seismol. Res. Lett. 2007, 78, 439–445. [Google Scholar] [CrossRef]
  37. Stein, S.; Wysession, M. An Introduction to Seismology, Earthquakes, and Earth Structure; Wiley-Blackwell: Malden, MA, USA, 2003; ISBN 978-0-86542-078-6. [Google Scholar]
  38. Gettings, M.E. Heat-Flow Measurements at Shot Points along the 1978 Saudi Arabian Seismic Deep-Refraction Line: Part 2, Discussion and Interpretation; US Geological Survey: Lawrence, KA, USA, 1982. [Google Scholar]
  39. Park, Y.; Nyblade, A.A.; Rodgers, A.J.; Al-Amri, A. Upper mantle structure beneath the Arabian Peninsula and northern Red Sea from teleseismic body wave tomography: Implications for the origin of Cenozoic uplift and volcanism in the Arabian Shield. Geochem. Geophys. Geosyst. 2007, 8, Q06021. [Google Scholar] [CrossRef]
  40. Ritsema, J.; Heijst, H.J.v.; Woodhouse, J.H. Complex shear wave velocity structure imaged beneath Africa and Iceland. Science 1999, 286, 1925–1928. [Google Scholar] [CrossRef]
  41. Zhao, D. Seismological structure of subduction zones and its implications for arc magmatism and dynamics. Phys. Earth Planet. Inter. 2001, 127, 197–214. [Google Scholar] [CrossRef]
  42. Bosworth, W.; Huchon, P.; McClay, K. The red sea and gulf of aden basins. J. Afr. Earth Sci. 2005, 43, 334–378. [Google Scholar] [CrossRef]
  43. Bohannon, R.G.; Naeser, C.W.; Schmidt, D.L.; Zimmermann, R.A. The timing of uplift, volcanism, and rifting peripheral to the Red Sea: A case for passive rifting? J. Geophys. Res. Solid Earth 1989, 94, 1683–1701. [Google Scholar] [CrossRef]
  44. Camp, V.E.; Roobol, M.J. Comment on “Topographic and volcanic asymmetry around the Red Sea: Constraints on rift models” by TH Dixon, ER Ivins, and JF Brenda. Tectonics 1991, 10, 649–652. [Google Scholar] [CrossRef]
  45. Coleman, R.G.; McGuire, A.V. Magma systems related to the Red Sea opening. Tectonophysics 1988, 150, 77–100. [Google Scholar] [CrossRef]
  46. Mohr, P.; Zanettin, B. The Ethiopian flood basalt province. In Continental Flood Basalts; Springer: Dordrecht, The Netherlands, 1988; pp. 63–110. [Google Scholar]
  47. Camp, V.E.; Roobol, M.J. Upwelling asthenosphere beneath western Arabia and its regional implications. J. Geophys. Res. Solid Earth 1992, 97, 15255–15271. [Google Scholar] [CrossRef]
  48. McGuire, A.V.; Bohannon, R.G. Timing of mantle upwelling: Evidence for a passive origin for the Red Sea rift. J. Geophys. Res. Solid Earth 1989, 94, 1677–1682. [Google Scholar] [CrossRef]
  49. Hansen, S.; Schwartz, S.; Al-Amri, A.; Rodgers, A. Combined plate motion and density-driven flow in the asthenosphere beneath Saudi Arabia: Evidence from shear-wave splitting and seismic anisotropy. Geology 2006, 34, 869–872. [Google Scholar] [CrossRef]
  50. Artemieva, I.M.; Mooney, W.D. Thermal thickness and evolution of Precambrian lithosphere: A global study. J. Geophys. Res. Solid Earth 2001, 106, 16387–16414. [Google Scholar] [CrossRef]
  51. Nyblade, A.A.; Pollack, H.N. A comparative study of parameterized and full thermal-convection models in the interpretation of heat flow from cratons and mobile belts. Geophys. J. Int. 1993, 113, 747–751. [Google Scholar] [CrossRef]
  52. Nyblade, A.A.; Pollack, H.N. A global analysis of heat flow from Precambrian terrains: Implications for the thermal structure of Archean and Proterozoic lithosphere. J. Geophys. Res. Solid Earth 1993, 98, 12207–12218. [Google Scholar] [CrossRef]
  53. Sebai, A.; Stutzmann, E.; Montagner, J.P.; Sicilia, D.; Beucler, E. Anisotropic structure of the African upper mantle from Rayleigh and Love wave tomography. Phys. Earth Planet. Inter. 2006, 155, 48–62. [Google Scholar] [CrossRef]
  54. McClusky, S.; Reilinger, R.; Mahmoud, S.; Ben Sari, D.; Tealeb, A. GPS constraints on Africa (Nubia) and Arabia plate motions. Geophys. J. Int. 2003, 155, 126–138. [Google Scholar] [CrossRef]
  55. Reilinger, R.; McClusky, S.; Oral, M.; King, R.; Toksoz, M.; Barka, A.; Kinik, I.; Lenk, O.; Sanli, I. Global Positioning System measurements of present-day crustal movements in the Arabia-Africa-Eurasia plate collision zone. J. Geophys. Res. Solid Earth 1997, 102, 9983–9999. [Google Scholar] [CrossRef]
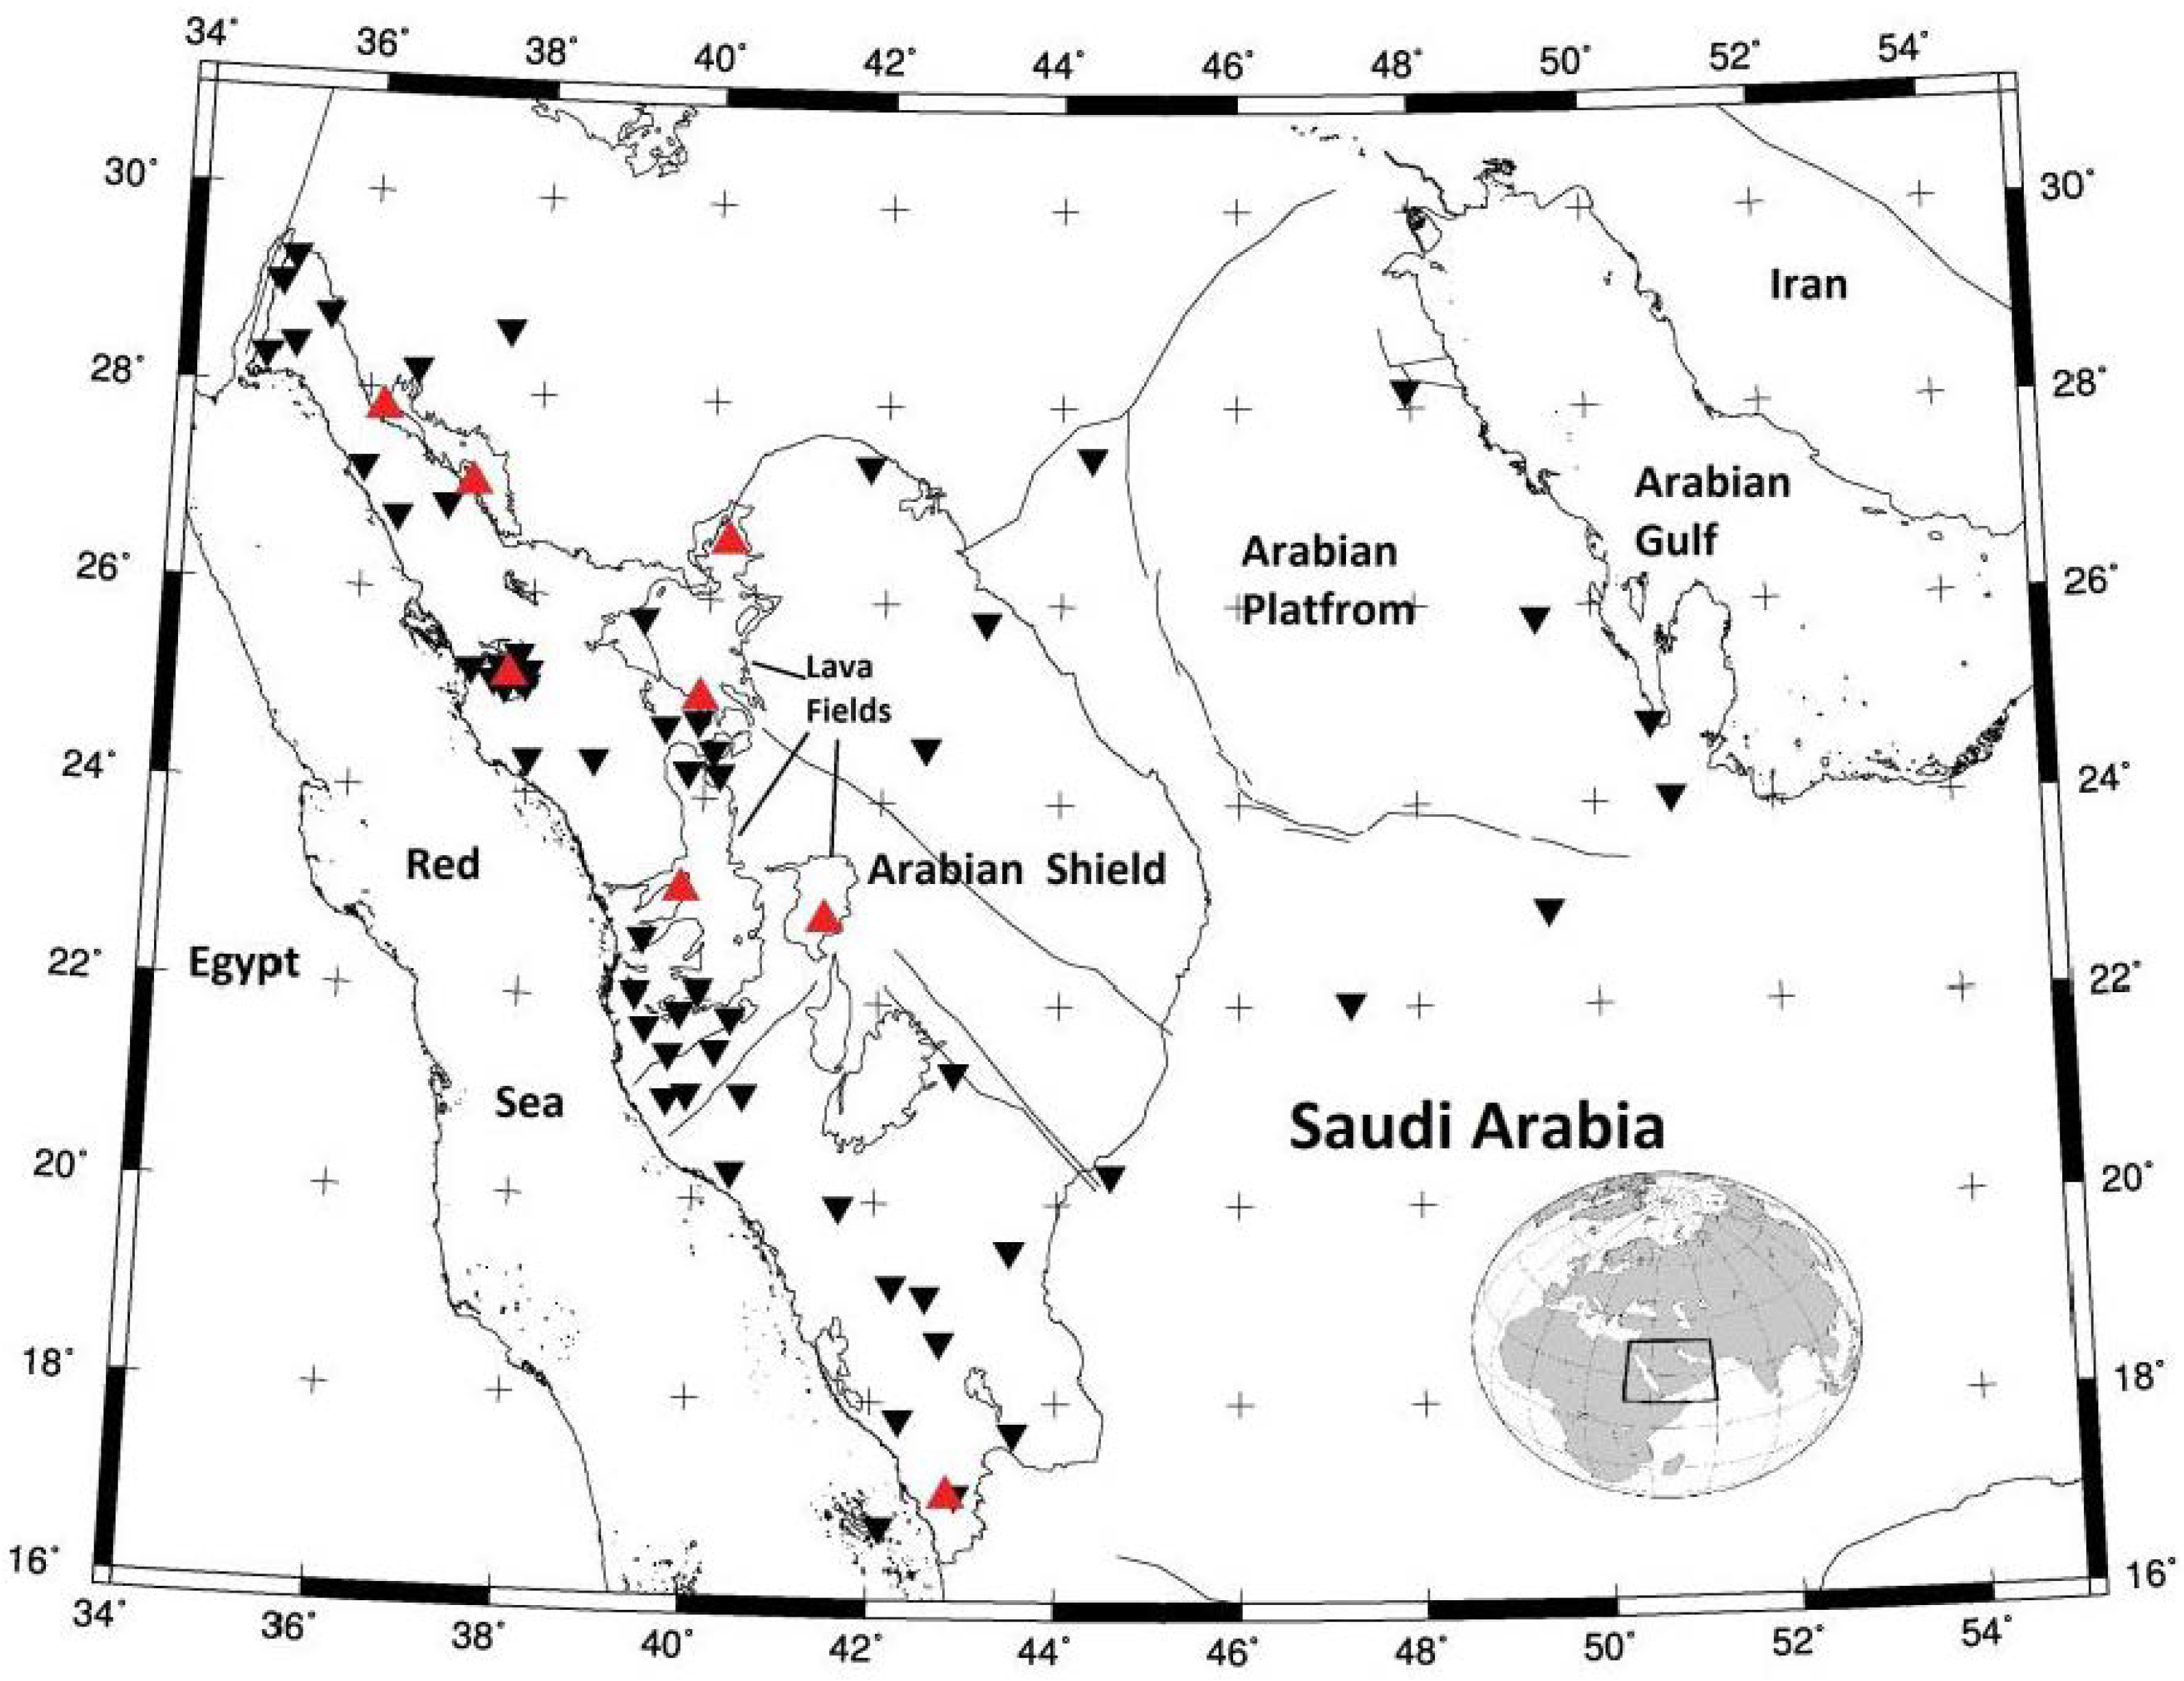
Figure 1. The station locations of the SNSN. The inverse black triangles represent the station locations, and the red triangles represent the locations of volcanoes. The thin black lines within the Arabian Plate outline the border of the Arabian Shield and the locations of the lava field areas.
Geosciences 13 00343 g001
Figure 2. The installation of SNSN station number 9, located in the Arabian Shield area. Each station consists of Nanometrics Trillium 40 seismometers, 24-bit Trident digitizers, GPS receivers, and Cygnus VSAT transceivers and powered by a 320-watt solar array.
Geosciences 13 00343 g002
Figure 3. The locations of the selected earthquakes and the stations. The stars represent the epicenters of the selected earthquakes recorded by the SNSN stations used in this study. The black reversed triangles represent the station locations.
Geosciences 13 00343 g003
Figure 4. The stars and the lines represent the epicenters and the ray paths of the selected earthquakes recorded by the SNSN stations used in this study, respectively.
Geosciences 13 00343 g004
Figure 5. Example of the selected teleseismic seismograms for two different SNSN stations. The data sets represent high quality recorded events seismograms from 49 stations.
Geosciences 13 00343 g005
Figure 6. The onset phase motion with picked arrivals of the P-waves recorded at the SNSN stations for the same event. (Top): The P-waves recorded at the eastern Arabian stations. (Bottom): The P-waves recorded at northwestern and western Arabian stations.
Geosciences 13 00343 g006
Figure 7. (a) Distributions of the term | Δ t p * | . (b) 2 σ error distribution of the regression line measurements with reference value ϵ R . (c) Interstation distribution with reference value.
Geosciences 13 00343 g007
Figure 8. The t P * variation in the Arabian Plate. The red triangles represent the volcanoes. The black lines within the Arabian Plate represent the border of the shield area. The highlighted white regions within the shield illustrate the lava fields. The major and some minor faults were also shown. The circle represents the t P * pattern obtained for each station. The results were overlapped with geological outline (lava field, Arabian Shield border and faults). The t P * scale (−1.0 s < t P * < 1.0 s) represents the minimum and maximum attenuation. The red color represents high t P * and the blue color represents low t P * .
Geosciences 13 00343 g008
Figure 9. A P-wave attenuation distribution, t P * , represented as station specific attenuation factors for the Arabian shield along the Red Sea. The circles represent the t P * pattern obtained for each station (green inverse triangles). The results were overlapped with geological outline (lava field, Arabian Shield border and faults). The t P * scale (−1.0 s < t P * < 1.0 s) represents the minimum and maximum attenuation. The red color represents high t P * and the blue color represents low t P * . The highest t P * is observed in the southern part of the Arabian Shield and south of the Red Sea (Gulf of Aden, area A). High t P * is also observed at the center of the Shield and extends to the north of the Arabian Shield (to the Gulf of Aqaba) along the Red Sea margin, which nearly follows the volcanic line regions, especially the MMNV line (area B). Red squares represent heat flow measurements along the Shield ([38,39]). The locations of lava fields and their names were also shown in the map. The black star represents the epicenter of the 2009 Earthquake with M W 5.7, at the Ashaqah Lava field (the Lunayyir lava field), see Figure 10.
Geosciences 13 00343 g009
Figure 10. The t P * variations around Harrat Lunayyir (Ashaqah). The epicenter of a recent major earthquake ( M W 5.7) is noted by the black star. The circles represent the t P * pattern obtained for each station around the Harrat. The triangle represent the Volcanic location. The thick black line represent the Harrat lava field border. The t P * scale (−1.0 s < t P * < 1.0 s) represents the minimum and maximum attenuation. The red color represents high t P * and the blue color represents low t P * .
Geosciences 13 00343 g010
Disclaimer/Publisher’s Note: The statements, opinions and data contained in all publications are solely those of the individual author(s) and contributor(s) and not of MDPI and/or the editor(s). MDPI and/or the editor(s) disclaim responsibility for any injury to people or property resulting from any ideas, methods, instructions or products referred to in the content.