Article

What Have We Learned from the Past? An Analysis of Ground Deformations in Urban Areas of Palermo (Sicily, Italy) by Means of Multi-Temporal Synthetic Aperture Radar Interferometry Techniques

by
Nicola Angelo Famiglietti
1,*,
Pietro Miele
1,
Luigi Petti
2,
Domenico Guida
2,
Francesco Maria Guadagno
3,
Raffaele Moschillo
1 and
Annamaria Vicari
1
1
Istituto Nazionale di Geofisica e Vulcanologia (INGV), Sezione Irpinia, 83035 Grottaminarda, Italy
2
Consorzio Inter-Universitario per la Previsione e Prevenzione del Grandi Rischi (C.U.G.RI.), 84084 Fisciano, Italy
3
Dipartimento di Scienze e Tecnologie, Università degli Studi del Sannio, 82100 Benevento, Italy
*
Author to whom correspondence should be addressed.
Geosciences 2023, 13(10), 298; https://doi.org/10.3390/geosciences13100298
Submission received: 7 September 2023 / Revised: 26 September 2023 / Accepted: 30 September 2023 / Published: 2 October 2023
(This article belongs to the Special Issue Active Tectonics and Earthquakes)

Abstract

:
This study focuses on analyzing and monitoring urban subsidence, particularly in the city of Palermo, Italy. Land subsidence, induced by natural and human factors, poses threats to infrastructure and urban safety. Remote sensing (RS), specifically synthetic-aperture radar interferometry (In-SAR), is employed due to its ability to detect ground displacements over large areas with great precision. The persistent scatterer InSAR (PS-InSAR) technique is utilized to identify stable targets and track millimeter-level surface deformations. This research spans from October 2014 to October 2021, using Sentinel-1 satellite data to capture ground deformation from various angles. The findings are integrated into an accessible web app (ArcGIS) for local authorities that could be used aiding in urban planning and enhancing safety measures. This study’s results offer updated deformation maps, serving as an operational tool to support decision-making and community resilience, emphasizing risk awareness and responsible practices. This study highlights that the exponential expansion of urban areas, which does not take into account historical information, can gravely jeopardize both the integrity of urban infrastructure and the well-being of its inhabitants. In this context, remote sensing technologies emerge as an invaluable ally, used in monitoring and safeguarding the urban landscape.

1. Introduction

The analysis and monitoring of ground deformations, such as subsidence phenomena in large cities, allows us to obtain significant information to mitigate the potential loss and/or damage of property and life caused by increasing development rates in many regions around the globe [1,2,3,4,5,6]. Different causes could produce urban subsidence, including human and natural reasons, such as long-time trends of natural compaction processes of fine-grained sediments [7,8], geological setting, building load [9], groundwater consumption [10,11,12], tectonic activity [13], dewatering [14], seasonal effects, and mining activities [15,16,17]. Slow and persistent geological processes, such as land subsidence, are a serious risk for the stability of infrastructure and human safety. Due to urban expansion, Palermo (Sicily, Italy) has shown important evidence of land subsidence with increasing effects, especially in the lowland area [18], where pre-existing fluvial and coastal incised landforms were used since historical times as landfill, burying them with detrital urban waste. In recent years, the increase in these phenomena in the urban area highlights problems and provides an alert regarding the safety of urban infrastructure, both pre-existing and in construction. Therefore, the effective and accurate long-term monitoring of land subsidence over the Palermo plain represents a necessary study in planning decisions in order to effectively face this problem.
Remote Sensing (RS) technology, such as synthetic-aperture radar interferometry (In-SAR) [19], has demonstrated its significant potential in various fields over the last two decades. In particular, images acquired by synthetic-aperture radar (SAR) sensors have been increasingly applied by the scientific community to study the measurable effects of natural or anthropogenic phenomena (or dangers) in different sectors of geosciences, as well as in civil and environmental engineering [20,21,22,23,24]. Differential interferometry techniques, using the phase difference between two radar images acquired on two different dates in combination with a digital elevation model (DEM), provide ground displacement measurement over wide areas with centimeter to millimeter accuracy [25] without the need for deploying extensive and costly in situ instrumentation networks. Due to the wavelengths employed in the SAR systems (usually, the C and X bands), the methodology is particularly suitable for the detection of ground deformation phenomena occurring at very low rates (few mm/year) [26]
Many studies on urban areas have used Multi-Temporal Interferometry SAR (MTInSAR) techniques to monitor the spatio–temporal evolution of deformation, such as groundwater extraction, underground construction, and building expansion [27,28,29]. Among the main different approaches for SAR imagery processing, such as SBAS (Small BAseline Subset) [30,31], SqueeSAR [32], and PSI (Permanent Scatterers Interferometry) [33,34], for this analysis, the last one has been chosen. PS-InSAR is a SAR-based approach that identifies and exploits stable targets as Permanents Scatterers (PS) in a temporal sequence of interferograms. Among the factors that could limit the effectiveness of this monitoring technique, there are spatial decorrelation and temporal decorrelation, but, in an urban environment, such as the study area of the present work, there is an abundance of (PS) that overcomes decorrelation issues [35]. In addition, these techniques, aimed at studying the ongoing deformations in cities through satellite products, have never been applied to the monitoring of the historic center of Palermo. PS-InSAR can get a very extended sequence of surface deformation data from hundreds of scenes, and PS point density is significantly higher than the data-point density produced by other standard leveling measuring techniques, such as GNSS surveys [36].
This research was carried out to monitor ground subsidence in the Conca d’Oro plain and in particular over the historical center of Palermo city, Western Sicily, from October 2014 to October 2021, collecting both ascending and descending Sentinel-1 images. Because the satellite can see the same target area from different Lines of Sight (LoS), both satellite tracks have been used to detect the ground deformation from different directions and calculate the E-W and vertical components. Furthermore, this work aims at providing local authorities with a cognitive tool based on a user-friendly web app such as ArcGIS online, depicting spatio–temporal evolution of ground deformation phenomena over the Palermo municipality area.
The results, consisting of updated land deformation maps, can be considered as an operational tool that might support urban planning activities, improving citizens’ safety. Lastly, the development of such a tool, based also on smart and low-cost monitoring techniques, might have a direct impact on the local population’s resilience, increasing risk awareness and collective best behavior and practices.

2. Materials and Methods

2.1. Geological and Geomorphological Settings

The study area (Figure 1A) is included in the Palermo plain (Conca d’Oro), on the northern coast of Western Sicily, which is laid on a structure of “semi-graben” [37] and that develops towards the sea according to a wedge of very low inclination formed by shallow water marine deposits, mostly Quaternary carbonates with thickness up to 100 m. These deposits (Figure 1B) lie on the older Meso–Cenozoic units with strong angular unconformities [38,39].
The Palermo plain is characterized by the presence of Middle-Upper Pleistocene marine terraces ranging from 0 to 150 m a.s.l., where large and well-preserved polycyclic wave-cut surfaces are present. The plain is surrounded by degraded scarps that correspond to abandoned coastal cliffs derived from original fault scarps and set on the Meso–Cenozoic carbonates. Talus slopes bound the base of the scarps. In the study area, different synthems from Lower-Middle Pleistocene to Holocene, laying on deformed Cenozoic formations (Numidian Flysch) and covered by anthropogenic materials (Figure 2A) outcrop in the Conca d’Oro plain [38,39,40,41,42]. From the base, the Palermo Calcarenite Sub-synthem (MRS4) of the Marsala synthem (MRS), Emilian-Sicilian aged and up to 80 m thick of calcarenites, calcirudite, and loose sand layers, constitutes the “identitary” bedrock and building stones of Palermo city. Upward, laying in unconformity on the previous layers, are the Middle Pleistocene coastal conglomerates of the Torre Tonda Sub-synthem (BCP4) of the Buonfornello–Campofelice synthem BCP) outcrop. Along the external sector of the terraced Palermo plain are discontinuous, cemented, and coastal deposits of the Barcarello synthem (SIT) of Tyrrenian age, covered by the talus screes (Raffo Rosso synthem, RFR), and coastal, aeolian, river, colluvial, and landslide deposits (Capo Plaia synthem AFL). Despite the name “Palermo plain”, from a geomorphological point of view, the sub-urban, underground landscape is very different from the ground. A very articulated river and valley network is present, progressively filled in historical and recent times by urban waste materials [43].
Figure 2A depicts the original reconstruction of this paleo-channel network and paleo-coastal bay, using as basemap the sheet 595 “Palermo” of the geological map of Italy in scale 1:50,000, released by the Italian Institute for Environmental Protection and Research (ISPRA). In order to reconstruct a simplified but significant geological cross-section of the buried channels, in Figure 2B is reported a modified geotechnical cross-section from Liguori et al. (2002) [44] along the track A-A′ in Figure 2A, as derived from many boreholes and samplings.

2.2. Urban Development

The study area includes the historic center of Palermo and various residential areas that have grown around it over time. The ancient historic center is situated on a rocky spur flat at the top, overlooking the sea, and is isolated by two streams that are today buried, Papireto and Kemonia. A large and easily defended port was built by the Phoenicians on this favorable spot, and the old town of Pan-ormos (Greek Παν-όρμος, all-port) was founded in the seventh century BC [45].
The city began to expand beyond the Papireto and Kemonia streams from the 9th to the 11th centuries, and many neighborhoods were built outside the old town, as shown in the geo-referenced historical maps of Figure 3.
Between 1943 and 1971, the urbanized area of Palermo expanded from 600 to 5000 hectares [46]. In this period, many buildings in the Art Nouveau style and green areas were demolished to give way to new, popular buildings. Today, almost the entire Conca d’Oro plain is urbanized [47].
Consequently, surface morphology is almost totally erased by anthropization. The main watercourse is the River Oreto, which is about 20 km long, which develops in a southwest direction according to a trend characterized by some meanders set in the Pleistocene calcarenite, up to the area of the mouth in Sant’Erasmo.
The final section was completely modified after the first hydraulic works of the XX century. Moreover, at the end of the XIV century, the valley of the Papireto River, deprived of surface runoff water, channeled into underground hydraulic works, was partially filled, as well as the valley of the Kemonia River; subsequently, these rivers were completely buried and on the new surfaces obtained were built new housing districts.
Figure 3. Palermo in the Arab period: (A) graphic by Maria Antonietta Parlapiano and Margherita Accascina from Ardizzone et al., 2016 [48] and (B) from G.M. Columba, 1910 [49]. The two images were georeferenced in GIS environment and plotted on a satellite base map with a transparency of 30%.
Geosciences 13 00298 g003

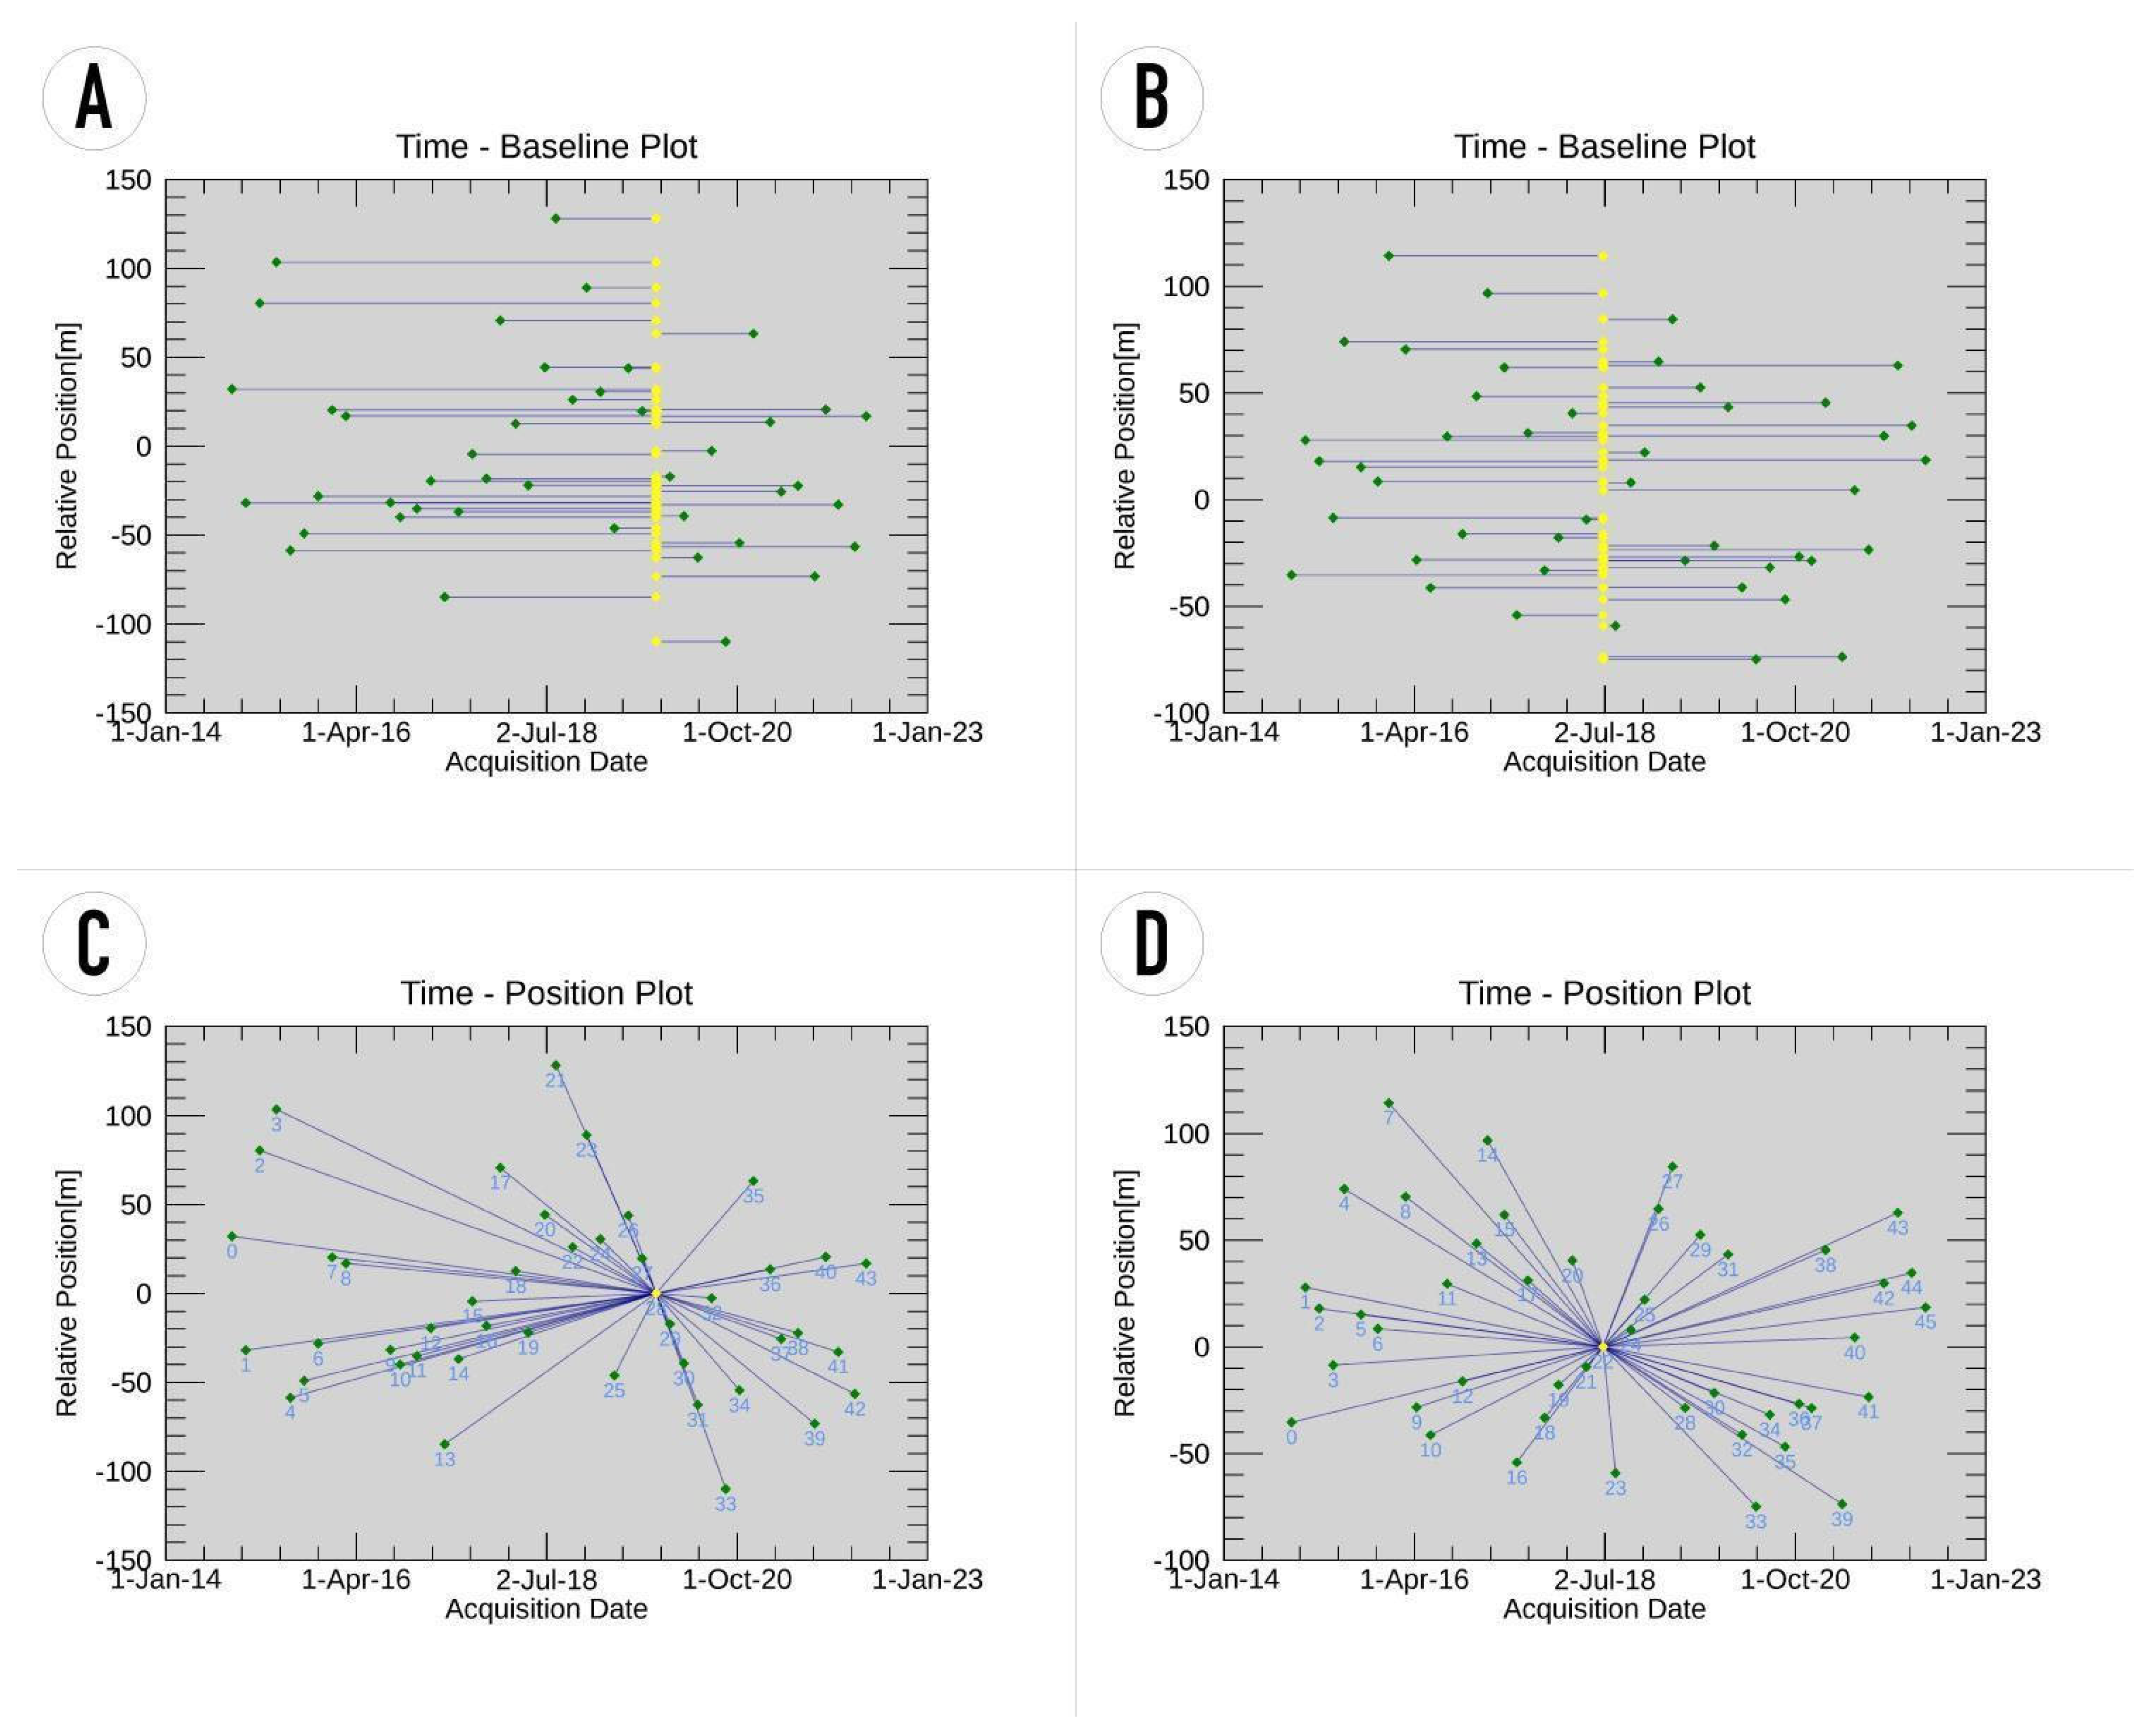
2.3. SAR Data Processing
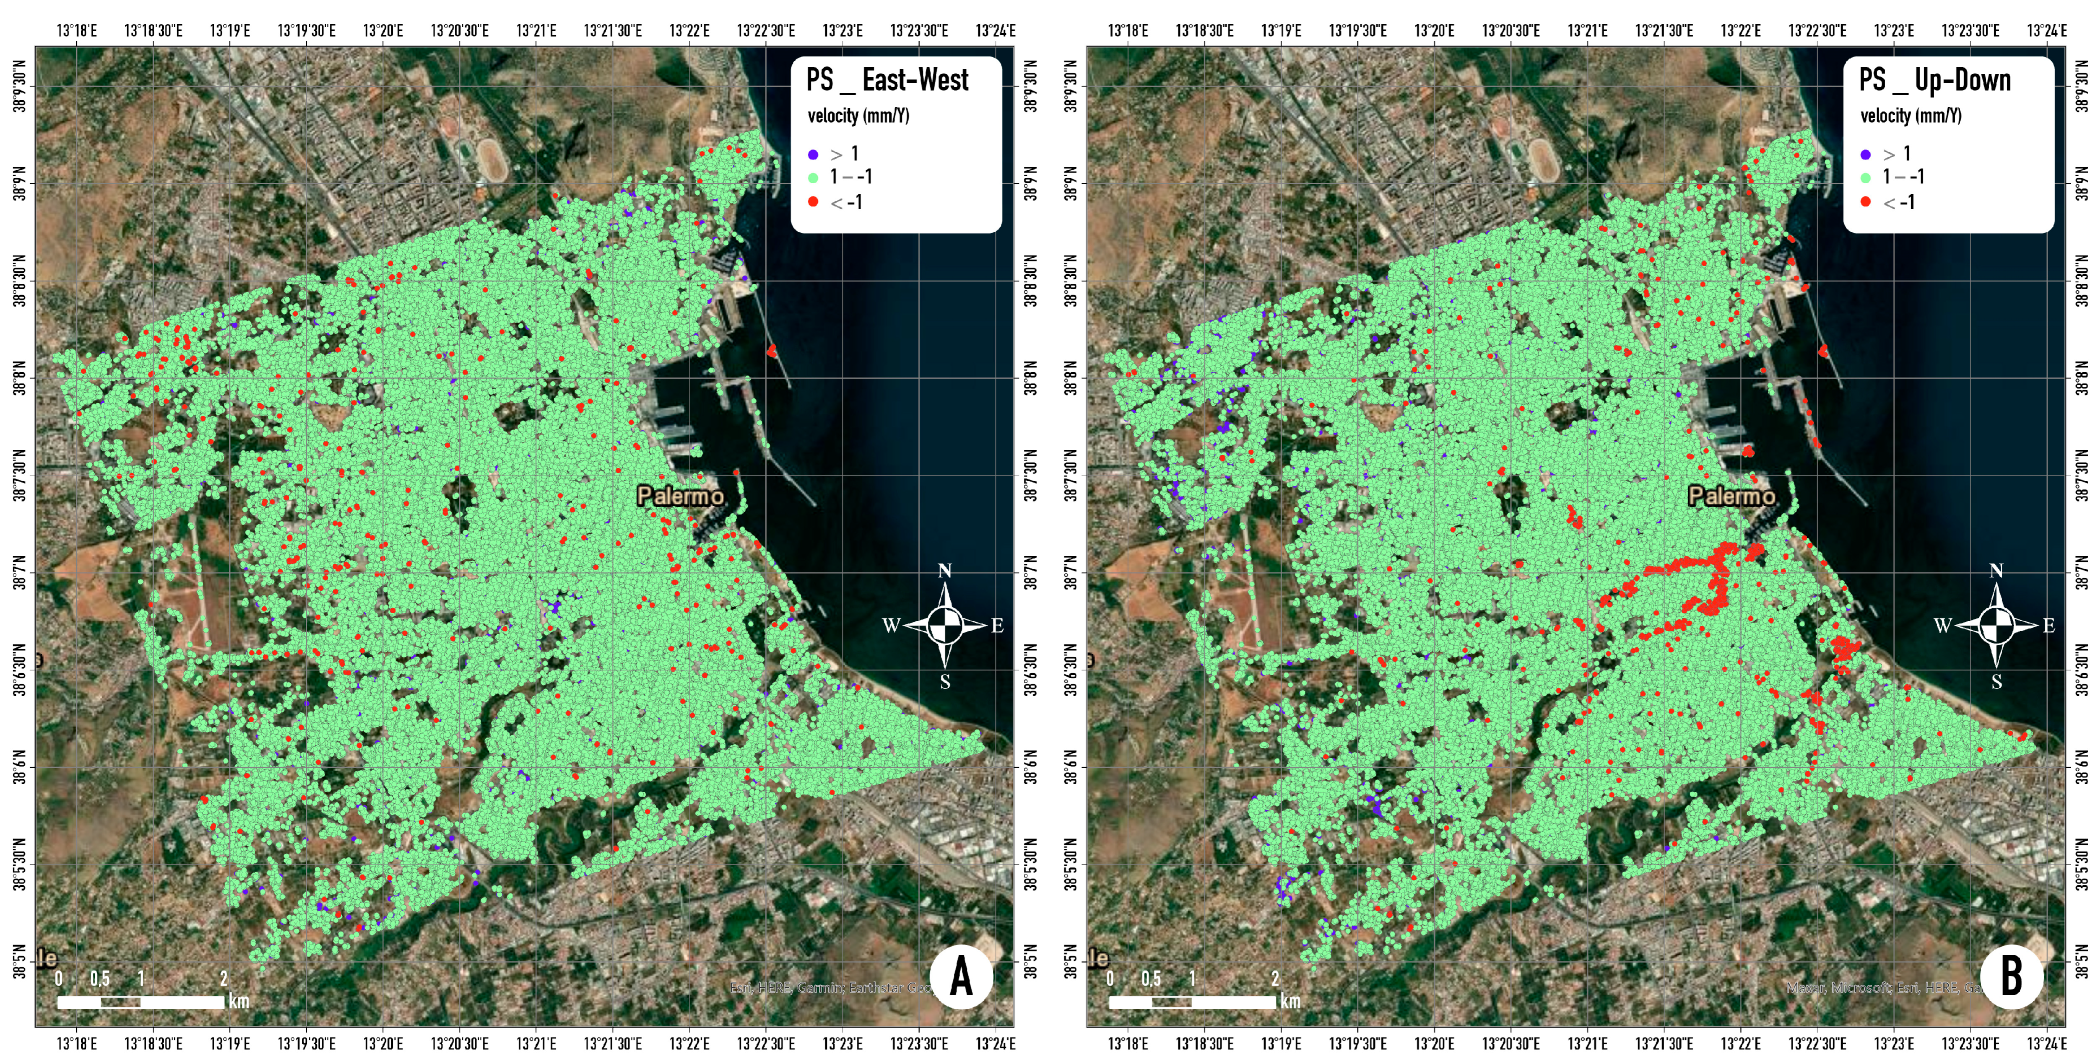
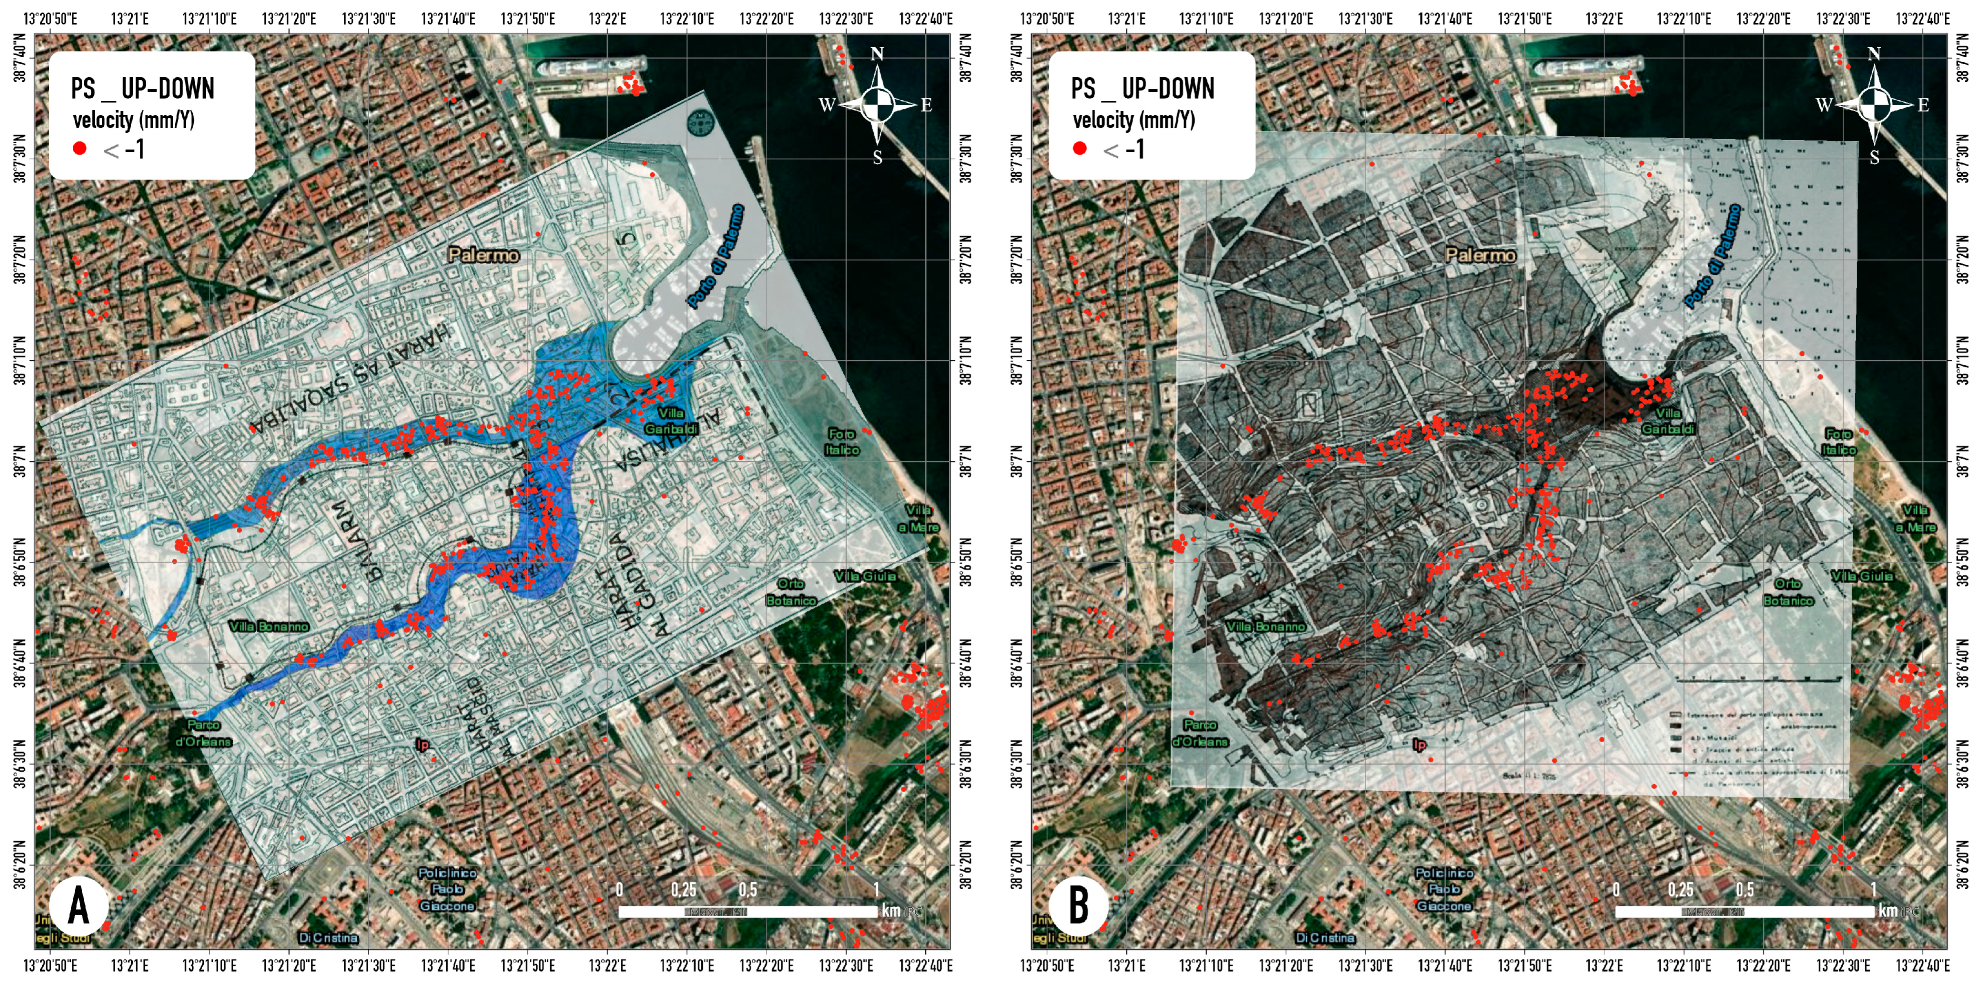
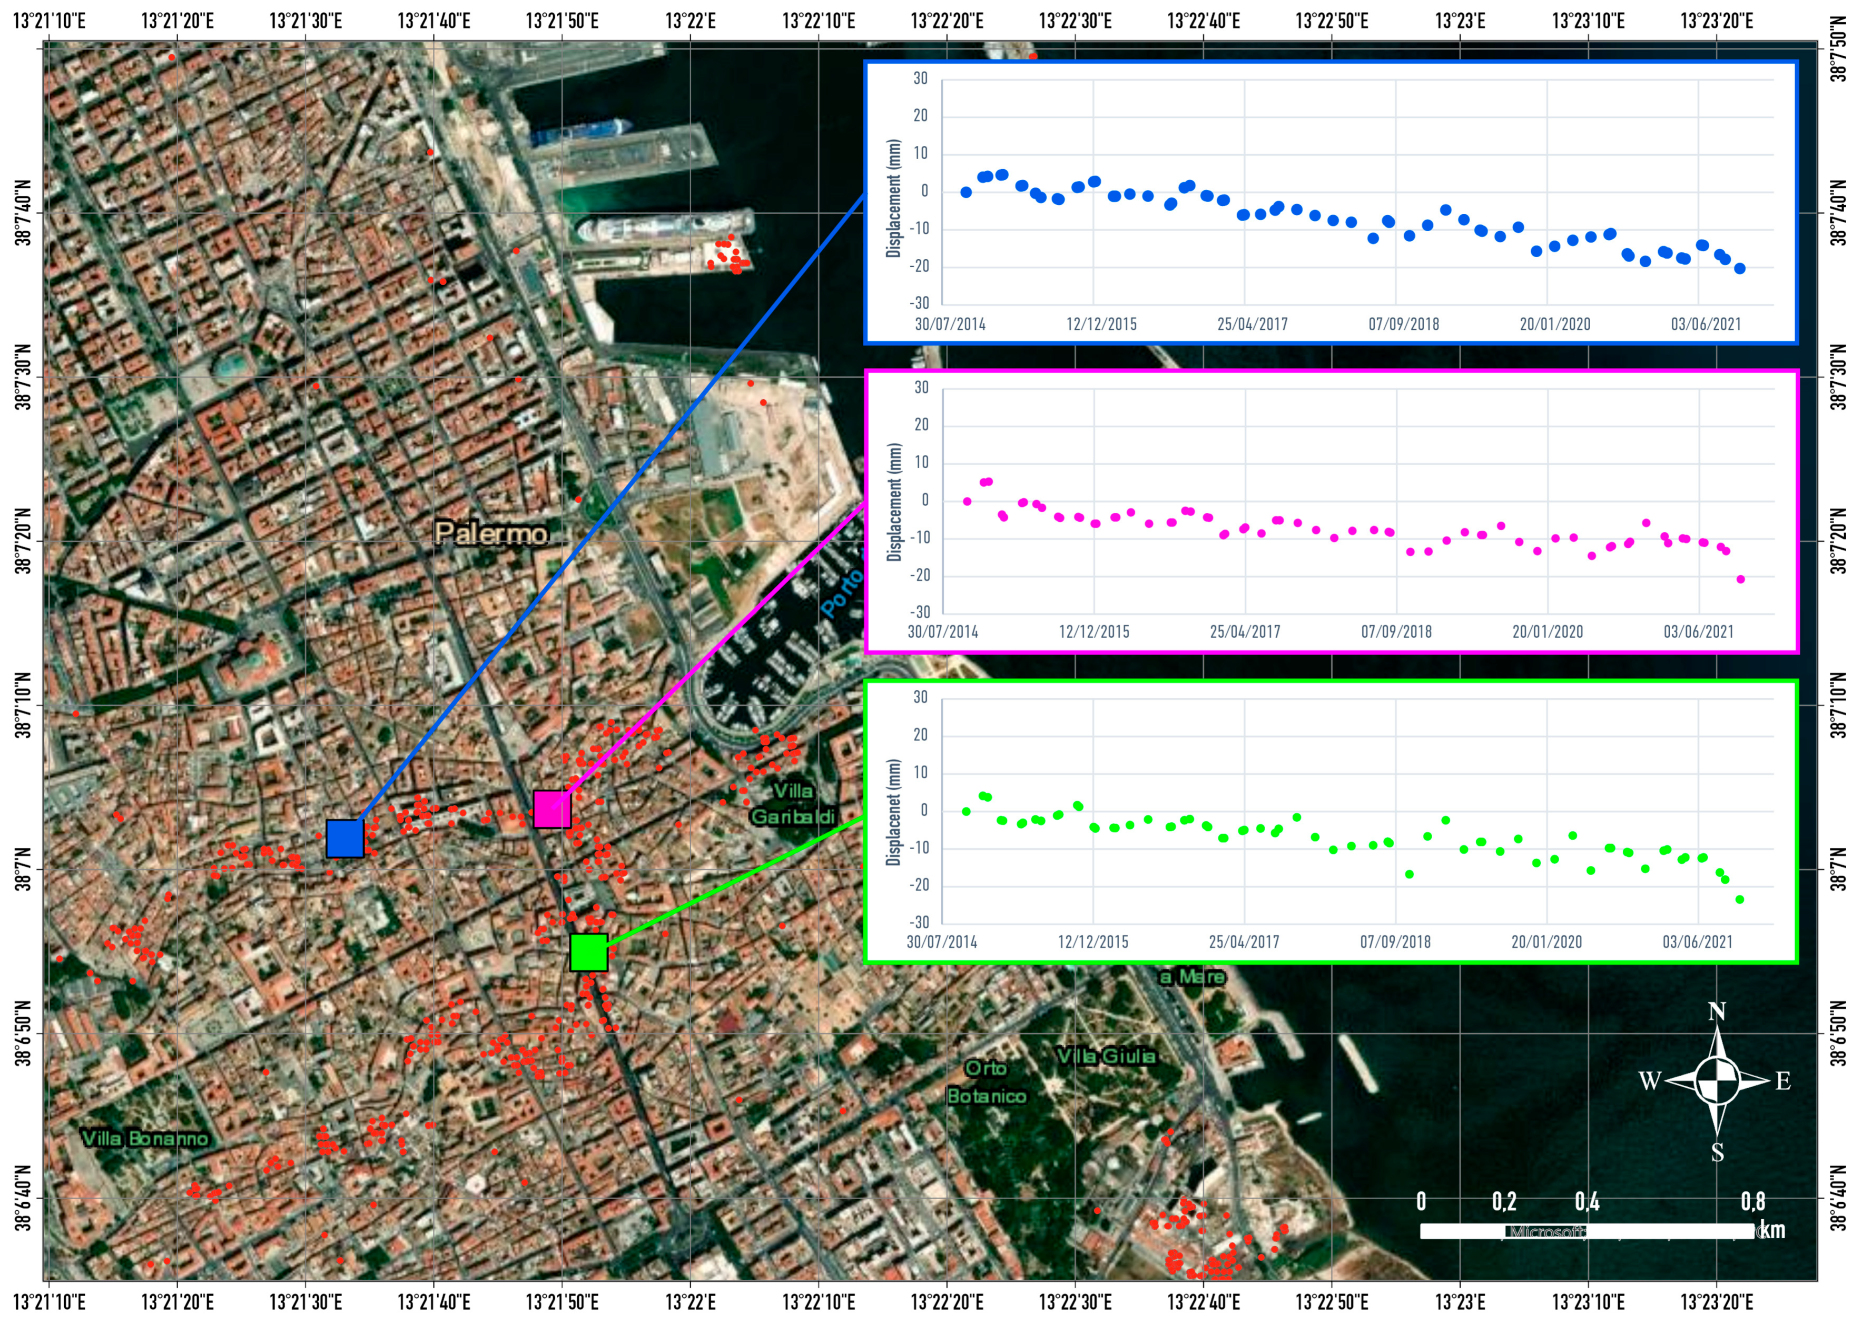
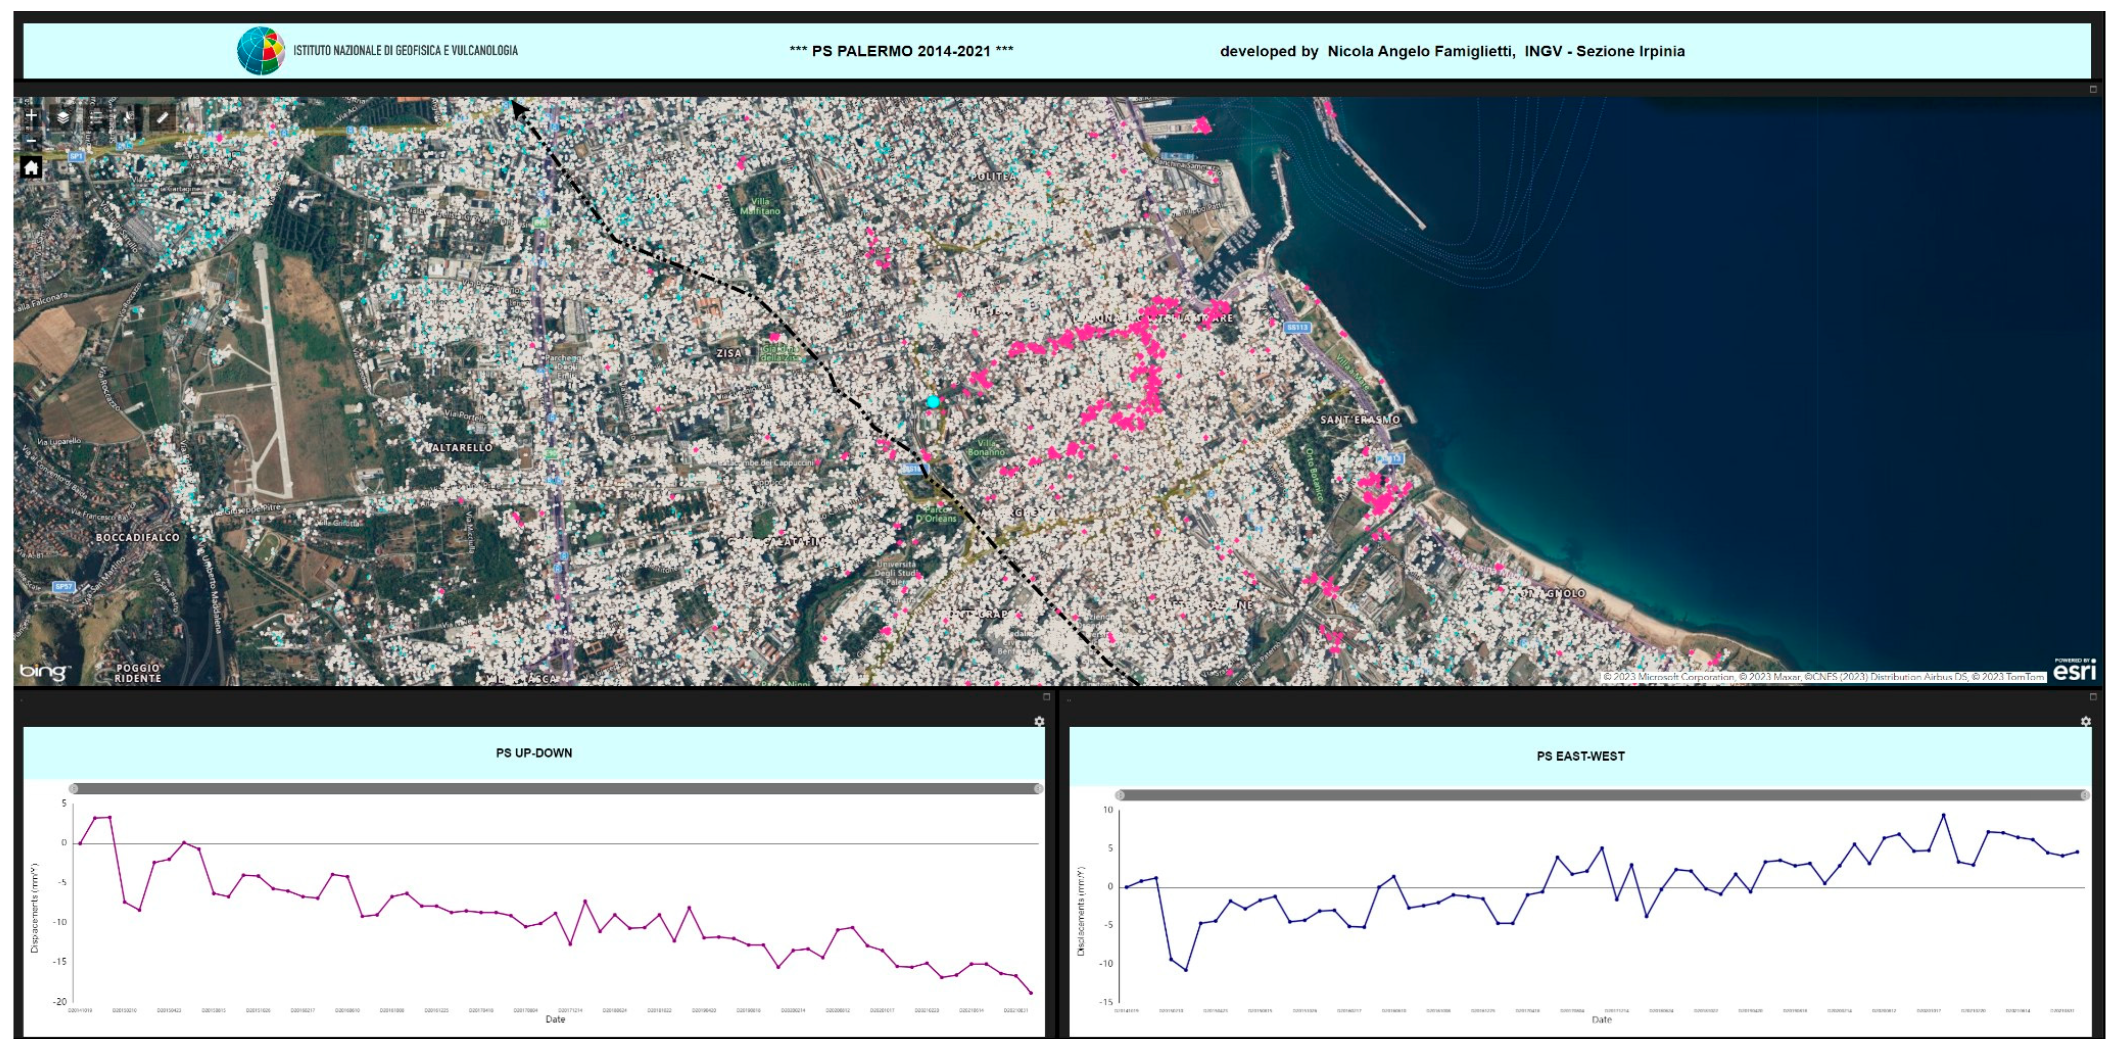
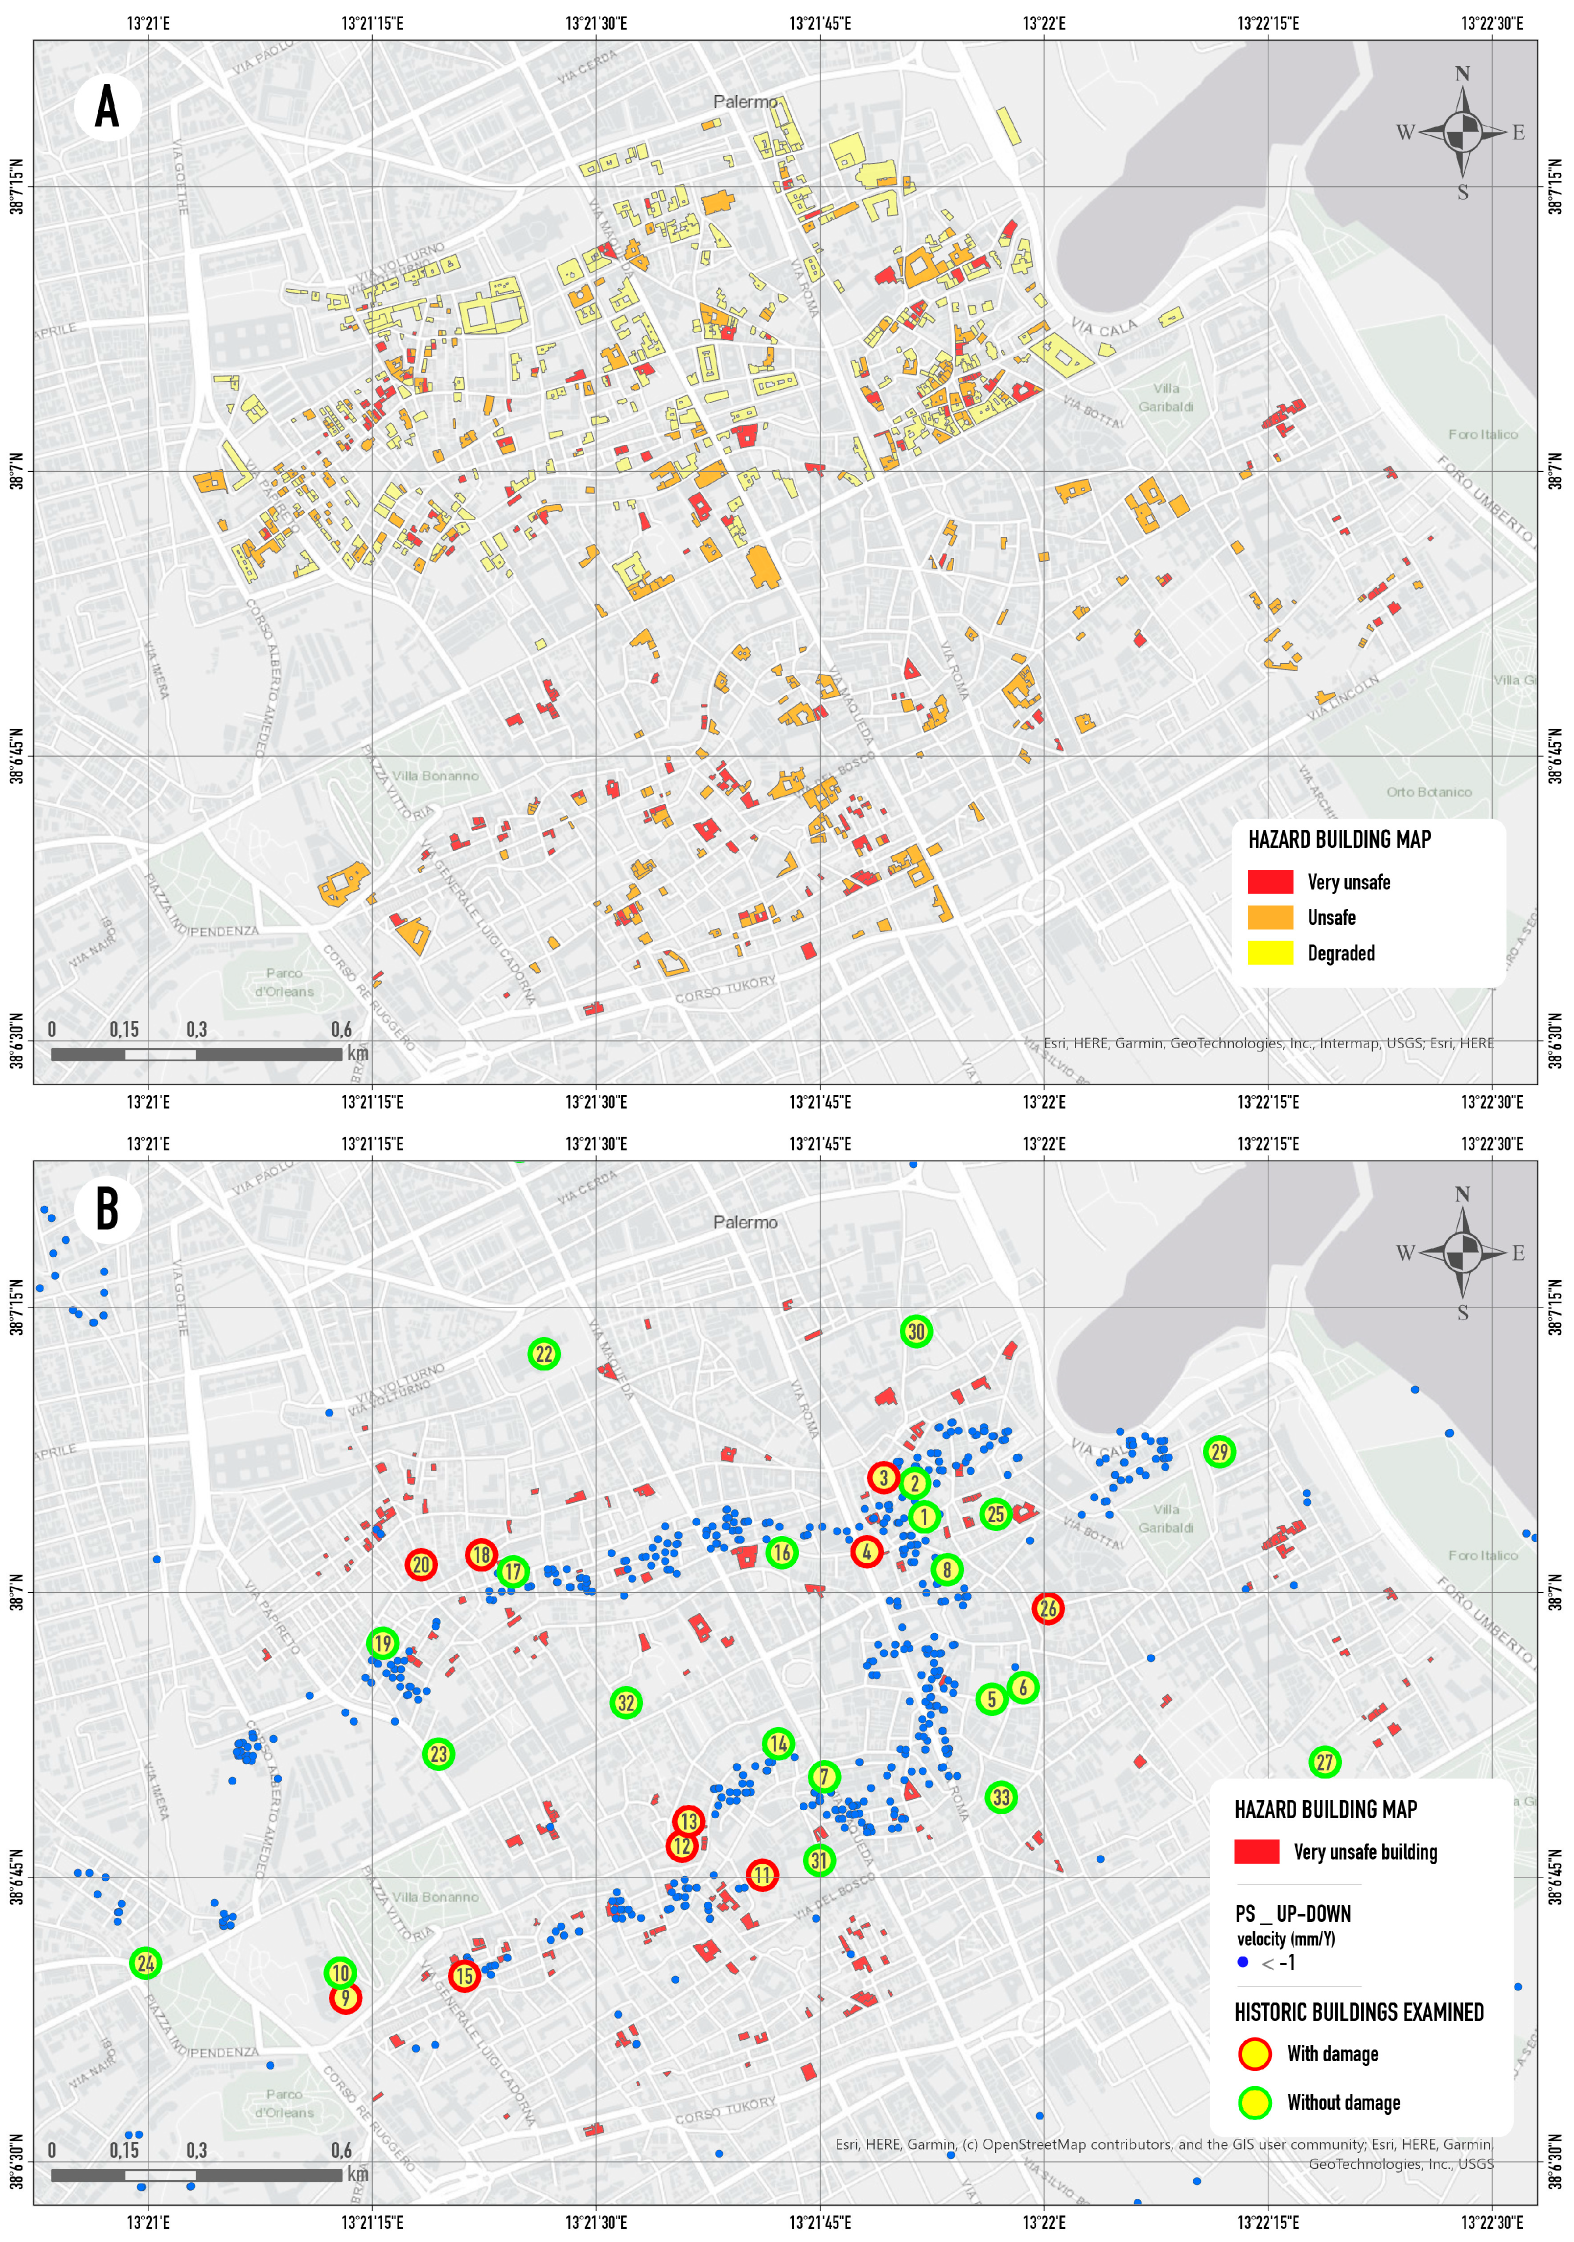
In this investigation, Sentinel-1 C-band SAR imagery (provided by ESA), recorded along both ascending and descending orbit tracks, has been employed (Table 1). In particular, products with the Interferometric Wide (IW) acquisition mode and VV polarisation were used covering an area of 250 km2 with a single scene (Figure 4).
For this purpose, two stack scenes were analyzed, covering the period from October 2014 to October 2021, with 46 scenes along the ascending orbit and 44 along the descending one, as summarized in Table 1.
The PS-InSAR technique is based on the use of a single master image to generate a stack of differential interferograms (generated for each slave) without limitations in temporal or spatial baselines (see Figure 5). The selection of PS candidates, which a priori carry reliable phase information across the interferogram stack, is based on their backscattering properties. On these points, the temporal unwrapping strategy is applied. The InSAR analysis was carried out using the SARscape® software, which demonstrated its reliability in different scientific works. After importing SLC data with accurate orbits, master and slave images were chosen both for ascending and descending datasets to achieve the images’ co-registration. A multilooking factor 1–4 (azimuth-range direction) has been used to improve the SNR (signal-to-noise ratio), obtaining a final ground resolution of 15 m. It reduces the speckle on image and increases its SNR (signal-to-noise ratio). The SNR corresponds to the ratio between the mean and the standard deviation of the data and it will increase if the standard deviation decreases. An oversampling of a factor of 4, in the range direction, has been applied to avoid aliasing of fast fringes in the case of large baseline values during the coregistration. During the entire processing, a DEM of the ALOS sensor with 30 m resolution was used as an elevation parameter, especially for the removal of the topographic phase component from the interferograms. Interferometric noise was reduced by applying a Goldstein filter [50], and the atmospheric phase was estimated and eliminated with the Delaunay-MCF gauge method [51], using a dual space–time filter.
Ultimately, for each dataset, PSs with coherence 0.75 or higher were chosen for the resulting subsidence map. Given the low sensitivity of the method along the north–south direction [52], ascending and descending information over the same geographical area allowed us to isolate the vertical and the East–West components [53,54,55] of the deformation status. For the decomposition step, the same ground control points (GCPs) are used for both datasets (ascending and descending) to optimize the displacement trend assessment. Employing more GCPs, the correction consists of the best fitting calculated from all GCPs.
Lastly, the identified deformation areas were converted into an external reference framework, i.e., geographical coordinates and the resulting ground displacement maps overlay, and loaded into a Geographic Information System (GIS) for further investigation.

3. Results

Thanks to the Ps-InSAR analysis, PS-driven deformation maps of the study area have been obtained for the ascending and descending datasets. Furthermore, the decomposition of E–W (Figure 6A) and vertical (Figure 6B) components have been performed, obtaining more than 130,000 PSs over the study area (~42 km2) with a density of more than 3000 PSs/km2.
For the E-W component map, PS velocity has values from −2.43 to 6.87 mm/Y, but considering the dataset histogram distribution, 81% of targets show values of the average velocity between −1 and 1 mm/Y and can be considered as stable points.
On the other hand, analyzing the vertical component map, PS velocity has values from −5.85 to 2.67 mm/Y. Also for this dataset, the largest part of the targets is included in the average velocity class between −1 and 1 mm/Y (91%), but the distribution of targets with velocity (negative values) rates faster than 2 mm/Y is concentrated in the neighborhoods of the historical center.
In particular, there are two main areas with very high density of PSs characterized by vertical negative velocity less than −1 mm/year: the first cluster is located on the east side of the botanical garden and very close to the Oreto stream, while the second group of points (about 700 PSs) with anomalous velocity is located along the streets of the old town that were built above the rivers Papireto and Kemonia, as shown in the historical map in Figure 7.
This shows a relatively strong subsidence in those areas where in the past the streams were buried, which may affect the buildings in the near future. In fact, taking into account the PS time series of the vertical component dataset, the deformation trends are almost linear with seasonal fluctuations. However, in the last six months of the considered period (i.e., from May to October 2021), time series show a sudden and widespread acceleration. For some targets, the cumulated displacements exceed the value of 2 cm, as shown in Figure 8. Other PSs with considerable velocities are located in correspondence with the train station and the internal and external structures of the harbor.
The obtained outcomes have been implemented in a GIS environment web app employing the ArcGIS online suite. In particular, layers of PS maps are available and can be visualized in the urban context. Spatial analysis makes it possible to identify and quantify the potential implications that may involve other urban and civil structures (e.g., aqueducts, roads, cultural heritage sites, etc.). In this platform, a tool for temporal analysis has also been implemented to visualize the PS time series using a very user-friendly GUI (Figure 9).

4. Discussion

As it is documented in the ancient maps of Palermo, the hydrographic network has been completely buried or erased in the last few centuries to obtain new space for anthropic structures and activities. Consequently, the compaction of filling materials can be considered as the main cause of the observed subsidence phenomena as estimated in this study analyzing the E–W and vertical component of the obtained PS maps. The high spatial and temporal resolution of SAR images enables us, nowadays, to investigate deformations and structural behavior in both large areas and single sections of buildings. The obtained results from MT-InSAR analysis are coherent, with the damaged pattern already recognized in the historical center of Palermo. Of course, to deeply understand the ongoing processes that cause the subsidence of the areas where the Kemonia and Papireto rivers originally flowed, in situ investigations should be planned.
Since such investigations could not be carried out immediately, the study focused on comparison with data already present in the literature. In fact, over the past few years, extensive research has been undertaken to assess the safety of buildings located in Palermo’s historical center. In the technical report by Carta 2010 [56], those edifices were discretized according to three levels of hazard, as shown in Figure 10A. It is notable to observe that the higher building risk conditions are located not far from the PSs with velocities higher than −1 mm/Y (blue dots), obtained by MT-InSAR analysis (Figure 10B). Of course, such risk conditions refer to all the building damage and/or degradation conditions even if not strictly related to differential settlements. Previously, Todaro 2006 [57] investigated many monuments and historical buildings located in the study area (yellow circles in Figure 10B). The different damage conditions had been correlated to the various lithotypes present. In particular, buildings with macroscopic evidence of deformations (yellow circles with a red outline in Figure 10B) are located in correspondence with the eluvio-colluvial and marshy sediments of Kemonia and Papireto and with Holocene deposits filling the paleo-valleys and the ancient harbor. In fact, these circles describe buildings with crack patterns attributable to differential settlements, highlighting an excellent accord with the obtained MT-InSAR results. For areas outside the original river courses, no PSs with velocity between ±1 mm/Y are observed, and deformation phenomena on buildings have not been observed. Then, by referring to the section shown in Figure 2B, in correspondence with the calcarenitic lithotypes, there are no subsidence phenomena.
Using advanced remote sensing techniques for the mapping of subsidence areas in the historic center of Palermo, an overview of the entire urban area and not only individual buildings was obtained, unlike previous research.
Among the two main PS clusters individuated in the vertical component map, the one located in correspondence of the Oreto river and botanical garden has not been considered. In fact, some PSs with significant velocities are in proximity to transport infrastructure such as bridges and train stations. Due to their location, these targets should be the topic of other studies focused on structural health monitoring (SHM) to understand the correlation between the deformation detected by means of MT-InSAR techniques and their effects on these strategic infrastructures.
The obtained outcomes can be used in future applications based on statistical modeling to achieve a susceptibility map of the urban area of Palermo. These PS maps can be considered as a starting point and, potentially, can be updated considering the satellite-pass acquisition.
A monitoring system that enables intervention in near real-time while also providing quantitative information is an instrument of fundamental importance. Pursuing an optimization of economic and technical resources, it is important to underline that the proposed approach does not require expensive costs. In fact, the costs are reduced because the Sentinel-1 images are free of charge (provided by ESA within the Copernicus Project), and at the same time, MT-InSAR techniques are completely accessible using free software. This would allow stakeholders to implement a near real-time monitoring system to identify the most prone urban areas to subsidence or instability in general.

5. Conclusions

The paper presents an application of a modern and low-cost PS-InSAR technique depicting urban dynamics in terms of active deformations over the Palermo city area. The outcomes consist of East–West and vertical PSs component maps derived using specifically implemented analysis procedures in SARscape® software. Especially for the vertical component map, the analysis highlighted a significant number of PSs with velocities higher than 1 mm/year. Those targets are located in the city’s historical center along the streets where, in the past, according to the ancient maps collected, two rivers flowed. Therefore, the observed deformations, which are mostly vertical, can be due to the compaction of sediments employed during the stream’s filling processes.
Remote sensing technologies may help in the identification and characterization of the urban areas affected by different levels of deformation, allowing us to detect movements from slow to very slow, which are notoriously difficult to recognize by direct observation. Furthermore, temporal revisiting time (8–16 days) of the SAR satellite permits firstly to periodically update PSs maps and time series and subsequently to control structural conditions of potentially involved buildings, thus developing a quasi-real time monitoring system in a GIS environment accessible by local authorities.
The developed procedure, based on updatable PS data, is an easy upgrade to account for this aspect, also providing support to natural hazards management, urban planning, and cost-effective mitigation planning. In this perspective, the association of PS data with historical maps and other ancillary data represents a major advance.
So, to answer our original question, what have we learned from the past? The urban plans of the city of Palermo did not take into account the information contained in the ancient maps, and the new buildings were built in the area where two large rivers once flowed, now covered by filling material. Today, these structures are showing damage and the construction of new infrastructure necessary for the city is problematic. Perhaps we could have considered historical knowledge and avoided having to deal with these problems.

Author Contributions

Conceptualization, N.A.F.; methodology, N.A.F.; software, N.A.F., P.M. and R.M.; validation, all; investigation, all; resources, D.G., L.P. and F.M.G.; data curation, N.A.F., P.M. and R.M.; writing—original draft preparation, all; writing—review and editing, all; supervision, N.A.F. and L.P.; project administration, D.G. and A.V. All authors have read and agreed to the published version of the manuscript.

Funding

This research was funded by the “Operational Convention” No. 0021391/2023 between the Istituto Nazionale di Geofisica e Vulcanologia (INGV)—Sezione Irpinia and the Consorzio interUniversitario per la prevenzione dei Grandi Rischi (C.U.G.RI.), within the 2023 scientific activities plan related to structures and infrastructure risk assessment.

Data Availability Statement

Sentinel data were made available by ESA in the Copernicus project through the Open-Access Hub portal (https://scihub.copernicus.eu/dhus/#/home (accessed on 10 January 2023)).

Acknowledgments

Sentinel data from the ESA Copernicus Project were obtained through the Open-Access Hub (https://scihub.copernicus.eu/dhus/#/home (accessed on 10 January 2023)). InSAR processing and data modeling were carried out with ENVI® SARscape® (Sarmap, CH).

Conflicts of Interest

The authors declare no conflict of interest.

References

  1. Whittaker, B.N.; Reddish, D.J. Subsidence: Occurrence, Prediction and Control; Elsevier: Amsterdam, The Netherlands, 1989. [Google Scholar]
  2. Abidin, H.Z.; Andreas, H.; Gumilar, I.; Fukuda, Y.; Pohan, Y.E.; Deguchi, T. Land Subsidence of Jakarta (Indonesia) and Its Relation with Urban Development. Nat. Hazards 2011, 59, 1753–1771. [Google Scholar] [CrossRef]
  3. Grandoni, D.; Battagliere, M.L.; Daraio, M.G.; Sacco, P.; Coletta, A.; Di Federico, A.; Mastracci, F. Space-Based Technology for Emergency Management: The COSMO-SkyMed Constellation Contribution. Procedia Technol. 2014, 16, 858–866. [Google Scholar] [CrossRef]
  4. Showstack, R. Sentinel Satellites Initiate New Era in Earth Observation. Eos Trans. Am. Geophys. Union 2014, 95, 239–240. [Google Scholar] [CrossRef]
  5. Kalia, A.C.; Frei, M.; Lege, T. A Copernicus Downstream-Service for the Nationwide Monitoring of Surface Displacements in Germany—ScienceDirect. Available online: https://www.sciencedirect.com/science/article/pii/S0034425717302158 (accessed on 29 August 2023).
  6. Novellino, A.; Cigna, F.; Brahmi, M.; Sowter, A.; Bateson, L.; Marsh, S. Assessing the Feasibility of a National InSAR Ground Deformation Map of Great Britain with Sentinel-1. Geosciences 2017, 7, 19. [Google Scholar] [CrossRef]
  7. Rosi, A.; Tofani, V.; Agostini, A.; Tanteri, L.; Tacconi Stefanelli, C.; Catani, F.; Casagli, N. Subsidence Mapping at Regional Scale Using Persistent Scatters Interferometry (PSI): The Case of Tuscany Region (Italy). Int. J. Appl. Earth Obs. Geoinf. 2016, 52, 328–337. [Google Scholar] [CrossRef]
  8. Solari, L.; Ciampalini, A.; Raspini, F.; Bianchini, S.; Moretti, S. PSInSAR Analysis in the Pisa Urban Area (Italy): A Case Study of Subsidence Related to Stratigraphical Factors and Urbanization. Remote Sens. 2016, 8, 120. [Google Scholar] [CrossRef]
  9. Kaneko, S.; Toyota, T. Long-Term Urbanization and Land Subsidence in Asian Megacities: An Indicators System Approach. In Groundwater and Subsurface Environments: Human Impacts in Asian Coastal Cities; Taniguchi, M., Ed.; Springer: Tokyo, Japan, 2011; pp. 249–270. ISBN 978-4-431-53904-9. [Google Scholar]
  10. Bajni, G.; Apuani, T.; Beretta, G.P. Hydro-Geotechnical Modelling of Subsidence in the Como Urban Area. Eng. Geol. 2019, 257, 105144. [Google Scholar] [CrossRef]
  11. Chaussard, E.; Amelung, F.; Abidin, H.; Hong, S.-H. Sinking Cities in Indonesia: ALOS PALSAR Detects Rapid Subsidence Due to Groundwater and Gas Extraction. Remote Sens. Environ. 2013, 128, 150–161. [Google Scholar] [CrossRef]
  12. Dai, L. Preventing and Controlling Land Subsidence in Shanghai—Towards More Integrated and Effective Land Use and Ground Water Governance in the Yangtze Delta. EGU General Assembly Conference Abstracts, Vienna, Austria, 17–22 April 2016. Available online: https://meetingorganizer.copernicus.org/EGU2016/EGU2016-16451.pdf (accessed on 15 May 2023).
  13. Figueroa-Miranda, S.; Tuxpan-Vargas, J.; Ramos-Leal, J.A.; Hernández-Madrigal, V.M.; Villaseñor-Reyes, C.I. Land Subsidence by Groundwater Over-Exploitation from Aquifers in Tectonic Valleys of Central Mexico: A Review. Eng. Geol. 2018, 246, 91–106. [Google Scholar] [CrossRef]
  14. Xu, Y.-S.; Wu, H.-N.; Wang, B.Z.-F.; Yang, T.-L. Dewatering Induced Subsidence during Excavation in a Shanghai Soft Deposit. Environ. Earth Sci. 2017, 76, 351. [Google Scholar] [CrossRef]
  15. Unlu, T.; Akcin, H.; Yilmaz, O. An Integrated Approach for the Prediction of Subsidence for Coal Mining Basins. Available online: https://www.sciencedirect.com/science/article/pii/S0013795213002329 (accessed on 28 August 2023).
  16. Nádudvari, Á. Using Radar Interferometry and SBAS Technique to Detect Surface Subsidence Relating to Coal Mining in Upper Silesia from 1993–2000 and 2003–2010. Environ. Socio-Econ. Stud. 2016, 4, 24–34. [Google Scholar] [CrossRef]
  17. Solarski, M.; Machowski, R.; Rzetala, M.; Rzetala, M.A. Hypsometric Changes in Urban Areas Resulting from Multiple Years of Mining Activity. Sci. Rep. 2022, 12, 2982. [Google Scholar] [CrossRef] [PubMed]
  18. Costantini, M.; Ferretti, A.; Minati, F.; Falco, S.; Trillo, F.; Colombo, D.; Novali, F.; Malvarosa, F.; Mammone, C.; Vecchioli, F.; et al. Analysis of Surface Deformations over the Whole Italian Territory by Interferometric Processing of ERS, Envisat and COSMO-SkyMed Radar Data. Remote Sens. Environ. 2017, 202, 250–275. [Google Scholar] [CrossRef]
  19. Ferretti, A.; Prati, C.; Rocca, F. Permanent Scatterers in SAR Interferometry. IEEE Trans. Geosci. Remote Sens. 2001, 39, 8–20. [Google Scholar] [CrossRef]
  20. Stramondo, S.; Bozzano, F.; Marra, F.; Wegmuller, U.; Cinti, F.R.; Moro, M.; Saroli, M. Subsidence Induced by Urbanisation in the City of Rome Detected by Advanced InSAR Technique and Geotechnical Investigations. Remote Sens. Environ. 2008, 112, 3160–3172. [Google Scholar] [CrossRef]
  21. Yang, K.; Yan, L.; Huang, G.; Chen, C.; Wu, Z. Monitoring Building Deformation with InSAR: Experiments and Validation. Sensors 2016, 16, 2182. [Google Scholar] [CrossRef]
  22. Miele, P.; Di Napoli, M.; Guerriero, L.; Ramondini, M.; Sellers, C.; Annibali Corona, M.; Di Martire, D. Landslide Awareness System (LAwS) to Increase the Resilience and Safety of Transport Infrastructure: The Case Study of Pan-American Highway (Cuenca–Ecuador). Remote Sens. 2021, 13, 1564. [Google Scholar] [CrossRef]
  23. Ramirez, R.A.; Lee, G.-J.; Choi, S.-K.; Kwon, T.-H.; Kim, Y.-C.; Ryu, H.-H.; Kim, S.; Bae, B.; Hyun, C. Monitoring of Construction-Induced Urban Ground Deformations Using Sentinel-1 PS-InSAR: The Case Study of Tunneling in Dangjin, Korea. Int. J. Appl. Earth Obs. Geoinf. 2022, 108, 102721. [Google Scholar] [CrossRef]
  24. Macchiarulo, V.; Milillo, P.; Blenkinsopp, C.; Reale, C.; Giardina, G. Multi-Temporal InSAR for Transport Infrastructure Monitoring: Recent Trends and Challenges. Proc. Inst. Civ. Eng. Bridge Eng. 2023, 176, 92–117. [Google Scholar] [CrossRef]
  25. Zebker, H.A.; Rosen, P.A.; Goldstein, R.M.; Gabriel, A.; Werner, C.L. On the Derivation of Coseismic Displacement Fields Using Differential Radar Interferometry: The Landers Earthquake. J. Geophys. Res. Solid Earth 1994, 99, 19617–19634. [Google Scholar] [CrossRef]
  26. Iglesias, R.; Mallorqui, J.J.; Monells, D.; López-Martínez, C.; Fabregas, X.; Aguasca, A.; Gili, J.A.; Corominas, J. PSI Deformation Map Retrieval by Means of Temporal Sublook Coherence on Reduced Sets of SAR Images. Remote Sens. 2015, 7, 530–563. [Google Scholar] [CrossRef]
  27. Vicari, A.; Famiglietti, N.A.; Colangelo, G.; Cecere, G. A Comparison of Multi Temporal Interferometry Techniques for Landslide Susceptibility Assessment in Urban Area: An Example on Stigliano (MT), a Town of Southern of Italy. Geomat. Nat. Hazards Risk 2019, 10, 836–852. [Google Scholar] [CrossRef]
  28. FGama, F.F.; Mura, J.C.; Paradella, W.R.; de Oliveira, C.G. Deformations Prior to the Brumadinho Dam Collapse Revealed by Sentinel-1 InSAR Data Using SBAS and PSI Techniques. Remote Sens. 2020, 12, 3664. [Google Scholar] [CrossRef]
  29. Cigna, F.; Esquivel Ramírez, R.; Tapete, D. Accuracy of Sentinel-1 PSI and SBAS InSAR Displacement Velocities against GNSS and Geodetic Leveling Monitoring Data. Remote Sens. 2021, 13, 4800. [Google Scholar] [CrossRef]
  30. Berardino, P.; Fornaro, G.; Lanari, R.; Sansosti, E. A New Algorithm for Surface Deformation Monitoring Based on Small Baseline Differential SAR Interferograms. IEEE Trans. Geosci. Remote Sens. 2002, 40, 2375–2383. [Google Scholar] [CrossRef]
  31. Lanari, R.; Mora, O.; Manunta, M.; Mallorqui, J.J.; Berardino, P.; Sansosti, E. A Small-Baseline Approach for Investigating Deformations on Full-Resolution Differential SAR Interferograms. IEEE Trans. Geosci. Remote Sens. 2004, 42, 1377–1386. [Google Scholar] [CrossRef]
  32. Ferretti, A.; Fumagalli, A.; Novali, F.; Prati, C.; Rocca, F.; Rucci, A. A New Algorithm for Processing Interferometric Data-Stacks: SqueeSAR. IEEE Trans. Geosci. Remote Sens. 2011, 49, 3460–3470. [Google Scholar] [CrossRef]
  33. Ferretti, A.; Prati, C.; Rocca, F. Nonlinear Subsidence Rate Estimation Using Permanent Scatterers in Differential SAR Interferometry. IEEE Trans. Geosci. Remote Sens. 2000, 38, 2202–2212. [Google Scholar] [CrossRef]
  34. Colesanti, C.; Ferretti, A.; Prati, C.; Rocca, F. Monitoring Landslides and Tectonic Motions with the Permanent Scatterers Technique. Eng. Geol. 2003, 68, 3–14. [Google Scholar] [CrossRef]
  35. Hanssen, R.F. Satellite Radar Interferometry for Deformation Monitoring: A Priori Assessment of Feasibility and Accuracy. Int. J. Appl. Earth Obs. Geoinf. 2005, 6, 253–260. [Google Scholar] [CrossRef]
  36. Del Soldato, M.; Confuorto, P.; Bianchini, S.; Sbarra, P.; Casagli, N. Review of Works Combining GNSS and InSAR in Europe. Remote Sens. 2021, 13, 1684. [Google Scholar] [CrossRef]
  37. Cappadonia, C.; Di Maggio, C.; Agate, M.; Agnesi, V. Geomorphology of the Urban Area of Palermo (Italy). J. Maps 2020, 16, 274–284. [Google Scholar] [CrossRef]
  38. Basilone, L.; Di Maggio, C. Geology of Monte Gallo (Palermo Mts, NW Sicily). J. Maps 2016, 12, 1072–1083. [Google Scholar] [CrossRef]
  39. ISPRA Carta Geologica d’italia Alla Scala 1:50,000 e Note Illustrative Del Foglio 595_Palermo 2013. Available online: https://www.isprambiente.gov.it/Media/carg/note_illustrative/595_Palermo.pdf (accessed on 15 May 2023).
  40. Agnesi, V.; Di Patti, C.; Truden, B. Giants and Elephants of Sicily. Geol. Soc. Lond. Spec. Publ. 2007, 273, 263–270. [Google Scholar] [CrossRef]
  41. Maggio, C.D.; Madonia, G.; Vattano, M.; Agnesi, V.; Monteleone, S. Geomorphological Evolution of Western Sicily, Italy. Geol. Carpathica 2017, 68, 80. [Google Scholar] [CrossRef]
  42. Martorana, R.; Aagate, M.; Patrizia, C.; Cavera, F.; D’Alessandro, A. Seismo-Stratigraphic Model of “La Bandita” Area in the Palermo Plain (Sicily, Italy) through HVSR Inversion Constrained by Stratigraphic Data. Ital. J. Geosci. 2018, 137, 73–86. [Google Scholar] [CrossRef]
  43. Agnesi, V. La geomorfologia di Palermo; Sapienza Università Editrice: Macerata, Italy, 2021; ISBN 978-88-9377-168-9. [Google Scholar]
  44. Liguori, V.; Piacentini, U.; Pratini, P.; Valore, C.; Ziccarelli, M. Caratteri Geologici e Geotecnici Del Sottosuolo Di Palermo. In Proceedings of the Convegno Nazionale di Geotecnica, L’Aquila, Italy, 11–14 September 2002; pp. 79–92, ISBN 88-555-2663-4. [Google Scholar]
  45. Coroneo, R. Storia del Porto di Palermo; Marcello Clausi Editore: Palermo, Italy, 2011. [Google Scholar]
  46. Pedone, F. La Città Che Non c’era. Lo Sviluppo Urbano Di Palermo Nel Secondo Dopoguerra; Istituto Poligrafico Europeo: Rome, Italy, 2019. [Google Scholar]
  47. Di Matteo, S. Palermo: Storia Della Città Dalle Origini a Oggi; Kalos: Palermo, Italy, 2002. [Google Scholar]
  48. Ardizzone, F.; Pezzini, E.; Sacco, V. The Role of Palermo in the Central Mediterranean: The Evolution of the Harbour and the Circulation of Ceramics (10th–11th Centuries). J. Islam. Archaeol. 2016, 2, 229–257. [Google Scholar] [CrossRef]
  49. Columba, G.M. Per La Topografia Antica Di Palermo. In Centenario della Nascita di Michele Amari; Stabilimento Tipografico Virzì: Palermo, Italy, 1910; Volume 2, pp. 395–426. [Google Scholar]
  50. Goldstein, R.M.; Werner, C.L. Radar Interferogram Filtering for Geophysical Applications. Geophys. Res. Lett. 1998, 25, 4035–4038. [Google Scholar] [CrossRef]
  51. Costantini, M. A Novel Phase Unwrapping Method Based on Network Programming. IEEE Trans. Geosci. Remote Sens. 1998, 36, 813–821. [Google Scholar] [CrossRef]
  52. Hanssen, R.F. Radar Interferometry: Data Interpretation and Error Analysis; Springer: Berlin/Heidelberg, Germany, 2001; ISBN 978-0-7923-6945-5. [Google Scholar]
  53. Fialko, Y.; Simons, M.; Agnew, D. The Complete (3-D) Surface Displacement Field in the Epicentral Area of the 1999 Mw7. 1 Hector Mine Earthquake, California, from Space Geodetic Observations. Geophys. Res. Lett. 2001, 28, 3063–3066. [Google Scholar] [CrossRef]
  54. Ng, A.H.-M.; Ge, L.; Zhang, K.; Chang, H.-C.; Li, X.; Rizos, C.; Omura, M. Deformation Mapping in Three Dimensions for Underground Mining Using InSAR—Southern Highland Coalfield in New South Wales, Australia. Int. J. Remote Sens. 2011, 32, 7227–7256. [Google Scholar] [CrossRef]
  55. Dalla Via, G.; Crosetto, M.; Crippa, B. Resolving Vertical and East-West Horizontal Motion from Differential Interferometric Synthetic Aperture Radar: The L’Aquila Earthquake. J. Geophys. Res. Solid Earth 2012, 117, B02310. [Google Scholar] [CrossRef]
  56. Carta, M. Il Futuro Del Centro Storico Di Palermo; Palermo Rotary: Palermo, Italy, 2010. [Google Scholar]
  57. Todaro, P. Il Rischio Sismico Nel Centro Storico Di Palermo: Rigidità Sismica e Modelli Geologici Semplificati per Terreni Di Sedime Di Fondazioni Datate. In Archeometria del Costruito. l’Edificato Storico: Materiali, Strutture e Rischio Sismico; Edipuglia s.r.l.: Bari, Italy, 2006; pp. 239–255. [Google Scholar]
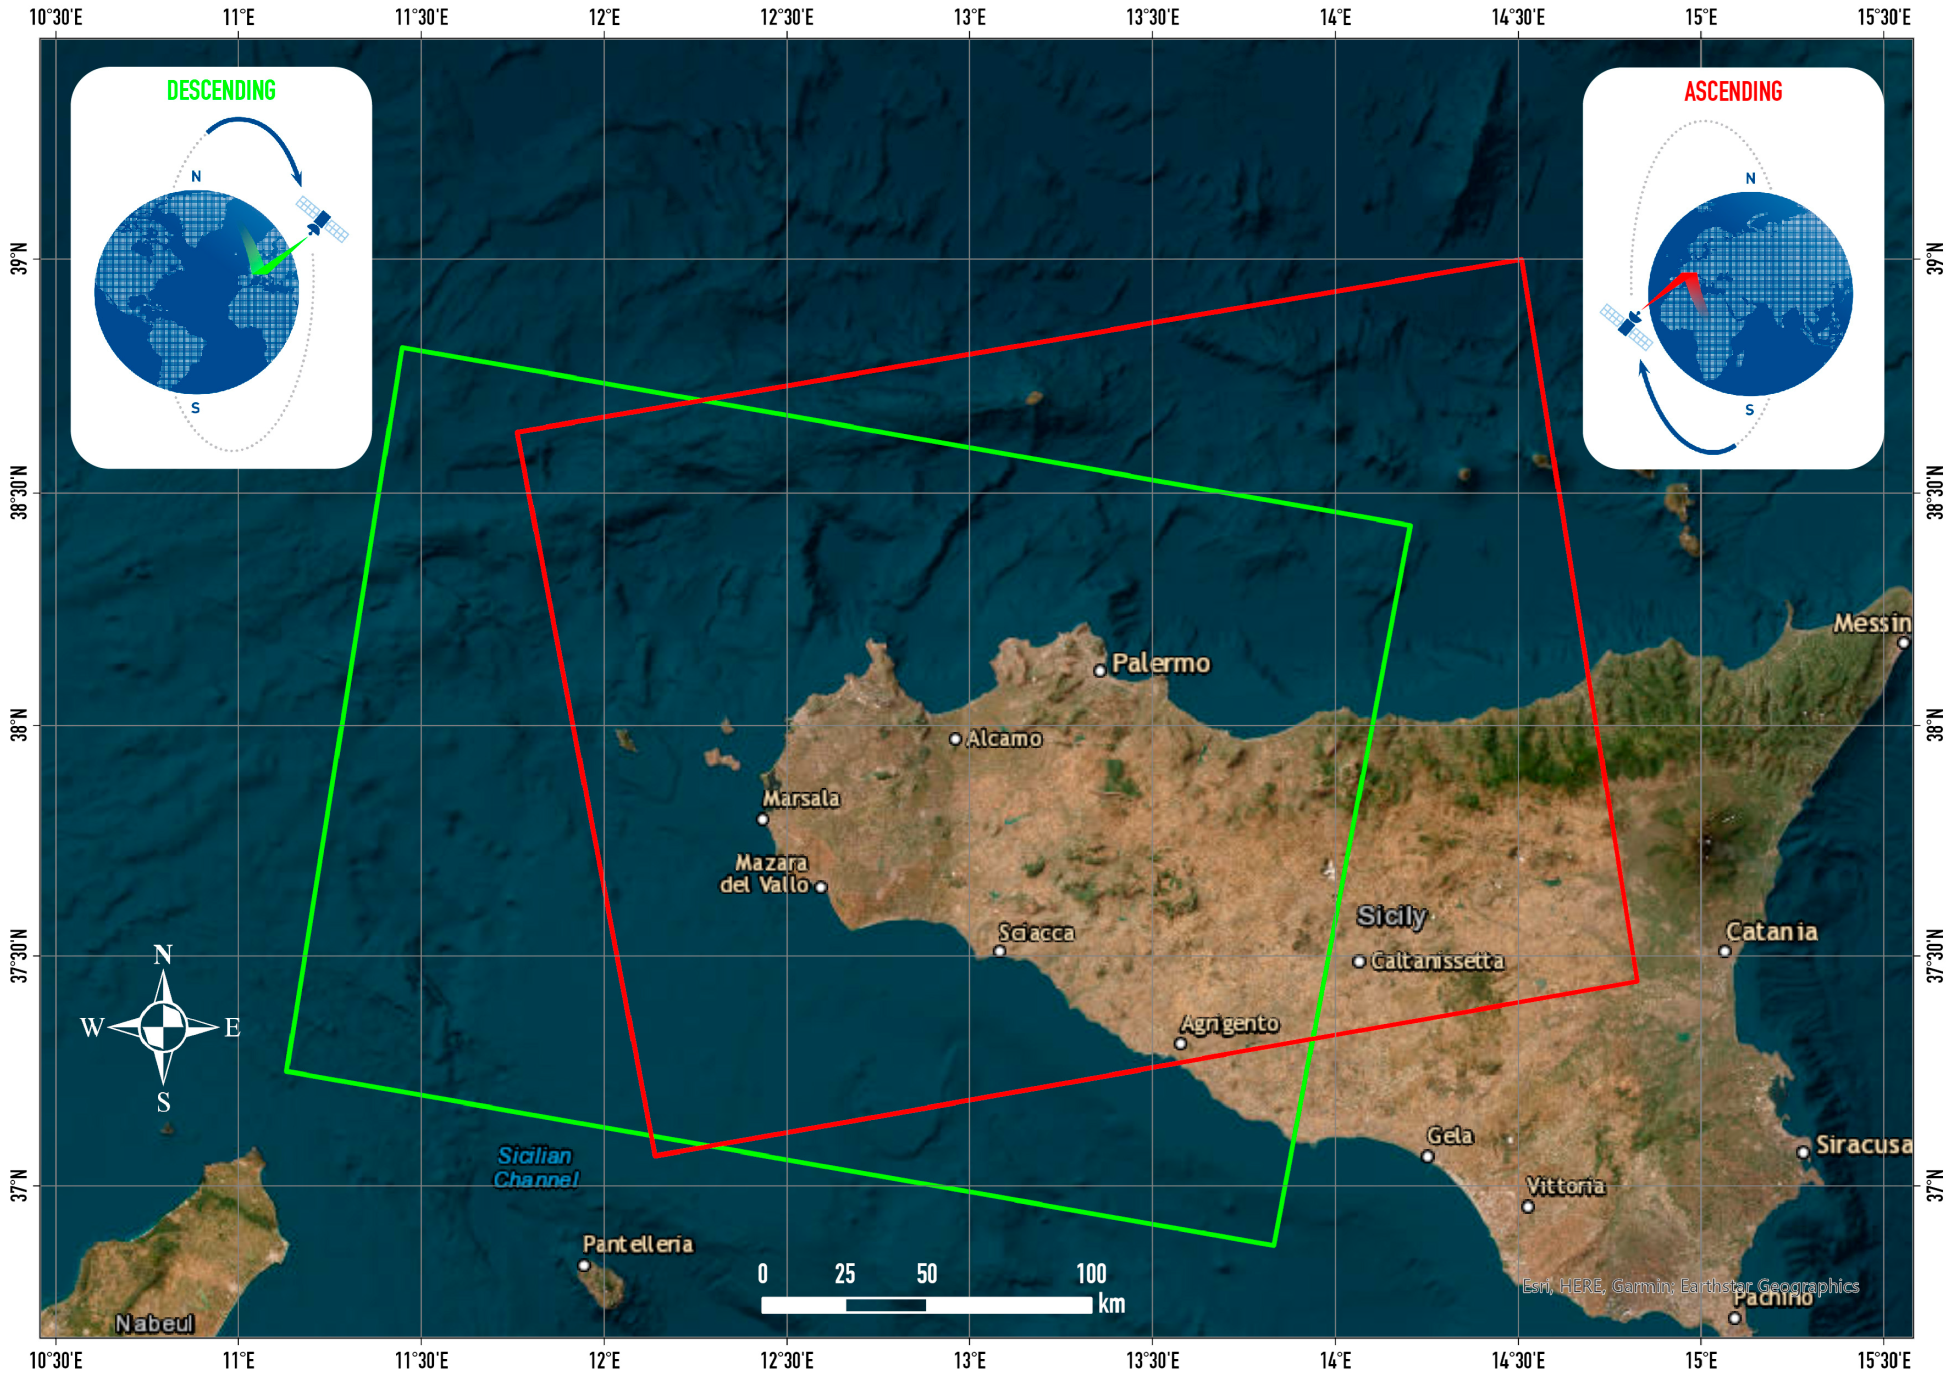
Figure 1. (A) A map of Italy that highlights the island of Sicily and the investigated area (red rectangle). (B) Geological sketch of the study area modified from sheet 595 “Palermo” of the geological map of Italy in scale 1:50,000, released by the Italian Institute for Environmental Protection and Research (ISPRA).
Geosciences 13 00298 g001
Figure 2. (A) Modified sketch of the sheet 595 “Palermo” of the geological map of Italy in scale 1:50,000, released by the Italian Institute for Environmental Protection and Research (ISPRA), on which are outlined the paleo-channels filled by urban waste materials; thick black line is the cross-section. (B) Cross-section along the track A–A′ on (A), modified and simplified from Liguori et al. (2002) [44]. Legend: 1. Waste urban material and buried alluvial deposits. 2. Upper Palermo Calcarenites. 3. Lower Palermo Calcarenites. 4. Yellowish sandy and calcarenite complex. 5. Grey silty sand complex. 6. Deformed argillites and quartz-arenites pre quaternary bedrock. Red, thick line is a normal fault. Reverse triangle and cyan lines are the boreholes used to reconstruct the cross-section.
Geosciences 13 00298 g002
Figure 4. Sentinel-1 satellite swaths along ascending (red) and descending (green) orbit.
Geosciences 13 00298 g004
Figure 5. Connection graphs for: (A) Ascending and (B) descending Time-Baseline plots (indicates the normal satellite distance in meters and acquisition dates); (C) ascending and (D) descending Time-Position plots (indicates the normal satellite distance from the master in meters for each slave acquisition and acquisition dates). A diamond represents the acquisitions: red = discarded, green = valid, yellow = master.
Geosciences 13 00298 g005
Figure 6. East–West (A) and vertical (B) PS velocity maps. The points are divided into 3 colored classes according to their velocity. In the vertical map, the red dots highlight area affected by subsidence phenomena.
Geosciences 13 00298 g006
Figure 7. Extraction from the vertical component map of PSs with vertical negative velocity < −1 mm/Y plotted on the two historical images previously described and cited.
Geosciences 13 00298 g007
Figure 8. Vertical component time series of 3 PSs. Red dots represent PSs with velocities between −5.85 and −1 mm/year.
Geosciences 13 00298 g008
Figure 9. PSs Palermo WebApp implemented by authors of this work using ArcGIS online suite. The points in the map are the PS on the E-W and Vertical components. The Two graphs show the time series of the selected PS in the map.
Geosciences 13 00298 g009
Figure 10. (A) Three-level hazard building map of the historical center of Palermo based on the structural state of decay according to Carta 2010. (B) Comparison between the location of very unsafe building according to Carta 2010 (red polygon), the position of PSs with velocities higher than −1 mm/Y (blue dots) and historical buildings examined by Todaro 2006 (yellow circles with red outlines represent damaged buildings, those with green outline are healthy and safe).
Geosciences 13 00298 g010
Table 1. The number of scenes and relatives path of Sentinel-1 satellites along both orbits.
SatelliteOrbitPathNr. Scenes
Sentinel-1Ascending11746
Descending2244
Disclaimer/Publisher’s Note: The statements, opinions and data contained in all publications are solely those of the individual author(s) and contributor(s) and not of MDPI and/or the editor(s). MDPI and/or the editor(s) disclaim responsibility for any injury to people or property resulting from any ideas, methods, instructions or products referred to in the content.

