Article

Effect of Pressure Perturbations on CO2 Degassing in a Mofette System: The Case of Hartoušov, Czech Republic

1
GFZ German Research Centre for Geosciences, 14473 Potsdam, Germany
2
Institute of Hydrogeology, Engineering Geology and Applied Geophysics, Faculty of Science, Charles University, 128 00 Prague, Czech Republic
3
Institute of Spa and Balneology, 360 01 Karlovy Vary, Czech Republic
4
Institute of Geosciences, University of Potsdam, 14476 Potsdam, Germany
*
Author to whom correspondence should be addressed.
Geosciences 2023, 13(1), 2; https://doi.org/10.3390/geosciences13010002
Submission received: 28 October 2022 / Revised: 2 December 2022 / Accepted: 14 December 2022 / Published: 21 December 2022
(This article belongs to the Special Issue Geogases in Fault Zones)

Abstract

:
Mofettes are gas emission sites where high concentrations of CO2 ascend through conduits from as deep as the mantle to the Earth’s surface and as such provide direct windows to processes at depth. The Hartoušov mofette, located at the western margin of the Eger Graben, is a key site to study interactions between fluids and swarm earthquakes. The mofette field (10 mofettes within an area of 100 m × 500 m and three wells of 28, 108, and 239 m depth) is characterized by high CO2 emission rates (up to 100 t/d) and helium signatures with (3He/4He)c up to 5.8 Ra, indicating mantle origin. We compiled geological, geophysical, geochemical, and isotopic data to describe the mofette system. Fluids in the Cheb basin are mixtures between shallow groundwater and brine (>40 g/L at a depth of 235 m) located at the deepest parts of the basin fillings. Overpressured CO2-rich mineral waters are trapped below the mudstones and clays of the sealing Cypris formation. Drilling through this sealing layer led to blow-outs in different compartments of the basin. Pressure transients were observed related to natural disturbances as well as human activities. External (rain) and internal (earthquakes) events can cause pressure transients in the fluid system within hours or several days, lasting from days to years and leading to changes in gas flux rates. The 2014 earthquake swarm triggered an estimated excess release of 175,000 tons of CO2 during the following four years. Pressure oscillations were observed at a wellhead lasting 24 h with increasing amplitudes (from 10 to 40 kPa) and increasing frequencies reaching five cycles per hour. These oscillations are described for the first time as a potential natural analog to a two-phase pipe–relief valve system known from industrial applications.

1. Introduction

Mofettes are gas emission sites where high concentrations of carbon dioxide (CO2) ascend together with other volatiles through conduits from as deep as the mantle to the Earth’s surface. As such, they provide direct windows to metamorphic and magmatic processes at depth [1]. Despite the obvious potential, systematic studies of mofettes to monitor magmatic processes at depth are rare [2]. Often, observed anomalies and transients are difficult to decipher. For instance, transients in fluid properties of mofettes may occur long after seismo-magmatic events have been indicated by, e.g., earthquake swarms [3]. It is not really known how long it takes for CO2 to ascend through the mantle and crust, and where models have been suggested, the propagation times vary extremely between them [4]. According to other reports, gas flow transients occur at the surface without any indications of deeper processes [5]. To understand these and other enigmas of gas flow and composition anomalies, a comprehensive understanding of the fracture network and its physico-chemical properties in the uppermost few hundred meters is needed. In this zone, deep volatiles either mix with meteoric fluids or become trapped under sedimentary seals. In the ICDP project “Drilling the Eger Rift: Magmatic fluids driving the earthquake swarms and the deep biosphere”, we planned three sampling drillings and monitoring wells at one of the most active mofettes in the NW Bohemia/Vogtland region (Czech Republic/Germany) [6,7]. The cores and data collected since 2016 provide a unique opportunity to address the key questions on how mofettes work and how the uppermost 200 m influences the measurements.
Moreover, this research project will contribute significantly to enhancing our knowledge on carbon capture and storage (CCS) systems, a key component that is proposed to remedy the problem of increased atmospheric CO2 [8]. Active mofettes in the NW Bohemia/Vogtland region represent a natural analog to study CCS systems, e.g., the impact of CO2 leakage from CCS systems [9]. Such analogs have already been studied for other geological settings. For instance, in shale reservoirs characterized by high temperature and pressure conditions, Jia et al. [10] performed extensive multidisciplinary investigations related to CO2 storage and flow behavior in shale formations. Similarly, Flohr et al. [11] successfully conducted an offshore CO2 leakage simulation experiment, demonstrating that different methods can detect, attribute, and quantify CO2 release.
The NW Bohemia/Vogtland region and the Cheb basin mark the western tip of the Eger Graben and are characterized by recurring earthquake swarms and the emanation of large amounts of mantle-derived CO2 in forms of mineral springs, wet mofettes (i.e., ponds filled with surface water that release free gas, mainly CO2), dry mofettes (i.e., areas of reduced vegetation and dry pools that discharge great amounts of CO2) [12,13], and soil degassing sites ([14,15] and Figure 1). The Cheb basin is the westernmost and also the youngest part of the Tertiary intra-platform Eger Rift structure of northwest Bohemia [16]. The Neogene sedimentary basin filling reaches a thickness of up to 300 m at its eastern edge. The thickness generally decreases towards the W as well as the S. In the area of Františkovy Lázně, a Tertiary sediment thickness of 233 m was documented (drill hole BJ-1). Within the basin, partially elevated areas were documented. These ridges obviously have a significant impact on the hydrodynamic and pneumatic conditions in the lower parts of the basin filling. The last phase of the volcanic activity of the basin occurred during the Pleistocene, manifested by the Komorní hůrka (Kammerbühl) volcano. The main tectonic direction (ENE–WSW) of the Eger Rift is partially suppressed at the expense of almost perpendicular faults, including the deep Mariánské Lázně fault. Tectonic structures with several directions are manifested both within the basement rocks and the sediment fillings: NW–SE (especially in the area of Soos), WSW–ENE (especially in the area of Františkovy Lázně), as well as older N–S striking faults.
Figure 1 shows the occurrence of seismic swarms (2001–2021, compiled from WebNet and SaxNet catalogues) and nearly 300 CO2-rich springs and mofettes in the NW Bohemia/Vogtland region compiled by Heinicke and Woith [17]. For 74 springs and dry mofettes, a total regional gas flux of 3.6 × 10⁸ mol/a per 1500 km2 had been determined [18], equivalent to 0.03 t/d/km2. However, this number underestimates the total gas flux, as it does not take into account diffuse degassing. Specifically, detailed soil gas surveys in the degassing center of the Cheb basin (one of the three major gas escape centers in the western Eger rift) revealed daily fluxes of up to 97 t CO2 over an area of 0.35 km2 for the Hartoušov mofette [19], leading to 277 t/d/km2, and another 30 t/d per 0.45 km2 in Bublák [20], equivalent to 67 t/d/km2. The isotopic fluid signatures (δ13CCO2 = −2.0 to −4.3 ‰; 3He/4He > 5 RA) indicate mantle origin for the NW Bohemia/Vogtland region [21]. The mantle helium contribution is up to 75% when calculated relative to MORB, but up to 95% relative to sub-continental lithospheric mantle (SCLM) composition. With respect to carbon, a limestone contribution cannot be excluded without analyzing rocks. Both the total gas discharge and the mantle contributions decrease with increasing distance away from the degassing center [18].
Figure 1. (A) Topographic map showing the NW Bohemia/Vogtland region. White circles depict CO2-rich mineral waters; filled circles indicate mofettes. Gray dots show earthquakes above ML ≥ 0.5 between 2000 and 2021. (B) Mofette fields of Bublák, Hartoušov, and Soos within the Cheb basin. Numbers indicate helium isotope ratios ((3He/4He)c in units of RA) according to [18,21,22]. (C) Simplified geological map modified from BGR Hannover black lines—fault zones, MLFZ—Mariánské Lázně fault zone. White squares indicate towns: BB—Bad Brambach, NK—Nový Kostel, FL—Františkovy Lázně, LK—Lázně Kynžvart, ML—Mariánské Lázně, KL—Konstantinovy Lázně. (D) Geological map of the Cheb basin.
Geosciences 13 00002 g001
This study focuses on the Hartoušov mofette field, a key site to investigate the interaction between fluids and swarm earthquakes within the framework of the ICDP-Eger project. The objectives are related to the monitoring setup, the CO2 degassing occurrence, the hydrochemical properties of the fluids at this site, as well as anomalies detected during the first period of observations. We discuss their origin to establish a basic understanding of mantle derived mofettes, providing a unique window to deep geodynamic processes.

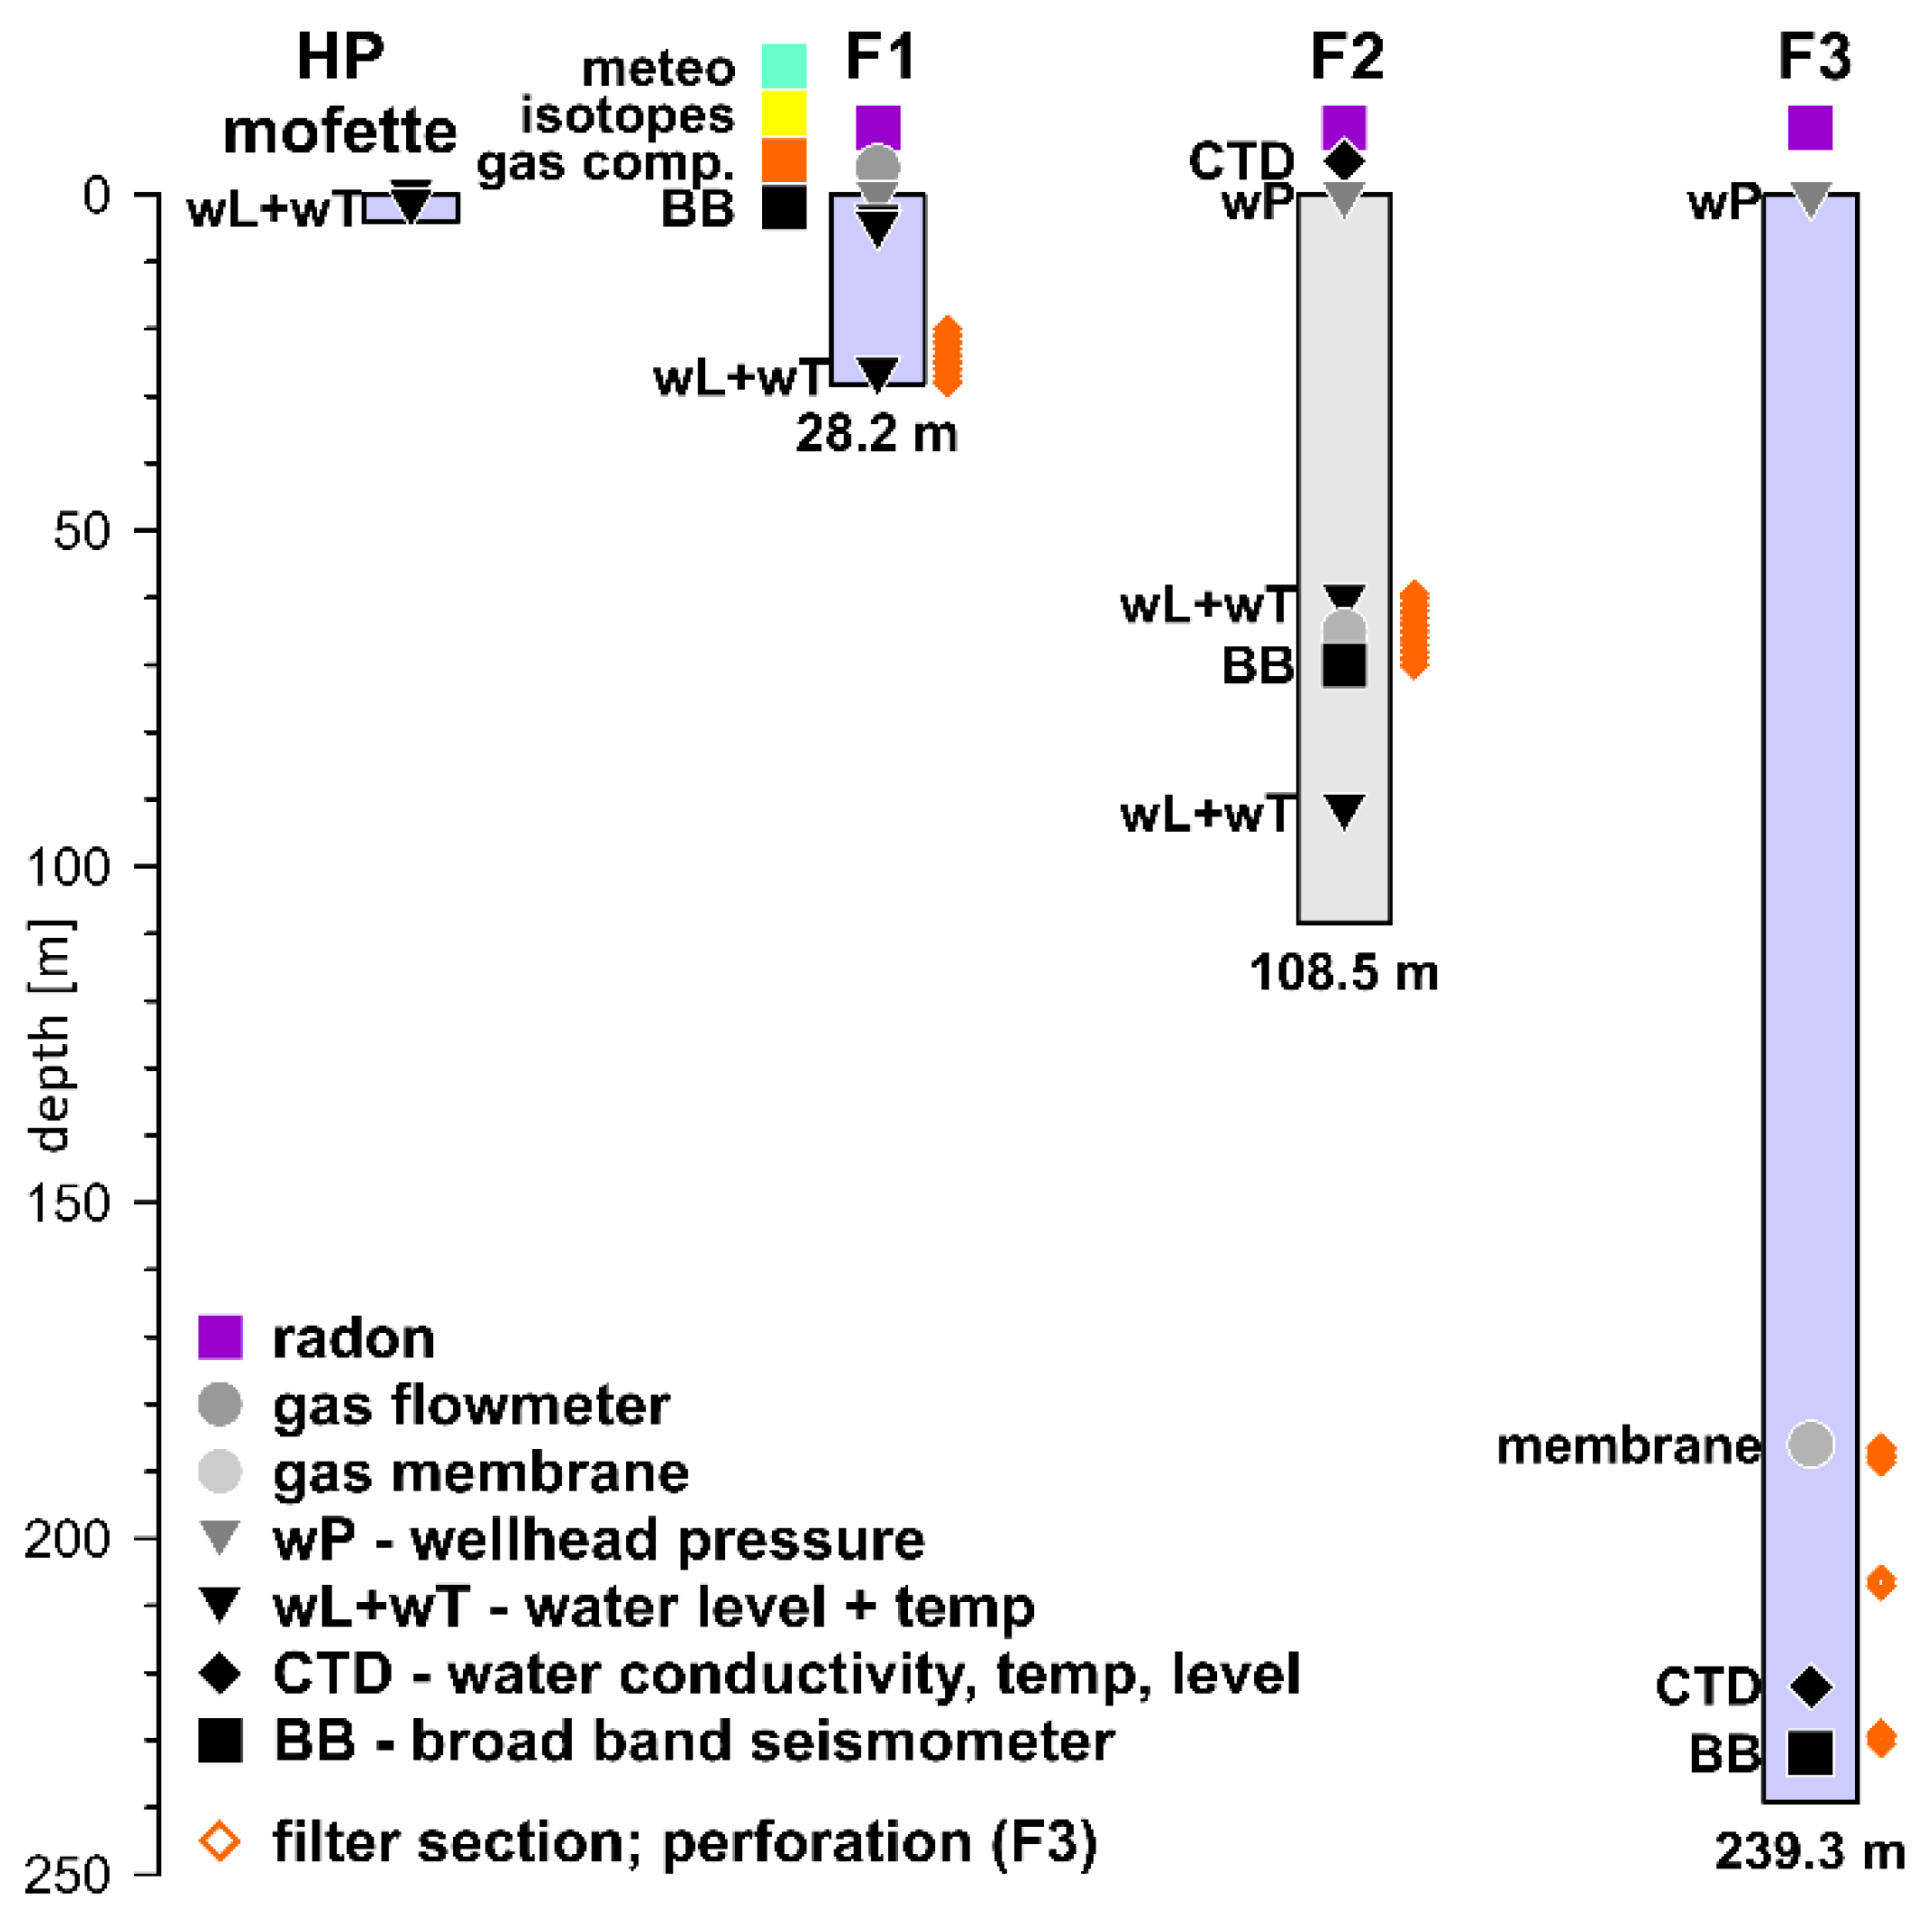
2. Methods and Fluid Monitoring Setup

At Hartoušov, geochemical and geophysical fluid properties are monitored continuously in a set of adjacent boreholes at three different depth levels and at the surface (Figure 2; for details, see Fischer et al. [23] and Woith et al. [24]): F1 (aka H1-31b), F2 (aka HJB-1), and F3 (aka HJB-2) were drilled to depths of 28.2, 108.5, and 239.3 m, respectively. This multi-level setup is designed to provide insights into the cause for temporal variations, possibly related to the admixture of crustal or meteoric fluids to an otherwise steady mantle degassing.
In addition to the continuous monitoring of fluid properties, discrete gas and water samples were systematically collected in situ. Gas samples were analyzed for their chemical (CO2, N2, O2, Ar, He, CH4, CxHy, and H2) and isotopic compositions (noble gases, CO2 and H2O). Details on sampling methods and analytical procedures along with the first results of the gas components are provided by [22]. Radon was measured directly in the field using a scintillation counter as described in [25].
Water temperature, specific electrical conductivity, pH, redox potential, and dissolved oxygen were measured on site. The measured redox value was converted to redox potential EH with respect to a standard hydrogen electrode. The HCO3 concentration was determined by titration with HCl on site. Water samples for anion and cation determinations were filtered with cellulose–acetate filters (pore size 0.2 μm). Two aliquots of 50 mL each were collected; one was acidified with concentrated HNO3 (150 μL per 50 mL) to determine cations, and the other aliquot remained non-acidified to determine anions. Analyses of cation and anion concentrations were performed at the ElMiE-lab (Elements and Minerals of the Earth) at the GFZ, Potsdam. Samples were diluted using Bidest water and ultra-pure reagents. Cations were measured using a 5110 ICP OES (Agilent, Santa Clara, CA, USA) in the acidified samples. Concentrations were calculated by external calibration using single element standards. Intermediate measurement precision is generally within 5%, similar to repeatability, which is regularly tested on in-house standards. Anion concentrations were measured with a Dionex Ion Chromatograph (IC; Thermo Scientific, Waltham, MA, USA) in the non-acidified aliquots. Anions were eluted over a Dionex IonPac AG22 guard and column, which were calibrated using single element standards.
Mineral saturation indices (Table A1) were calculated using PHREEQC [26]. The saturation index (SI) indicates that a fluid is undersaturated (SI < 0), saturated (SI = 0), or oversaturated (SI > 0) with respect to a mineral phase. In other words, a negative SI of a given mineral in, e.g., groundwater will facilitate dissolution of that mineral. A neutral or positive SI indicates that a mineral may remain in equilibrium or precipitate, respectively.

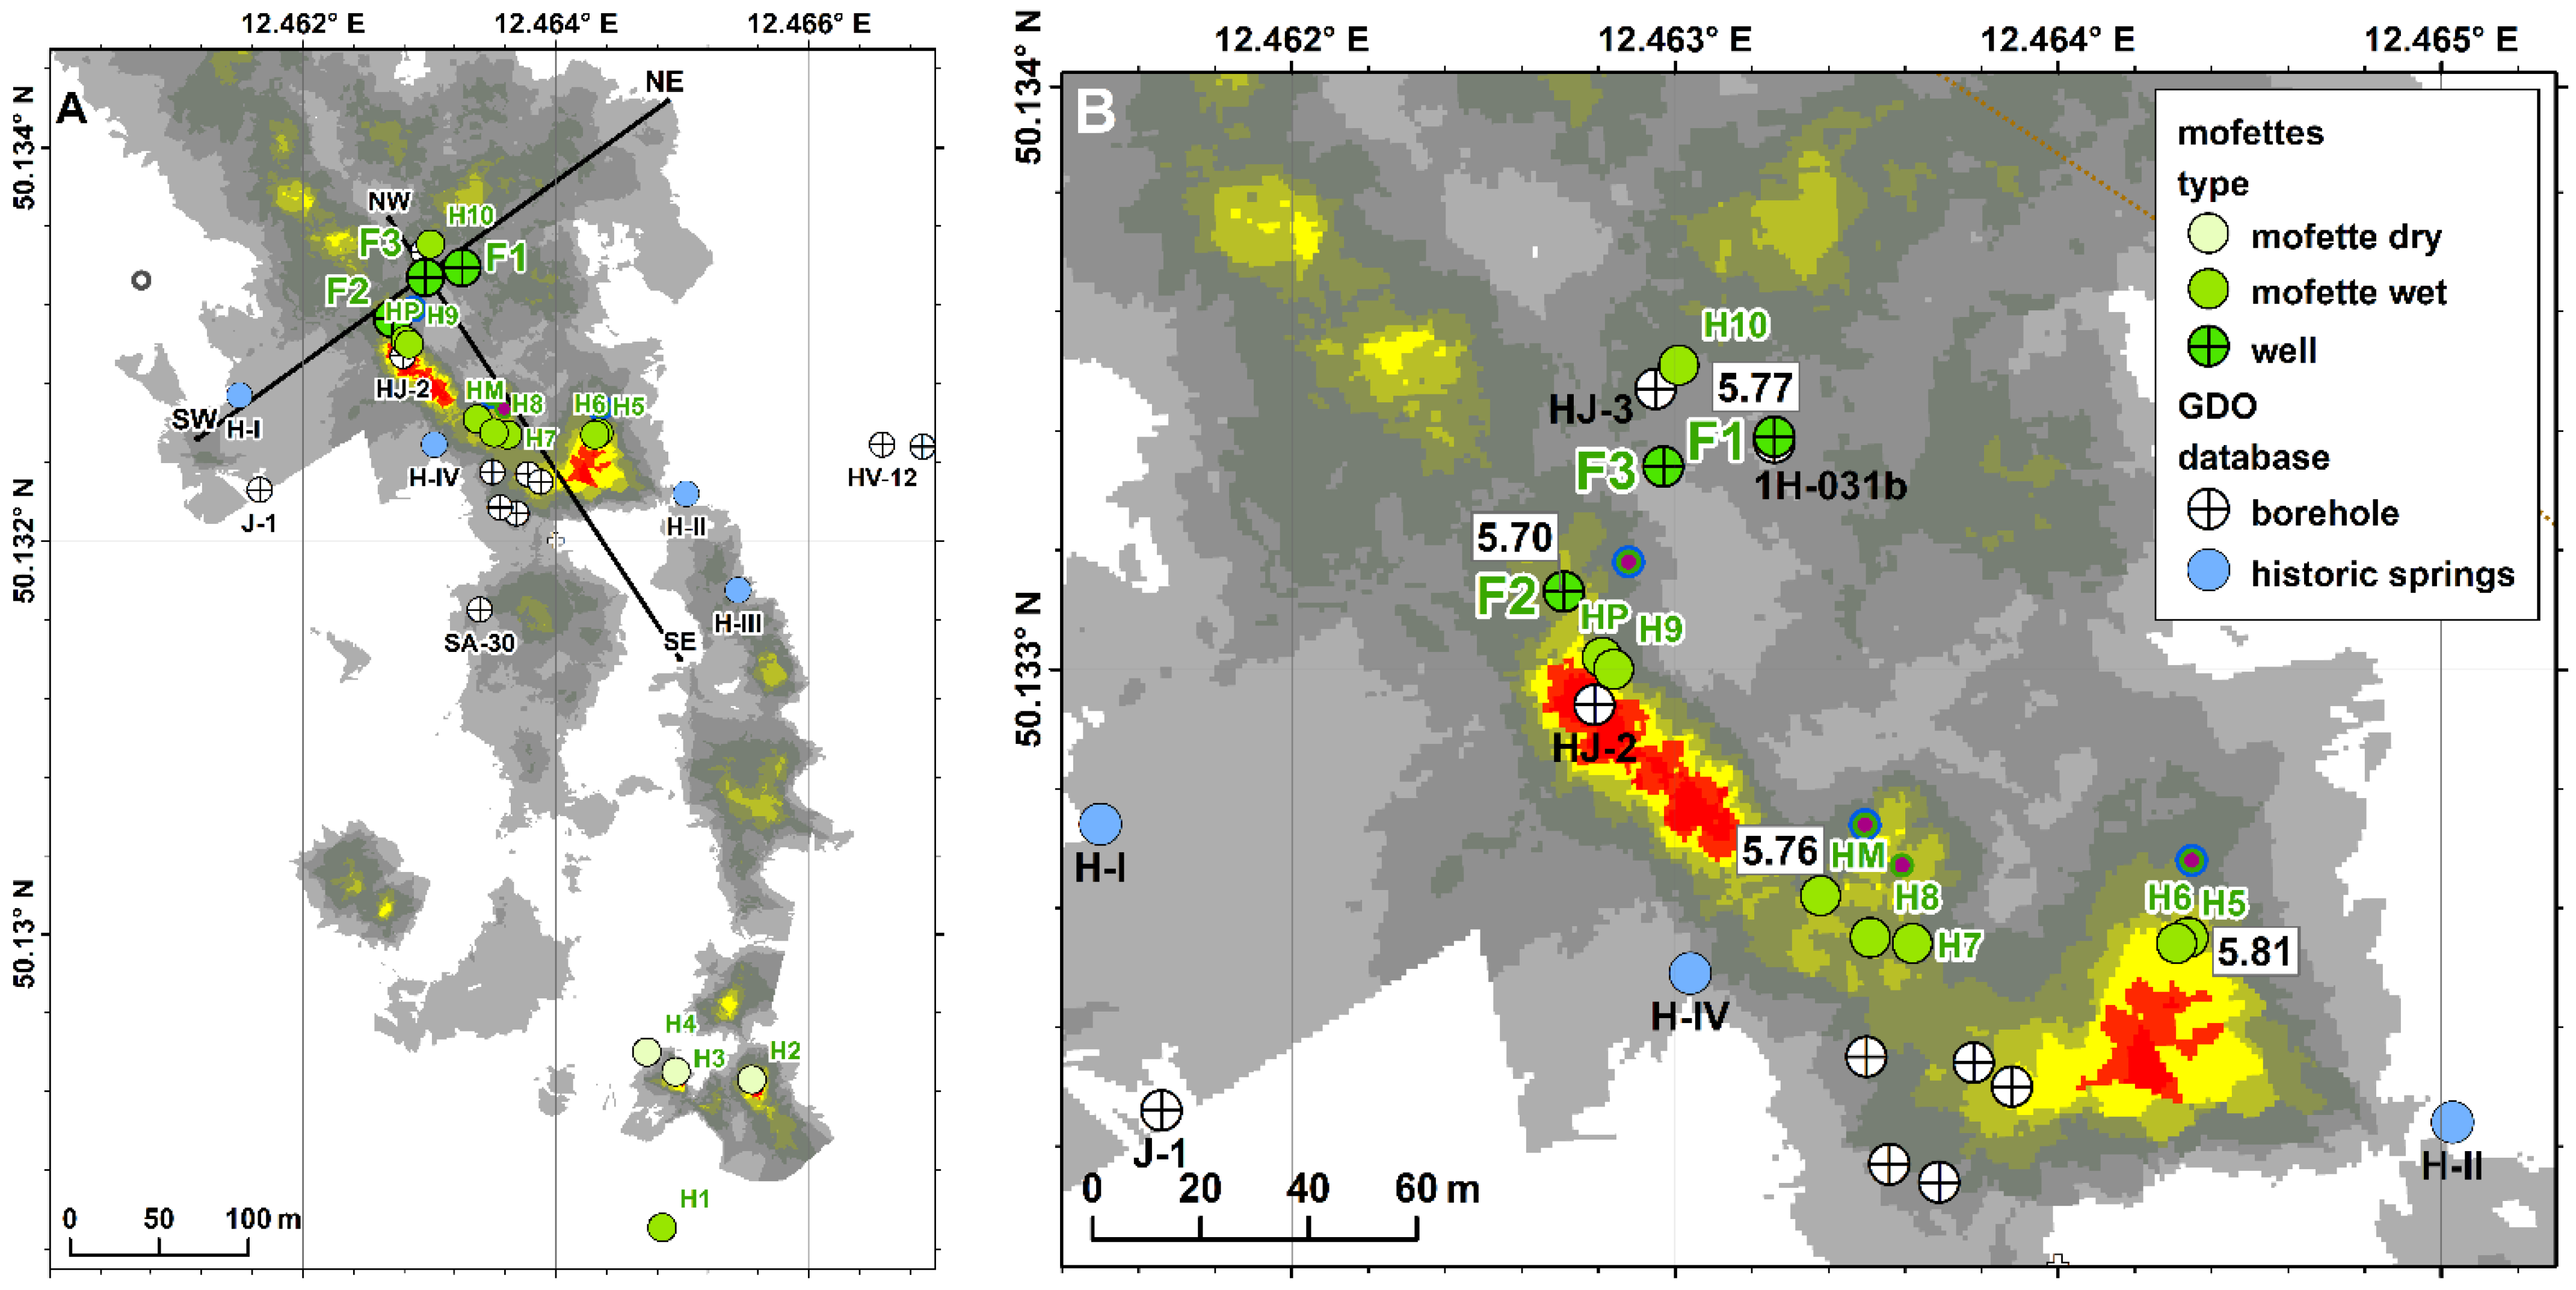
3. Hydrogeology of Hartoušov Mofette and Cheb Basin

The Hartoušov mofette field is located in the eastern part of the Cheb basin. It comprises distinct wet and dry mofettes, and diffusive degassing within an area of about 0.35 km2, with gas flux hot spots of more than 50 kg/d/m2 (compare red areas in Figure 3).

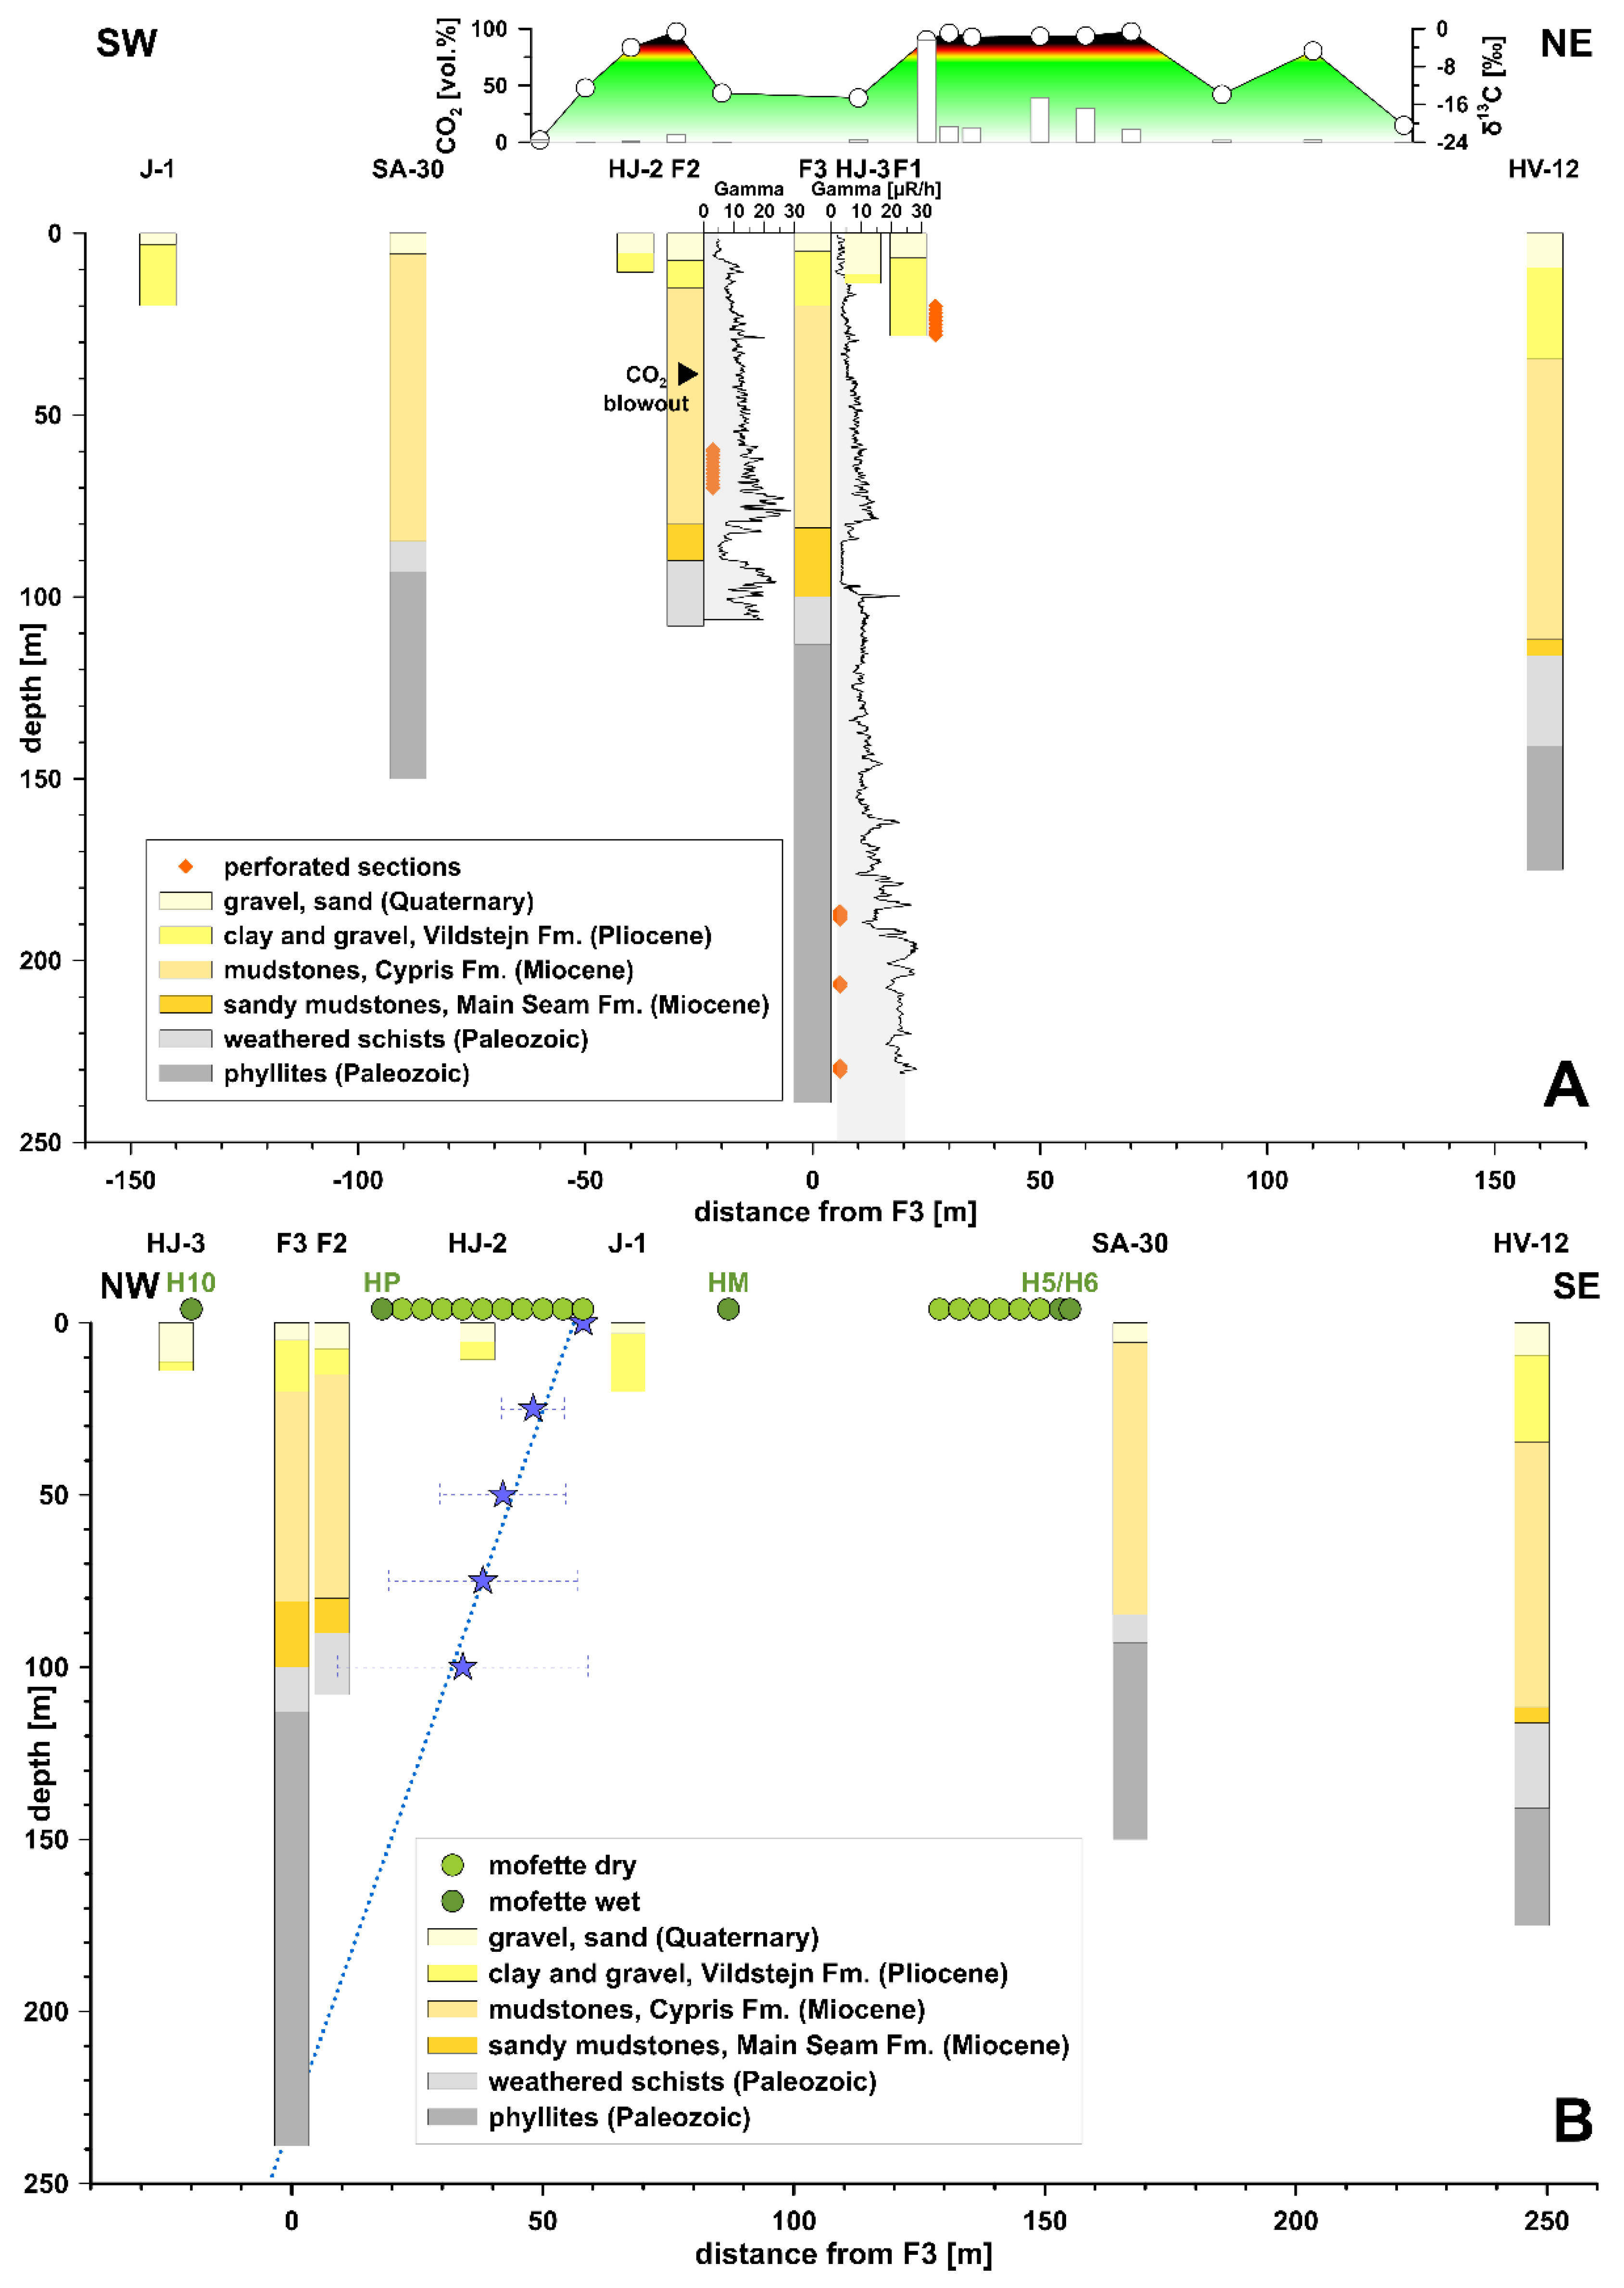
3.1. Geophysical Investigations

During the preparation phase of the drillings, a series of geophysical investigations dedicated to obtaining information about the shallow underground beneath the Hartoušov mofette field were performed. Sandig et al. [28] combined soil gas measurements (CO2, Rn) along a 500 m long profile—parallel to the SW–NE profile shown in Figure 3A at a distance of about 20 m to the north of F3—with electrical resistivity tomography and self-potential methods. High CO2 concentrations were related to positive self-potential anomalies, low soil moistures, and high resistivity, as well as high δ13C values and increased Rn concentrations (see Figure 4A).
Sandig et al. [28] further noted that CO2 ascends from deep geological sources via preferential pathways and accumulates in coarser sediments. Flechsig et al. [27] observed high CO2 soil gas concentrations in areas where the shallow subsurface sediments display elevated contents of Corg and pyrite.
Seismic noise measurements were applied to detect fluid channels below the Hartoušov mofette using matched field processing techniques [30,31]. Flores Estrella et al. [31] observed changes in the spatial degassing patterns from day to day. Umlauft and Korn [30] located channel-like structures below the known mofettes (an example from the northern mofette field is shown in Figure 4).

3.2. Hydrogeologic and Isotopic Inventory

The Hartoušov mofette field is located in the protection zone of natural healing resources of Františkovy Lázně, just 8 km to the west of Hartoušov village. The hydrogeological, hydrogeochemical, and geochemical inventory of the Hartoušov mofette field is summarized in Table 1 and Figure 4, Figure 5 and Figure 6. Data from Soos Císařský pramen, Kyselecký hamr, and Františkovy Lázně are also presented here and used for comparison (chemical and isotopic data of Hartoušov mofette HM, Hartoušov F1, and Hartoušov F2 are taken from Daskalopoulou et al. [22]). Information about the analytical processes used for the determination of the chemical and isotopic gas components and the uncertainties for all the presented (published and unpublished) data can be found in [22].
A pumping test performed immediately after drilling F2 revealed a Na-HCO3-SO4-type groundwater with a total mineralization of 6300 mg/L, a pH of 6.67, and a dissolved CO2 concentration of 1628–1892 mg/L. Highly mineralized (40,900 mg/L) groundwater of Na-SO4-HCO3-Cl type—which is similar to waters of Františkovy Lázně—was discovered in the crystalline rocks in the F3 borehole. A dissolved CO2 concentration of <90 mg/L was determined for F3, compared to 2580 mg/L for Františkovy Lázně.
For the Cheb basin, three groups of groundwater types can be distinguished on the basis of major ion concentrations (Figure 5A). The first type (Ca-HCO3) is represented by the waters of Hartoušov F1 and the natural mofettes HM, Bublák, and Smrčina. These waters have acidic pH values between 3.9 and 5.3 along with low conductivities (<400 µS/cm). Hartoušov F3, Soos Císařský pramen, and Soos mofette, as well as Hartoušov mofette H5 belong to the second type of waters (Na-Cl-SO4) with a pH between 5.4 and 6.1, and conductivities between 1849 and 6950 µS/cm. F3 is characterized by high conductivities (43,000 μS/cm) and elevated temperatures of 20.5 °C. Hartoušov F2, Kyselecký hamr, and Wettinquelle (located in Bad Brambach) belong to the third type of waters (mixed Ca-Na-HCO3) and are characterized by pH values between 5.8 and 6.7 and conductivities between 1880 and 7850 μS/cm. Immediately after the drilling of F2 in 2016, the sampled water was of Na-Cl-SO4 type (see symbol labeled F2 in Figure 5A), while newer samples plot in the field of the third group. Figure 5B, where Na+ is plotted vs. Cl concentrations, reveals that the fluids of the Cheb basin plot on a mixing line between a shallow water end-member F1 and the brines of F3. The Cl concentrations range from 10 mg/L to nearly 5000 mg/L (for comparison, seawater has typically 19,400 mg/L Cl). The water of mofette H5 has a specific electrical conductivity of 1849 µS/cm. This is too high for a classical wet mofette, which is usually defined as a site where CO2 degasses through surface water (e.g., puddles, ponds, rivers, lakes). Further, as can be seen from the diagram shown in Figure 5B, the water of H5 is a mixture of a shallow-water end-member (like F1) and a deep-water end-member (F3). The same applies to the mofettes in Soos.
Figure 5. Chemical composition of Cheb basin fluids (circles—mofettes, diamonds—mineral springs, squares—wells). (A) Langelier–Ludwig diagram [32] showing element ratios in mmol(eq)%, (B) Na+ vs. Cl concentrations plot on a mixing line between the end-members F1 and F3.
Geosciences 13 00002 g005
Evaporites (gypsum, anhydrite, halite) are undersaturated, which reflects their absence in the study area. In contrast, both dolomite and calcite are commonly found in the western Cheb basin [33]. The negative SI, indicating undersaturation with respect to carbonate minerals, can be attributed to the natural upwelling of CO2-rich subsurface fluids. Note that shortly after drilling, the waters of F2 and F3 were both oversaturated with respect to calcite and dolomite. Silica minerals (chalcedony and quartz) are oversaturated in these groundwaters, and hence play an important role in regulating the groundwater chemistry.
CO2 is the dominant gas species in the Hartoušov mofette field, with concentrations that exceed 99%. The remaining gas components comprise mostly N2 and O2, which are usually below 0.9%, while Ar, He, CH4, and CxHy are found in trace amounts. Hydrogen is often below the detection limit [12,18,21,22]. It is worth noting that the amount of atmospheric gases varies in correspondence to the depth of the sampling site; the deeper the sampled gas is found, the lower the air content is.
The He isotope composition in the two boreholes F1 and F2 and the mofettes HM and H5 (surface expressions) is between ~5.4 and 5.9 RA, typical for the sub-continental lithospheric mantle (SCLM) [21,22]. The δ13CCO2 data (−2.4 to −1.3‰ vs. V-PDB) reflect mantle-derived CO2 [12,18,21,22].
The chemical and isotopic compositions mentioned above are considered background values as they occur in seismically quiescent periods. Variations in gas flow, water temperature, and seismic activity may induce transient changes in the chemical and isotopic composition of the gases. For instance, a significant increase in the gas flow was observed at Hartoušov after the 2014 earthquakes [34]. An increase in the 3He/4He ratio, and thus of the SCLM contribution from 38% in 1993 up to 89% in 2016, was also observed in the eastern Cheb basin [21]. Moreover, during the seismically quiescent drilling period of F3, gas flow changes at F1 resulted in fluctuations in the chemical composition of the gases (solubility differences) and may have led to higher δ13CCO2 values [22].
Higher CO2 concentrations with respect to Hartoušov are observed at Soos Císařský pramen and Kyselecký hamr. These elevated CO2 contents are mirrored by the depleted chemical composition of the minor components. For instance, He in Hartoušov mofette HM is 20.3 μmol/mol, while in Soos Císařský pramen, it is 0.50 μmol/mol (Table 1). Isotopically, gas within the Soos area has a lower mantle He contribution (~52% considering an SCLM end-member), while CO2 indicates a mixed mantle–limestone origin.
Figure 6. Hydrogeological inventory of the Hartoušov mofette field. Shown are fluid properties of wells and mofettes (site IDs are given at the top of the figure) along a NW–SE profile. The locations of the wells and mofettes are shown in Figure 3 (same IDs). Values are given for gas and water samples collected on 3/4 September 2019. Carbon isotope values are given in δ13CCO2 vs. V-PDB (‰).
Geosciences 13 00002 g006
The sketch in Figure 6 refers to the situation before the F2 borehole had to be re-designed due to safety issues in 2019 (compare to the recent technical setup in Figure 2). Since the drilling of the F2 well in April 2016, the wellhead pressure remained rather constant around 500 kPa. In October 2016, an additional pressure sensor was installed at a depth of 94 m, showing a pressure of 900 kPa. From this, we concluded that the well was partly filled with water (40 m of water above the borehole sensor) and that the headspace was occupied by a gas column of 50 m.

4. Effect of Natural Pressure Perturbations on CO2 Degassing

In the following, we compare the impact of rain and earthquakes on the degassing of the mofette system. While rain is affecting the surface area and has presumably only short-term effects, it is crucial to distinguish external signals from those caused by the underground processes.

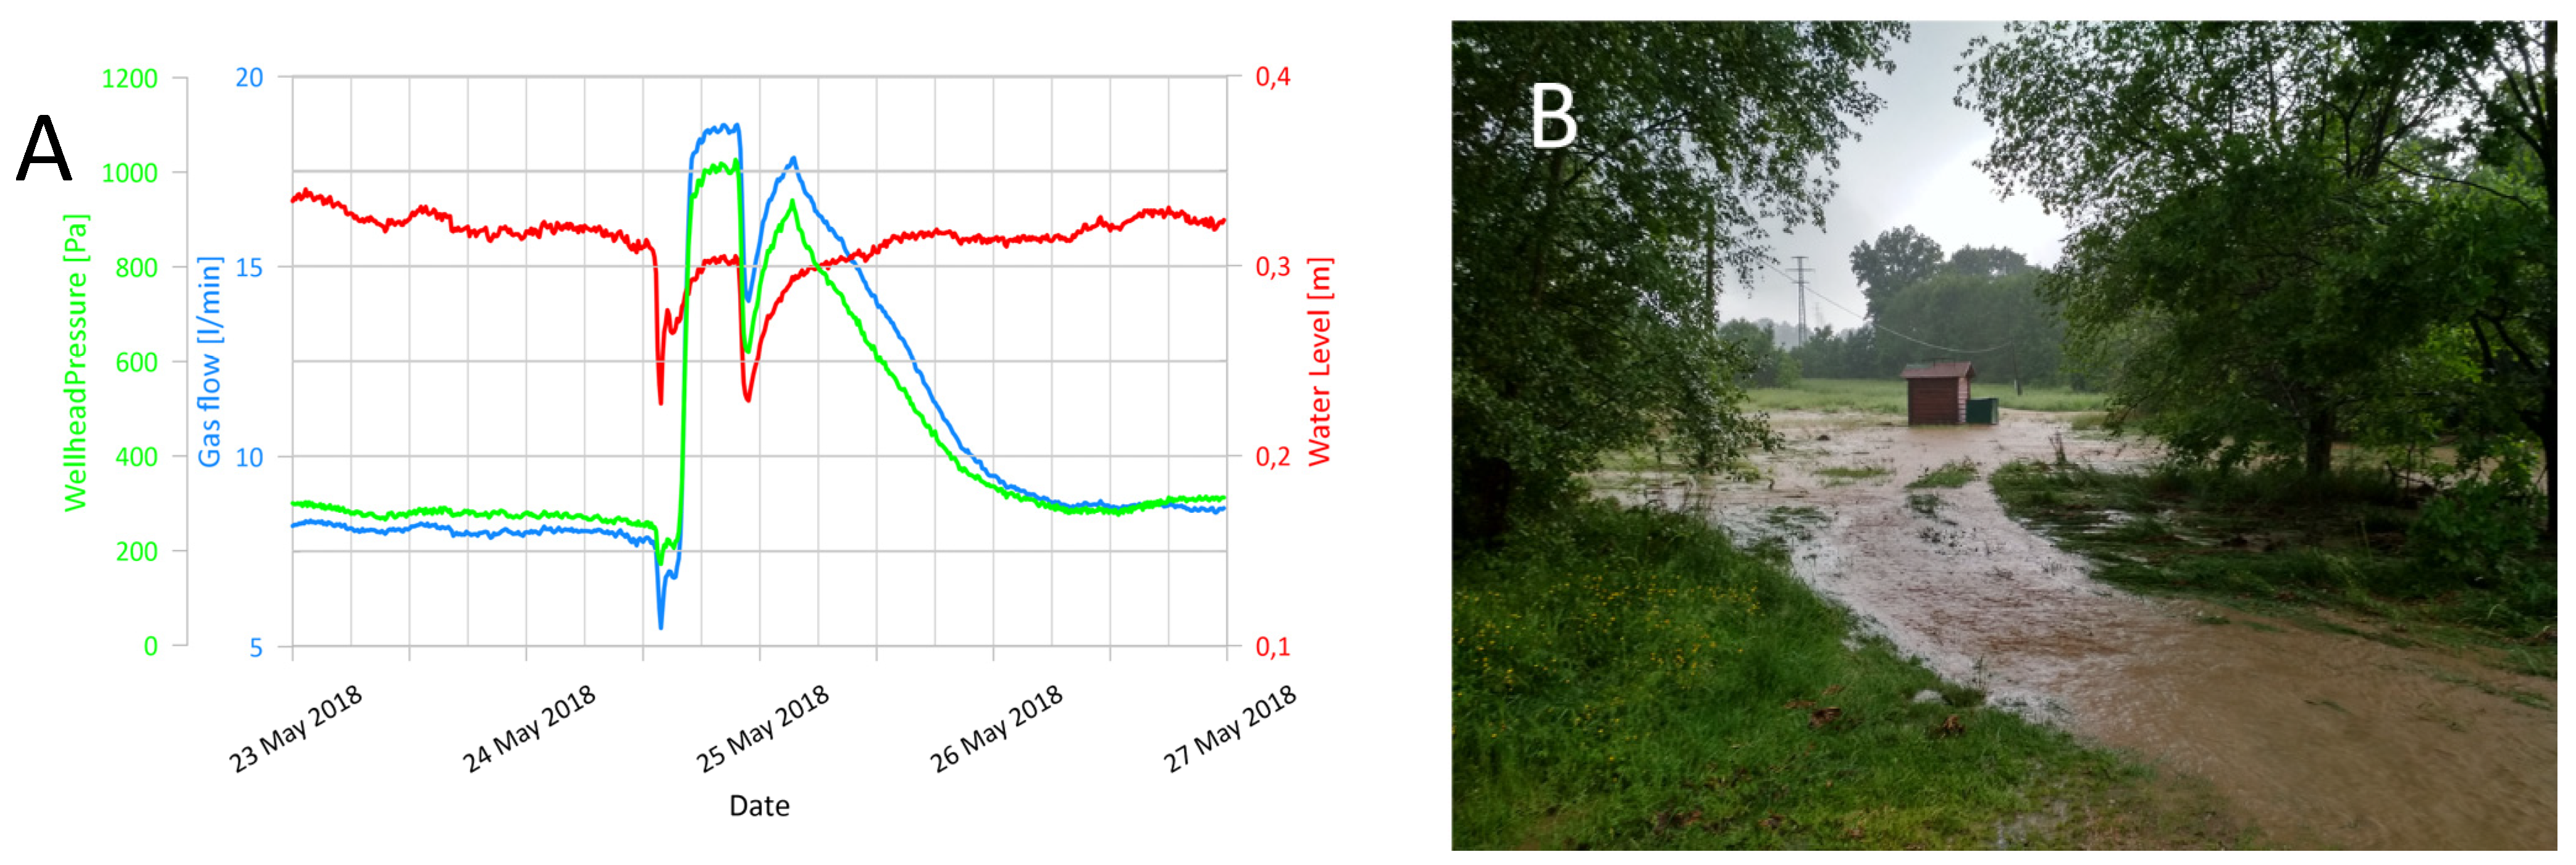
4.1. Rain-Induced Pressure Transients

Heavy rain on 24 May 2018 caused flooding of the Hartoušov meadow, resulting in a water level increase of 50 cm in the mofette HP (mofette with an iron pipe located about 10 m SSE of the wooden hut in Figure 7B) and an abrupt increase in the gas flow from 7 to 17 L/min in borehole F1. Contemporarily, the water level in the F1 well dropped by 10 cm (Figure 7A). The F2 borehole reaction (not shown) was very weak compared to F1.
High water level in the nearby meadow likely closed small escape paths for gas, causing almost three times higher measured gas flow through the well and a corresponding response of wellhead pressure (compare similar shapes of green and blue lines in Figure 7A). Two small negative anomalies on all three measured values cannot be resolved, limiting possible interpretations, due to the fast and turbulent flooding behavior that exceeds minimum sampling intervals of 10 min. A possible cause might be the closing and re-opening of gas leakage pathways.

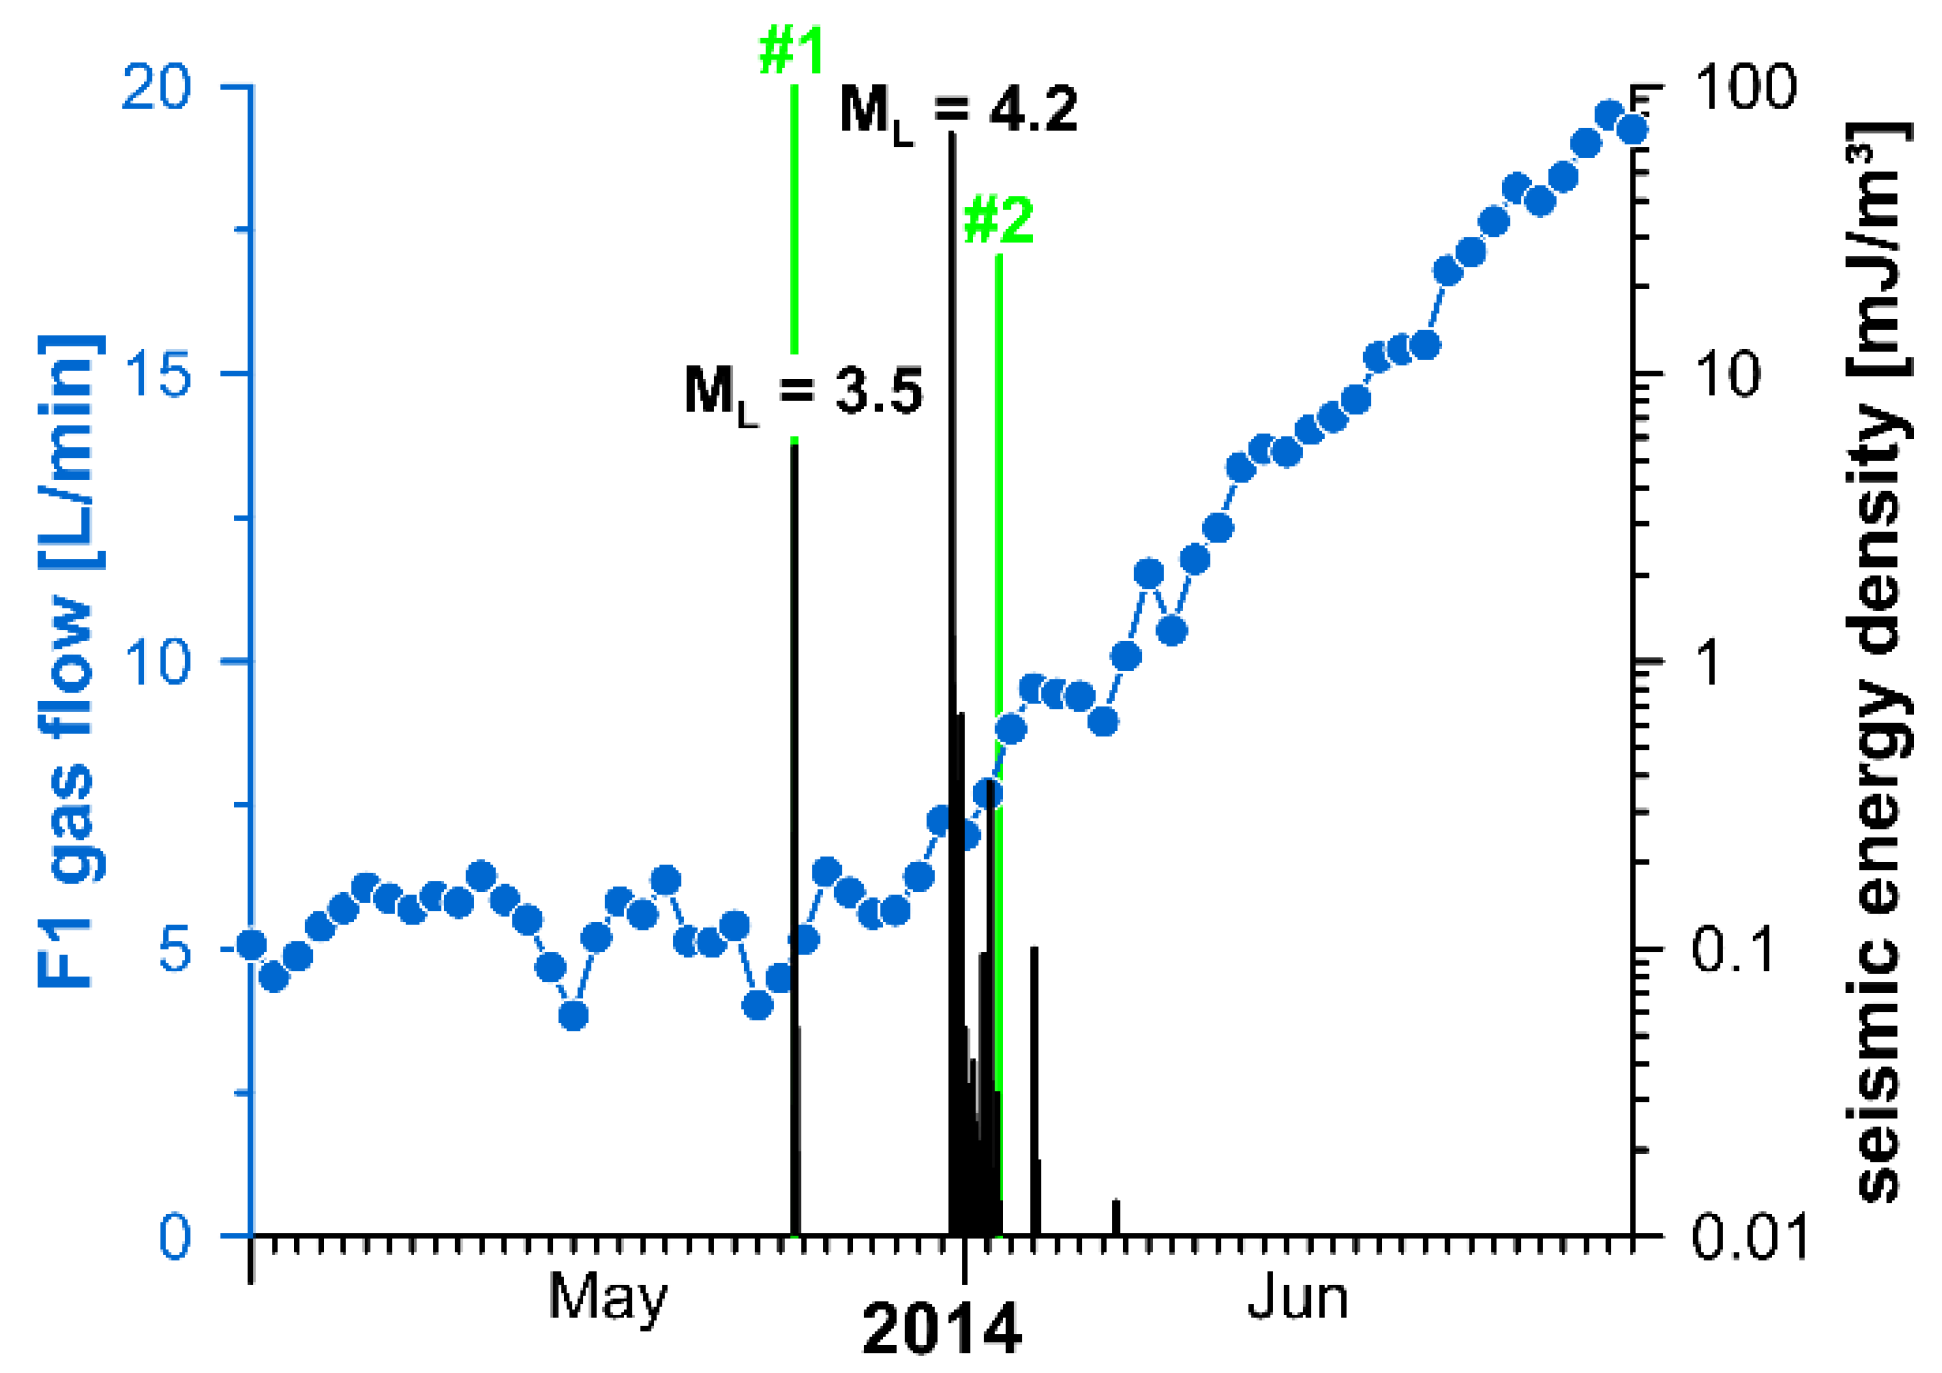
4.2. Earthquake-Induced Gas Flow Transients

The most pronounced anomalies of gas flow in Hartoušov were observed during the 2014 earthquake swarm, when the CO2 flow in the F1 borehole (which was the only one existing at that time) increased from the pre-seismic rate of less than 10 L/min to more than 40 L/min four months after the beginning of the swarm [23,34]. The flow rate started to rise four days after the first swarm event, which was also the strongest one (ML 4.2) with a hypocenter depth of 9 km and an epicentral distance from Hartoušov of 10 km. After reaching a maximum, the flow slowly decreased for the following four years, reaching pre-seismic levels in 2018. This behavior is consistent with Sibson’s fault valve model [35], suggesting that the earthquake rupture breached a sealing layer at the hypocenter depth, which released fluid from a relatively low-permeable lower crust [34]. Similar behavior was observed during the 2008 earthquake swarm, which occurred at the same fault patch as in 2014. It is of interest to mention that the average flow rate for the 4-year decay period was about three times the pre-seismic level. Applying this to the whole Hartoušov mofette field and considering an average daily release of 60 tons of CO2 [19], an excess of 175,000 tons of CO2 released by the 2014 earthquake swarm from the lower crust during the four years decay period is estimated for this mofette field.
The fault valve hypothesis requires the opening of a valve in the hypocentral region and the subsequent diffusion of a pressure front through the crust. Another possible explanation for the increase in the gas flow would be a dynamically triggered response of the local hydrogeological system to the passing seismic waves. Since the observed increase in flow rate was not very sharp, it is difficult to determine the exact beginning of the pressure transient. We revisited the 2014 event and applied a statistical test to determine the breaking point(s) in the gas flow data using the code of Zeileis et al. [36]. The result is shown in Figure 8 together with the daily gas flow rate data from F1 and the seismic energy density for the site Hartoušov calculated according to Wang and Manga [37].
The analysis suggested two significant breaking points: #1 on 23 May 2014, one day before the first swarm event (24 May 2014 14:35, ML = 3.5, distance 10.5 km, depth 9 km), and a less relevant #2 on 2 June 2014, at the end of the swarm activity. The strongest event of this swarm occurred on 31 May 2014 10:37 with ML = 4.2 at a distance of 10 km and a hypocentral depth of 8 km. The following mechanisms could explain the gas flow increase: (1) re-adjustment of the head gradient due to increased permeability by removing bubbles from the pore space (see Roeloffs [38]), (2) advective overpressure due to rising of the gas bubbles [39], and (3) triggering of the degassing of local oversaturated fluids. All three options are feasible given the hydrogeological situation at Hartoušov mofette. Similar observations were described and modeled from an artesian well in Armenia, which responded repeatedly to distant earthquakes (see Woith et al. [40], Wang et al. [41]). Additionally, the shape of the anomalies including the recovery phase is similar to the ones described in Fischer et al. [34]. The differences in the time scales—several months vs. several years for the recovery—might be related to different permeabilities of both aquifers: the Armenian site is characterized by high permeability due to abundant fractured rocks, whereas Hartoušov is characterized by relatively low permeabilities within sedimentary and metamorphic rocks.
At this stage, we do not have a clear favorite. Both mechanisms, the fault valve and the dynamic interaction of seismic waves with the local aquifer, are feasible scenarios. Both of them need a certain threshold in terms of earthquake magnitude and distance. No earthquake with a magnitude above ML 4 occurred since the ML 4.2 event of 2014.

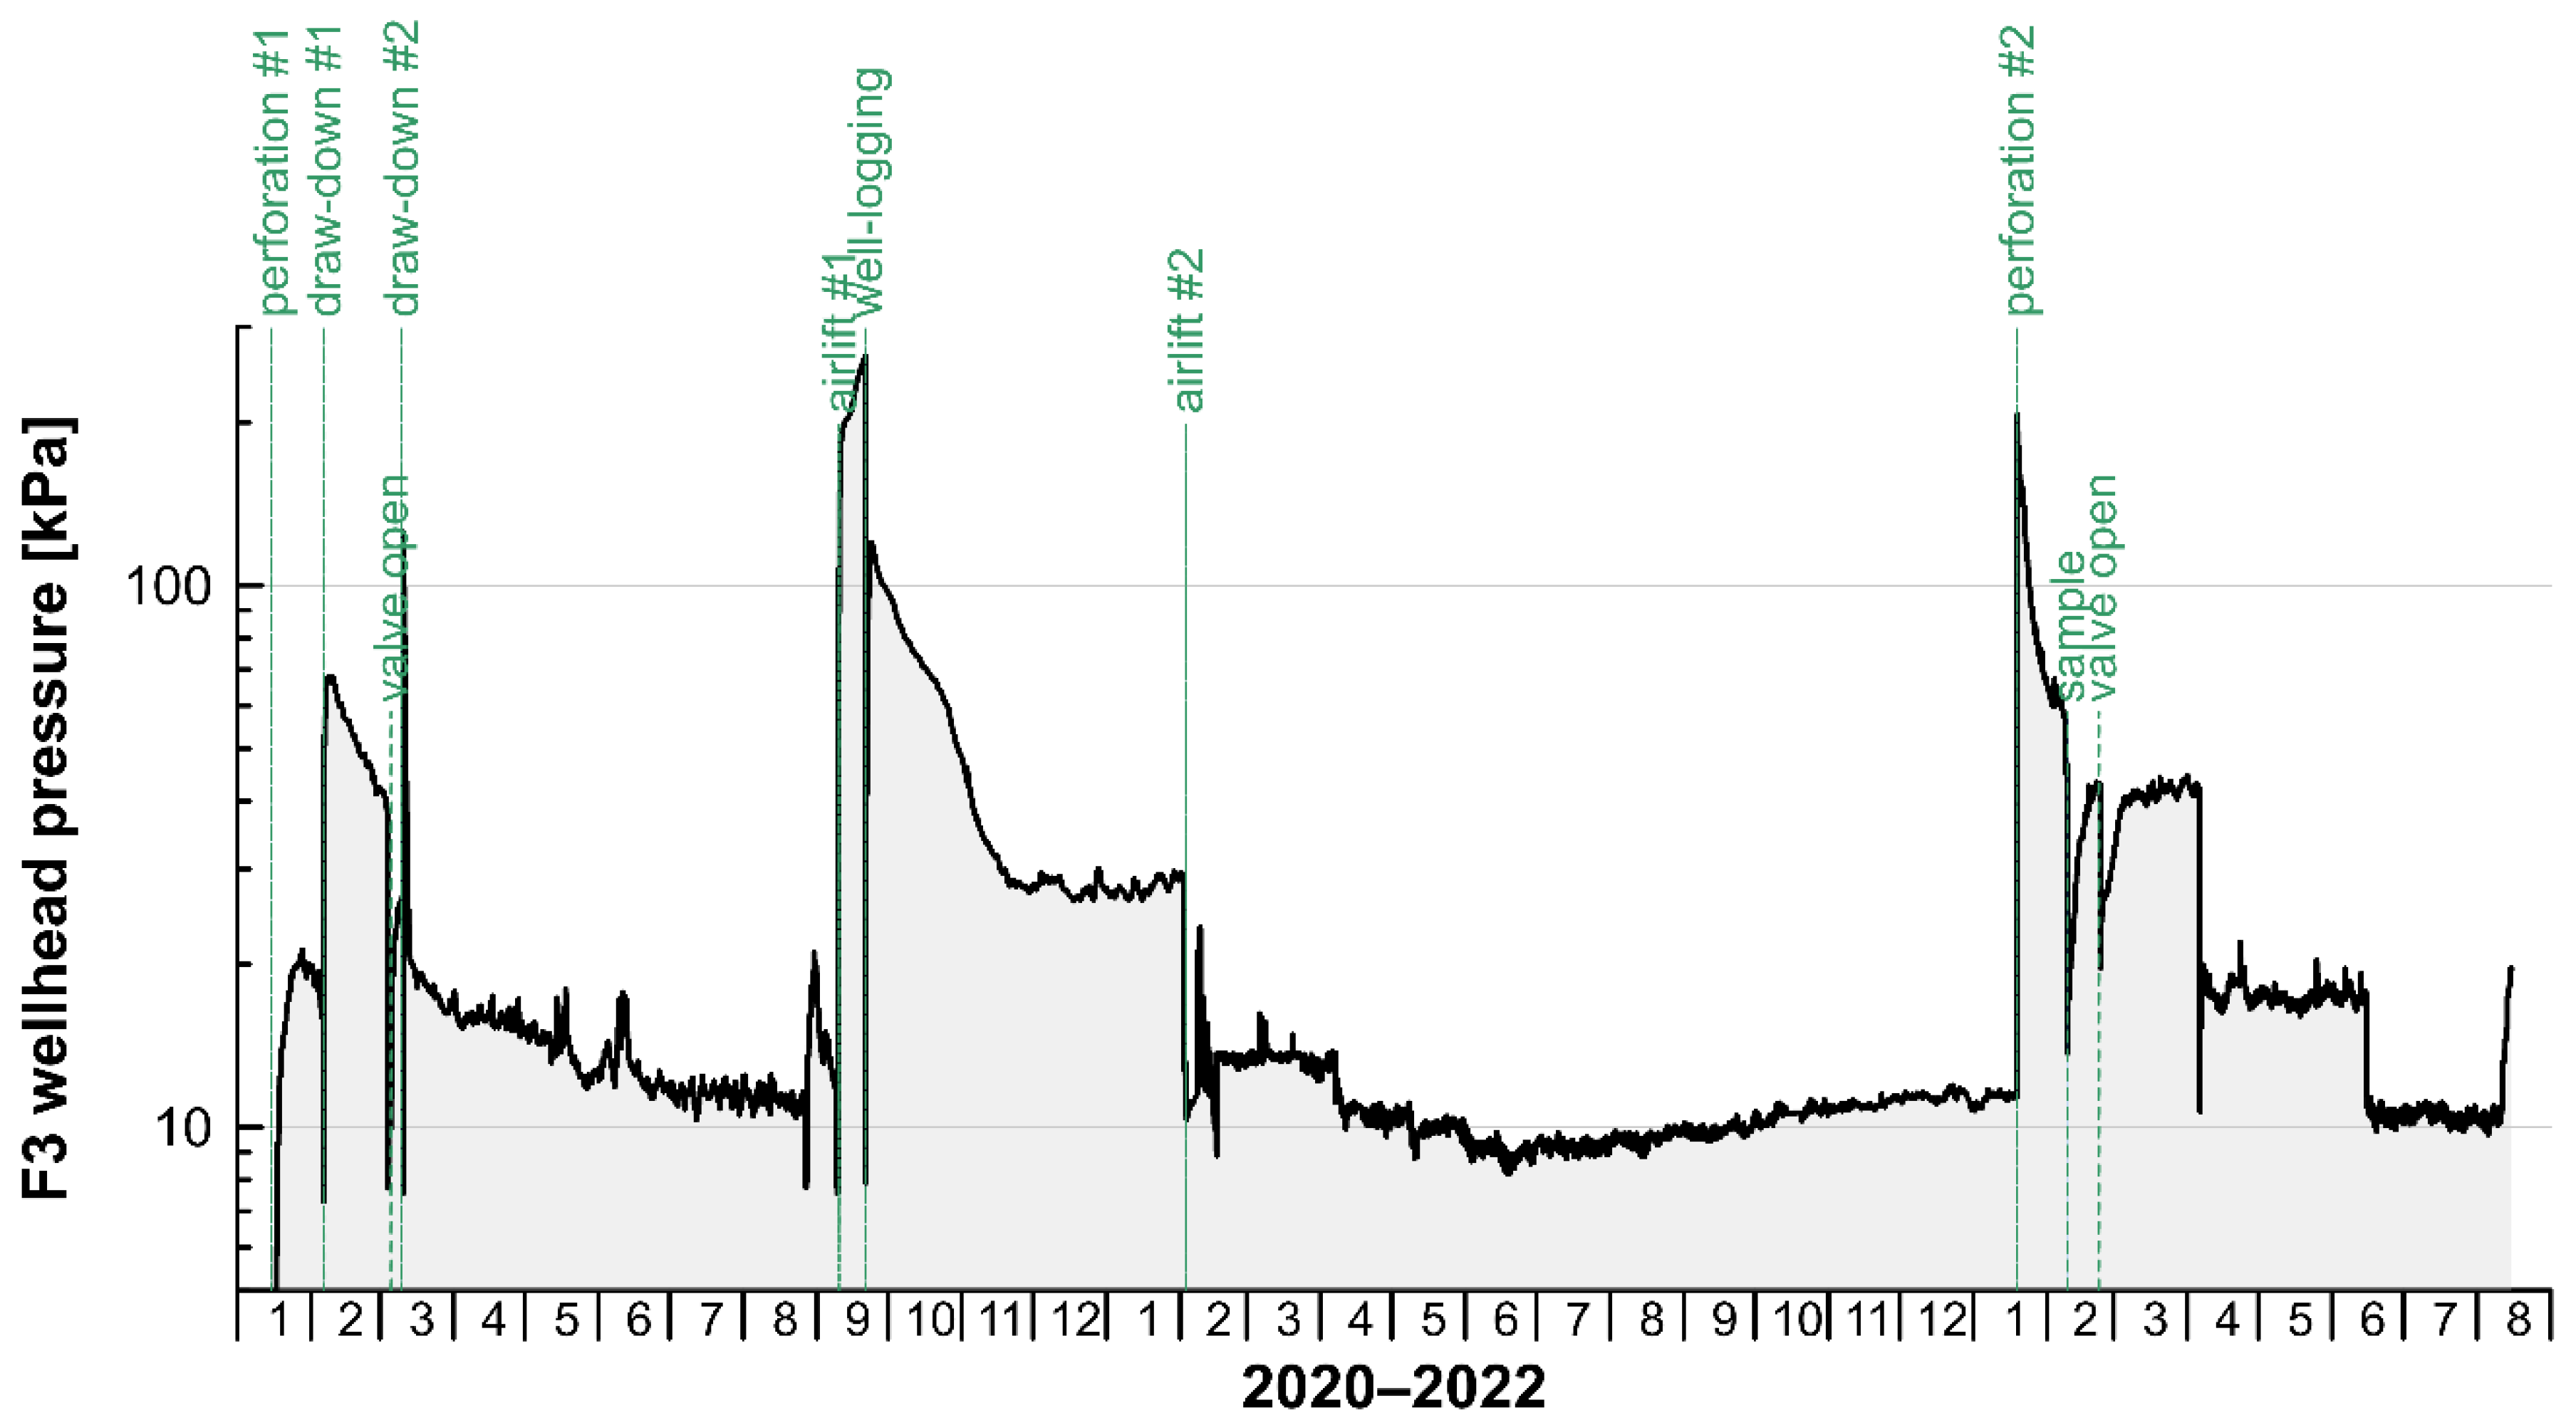
5. Pressure Transients Related to Stimulation Measures of Well F3

Borehole F3 was drilled in August 2019 to a final depth of 239.2 m with PQ3 drill rods (hole size 122.6 mm, core diameter 83 mm). Borehole logging was carried out after the termination of the drilling. Thereafter, HRQ V-wall drill rods were installed as casing (OD 88.9 mm, ID 81.0 mm, at joints ID 77.8 mm) from 0 to 235 m. The total volume is about 1232 L, or 5.15 L/m. The casing was cemented from the bottom to the surface. Thus, it was necessary to perforate casing and cement at the target depth with explosives. A series of stimulation measures aimed to access a CO2-bearing horizon at depth have been performed since 2020, which included a first perforation, two draw-down tests, two airlifts to clean the well, and a second perforation. A complete timeline of the stimulations and the wellhead pressure evolution at F3 is shown in Figure 9.

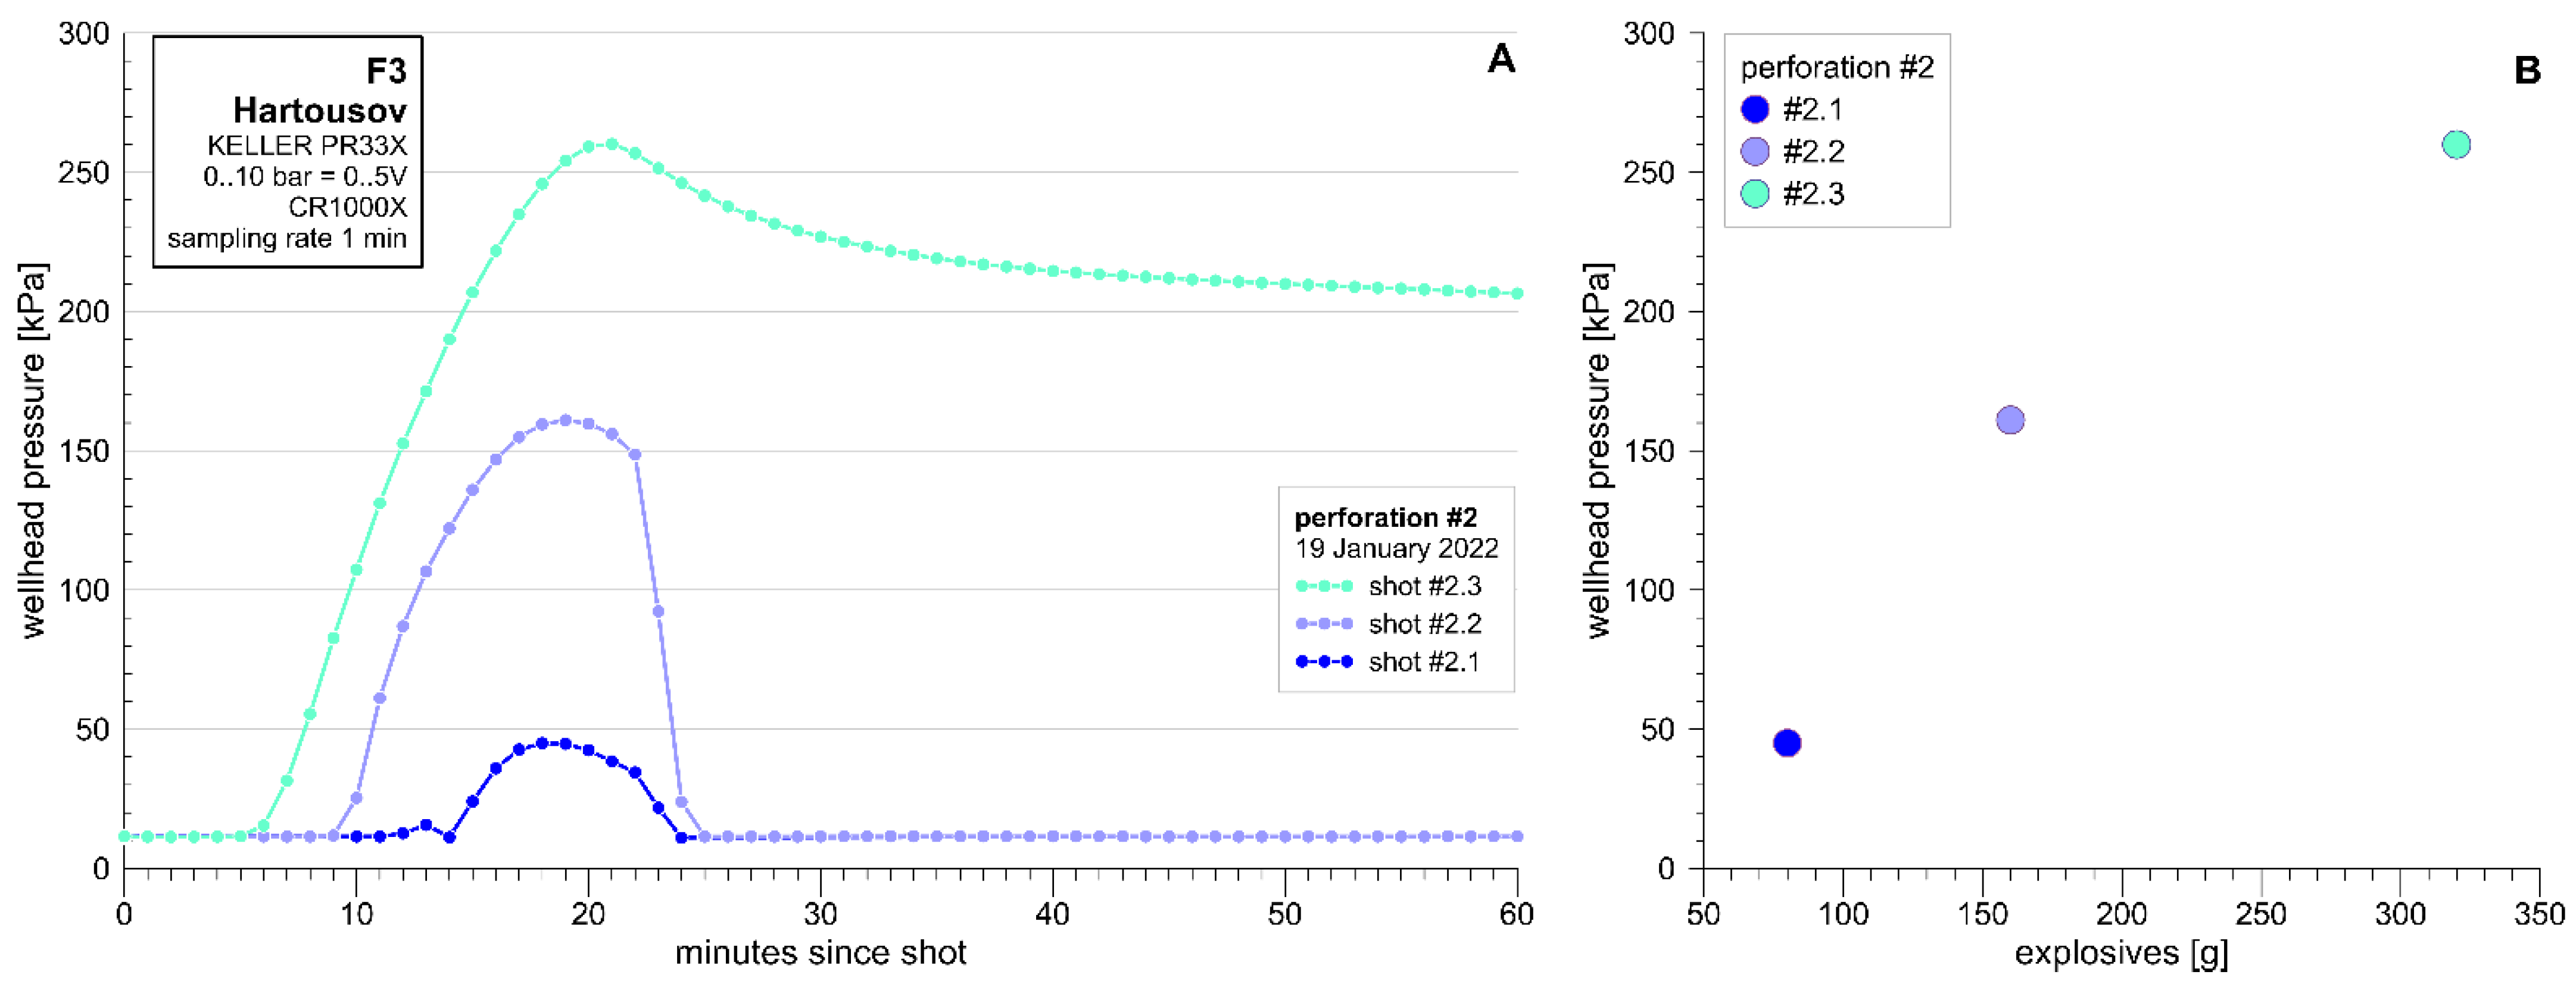
5.1. Pressure Variations after Perforations

The first attempt to connect the well to the gas reservoir at depth was performed on 15 January 2020. In total, two rounds of perforation shots were fired (gun type TTG Link 45 mm, 8 g RDX DP, 20 spm). Shot #1.1 at a depth of 228.5 m took place at 08:29 UTC and consisted of 24 g explosives (three pieces of 8 g). A small fountain (some dm high) occurred at the wellhead. Well-logging was performed at 09:09 UTC (downwards) and 09:30 (upwards). Shot #1.2 was fired at 10:11 UTC again with 24 g explosives at a depth of 229 m. Well-logging was repeated at 11:07 (downwards) and 11:28 UTC (upwards).
The second attempt was performed on 19 January 2022. Before the perforation, the well depth and access were checked by MND company. The measured depth of the well was 232 m, which agrees with a depth of 232.5 m estimated from a camera inspection of the borehole in April 2021. In total, three perforation shots were taken at different depths; the wellhead pressure response is shown in Figure 10A. After each shot, the wellhead was closed with a slider valve, so that the pressure increase could be monitored with a pressure transducer mounted at the wellhead below the sliding valve.
Shot #2.1 consisted of 80 g explosives (10 pieces of 8 g), covering a depth span of 231.0–230.5 m, at 09:55:40 UTC (the exact time was obtained from the seismometer recordings at F1 and F2). A small geyser with an ~10 min delay occurred. The well was closed and the pressure raised up to 50 kPa. Thereafter, the well was inspected by a camera—bubbles with foam were visible at the water table and down to about 80–100 m. Visibility in the well was good to ~200 m; below that, the visibility was reduced due to whirling particles in the vicinity of the explosion. When going up with the camera, a weakened bubbling on the water level was noticed.
Shot #2.2 consisted of 160 g explosives (20 pieces of 8 g) covering a depth range of 207–206 m, at 12:27:10 UTC. After the shot, we waited for water to flow out, then the well was closed. Pressure raised up to 150 kPa, but then decreased quickly—also due to a leaking slider valve at the wellhead.
The last shot #2.3 consisted of 320 g explosives (40 pieces of 8 g), covering a span of 188.5–186.5 m, at 13:27:15 UTC. Water started to leak from the well almost immediately after the shot. The slider valve was closed and a wellhead lid was also attached for better sealing. Pressure increased to more than 250 kPa and stabilized at 200 kPa almost 2 h after the shot.
The maximum amplitude of the wellhead pressure changes is obviously related to the amount of used explosives as shown in Figure 10B. The explosive RDX, also called hexogen, has a normal gas volume of 927 L/kg. Thus, during the three shots, gas volumes of about 75, 150, and 300 L were generated inside the well casing. The pressure pulse traveled at velocities of the order of 0.3 m/s when correcting the perforation depth for the expanded volume of the explosive (Table 2).
The molecular formula of hexogen is C3H6N6O6, which might explain the presence of hydrocarbons in a gas sample that had been taken about one month after the perforation. The sample collected from F3 was analyzed in situ for its elemental composition with the use of a quadrupole mass spectrometer (QMS). The instrument was previously calibrated. The results showed that CO2 is the dominant gas species with 93.5%, followed by N2 and O2 with 2.3%. Methane and hydrogen displayed concentrations up to 1.9% and 2.1%, respectively, while Ar and He were present in minor amounts.
This chemical composition is quite abnormal considering that gas from F3 is expected to be the least air-contaminated of the three boreholes and the natural mofette (surface expression). In addition to this, CH4 and H2 concentrations are comparatively high. The enhanced amount of H2 may be related either to low temperature interactions between groundwater, rock fragments, and steel detritus from the casing or to H2 dissolution from the surrounding strata [42]. Moreover, CH4 might have been generated by anaerobic bacterial consumption of H2 in the borehole slurry and by oxidation of the steel casing [43]. The elevated content of CH4 may also be related to C3H6N6O6 decomposition [44].

5.2. Pressure Recovery in a Closed Hole following Draw-down Tests

Following the first perforation, two draw-down tests were performed. The aim was to lower the water level in order to trigger degassing of dissolved CO2 due to the reduced water column. The first one (compare “draw-down #1” in Figure 9) was performed on 6 February 2020. A pump (Grundfos MP1, diameter 4.6 cm) was installed at a depth of 80 m. The water level could be lowered from 5 m to 15 m below surface (measured manually with a water level contact gauge) before the pump failed due to problems with fuse/power supply. A second draw-down test was made on 10 March 2020. Again, the pump was installed 80 m below the surface. The test lasted 33 min (from 16:05 to 16:38 local time), and the estimated pumped volume of water was about 386 L. The steel casing has an inner diameter of 81 mm, which gives a volume of 5.15 L/m of casing; water level was lowered from 5 m to 80 m, i.e., by 75 m. This converts to a pumping rate of about 11.7 L/min. A retry to pump water again after waiting half an hour was not successful, because water inflow into the well was too slow. After both draw-down tests, the wellhead was closed tightly, and the wellhead pressure monitored with a pressure transducer mounted at the wellhead increased from 0 to 68 and 126 kPa, respectively.
The observed pressure increases are likely not related to an increased CO2 degassing, but simply due to the compression of the air in the headspace of the well while the water level was recovering to the pre-test level of 5 m below the surface as the following estimates suggest: When the wellhead was still closed, a pressure of 16 kPa was measured inside the headspace, and the barometric pressure was 98 kPa. Thus, the absolute initial pressure was p0 = 114 kPa = 114 kJ/m3 within an initial volume V0 = 5 m ∗ 5.15 L/m = 0.02575 m3, given p*V = constant = 2.941 kJ. During the test, the water level was at 15 m, i.e., V1 = 0.07725 m3, and p1 = 2.941 kJ/0.07725 m3 = 38 kJ/m3 = 38 kPa. This is calculated to a pressure increase of p = p0 − p1 = 114 kPa − 38 kPa = 76 kPa, which is close to the observed value of 68 kPa. Accordingly, the theoretical pressure increase for the second draw-down test is calculated to 115 kPa. Whether the difference of 11 kPa between prediction and observation is due to an additional pressure build-up from degassed CO2 remains unclear.

5.3. Water Level Recovery in the Open Well following Airlift Operations

In order to clear the bottom of the borehole from drillmud and sediments which entered the borehole after the perforations, two airlift operations were conducted on 10 September 2020 and 3 February 2021. In both cases, slim steel tubing was installed inside the borehole casing to the bottom of the well. Compressed air was then pumped down inside the spaghetti tubes with a pressure of 2 MPa, pushing the water towards the surface. In the beginning, the water was muddy, containing minor amounts of drillmud and later phyllitic material. Finally, clear water was raised to the surface. During the airlift operation in 2021, pumping started at a depth of 185 m. Then, the depth was lowered to 203 m and finally to 227 m, where the jet became stuck. At the end of the first attempt, the rise in the water level was measured, indicating an inflow rate of about 3.4 L/min, compared to about 2.1 L/min during the 2020 airlift. Meanwhile, the drillers had removed, cleaned, and reinstalled the pipes. A second attempt started at a depth of 206 m, continued at 227 m, and finally at 230 m, producing clear water with phyllitic particles. From the recovery data (for details of the recovery tests, see Figure A1), rough estimates of the transmissivity T could be obtained using the Cooper–Jacob method [45], indicating values of T of the order of 5–9 × 10⁻⁸ m2/s. For F2, a transmissivity of T = 8 × 10⁻⁶ m2/s had been determined. Thus, the transmissivity of F2 is about two orders of magnitude higher than that of F3. For comparison, aquifers suitable for water exploitation have transmissivities greater than 0.015 m2/s [46].

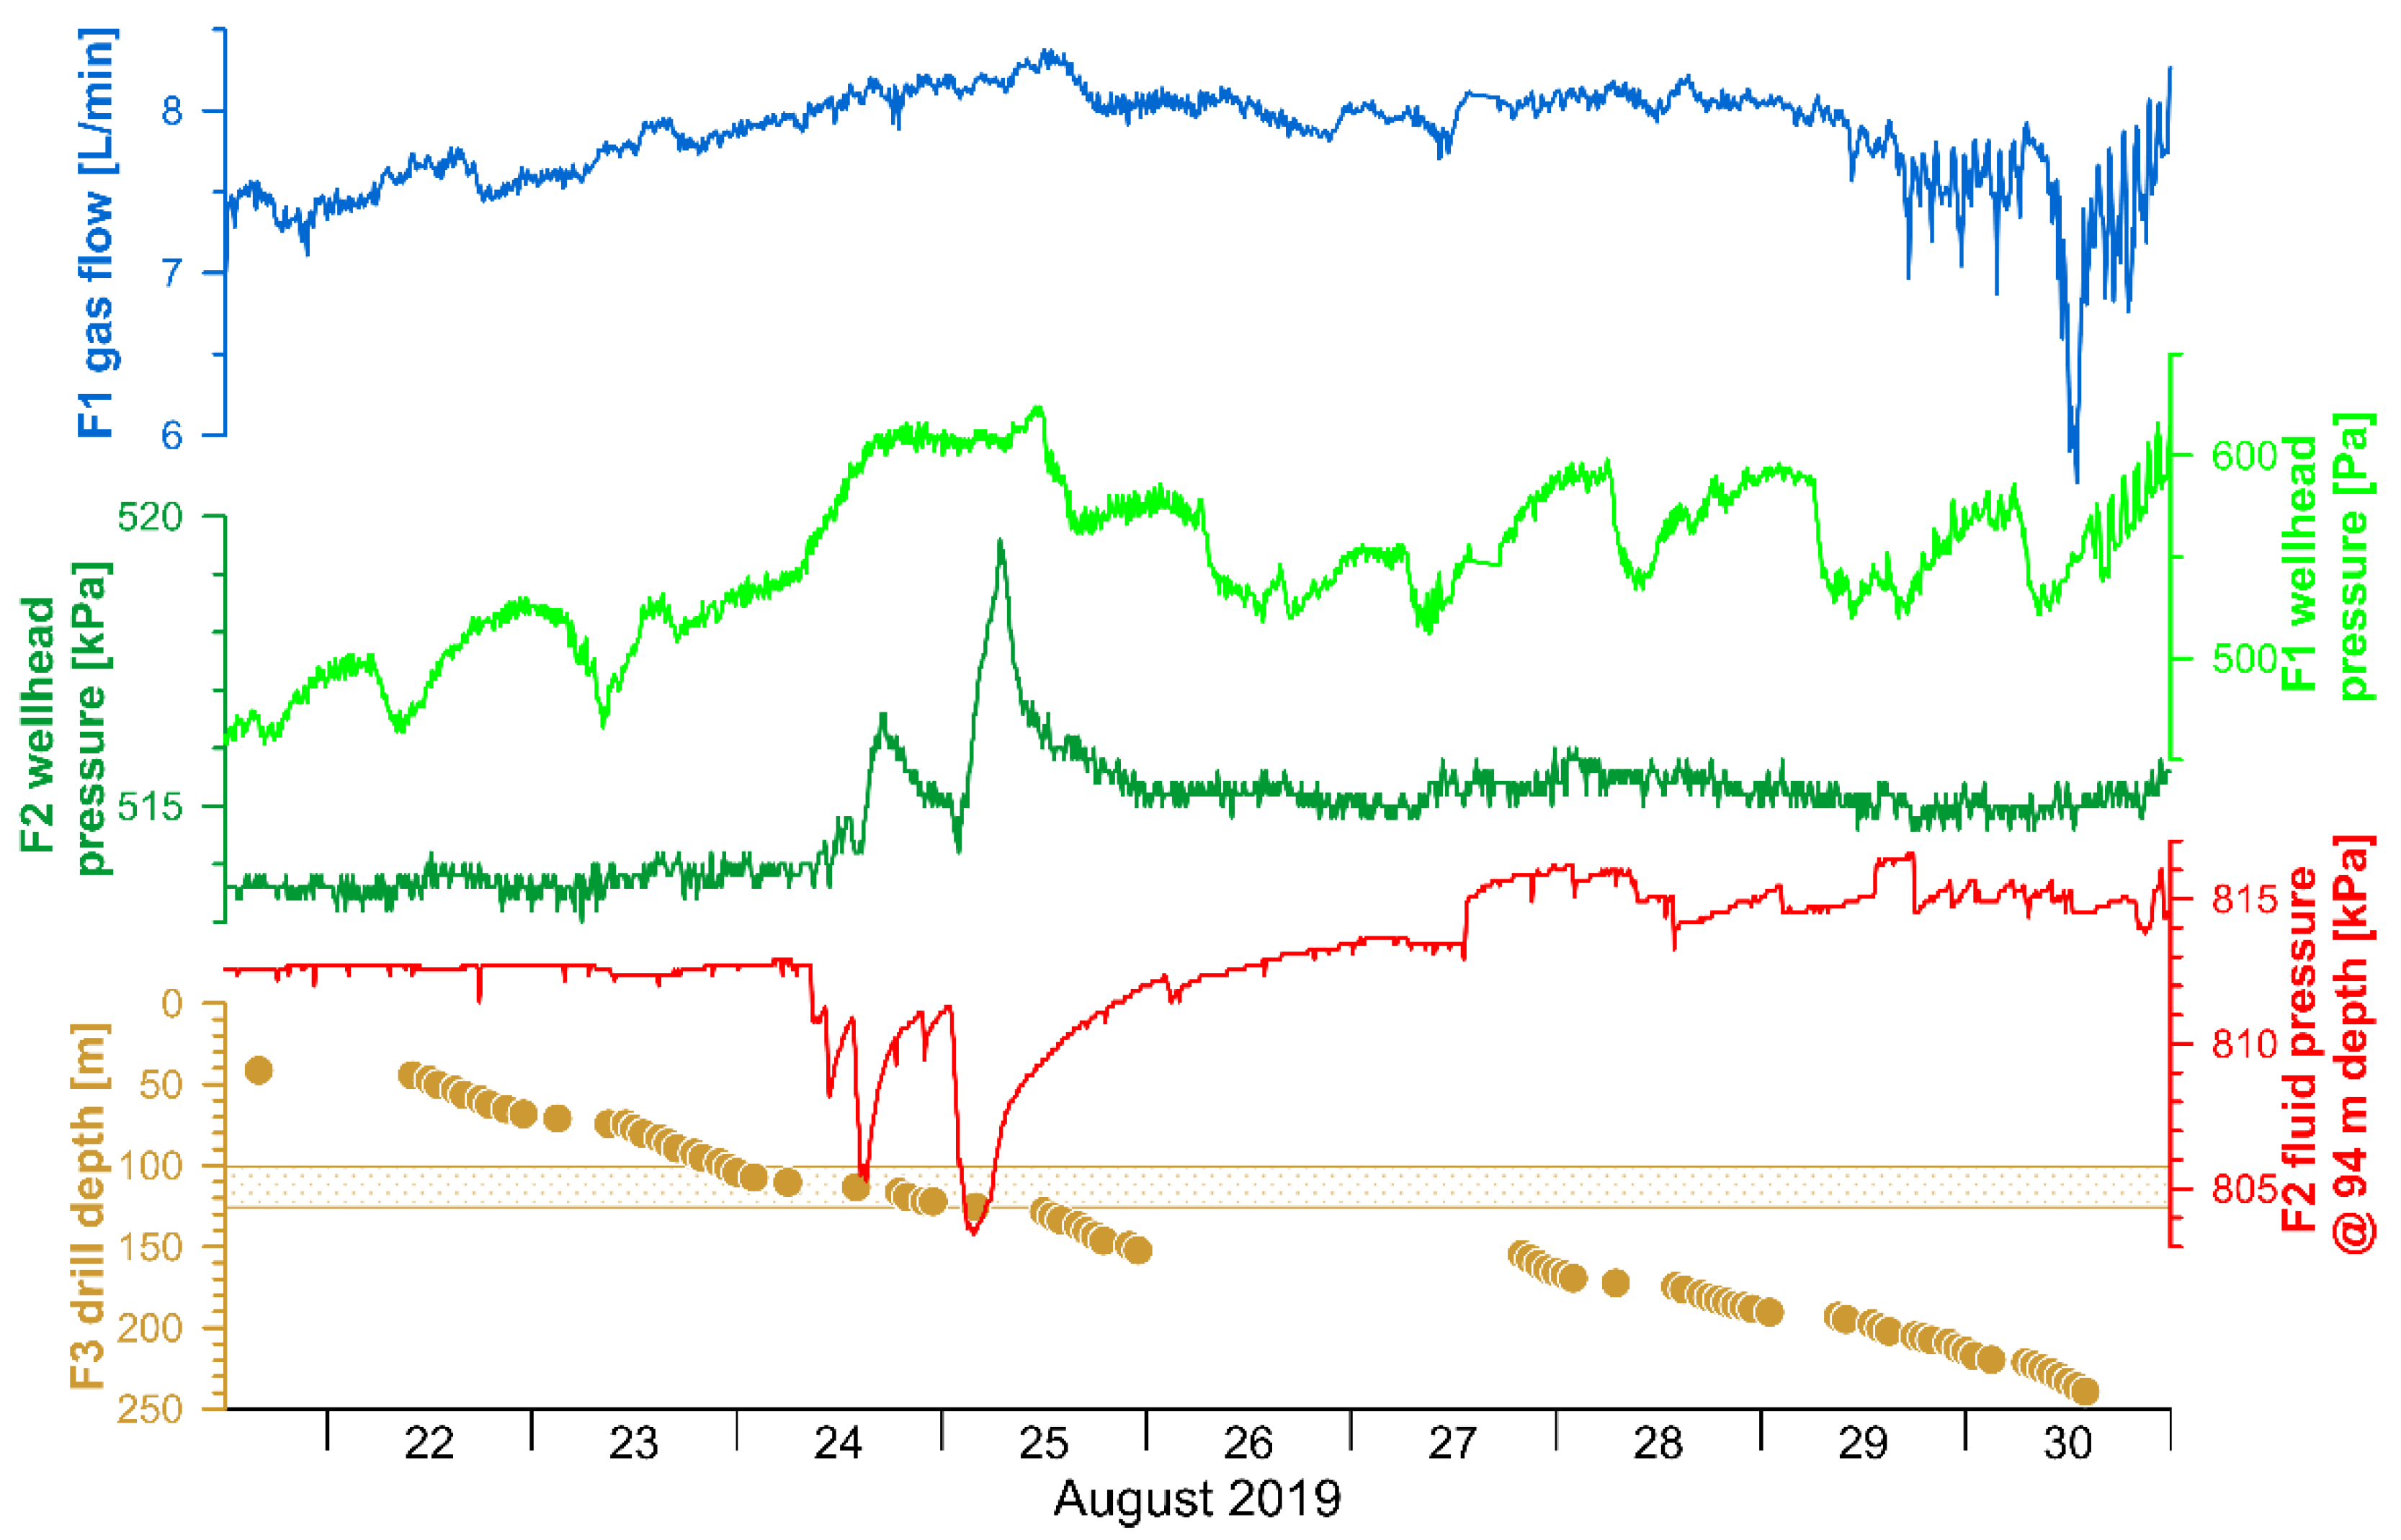
6. Pressure Transients Related to Drilling Operations

6.1. Response of F1 and F2 while Drilling F3

During the drilling of F3, pressure transients were observed at F1 and F2 wells. Between 24 and 25 August 2019, the fluid pressure increased by <0.1 kPa and 6 kPa at F1 and F2, respectively. The wellhead pressure started to increase when the F3 drilling reached a depth of about 110 m (Figure 11). At this depth, intense degassing of the fresh on-deck cores was observed. On 29 August, the gas flow of F1 started to oscillate and decreased from 7.5 L/min to below 6 L/min when F3 reached its final depth at noon on 30 August 2019, before recovering to nearly 8 L/min during the following night. We do not have an explanation for the oscillations and the drop of flow rate, but similar observations were made a few months after the F2 drilling had been completed.

6.2. Pressure Drops and Recovery after Drilling F2

The wellhead pressure at F2 was about 500 kPa since the installation of a pressure transducer (KELLER PR-33X, 10 bar, sampled at 1 min intervals) on 19 May 2016. In July 2016, the pressure repeatedly dropped to values below 100 kPa (Figure 12A). On 3 July 2016, the pressure dropped within a few hours to 50 kPa and remained between 50 and 100 kPa for more than two days before returning to the pre-event pressure level. Such pressure excursions occurred again on 24 and 27 July 2016. The events do not correlate with rainfall or local earthquakes as recorded by the Czech WebNet.
Details of the third event, which started on 27 July 2016, are shown in Figure 12B. Within several hours, the pressure dropped to below 100 kPa, before slowly recovering to almost 540 kPa on the morning of 29 July. The pressure started to oscillate with increasing amplitudes (from 10 to 40 kPa) and varying frequencies until the early morning of 30 July (Figure 12C). Thereafter, the pressure reached again the pre-event level of 500 kPa.
The most striking feature of the observed pressures is the reliability with which the pressure is kept around the level of 500 kPa, particularly when compared to the three anomalies, when the pressure was lowered as much as below 100 kPa, only to return over 1–3 days to the previous level again. Particularly interesting, then, is the oscillatory behavior after the third anomaly. Qualitatively, similar oscillations can be observed in two-phase pipe–relief valve systems in industrial applications, e.g., in hydropower stations (see engineering application presented by Wang et al. [47]). Nevertheless, the oscillations at Hartoušov lasted almost 24 h with changing amplitudes and frequencies (see Figure 12C). In the first eight hours after the beginning of the oscillations, 2–3 cycles per hour (cph) were observed, while in the following six hours, the frequency dropped to about 1 cph before increasing to 5 cph until the oscillations finally stopped after 23 h.

7. Tentative Hydro-Mechanical Model

Within the Cheb basin, four main CO2 degassing centers can be distinguished: Soos, Bublák, Hartoušov, and the area SE of Františkovy Lázně. The existing data and models do not allow us to identify the position of the supply paths of CO2 from the lithospheric mantle [48]. However, analysis of the water chemistry revealed that the fluids of Františkovy Lázně, Hartoušov F2, Kyselecký hamr, and Soos are mixtures between shallow groundwater and brine located at the deepest parts (>230 m below surface) of the segmented basin fillings.
CO2 eruptions (blow-outs) related to drilling activities were repeatedly reported, e.g., several erupting wells NE of Františkovy Lázně (boreholes HJ-11 and HJ-9 [49], as well as borehole HJ-1). In particular, the documentation of the gas eruption at the HJ-1 well near Spálená (W of Nový Kostel) during the drilling of the CO2 outlet zone in the Cypris formation testifies to the fact that other tectonically based structures than just the above-mentioned contacts in the basin floor and faults are responsible for the distribution of CO2. The eruption of the H-11 well near Horní Ves (E of Františkovy Lázně) in 1957 [49] occurred during the excavation of the well in the underlying clays of the layered zone, an eruption of a mixture of water and gas with a strong mechanical admixture (sand, coal) with an estimated total yield of both phases of approx. 250 L/s. A secondary accumulation of gasified water was hit by the well, and the eruption affected the regime of some mineral water sources in Františkovy Lázně. The impact of the eruption was mainly caused by the drop in CO2 pressure in the individual collectors. The difference in the reaction of the resources of the Františkovy Lázně outflow area to the eruption of the H-11 well near Horní Ves and to the eruption of the HJ-1 well near Spálená confirms the hypothesis about the hydraulic role of the Nebanice-Soos ridge in the basin floor.
In the following, we present a tentative hydro-mechanical model of the Hartoušov mofette system made of pipes and relief valves. The stratigraphic analysis of cores showed a layer of higher permeability below 80 m depth, which is sealed by 60 to 70 m clays and mudstones of the Cypris formation on top of it. The permeable layer consists of porous sandy mudstones of the Main Seam Formation having a thickness of 10 m and 20 m in F2 and F3, respectively. During drilling of F2, a small gas blow-out occurred when the drilling reached the top of the Main Seam formation at a depth of about 80 m. The permeable layer consists of porous sand directly above the weathered phyllitic basement rock. During drilling, it was documented that the local aquifer was under high overpressure and fully saturated by gas and water. We assume a steady supply of CO2 from depth by a gas reservoir below the local aquifer. The gas reservoir leads to continuous inflow of CO2 into the saline water. The aquifer itself is therefore assumed to be oversaturated, and the gas is migrating upward through small channels as manifested by the mofettes in Hartoušov. Since gas migration in the sediment and soil column experiences resistance, the system can be described as an overpressure valve. Measurements indicate that the sediment/soil cover can resist an overpressure of about 500 kPa.
The F2 well was dressed with a PVC-U casing with a diameter of DN 114 mm with perforated sections at three depth intervals from 58.5 to 63.5 m, 68.5 to 83.5 m, and 88.5 to 103.5 m. The bottom of the borehole was equipped with a full casing with a length of 5 m. The natural gas migrates into the well to replace any water due to the lighter density. We assume that the water–gas interface in the drilling is at the first open section in about 58 m depth. All inflowing CO2 escapes at the first open section into the sediments, and the measured overpressure at the well head is relatively constant at 500 kPa. The overpressure in the cased section of the well is controlled by the difference in water level in the drill hole and the hydraulically connected aquifer. From the 500 kPa, we estimate a depth difference of about 50 m. Since the uppermost perforated section is only a few meters below, at 58.5 m, it can be assumed that the local aquifer is hydraulically connected to the near surface ground water. In other words, the wellhead pressure depends mainly on geometrical parameters (e.g., ground water level minus open section of casing), but not on CO2 flux from depth, which explains why the pressure has been rather stable over time.
In July 2016, just 2 months after the drilling had been completed, we observed a sudden pressure drop. We postulate that the pressure was too high, causing the relief valve to open. The relief valve likely was situated between the casing and the clays of the Cypris formation; the pressure dropped and the valve closed again. This process repeated twice before the valve, i.e., the ring space between casing and wall rock, was finally closed completely by the plastic clay. It is interesting to note that the cores of F2 show dike-like injection structures—also described as injectites [50]—cutting through the host rock at high angles. Bussert and co-workers [29,51] suggest that fluidized sediments were injected into overlying beds, probably caused by over-pressurized fluids.

8. Conclusions

We compiled geological, geophysical, geochemical, and isotopic data from the Cheb basin with special focus on the Hartoušov mofette field, which is a key site to study the interaction between fluids and swarm earthquakes. Several pressure transients were observed related to natural disturbances as well as human activities. The main findings can be highlighted as follows:
-
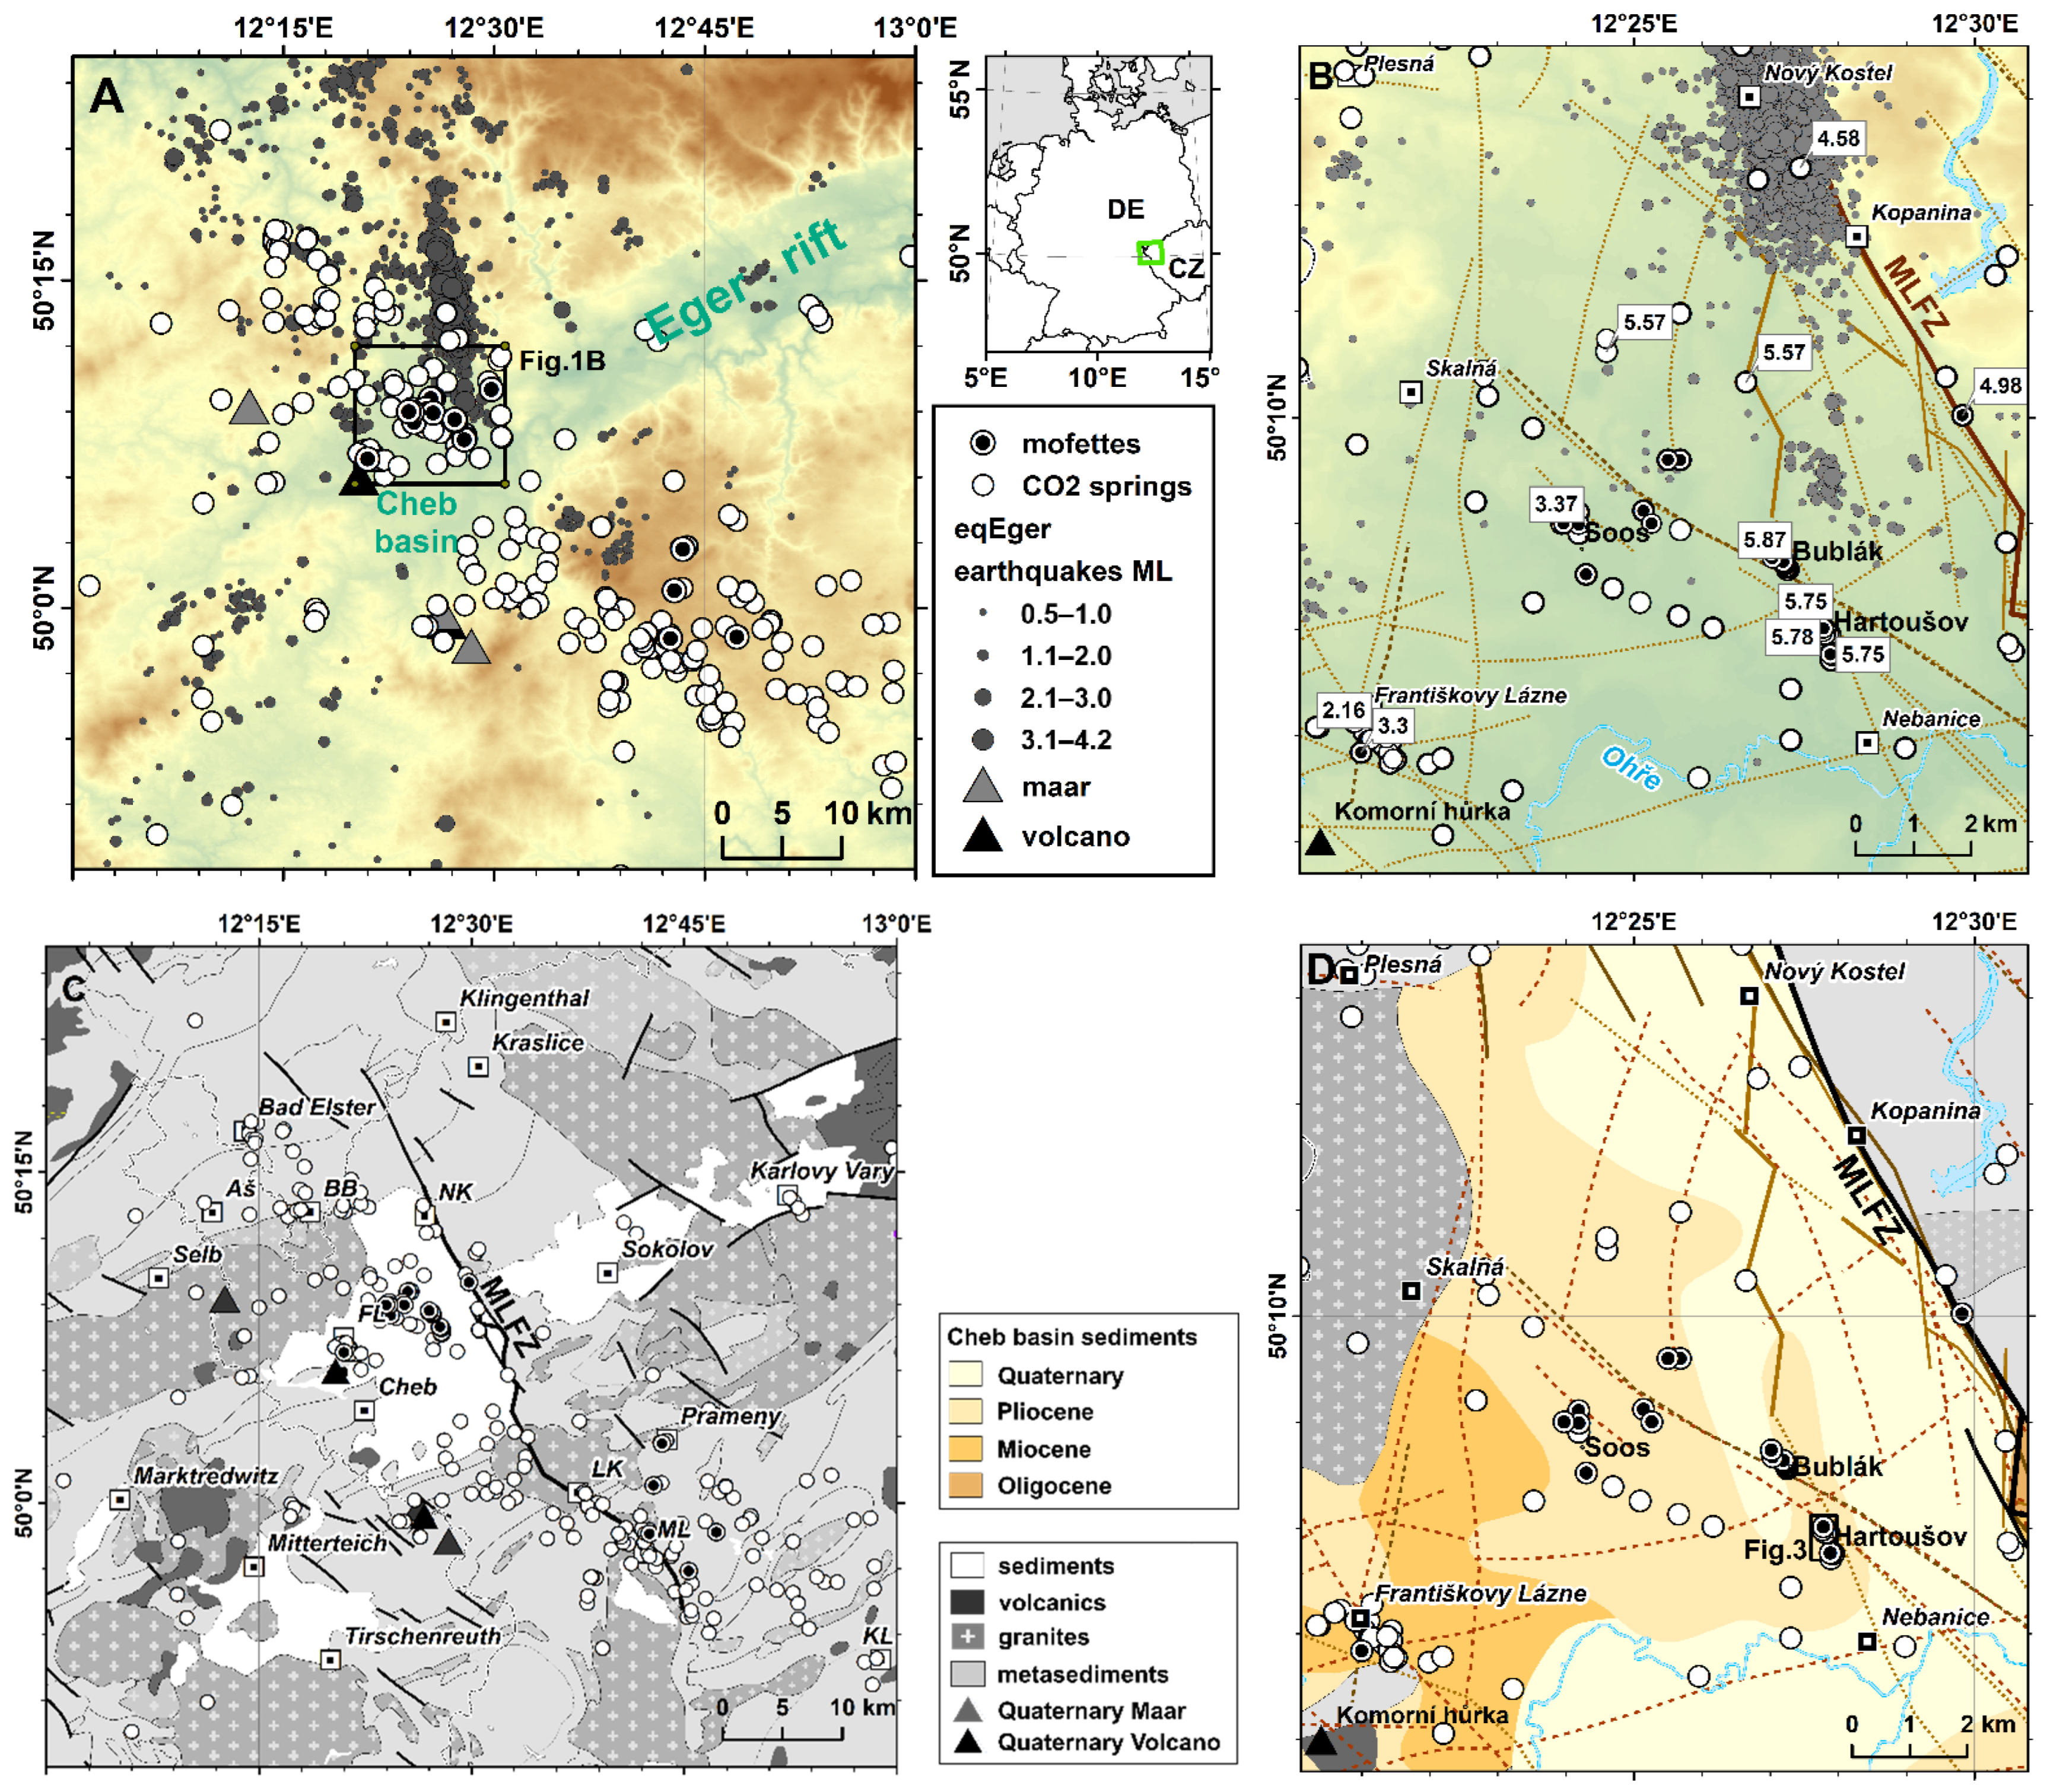
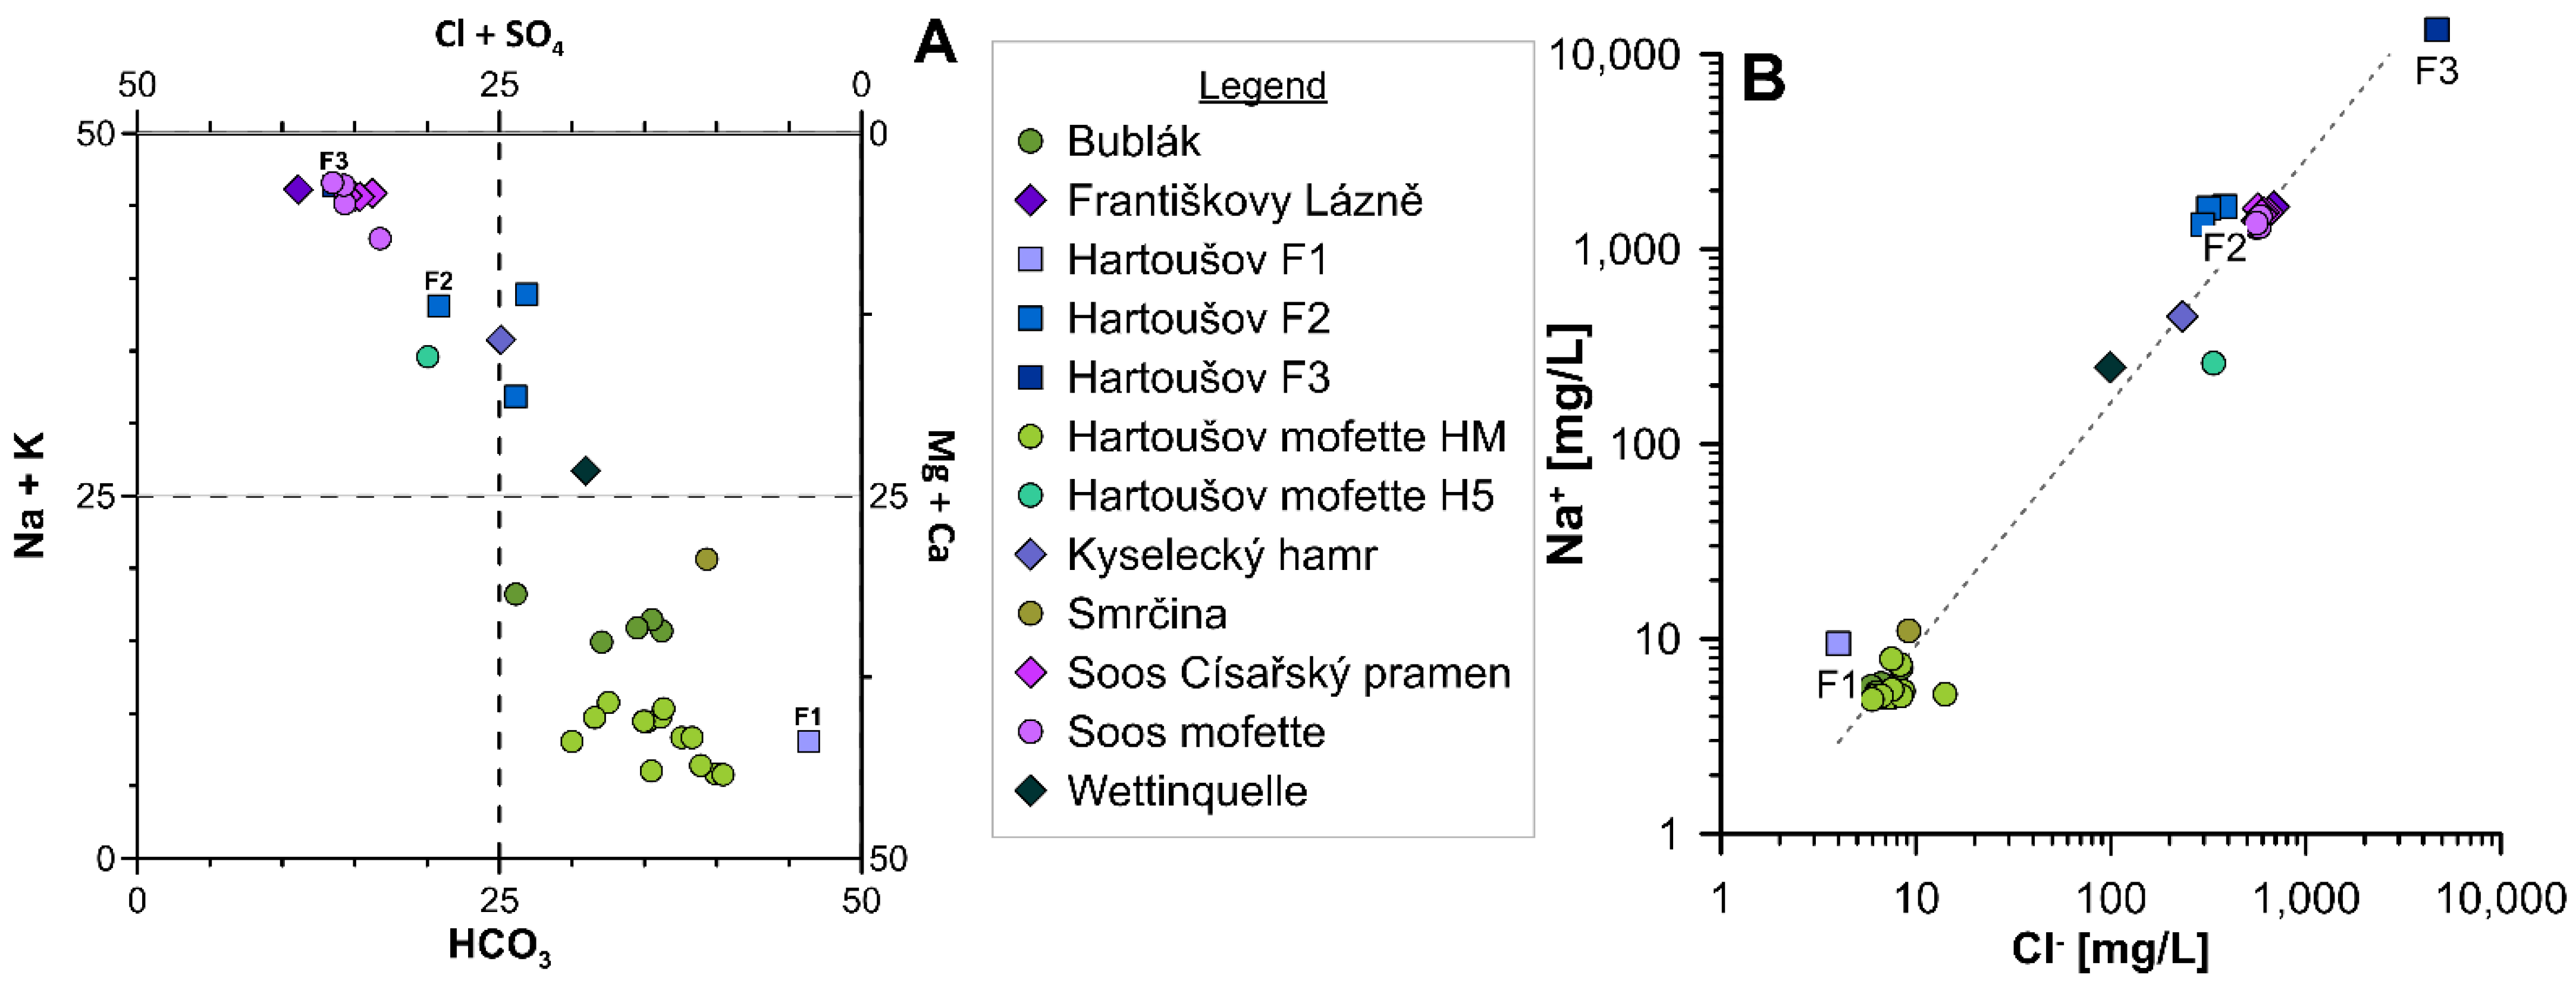
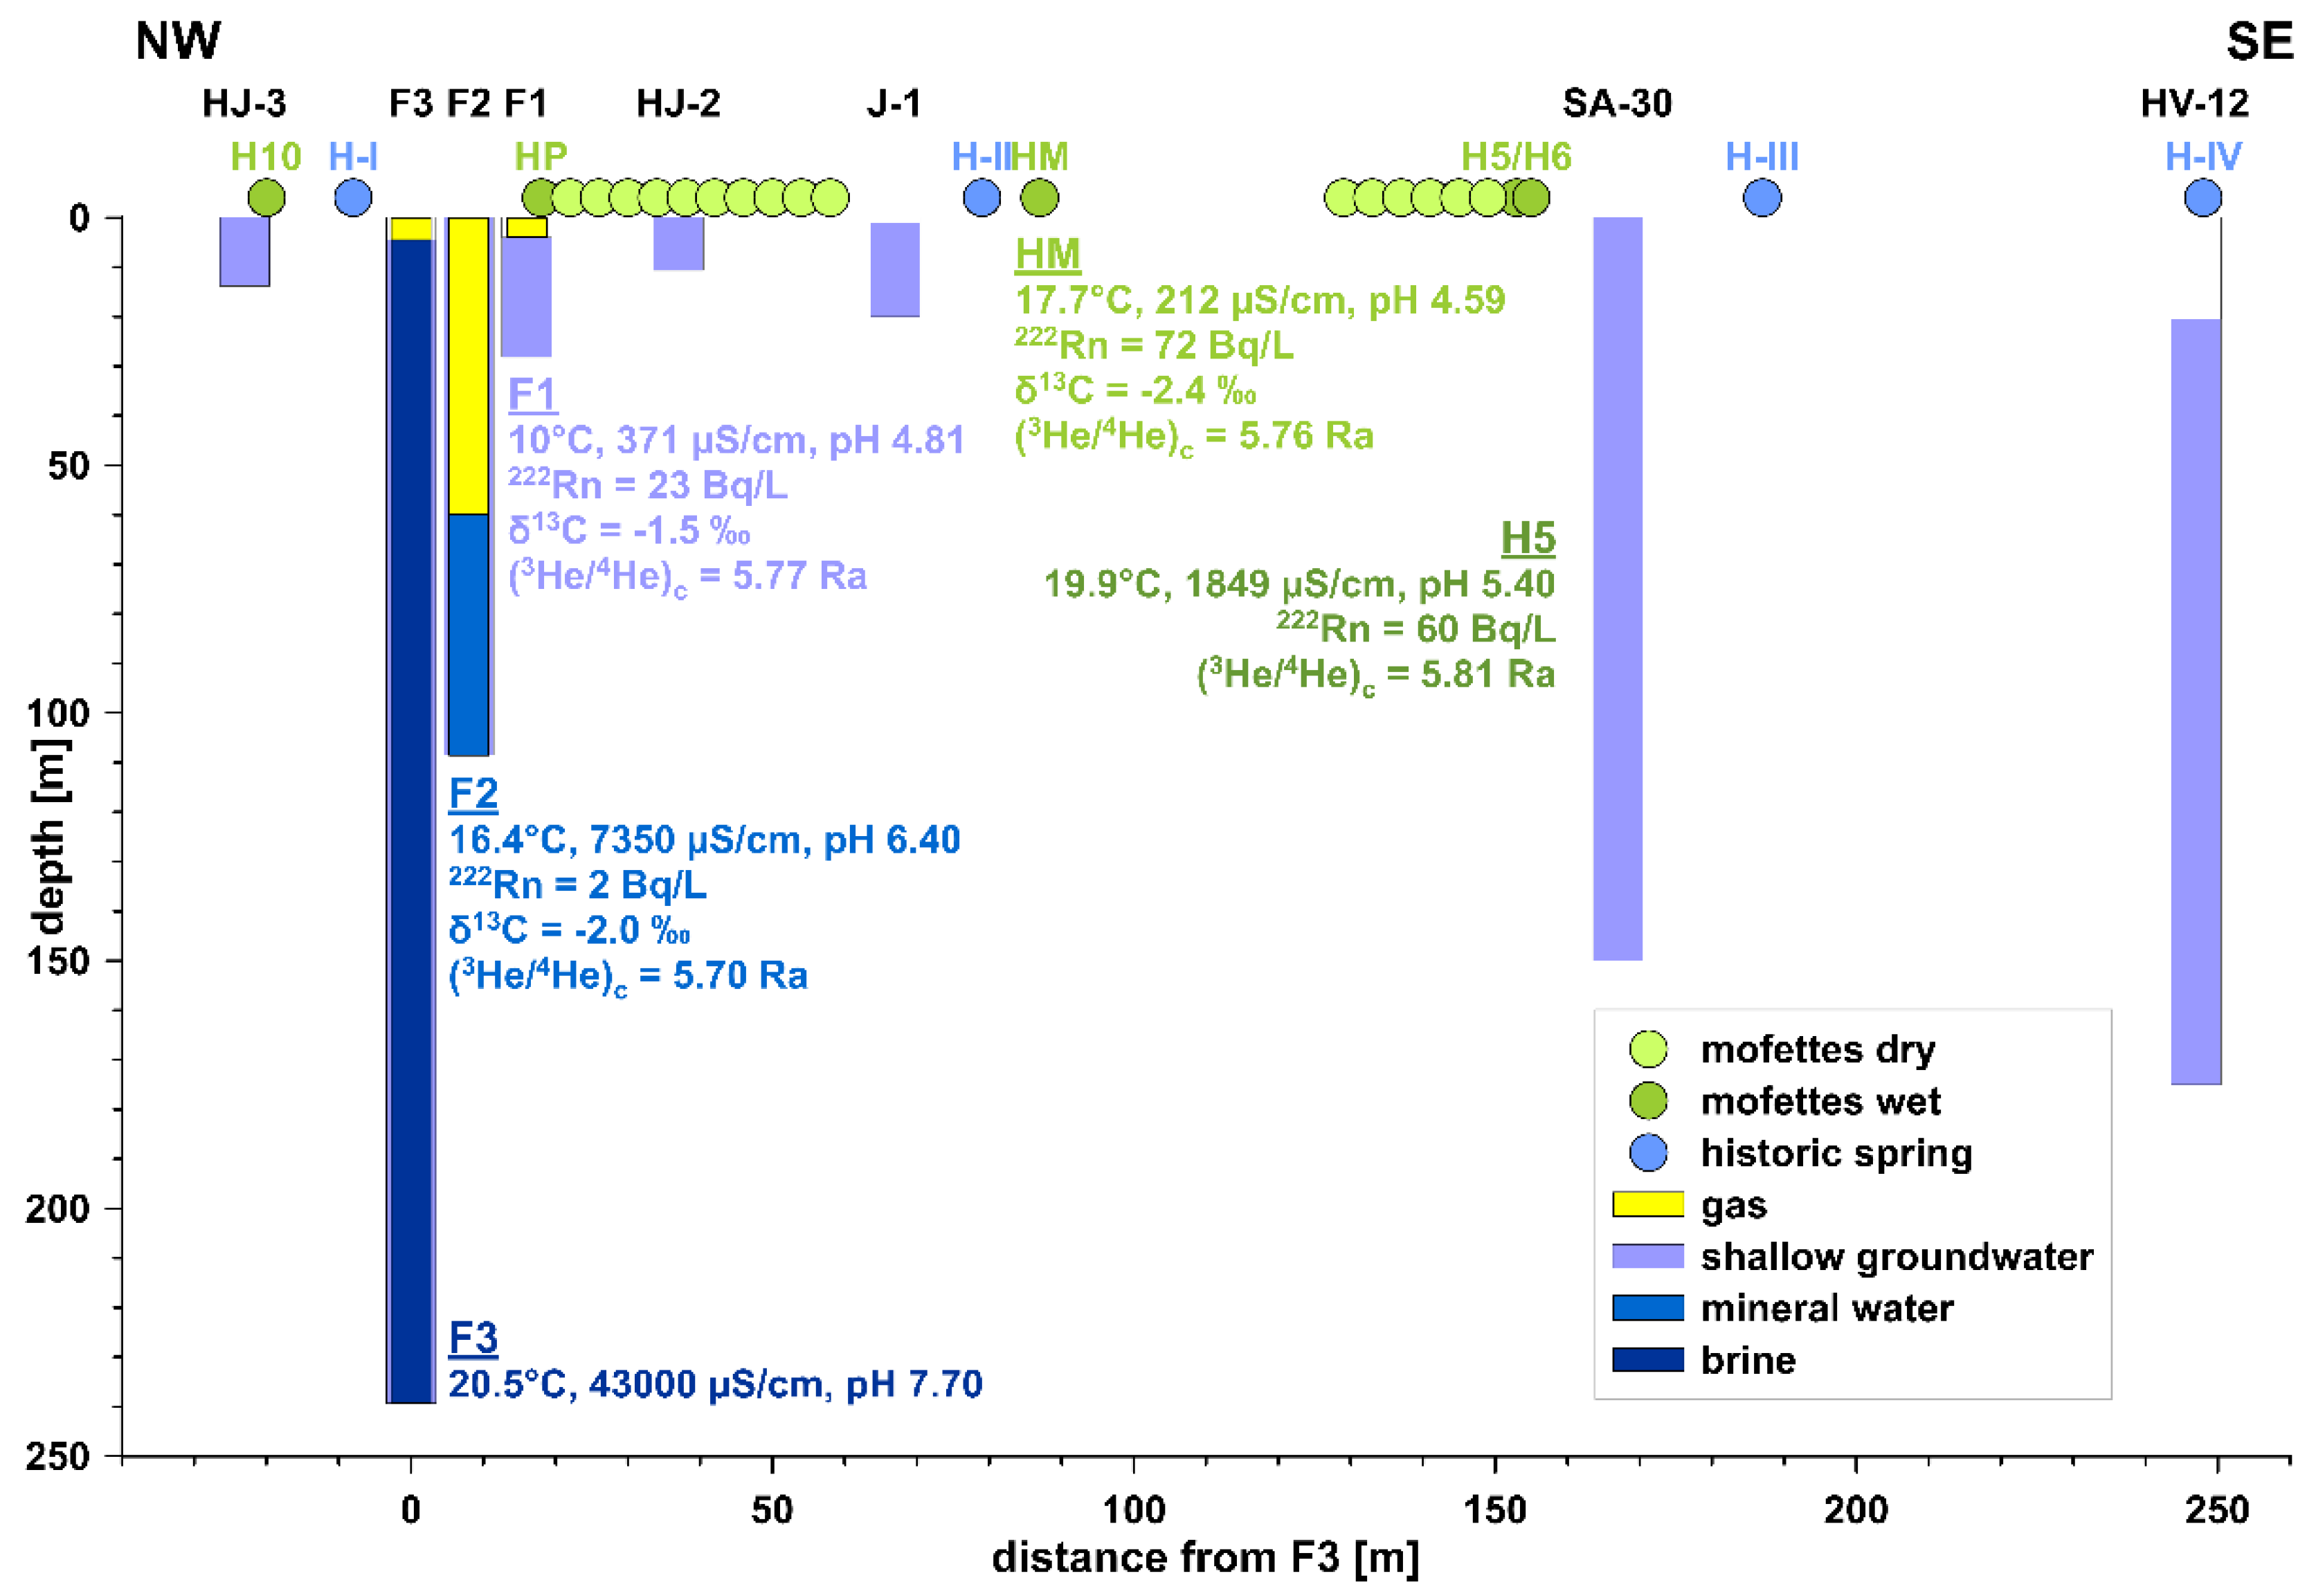
Fluids in the Cheb basin are mixtures between shallow groundwater and brine located at the deepest parts (>230 m below surface) of the segmented basin fillings.
-
Deepwater components were also found in two wet mofettes (Hartoušov H5 and Soos), which are usually defined as sites where CO2 degasses through surface water (puddles, ponds, rivers, lakes).
-
Over-pressured CO2-rich mineral waters are trapped below the mudstones and clays of the sealing Cypris formation. Drilling through the sealing layer led to several blow-outs in different compartments of the basin.
-
External (rain) and internal (earthquakes) events can cause pressure and gas flowrate transients in the fluid system within hours or several days, lasting from days to years.
-
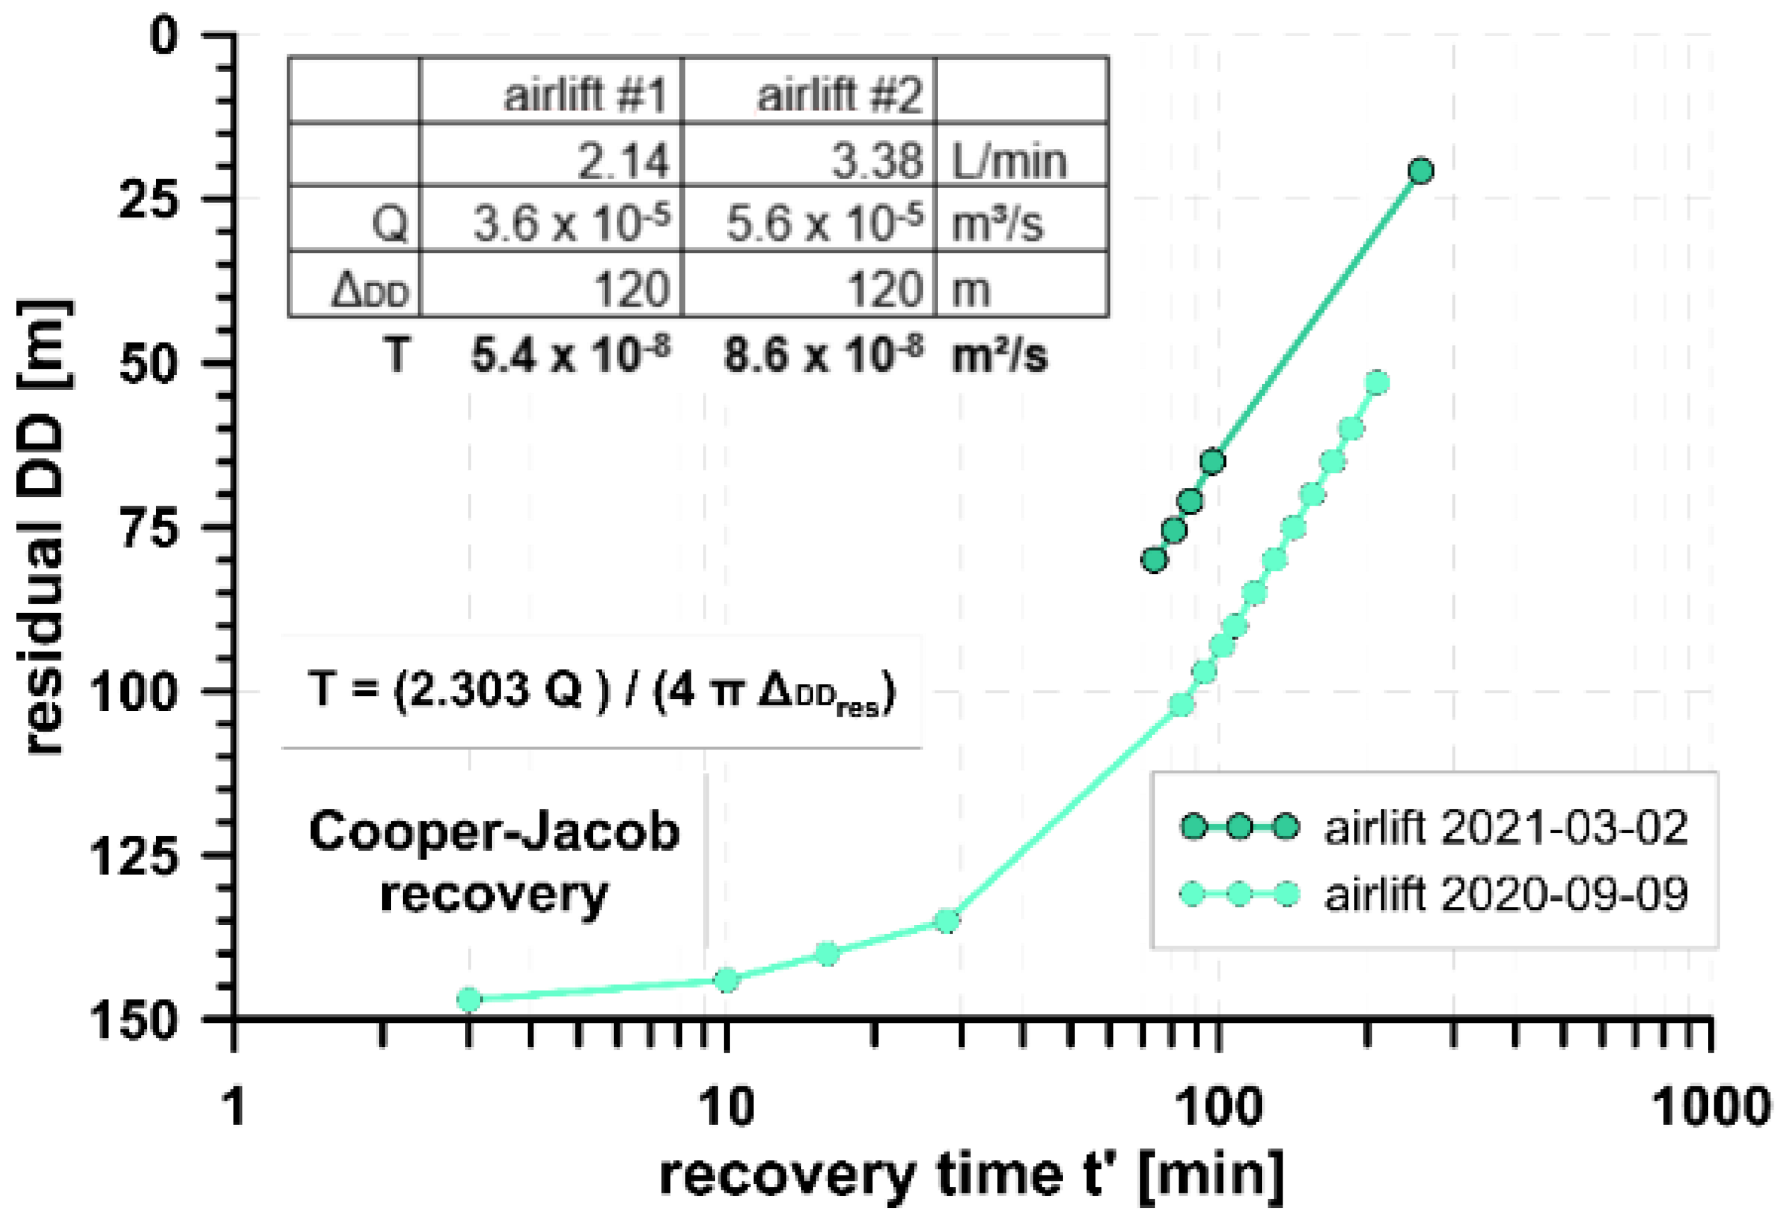
The transmissivity at F3 (235 m, T = 5–9 × 10⁻⁸ m2/s) is about two orders of magnitude lower than at F2 (108 m, T = 8 × 10⁻⁶ m2/s). This has implications for the response time to pressure transients at different depth levels of the mofette system.
-
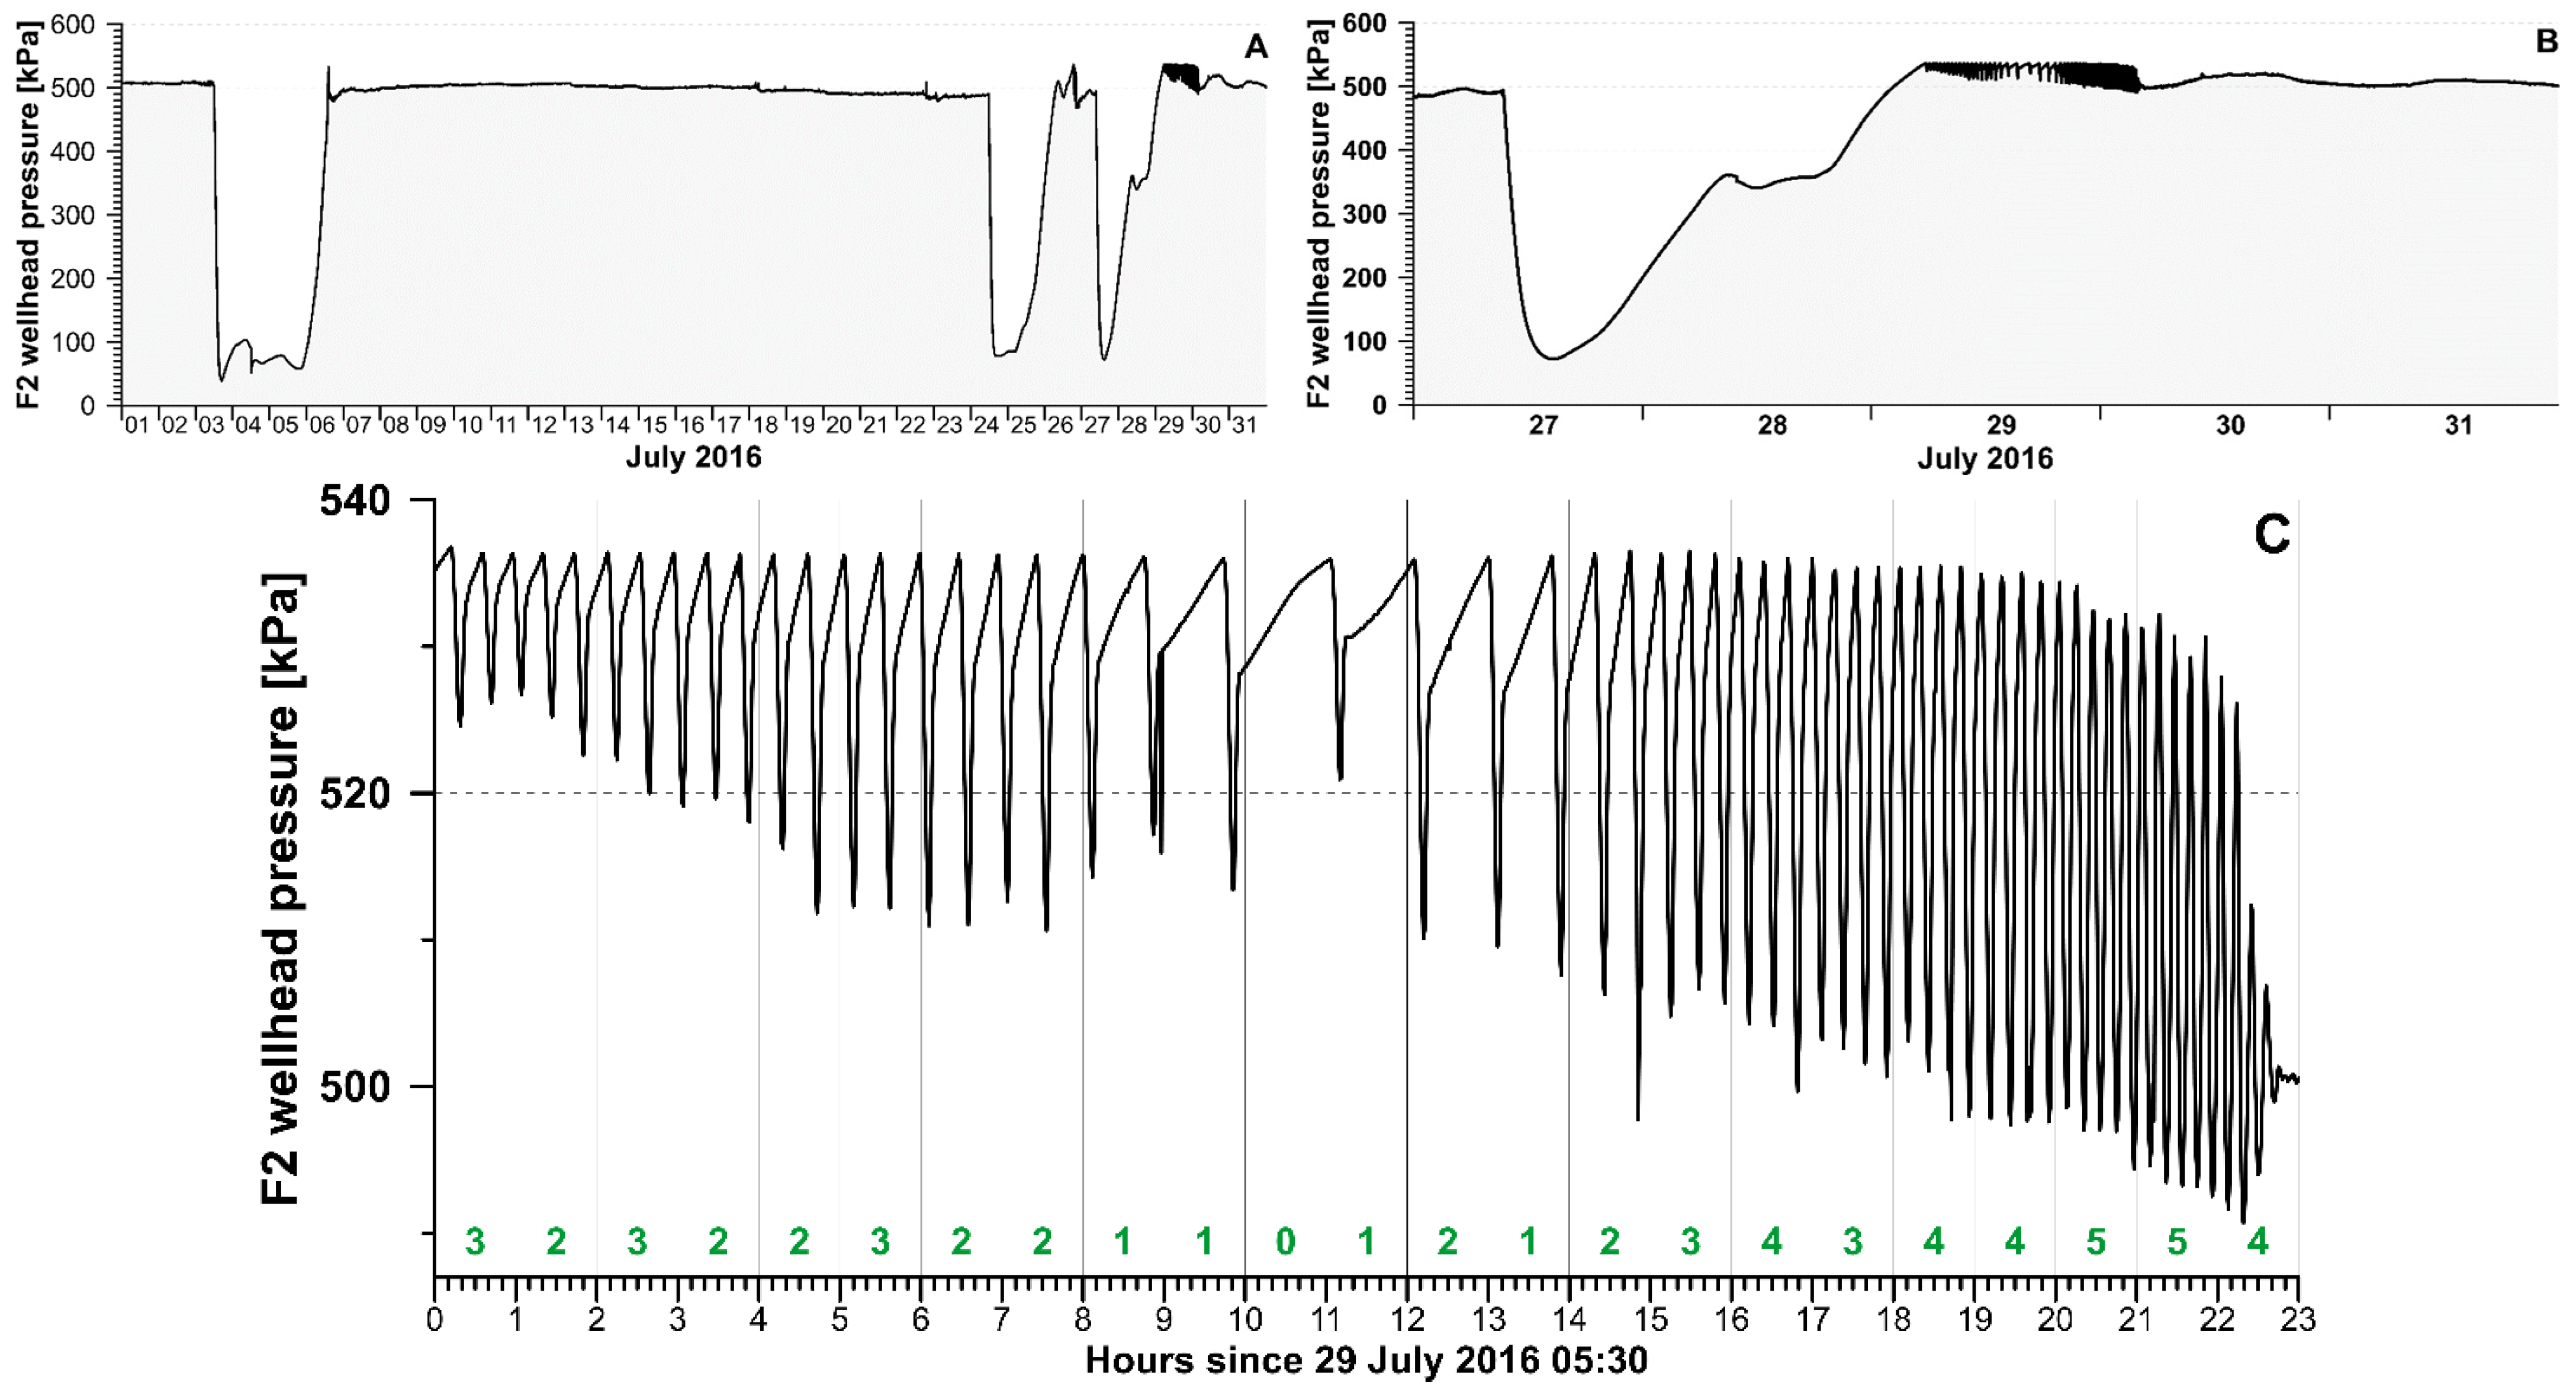
Pressure oscillations at a wellhead are described for the first time as a potentially natural analog to a two-phase pipe–relief valve system known from industrial applications.
The collected data provide the basis for further research at this unique site to study the role of mantle fluids in the triggering of swarm earthquakes.

Author Contributions

Conceptualization, H.W., T.D. and T.F.; Data curation, H.W. and J.V.; Funding acquisition, H.W., T.D., T.F. and K.D.; Investigation, H.W., J.V., T.V., K.D., M.Z., S.N. and J.A.S.; Methodology, S.N. and J.A.S.; Validation, T.V., V.T. and M.L.; Visualization, H.W. and J.V.; Writing—original draft, H.W.; Writing—review and editing, H.W., J.V., T.V., T.D., T.F., K.D., M.Z., S.N., J.A.S. and M.L. All authors have read and agreed to the published version of the manuscript.

Funding

This research was funded by the International Continental Scientific Drilling Program (ICDP), GFZ German Research Centre for Geosciences, the Czech Science Foundation, Czech infrastructure CzechGeo (CZ.02.1.01/0.0/0.0/16_013/0001800), and CzechGeo/EPOS (LM2015079). This work is also part of the research projects “MoRe-Mofette Research” and “MoCa-Monitoring Carbon”, which were funded by the Deutsche Forschungsgemeinschaft (DFG, German Research Foundation)—419880416, 461419881. We received co-funding from the Swedish National Research 783 infrastructure for scientific drilling Riksriggen at Lund University, Sweden.

Data Availability Statement

Data will be made available in the data repository of GFZ at https://dataservices.gfz-potsdam.de (accessed on 15 December 2022), see Heinicke and Woith [17].

Acknowledgments

For technical support before, during, and after drilling, we are grateful to Ulrich Harms, Thomas Wiersberg, Santiago Aldaz, Simona Pierdominici, and Jochem Kück of the Operational Support Group of ICDP. We thank the international team of drillers from Geoněmec-vrty, s.r.o., Protek Norr AB, and PRUY KG, with special thanks to František Kalenda and Milan Němec (Czech Republic), Danilo Pruy (Saxony), Jan-Erik Rosberg and Johan Kullenberg (Sweden), and Friðfinnur K. Danielsson (Iceland). We also thank Ralf Bauz (Germany) for support during drilling of F3. For the breaking point analysis, we are grateful to Susana Barbosa (INES TEC, Portugal). We are grateful for constructive comments by three reviewers, which helped to improve our manuscript.

Conflicts of Interest

The authors declare no conflict of interest. The funders had no role in the design of the study; in the collection, analyses, or interpretation of data; in the writing of the manuscript, or in the decision to publish the results.

Appendix A

Table A1. Properties of the Hartoušov fluids compared to Františkovy Lázně, Kyselecký hamr, and Soos Císařský pramen. Saturation indices calculated with PhreeqC.
HartoušovHartoušovHartoušovHartoušovHartoušovFrantiškovy Soos
MofetteMofetteWellWellWellLázněKyseleckýCísařský
HMH5F1F2 *F3 *E-1 Erika *HamrPramen
sample DATE03.09.201929.08.201903.09.201923.05.201610.09.202029.07.202018.06.201919.06.2019
water temp. (°C)17.719.910.018.420.513.98.617.3
spec.elec.cond. (µS/cm)2121849371673043,000679026206630
pH4.595.404.816.677.705.906.036.05
mmol(eq) %Ca2+49.520.152.515.72.05.39.84.1
Mg2+15.53.720.67.65.32.018.72.5
Na+11.667.010.474.691.091.267.890.2
K+7.92.15.81.61.81.03.71.5
Cl12.252.83.110.321.225.522.420.8
SO42−15.47.14.148.151.752.327.446.8
HCO372.240.192.741.627.122.250.232.4
%ionic balance−0.48−3.104.53−4.801.182.34−0.430.55
saturation indexCalcite−3.68−1.77−2.900.491.64−1.25−1.19−1.00
Dolomite−7.83−4.21−6.300.693.78−2.94−2.22−2.18
Halite−8.89−5.66−8.96−4.92−3.06−4.64−5.60−4.74
Gypsum−2.81−1.94−2.84−0.32−0.29−0.84−1.36−1.01
Anhydrite−3.19−2.30−3.31−0.69−0.63−1.27−1.86−1.39
Chalcedony0.230.400.910.800.670.730.740.86
Quartz0.690.841.391.251.111.191.221.31
CO2(g)0.310.170.42−0.38−0.91−0.04−0.220.01
pCO2 (kPa)20414926042129261101
remarks: * analysis performed by CZ lab.
Airlift operations to clean the well F3 were conducted on 10 September 2020 and 3 February 2021. In both cases, the recovery of the water level was monitored manually. Thus, rough estimates of the transmissivity could be obtained using the Cooper–Jacob [44] method (Figure A1), indicating values of T of the order of 5–9 × 10⁻⁸ m2/s. For comparison, aquifers suitable for water exploitation have transmissivities greater than 0.015 m2/s [45].
Figure A1. Results of well recovery tests according to Cooper–Jacob after two airlift operations.
Geosciences 13 00002 g0a1

References

  1. Mörner, N.A.; Etiope, G. Carbon Degassing from the Lithosphere. Glob. Planet. Change 2002, 33, 185–203. [Google Scholar] [CrossRef]
  2. Chiodini, G.; Granieri, D.; Avino, R.; Caliro, S.; Costa, A.; Minopoli, C.; Vilardo, G. Non-Volcanic CO2 Earth Degassing: Case of Mefite D’ansanto (Southern Apennines), Italy. Geophys. Res. Lett. 2010, 37, L11303. [Google Scholar] [CrossRef]
  3. Karin, B.; Kämpf, H.; Strauch, G. Seismically Triggered Anomalies in the Isotope Signatures of Mantle-Derived Gases Detected at Degassing Sites Along Two Neighboring Faults in Nw Bohemia, Central Europe. J. Geophys. Res.-Solid Earth 2014, 119, 5613–5632. [Google Scholar] [CrossRef] [Green Version]
  4. Etiope, G.; Martinelli, G. Migration of Carrier and Trace Gases in the Geosphere: An Overview. Phys. Earth Planet. Inter. 2002, 129, 185–204. [Google Scholar] [CrossRef]
  5. Weinlich, F.H.; Stejskal, V.; Teschner, M.; Poggenburg, J. Geodynamic Processes in the Nw Bohemian Swarm Earthquake Region, Czech Republic, Identified by Continuous Gas Monitoring. Geofluids 2013, 13, 305–330. [Google Scholar] [CrossRef]
  6. Dahm, T.; Hrubcová, P.; Fischer, T.; Horálek, J.; Korn, M.; Buske, S.; Wagner, D. Eger Rift Icdp: An Observatory for Study of Non-Volcanic, Mid-Crustal Earthquake Swarms and Accompanying Phenomena. Sci. Drill. 2013, 16, 93–99. [Google Scholar] [CrossRef] [Green Version]
  7. Fischer, T.; Hrubcová, P.; Dahm, T.; Woith, H.; Vylita, T.; Ohrnberger, M.; Vlček, J.; Horálek, J.; Dědeček, P.; Zimmer, M.; et al. Icdp Drilling of the Eger Rift Observatory: Magmatic Fluids Driving the Earthquake Swarms and Deep Biosphere. Sci. Drill. 2022, 31, 31–49. [Google Scholar] [CrossRef]
  8. IPCC. Ipcc Special Report on Carbon Dioxide Capture and Storage. In Working Group Iii of the Intergovernmental Panel on Climate Change; Davidson, O., Metz, B., de Coninck, H.C., Loos, M., Meyer, L.A., Eds.; Cambridge University Press: Cambridge, UK, 2005. [Google Scholar]
  9. Schütze, C.; Sauer, U.; Beyer, K.; Lamert, H.; Bräuer, K.; Strauch, G.; Flechsig, C.; Kämpf, H.; Dietrich, P. Natural Analogues: A Potential Approach for Developing Reliable Monitoring Methods to Understand Subsurface CO2 Migration Processes. Environ. Earth Sci. 2012, 67, 411–423. [Google Scholar] [CrossRef]
  10. Jia, B.; Chen, Z.L.; Xian, C.G. Investigations of CO2 Storage Capacity and Flow Behavior in Shale Formation. J. Pet. Sci. Eng. 2022, 208, 109659. [Google Scholar] [CrossRef]
  11. Flohr, A.; Schaap, A.; Achterberg, E.P.; Alendal, G.; Arundell, M.; Berndt, C.; Blackford, J.; Böttner, C.; Borisov, S.M.; Brown, R.; et al. Towards Improved Monitoring of Offshore Carbon Storage: A Real-World Field Experiment Detecting a Controlled Sub-Seafloor CO2 Release. Int. J. Greenh. Gas Control 2021, 106, 103237. [Google Scholar] [CrossRef]
  12. Kämpf, H.; Bräuer, K.; Schumann, J.; Hahne, K.; Strauch, G. CO2 Discharge in an Active, Non-Volcanic Continental Rift Area (Czech Republic): Characterisation (δ13C, 3He/4He) and Quantification of Diffuse and Vent CO2 Emissions. Chem. Geol. 2013, 339, 71–83. [Google Scholar] [CrossRef]
  13. Pfanz, H. Mofetten: Kalter Atem Schlafender Vulkane; Deutsche Vulkanologische Gesellschaft: Mendig, Germany, 2008. [Google Scholar]
  14. Bräuer, K.; Kämpf, H.; Strauch, G.; Weise, S.M. Isotopic Evidence (3He/4He, 13CCO2) of Fluid-Triggered Intraplate Seismicity. J. Geophys. Res. B Solid Earth Planets 2003, 108, 2070. [Google Scholar] [CrossRef]
  15. Horalek, J.; Fischer, T. Role of Crustal Fluids in Triggering the West Bohemia/Vogtland Earthquake Swarms: Just What We Know (a Review). Stud. Geophys. Et Geod. 2008, 52, 455–478. [Google Scholar] [CrossRef]
  16. Peterek, A.; Retuher, C.D.; Schunk, R. Neotectonic Evolution of the Cheb Basin (Northwestern Bohemia, Czech Republic) and Its Implication for the Late Pliocene to Recent Deformation in the Western Part of the Eger Rift. Z. Geol. Wiss. Berl. 2011, 5, 335–365. [Google Scholar]
  17. Heinicke, J.; Woith, H. Mofettes and CO2-Rich Mineral Waters of the Nw Bohemia-Vogtland Region; GFZ Data Services: Potsdam, Germany, 2022. [Google Scholar] [CrossRef]
  18. Weinlich, F.H.; Bräuer, K.; Kämpf, H.; Strauch, G.; Tesař, J.; Weise, S.M. An Active Subcontinental Mantle Volatile System in the Western Eger Rift, Central Europe: Gas Flux, Isotopic (He, C, and N) and Compositional Fingerprints. Geochim. Et Cosmochim. Acta 1999, 63, 3653–3671. [Google Scholar] [CrossRef]
  19. Nickschick, T.; Kämpf, H.; Flechsig, C.; Mrlina, J.; Heinicke, J. CO2 Degassing in the Hartoušov Mofette Area, Western Eger Rift, Imaged by CO2 Mapping and Geoelectrical and Gravity Surveys. Int. J. Earth Sci. 2015, 104, 2107–2129. [Google Scholar] [CrossRef]
  20. Kämpf, H.; Broge, A.S.; Marzban, P.; Allahbakhshi, M.; Nickschick, T. Nonvolcanic Carbon Dioxide Emission at Continental Rifts: The Bublak Mofette Area, Western Eger Rift, Czech Republic. Geofluids 2019, 2019, 4852706. [Google Scholar] [CrossRef]
  21. Bräuer, K.; Kämpf, H.; Niedermann, S.; Strauch, G. Monitoring of Helium and Carbon Isotopes in the Western Eger Rift Area (Czech Republic): Relationships with the 2014 Seismic Activity and Indications for Recent (2000–2016) Magmatic Unrest. Chem. Geol. 2018, 482, 131–145. [Google Scholar] [CrossRef]
  22. Daskalopoulou, K.; Woith, H.; Zimmer, M.; Niedermann, S.; Barth, J.A.C.; Frank, A.H.; Vieth-Hillebrand, A.; Vlček, J.; Bağ, C.D.; Bauz, R. Insight into Hartoušov Mofette, Czech Republic: Tales by the Fluids. Front. Earth Sci. 2021, 9, 615766. [Google Scholar] [CrossRef]
  23. Fischer, T.; Vlček, J.; Lanzendörfer, M. Monitoring Crustal CO2 Flow: Methods and Their Applications to the Mofettes in West Bohemia. Solid Earth 2020, 11, 983–998. [Google Scholar] [CrossRef]
  24. Woith, H.; Daskalopoulou, K.; Zimmer, M.; Fischer, T.; Vlček, J.; Trubač, J.; Rosberg, J.E.; Vylita, T.; Dahm, T. Multi-Level Gas Monitoring: A New Approach in Earthquake Research. Front. Earth Sci. 2020, 8, 585733. [Google Scholar] [CrossRef]
  25. Woith, H. Spatial and Temporal Variations of Radon in Ground Air and Ground Water within the Mudurnu Valley, Nw-Turkey. A Contribution to the Turkish-German Joint Project on Earthquake Research. Ph.D. Thesis, Christian-Albrechts-University Kiel, Kiel, Germany, 1996. [Google Scholar]
  26. Parkhurst, D.L.; Appelo, C.A.J. User’s Guide to Phreeqc (Version 2), 312; US Geological Survey: Denver, Colorado, 1999.
  27. Flechsig, C.; Bussert, R.; Rechner, J.; Schütze, C.; Kämpf, H. The Hartousov Mofette Field in the Cheb Basin, Western Eger Rift (Czech Republic): A Comperative Geoelectric, Sedimentologic and Soil Gas Study of a Magmatic Diffuse CO2-Degassing Structure. Z. Für Geol. Wiss. 2008, 36, 177–193. [Google Scholar]
  28. Sandig, C.; Sauer, U.; Bräuer, K.; Serfling, U.; Schutze, C. Comparative Study of Geophysical and Soil-Gas Investigations at the Hartousov (Czech Republic) Natural CO2 Degassing Site. Environ. Earth Sci. 2014, 72, 1421–1434. [Google Scholar] [CrossRef]
  29. Bussert, R.; Kämpf, H.; Flechsig, C.; Hesse, K.; Nickschick, T.; Liu, Q.; Umlauft, J.; Vylita, T.; Wagner, D.; Wonik, T.; et al. Drilling into an Active Mofette: Pilot-Hole Study of the Impact of CO2-Rich Mantle-Derived Fluids on the Geo–Bio Interaction in the Western Eger Rift (Czech Republic). Sci. Dril. 2017, 23, 13–27. [Google Scholar] [CrossRef] [Green Version]
  30. Umlauft, J.; Korn, M. 3-D Fluid Channel Location from Noise Tremors Using Matched Field Processing. Geophys. J. Int. 2019, 219, 1550–1561. [Google Scholar] [CrossRef]
  31. Flores Estrella, H.; Umlauft, J.; Schmidt, A.; Korn, M. Locating Mofettes Using Seismic Noise Records from Small Dense Arrays and Matched Field Processing Analysis in the NW Bohemia/Vogtland Region, Czech Republic. Near Surf. Geophys. 2016, 14, 327–335. [Google Scholar] [CrossRef]
  32. Langelier, W.; Ludwig, H. Graphical Methods for Indicating the Mineral Character of Natural Waters. J. Am. Water Assoc. 1942, 34, 335–352. [Google Scholar] [CrossRef]
  33. Fiala, J.; Vejnar, Z. The Lithology, Geochemistry, and Metamorphic Gradation of the Crystalline Basement of the Cheb (Eger) Tertiary Basin, Saxothuringian Unit. Bull. Geosci. 2004, 79, 41–52. [Google Scholar]
  34. Fischer, T.; Matyska, C.; Heinicke, J. Earthquake-Enhanced Permeability—Evidence from Carbon Dioxide Release Following the ML 3.5 Earthquake in West Bohemia. Earth Planet. Sci. Lett. 2017, 460, 60–67. [Google Scholar] [CrossRef]
  35. Sibson, R.H. Fault-Valve Behavior and the Hydrostatic-Lithostatic Fluid Pressure Interface. In Metamorphic Fluids; Fyfe, W.S., Ed.; Elsevier: Amsterdam, The Netherlands, 1992; pp. 141–144. [Google Scholar]
  36. Zeileis, A.; Kleiber, C.; Kramer, W.; Hornik, K. Testing and Dating of Structural Changes in Practice. Comput. Stat. Data Anal. 2003, 44, 109–123. [Google Scholar] [CrossRef] [Green Version]
  37. Wang, C.Y.; Manga, M. Earthquakes and Water. In Lecture Notes in Earth Sciences; Springer: Berlin/Heidelberg, Germany, 2010; Volume 114. [Google Scholar]
  38. Roeloffs, E.A. Persistent Water Level Changes in a Well near Parkfield, California, Due to Local and Distant Earthquakes. J. Geophys. Res. 1998, 103, 869–889. [Google Scholar] [CrossRef]
  39. Steinberg, G.S.; Steinberg, A.S.; Merzhanov, A.G. Fluid Mechanism of Pressure Rise in Volcanic (Magmatic) Systems with Mass Exchange. Mod. Geol. 1989, 13, 275–281. [Google Scholar]
  40. Woith, H.; Wang, R.J.; Milkereit, C.; Zschau, J.; Maiwald, U.; Pekdeger, A. Heterogeneous Response of Hydrogeological Systems to the Izmit and Duzce (Turkey) Earthquakes of 1999. Hydrogeol. J. 2003, 11, 113–121. [Google Scholar] [CrossRef]
  41. Wang, R.; Woith, H.; Milkereit, C.; Zschau, J. Modelling of Hydrogeochemical Anomalies Induced by Distant Earthquakes. Geophys. J. Int. 2004, 157, 717–726. [Google Scholar] [CrossRef] [Green Version]
  42. Bjornstad, B.N.; McKinley, J.P.; Stevens, T.O.; Rawson, S.A.; Frederickson, J.K.; Long, P.E. Generation of Hydrogen Gas as a Result of Drilling within The Saturated Zone. Ground Water Monit. Remediat. 1994, 14, 140–147. [Google Scholar] [CrossRef]
  43. Daniels, L.; Belay, N.; Rajagopal, B.S.; Weimer, P.J. Bacterial Methanogenesis and Growth from CO2 with Elemental Iron as the Sole Source of Electrons. Science 1987, 237, 509–511. [Google Scholar] [CrossRef]
  44. Anisichkin, V.F. Mechanism of Carbon Release during Detonation Decomposition of Substances. Combust. Explos. Shock Waves 1994, 30, 667–673. [Google Scholar] [CrossRef]
  45. Cooper, H.H.; Jacob, C.E. A Generalized Graphical Method for Evaluating Formation Constants and Summarizing Well Field History. Trans. Am. Geophys. Union 1946, 27, 526–534. [Google Scholar] [CrossRef]
  46. Freeze, A.R.; Cherry, J.A. Groundwater; Prentice Hall: Englewood Cliffs, NJ, USA, 1979. [Google Scholar]
  47. Wang, C.; Yang, J.; Nilsson, H. Simulation of Water Level Fluctuations in a Hydraulic System Using a Coupled Liquid-Gas Model. Water 2015, 7, 4446–4476. [Google Scholar] [CrossRef] [Green Version]
  48. Fischer, T.; Horálek, J.; Hrubcová, P.; Vavryčuk, V.; Bräuer, K.; Kämpf, H. Intra-Continental Earthquake Swarms in West-Bohemia and Vogtland: A Review. Tectonophysics 2014, 611, 1–27. [Google Scholar] [CrossRef]
  49. Kolářová, M. Hydrogeologie chebské pánve. Sb. Geol. Věd Hydrogeol. Inz. Geol. 1965, 3, 7–101. [Google Scholar]
  50. Hurst, A.; Scott, A.; Vigorito, M. Physical Characteristics of Sand Injectites. Earth-Sci. Rev. 2011, 106, 215–246. [Google Scholar] [CrossRef]
  51. Pitz, M.; Bussert, R. Proceedings of the CO2-Induced Natural Deformation Structures in Well HJB-1 (Cheb Basin, Czech Republic), Münster, Germany, 22–25 September 2019; Available online: https://www.google.com/url?sa=t&rct=j&q=&esrc=s&source=web&cd=&cad=rja&uact=8&ved=2ahUKEwj76ri53on8AhWBlmoFHXrsAeUQFnoECA4QAQ&url=http%3A%2F%2Fwww.geomuenster2019.de%2Fassets%2Fgeomuenster_book_of_abstracts.pdf&usg=AOvVaw3rosxMXO1ZOpTHYjNxevN9 (accessed on 27 October 2022).
Figure 2. Principle sketch of the fluid and seismic monitoring setup at the Hartoušov mofette field. While the instrumentation of F1 and F2 is in place, instrumentation of F3 is planned in the near future. The horizontal distance is not to scale.
Geosciences 13 00002 g002
Figure 3. Map of the Hartoušov mofette system showing CO2 flux distribution (from Nickschick et al. [15], light gray colors indicate a CO2 flux above 25 g/d/m2; red colors mark regions with a CO2 flux >50 kg/d/m2), the location of the ICDP research boreholes (F1, F2, and F3), wet and dry mofettes according to [12], historic springs, boreholes (the latter two from GDO (geologically documented objects) database of the Czech Geological Survey), and shallow drillholes (from [27]). (A) Position of SW–NE and NW–SE profiles used for the stratigraphic and hydrogeological profiles shown in Figure 4. (B) Numbers in boxes indicate air-corrected helium isotope ratios (3He/4He)c in RA units from Daskalopoulou et al. [22].
Geosciences 13 00002 g003
Figure 4. Lithologic and stratigraphic units from drillholes along two transects through the Hartoušov mofette field compiled from Bussert et al. [29], the GDO database of the Czech Geological Survey, and own data for F1, F2, and F3. Site IDs are given at the top of each figure; their locations are shown in Figure 3. (A) SW–NE profile with gamma logs shown for F2 and F3. Inset: Soil CO2 concentrations at 0.4 to 0.8 m depth (white bars) and δ13C values (white circles) along a SW–NE profile located about 20 m to the north of F3 [28]. Greenish colors indicate δ13C values typical for organic material, whereas red to brownish colors indicate mantle origin. (B) NW–SE profile; blue stars mark a channel-like structure obtained from matched field processing of seismic noise data (see Table 2 and Figure 8a in Umlauft and Korn [30]).
Geosciences 13 00002 g004
Figure 7. (A) Response of the gas flow (blue), wellhead pressure (green), and water level (red) of F1 well to a local flood documented in (B). Photo taken by Josef Vlček on 24 May 2018 at 15:42 local time. View from F1 looking westwards. The wooden hut sits on top of well F2.
Geosciences 13 00002 g007
Figure 8. Gas flow rate (daily averages; blue symbols) at F1 during the 2014 earthquake swarm. Seismic energy density (black bars) calculated according to [37] for the site Hartoušov. Vertical green lines indicate two breaking points suggested by the code of [36]: #1 on 23 May and #2 on 2 June 2014 (the height of the green bars is proportional to their relevance).
Geosciences 13 00002 g008
Figure 9. Wellhead pressure at borehole F3 from January 2020 to August 2022. Vertical dashed lines indicate the time of various hydraulic experiments.
Geosciences 13 00002 g009
Figure 10. Wellhead pressure changes following three perforation shots on 19 January 2022. (A) Temporal evolution, (B) pressure increase related to the amount of explosives.
Geosciences 13 00002 g010
Figure 11. Response of F1 and F2 to drilling activities at F3. From the top: F1 gas flow, wellhead pressure at F1 and F2, and F2 fluid pressure at 94 m depth. The brown curve indicates the progress of the F3 drilling operation.
Geosciences 13 00002 g011
Figure 12. Wellhead pressure excursions at F2 (A) during July 2016, (B) details during 27–31 July 2016, and (C) a zoom showing the oscillations which started 29 July 2016 at 05:30 UTC. The green numbers indicate the frequency of the oscillations in cycles per hour.
Geosciences 13 00002 g012
Table 1. Properties of the Hartoušov fluids compared to Františkovy Lázně, Kyselecký hamr, and Soos Císařský pramen. Chemical and isotopic data of Hartoušov mofette HM, Hartoušov F1, and Hartoušov F2 are taken from Daskalopoulou et al. [22]. The abbreviations n.a. and b.d.l. stand for “not analyzed” and “below detection limit”, respectively.
HartoušovHartoušovHartoušovHartoušovHartoušovFrantiškovy Soos
MofetteMofetteWellWellWellLázněKyseleckýCísařský
HMH5F1F2 *F3 *E-1 Erika *HamrPramen
sample DATE03.09.201929.08.201903.09.201923.05.201610.09.202029.07.202018.06.201919.06.2019
water temp. (°C)17.719.910.018.420.513.98.617.3
spec.elec.cond. (µS/cm)2121849371673043,000679026206630
pH4.595.404.816.677.705.906.036.05
mg/LLi+n.a.n.a.0.202.70n.a.2.571.903.30
Na+5.12609.5166013,40016504531614
K+5.91496044931.74246
Mg2+3.67.6108941119.46624
Ca2+196842305252845764
Sr2+n.a.0.230.306.40n.a.0.690.360.10
Ba2+0.070.080.140.03n.a.0.01b.d.l.b.d.l.
Mn2+0.180.700.51n.a.n.a.0.530.241.60
Fe2+/3+8.333.012.013.72.78.9n.a.35
SiO223.636.489.986.257.264.357.896.4
F0.080.110.510.60n.a.0.81b.d.l.b.d.l.
Cl8.433643844710682233569
SO42−14.3617.2243015,60018903861731
HCO385439207267010,40010208971525
222Rn gas (Bq/L)71.759.622.72 xn.a.n.a.0.1304
δ13C (‰)−2.4n.a.−1.5−1.8 §n.a.n.a.n.a.n.a.
(3He/4He)c (RA)5.76 ± 0.09 §5.81 ± 0.305.77 ± 0.09 $5.70 ± 0.10 §n.a.n.a.3.86 ± 0.093.24 ± 0.08
4He/20Ne22.7 ± 1.6 §72.5 ± 6.3203 ± 18 $18.7 ± 1.3 §n.a.n.a.8.38 ± 0.4914.9 ± 1.1
vol.%CO299.8599.8799.7599.87n.a.n.a.99.6799.88
O20.020.010.050.02n.a.n.a.0.100.04
N20.120.110.200.11n.a.n.a.0.220.08
µmol/molHe20.323.525.824.9n.a.n.a.0.50.2
H2b.d.l.0.8b.d.l.b.d.l.n.a.n.a.b.d.l.b.d.l.
Ar28.128.143.923.8n.a.n.a.56.718.2
CH45.5315.74.955.99n.a.n.a.2.322.68
C2H4b.d.l.0.01b.d.l.b.d.l.n.a.n.a.b.d.l.0.11
C2H60.060.08b.d.l.0.01n.a.n.a.0.070.04
C3H8b.d.l.0.001b.d.l.b.d.l.n.a.n.a.b.d.l.b.d.l.
remarks: * analysis performed by CZ lab; x radon measured 18.06.2019; § sample of 30.08.2019; $ sample of 14.08.2019.
Table 2. Depth ranges and amount of explosives used during the perforation attempts. “RDX volume m” refers to the length of the borehole occupied by the expanded gas.
PerforationRDXPressureDelayRDXRDX
DepthExplosivesChangeTimeVolumeVolumeVelocity
Date & Time UTCShotRangegkPaminLmm/s
15 January 2020 08:29#1.1228.5 m24 22.24.3
15 January 2020 10:11#1.2229 m24 22.24.3
19 January 2022 09:55#2.1231–230.5 m80451274.214.40.30
19 January 2022 12:27#2.2207–206 m16016110148.328.80.30
19 January 2022 13:27#2.3188.5–186.5 m3202606296.657.60.36
Disclaimer/Publisher’s Note: The statements, opinions and data contained in all publications are solely those of the individual author(s) and contributor(s) and not of MDPI and/or the editor(s). MDPI and/or the editor(s) disclaim responsibility for any injury to people or property resulting from any ideas, methods, instructions or products referred to in the content.

