Article

Kelvin and Rossby Wave Contributions to the Mechanisms of the Madden–Julian Oscillation

Department of Earth and Planetary Sciences, Yale University, New Haven, CT 06511, USA
Geosciences 2022, 12(9), 314; https://doi.org/10.3390/geosciences12090314
Submission received: 30 June 2022 / Revised: 11 August 2022 / Accepted: 17 August 2022 / Published: 23 August 2022

Abstract

:
The Madden–Julian Oscillation (MJO) is a large-scale tropical weather system that generates heavy rainfall over the equatorial Indian and western Pacific Oceans on a 40–50 day cycle. Its circulation propagates eastward around the entire world and impacts tropical cyclone genesis, monsoon onset, and mid-latitude flooding. This study examines the mechanism of the MJO in the Lagrangian atmospheric model (LAM), which has been shown to simulate the MJO accurately, and which predicts that MJO circulations will intensify as oceans warm. The LAM MJO’s first baroclinic circulation is projected onto a Kelvin wave leaving a residual that closely resembles a Rossby wave. The contribution of each wave type to moisture and moist enthalpy budgets is assessed. While the vertical advection of moisture by the Kelvin wave accounts for most of the MJO’s precipitation, this wave also exports a large amount of dry static energy, so that in total, it reduces the column integrated moist enthalpy during periods of heavy precipitation. In contrast, the Rossby wave’s horizontal circulation builds up moisture prior to the most intense convection, and its surface wind perturbations enhance evaporation near the center of MJO convection. Surface fluxes associated with the Kelvin wave help to maintain its circulation outside of the MJO’s convectively active region.

1. Introduction

1.1. MJO Overview and Impacts

The Madden Julian Oscillation (MJO) is a large-scale tropical weather disturbance that produces heavy rainfall over the equatorial Indian and western Pacific Oceans on a 45–50 day cycle [1,2,3,4]. The MJO’s circulation, which includes low-level cyclonic gyres and an upper-level quadrapole [5], is strongly coupled with moist convection over the western Pacific warm pool and more weakly coupled with convection in the eastern Pacific and western hemisphere [6,7,8]. Although the MJO’s convective envelope generally moves slowly eastward, it contains smaller-scale convective systems that propagate in a variety of directions, including eastward and westward in the equatorial west Pacific [9,10,11] and northward in Asian monsoon regions [12].
The MJO has important impacts on weather and climate all over the world. First, it modulates tropical cyclones over the Atlantic, Indian, and Pacific Oceans [13,14]. Second, it affects the timing of active and break periods in Asian, Australian, and North American Monsoons [15,16], as well as the frequency and intensity of monsoon disturbances [17]. Third, it is known to impact mid- and high-latitude weather, modulating atmospheric rivers that can cause extreme flooding [18], and interacting with the stratospheric polar vortex and North Atlantic Oscillation [19]. Finally, westerly wind bursts associated with the MJO can impact the development of El Nino events, including their timing and diversity [20,21]. In particular, extreme El Nino events (in 1982, 1997, and 2015) all started after a strong sequence of westerly wind bursts generated within the MJO [22].

1.2. Proposed MJO Mechanisms

Despite decades of study and numerous modeling attempts and theoretical interpretations, the mechanisms of the Madden–Julian Oscillation (MJO) are not fully understood. Many different MJO theories have been put forward to explain the MJO’s instability and/or slow eastward propagation, and they do not agree on which physical processes are the most important [23,24,25]. The processes these theories emphasize include enhanced surface evaporation in the MJO’s perturbation easterlies [26,27] or westerlies [28,29]; frictional surface convergence to the east of the MJO’s convection [25,30,31]; perturbations to atmospheric radiation [29,32,33,34,35]; momentum transport, moistening, and/or convective triggering due to smaller-scale disturbances [36,37,38]; and baroclinic instability [39] to name a few.
The various MJO theories also differ in the roles played by the two key dynamical components of the MJO’s circulation: the Kelvin wave and the Rossby wave [40,41,42]. Early on, the MJO was essentially interpreted as a convectively coupled Kelvin wave, gaining energy from wind-induced surface heat exchange where MJO perturbation easterlies increased surface wind speed [26,43,44]. In later theories, the role of the Kelvin wave shifted to being a region of low pressure, where frictionally induced meridional moisture convergence helped convection move eastward [25,30], and/or enhanced surface fluxes where it contributed perturbation westerlies in regions of basic state westerly winds [7,29]. While there has generally been a consensus that the MJO’s low-level Rossby gyres on the western edge of its precipitation envelope cause drying by pulling in off-equatorial air (e.g., [45,46]), there have been diverse perspectives on the role of the Rossby wave in initiating the MJO and/or causing eastward propagation, which include moistening where the Rossby wave contributes off-equatorial flow [21,47], advection from suppressed MJO phase Rossby waves over the Indian ocean [48], and eastward advection of the MJO’s moisture perturbation by Rossby wave perturbation westerlies [49,50]. Moreover, in many MJO theories, the individual roles of Kelvin and Rossby waves are hard to discern, as both are included in the dynamics, and only the effects of their superposition are considered.

1.3. Modeling the MJO

For decades, the MJO has been a challenge to simulate, with models often having too little variance in the MJO wavenumber/frequency band and/or lacking sufficient eastward propagation [51,52,53]. While improvements in modeling the MJO have been obtained by either using embedded two-dimensional cloud-permitting models to represent the effects of convection [54,55] or increasing convective entrainment to make parameterized convection more sensitive to atmospheric moisture, the former approach is much more computationally intensive than traditional convective parameterizations, and the latter technique can lead to inaccuracies in modeling the atmosphere’s basic state [56]. Moreover, despite recent advances in modeling the MJO, even cutting edge forecast models have substantial room for improvement in predicting rainfall on MJO time scales [57].

1.4. MJO Changes with Global Warming

There is growing evidence that the MJO is becoming more frequent and intense with time as the oceans warm. Slingo et al. [58] used zonally integrated equatorial zonal wind as a metric of MJO activity, and noted a substantial increase in the late 1970s, which seemed to be associated with warming in the Indian Ocean. Jones and Carvalho [59] examined changes in the MJO starting in 1958, and found positive trends in lower- and upper-level zonal wind anomalies and the number of summer and winter MJO events, some of which were statistically significant at the 95 percent confidence level. Moreover, many simulations suggest that the MJO will become more frequent and intense and will propagate more rapidly as the climate warms [55,60,61,62,63,64,65,66]. Possible mechanisms for these changes include sharper vertical and horizontal gradients in basic state moisture, changes to dry and moist stratifications, and enhanced evaporation over warmer oceans [46,55,64,67,68,69].
A changing MJO could lead to many significant climate impacts. First, its influence on tropical cyclones, Asian, Australian, and American monsoons and mid- and high-latitude weather could all increase with time. Second, the momentum transport associated with the MJO could also increase, leading to fundamental changes in the atmospheric circulation, such as equatorial superrotation [62]. Third, combined direct effects of changes to MJO wind perturbations, and indirect effects such as MJO-induced changes to tropical cyclonic disturbances, could alter the wind stress on equatorial oceans [70], possibly even causing structural changes to equatorial ocean SSTs [71].

1.5. Motivation

Because of the importance of the MJO for global weather and climate, and the growing evidence that it is intensifying as the oceans warm, it should be a high priority to warn society about the potential impacts of a strengthening MJO. Both future MJO changes and their impacts depend on the mechanism(s) of the MJO, which are still a matter of debate, and which are not adequately represented in many climate and forecasting models. Therefore, in this study, we use a novel Lagrangian atmospheric model (LAM) that has been tuned to simulate robust and realistic MJOs, and recently developed dynamical analysis techniques, to better understand the mechanisms of the MJO. In particular, we use the Kelvin/Rossby dynamical decomposition developed by [42] to isolate the contributions of Kelvin and Rossby waves to moisture and moist enthalpy budgets for the LAM MJO. Because the structure of the LAM MJO closely resembles that of the observed MJO [49], particularly its decomposition into Kelvin and Rossby components [42], we expect that many of the conclusions drawn about the mechanisms of the LAM MJO will also apply to the observed MJO. Moreover, we also hope this analysis will shed light on why Lagrangian models predict the MJO’s circulation will intensify with ocean warming [64,66], whereas some other models do not predict such intensification [65].
This paper builds directly on the results of Haertel [42], who developed a method of decomposing MJO circulations into components associated with Kelvin and Rossby waves. That study also established that the Kelvin wave portion of the MJO’s circulation is well represented by simple linear dynamics, and that it can be simulated as a linear response to a heat source. In contrast, the Rossby wave component of the circulation has important deviations from linear theory for a basic state of rest: gyres become centered much farther from the equator than simple linear theory predicts, and they move eastward instead of westward during the life cycle of the MJO. Haertel [42] did not consider how Kelvin and Rossby wave circulations feed back on the moisture and moist enthalpy budgets of the MJO, however, which is the focus of this paper.
This study is organized as follows. Section 2 describes the Lagrangian model and methods for creating a composite MJO, decomposing circulations into Kelvin and Rossby components, and computing moisture and moist enthalpy budgets. In Section 3, we compare the dynamical structure of the LAM MJO to that of the observed MJO, and then isolate contributions of Kelvin and Rossby waves to the moisture and moist enthalpy budgets. Section 4 discusses the results in light of other studies, and Section 5 provides the conclusions.

2. Materials and Methods

2.1. Lagrangian Atmospheric Model

The Lagrangian Atmospheric Model (LAM) simulates atmospheric circulations by predicting the motions of individual air parcels [72]. It includes a unique convective parameterization in which vertical positions of parcels are exchanged in convectively unstable regions [49,73]. The LAM has been shown to simulate MJOs with realistic horizontal structure, vertical structure, and convective life cycles [8,49,64,66,73,74]. In this study, we use a 4-year simulation with prescribed sea surface temperatures (SSTs) that are monthly averages for the years 1998–2009. The equivalent Eulerian horizontal resolution is approximately 3.75 degrees in longitude and 1.875 degrees in latitude, with average vertical spacing of parcels of about 29 hPa. Nineteen MJOs occur during this simulation. Haertel [42] previously used this simulation to show that the LAM reproduces the observed partitioning of MJO circulations between Kelvin and Rossby Waves, which is why it was selected as the primary data source for this study. However, in that study, fields were analyzed on pressure surfaces, whereas here, we use a sigma coordinate system for more precise calculations of column integrated moisture and moist enthalpy budgets.

2.2. Composite MJOs

In previous research, we found it useful to create an observational composite of MJO wind, temperature, and moisture perturbations in the vicinity of the MJO’s convective envelope using only raw atmospheric sounding data [8]. This composite depicts MJO circulations for each of the developing, mature, and dissipating stages of the MJO’s convective envelope, and it uses a coordinate system centered on the MJO’s convective envelope, and not a particular location. This is important because the formation and dissipation locations for the convective envelope vary from one MJO to the next, and MJO circulations are intimately connected to convection. This approach also puts particular sounding locations in different positions (in the MJO-centered coordinate system) for different MJOs, which increases the spatial coverage of the observations. Soundings for the observational MJO composite were taken from the Integrated Global Radiosonde Array for the period 1996–2009 [75]. There were 44 MJOs that occurred over a 13-year period (3.4 MJOs per year).
In this study, we use the same basic approach to create an MJO composite for the LAM simulation. Here, we use the objective tracking algorithm developed by [66] for identifying MJOs. We analyze MJO perturbations to wind, temperature, and moisture on sigma surfaces with a 0.05 resolution for each of the developing, mature, and dissipating stages of the MJO in a MJO-centered coordinate system following Haertel et al. [8]. We plot data for the corresponding pressure surface (e.g., sigma = 0.2 corresponds to p = 200 hPa) for ease of comparison with observational data and other studies. Nineteen MJOs occur during the 4-year LAM simulation (4.75 MJOs per year).

2.3. Moisture and Moist Enthalpy Budgets

In order to understand the mechanisms of the LAM MJO, we examine how different components of the MJO’s circulation bring moisture and heat to the center of convection. The column integrated moisture budget is as follows:
q d t = u q x + v q y + ω q p + E P
where q is specific humidity, u is zonal velocity, v is meridional velocity, ω is pressure velocity, E is evaporation, P is precipitation, t is time, and [ ] denotes column integration, with mass as the metric (e.g., d p / g ). Now, let h = C p T + L q , where C p is the specific heat at constant pressure for dry air and L is the latent heat of vaporization. Then, the column integrated moist enthalpy budget is as follows:
h t = u h x + v h x + ω h p + [ α ω ] + [ R ] + S + E
where T is temperature, α is specific volume, R is radiative heating, and S is the sensible heat flux. The first three terms on the right hand side of (2) represent the column integrated advection of moist enthalpy, compressional warming, and radiative heating, respectively. Note that precipitation does not change the moist enthalpy (other than through unbalanced melting/freezing effects), but rather converts enthalpy from the moisture term to the temperature term. Equation (2) can be derived by combining (1) with the thermodynamic equation [76] without any approximations beyond the hydrostatic equation and neglecting melting/freezing effects. The compressional warming ( [ α ω ] ) can be written as the vertical advection of geopotential ( g z ), so that it is the vertical advection of moist static energy that changes the column integrated moist enthalpy. In contrast, the horizontal advection terms involve moist enthalpy itself (see also [45]). This distinction is often not made in applications of moist static energy budgets to tropical convection systems, but here, we choose to include only those terms provided by combining the column integrated moisture and thermodynamic equations for accuracy.

2.4. Kelvin/Rossby Decomposition

In order to isolate the contributions of Kelvin and Rossby waves to the moisture and moist enthalpy budgets of the MJO, we project its vertical structure onto an empirical deep convective mode (DCM) and then project the horizontal structure of the DCM onto an equatorial Kelvin wave and subtract out the Kelvin wave component to obtain the Rossby wave structure following [42]. Let ϕ d c ( p ) be the average, mass-balanced horizontal divergence within 10 degrees longitude and 5 degrees latitude of the LAM MJO’s convective center during the mature stage (Figure 1). We normalize ϕ d c :
ϕ ˜ d c = ϕ d c / < ϕ d c , ϕ d c >
where <> denotes an inner product applied over the vertical coordinate, and we then project MJO wind perturbations onto ϕ d c :
u ^ = < u , ϕ ˜ d c >
v ^ = < v , ϕ ˜ d c >
u p = u ^ ϕ ˜ d c
v p = v ^ ϕ ˜ d c
where u p , v p are the zonal and meridional components of the projected flow. We then compute the mean tropospheric temperature, and 850–200 hPa wind shear for the projected flow, and apply the method described in the Appendix of [42] to these fields to separate Kelvin and Rossby wave components. Note that this only partitions the portion of the MJO’s circulation that projects onto the deep convective mode into Rossby and Kelvin waves; however, as we show below, the deep convective circulation accounts for most of the moisture and moist enthalpy transport. Note also that the deep convective mode would likely project strongly onto 2–3 vertical normal modes of a dry tropical troposphere [77,78,79]. However, previous research has shown that in tropical deep convective systems, the partial cancelation of adiabatic cooling due to vertical motion by convective heating varies in such a way that these modes have the roughly same “moist” equivalent depth [11,79], and that a single mode such as that shown in Figure 1 can capture the gross flow structure of the MJO [42].

3. Results

3.1. Composite MJO and Kelvin/Rossby Projection

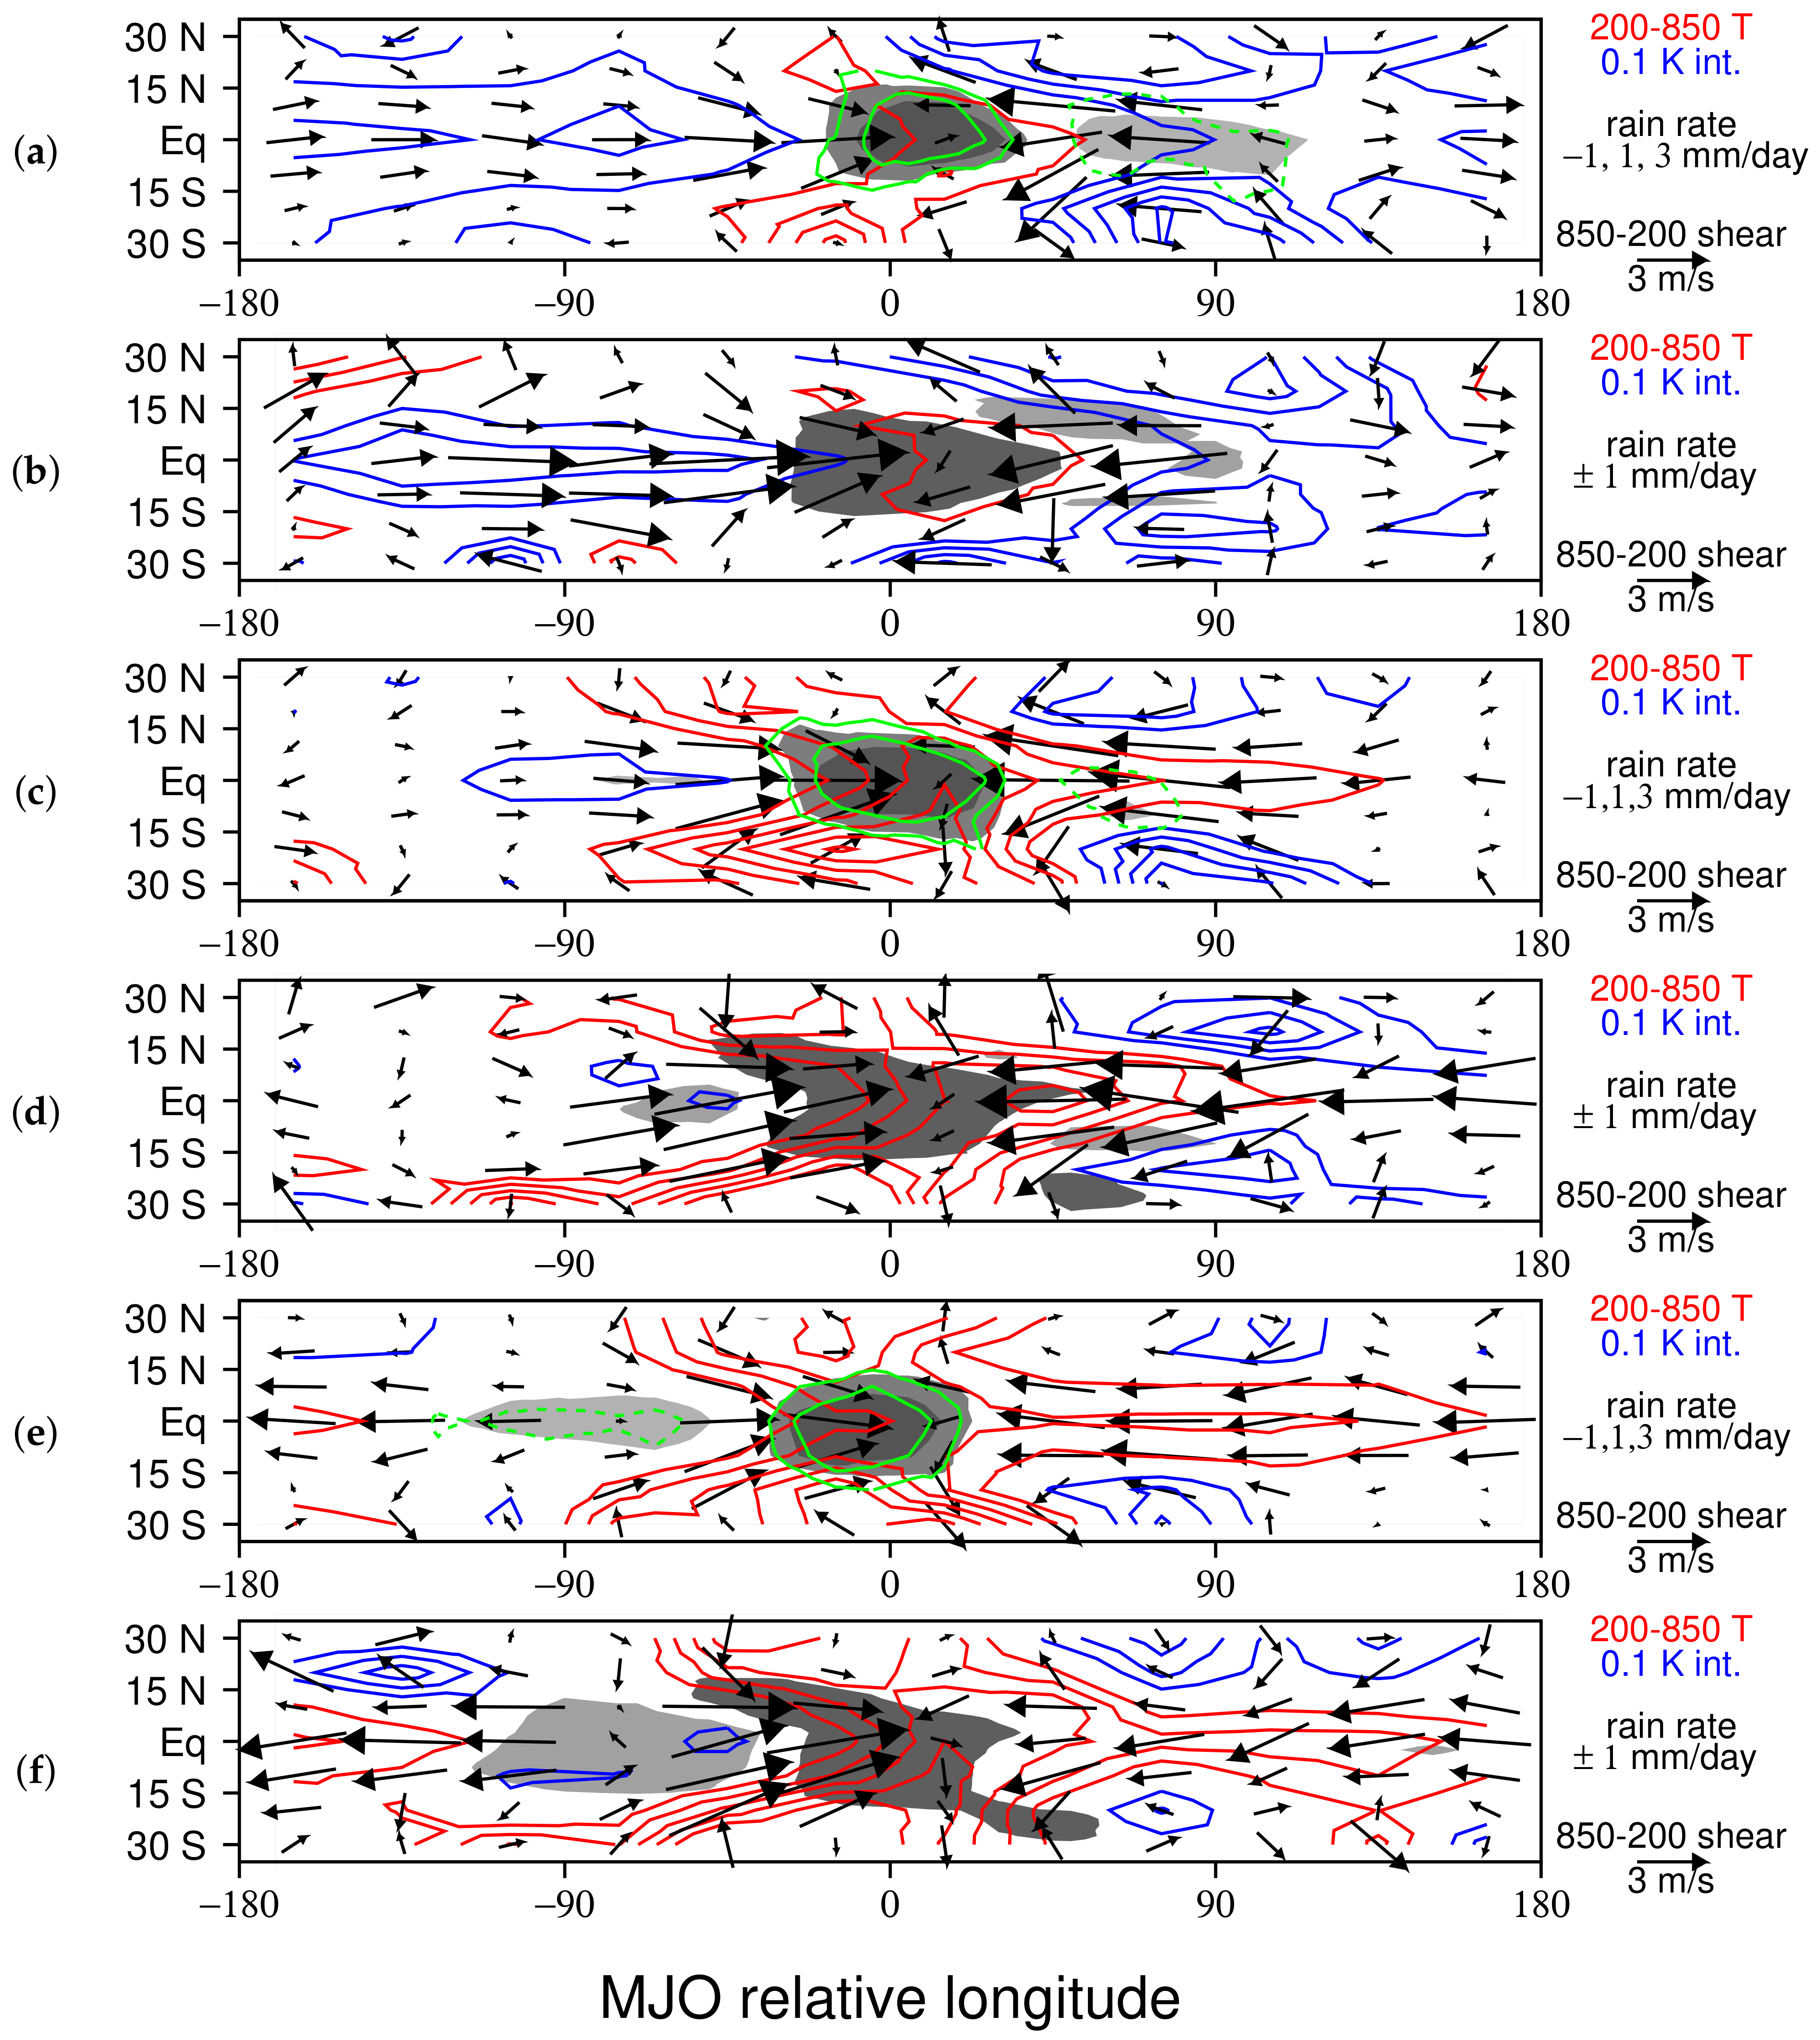
As previously noted by [42], the LAM reproduces the observed life cycle of Kelvin and Rossby wave circulations in the MJO for the developing, mature, and dissipating stages of the convective envelope. In that study, the total flow was used to analyze the Kelvin and Rossby wave components. Here, we show that the same can be said for the projection of the flow onto the deep convective mode (Figure 1). During the developing stage, in both the LAM DCM (Figure 2a) and the observations (Figure 2b), westerly low-level flow occurs in a cool troposphere to the west of the convective center near the equator, and anticyclonic low-level flow encircles negative off-equatorial temperature perturbations centered 70–100 degrees east of the convective center. Kelvin–Rossby (K-R) decomposition reveals that these two circulation components are Kelvin (Figure 3a,b) and Rossby (Figure 4a,b) waves, respectively. The K-R decomposition also shows a positive-phase Kelvin wave with easterly low-level flow starting to grow eastward from the MJO’s convection (Figure 3a,b), as well as a positive phase Rossby wave growing on the western side of MJO’s precipitation region (Figure 4a,b).
During the mature and dissipating phases, in both the LAM DCM and the observations, the cool-phase Kelvin wave to the west of the MJO shrinks, and the warm-phase Kelvin wave to the east of the MJO grows (Figure 2c–f and Figure 3c–f). Similarly, the amplitude of the cool-phase Rossby waves to the east of the MJO decreases, and the positive-phase Rossby waves to the west of the MJO strengthen (Figure 2c–f and Figure 4c–f). The growth of positive-phase Rossby waves to the west of the MJO’s convection, as well as the positive-phase Kelvin wave to the east, is consistent with the predictions of linear theory [41,42]. However, at later times, the Rossby gyres are centered farther off the equator than linear theory predicts (Figure 4c–f), as was previously noted by [42].
The amplitudes of Kelvin wave wind and temperature perturbations are slightly weaker in the LAM than in nature (Figure 3), but Rossby wave perturbations are, on average, of a similar magnitude (Figure 4). The areal coverage of precipitation is slightly smaller in the LAM than in nature (Figure 2, Figure 3 and Figure 4). However, the phasing of Kelvin and Rossby wave circulations, as well as their positioning relative to precipitation regions, are similar in the LAM DCM and in the observations for each of the developing, mature, and dissipating stages of the MJO convective envelope (Figure 3 and Figure 4), which suggests that these circulations might play a similar role in the mechanisms of the simulated and observed MJOs.

3.2. Moist Enthalpy Budget

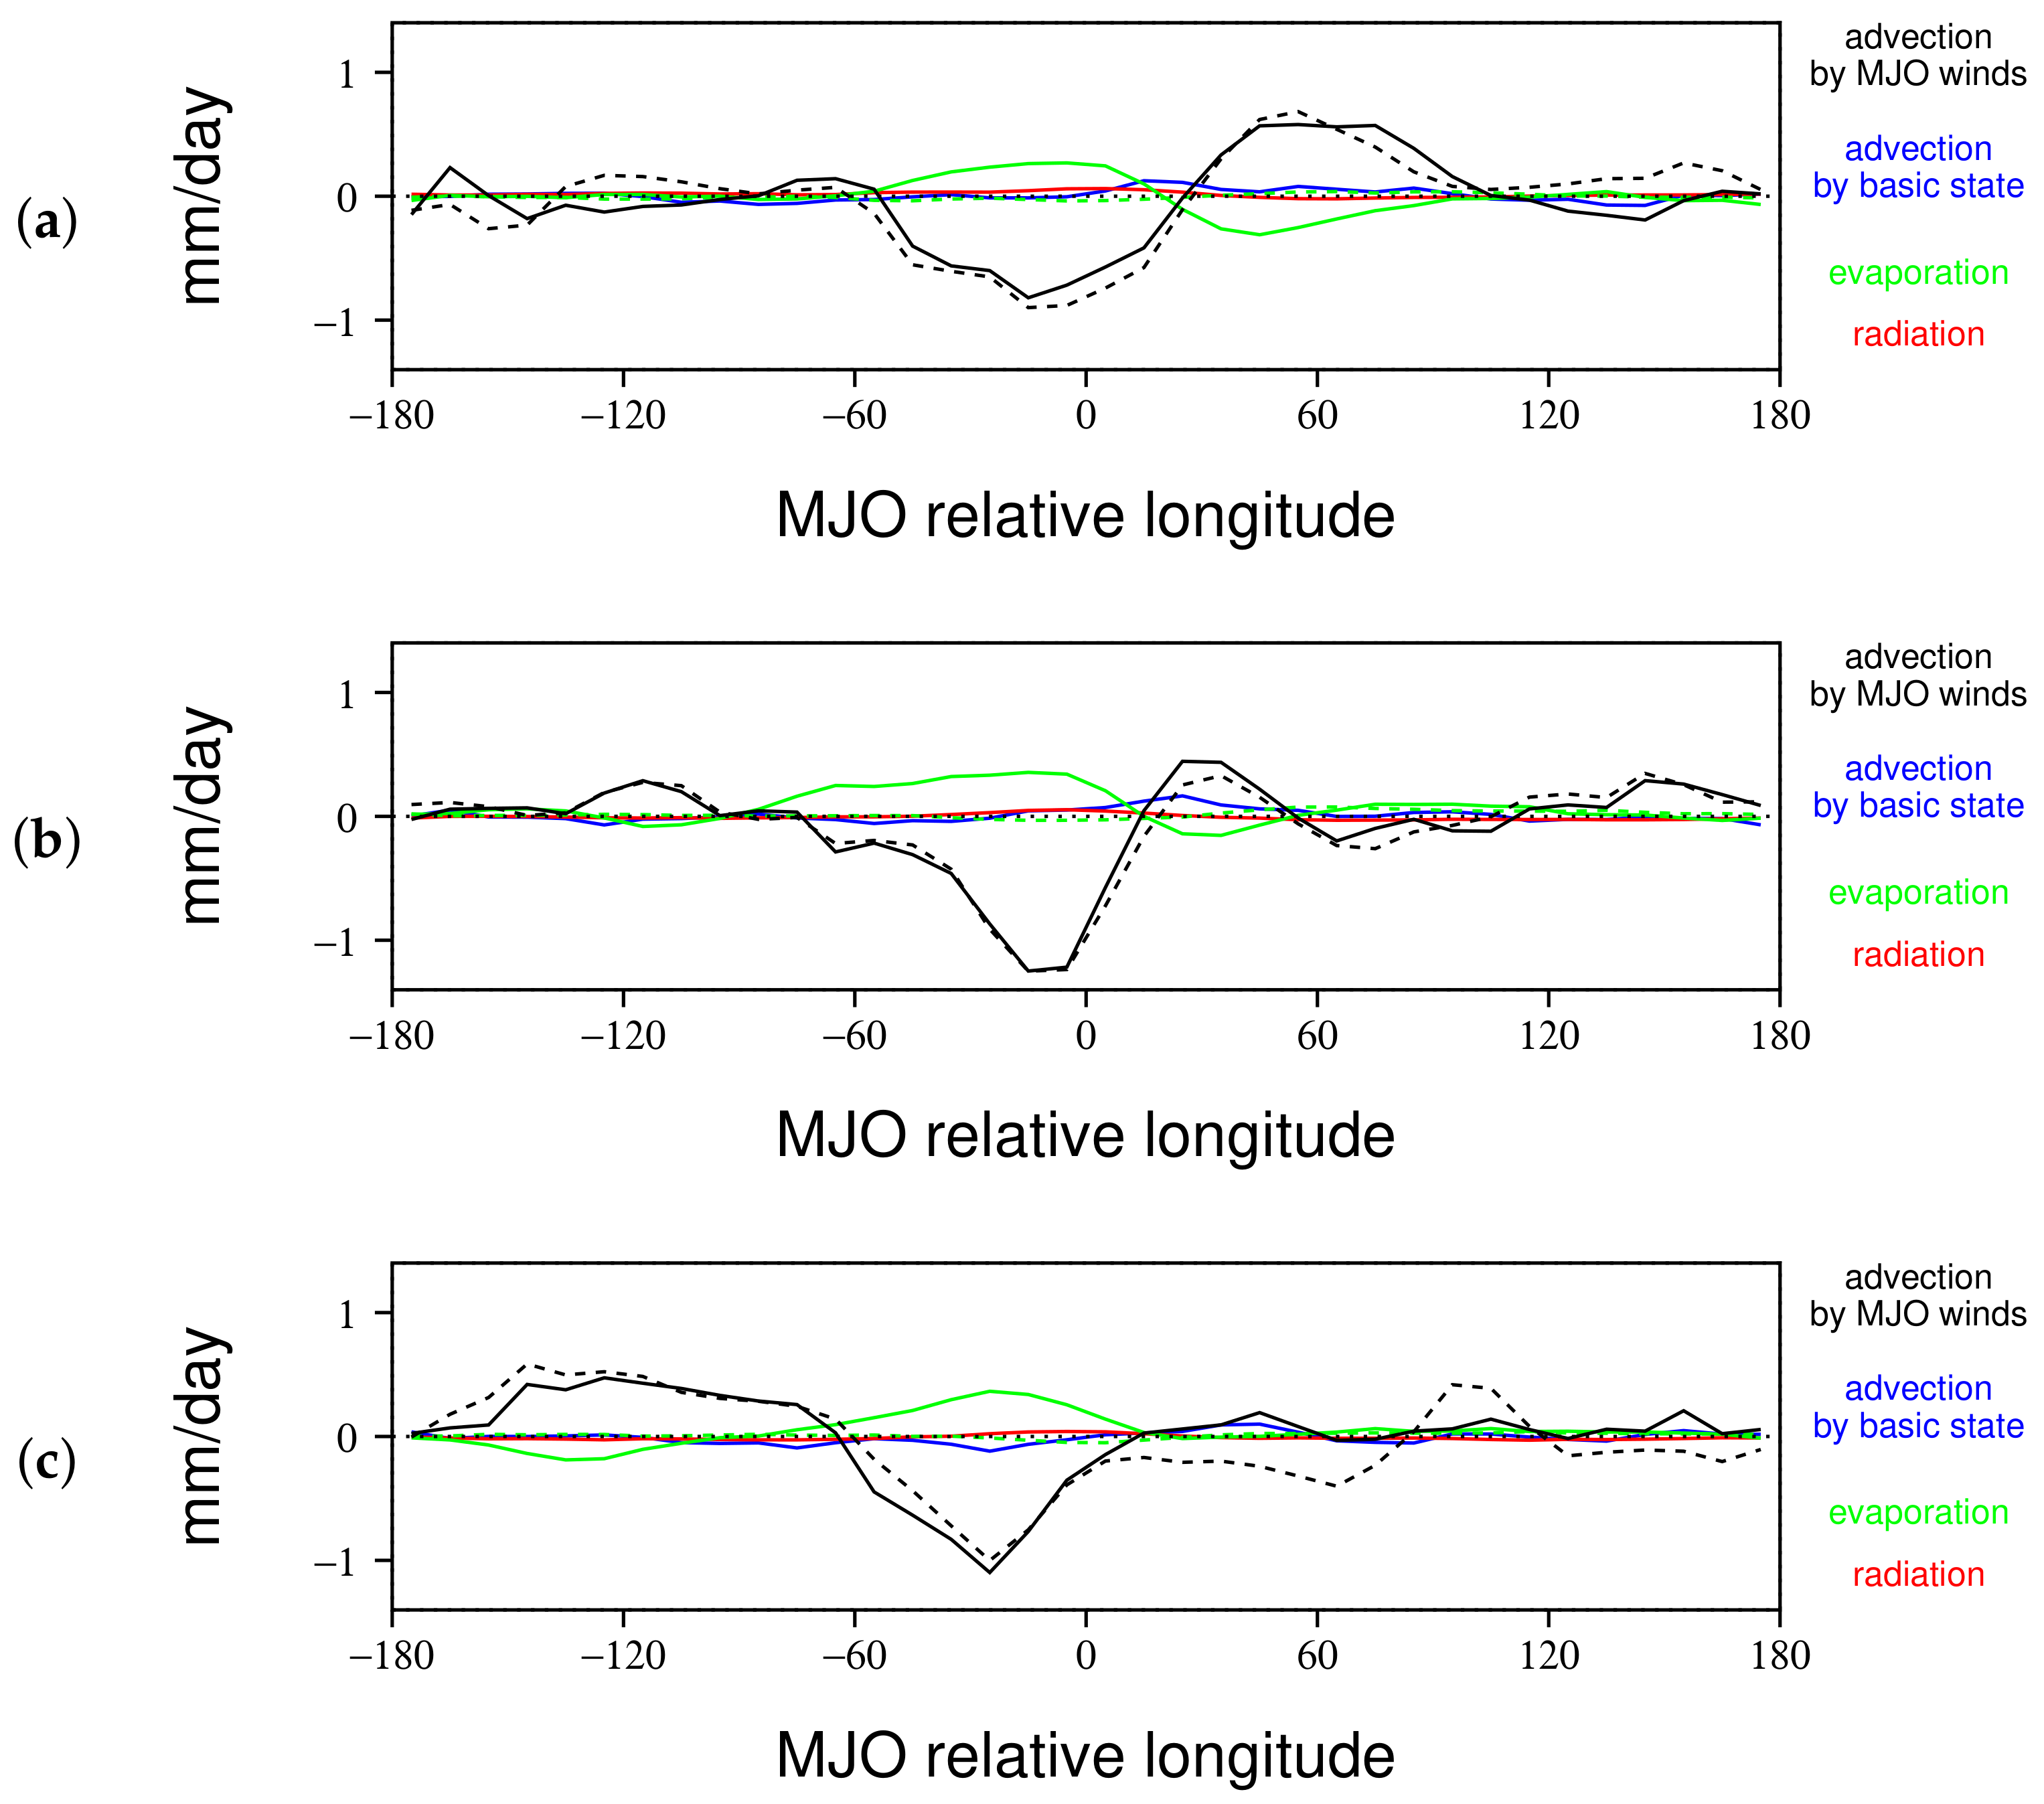
Figure 5 shows the key terms in the moist enthalpy budget of the LAM MJO for each of the developing, mature, and dissipating stages. Here, we use the units of mm/day for all variables to make it easy to compare changes in heat to those in moisture content, and to relate moisture tendencies to rainfall and evaporation. For each stage, advection (the black line) dominates the budget, followed by surface evaporation (the green line), which has roughly one-third of the amplitude of advection. These two terms are roughly out of phase throughout the convective life cycle. The deep convective mode’s advection (dashed black line) is generally close to that of the total circulation near the MJO’s convective center, except for the region to the east of the MJO during the dissipating stage (Figure 5). This region lies to the east of the Dateline; suffice it to say that the deep convective circulation transports most of the moist enthalpy over the Indian Ocean and Western Pacific Oceans within the LAM MJO. Other terms that make non-negligible impacts include advection of moisture perturbations by basic state flow (blue line), and radiation (red line). While the radiation term is roughly in phase with rainfall, so that it destabilizes the LAM MJO, it is much weaker than in other studies (e.g., [80]), probably owing to the idealized nature of the LAM’s radiative scheme.
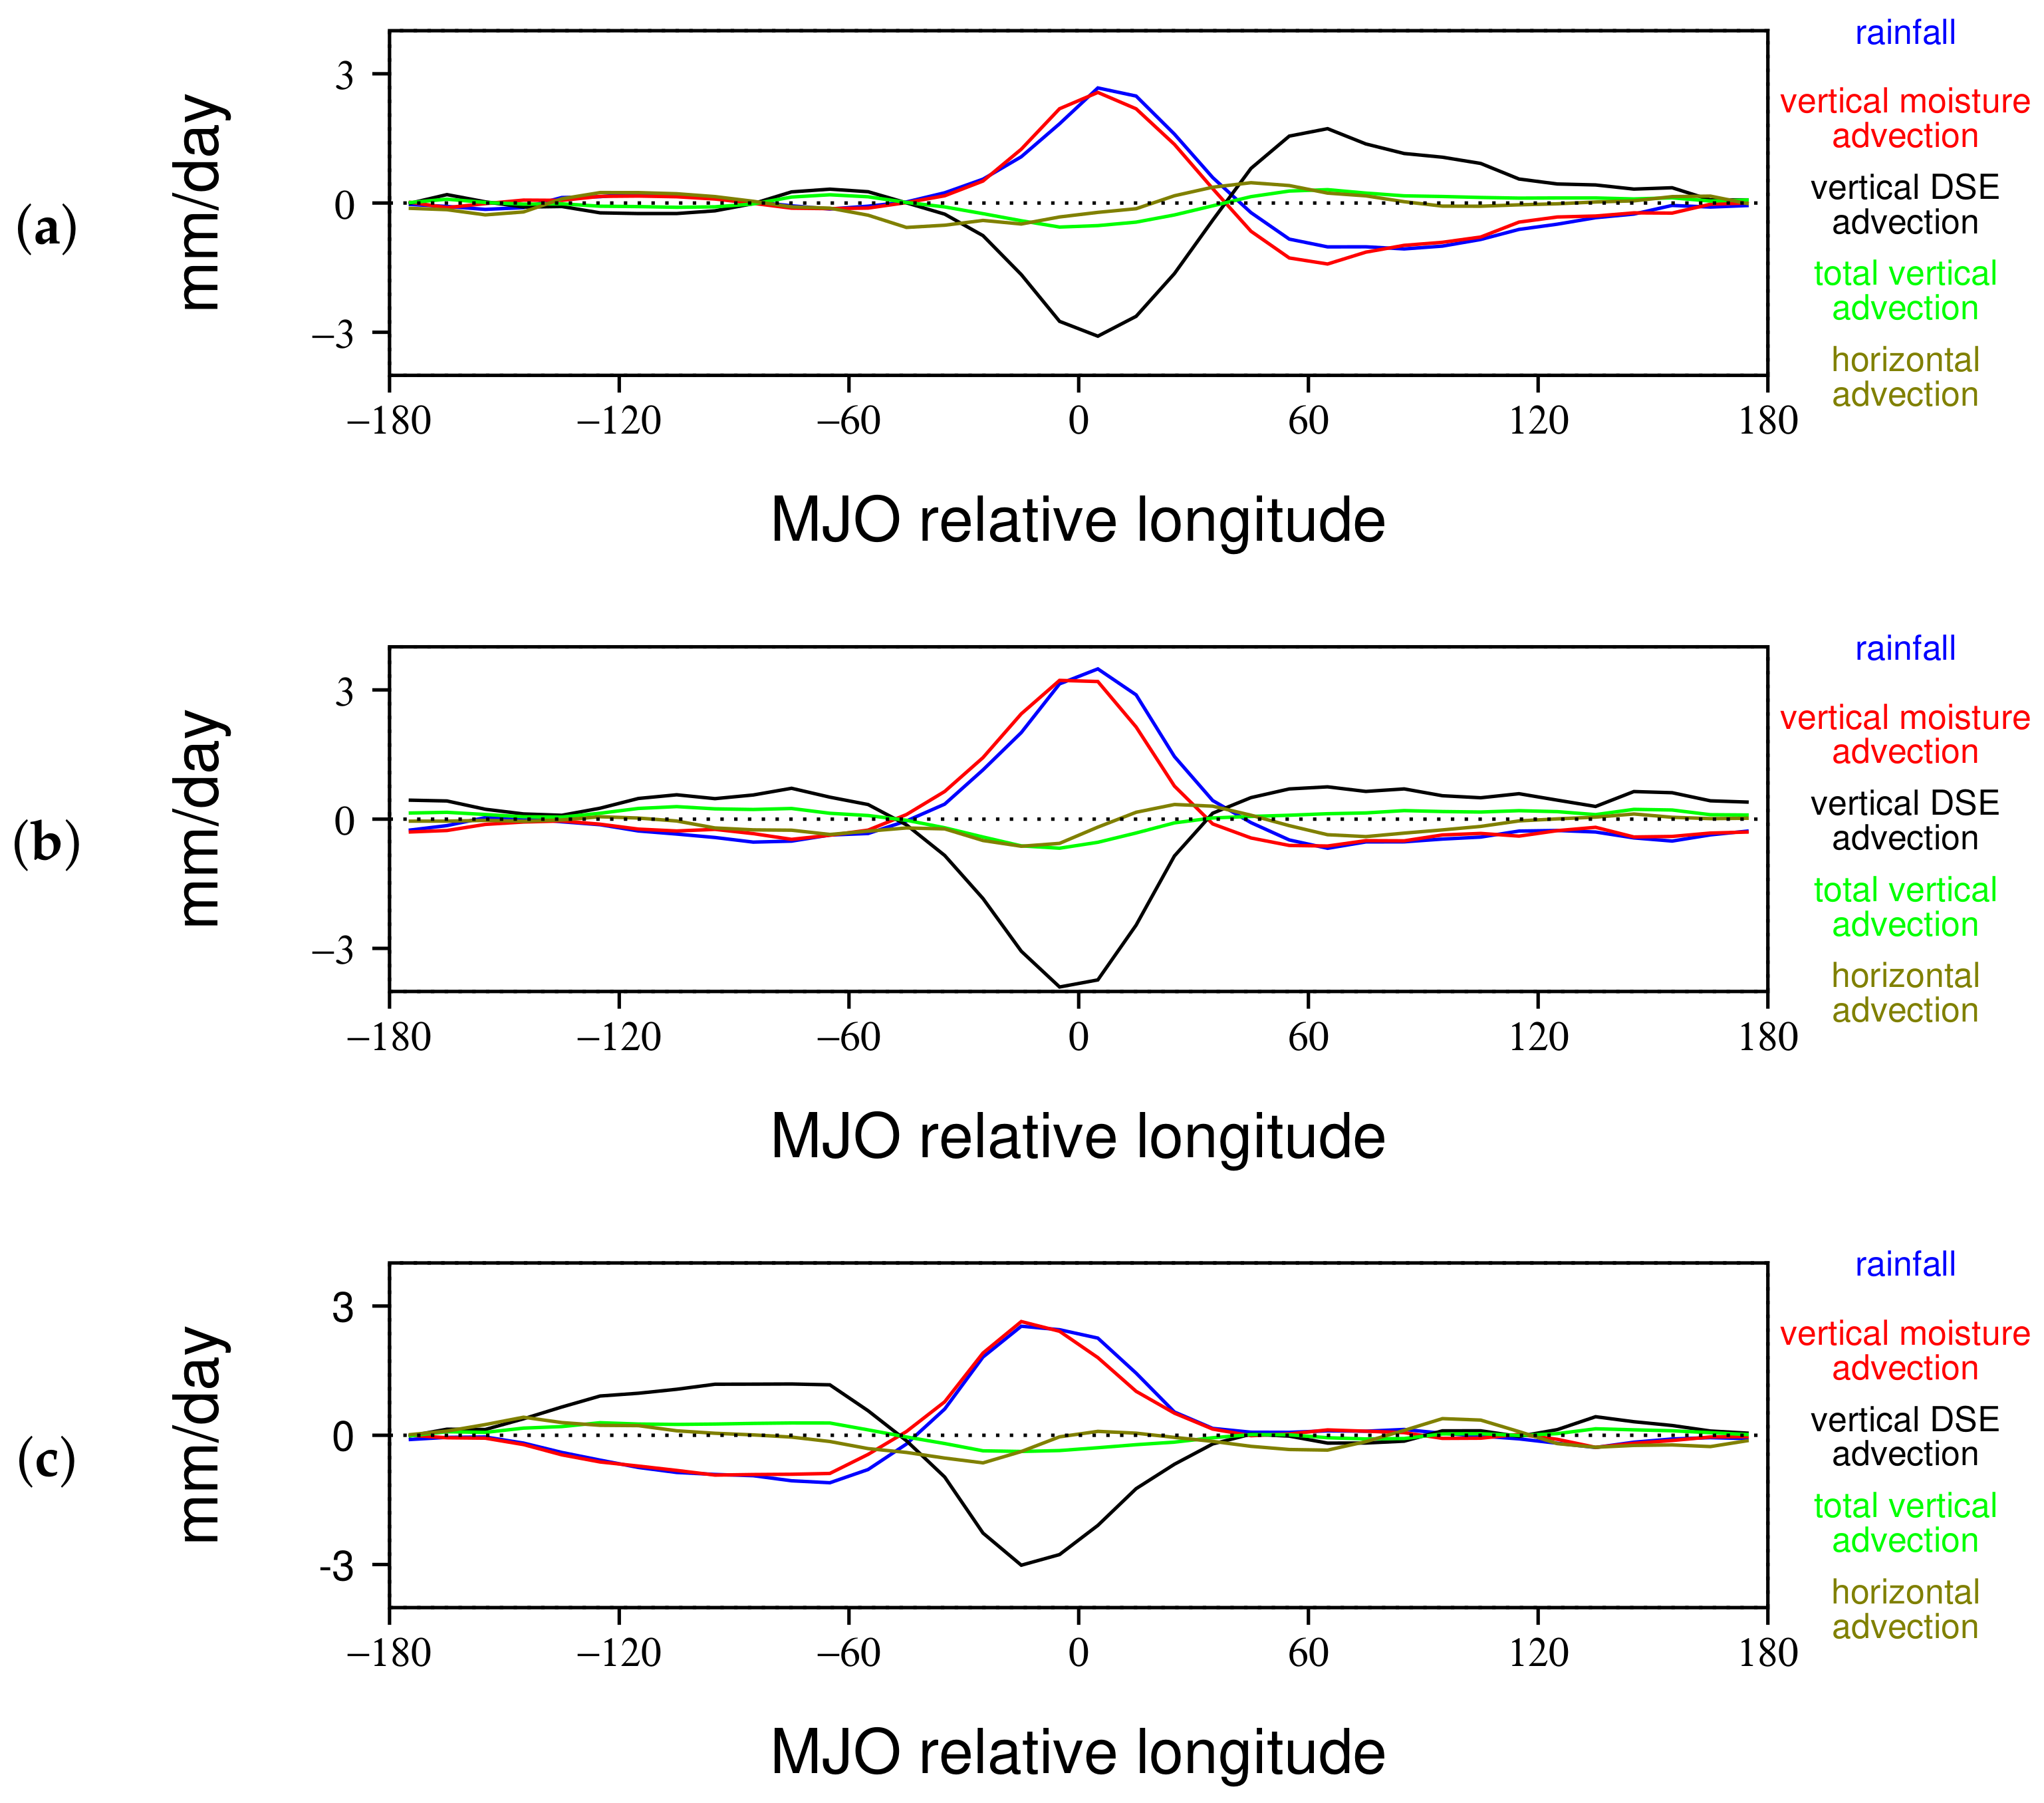
In Figure 6, we decompose advective tendencies of moist enthalpy into vertical advection of moisture (red line), vertical advection of heat (black line), total vertical advection (green line), and horizontal advection of moisture and heat (gold line). The vertical advection of moisture can explain most of the rainfall perturbation (blue line) in the MJO, and it has a strong positive impact on the moist enthalpy budget during the heaviest rain. However, it is accompanied by an even greater export of heat (black line), so that in total, vertical advection exports a small amount of moist enthalpy near the convective center (solid green line). Horizontal advection (gold line) increases the column integrated moist enthalpy prior to the MJO’s heaviest convection, and reduces moist enthalpy after heavy rainfall.
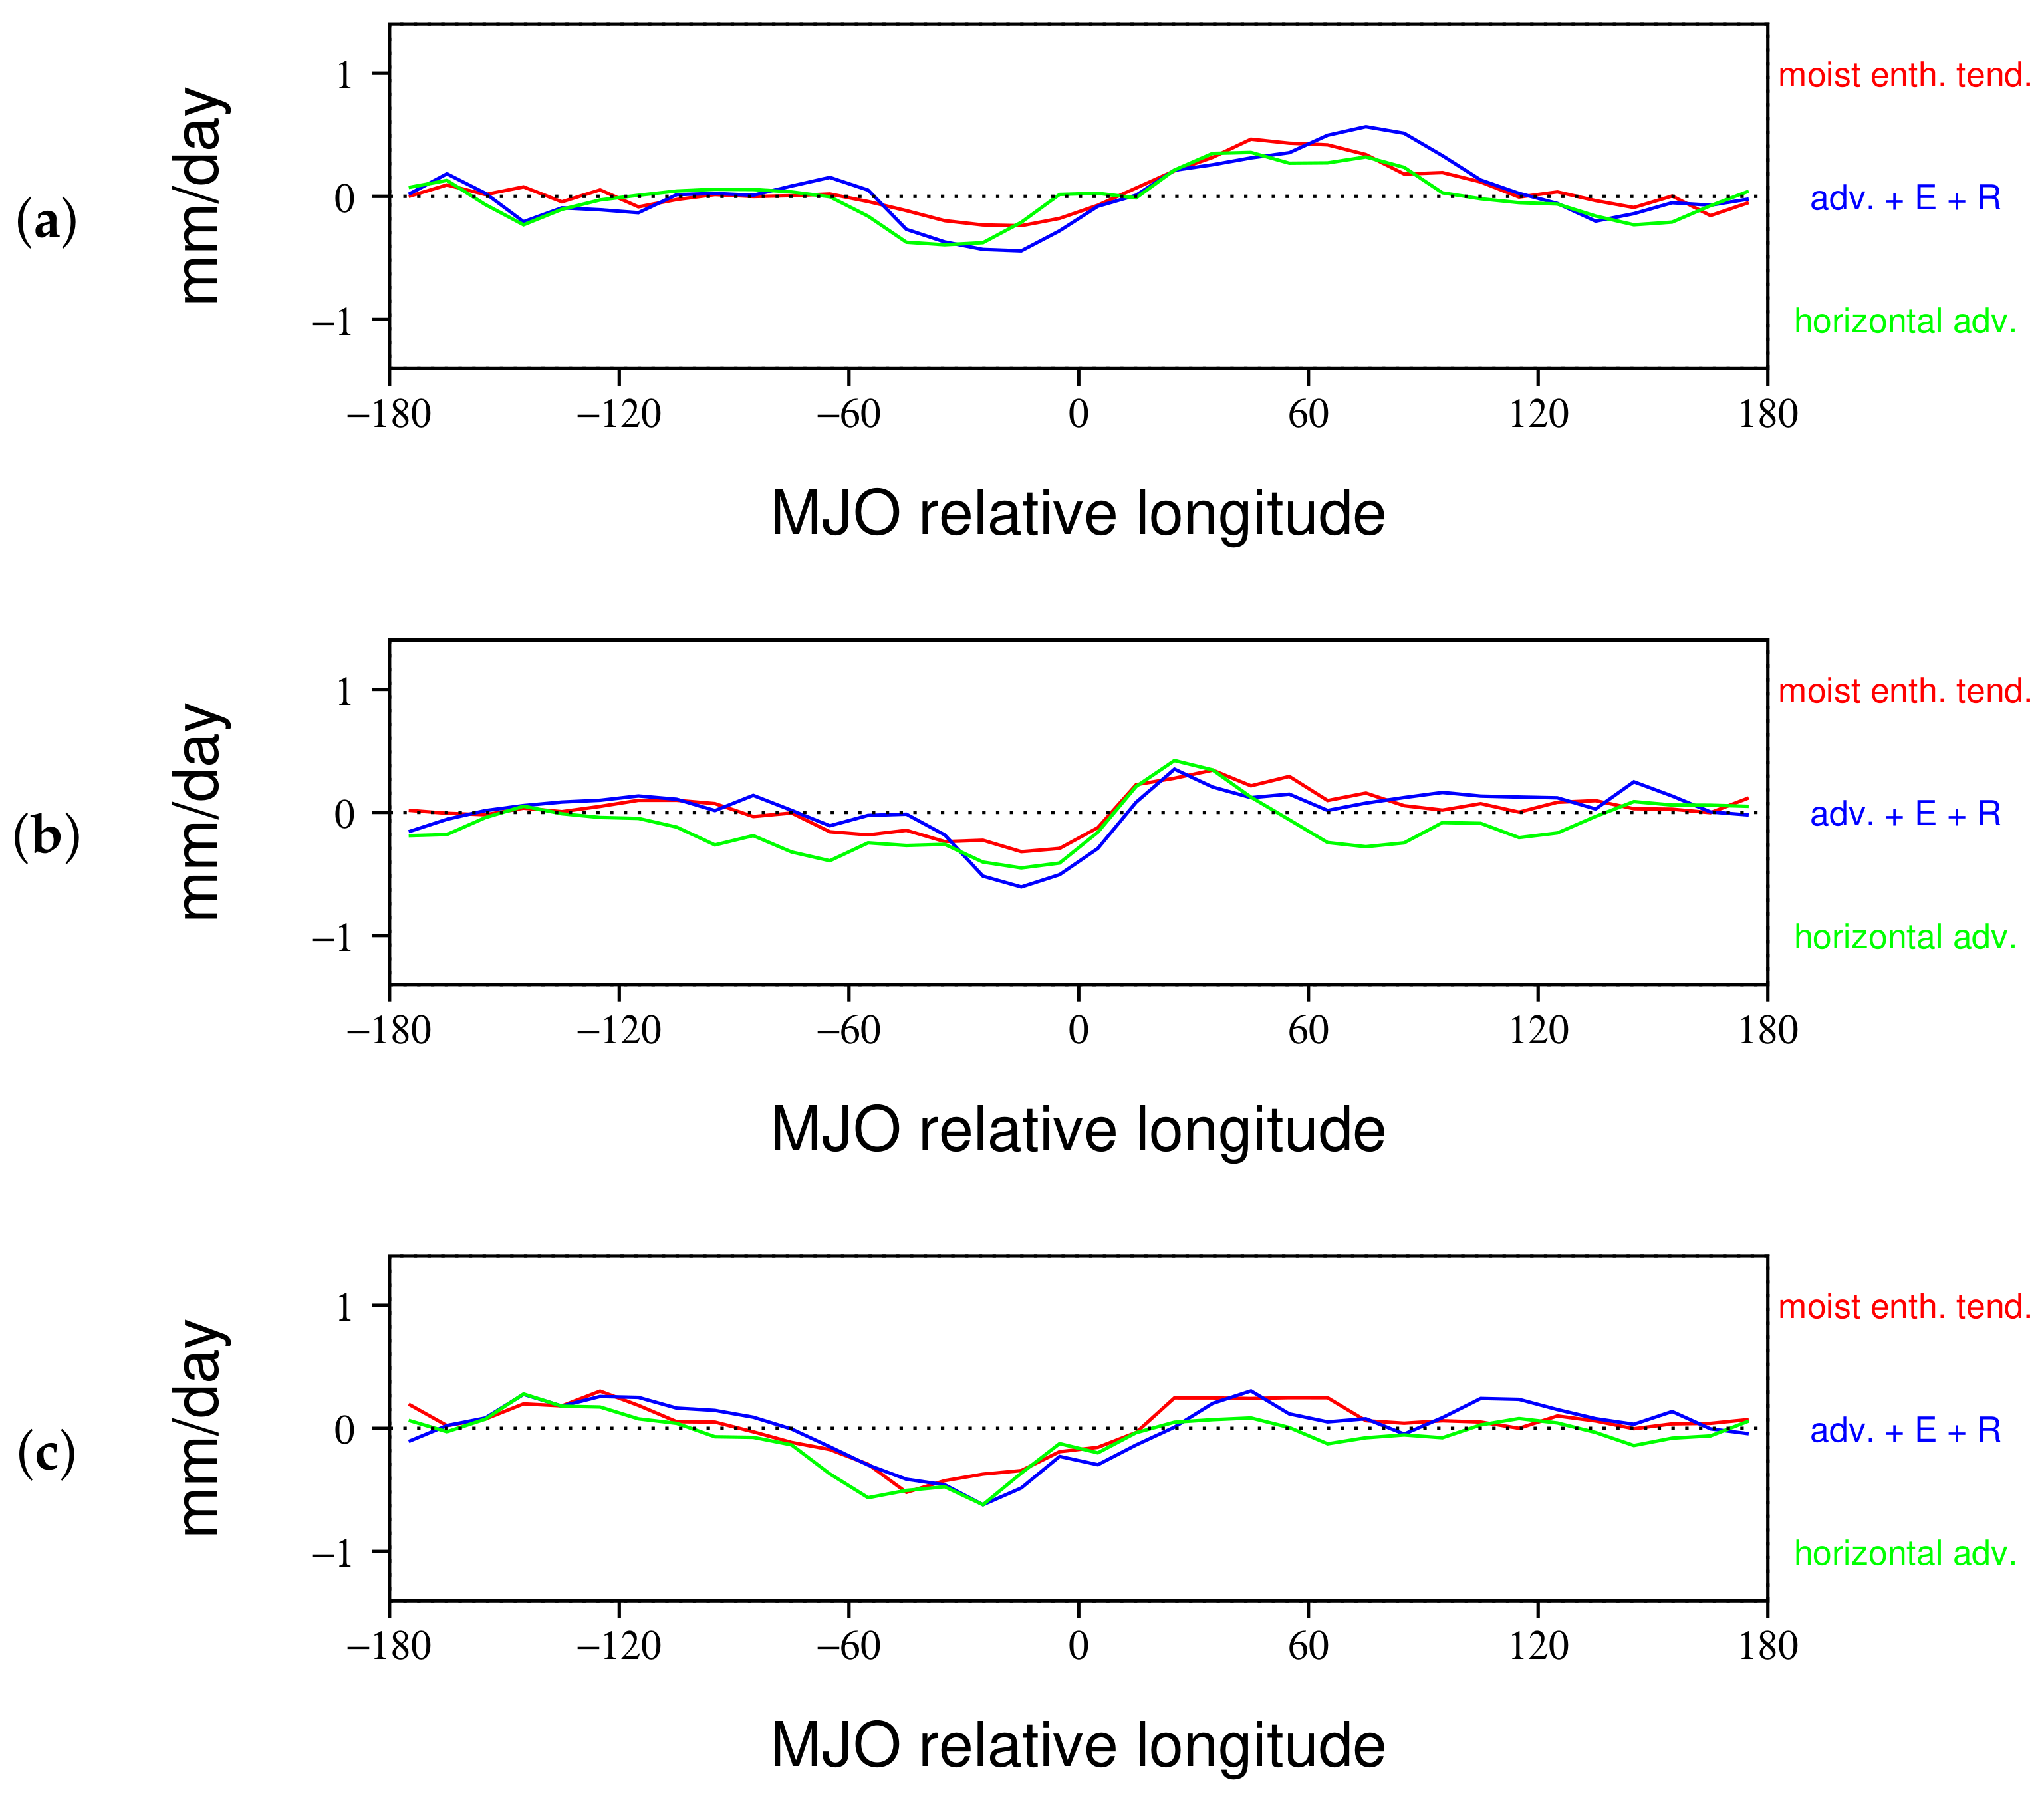
In order to test if our moist enthalpy budget balances, we compute each of the terms on the right side of (2) and compare their sum to the tendency in moist enthalpy computed as a time difference (Figure 7; compare blue and red lines). The two curves mostly follow each other for each of the developing, mature, and dissipating stages, with deviations generally being a few tenths of a mm/day or less (Figure 7). Considering that the largest individual terms on the right-hand side of (2) have amplitudes of several mm/day (e.g., Figure 6), and circulations are sampled at 1-day intervals, such small random imbalances in the budget are expected. Moreover, the budget excludes melting and freezing effects, which do not necessarily cancel within a column, and could also contribute to the small discrepancies. Overall, Figure 7 supports the idea that there are not large systemic errors in our moist enthalpy budget.
We also note that much of the tendency in moist enthalpy is attributable to horizontal advection (compare red and green lines in Figure 7). Over most of the domain, meridional advection contributes the vast majority of the change in moist enthalpy due to horizontal advection. However, there are a few exceptions. During the developing and mature stages, zonal advection causes most of the moist enthalpy increase due to horizontal advection on the eastern edge of the precipitation region, and during the mature and dissipating stages, zonal advection causes most of the moist enthalpy decrease due to horizontal advection on the western edge of the precipitation region (not shown). Horizontal advection is often substantially lower than the tendency well to the east of the MJO (Figure 7), because vertical advection plays an important role in increasing moist enthalpy there (Figure 6).

3.3. Kelvin and Rossby Wave Contributions

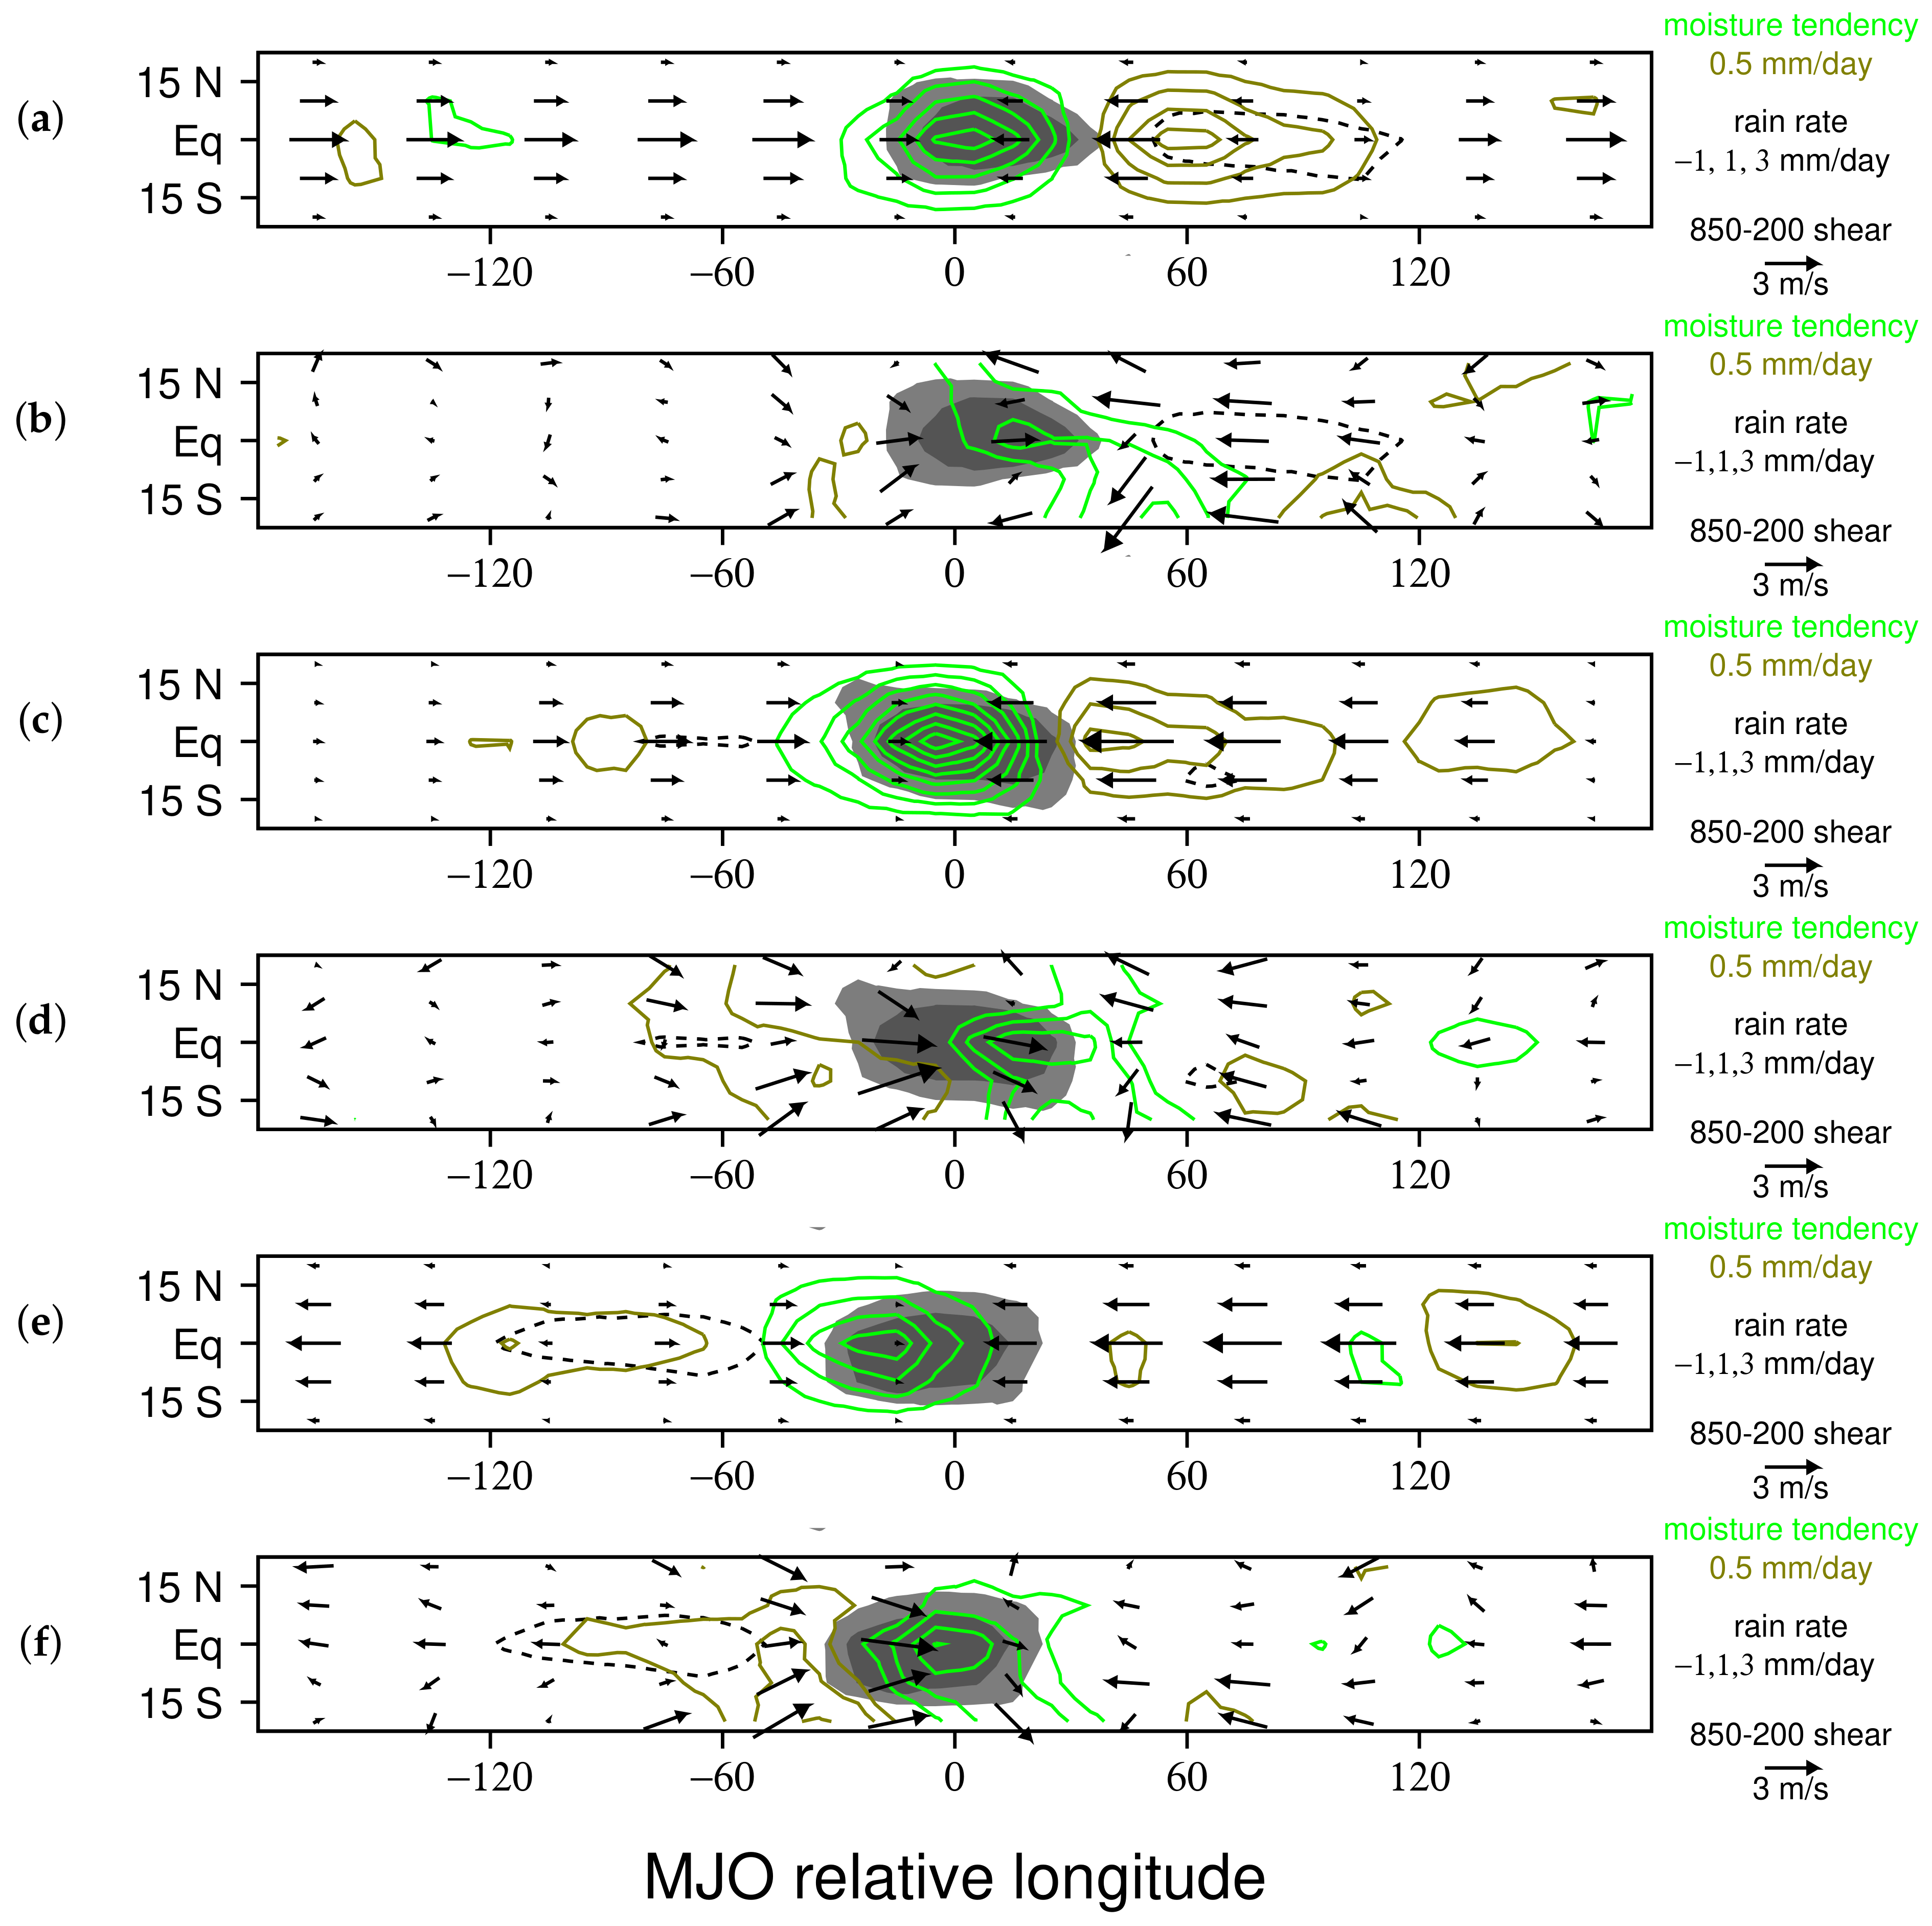
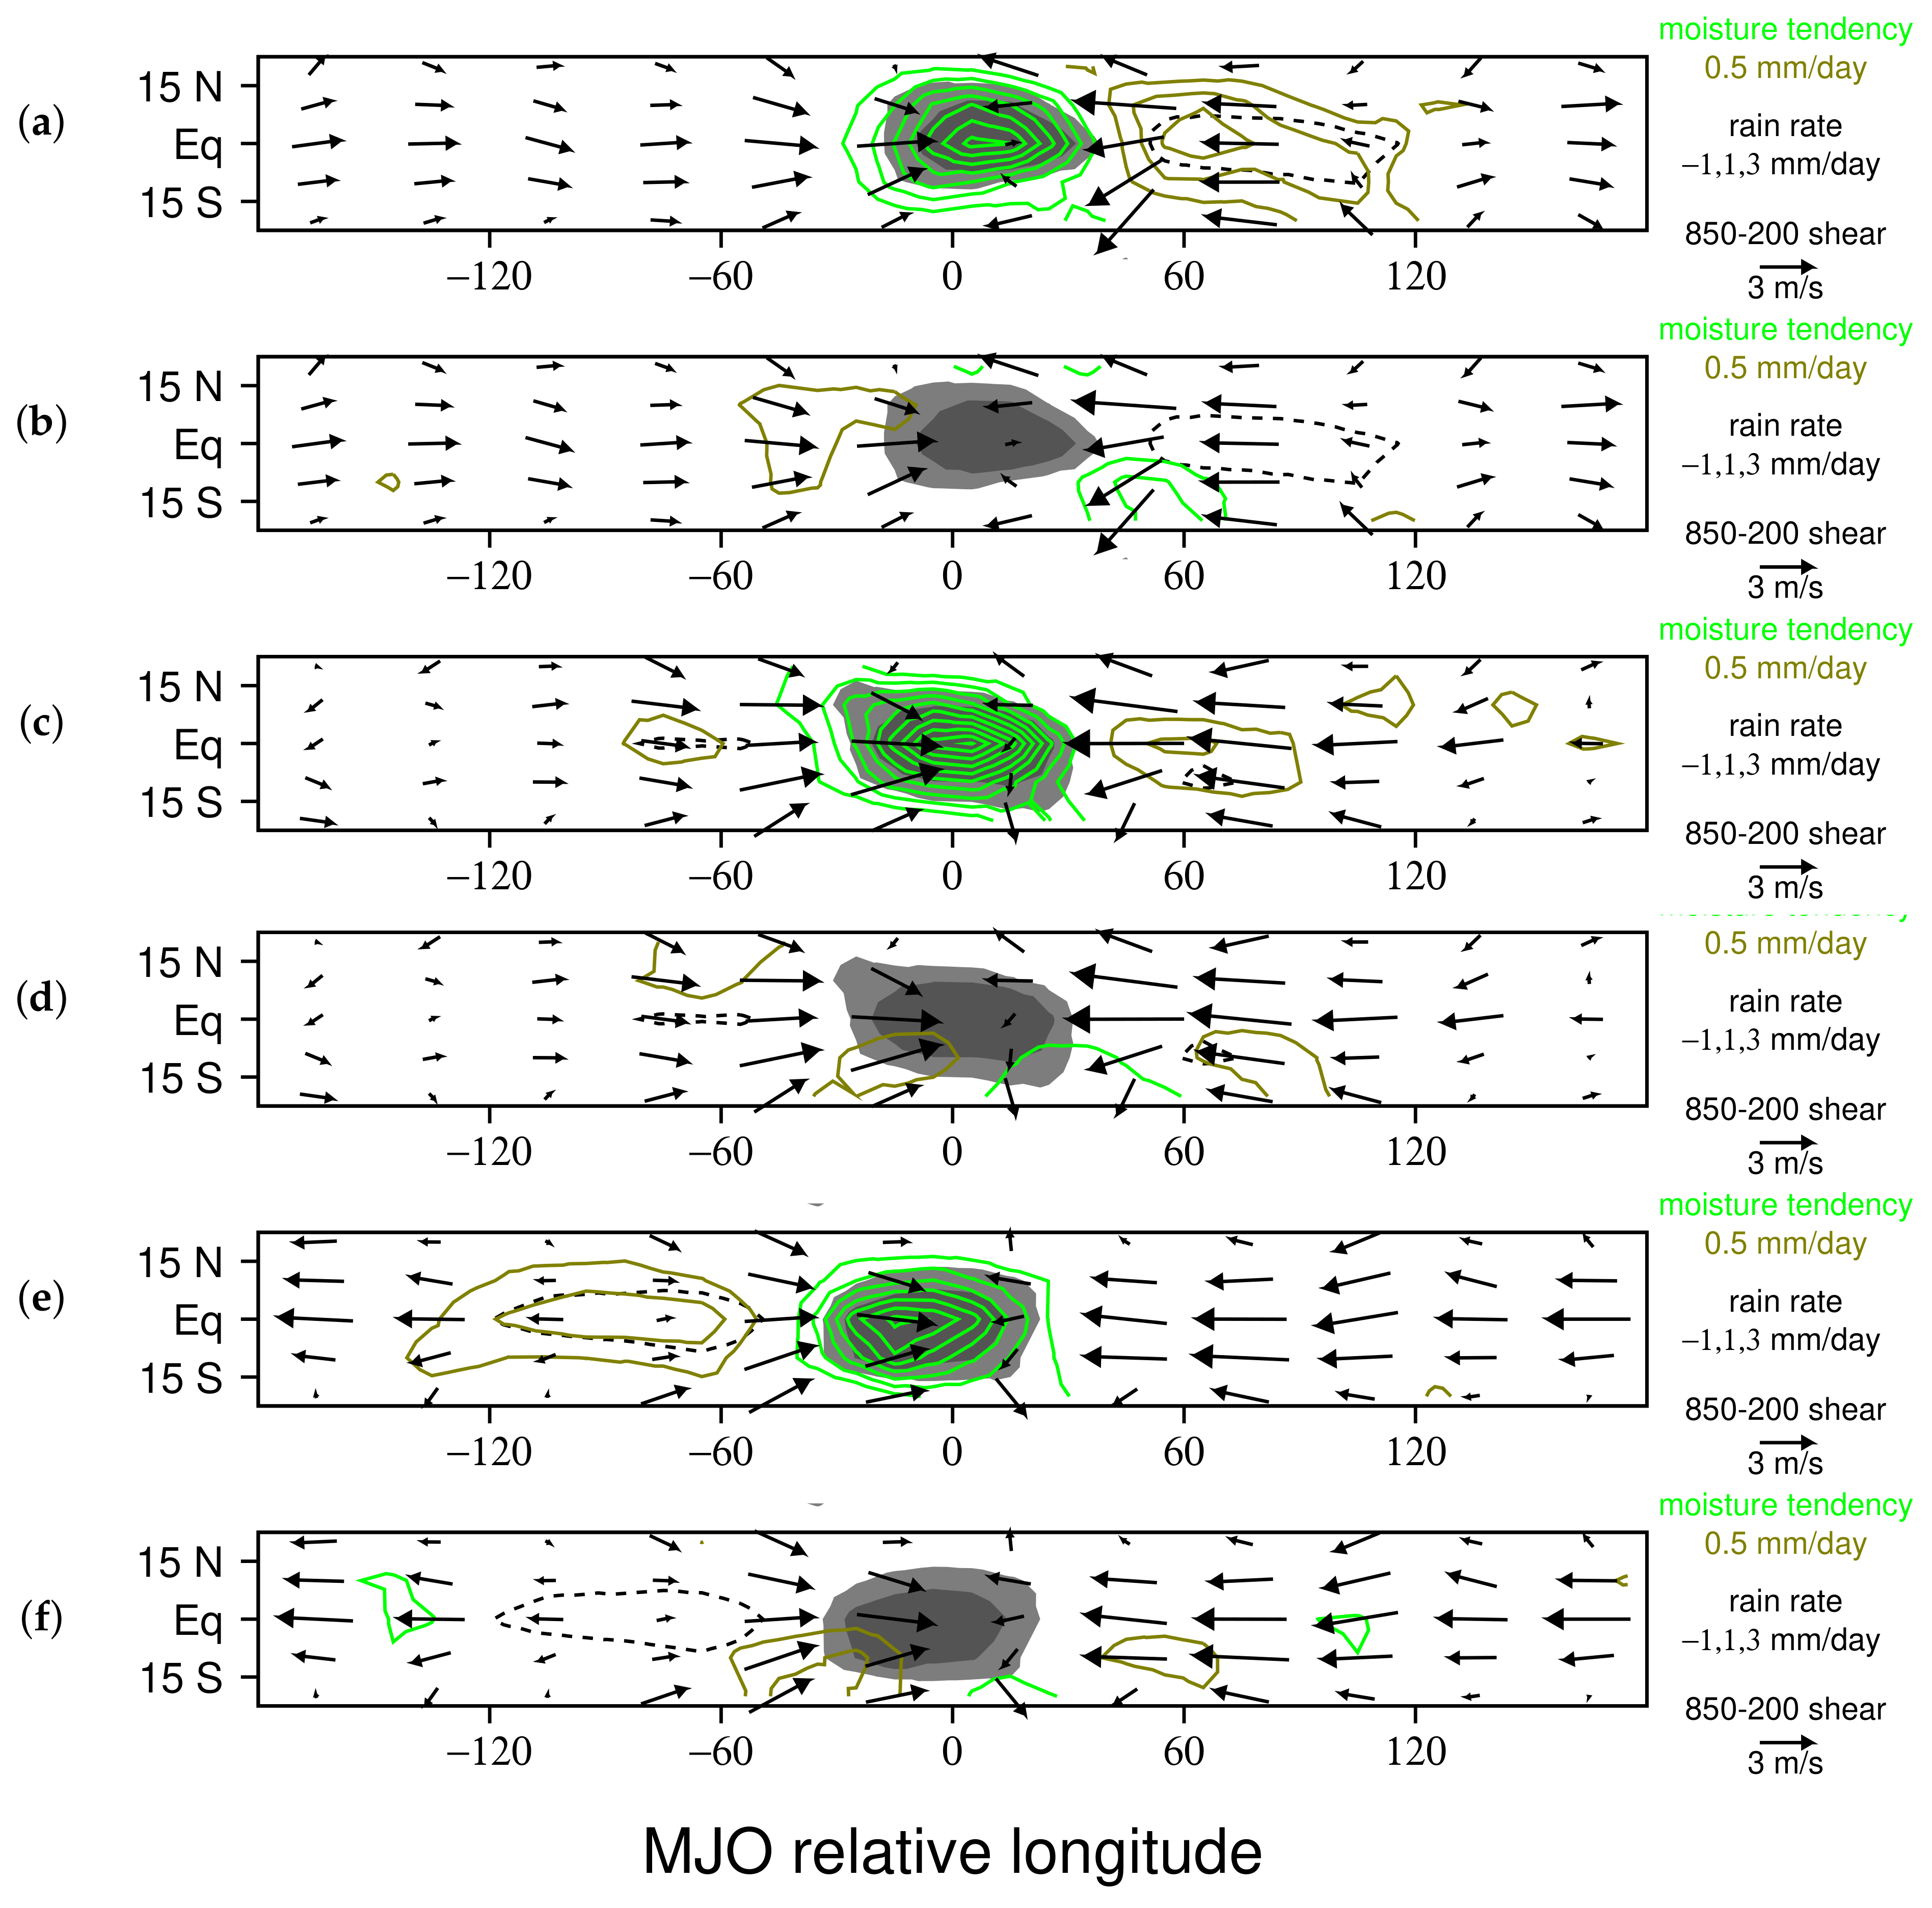
We now consider the individual contributions of Kelvin and Rossby waves to the moisture and moist enthalpy budgets of the LAM MJO. Figure 8a shows the advective tendency of moisture due to the Kelvin wave circulation during the developing stage. Most of the MJO’s rainfall perturbation can be explained by vertical advection of moisture associated with the Kelvin wave, which occurs where low-level zonal winds converge (Figure 8a). There is also some rainfall associated with vertical advection of moisture near the eastern edge of low-level westerly wind perturbations of the Rossby wave circulation (Figure 8b). The Rossby wave also creates a positive moisture tendency where there is flow away from the equator ahead of the MJO’s convective center, which is largely due to horizontal advection. During the mature stage, the advective moistening due to vertical motion within the MJO’s precipitation region increases for both the Rossby and Kelvin wave components (Figure 8c,d). Moistening ahead of the convective center where there is off-equatorial flow continues, and drying intensifies behind the convective center, where winds have an equatorward and westerly component. During the dissipating stage, moistening due to vertical motion remains strong for the Rossby wave, but begins to diminish for the Kelvin wave. Drying associated with equatorward flow west of the MJO in the Rossby wave intensifies.
Figure 9 partitions the advective moisture tendency into components associated with vertical [ ω q p ] and horizontal motion [ u q x v q y ] for each of the developing, mature, and dissipating stages of the MJO convective envelope. Comparing Figure 8 and Figure 9 reveals that during the developing and mature stages, most of the moistening associated with vertical motion is provided by the Kelvin wave (compare Figure 8a,c with Figure 9a,c). The dissipating stage is somewhat different, in that Kelvin and Rossby wave circulations have similar size contributions to moistening associated with vertical motion (compare Figure 8e,f and Figure 9e,f). For all stages, much of the off-equatorial moistening ahead of the MJO precipitation region and drying behind it is associated with horizontal advection (Figure 9b,d,f), which is primarily contributed by the Rossby wave (Figure 8b,d,f).
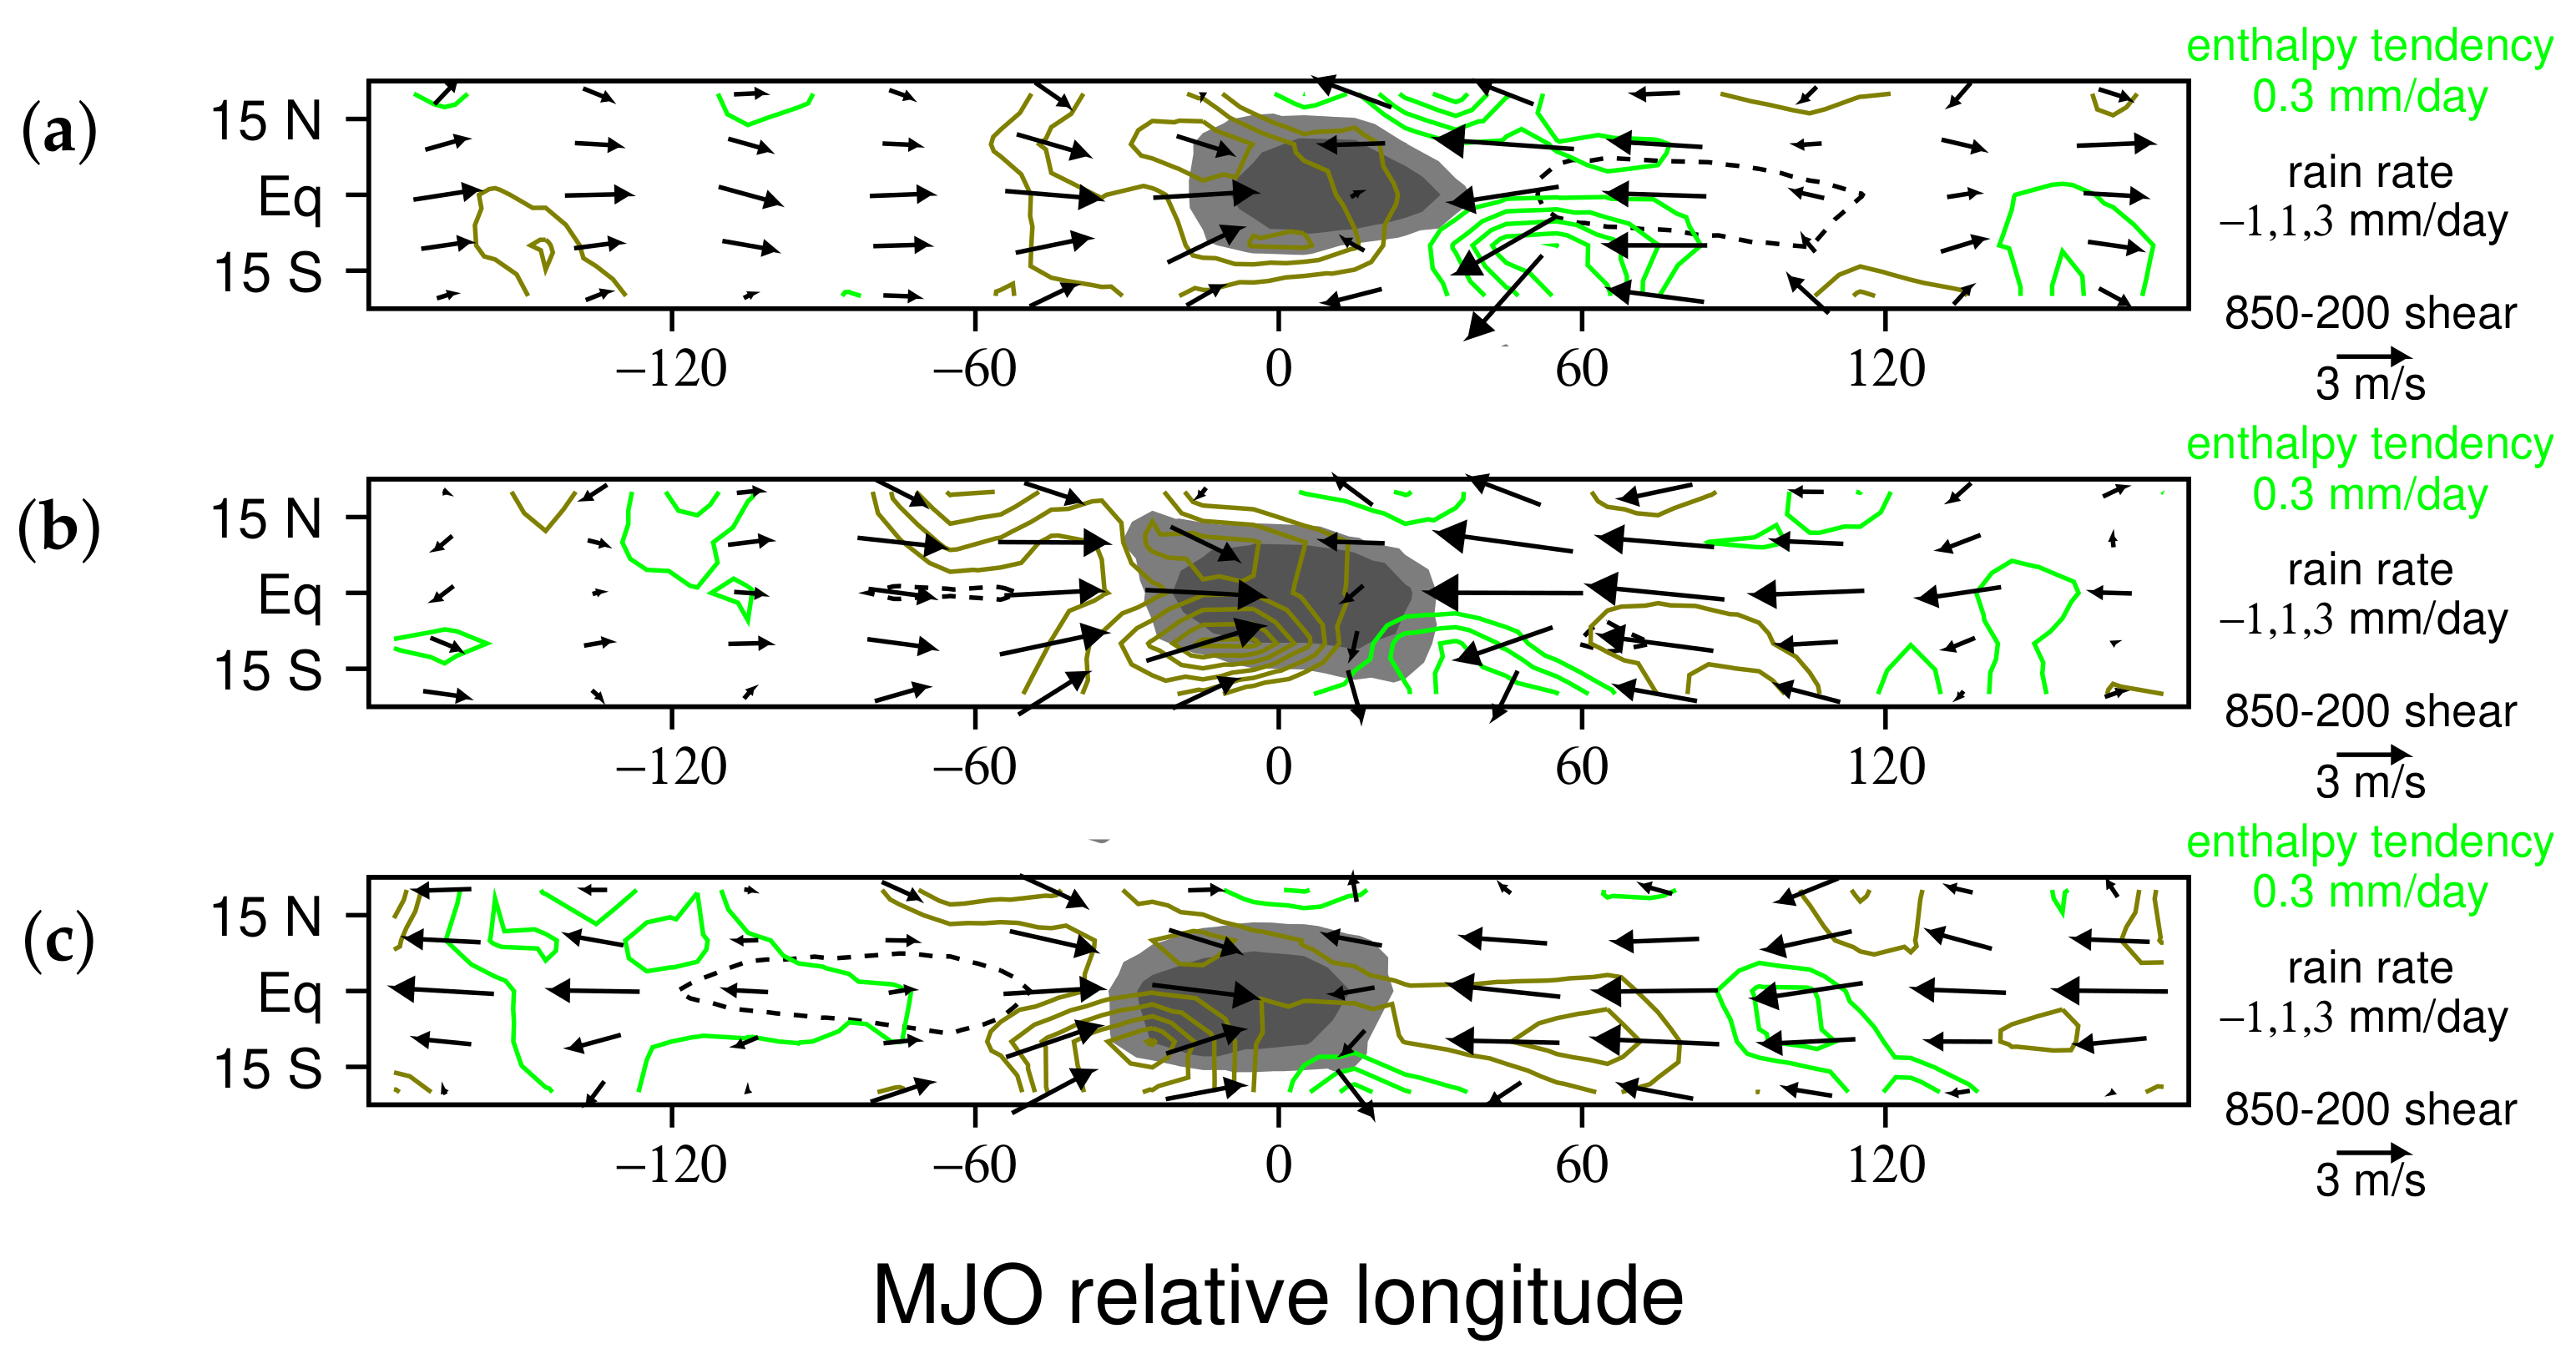
We now consider the spatial distribution of the advective moist enthalpy tendency in the LAM MJO (Figure 10). This field includes the first four terms on the right-hand side of Equation (2). For each stage, there is an off-equatorial increase in moist enthalpy to the east of the precipitation region associated with off-equatorial flow (Figure 10a–c). The increase is the greatest in the developing stage (Figure 10a), is still strong in the mature stage (Figure 10b), is and somewhat weaker in the dissipating stage (Figure 10c). During all stages there is a decrease in moist enthalpy on the western side of the MJO’s precipitation region, which is greater in the mature and dissipating stages. The reduction in moist enthalpy peaks on the northwest flank of the precipitation region in the developing stage, and on the southwest flank during the mature and dissipating stages.
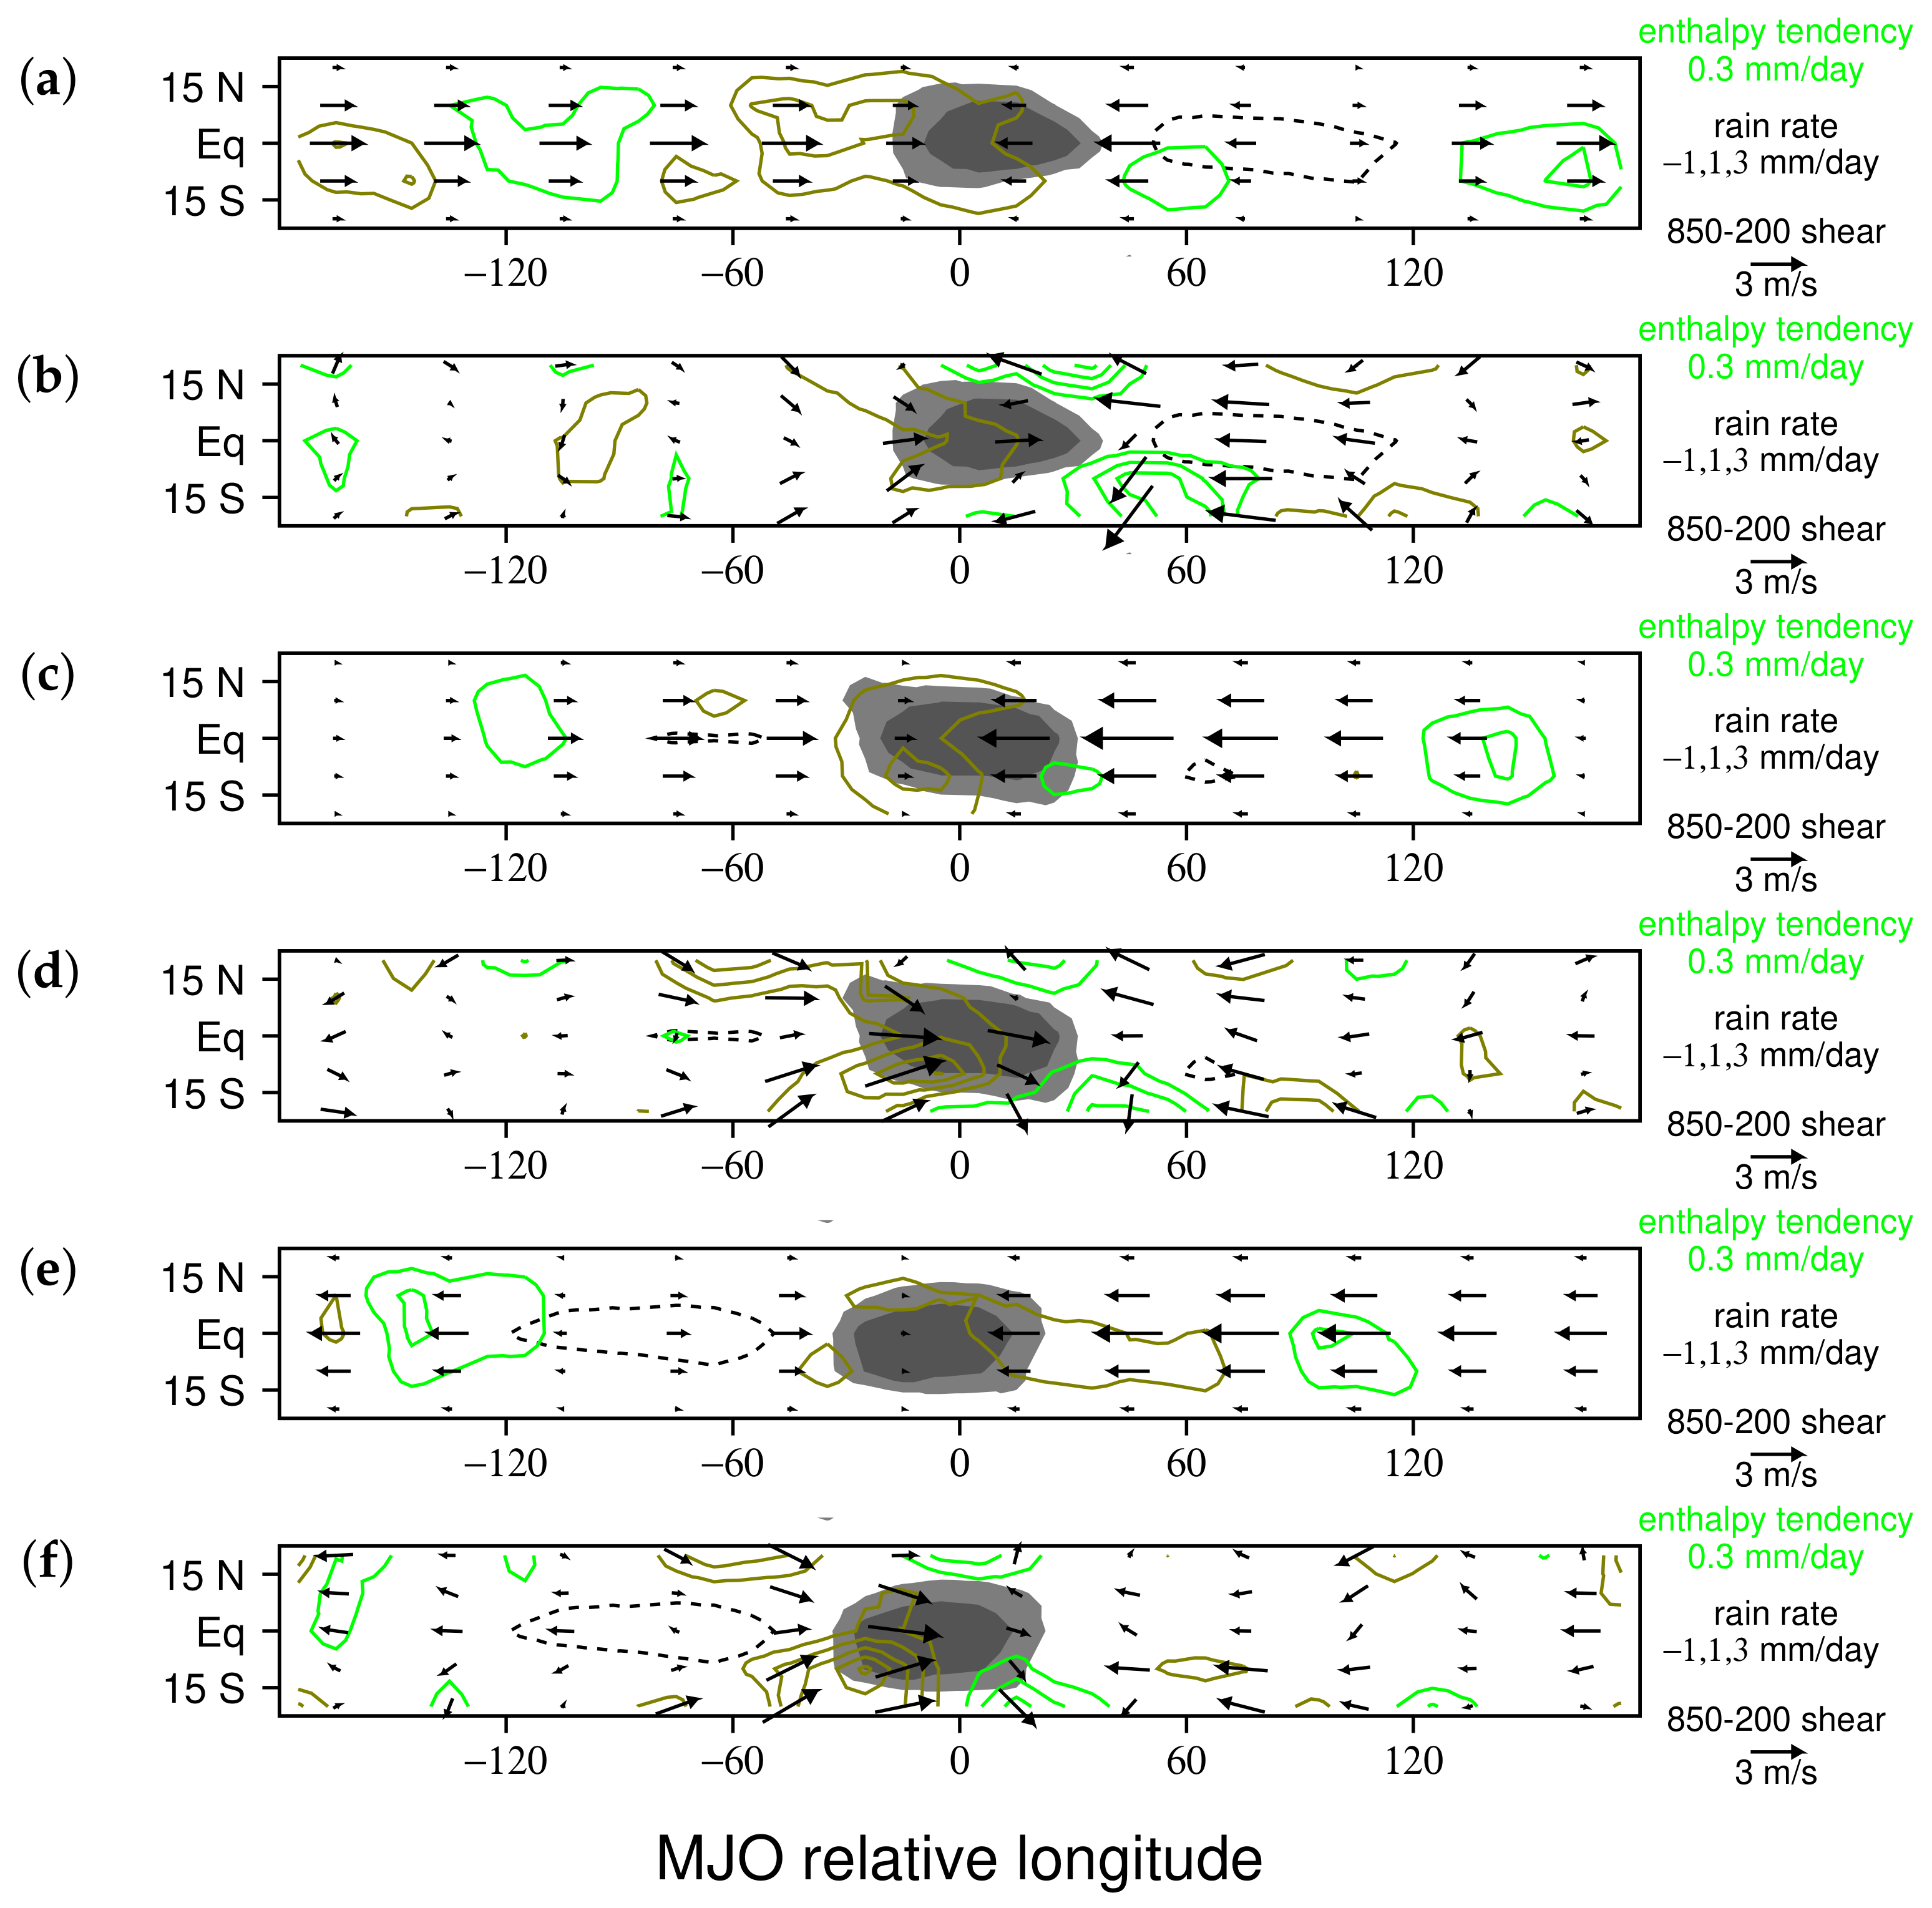
The general pattern of the moist enthalpy tendency in Figure 10 can be understood in terms of the differing impacts of enthalpy changes due to vertical [ ω h p + α ω ] and horizontal advection [ u h x v h x ]. Vertical advective moistening is accompanied by an export of heat that has a greater impact on the column integrated moist enthalpy than the moistening (e.g., Figure 6), so that upward motion causes a net reduction in moist enthalpy. In contrast, moistening associated with horizontal advection is not counterbalanced in this way (i.e., horizontal advection of temperature has a minor impact on column integrated moist enthalpy). Moist enthalpy increases ahead of the precipitation region, where the Rossby wave circulation creates a positive advective tendency (Figure 8, Figure 9 and Figure 10). Moist enthalpy decreases on the western side of the precipitation region, where the Kelvin wave contributes upward motion (Figure 6, Figure 8 and Figure 9), and the Rossby wave contributes drying owing to horizontal advection (Figure 8).
In Figure 11, we break down the individual contributions of Kelvin and Rossby waves to the moist enthalpy budget. During all stages, the Kelvin wave reduces moist enthalpy on the western side of the precipitation region (Figure 11a,c,e). During the developing and mature stages, it also increases moist enthalpy in a small area on the southeastern side of the precipitation region, where it contributes downward motion. During all stages, the Rossby wave increases moist enthalpy on the eastern side of the precipitation region and decreases moist enthalpy on the western side of the precipitation region, with the greatest impact in off-equatorial regions (Figure 11b,d,f). Note that while the both Rossby and Kelvin waves reduce moist enthalpy on the western side of the precipitation region (Figure 11), the mechanism is very different; the horizontal circulation of the Rossby wave advects dry air (Figure 8b,d,f), whereas upward motion associated with the Kelvin wave exports heat, even though it is bringing in moisture (Figure 6 and Figure 8a,c,e).
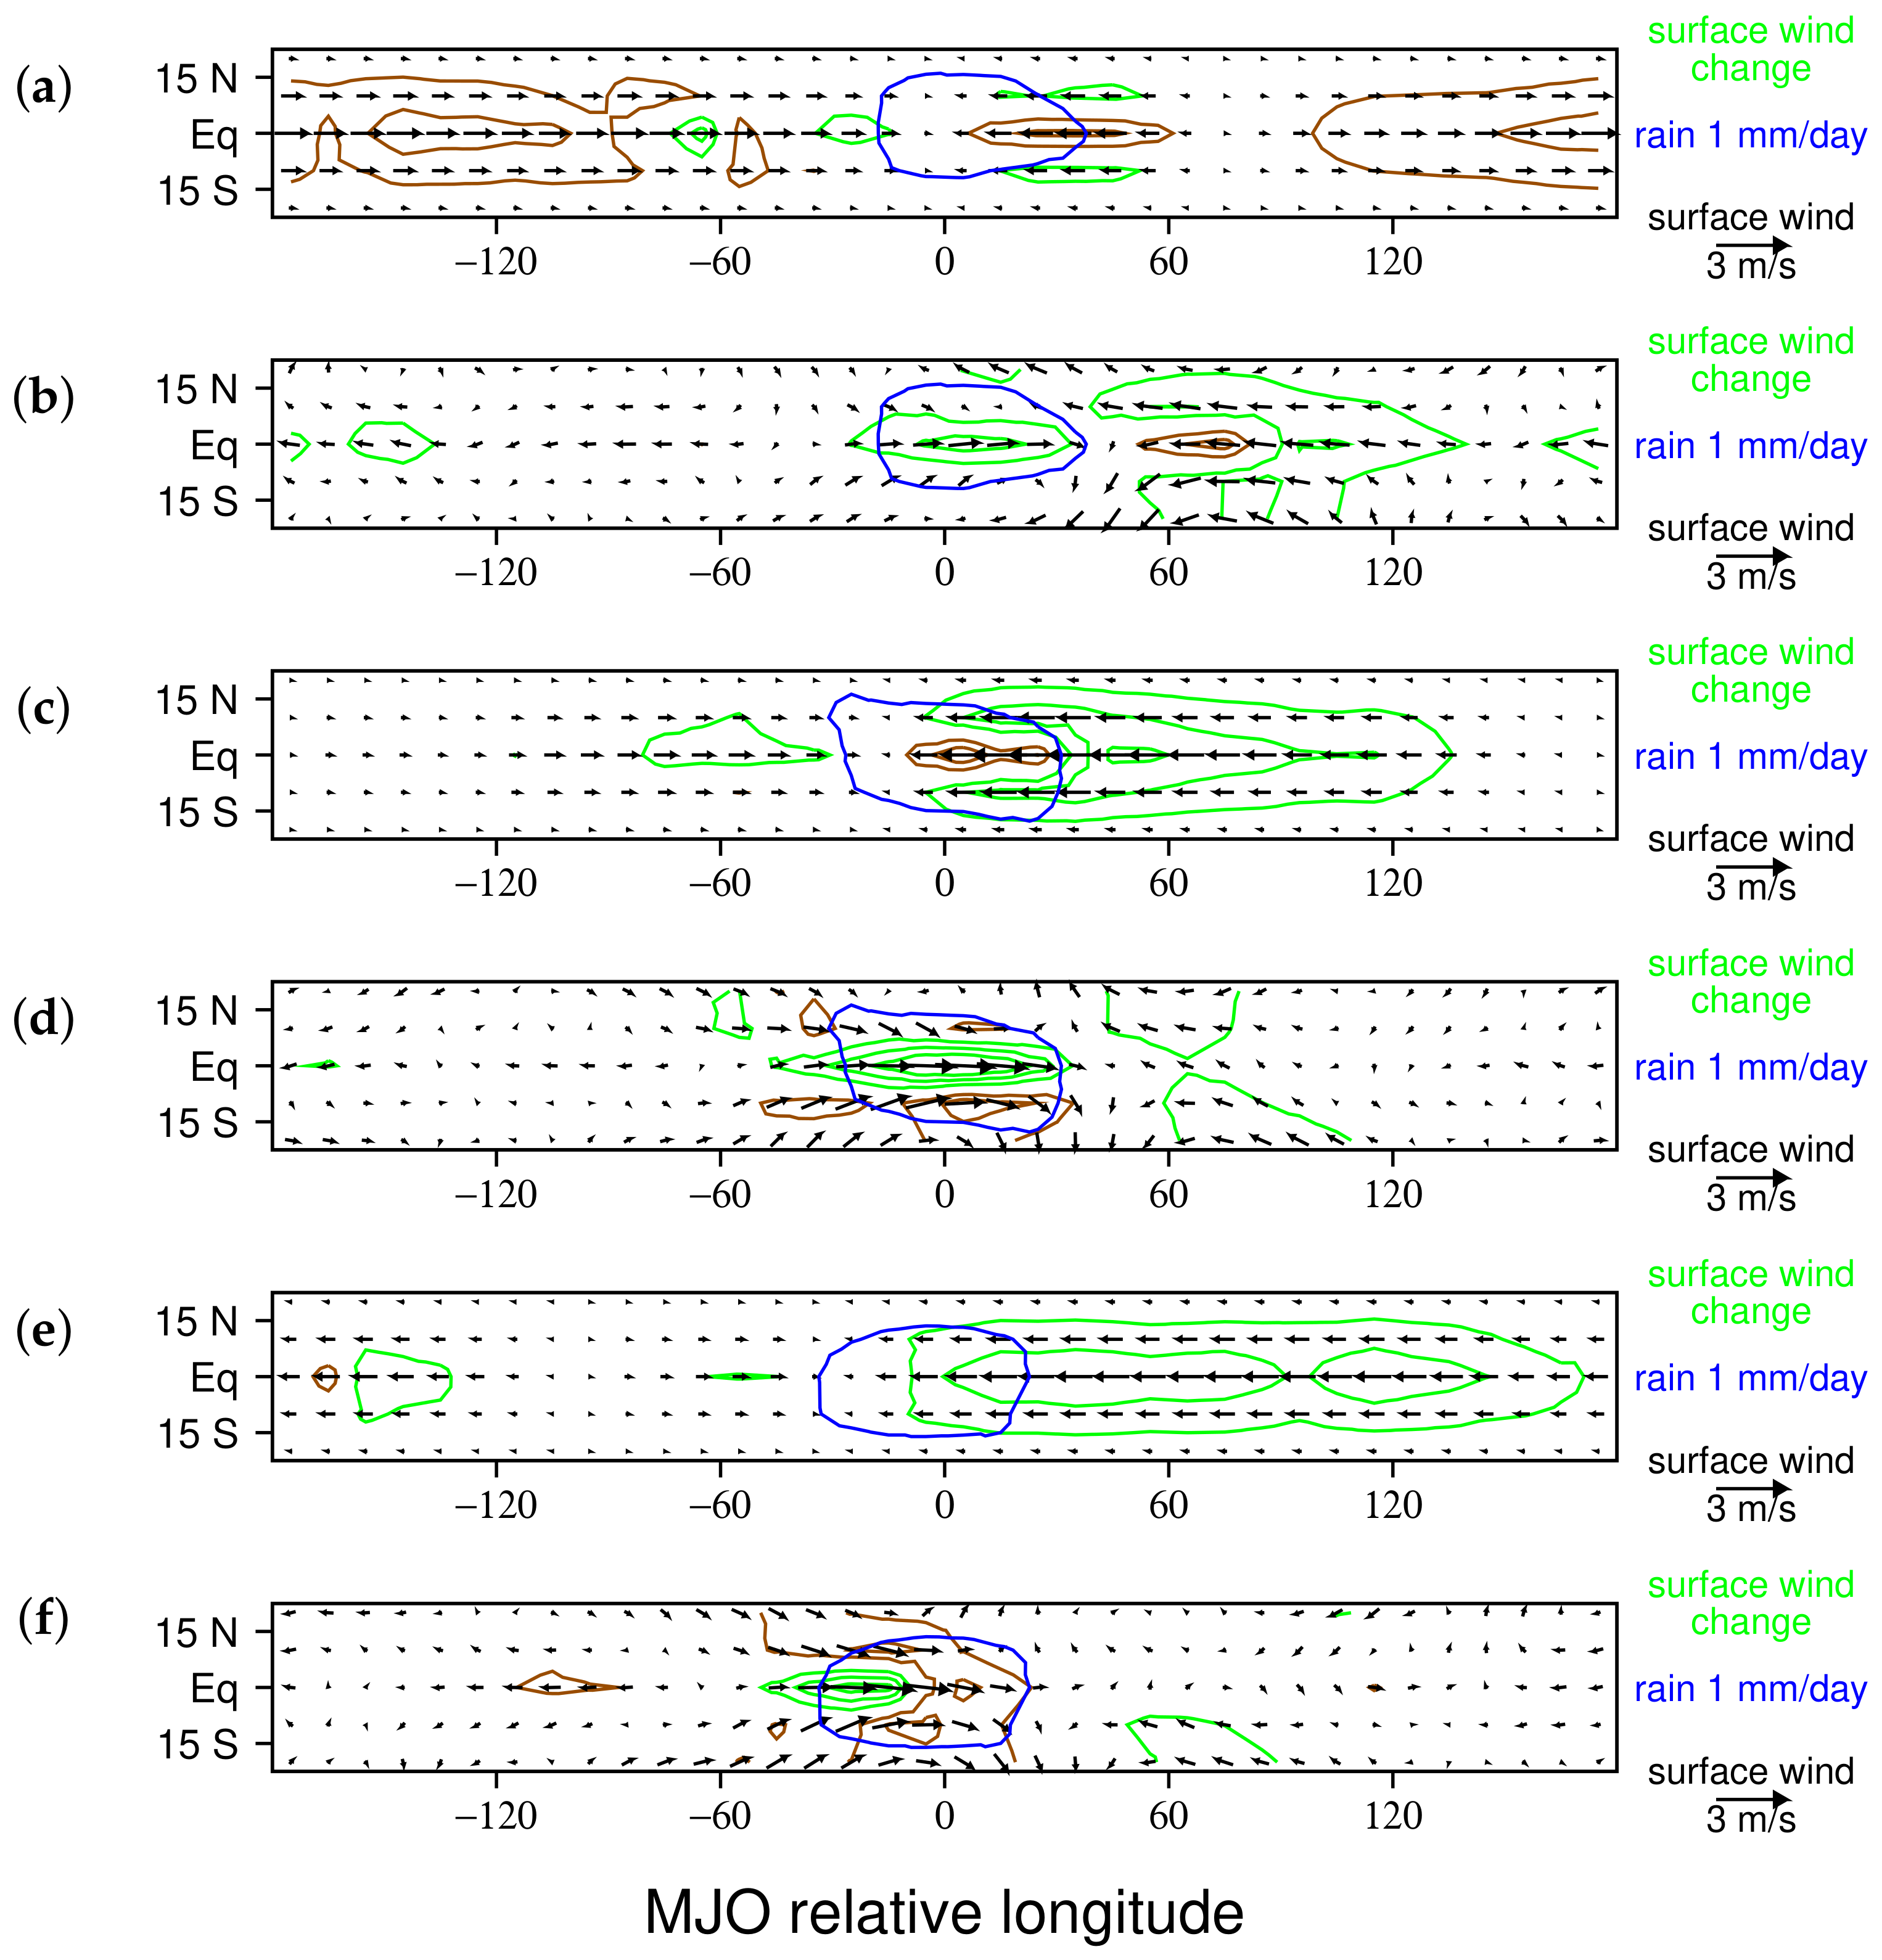
So far, we have examined which Kelvin and Rossby wave circulations contribute to the moisture and moist enthalpy budgets of the LAM MJO through advective tendencies of moisture and heat. They also change column-integrated moist enthalpy by altering surface fluxes. In Figure 12, we show how each wave type changes the surface wind speed when added to basic state winds, which illustrates where surface fluxes are enhanced or reduced by that wave. During the developing stage, the Kelvin wave reduces the surface wind speed near the equator on the eastern edge of the precipitation region, where easterly wind perturbations overlap westerly basic state flow (Figure 12a). Over almost half of the world opposite the MJO, westerly Kelvin wave wind perturbations reduce the surface wind speed, because they occur in a region with basic state easterlies. Note that this happens in an area where the troposphere is cool owing to a circumnavigating Kelvin wave (Figure 3a), and that the resulting surface flux perturbation reinforces this wave. Rossby wave wind perturbations enhance the surface wind speed and thereby increase surface fluxes of heat and moisture near the center of the MJO precipitation region (Figure 12b), and also off the equator just east of the convection, and on the equator more than 90 degrees east of the MJO. This is because there is a narrow band of basic state westerlies that extends into the western Pacific near the equator in the LAM, which is surrounded by basic state easterlies off of the equator (e.g., [49]). During the mature stage, when the MJO precipitation region lies on the eastern edge of these basic state westerlies, the Kelvin wave circulation enhances the surface wind speed in a broad region to the east of the MJO (Figure 12c). This region of surface flux enhancement overlaps the warm-phase Kelvin wave extending eastward from the MJO (Figure 3c), and therefore reinforces this wave. Rossby wave wind perturbations continue to enhance the surface wind speed near the center of the MJO, and off of the equator to the east of the MJO (Figure 12d). In the dissipating stage, the Kelvin wave wind perturbation enhances surface wind speed almost halfway around the world to the east of the MJO (Figure 12e), underneath a broad warm-phase Kelvin wave (Figure 3e). At this time, the Rossby wave wind perturbation only enhances surface wind speed in a small area near the western edge of the precipitation region, and reduces surface wind speed in a much larger area (Figure 12b). We conclude that Kelvin wave surface wind perturbations reinforce circumnavigating Kelvin waves throughout the MJO life cycle, and Rossby wave wind perturbations enhance surface fluxes within and to the east of the precipitation region in the developing and mature stages of the MJO.

4. Discussion

In this study, we isolate contributions of Kelvin and Rossby waves to the column integrated moisture and moist enthalpy budgets of the Madden–Julian Oscillation (MJO) in the Lagrangian Atmospheric Model (LAM). The LAM MJO resembles the observed MJO in vertical structure, horizontal structure, and life cycle (e.g., Figure 1, Figure 2 and Figure 3). Our analysis reveals differing roles for Kelvin and Rossby waves in the mechanisms of the MJO. While vertical motion associated with the Kelvin wave accounts for most of the MJO’s rainfall perturbation, this circulation exports a large amount of heat, so that it has a net negative impact on column-integrated moist enthalpy (Figure 6, Figure 8, Figure 9 and Figure 11). In contrast, the Rossby wave circulation accumulates less moisture, but much of the moisture it does bring in is through horizontal advection with little heat export, so it has a net positive impact on moist enthalpy in the developing and mature stages of the MJO (Figure 8, Figure 9 and Figure 11). The Kelvin wave circulation alters surface wind speed outside of the MJO’s convectively active region in a manner that reinforces both positive- and negative-phase circumnavigating Kelvin waves (Figure 12). Rossby wave wind perturbations enhance surface fluxes at the center of the MJO’s precipitation region, as well as ahead of the MJO, during the developing and mature stages (Figure 12).
Our analysis reveals several other aspects of the mechanism of the LAM MJO. In particular, neither radiation nor surface fluxes can account for the rapid build-up of moist enthalpy to the east of the LAM MJO convective center, nor the reduction in moist enthalpy to the west of the precipitation region, which are primarily achieved via horizontal advection by the Rossby wave (Figure 8, Figure 9, Figure 10 and Figure 11). During the developing stage, the greatest enthalpy increase occurs in off-equatorial anticyclonic flow near the eastern edge of the precipitation region (Figure 11b), which wraps around negative temperature perturbations (Figure 4a). By the mature stage, the greatest enthalpy decrease occurs in off-equatorial cyclonic flow on the western edge of the precipitation region (Figure 11f), which wraps around positive temperature perturbations (Figure 4e). These flow features have a similar positioning relative to the precipitation region in the observed MJO (Figure 4b,f), which suggests that this portion of the MJO mechanism may be the same in nature and in the LAM. The Rossby gyres deviate from predictions of linear theory [41] in that they are centered 25–30 degrees off the equator, and they move slowly eastward along with the MJO convective center, which is presumably a consequence of the non-resting basic state [42,81,82]. Many other studies have noted the important role played by these Rossby gyres in the moisture and/or moist static energy budgets of the MJO (e.g., [45,46,47,80,82,83]).
The results in this paper also help to tie together two seemingly contradictory theories of the MJO. Some scientists suggest that perturbation easterlies enhance surface fluxes in basic state easterlies to maintain the MJO circulation (e.g., [26]). Others believe that perturbation westerlies in basic state westerlies enhance surface fluxes to destabilize the MJO (e.g., [28]). Here, we show that both theories are correct for different components of the MJO’s circulation. Perturbation westerlies associated with the Rossby wave circulation enhance surface fluxes near the center of the MJO’s precipitation region during the developing and mature phases of the convective envelope (Figure 12b,d). Perturbation easterlies associated with both Kelvin and Rossby wave circulations enhance surface fluxes to the east of the convective envelope, aiding in the build-up of moist enthalpy there (Figure 12b–f). Finally, both perturbation easterlies and westerlies help to maintain the different phases of the circumnavigating Kelvin wave (Figure 12a,c,e [8]).
The results presented here also help to explain why the LAM predicts substantial strengthening of the MJO with global warming [42,64], whereas some other climate models do not [65]. Several of the key processes in the LAM MJO either directly or indirectly depend on the magnitude of surface fluxes of moisture, which could increase substantially with global warming owing to the nonlinear nature of the Clausius Clapyron equation (e.g., [64]). First, the LAM MJO is often triggered by the arrival of a cool-phase circumnavigating Kelvin wave (e.g., [8,42]). In coupled LAM simulations, the amplitude of this component of the MJO increases substantially with ocean warming [66], possibly due to its coupling with surface fluxes. Second, owing to stronger surface fluxes, the meridional gradient of moisture increases with ocean warming in the LAM, and this could cause a more rapid build-up of moisture on the eastern edge of the MJO owing to horizontal advection. Finally, surface fluxes of moisture associated with Rossby wave westerlies near the center of the MJO could increase with ocean warming. It is quite possible that other climate models have a larger role in radiation or frictional moisture convergence in the mechanisms of the MJO, which may not change as much with ocean warming as the key processes in the LAM MJO.
Taken as a whole, the results in this paper and its predecessors (Haertel et al. [8], Haertel [42,64,66]) point out two key deficiencies in theoretical interpretations of the MJO, which typically use a dynamical system linearized about a basic state of rest and high damping, yielding a Matsuno–Gill (MG)-type solution that is a steady-state response to a heat source. First, such theories fail to account for the circumnavigating Kelvin wave component of the MJO’s circulation. Haertel [42] showed that the cool-phase Kelvin wave lying to the west of the MJO’s precipitation region in the developing stage (Figure 3a,b) is generated by the suppressed phase of a preceding MJO, and that it propagates around the world. Here, we show that much of the precipitation in the developing MJO is due to this wave (Figure 6a, Figure 8a and Figure 9a). Note that this part of the Kelvin wave circulation is completely absent in an MG solution of a steady-state response to positive heating. Moreover, the results presented here suggest that in a warming climate, surface fluxes will enhance the circumnavigating component of the MJO’s circulation (Figure 12), possibly leading to MJO intensification with time [66]. The second key deficiency of MJO theories that use a system of equations linearized about a basic state of rest is that they fail to properly model the Rossby wave component of the MJO’s circulation. Not only does a simple linear dynamical system place the center of circulation of Rossby gyres too close to the equator, but it also causes the Rossby wave to propagate westward. Haertel [42] showed that the linear response to an MJO-like heating produces an elongated Rossby gyre growing westward from the heat source (e.g., Figure 6f,i from [42]) that differs substantially from the observed Rossby wave component of the MJO’s circulation (Figure 4). While using high damping makes the Rossby gyres more compact, it misses the point that in nature, the gyres extend a long way off of the equator into regions with westerlies, and they move eastward alongside the convective envelope with time (Figure 4; note that the Rossby gyres essentially stay fixed in the MJO’s frame of reference that moves eastward at 5 m/s). The reason the MJO’s precipitation envelope moves eastward along with the Rossby gyres is plain from the results presented in this study: Rossby wave circulations moisten ahead of the convective envelope and dry whilst they are a part of it (Figure 7, Figure 8, Figure 9, Figure 10 and Figure 11), and they also enhance surface fluxes at the center of the convective envelope (Figure 12). While recent theoretical interpretations of the MJO are making progress in that they include non-linear moisture advection [50], MJO theories would also benefit from using a non-resting basic state for the dynamics (i.e., height and wind terms), which would allow Rossby gyres to move eastward as they do in nature.
Another point worth mentioning is that in contrast with several leading MJO theories, neither radiation, negative gross moist stability, nor frictional moisture convergence appear to be of first-order importance to the LAM MJO. Radiation has a tiny impact on the moist enthalpy budget compared to the other terms (red line in Figure 5); upward motion reduces moist enthalpy in the MJO’s convective envelope (green line in Figure 6); and moist enthalpy advection is dominated by the deep convective circulation (compare black and dashed lines in Figure 5). Apparently, the instability of the LAM MJO is largely driven by surface fluxes, both from the Rossby wave westerlies near the center of convection and from the fluxes that enhance the circumnavigating Kelvin wave (Figure 12), and the key factor for eastward propagation is not frictional moisture convergence, but instead, the eastward movement of the Rossby gyres (Figure 4a,c,e), which mimics the behavior of the observed Rossby gyres (Figure 4b,d,f).

5. Conclusions

In the Lagrangian Atmospheric Model, the Madden–Julian Oscillation is driven primarily by horizontal advection of moisture and wind-enhanced evaporation, with only a minor contribution from radiation. Horizontal advection of moisture by Rossby waves builds up moist enthalpy east of the convective center, and reduces moist enthalpy following the heaviest rainfall. Vertical motion associated with the Kelvin wave contributes most of the rainfall, but this circulation reduces moist enthalpy due to a strong export of heat. Westerly wind perturbations associated with the Rossby wave enhance surface fluxes in the center of the MJO, and both easterly and westerly wind perturbations in circumnavigating Kelvin waves alter surface fluxes in such a way that helps to maintain these waves. Because the LAM reproduces the observed life cycle of Kelvin and Rossby wave circulations in the MJO (Figure 1, Figure 2 and Figure 3), there is a good chance that at least some of the key processes in the LAM MJO have a similar role in nature. This work also highlights two limitations of many theoretical interpretations of the MJO: (1) they fail to account for the circumnavigating Kelvin wave component of the MJO’s circulation, which makes important contributions to MJO rainfall, and (2) using a basic state of rest distorts the low-level Rossby gyres on the western flank of the precipitation region, which are important for MJO propagation owing to horizontal moisture advection.

Funding

This research was funded by NOAA grant NA20OAR4310377 and NSF grant AGS-2140281.

Data Availability Statement

Data for the composite MJO simulated with the LAM are available at https://ducky.net/lom/dat_cmp.zip.

Acknowledgments

The author thanks Alexey Fedorov and Yu Liang for their comments and suggestions.

Conflicts of Interest

The author declares no conflict of interest.

References

  1. Madden, R.A.; Julian, P.R. Detection of a 40–50 day oscillation in the zonal wind in the tropical Pacific. J. Atmos. Sci. 1971, 28, 702–708. [Google Scholar] [CrossRef]
  2. Madden, R.A.; Julian, P.R. Description of global-scale circulation cells in the tropics with a 40–50 day period. J. Atmos. Sci. 1972, 29, 1109–1123. [Google Scholar] [CrossRef]
  3. Madden, R.A.; Julian, P.R. Observations of the 40–50-day tropical oscillation—A review. Mon. Weather. Rev. 1994, 122, 814–837. [Google Scholar] [CrossRef]
  4. Zhang, C. Madden-julian oscillation. Rev. Geophys. 2005, 43, RG2003. [Google Scholar] [CrossRef] [Green Version]
  5. Kiladis, G.N.; Straub, K.H.; Haertel, P.T. Zonal and vertical structure of the Madden–Julian oscillation. J. Atmos. Sci. 2005, 62, 2790–2809. [Google Scholar] [CrossRef]
  6. Wheeler, M.; Kiladis, G.N.; Webster, P.J. Large-scale dynamical fields associated with convectively coupled equatorial waves. J. Atmos. Sci. 2000, 57, 613–640. [Google Scholar] [CrossRef] [Green Version]
  7. Sobel, A.; Kim, D. The MJO-Kelvin wave transition. Geophys. Res. Lett. 2012, 39, L20808. [Google Scholar] [CrossRef]
  8. Haertel, P.; Straub, K.; Budsock, A. Transforming circumnavigating Kelvin waves that initiate and dissipate the Madden–Julian Oscillation. Q. J. R. Meteorol. Soc. 2015, 141, 1586–1602. [Google Scholar] [CrossRef]
  9. Nakazawa, T. Tropical super clusters within intraseasonal variations over the western Pacific. J. Meteorol. Soc. Jpn. Ser. II 1988, 66, 823–839. [Google Scholar] [CrossRef] [Green Version]
  10. Hendon, H.H.; Liebmann, B. Organization of convection within the Madden-Julian oscillation. J. Geophys. Res. Atmos. 1994, 99, 8073–8083. [Google Scholar] [CrossRef]
  11. Haertel, P.T.; Kiladis, G.N. Dynamics of 2-day equatorial waves. J. Atmos. Sci. 2004, 61, 2707–2721. [Google Scholar] [CrossRef]
  12. Wang, B.; Rui, H. Synoptic climatology of transient tropical intraseasonal convection anomalies: 1975–1985. Meteorol. Atmos. Phys. 1990, 44, 43–61. [Google Scholar] [CrossRef]
  13. Maloney, E.D.; Hartmann, D.L. Modulation of eastern North Pacific hurricanes by the Madden–Julian oscillation. J. Clim. 2000, 13, 1451–1460. [Google Scholar] [CrossRef]
  14. Liebmann, B.; Hendon, H.H.; Glick, J.D. The relationship between tropical cyclones of the western Pacific and Indian Oceans and the Madden-Julian oscillation. J. Meteorol. Soc. Jpn. Ser. II 1994, 72, 401–412. [Google Scholar] [CrossRef] [Green Version]
  15. Wu, M.L.C.; Schubert, S.; Huang, N.E. The development of the South Asian summer monsoon and the intraseasonal oscillation. J. Clim. 1999, 12, 2054–2075. [Google Scholar] [CrossRef]
  16. Lorenz, D.J.; Hartmann, D.L. The effect of the MJO on the North American monsoon. J. Clim. 2006, 19, 333–343. [Google Scholar] [CrossRef] [Green Version]
  17. Haertel, P.; Boos, W.R. Global association of the Madden-Julian Oscillation with monsoon lows and depressions. Geophys. Res. Lett. 2017, 44, 8065–8074. [Google Scholar] [CrossRef]
  18. Mundhenk, B.D.; Barnes, E.A.; Maloney, E.D.; Baggett, C.F. Skillful empirical subseasonal prediction of landfalling atmospheric river activity using the Madden–Julian oscillation and quasi-biennial oscillation. NPJ Clim. Atmos. Sci. 2018, 1, 1–7. [Google Scholar] [CrossRef] [Green Version]
  19. Barnes, E.A.; Samarasinghe, S.M.; Ebert-Uphoff, I.; Furtado, J.C. Tropospheric and stratospheric causal pathways between the MJO and NAO. J. Geophys. Res. Atmos. 2019, 124, 9356–9371. [Google Scholar] [CrossRef]
  20. Liang, Y.; Fedorov, A.V. Linking the Madden–Julian Oscillation, tropical cyclones and westerly wind bursts as part of El Niño development. Clim. Dyn. 2021, 57, 1039–1060. [Google Scholar] [CrossRef]
  21. Liang, Y.; Fedorov, A.V.; Haertel, P. Intensification of Westerly Wind Bursts Caused by the Coupling of the Madden-Julian Oscillation to SST During El Niño Onset and Development. Geophys. Res. Lett. 2021, 48, e2020GL089395. [Google Scholar] [CrossRef]
  22. Hu, S.; Fedorov, A.V. The extreme El Niño of 2015–2016: The role of westerly and easterly wind bursts, and preconditioning by the failed 2014 event. Clim. Dyn. 2019, 52, 7339–7357. [Google Scholar] [CrossRef]
  23. Zhang, C.; Adames, Á.; Khouider, B.; Wang, B.; Yang, D. Four Theories of the Madden-Julian Oscillation. Rev. Geophys. 2020, 58, e2019RG000685. [Google Scholar] [CrossRef] [PubMed]
  24. Jiang, X.; Adames, Á.F.; Kim, D.; Maloney, E.D.; Lin, H.; Kim, H.; Zhang, C.; DeMott, C.A.; Klingaman, N.P. Fifty years of research on the Madden-Julian Oscillation: Recent progress, challenges, and perspectives. J. Geophys. Res. Atmos. 2020, 125, e2019JD030911. [Google Scholar] [CrossRef]
  25. Wang, B.; Liu, F.; Chen, G. A trio-interaction theory for Madden–Julian oscillation. Geosci. Lett. 2016, 3, 1–16. [Google Scholar] [CrossRef] [Green Version]
  26. Emanuel, K.A. An air-sea interaction model of intraseasonal oscillations in the tropics. J. Atmos. Sci. 1987, 44, 2324–2340. [Google Scholar] [CrossRef] [Green Version]
  27. Fuchs, Ž.; Raymond, D.J. A simple model of intraseasonal oscillations. J. Adv. Model. Earth Syst. 2017, 9, 1195–1211. [Google Scholar] [CrossRef] [Green Version]
  28. Sobel, A.; Maloney, E. Moisture modes and the eastward propagation of the MJO. J. Atmos. Sci. 2013, 70, 187–192. [Google Scholar] [CrossRef] [Green Version]
  29. Adames, Á.F.; Kim, D. The MJO as a dispersive, convectively coupled moisture wave: Theory and observations. J. Atmos. Sci. 2016, 73, 913–941. [Google Scholar] [CrossRef]
  30. Wang, B.; Rui, H. Dynamics of the coupled moist Kelvin–Rossby wave on an equatorial β-plane. J. Atmos. Sci. 1990, 47, 397–413. [Google Scholar] [CrossRef] [Green Version]
  31. Maloney, E.D.; Hartmann, D.L. Frictional moisture convergence in a composite life cycle of the Madden–Julian oscillation. J. Clim. 1998, 11, 2387–2403. [Google Scholar] [CrossRef]
  32. Hu, Q.; Randall, D.A. Low-frequency oscillations in radiative-convective systems. Part II: An idealized model. J. Atmos. Sci. 1995, 52, 478–490. [Google Scholar] [CrossRef] [Green Version]
  33. Raymond, D.J. A new model of the Madden–Julian oscillation. J. Atmos. Sci. 2001, 58, 2807–2819. [Google Scholar] [CrossRef]
  34. Andersen, J.A.; Kuang, Z. Moist static energy budget of MJO-like disturbances in the atmosphere of a zonally symmetric aquaplanet. J. Clim. 2012, 25, 2782–2804. [Google Scholar] [CrossRef]
  35. Khairoutdinov, M.F.; Emanuel, K. Intraseasonal variability in a cloud-permitting near-global equatorial aquaplanet model. J. Atmos. Sci. 2018, 75, 4337–4355. [Google Scholar] [CrossRef]
  36. Biello, J.A.; Majda, A.J.; Moncrieff, M.W. Meridional momentum flux and superrotation in the multiscale IPESD MJO model. J. Atmos. Sci. 2007, 64, 1636–1651. [Google Scholar] [CrossRef] [Green Version]
  37. Majda, A.J.; Stechmann, S.N. The skeleton of tropical intraseasonal oscillations. Proc. Natl. Acad. Sci. USA 2009, 106, 8417–8422. [Google Scholar] [CrossRef] [Green Version]
  38. Yang, D.; Ingersoll, A.P. Triggered convection, gravity waves, and the MJO: A shallow-water model. J. Atmos. Sci. 2013, 70, 2476–2486. [Google Scholar] [CrossRef]
  39. Straus, D.M.; Lindzen, R.S. Planetary-scale baroclinic instability and the MJO. J. Atmos. Sci. 2000, 57, 3609–3626. [Google Scholar] [CrossRef]
  40. Matsuno, T. Quasi-geostrophic motions in the equatorial area. J. Meteorol. Soc. Jpn. Ser. II 1966, 44, 25–43. [Google Scholar] [CrossRef] [Green Version]
  41. Gill, A. Some simple solutions for heat-induced tropical circulation. Q. J. R. Meteorol. Soc. 1980, 106, 447–462. [Google Scholar] [CrossRef]
  42. Haertel, P. Kelvin/Rossby wave partition of Madden-Julian oscillation circulations. Climate 2020, 9, 2. [Google Scholar] [CrossRef]
  43. Neelin, J.D.; Held, I.M.; Cook, K.H. Evaporation-wind feedback and low-frequency variability in the tropical atmosphere. J. Atmos. Sci. 1987, 44, 2341–2348. [Google Scholar] [CrossRef]
  44. Emanuel, K.A.; David Neelin, J.; Bretherton, C.S. On large-scale circulations in convecting atmospheres. Q. J. R. Meteorol. Soc. 1994, 120, 1111–1143. [Google Scholar] [CrossRef]
  45. Sobel, A.; Wang, S.; Kim, D. Moist static energy budget of the MJO during DYNAMO. J. Atmos. Sci. 2014, 71, 4276–4291. [Google Scholar] [CrossRef]
  46. Pritchard, M.S.; Bretherton, C.S. Causal evidence that rotational moisture advection is critical to the superparameterized Madden–Julian oscillation. J. Atmos. Sci. 2014, 71, 800–815. [Google Scholar] [CrossRef] [Green Version]
  47. Adames, Á.F.; Wallace, J.M. Three-dimensional structure and evolution of the moisture field in the MJO. J. Atmos. Sci. 2015, 72, 3733–3754. [Google Scholar] [CrossRef]
  48. Mei, S.; Li, T.; Chen, W. Three-type MJO initiation processes over the Western Equatorial Indian Ocean. Adv. Atmos. Sci. 2015, 32, 1208–1216. [Google Scholar] [CrossRef]
  49. Haertel, P.; Boos, W.R.; Straub, K. Origins of Moist Air in Global Lagrangian Simulations of the Madden–Julian Oscillation. Atmosphere 2017, 8, 158. [Google Scholar] [CrossRef] [Green Version]
  50. Vallis, G.K. Distilling the mechanism for the Madden–Julian Oscillation into a simple translating structure. Q. J. R. Meteorol. Soc. 2021, 147, 3032–3047. [Google Scholar] [CrossRef]
  51. Lin, J.L.; Kiladis, G.N.; Mapes, B.E.; Weickmann, K.M.; Sperber, K.R.; Lin, W.; Wheeler, M.C.; Schubert, S.D.; Del Genio, A.; Donner, L.J.; et al. Tropical intraseasonal variability in 14 IPCC AR4 climate models. Part I: Convective signals. J. Clim. 2006, 19, 2665–2690. [Google Scholar] [CrossRef] [Green Version]
  52. Hung, M.P.; Lin, J.L.; Wang, W.; Kim, D.; Shinoda, T.; Weaver, S.J. MJO and convectively coupled equatorial waves simulated by CMIP5 climate models. J. Clim. 2013, 26, 6185–6214. [Google Scholar] [CrossRef]
  53. Jiang, X.; Waliser, D.E.; Xavier, P.K.; Petch, J.; Klingaman, N.P.; Woolnough, S.J.; Guan, B.; Bellon, G.; Crueger, T.; DeMott, C.; et al. Vertical structure and physical processes of the Madden-Julian oscillation: Exploring key model physics in climate simulations. J. Geophys. Res. Atmos. 2015, 120, 4718–4748. [Google Scholar] [CrossRef]
  54. Grabowski, W.W. Coupling cloud processes with the large-scale dynamics using the cloud-resolving convection parameterization (CRCP). J. Atmos. Sci. 2001, 58, 978–997. [Google Scholar] [CrossRef] [Green Version]
  55. Arnold, N.P.; Branson, M.; Kuang, Z.; Randall, D.A.; Tziperman, E. MJO intensification with warming in the superparameterized CESM. J. Clim. 2015, 28, 2706–2724. [Google Scholar] [CrossRef]
  56. Kim, D.; Sobel, A.H.; Maloney, E.D.; Frierson, D.M.; Kang, I.S. A systematic relationship between intraseasonal variability and mean state bias in AGCM simulations. J. Clim. 2011, 24, 5506–5520. [Google Scholar] [CrossRef]
  57. Janiga, M.A.; Schreck, C.J., III; Ridout, J.A.; Flatau, M.; Barton, N.P.; Metzger, E.J.; Reynolds, C.A. Subseasonal forecasts of convectively coupled equatorial waves and the MJO: Activity and predictive skill. Mon. Weather Rev. 2018, 146, 2337–2360. [Google Scholar] [CrossRef] [Green Version]
  58. Slingo, J.; Rowell, D.; Sperber, K.; Nortley, F. On the predictability of the interannual behaviour of the Madden-Julian Oscillation and its relationship with El Niño. Q. J. R. Meteorol. Soc. 1999, 125, 583–609. [Google Scholar] [CrossRef]
  59. Jones, C.; Carvalho, L.M. Changes in the activity of the Madden–Julian oscillation during 1958–2004. J. Clim. 2006, 19, 6353–6370. [Google Scholar] [CrossRef] [Green Version]
  60. Takahashi, C.; Sato, N.; Seiki, A.; Yoneyama, K.; Shirooka, R. Projected future change of MJO and its extratropical teleconnection in east Asia during the northern winter simulated in IPCC AR4 models. Sola 2011, 7, 201–204. [Google Scholar] [CrossRef] [Green Version]
  61. Adames, A.F.; Kim, D.; Sobel, A.H.; Del Genio, A.; Wu, J. Changes in the structure and propagation of the MJO with increasing CO2. J. Adv. Model. Earth Syst. 2017, 9, 1251–1268. [Google Scholar] [CrossRef] [PubMed] [Green Version]
  62. Carlson, H.; Caballero, R. Enhanced MJO and transition to superrotation in warm climates. J. Adv. Model. Earth Syst. 2016, 8, 304–318. [Google Scholar] [CrossRef] [Green Version]
  63. Jones, C.; Carvalho, L.M. Stochastic simulations of the Madden–Julian oscillation activity. Clim. Dyn. 2011, 36, 229–246. [Google Scholar] [CrossRef] [Green Version]
  64. Haertel, P. Sensitivity of the Madden Julian Oscillation to Ocean Warming in a Lagrangian Atmospheric Model. Climate 2018, 6, 45. [Google Scholar] [CrossRef] [Green Version]
  65. Maloney, E.D.; Adames, Á.F.; Bui, H.X. Madden–Julian oscillation changes under anthropogenic warming. Nat. Clim. Chang. 2019, 9, 26–33. [Google Scholar] [CrossRef]
  66. Haertel, P. Prospects for Erratic and Intensifying Madden-Julian Oscillations. Climate 2020, 8, 24. [Google Scholar] [CrossRef] [Green Version]
  67. Bretherton, C.S.; Peters, M.E.; Back, L.E. Relationships between water vapor path and precipitation over the tropical oceans. J. Clim. 2004, 17, 1517–1528. [Google Scholar] [CrossRef]
  68. Adames, Á.F.; Kim, D.; Sobel, A.H.; Del Genio, A.; Wu, J. Characterization of moist processes associated with changes in the propagation of the MJO with increasing CO2. J. Adv. Model. Earth Syst. 2017, 9, 2946–2967. [Google Scholar] [CrossRef] [Green Version]
  69. Bui, H.X.; Maloney, E.D. Mechanisms for global warming impacts on Madden–Julian oscillation precipitation amplitude. J. Clim. 2019, 32, 6961–6975. [Google Scholar] [CrossRef]
  70. Puy, M.; Vialard, J.; Lengaigne, M.; Guilyardi, E. Modulation of equatorial Pacific westerly/easterly wind events by the Madden–Julian oscillation and convectively-coupled Rossby waves. Clim. Dyn. 2016, 46, 2155–2178. [Google Scholar] [CrossRef]
  71. Fedorov, A.; Brierley, C.; Lawrence, K.T.; Liu, Z.; Dekens, P.; Ravelo, A. Patterns and mechanisms of early Pliocene warmth. Nature 2013, 496, 43–49. [Google Scholar] [CrossRef] [Green Version]
  72. Haertel, P.T.; Straub, K.H. Simulating convectively coupled Kelvin waves using Lagrangian overturning for a convective parametrization. Q. J. R. Meteorol. Soc. 2010, 136, 1598–1613. [Google Scholar] [CrossRef]
  73. Haertel, P.; Straub, K.; Fedorov, A. Lagrangian overturning and the Madden–Julian Oscillation. Q. J. R. Meteorol. Soc. 2014, 140, 1344–1361. [Google Scholar] [CrossRef]
  74. Haertel, P. A Lagrangian method for simulating geophysical fluids. Lagrangian Model. Atmos. 2012, 85–98. [Google Scholar]
  75. Durre, I.; Vose, R.S.; Wuertz, D.B. Overview of the integrated global radiosonde archive. J. Clim. 2006, 19, 53–68. [Google Scholar] [CrossRef] [Green Version]
  76. Holton, J.R. An Introduction to Dynamic Meteorology, 4th ed.; International Geophysics Series; Elsevier: Amsterdam, The Netherlands; Academic Press: Burlington, MA, USA, 2004; p. 535. [Google Scholar]
  77. Fulton, S.R.; Schubert, W.H. Vertical normal mode transforms: Theory and application. Mon. Weather Rev. 1985, 113, 647–658. [Google Scholar] [CrossRef] [Green Version]
  78. Mapes, B.E.; Houze, R.A., Jr. Diabatic divergence profiles in western Pacific mesoscale convective systems. J. Atmos. Sci. 1995, 52, 1807–1828. [Google Scholar] [CrossRef] [Green Version]
  79. Haertel, P.T.; Kiladis, G.N.; Denno, A.; Rickenbach, T.M. Vertical-mode decompositions of 2-day waves and the Madden–Julian oscillation. J. Atmos. Sci. 2008, 72, 813–833. [Google Scholar] [CrossRef]
  80. Inoue, K.; Back, L. Column-integrated moist static energy budget analysis on various time scales during TOGA COARE. J. Atmos. Sci. 2015, 72, 1856–1871. [Google Scholar] [CrossRef] [Green Version]
  81. Monteiro, J.M.; Adames, Á.F.; Wallace, J.M.; Sukhatme, J.S. Interpreting the upper level structure of the Madden-Julian oscillation. Geophys. Res. Lett. 2014, 41, 9158–9165. [Google Scholar] [CrossRef] [Green Version]
  82. Liang, Y.; Fedorov, A.V.; Zeitlin, V.; Haertel, P. Excitation of the Madden–Julian Oscillation in Atmospheric Adjustment to Equatorial Heating. J. Atmos. Sci. 2021, 78, 3933–3950. [Google Scholar]
  83. Kim, D.; Kim, H.; Lee, M.I. Why does the MJO detour the Maritime Continent during austral summer? Geophys. Res. Lett. 2017, 44, 2579–2587. [Google Scholar] [CrossRef]
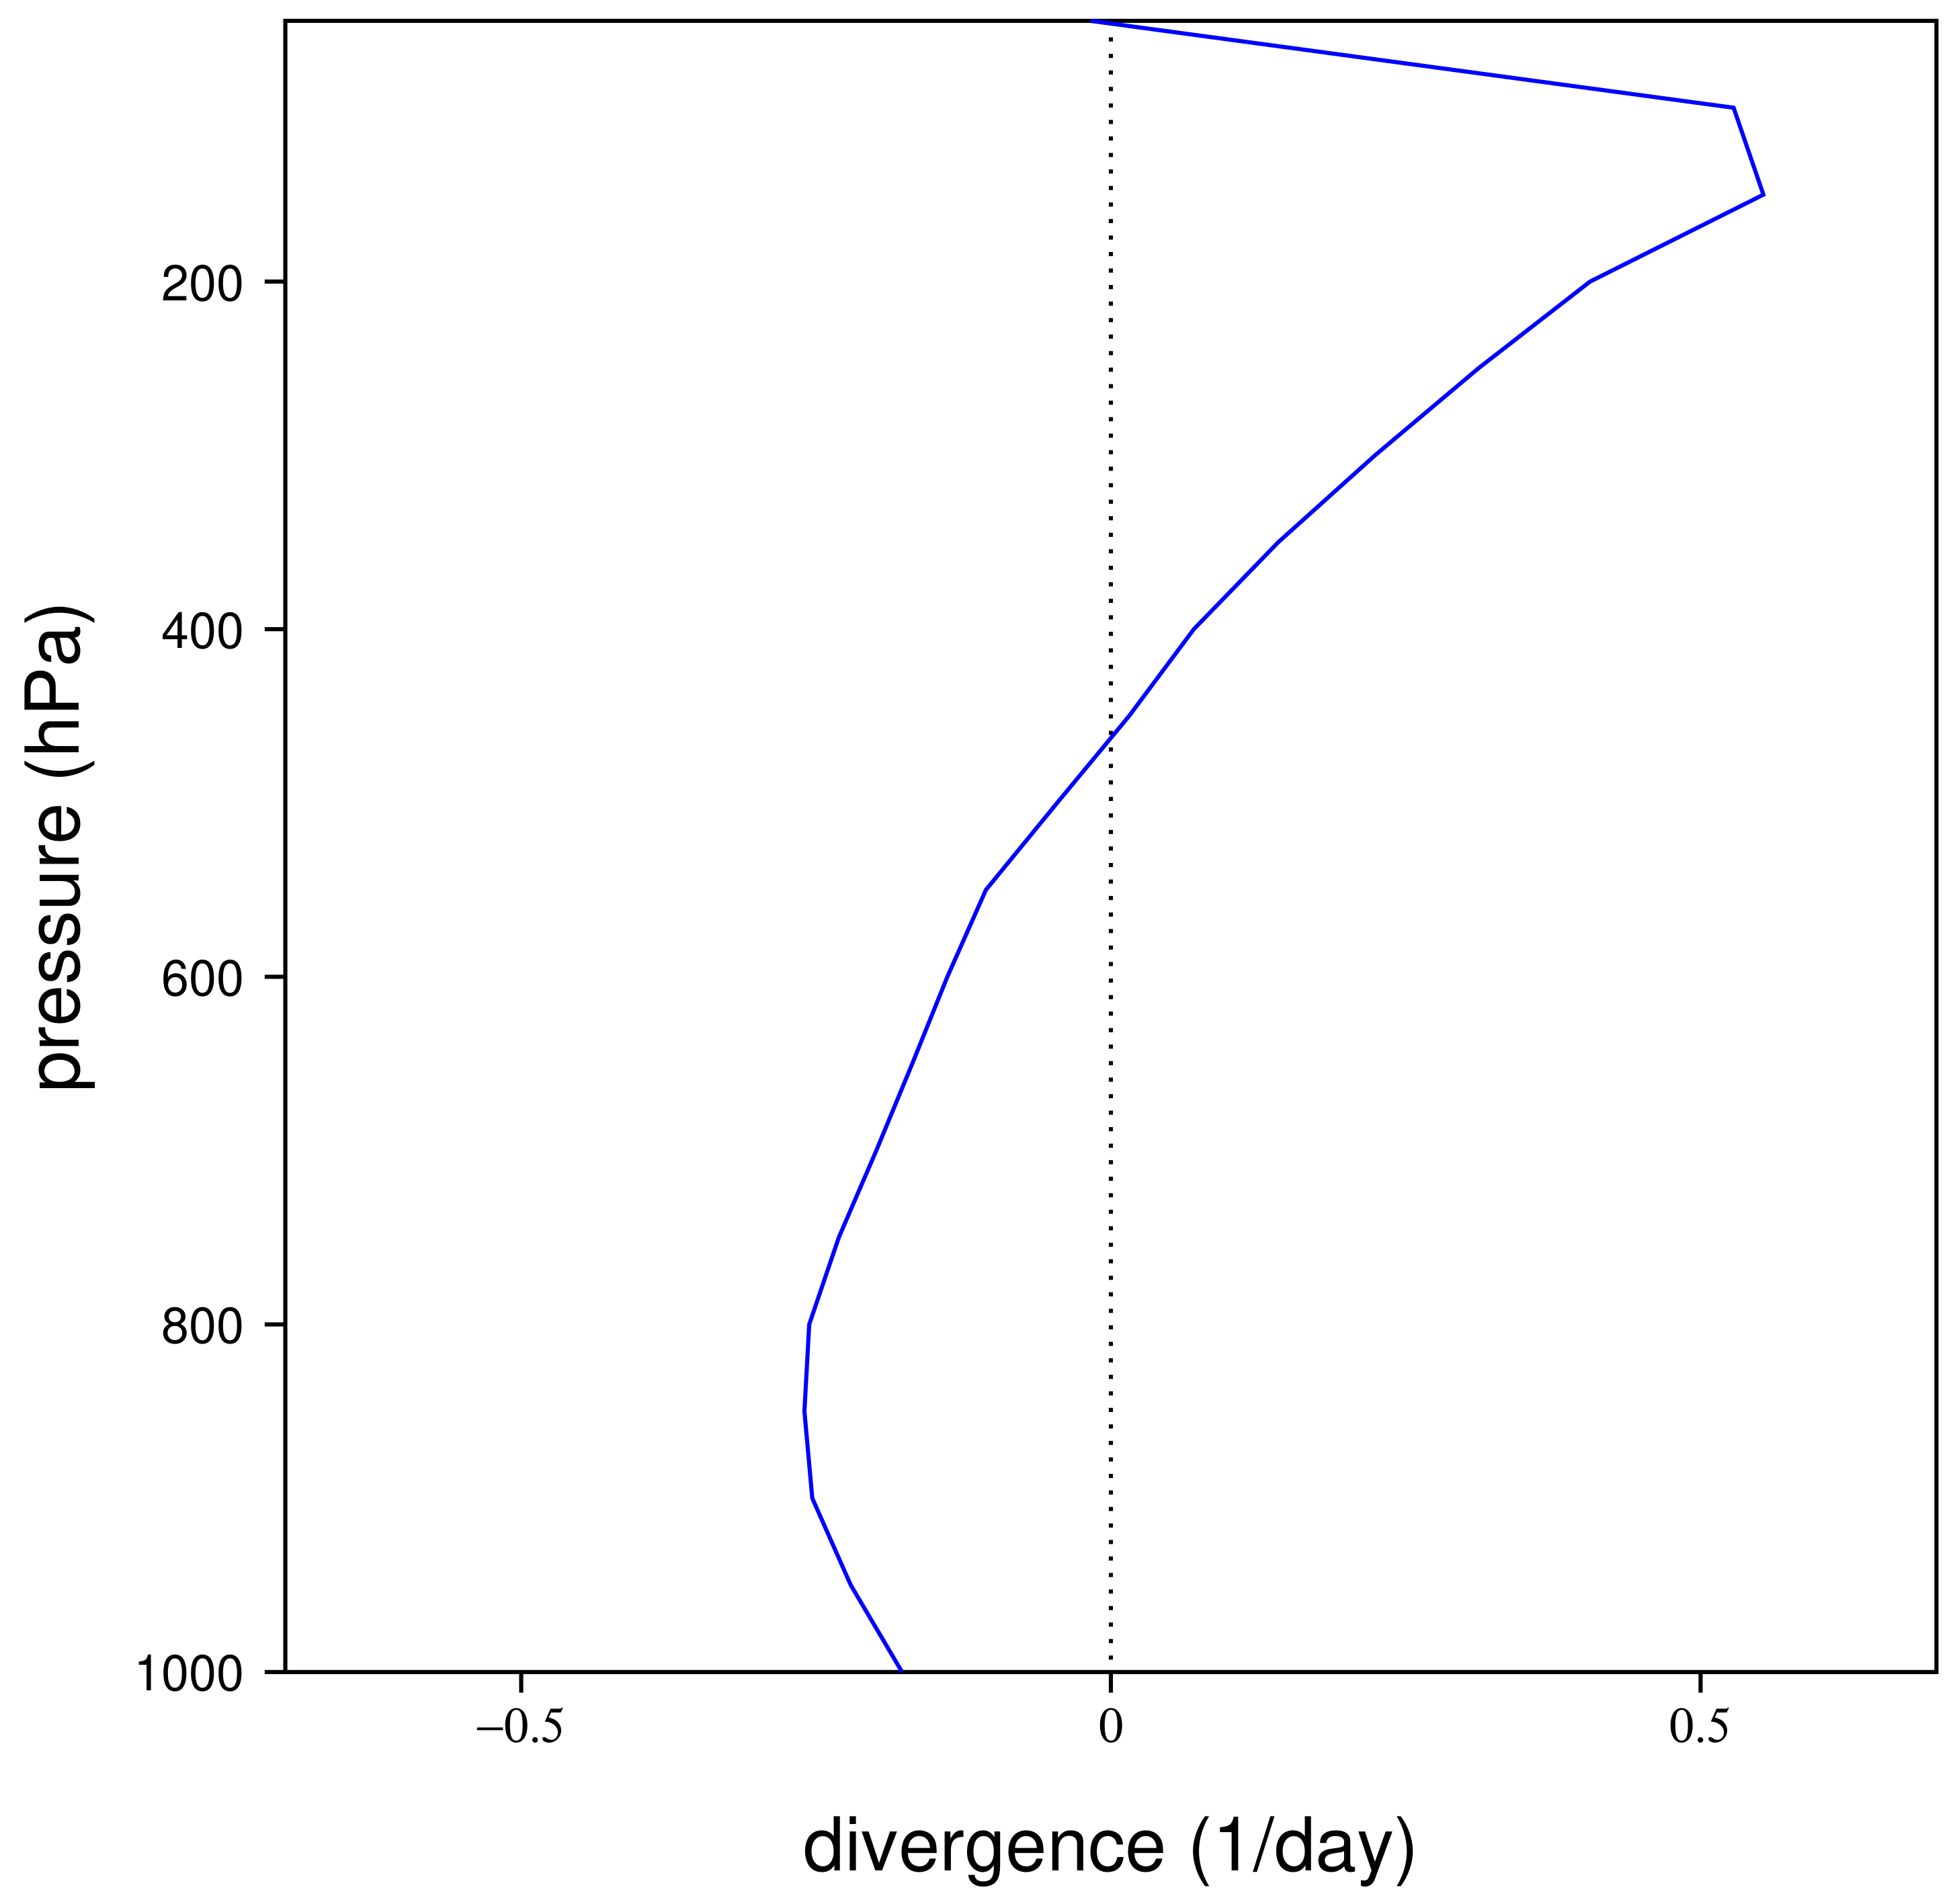
Figure 1. The average horizontal divergence perturbation within 10 degrees longitude and 5 degrees latitude of the MJO’s convective center during the mature stage. This function defines the vertical structure of the deep convective mode.
Geosciences 12 00314 g001
Figure 2. Average 200–850 hPa temperature (red and blue contours) and the difference between 850 and 200 hPa flow (vectors) for the composite LAM MJO (a,c,e) and the observed MJO (b,d,f) for the developing, mature, and dissipating stages of the convective envelope, respectively. For the LAM, MJO regions of perturbation rainfall less than −1 mm/day are shaded light gray, and areas with rainfall greater than 1 and 3 mm/day are shaded medium and dark gray, respectively. Green contours indicate budget-derived rainfall rates of 1 and 3 mm/day, respectively. Observed MJO regions of rainfall less than −1 and more than 1 mm/day are shaded light and dark gray, respectively (adapted from [42]).
Geosciences 12 00314 g002
Figure 3. Average 200–850 hPa temperature perturbations and the difference between 850 and 200 hPa flow for the Kelvin wave components of the composite LAM MJO (a,c,e) and the observed MJO (b,d,f) for the developing, mature, and dissipating stages of the convective envelope, respectively (contoured as in Figure 2). Regions of rainfall less than −1 and more than 1 mm/day are shaded light and dark gray, respectively. Panels (b,d,f) are adapted from [42].
Geosciences 12 00314 g003
Figure 4. Average 200–850 hPa temperature perturbations and the difference between 850 and 200 hPa flow for the Rossby wave components of the composite LAM MJO (a,c,e) and the observed MJO (b,d,f) for the developing, mature, and dissipating stages of the convective envelope, respectively (contoured as in Figure 2). Regions of rainfall less than −1 and more than 1 mm/day are shaded light and dark gray, respectively. Panels (b,d,f) are adapted from [42].
Geosciences 12 00314 g004
Figure 5. Key terms in the moist enthalpy budget of the composite LAM MJO for the developing, mature, and dissipating stages, respectively (ac). Advection of moisture and heat by MJO wind perturbations (black line), the contribution of the deep convective mode to moisture and heat advection (black dashed line), advection of perturbation heat and moisture by basic state winds (blue line), evaporation (green line), and radiation (red line).
Geosciences 12 00314 g005
Figure 6. Components of moist enthalpy advection for the LAM MJO. Rainfall (blue line), moisture tendency from vertical advection (red line), moist enthalpy tendency from vertical advection of dry static energy (black line), total moist enthalpy tendency from vertical advection (green line), and moist enthalpy tendency from horizontal advection (gold line). Panels (ac) are for the developing, mature, and dissipating stages of the MJO, respectively.
Geosciences 12 00314 g006
Figure 7. Comparison of moist enthalpy tendency (red line) with the sum of all the terms that contribute to it (blue line). Due to the facts that advective tendencies are sampled on a 1-day interval and that the effects melting and freezing are neglected, small random deviations between the red and blue curves are expected. Horizontal advection of moist enthalpy (green line) accounts for most of the change in moist enthalpy. Panels (ac) are for the developing, mature, and dissipating stages of the MJO respectively.
Geosciences 12 00314 g007
Figure 8. Moisture tendency owing to advection from the Kelvin (a,c,e) and Rossby (b,d,f) components of the LAM MJO for the developing, mature, and dissipating stages, respectively. Green (brown) contours indicate moistening (drying), and vectors show the difference between 850 and 200 hPa flow. Regions with rainfall greater than 1 and 3 mm/day are shaded light and dark gray, respectively. The −1 mm/day rainfall contour is marked with a dashed line.
Geosciences 12 00314 g008
Figure 9. Moisture tendency owing to vertical (a,c,e) and horizontal (b,d,f) advection in the LAM MJO for the developing, mature, and dissipating stages, respectively. Green (brown) contours indicate moistening (drying), and vectors show the difference between 850 and 200 hPa flow. Regions with rainfall greater than 1 and 3 mm/day are shaded light and dark gray, respectively. The −1 mm/day rainfall contour is marked with a dashed line.
Geosciences 12 00314 g009
Figure 10. Moist enthalpy tendency owing to advection for the developing, mature, and dissipating stages (ac). Green contours indicate moistening and/or heating, and brown contours indicate drying and/or cooling. Vectors show the difference between 850 and 200 hPa flow. Regions with rainfall greater than 1 and 3 mm/day are shaded light and dark gray, respectively. The −1 mm/day rainfall contour is marked with a dashed line.
Geosciences 12 00314 g010
Figure 11. Moist enthalpy tendency owing to advection from the Kelvin (a,c,e) and Rossby (b,d,f) components of the LAM MJO for the developing, mature, and dissipating stages. Contoured and shaded as in Figure 10.
Geosciences 12 00314 g011
Figure 12. Change in surface wind speed due to Kelvin (a,c,e) and Rossby (b,d,f) components of the LAM MJO for the developing, mature, and dissipating stages of the MJO, respectively. Green contours indicate regions with enhanced wind speed, and brown contours indicate regions with reduced wind speed (i.e., regions of enhanced and reduced surface fluxes, respectively). The contour interval is 0.5 m/s. Vectors indicate the difference between 850 and 200 hPa flow. The blue contour encloses the region with rain rates greater than 1 mm/day.
Geosciences 12 00314 g012
Publisher’s Note: MDPI stays neutral with regard to jurisdictional claims in published maps and institutional affiliations.