Abstract
In mountain environments, slope and fluvial dynamics often interact, and their relationship can be investigated through an integrated methodological approach. Landslides are a source of supplying sediments into riverbeds and can interact or interrupt the water course. Water courses can trigger or re-activate slope movements. The complexity of investigating the interaction between the two dynamics needs a complementarity of methods and techniques, combining remote and proximal sensing, geotechnical in situ surveys, and repositories and catalogue datasets. This leads to a synergistic use of all the heterogeneous data from different fields and formats. The present paper provides a literature review on the approaches and surveying procedures adopted in the investigation of slope and fluvial dynamics and highlights the need to improve the integrated management of geospatial information complemented by quality information. In this regard, we outline a geodatabase structure capable of handling the variety of geoscientific data available at different spatial and temporal scales, with derived products that are useful in integrated monitoring tasks. Indeed, the future adoption of a shared physical structure would allow the merging and synergistic use of data provided by different surveyors as well as the effective storing and sharing of datasets from a monitoring perspective.
1. Introduction
In mountain environments, slope dynamics includes different processes capable of affecting the channel network and influencing fluvial dynamics. Landslides and other mass-wasting processes can be important sources of supplying sediments into riverbeds and can interact with and sometimes interrupt water courses [1]. On the other hand, water courses can re-shape and/or re-activate slope movements, and water-level fluctuations can affect the lower part of a slope leading to accelerated erosion processes [2]. Generally, the interaction between slope processes and fluvial dynamics is characterized by a combination of different events, such as multi-physical, interactive processes between water flows, multi-sized sediment transport, and surficial morphological evolution. The above-mentioned mechanisms have been reported in the recent literature. Costa et al. and Van Asch et al. [3,4] discussed that if a rapid deposition of a large amount of sediment occurs, a landslide dam can be produced. Moreover, Fan et al. and Li et al. [5,6] reported that water waves can trigger landslides or collapses of the riverbanks. Other authors [1,7,8,9,10] outlined that during extreme precipitation events, large amounts of sediment and material are eroded and transported from hillslopes to the channel network in a short time. The understanding of the complex phenomena involved in the interaction between slope and fluvial dynamics requires an integrated surveying approach and effective management of the extremely heterogeneous datasets collected. Remote-sensing techniques, in situ methods, and a repository of historical data need to be combined in order to provide a quantitative description of such complex phenomena and validate the obtained results.
However, several issues still need to be addressed to achieve a fully integrated use of geoscientific data in the investigation of the selected phenomena. Each of these methods provide heterogeneous measurements and formats of the collected dataset: raster formats, vector formats, 3D point clouds, single point coordinates, and points’ velocity; all these datasets can be connected with historical maps, cartography, morphometry, hydrography, and lithology [11]. Moreover, all the collected data must be linked to each other for integrated and multi-temporal analyses of fluvial and slope dynamics. All data should be referred to the same reference system, and the accuracy value must be provided. Thus, an inventory mechanism based on the modern geodatabase structure, able to manage the dataset and make the data easily accessible and usable by the user, is required [12]. The availability of geodatabases for the abovementioned purposes may also assist in the planning of investigations through the effective use of all pre-existing information [13]. In the attempt to support the investigations about past and present phenomena falling into natural hazards, several databases and digital catalogues were developed by agencies and research institutes, for many different purposes [14,15,16,17,18,19,20]. These databases adopt Geographical Information System (GIS) technology to archive, manage, process, and report the results achieved. Basically, such datasets incorporate information about historical and digital cartography, products of aerial photogrammetry at small-to-medium scales, and documentation about historical events related to geo-hydrological hazards. Major limitations of the available repositories lie in the heterogeneity of the database architectures, which prevent their effective merging in a single database structure [21] and the ability to inform on possible interactions between geo-hydrological phenomena. Moreover, obvious limitations in the spatial detail of the reported information can be detected [17,22]. Databases are designed to incorporate dataset for specific phenomena (earthquakes, floods, landslides, etc.) at a national scale or within the administrative boundaries of the involved countries. Another limitation is the lack of the available database of structures being able to include possible data from the geomatics surveying and monitoring activities, which are complemented by the fundamental attributes about the source of measures, positional accuracy, and coordinate system used; all of these are from a multi-temporal analyses perspective and a synergic/integrated use of the geomatics technologies.
The main purpose of this paper is to provide a literature review on the methods and applications adopted for research on slope and fluvial dynamics, with special attention given to those studies integrating slope and fluvial datasets. The literature review showed limitations in the archiving and management of surveying data for an integrated approach in multitemporal data analysis and the need to design a geodatabase structure capable of handling and combining the amount and heterogeneity of geoscientific data, which are nowadays collected at different spatial and temporal scales through modern surveying techniques.
In this respect, the present paper outlines a schematic physical structure of an object-based relational and geometric database (namely the geodatabase), which is able to incorporate pre-existing historical data, remote and proximal sensing, and site-specific information from geomatics surveying, to be used in the investigation of slope dynamics and their effect on channel networks through an integrated methodological approach. The future adoption of a common and shared geodatabase structure would allow the synergistic use of historical data and new information collected by monitoring with different surveying technologies through more standardized approaches.
2. Investigation of Slope and Fluvial Dynamics: State-of-the-Art
The issue of analysing and interpreting the interaction between fluvial and slope dynamics is catching on, and, in the last decades, the ability of scientists to investigate river beds and hillslopes has remarkably increased [23]. Fluvial geomorphology explores the complex behaviour of river systems at different scales, from individual cross-sections to entire basins [24,25,26,27]. It has increasingly become a popular topic over the last decade, also as a support to sustainable river management, flood-risk assessment, and fluvial processes analysis [27,28,29,30]. Channel systems continuously evolve responding to fluctuations and changes of sediment supply and runoff; this can interact with channel morphologies, bed material size, hydraulic forces, river islands, and construction sites [31,32,33,34,35,36,37,38,39]. The movement and remodelling of soil due to anthropic actions can affect both slope and fluvial dynamics [30,40]. On the one hand, interventions along the slope can generate significant imbalances and modify the morphology of the riverbed; on the other hand, the construction of fluvial works (such as dams, riverbanks, weirs, etc.) can restore the equilibrium of the environment.
Scientists are trying to move toward an innovative direction that analyses geology, topography, geomorphology, land cover, and run-off, by using digital maps, orthophotos, digital elevation models for volumes computation, and displacements analyses [41,42]. Moreover, the improvement of high-resolution mapping tools, data accuracy, spatial coverage, and resurvey frequency represents a potential resource for monitoring morphological channel dynamics at different scales [26,27,43,44,45,46,47].
Remote and proximal sensing (e.g., satellite radar interferometry, Global Navigation Satellite Systems (GNSS) surveys, traditional topography, Uncrewed Aerial Vehicles (UAVs) photogrammetry, and terrestrial laser scanning) are usually integrated with geotechnical in situ surveys (e.g., by means of inclinometers, piezometers, extensometers, etc.). Spatial surveying methodologies, such as satellite radar interferometry from Synthetic Aperture Radar (SAR) images, led to maps of ground-surface deformations. Moreover, satellite, airborne, or UAV imagery (using RGB and multispectral sensors) can be effectively employed for the mapping of fluvial riparian vegetation or strongly vegetated slopes, with important implications in flood hazard assessment [48,49]. Proximity photogrammetry and LiDAR are very effective for monitoring natural processes (landslides, floodplain width, and their control on channel dynamics) because of the technological developments of UAV’s systems (lightweight cameras, miniature GNSS, and miniature LIDAR) and the development of new processing methodologies, both for LIDAR data and photogrammetric datasets [50]. These methods allow the generation of high-resolution 3D models at repeated intervals (month or years) that can be used to calculate slope dynamics and sediment budgets and to investigate channel-pattern changes [51,52,53]. Arrays of fixed cameras can be a suitable alternative to the above-mentioned 3D methods to raise monitoring frequency [54,55]. Moreover, a terrestrial laser scanner allows the generation of 3D product, but requires direct access to a site, so are rarely used in morphological applications. When the monitoring of specific points or the establishment of a common reference system are required, GNSS and a total station can be adopted. Geotechnical instruments (i.e., inclinometers and/or extensometers) are used for slope dynamics assessment. Inclinometers allow for monitoring displacements and deflections of slopes, embankments, and structures; the subsurface location of a rupture, determine the magnitude, rate, and direction of movements can be detected [50]. Extensometers allow for the measurement of the relative displacement between two points [56,57,58]. Piezometers can be used to measure underground water pressure, a crucial parameter in landslide analysis [59].
3. Methodologies and Techniques for Slope and Fluvial Dynamics
Different surveying techniques are used to monitor movements of unstable areas and investigate slope and fluvial dynamics. A multidisciplinary approach and integration of different methods are the best option to understand slope dynamics and their effects on channel networks [60,61]. The choice of the most suitable surveying method is mandatory in geoscientific applications, and it depends on different parameters: (i) accessibility, (ii) geographical and morpho-structural context, (iii) slope exposure and orientation, (iv) vegetation cover, (v) size of the phenomena, etc. [60]. Limitations of one single method can be overcome by the integration with other sources [62]. Only a synergistic use of multidisciplinary surveys and archive data allows a thorough investigation of geomorphological evolution [63], in particular of the interaction between slope and fluvial dynamics (Figure 1).
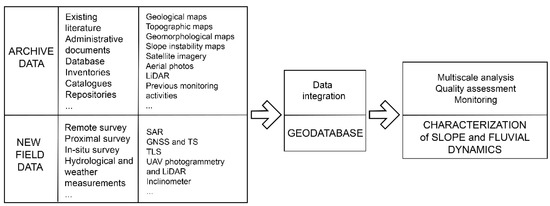
Figure 1.
Workflow of the multidisciplinary approach combining and integrating different remote and proximal sensing techniques and archive data applied to a study area.
3.1. Archive Data
Inventories, catalogues, and archives are useful tools to investigate slopes and fluvial dynamics. Different datasets and cartographic products can be found on online platforms and in digital databases. The open-access availability of geospatial datasets and products is rapidly increasing because of new monitoring technologies, new processing capabilities, and a growing willingness to share data [64]. Satellite data have increased the number of open-access products, and a wide range of datasets are continuously being released [65]. Different virtual platforms provide access to data, including Copernicus, European Space Agency (ESA), Google Earth Pro, Google Earth Engine, NASA Earth Exchange, and Open Data Cube [66,67,68]. Regional, national, or international repositories can be consulted to examine various data. For instance, the Italian Regional and National Geoportals provides different thematic maps, including geological maps, slope instability maps, and landslide inventory maps, together with historical digital orthophotos, historical LiDAR, and interferometric data. Furthermore, meteorological data are useful to understand the interaction between slope and fluvial dynamics, as well as morphological, morphometric, and hydrological data. Landslide inventories can be used for a variety of analyses, including: (i) investigating landslide spatial distribution through landslide density maps; (ii) comparing inventory maps obtained from different sources for the same area; (iii) evaluating the completeness of the inventories; (iv) estimating the frequency of slope failure occurrence through historical catalogues or multi-temporal inventory maps; (vi) analyzing size and dimensions; (vii) assessing landslide susceptibility and hazards [69]; and (viii) establishing levels of landslide risk [70], also with reference to fluvial dynamics. The accuracy of archive and inventories depends on the quality and quantity of the information sources [71,72,73,74,75]. The reliability of detecting slope dynamics comes not only from aerial photographs’ interpretation and systematic field surveys [76] but also from: (i) landslide age and freshness; (ii) persistence of landslide morphology in the landscape; (iii) type, quality, and scale of aerial photographs; (iv) morphological and geological complexity of the study area; and (v) land use [77,78,79].
Benchmarks monographies and administrative information also belong to archive data. Topographic surveys need benchmarks to ensure the repeatability through time and compare the obtained results; monographies of historical and new benchmarks are mandatory to find them and understand the performed measurements. With the term administrative data, we refer to information not available in existing geospatial databases, such as occurred maintenance yards, epoch, and type of activities. The need, the frequency of intervention on a road or a retaining wall, and the volume of handled materials are relevant information to understand slope dynamics, its effects on the channel, and correctly interpret field data.
3.2. New Field Data
In order to investigate the interaction between slope and fluvial dynamics, several surveying techniques can be used and integrated in order to perform measurements and analyses that cannot be reached with just one monitoring tool. Here, the field methodologies and instruments are described below: Differential Interferometry based on Synthetic Aperture Radar (DInSAR) satellite data, Global Navigation Satellite Systems surveys (GNSS), Uncrewed Aerial Vehicles (UAVs) photogrammetry, UAV Light Detection and Ranging (LiDAR), Terrestrial Laser Scanning (TLS), fixed cameras, Total Stations (TS), inclinometers, extensometers, and piezometers. In Table 1, specifications of approaches for on-field data acquisition are listed.

Table 1.
Specifications of techniques for field data acquisition.
3.2.1. DInSAR
The multi-temporal DInSAR techniques are effective tools for ground deformation analyses with a millimetre accuracy [80,81]. Different processing techniques are available: the DInSAR technique exploits two or three successive passes of the satellite over the same area to compute the interferogram and then the displacement map; Persistent Scatterer Interferometry (PSI) is based on the stacking of multi-temporal interferograms and enables the computation of the displacement time series of specific targets at the ground. These targets are selected for their signal-reflection stability in time [82,83]. DInSAR technique is based on a differential approach, the displacement values are referred to a reference position and to a reference epoch. In order to refer the results to an absolute frame, the interferometric products need to be calibrated with GNSS data, providing absolute positioning. Additionally, displacements are calculated along the line of sight (LOS), as the computation of the 2D components of the displacement (i.e., vertical and horizontal) requires both (ascending and descending) orbits.
Nowadays, InSAR techniques are widely used in slope instability monitoring, deformation monitoring, natural hazard assessment [84,85,86]; the main benefits are related to [87]: (a) the improvement of the spatial density of targets (without the need of maintenance) with respect to traditional geodetic terrestrial survey techniques; (b) the possibility to cover, with a single processing, a wide area at the ground (up to thousands of squared kilometres); (c) the computation of long displacement time series and the value of the mean velocity of the targets (the first available SAR dataset dates back to 1992); and (d) the high temporal resolution (few days or tens of days) of the series. Moreover, SAR-derived data (and remotely sensed data in general) can be a fundamental source of information when it is not possible to perform a ground survey on the investigated area due to its difficult accessibility [88]. However, the main limitations in this field of application must be mentioned, in particular: the decorrelation phenomena due to the variability of the land cover [89]; the temporal decorrelation due to occurrence of fast slope instability phenomena and the occurrence of geometric distortion effects such as layover, foreshortening, or shadowing depending on the slope gradient and orientation with respect to the acquisition geometry; and inability in the detection of north–south displacements. Products of DInSAR processing are: original SAR images (raster files), interferograms (raster files), and list of PS positions through time (.txt file).
3.2.2. GNSS
In GNSS positioning, the coordinates of points are provided in a global reference system [90,91]. Several methods for GNSS positioning can be implemented depending on required accuracy, number of available receivers, need for real time coordinates, and surveying repetition frequency. Land-monitoring applications can be performed by real-time or post-processing solutions. Real-time positioning allows final accuracy at the cm level, whereas the few mm levels of accuracy can be obtained with static methods based on relative positioning. The surveying rate (periodic or continuous) is chosen according to the risk associated to the phenomena.
GNSS has been effectively applied for the monitoring of slopes dynamics [92,93,94,95] to provide information on the morphometry, locations, and displacements [96]. Access to the area is required, and a proper materialization of interest points is mandatory for monitoring or integrating purposes; any obstacle to the sight of satellites make this technique unworkable [97]. Products of GNSS surveys are observables, navigation files in binary formats or RINEX files (Receiver Independent Exchange Format), required for post-processing solutions, and points coordinates (.txt file). If the survey is designed with a high frequency rate (continuous monitoring), the time series of the position will be available (.txt file). Coordinates measured with GNSS systems are often used to georeference/constrain other surveying methods.
3.2.3. UAV Photogrammetry
UAVs are largely used in geoscience applications because they can reach remote and dangerous areas without risks for operators. They allow a rapid execution of the survey, the collection of high-resolution images, geocoded data, and a proper design and automation of flight paths. The use of image-processing methodologies, such as Structure from Motion (SfM) photogrammetry, allows for the generation of 3D products with both photorealistic and metric contents, a detailed reconstruction of the morphology of the investigated area in a short time, and ensured affordable costs [60,98,99,100,101,102,103,104].
Photogrammetry requires metric references in order to georeferenced the obtained results; Ground Control Points (GCPs) or RTK UAVs can be used. GCPs are natural features or artificial targets, with coordinates that are known; GCPs can be recognized on the images, offering a ground constrain to the absolute orientation of the model. RTK UAVs allow for acquiring geolocated images. The overall quality of obtained 3D reconstructions can be affected by low overlap of images, blurry or bad-quality images, geometry of acquisition, occlusions, shadows, complex topography, numerosity and distribution of GCPs, accuracy of GCPs coordinates, camera modelling, ground sampling distance, and presence of vegetation [105,106,107,108,109,110]. Casella et al. [111] tested various SfM software, approaches, and GCPs configurations; they found that: an accuracy of 1–2 Ground Sample Distance (GSD) in planimetry and 2–3 GSD in altimetry is confirmed if the 3D accuracy of GCPs is like the GSD; a GCPs’ accuracy smaller than the GSD can lead to an overall accuracy of the photogrammetric 3D model of less than 1 GSD for the horizontal component and 1.5 GSD for the vertical one. Casella and several authors [112] also confirmed that accuracies are better when the number of GCPs increased but their decreasing influence the results less than expected.
UAV photogrammetry is well suited for volume computations and surface deformations control, for applications in small–medium extensions (till a few tenths of hectares) and good-textured and sparse–low-vegetation areas. The rate of subsequent survey is low (period monitoring), so operators on field and processing of data are required; the repeatability is ensured if similar survey condition are guaranteed. A series of products can be obtained through aerial photogrammetry: 3D point clouds (.txt, .las, .ptx, .e57), textured meshes (.obj, .ply), DEM, and ortomosaic (.tiff, .kmz).
3.2.4. UAV LiDAR
LiDAR sensors have been newly developed and implemented on UAV systems. UAV LiDAR has been increasingly used for applications including forestry, archaeology, and infrastructure surveying [113,114], yet monitoring applications are still limited. UAV LiDAR combines the benefits of both UAV and LiDAR: handling, efficacy, and simplicity of operation and metric results [115,116]. UAV LiDAR provides advantages in terms of large and uniform ground coverage over different geomorphic environments, high point density, and ability to penetrate vegetation. This methodology results in high-resolution 3D models, and it is well-suited for volume computation, surface deformations, and fast phenomena. Tests performed by Lin et al. [115] exhibit a precision of about 5–10 cm and a sensitiveness to external factors (flight configuration, surface characteristics) that is less than expected. The repeatability of subsequent surveys is ensured by similar flight conditions and overlapping scans. Ground targets or RTK systems are recommended for the georeferencing of the resulting 3D model. The rate of subsequent survey is low (period monitoring), so operators on field and processing of data are required. UAV LiDAR produces 3D point clouds (.txt, .las, .ptx, .e57), so a Digital Surface Model (DSM) and Digital Terrain Model (DTM) can be generated (.tiff, .geotiff).
3.2.5. TLS
TLS allows to digitize and model the shape of objects or surfaces by laser-scanning technologies efficiently and productively. Digitization takes place discreetly by measuring the three-dimensional position of a multitude of points; high resolution data that is accurate and precise are provided in a short time [117,118]. Terrestrial scanners can perform measurements at long distance (ranging from 150 m to 1000 m). The TLS method is well-suited for areas that can be investigated from a stable and accessible location [119]. If the operator needs to move the instrument on inaccessible areas, TLS is no longer an effective methodology. Terrestrial scanners are generally quite heavy and need to be placed over a tripod and properly levelled; additionally, in order to avoid occlusions, several locations of the instrument are required. The high resolution and accuracy of measured data make TLS an effective methodology for slopes’ instability, especially when man-made artefacts or sharp geometries occur [120]. The presence of vegetation makes the detection of the phenomena and the registration of different scansions hard. Acquisition distance, resolution, high oblique viewing angles, not-optimal external conditions or surface properties, poorly designed scan location, and bad scans’ registration influence the overall quality of the generated results [121]. Typically, in natural environments and easy-to-access conditions a resolution of 1–3 cm, and an overall accuracy of 3–6 cm, can be achieved. The methodology produces scaled products in a local reference system (internal to the instrument); for monitoring purposes, a georeferencing is required and performed through targets of known position (at least four, well distributed). The position of the targets in a defined reference system can be measured using a satellite-positioning system such as GNSS and permits a multitemporal comparison between surveys performed through time [122]. The repeatability of subsequent survey is ensured by similar acquisition parameters and data processing (instrument, location, resolution, targets positioning). The rate of subsequent survey is low (period monitoring), so operators on field are required. Generated products are a 3D point cloud with RGB and reflectance contents (.txt, .ply, .pts, .e57, .las); meshes and DEMs can be easily generated from the resulting point clouds.
3.2.6. Fixed Cameras
Capturing the overlapping images to compute 3D models can be performed with two approaches: single camera moving around the object, and a set of stationary cameras pointing to the object of interest [123]. Fixed systems compute 3D models with images acquired by the same position, so the resulting processing is based on a limited camera perspective. The reliability of photogrammetric outputs is guaranteed if an adequate images’ distribution and convergence pose are designed [124]. Kromer et al. [125] discussed results obtained with an array of five cameras, where accuracies of about 2–3 cm were achieved. The surveying rate is arbitrary, the camera can be remotely controlled, and no operators are required on site. Generated products are original images (.jpeg, .tiff), point clouds, 3D models, and generated bidimensional products (DSM, orthophoto).
3.2.7. TS
The monitoring of instability phenomena often employs distance and angles data, as measured by TS [97]. Total stations allow the measurement of both natural and artificial targets from the distance, access to the interest point is not required, and achievable accuracies are about 1–3 cm. Measurements can be periodic or continuous and are performed in a local reference system. On-site vegetation reduces the use of this method, and the intervisibility instrument target is mandatory; atmospheric corrections models are required to reduce the effects of refraction on the acquired measurements. In monitoring application, a stability check of the local reference system is mandatory (for both total station position and bearing reference), to ensure repeatability through time [126]. If the topographic survey needs to be integrated with other data, georeferencing is required (often performed with GNSS). Results of a topographic survey are: original measurements (.txt file) and point coordinates (.txt file); if continuous monitoring is performed, a time series of the positions is generated.
3.2.8. Geotechnical Instruments: Inclinometers, Extensometers
For slope-dynamics investigation, geotechnical instruments are also used. Vertical inclinometers enable the measurement of the relative horizontal displacements affecting the installation. Inclinometers measure displacements in two perpendicular planes; thus, displacement magnitudes and directions (vectors) can be calculated. Inclinometers are used in several applications, such as monitoring landslide movement and slope stability, as well as monitoring the impact of excavations on nearby facilities, deformations of structures, and settlement of embankment fills and roadway subgrades. Inclinometers present a maximum system precision of 1.2 mm per 30 m. The resolution is nearly linear and constant at inclinations between ±30° from vertical [127]. Technicians with expertise are usually required, but an automatic data-acquisition system may be required when: (i) there is a need for real-time monitoring and automatic alarms; (ii) sensors are located at a remote site; and (iii) there are too many sensors for timely manual readings. Results of inclinometers are a list of detected inclinations at various depths (.txt format).
Extensometers are used to measure and monitor lateral strains and displacements of soil or rock along the axis of a borehole. They can also be used to monitor the lateral movements of a wall or structure. The extensometer consists of two anchor plates, a connecting rod, and a displacement transducer. The rod spans the distance from the anchor to the reference head. A change in this distance, measured at the reference head, indicates that movement has occurred. The system provides high-resolution measurements; an electric head allows unattended monitoring by a data logger. Anchor depth is limited by the orientation of rods, so free movement of the horizontal rods can be restricted by friction and by pinching due to vertical movements; moreover, extensometers monitor movements along the axis of a borehole. Results of extensometers are lists of detected movements (.txt format).
3.2.9. Piezometers
Piezometers are tubes inserted into the saturated zone at or below the water table and are the only instrument used to monitor pore-water pressure [128]. The system directly measures the water level, so no buried sensing components are required. The response is slow time in soils with low permeability and direct access for readings the value is required. Ground conditions can affect the choice of instrument, so a standpipe piezometer is a reliable indicator of pore-water pressure in soil with high permeability, but, in soils with low permeability, the flow of water into and out of the standpipe is too slow to provide a timely indication of pore-water pressure. Temperature and humidity also interfere with the piezometer measurements, so instruments such as hydraulic piezometers and liquid-settlement gauges have limited use in freezing weather. In tropical heat and humidity, simple mechanical devices may be more reliable than electrical instruments. Results of piezometer surveys are a list of water level values (.txt format).
3.3. Integrated Use of Techniques
Measurements from conventional monitoring techniques (e.g., inclinometers, extensometers, and topographic and GNSS surveys) are normally restricted to a small number of ground points with respect to the surface of the investigated area. LiDAR and photogrammetric applications detect a huge number of points, so some hectares areas could be investigated; in addition, the same points cannot be surveyed at subsequent epochs, only areal analysis can be performed. UAV photogrammetry, LiDAR, and TLS provide high-density point clouds, enabling generation of high-quality models. All these techniques are relatively costly and are very effective in providing huge amounts of measurements in short time, improving understanding for changes and deformations. TLS provides highly dense and accurate observations, but the deployment of the survey can be time-consuming and difficult when dealing with steep terrains. Airborne methods (especially UAV) offer a time-efficient and cost-effective solution for the monitoring of instability phenomena and morphological changes or sedimentary processes along river channels and the development of new processing methodologies, both for LIDAR data and photogrammetric datasets [50]. Given the pros and cons of each technique, an integrated use of datasets is fundamental for obtaining reliable research outputs and helping to reduce uncertainties [90]. To this aim, information about data quality, resolution, and accuracy must be collected and stored.
In this regard, GIS platforms are recognized as useful tools to collect, storage, manage, process, analyse, and cartographically represent all the acquired data [126]. The existence of different kinds of spatial information, raster and vector data, point polygons and polylines, and sparse points coordinates necessitate the use of a GIS platform for the implementation, harmonisation, and integration of the results [50]. The use of appropriate technologies for landslide and river-channel mapping and monitoring is important in reducing risk of slope dynamics [129]. Slope monitoring should be accomplished by field-based geodetic, geotechnical, and geophysical techniques and remote-sensing techniques [50]. Each monitoring technique has limitations if applied individually, and a dense or multiparameter data coverage is tricky [130]; thus, only a synergistic use of multidisciplinary surveys can allow a complete multitemporal monitoring investigation [50].
4. Discussion
The literature review points out a more and more integrated technical approach to the investigations of fluvial and slope dynamics. However, the effective management of heterogeneous datasets aiming at an integrated approach is very often overlooked by the authors of papers focused on relevant applications, and such papers rarely introduce a description of geodatabase structures [14,18,19,20]. In addition, a geodatabase structure designed for the integration of techniques for monitoring tasks should integrate information about the timing of surveying and data quality. Based on the needs emerging from the literature review, we propose a schematic physical structure of an object-based relational and geometric database, allowing for the synergistic use of historical data and new information collected by monitoring with different surveying technologies through more standardized approaches (Figure 2).
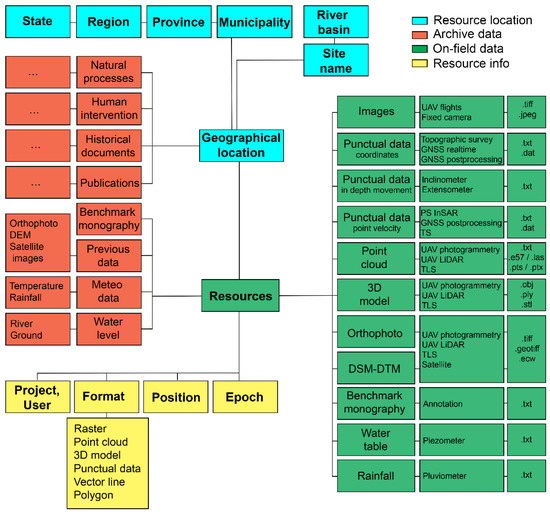
Figure 2.
Schematic physical structure of an object-based relational and geometric database.
In the proposed scheme, the main outputs of field survey methodologies are listed, and the most-used file formats are specified. Moreover, several possible interactions between data are guaranteed by the proposed database structure. To allow the use of the surveying data in successive monitoring activities, the database scheme includes a reference to the epoch of surveying for any techniques and stores final or intermediate products of the processing. The scheme is extensible through new tables.
Four main tables compose the database: “on-field data”, “archive data”, “resource location”, and “resource information”. On-field data and archive data are connected through the “resources” and “geographic location” tables: geographic location is used to connect on-field and repository data to location information, such as administration or basin-site name; resources table connects all data to their format, position (meant as coordinates), and reference epoch. These connections allow the user to search for geographical coordinates, locations information, epoch, name of site, and type of data format. Repository data represent: (i) an inventory of documentations about the investigated area and occurred events (i.e., past activation of the phenomenon, relevant natural phenomena, or human yards), intended as administrative data; and (ii) regional data with position information, not specifically acquired in the investigated site but suitable for extrapolating useful data for a specific case study. All data generated by in situ investigations form “in situ data” tables; different formats need to be considered (raster, vector, punctual information, and 3D datasets), data are generated with various methodologies and sensors ranging from topographic to geology, hydrology, and meteorological sciences. All these outputs can be generated by means of numerous methodologies and provided in various file formats. To query the database and correctly classify all the data, specific queries need to be created. The queries allow the user to browse the entire database and focus the search on specific resource type: on-field data type, format, specific epoch, coordinate, and site name.
Below is a brief description of the main resources:
- -
- previous data (repository) are resources available for the region such as airborne LiDAR, orthophoto, and PS-InSAR processing;
- -
- meteorological data (repository) are information about the investigated site that can be extrapolated from meteorological stations that are geographically distributed;
- -
- water level (repository) for both the water table and any rivers coming from geographically distributed sensors;
- -
- images (in situ) resource represents any image acquired on site;
- -
- punctual data (in situ) are separated in coordinates, as both periodic and continuous time series, belonging to topographic and GNSS surveys, in-depth movements coming from inclinometers and similar sensors, and point velocities produced by continuous survey and PS-InSAR;
- -
- point clouds and 3D models (in situ) generated with TLS, UAV photogrammetry, and LiDAR;
- -
- DSM, DTM, orthophotos data (in situ) extracted from 3D sources;
- -
- any meteorological and water level information derived by in situ instrumentations;
- -
- benchmark monography represents images, annotations, and any information useful in benchmark identification and use, for both historical and new benchmarks.
The physical structure of the outlined database is capable to support studies on slopes’ behaviour and morphodynamic parameters of channels according to two fundamental principles. The first refers to the need to design a procedure of surveys according to an integrated approach. The second relates to the need to organize data according to a multi-temporal scheme as required by the monitoring purposes. To ensure this dual need, the database structure should be designed to preserve the information about the reference system the surveying data are referred to. Indeed, the adoption of a single-coordinates reference system among products from different survey technologies allows to merge solutions and compare results in a multitemporal perspective (see, for instance, the detection of displacements or morphological variations due to landslide phenomena, the comparison of the digital elevation models for sediment budgets, and the investigation of channel pattern changes). Besides, the collection of surveying data related to a system composed of slopes, river banks, and riverbeds at the desired spatial scale opens the way to a quantitative representation of the interaction mechanisms and dynamics.
Therefore, the datasets stored in the geodatabase must preserve information about the surveying methodologies adopted and the positioning accuracy characterizing vector products such as coordinates, point clouds, surfaces, and delimiting polygons. The quality parameters must also be associated with the raster products such as orthophotos, photograms, and digital elevation models obtained from proximity aerial or terrestrial photogrammetry. These parameters can be summarized by the GSD, metrical, and spectral accuracy and must also be complemented by information on the surveying methodology. Ancillary data on the level of accuracy of the individual products from the geomatic survey make the assessment of the overall quality of the monitoring operations possible. In particular, in the monitoring of phenomena involving slow movements of slopes, it is essential to preserve the maximum quality provided by the detection techniques so that the adopted scheme is sensitive to small phenomena or small variations in the superficial morphology.
Since the merging of products in situ and remote-sensing techniques takes place from the knowledge of reference points normally detected with the GNSS technique, satellite positioning should be performed with the accuracy at a level of the adoptable monitoring technology or better. Thus, a rapid static method survey or a static method relative with sessions of sufficient duration is recommended to couple with the cm-level accuracy achieved by terrestrial laser scanning and short-range photogrammetry. Moreover, it must be considered that in environmental contexts such as those described in this work, it can be very difficult to apply differential GNSS techniques in the detection of GCPs, due to the lack of mobile data networks or limitations in the GNSS real-time kinematic (RTK) methods because of obstacles for the radio connection and difficulties for the setup of instruments in the area. In any case, information relating to the GNSS methods used must be reported in the database as descriptive attributes. Indeed, the type and accuracy of the GCPs used to align or compare the surveying products such as point clouds from different aerial photogrammetry operations and terrestrial/aerial laser scanning must be carefully evaluated and reported in the database. In the reconstruction of the channels and slopes morphometry with aerial photogrammetric surveys combined with terrestrial laser scanning, it can be extremely convenient to use common GCPs between the methods. GCPs and reflecting targets could be placed on the same location to reciprocally constrain the datasets from aerial photogrammetry and terrestrial laser scanning. Their spatial distribution should be designed to serve the whole surveyed area, very often composed of slopes and the involved stretch of the channel system. The information reported in the database must take this use of GCPs into account. The knowledge of absolute velocities of GNSS sites is also fundamental in the integration of the multi-temporal InSAR methods into the monitoring activities, because of the relative properties of displacements produced and the need to refer the dataset to a common and absolute coordinate reference system.
Ultimately, the relational structure of the geographic database proposed in this work must be able to support this synergistic use of the survey techniques, while preserving information about the quality of data collected and products obtained.
The development of a geodatabase oriented to the integrating of field data and historical information about the slope-channel morphodynamic parameters could easily support successive investigations. Indeed, it includes morphological data and previous approaches to the investigations, which help in the design of new surveys and inform on the accessibility of a study area or logistical constraints that prevent the use of a certain instrument. Moreover, the database includes useful data to guarantee the repeatability of surveying operations (see, for instance, the location of GCPs and the UAV trajectories followed in previous aerial surveys).
Morphometric data and previous displacements archived in the database could support this crucial stage in the planning of surveys. For instance, the effective use of multi-temporal SAR interferometry in this field of applications is strongly dependent from the rate of displacements [131] and the exposure and morphometry of slopes and river channels, including the presence of anthropic features; another important factor is the terrain orientation and exposure, with respect to the satellite Line Of Sight (LOS) along the ascending and/or descending orbits.
The usefulness of the proposed geodatabase structure is increased by the ability to merge information about the natural domain of the phenomena with data on anthropic modifications. Interventions oriented to the mitigation of effects due to slope failures on river channels, as well as interventions on river banks for flow regulation, could be of interest in the monitoring tasks. Anyhow, anthropic modifications and the induced effect on the slope and fluvial dynamics must be considered in the database and the related information that is included. The management of such a variety of information in a single database allows for a complete representation of the interaction processes between the slope and channel dynamics.
5. Conclusions
The analysis of the state-of-the-art surveying methodology and the limitations concerning the investigation of slope and fluvial dynamics highlighted the need to design a suitable geodatabase structure integrating geomatics surveying, monitoring activities, and repositories data at different spatial and temporal scales for adequate quantitative assessments.
The implementation of a common approach to the design of a surveying procedure and successive data management through a shared database structure introduces some advantages. First of all, the database scheme allows to integrate all the possible raster and vector data and intermediate or final products from the processing that has been carried out, starting from data collected by different surveying methodologies. In a monitoring approach to surveying, this allows for organizing the temporal datasets according to a repeatable scheme and, therefore, for homogenizing the data coming from different sites or being acquired by different users. Moreover, it would open the way to a common and shared approach of cataloguing the detailed data acquired at site-scale, while preserving the integrity of the data and their use in a temporal perspective for monitoring purposes. Besides, the future adoption of a shared physical structure would allow the merging and synergistic use of the data provided by different surveyors, who may have collected information in an area even for different purposes or with different approaches to surveying, as well as with varying accuracy and spatial resolution of the collected data and products. Ultimately, this allows for storing and preserving the data acquired with several monitoring technologies and the sharing of them in all investigations that might benefit from such data. The literature review also underlined that the potential of a geodatabase relies on the integration with existing repositories including the geographical data and documentation available on the investigated phenomena. Such repositories have been structured according to the philosophy of geodatabases and are accessed by desktop software using common web services or visualized using the WebGIS functionalities. The integration of geodatabases about surveying data with existing repositories would allow for the archiving of all the geoscientific data available at various spatial scales, from large extents to site-specific data.
Author Contributions
Conceptualization, C.P., P.R., M.S. and F.M.; methodology, C.P., P.R., F.G. and F.M.; resources, C.P., P.R. and F.M.; writing—original draft preparation, C.P., P.R., F.G. and F.M.; writing—review and editing, C.P., P.R., M.S. and F.M.; visualization, P.R., M.S. and F.M.; supervision, M.S. and F.M.; project administration, M.S. and F.M.; funding acquisition, M.S. and F.M. All authors have read and agreed to the published version of the manuscript.
Funding
The research presented here has been carried out within the framework of the collaboration between the Inter-Departmental Research and Innovation Centre on Constructions and Environmental Services (CRICT) of the University of Modena and Reggio Emilia and the Regional Agency for Territorial Safety and Civil Protection of Emilia-Romagna, in the frame of the project “Analysis of the interaction between fluvial dynamics and slope processes aiming at the recognition of geomorphological risk situations” (M.S.).
Institutional Review Board Statement
Not applicable.
Informed Consent Statement
Not applicable.
Data Availability Statement
Not applicable.
Acknowledgments
The authors are grateful to the Regional Agency for Territorial Safety and Civil Protection of Emilia-Romagna, namely to Francesca Lugli and Edda Pattuzzi for the technical assistance and support.
Conflicts of Interest
The authors declare no conflict of interest.
References
- Scorpio, V.; Cavalli, M.; Steger, S.; Crema, S.; Marra, F.; Zaramella, M.; Borga, M.; Marchi, L.; Comiti, F. Storm characteristics dictate sediment dynamics and geomorphic changes in mountain channels: A case study in the Italian Alps. Geomorphology 2022, 403, 108173. [Google Scholar] [CrossRef]
- Płaczkowska, E. Slope-Fluvial System Structure in the Western Tatra Mountains (Poland): Slope-to-Channel Transition. Arct. Antarct. Alp. Res. 2017, 49, 569–583. [Google Scholar] [CrossRef]
- Costa, J.E.; Schuster, R.L. The formation and failure of natural dams. Geol. Soc. Am. Bull. 1988, 100, 1054–1068. [Google Scholar] [CrossRef]
- Van Asch, T.W.; Buma, J.; Van Beek, L.P.H. A view on some hydrological triggering systems in landslides. Geomorphology 1999, 30, 25–32. [Google Scholar] [CrossRef]
- Fan, X.; Xu, Q.; Alonso-Rodriguez, A.; Subramanian, S.; Li, W.; Zheng, G.; Dong, X.; Huang, R. Successive landsliding and damming of the Jinsha river in eastern Tibet, China: Prime investigation, early warning, and emergency response. Landslides 2019, 16, 1003–1020. [Google Scholar] [CrossRef]
- Li, J.; Cao, Z.; Cui, Y.; Borthwick, A.G.I. Barrier lake formation due to landslide impacting a river. Appl. Math. Model. 2020, 80, 574–601. [Google Scholar] [CrossRef]
- Schuerch, P.; Densmore, A.L.; McArdell, B.W.; Molnar, P. The influence of landsliding on sediment supply and channel change in a steep mountain catchment. Geomorphology 2006, 78, 222–235. [Google Scholar] [CrossRef]
- Thompson, C.; Fryirs, K.; Croke, J. The disconnected sediment conveyor belt: Patterns of longitudinal and lateral erosion and deposition during a catastrophic flood in the Lockyer Valley, southeast Queensland. Australia. River Res. Appl. 2016, 32, 540–551. [Google Scholar] [CrossRef]
- Scorpio, V.; Crema, S.; Marra, F.; Righini, M.; Ciccarese, G.; Borga, M.; Cavalli, M.; Corsini, A.; Marchi, L.; Surian, N.; et al. Basin-scale analysis of the geomorphic effectiveness of flash floods: A study in the northern Apennines (Italy). Sci. Total Environ. 2018, 640–641, 337–351. [Google Scholar] [CrossRef] [PubMed]
- Shmilovitz, Y.; Morin, E.; Rinat, Y.; Haviv, I.; Carmi, G.; Mushkin, A.; Enzel, Y. Linking frequency of rainstorms, runoff generation and sediment transport across hyperarid talus-pediment slopes. Earth Surf. Process. Landf. 2020, 49, 1644–1659. [Google Scholar] [CrossRef]
- Gustavsson, M.; Seijmonsbergen, A.C.; Kolstrup, E. Structure and contents of a new geomorphological GIS database linked to a geomorphological map—With an example from Liden, central Sweden. Geomorphology 2008, 95, 335–349. [Google Scholar] [CrossRef]
- Favretto, A.; Brunello Zanitti, A. Geodatabase to store non homogeneous cartography: An applicatory example. Boll. AIC 2010, 138, 123–130. [Google Scholar]
- Chesnaux, R.; Lambert, M.; Walter, J.; Fillastre, U.; Hay, M.; Rouleau, A.; Daigneault, R.; Moisan, A.; Germaneau, D. Building a geodatabase for mapping hydrogeological features and 3D modeling of groundwater systems: Application to the Saguenay–Lac-St.-Jean region, Canada. Comput. Geosci. 2011, 37, 1870–1882. [Google Scholar] [CrossRef]
- Munich Re. NatCat SERVICE Loss Database for Natural Catastrophes Worldwide. 2011. Available online: http://www.munichre.com/en/reinsurance/business/non-life/georisks/natcatservice/default.aspx (accessed on 10 March 2022).
- Sacco, G.M.; Nigrelli, G.; Bosio, A.; Chiarle, M.; Luino, F. Dynamic Taxonomies Applied to a Web-Based Relational Database for Geo-Hydrological Risk Mitigation. Comput. Geosci. 2012, 39, 182–187. [Google Scholar] [CrossRef]
- Menoni, S.; Molinari, D.; Ballio, F.; Minucci, G.; Mejri, O.; Atun, F.; Berni, N.; Pandolfo, C. Flood Damage: A Model for Consistent, Complete and Multipurpose Scenarios. Nat. Hazards Earth Syst. Sci. 2016, 16, 2783–2797. [Google Scholar] [CrossRef]
- Swiss Re. Sigma Natural Catastrophes and Man-Made Disasters. 2017. Available online: http://institute.swissre.com/research/overview/sigma/ (accessed on 10 March 2022).
- Herrera, G.; Mateos, R.M.; García-Davalillo, J.C.; Grandjean, G.; Poyiadji, E.; Maftei, R.; Filipciuc, T.C.; Jemec Auflič, M.; Jež, J.; Podolszki, L.; et al. Landslide Databases in the Geological Surveys of Europe. Landslides 2018, 15, 359–379. [Google Scholar] [CrossRef]
- Napolitano, E.; Marchesini, I.; Salvati, P.; Donnini, M.; Bianchi, C.; Guzzetti, F. LAND-DeFeND—An Innovative Database Structure for Landslides and Floods and Their Consequences. J. Environ. Manag. 2018, 207, 203–218. [Google Scholar] [CrossRef]
- Núñez-Andrés, M.A.; Lantada Zarzosa, N.; Martínez-Llario, J. Spatial Data Infrastructure (SDI) for Inventory Rockfalls with Fragmentation Information. Nat. Hazards 2022, 112, 2649–2672. [Google Scholar] [CrossRef]
- Guzzetti, F.; Tonelli, G. Information System on Hydrological and Geomorphological Catastrophes in Italy (SICI): A Tool for Managing Landslide and Flood Hazards. Nat. Hazards Earth Syst. Sci. 2004, 4, 213–232. [Google Scholar] [CrossRef]
- Boschi, E.; Guidoboni, E.; Ferrari, G.; Valensise, G.; Gasperini, P. Catalogo dei Forti Terremoti in Italia dal 461 aC al 1990, Volume 2; ING-SGA: Bologna, Italy, 1997; p. 644. [Google Scholar]
- Nones, M. On the main components of landscape evolution modelling of river systems. Acta Geophys. 2020, 68, 459–475. [Google Scholar] [CrossRef]
- Newson, M.D.; Sear, D. The role of geomorphology in monitoring and managing river sediment systems. Water Environ. J. 1998, 11, 264–270. [Google Scholar] [CrossRef]
- Miklín, J.; Galia, T. Detailed fluvial-geomorphologic mapping of wadeable streams: A proposal of universal map symbology. J. Maps 2017, 13, 698–706. [Google Scholar] [CrossRef]
- Belletti, B.; Rinaldi, M.; Gurnell, A.M.; Buijse, A.D.; Mosselman, E. A review of assessment methods for river hydromorphology. Environ. Earth Sci. 2015, 73, 2079–2100. [Google Scholar] [CrossRef]
- Scorpio, V.; Santangelo, N.; Santo, A. Multiscale map analysis in alluvial fan flood prone areas. J. Maps 2016, 12, 382–393. [Google Scholar] [CrossRef]
- Dollar, E.S.J. Fluvial geomorphology. Prog. Phys. Geogr. 2002, 24, 385–406. [Google Scholar] [CrossRef]
- Bizzi, S.; Demarchi, L.; Grabowski, R.C.; Weissteiner, C.J.; Van de Bund, W. The use of remote sensing to characterise hydromorphological properties of European rivers. Aquat. Sci. 2016, 78, 57–70. [Google Scholar] [CrossRef]
- Scorpio, V.; Piégay, H. Is afforestation a driver of change in italian rivers within the Anthropocene era? Catena 2021, 198, 105031. [Google Scholar] [CrossRef]
- Lisle, T.E.; Nelson, J.M.; Pitlick, J.; Madej, M.A.; Barkett, B.L. Variability of bed mobility in natural, gravel-bed channels and adjustments to sediment load at local and reach scales. Water Resour. Res. 2000, 36, 3743–3755. [Google Scholar] [CrossRef]
- Picco, L.; Mao, L.; Rigon, E.; Moretto, J.; Ravazzolo, D.; Delai, F.; Lenzi, M.A. Medium term fluvial island evolution in relation with flood events in the Piave River. WIT Trans. Eng. Sci. 2012, 73, 161–172. [Google Scholar]
- Picco, L.; Mao, L.; Rainato, R.; Lenzi, M.A. Medium-termfluvial island evolution in a disturbed gravelbed river (Piave River, Northeastern Italian Alps). Geogr. Ann. A Phys. Geogr. 2014, 96, 83–97. [Google Scholar] [CrossRef]
- Picco, L.; Tonon, A.; Ravazzolo, D.; Rainato, R.; Lenzi, M.A. Monitoring river island dynamics using aerial photographs and lidar data: The tagliamento river study case. Appl. Geomat. 2015, 7, 163–170. [Google Scholar] [CrossRef]
- Turowski, J.M.; Yager, E.M.; Badoux, A.; Rickenmann, D.; Molnar, P. The impact of exceptional events on erosion, bedload transport and channel stability in a step-pool channel. Earth Surf. Process. Landf. 2009, 34, 1661–1673. [Google Scholar] [CrossRef]
- Turowski, J.M.; Rickenmann, D.; Dadson, S.J. The partitioning of the total sediment load of a river into suspended load and bedload: A review of empirical data. Sedimentology 2010, 57, 1126–1146. [Google Scholar] [CrossRef]
- Mao, L.; Cavalli, M.; Comiti, F.; Marchi, L.; Lenzi, M.A.; Arattano, M. Sediment transfer processes in two Alpine catchments of contrasting morphological settings. J. Hydrol. 2009, 364, 88–98. [Google Scholar] [CrossRef]
- Rainato, R.; Mao, L.; García-Rama, A.; Picco, L.; Cesca, M.; Vianello, A.; Preciso, E.; Scussel, G.R.; Lenzi, M.A. Three decades of monitoring in the Rio Cordon instrumented basin. Sediment budget and temporal trend of sediment yield. Geomorphology 2017, 291, 45–56. [Google Scholar] [CrossRef]
- Steger, S.; Scorpio, V.; Comiti, F.; Cavalli, M. Data-driven modelling of joint debris flow release susceptibility and connectivity. Earth Surf. Process. Landf. 2022, 1–25. [Google Scholar] [CrossRef]
- David, M.; Labenne, A.; Carozza, J.M.; Valette, P. Evolutionary trajectory of channel planforms in the middle Garonne River (Toulouse SW France) over a 130-year period: Contribution of mixed multiple factor analysis (MFAmix). Geomorphology 2016, 258, 21–39. [Google Scholar] [CrossRef]
- Gesch, B.; Muller, J.; Farr, T.G. The shuttle radar topography mission-Data validation and applications. Photogramm. Eng. Remote Sens. 2006, 72, 233–235. [Google Scholar]
- Ziliani, L.; Surian, N. Evolutionary trajectory of channelmorphology and controlling factors in a large gravel-bed river. Geomorphology 2012, 173–174, 104–117. [Google Scholar] [CrossRef]
- Pasuto, A.; Soldati, M. Geomorphological hazard. In Environmental Geomorphology, 1st ed.; Panizza, M., Ed.; Developments in Earth Surface Processes; Elsevier: Amsterdam, The Netherlands, 1996; Volume 4, pp. 35–196. [Google Scholar]
- Gutiérrez, F.; Soldati, M.; Audemard, F.; Bălteanu, D. Recent advances in landslide investigation: Issues and perspectives. Geomorphology 2010, 124, 95–101. [Google Scholar] [CrossRef]
- Carbonneau, P.E.; Piegay, H. Fluvial Remote Sensing for Science and Management; Wiley: Chichester, UK, 2012. [Google Scholar]
- Carbonneau, P.; Fonstad, M.A.; Marcus, W.A.; Dugdale, S.J. Making riverscapes real. Geomorphology 2012, 137, 74–86. [Google Scholar] [CrossRef]
- Javernick, L.; Brasington, J.; Caruso, B. Modeling the topography of shallow braided rivers using Structure-from-Motion photogrammetry. Geomorphology 2014, 213, 166–182. [Google Scholar] [CrossRef]
- Neal, J.; Schumann, G.; Bates, P.; Buytaert, W.; Matgen, P.; Pappenberger, F. A data assimilation approach to discharge estimation from space. Hydrol. Process. 2009, 3649, 3641–3649. [Google Scholar] [CrossRef]
- Frattini, P.; Crosta, G.B.; Allievi, J. Damage to buildings in large slope rock instabilities monitored with the PSInSAR™ technique. Remote Sens. 2013, 5, 4753–4773. [Google Scholar] [CrossRef]
- Nikolakopoulos, K.; Kavoura, K.; Depountis, N.; Kyriou, A.; Argyropoulos, N.; Koukouvelas, I.; Sabatakakis, N. Preliminary results from active landslide monitoring using multidisciplinary surveys. Eur. J. Remote. Sens. 2017, 50, 280–299. [Google Scholar] [CrossRef]
- Flener, C.; Vaaja, M.; Jaakkola, A.; Krooks, A.; Kaartinen, H.; Kukko, A.; Kasvi, E.; Huuppä, H.; Alho, P. Seamless mapping of river channels at high resolution using mobile liDAR and UAVphotography. Remote Sens. 2013, 5, 6382–6407. [Google Scholar] [CrossRef]
- Wheaton, J.M.; Brasington, J.; Darby, S.E.; Kasprak, A.; Sear, D.; Vericat, D. Morphodynamic signatures of braiding mechanisms as expressed through change in sediment storage in a gravel-bed river. J. Geophys. Res. Earth Surf. 2013, 118, 759–779. [Google Scholar] [CrossRef]
- Pirot, G.; Straubhaar, J.; Renard, P. Simulation of braided river elevation model time series with multiple-point statistics. Geomorphology 2014, 214, 148–156. [Google Scholar] [CrossRef]
- Eltner, A.; Kaiser, A.; Abellan, A.; Schindewolf, M. Time lapse structure-from-motion photogrammetry for continuous geomorphic monitoring. Earth Surf. Process. Landf. 2017, 42, 2240–2253. [Google Scholar] [CrossRef]
- Santise, M.; Thoeni, K.; Roncella, R.; Sloan, S.W.; Giacomini, A. Preliminary tests of a new low-cost photogrammetric system. Int. Arch. Photogramm. Remote Sens. Spat. Inf. Sci. 2017, 42, 229. [Google Scholar] [CrossRef]
- Corominas, J.; Moya, J.; Lloret, A.; Gili, J.A.; Angeli, M.G.; Pasuto, A.; Silvano, S. Measurement of landslide displacements using a wire extensometer. Eng. Geol. 2000, 55, 149–166. [Google Scholar] [CrossRef]
- Liu, L.; Yang, Y. Modeling and Precision Control of Systems with Hysteresis; Butterworth-Heinemann: Oxford, UK, 2016. [Google Scholar]
- Christenson, J. Sensors and Transducers. In Handbook of Biomechatronics; Segil, J., Ed.; Academic Press: Cambridge, MA, USA, 2019; pp. 61–93. [Google Scholar]
- Chaulya, S.K.; Prasad, G.M. Sensing and Monitoring Technologies for Mines and Hazardous Areas. Monitoring and Prediction Technologies, 1st ed.; Elsevier: Amsterdam, The Netherlands, 2016. [Google Scholar]
- Lissak, C.; Bartsch, A.; De Michele, M.; Gomez, C.; Maquaire, O.; Raucoules, D.; Roulland, T. Remote Sensing for Assessing Landslides and Associated Hazards. Surv. Geophys. 2020, 41, 1391–1435. [Google Scholar] [CrossRef]
- Bianchini, S.; Solari, L.; Bertolo, D.; Thuegaz, P.; Catani, F. Integration of Satellite Interferometric Data in Civil Protection. Strategies for Landslide Studies at a Regional Scale. Remote Sens. 2021, 13, 1881. [Google Scholar] [CrossRef]
- Hu, Q.; Zhou, Y.; Wang, S.; Wang, F. Machine learning and fractal theory models for landslide susceptibility mapping: Case study from the Jinsha River Basin. Geomorphology 2020, 351, 106975. [Google Scholar] [CrossRef]
- Pastor, J.L.; Tomás, R.; Lettieri, L.; Riquelme, A.; Cano, M.; Infante, D.; Ramondini, M.; Di Martire, D. Multi-Source Data Integration to Investigate a Deep-Seated Landslide Affecting a Bridge. Remote Sens. 2019, 11, 1878. [Google Scholar] [CrossRef]
- Lindersson, S.; Brandimarte, L.; Mård, J.; Di Baldassarre, G. A review of freely accessible global datasets for the study of floods, droughts and their interactions with human societies. WIREs Water 2020, 7, e1424. [Google Scholar] [CrossRef]
- United Nations Office for Disaster Risk Reduction. Global Assessment Report on Disaster Risk Reduction; United Nations Office for Disaster Risk Reduction: Geneva, Switzerland, 2019; eISBN 978-92-1-004180-5. [Google Scholar]
- Nemani, R.; Votava, P.; Michaelis, A.; Melton, F.; Milesi, C. Collaborative Super-computing for Global Change Science. Eos 2011, 92, 109–110. [Google Scholar] [CrossRef]
- Gorelick, N.; Hancher, M.; Dixon, M.; Ilyushchenko, S.; Thau, D.; Moore, R. Google Earth Engine: Planetary-scale geospatial analysis for everyone. Remote Sens. Environ. 2017, 202, 18–27. [Google Scholar] [CrossRef]
- Zhu, Z.; Wulder, M.A.; Roy, D.P.; Woodcock, C.E.; Hansen, M.C.; Radeloff, V.C.; Healey, S.P.; Schaaf, C.; Hostert, P.; Strobl, P.; et al. Benefits of the free and open Landsat data policy. Remote Sens. Environ. 2019, 224, 382–385. [Google Scholar] [CrossRef]
- Józsa, E.; Lóczy, D.; Soldati, M.; Drăguţ, L.D.; Szabó, J. Distribution of landslides reconstructed from inventory data and estimation of landslide susceptibility in Hungary. Hung. Geogr. Bull. 2019, 68, 255–267. [Google Scholar] [CrossRef]
- Guzzetti, F. Landslide hazard and risk assessment. Doctoral Dissertation, Rheinische Friedrich-Wilhelms-Universität, Bonn, Germany, 3 July 2006. [Google Scholar]
- Guzzetti, F.; Cardinali, M.; Reichenbach, P. The AVI Project: A bibliographical and archive inventory of landslides and floods in Italy. Environ. Manag. 1994, 18, 623–633. [Google Scholar] [CrossRef]
- Ibsen, M.L.; Brunsden, D. The nature, use and problems of historical archives for the temporal occurrence of landslides, with specific reference to the south coast of Britain, Ventnor, Isle of Wight. Geomorphology 1996, 15, 241–258. [Google Scholar] [CrossRef]
- Cruden, D.M. Estimating the risk from landslide historical data. In Landslide Risk Assessment; Cruden, D.M., Fell, R., Eds.; A.A. Balkema Publisher: Rotterdam, The Netherlands, 1997; pp. 177–184. [Google Scholar]
- Glade, T. Establishing the frequency and magnitude of landslide-triggering rainstorm events in New Zealand. Environ. Geol. 1998, 35, 160–174. [Google Scholar] [CrossRef]
- Glade, T. Landslide hazard assessment and historical landslide data—An inseparable couple? In The Use of Historical Data in Natural Hazard Assessments; Glade, T., Frances, F., Albini, P., Eds.; Kluwer Academic Publishers: Dordrecht, The Netherlands, 2001; Volume 7, pp. 153–168. [Google Scholar]
- Rib, H.T.; Liang, T. Recognition and identification. In Landslide Analysis and Control; Schuster, R.L., Krizek, R.J., Eds.; Transportation Research Board Special Report 176; National Academy of Sciences: Washington, DC, USA, 1978; pp. 34–80. [Google Scholar]
- Hansen, A. Landslide hazard analysis. In Slope Instability; Brunsden, D., Prior, D.B., Eds.; Wiley & Sons: New York, NY, USA, 1984; pp. 523–602. [Google Scholar]
- Fookes, P.G.; Dale, S.G.; Land, J.M. Some observations on a comparative aerial photography interpretation of a landslipped area. Q. J. Eng. Geol. Hydrogeol. 1991, 24, 249–265. [Google Scholar] [CrossRef]
- Ardizzone, F.; Cardinali, M.; Carrara, A.; Guzzetti, F.; Reichenbach, P. Uncertainty and errors in landslide mapping and landslide hazard assessment. Nat. Hazards Earth Syst. Sci. 2002, 2, 3–14. [Google Scholar] [CrossRef]
- Moreira, A.; Prats-Iraola, P.; Younis, M.; Krieger, G.; Hajnsek, I.; Papathanassiou, K.P. A tutorial on synthetic aperture radar. IEEE Trans. Geosci. Remote Sens. 2013, 1, 6–43. [Google Scholar] [CrossRef]
- Mancini, F.; Grassi, F.; Cenni, N. A workflow based on SNAP–StaMPS open-source tools and GNSS data for PSI-Based ground deformation using dual-orbit sentinel-1 data: Accuracy assessment with error propagation analysis. Remote Sens. 2021, 13, 753. [Google Scholar] [CrossRef]
- Ferretti, A.; Prati, C.; Rocca, F. Permanent scatterers in SAR interferometry. IEEE Trans. Geosci. Remote Sens. 2001, 39, 8–20. [Google Scholar] [CrossRef]
- Hooper, A.; Zebker, H.; Segall, P.; Kampes, B. A new method for measuring deformation on volcanoes and other natural terrains using InSAR persistent scatterers. Geophys. Res. Lett. 2004, 31, 1–5. [Google Scholar] [CrossRef]
- Massonnet, D.; Feigl, K.L. Radar interferometry and its application to changes in the Earth’s surface. Rev. Geophys. 1998, 36, 441–500. [Google Scholar] [CrossRef]
- Bürgmann, R.; Rosen, P.A.; Fielding, E.J. Synthetic aperture radar interferometry to measure Earth’s surface topography and its deformation. Annu Rev Earth Planet Sci. 2000, 28, 169–209. [Google Scholar] [CrossRef]
- Piacentini, D.; Devoto, S.; Mantovani, M.; Pasuto, A.; Prampolini, M.; Soldati, M. Landslide susceptibility modeling assisted by Persistent Scatterers Interferometry (PSI): An example from the northwestern coast of Malta. Nat. Hazards 2015, 78, 681–697. [Google Scholar] [CrossRef]
- Wasowski, J.; Bovenga, F. Investigating landslides and unstable slopes with satellite Multi Temporal Interferometry: Current issues and future perspectives. Eng. Geol. 2014, 174, 103–138. [Google Scholar] [CrossRef]
- Solari, L.; Del Soldato, M.; Raspini, F.; Barra, A.; Bianchini, S.; Confuorto, P.; Casagli, N.; Crosetto, M. Review of satellite interferometry for landslide detection in Italy. Remote Sens. 2020, 12, 1351. [Google Scholar] [CrossRef]
- Colesanti, C.; Wasowski, J. Investigating landslides with space-borne Synthetic Aperture Radar (SAR) interferometry. Eng. Geol. 2006, 88, 173–199. [Google Scholar] [CrossRef]
- Carlà, T.; Tofani, V.; Lombardi, L.; Raspini, F.; Bianchini, S.; Bertolo, D.; Thuegaz, P.; Casagli, N. Combination of GNSS, satellite InSAR, and GBInSAR remote sensing monitoring to improve the understanding of a large landslide in high alpine environment. Geomorphology 2019, 335, 62–75. [Google Scholar] [CrossRef]
- Kyriou, A.; Nikolakopoulos, K.; Koukouvelas, I.; Lampropoulou, P. Repeated UAV campaigns, GNSS measurements, GIS, and petrographic analyses for landslide mapping and monitoring. Minerals 2021, 11, 300. [Google Scholar] [CrossRef]
- Gili, J.A.; Corominas, J.; Rius, J. Using Global Positioning System techniques in landslide monitoring. Eng. Geol. 2000, 55, 167–192. [Google Scholar] [CrossRef]
- Hastaoglu, K.O.; Sanli, D.U. Accuracy of Gps Rapid Static Positioning: Application to Koyulhisar Landslide, Central Turkey. Surv. Rev. 2011, 43, 226–240. [Google Scholar] [CrossRef]
- Zeybek, M.; Şanlıoğlu, İ.; Genç, A. Landslide Monitoring with GNSS measurements and prediction with Linear regression Model: A case study Taşkent (Konya, Turkey) Landslide. In Proceedings of the Digital Proceeding Of The ISDS’2014, Side, Turkey, 10–14 May 2014. [Google Scholar]
- Mantovani, M.; Bossi, G.; Dykes, A.P.; Pasuto, A.; Soldati, M.; Devoto, S. Coupling long-term GNSS monitoring and numerical modelling of lateral spreading for hazard assessment purposes. Eng. Geol. 2022, 296, 106466. [Google Scholar] [CrossRef]
- Eyo, E.E.; Musa, T.A.; Omar, K.M.; Idris, K.M.; Bayrak, T.; Onuigbo, I.C.; Opaluwa, Y.D. Application of Low-Cost GPS Tools and Techniques for Landslide Monitoring: A Review. J. Teknol. 2014, 71, 71–78. [Google Scholar] [CrossRef][Green Version]
- Castagnetti, C.; Bertacchini, E.; Corsini, A.; Rivola, R. A reliable methodology for monitoring unstable slopes: The multi-platform and multi-sensor approach. In Proceedings of the SPIE, Earth Resources and Environmental Remote Sensing/GIS Applications V, Amsterdam, The Netherlands, 23–25 September 2014. [Google Scholar]
- Lane, S.N.; James, T.D.; Crowell, M.D. Application of digital photogrammetry to complex topography for geomorphological research. Photogramm. Rec. 2000, 16, 793–821. [Google Scholar] [CrossRef]
- Chao, H.; Cao, Y.; Chen, Y. Autopilots for small unmanned aerial vehicles: A survey. Int. J. Control Autom. Syst. 2010, 8, 36–44. [Google Scholar] [CrossRef]
- Westoby, M.J.; Brasington, J.; Glasser, N.F.; Hambrey, M.J.; Reynolds, J.M. “Structure-from-Motion” photogrammetry: A low-cost, effective tool for geoscience applications. Geomorphology 2012, 179, 300–314. [Google Scholar] [CrossRef]
- Chudý, F.; Slámová, M.; Tomaštík, J.; Prokešová, R.; Mokroš, M. Identification of micro-scale landforms of landslides using precise digital elevation models. Geosciences 2019, 9, 117. [Google Scholar] [CrossRef]
- Cignetti, M.; Godone, D.; Wrzesniak, A.; Giordan, D. Structure from Motion Multisource Application for Landslide Characterization and Monitoring: The Champlas du Col Case Study, Sestriere, North-Western Italy. Sensors 2019, 19, 2364. [Google Scholar] [CrossRef]
- Devoto, S.; Macovaz, V.; Mantovani, M.; Soldati, M.; Furlani, S. Advantages of Using UAV Digital Photogrammetry in the Study of Slow-Moving Coastal Landslides. Remote Sens. 2020, 12, 3566. [Google Scholar] [CrossRef]
- Godone, D.; Allasia, P.; Borrelli, L.; Gullà, G. UAV and Structure from Motion Approach to Monitor the Maierato Landslide Evolution. Remote Sens. 2020, 12, 1039. [Google Scholar] [CrossRef]
- James, M.R.; Robson, S. Mitigating systematic error in topographic models derived from UAV and ground-based image networks. Earth Surf. Process. Landf. 2014, 39, 1413–1420. [Google Scholar] [CrossRef]
- Sieberth, T.; Wackrow, R.; Chandler, J.H. Motion blur disturbs—The influence of motion-blurred images in photogrammetry. Photogramm. Rec. 2014, 29, 434–453. [Google Scholar] [CrossRef]
- Eltner, A.; Schneider, D. Analysis of different methods for 3D reconstruction of natural surfaces from parallel-axes UAV images. Photogramm. Rec. 2015, 30, 279–299. [Google Scholar] [CrossRef]
- Harwin, S.; Lucieer, A.; Osborn, J. The impact of the calibration method on the accuracy of point clouds derived using unmanned aerial vehicle multi-view stereopsis. Remote Sens. 2015, 7, 11933–11953. [Google Scholar] [CrossRef]
- Peppa, M.V.; Mills, J.P.; Moore, P.; Miller, P.E.; Chambers, J.E. Accuracy assessment of a UAV-based landslide monitoring system. Int. Arch. Photogramm. Remote Sens. Spat. Inf. Sci. 2016, 41, 895–902. [Google Scholar] [CrossRef]
- James, M.R.; Robson, S.; d’Oleire-Oltmanns, S.; Niethammer, U. Optimising UAV topographic surveys processed with structure-from-motion: Ground control quality, quantity and bundle adjustment. Geomorphology 2017, 280, 51–66. [Google Scholar] [CrossRef]
- Casella, V.; Chiabrando, F.; Franzini, M.; Manzino, A.M. Accuracy assessment of a UAV block by different software packages, processing schemes and validation strategies. ISPRS Int. J. Geoinf. 2020, 9, 164. [Google Scholar] [CrossRef]
- Rangel, J.M.G.; Gonçalves, G.R.; Pérez, J.A. The impact of number and spatial distribution of GCPs on the positional accuracy of geospatial products derived from low-cost UASs. Int. J. Remote Sens. 2018, 39, 7154–7171. [Google Scholar] [CrossRef]
- Miura, N.; Yokota, S.; Koyanagi, T.F.; Yamada, S. Herbaceous Vegetation Height Map on Riverdike Derived from UAV LiDAR Data. In Proceedings of the IGARSS 2018–2018 IEEE International Geoscience and Remote Sensing Symposium, Valencia, Spain, 22–27 July 2018. [Google Scholar]
- Pu, S.; Xie, L.; Ji, M.; Zhao, Y.; Liu, W.; Wang, L.; Zhao, Y.; Yang, F.; Qiu, D. Real-time powerline corridor inspection by edge computing of UAV Lidar data. Int. Arch. Photogramm. Remote Sens. Spat. Inf. Sci. 2019, 4213, 547–551. [Google Scholar] [CrossRef]
- Lin, Y.C.; Cheng, Y.T.; Zhou, T.; Ravi, R.; Hasheminasab, S.M.; Flatt, J.E.; Troy, C.; Habib, A. Evaluation of UAV LiDAR for mapping coastal environments. Remote Sens. 2019, 11, 2893. [Google Scholar] [CrossRef]
- Shaw, L.; Helmholz, P.; Belton, D.; Addy, N. Comparison of UAV Lidar and imagery for beach monitoring. Int. Arch. Photogramm. Remote Sens. Spat. Inf. Sci. 2019, 42, 589–596. [Google Scholar] [CrossRef]
- Pirotti, F.; Guarnieri, A.; Vettore, A. State of the art of ground and aerial laser scanning technologies for high-resolution topography of the earth surface. Eur. J. Remote Sens. 2013, 46, 66–78. [Google Scholar] [CrossRef]
- Stumvoll, M.J.; Schmaltz, E.M.; Glade, T. Dynamic characterization of a slow-moving landslide system—Assessing the challenges of small process scales utilizing multi-temporal TLS data. Geomorphology 2021, 389, 107803. [Google Scholar] [CrossRef]
- Barbarella, M.; Fiani, M.; Lugli, A. Landslide monitoring using multitemporal terrestrial laser scanning for ground displacement analysis. Geomat. Nat. Hazards Risk. 2015, 6, 398–418. [Google Scholar] [CrossRef]
- Corsini, A.; Castagnetti, C.; Bertacchini, E.; Rivola, R.; Ronchetti, F.; Capra, A. Integrating airborne and multi-temporal long-range terrestrial laser scanning with total station measurements for mapping and monitoring a compound slow moving rock slide. Earth Surf. Process. Landf. 2013, 38, 1330–1338. [Google Scholar] [CrossRef]
- Kromer, R.A.; Abellán, A.; Hutchinson, D.J.; Lato, M.; Chanut, M.A.; Dubois, L.; Jaboyedoff, M. Automated terrestrial laser scanning with near-real-time change detection–monitoring of the Séchilienne landslide. Earth Surf. Dyn. 2017, 5, 293–310. [Google Scholar] [CrossRef]
- Sgrenzaroli, M.; Vassena, G.P.M. Tecniche di Rilevamento Tridimensionale Tramite Laser Scanner; Starrylink Editrice: Brescia, Italy, 2007. [Google Scholar]
- Blanch, X.; Eltner, A.; Guinau, M.; Abellan, A. Multi-Epoch and Multi-Imagery (MEMI) Photogrammetric Workflow for Enhanced Change Detection Using Time-Lapse Cameras. Remote Sens. 2021, 13, 1460. [Google Scholar] [CrossRef]
- Micheletti, N.; Chandler, J.H.; Lane, S.N. Investigating the geomorphological potential of freely available and accessible structure from-motion photogrammetry using a smartphone. Earth Surf. Process. Landf. 2015, 40, 473–486. [Google Scholar] [CrossRef]
- Kromer, R.; Walton, G.; Gray, B.; Lato, M.; Group, R. Development and optimization of an automated fixed-location time lapse photogrammetric rock slope monitoring system. Remote Sens. 2019, 11, 1890. [Google Scholar] [CrossRef]
- Castagnetti, C.; Bertacchini, E.; Corsini, A.; Capra, A. Multi-sensors integrated system for landslide monitoring: Critical issues in system setup and data management. Eur. J. Remote Sens. 2013, 46, 104–124. [Google Scholar] [CrossRef]
- Machan, G.; Bennett, V.G. Use of Inclinometers for Geotechnical Instrumentation on Transportation Projects. State of the Practice; Transportation Research Circular, Number E-C129, October 2008; Transportation Research Board of the National Academies: Washington, DC, USA, 2008; ISSN 0097-8515. [Google Scholar]
- Durham Geo Slope Indicator. Guide to Geotechnical Instrumentation; 12123 Harbour Reach Drive Mukilteo: Washington, DC, USA, 2004; p. 98275. [Google Scholar]
- Pellicani, R.; Argentiero, I.; Manzari, P.; Spilotro, G.; Marzo, C.; Ermini, R.; Apollonio, C. UAV and airborne LiDAR data for interpreting kinematic evolution of landslide movements: The case study of the Montescaglioso landslide (Southern Italy). Geosciences 2019, 9, 248. [Google Scholar] [CrossRef]
- Helmstetter, A.; Garambois, S. Seismic monitoring of Séchilienne rockslide (French Alps): Analysis of seismic signals and their correlation with rainfalls. J. Geophys. Res. Earth Surf. 2010, 115, F03016. [Google Scholar] [CrossRef]
- Kalia, A.C. Classification of Landslide Activity on a Regional Scale Using Persistent Scatterer Interferometry at the Moselle Valley (Germany). Remote Sens. 2018, 10, 1880. [Google Scholar] [CrossRef]
Publisher’s Note: MDPI stays neutral with regard to jurisdictional claims in published maps and institutional affiliations. |
© 2022 by the authors. Licensee MDPI, Basel, Switzerland. This article is an open access article distributed under the terms and conditions of the Creative Commons Attribution (CC BY) license (https://creativecommons.org/licenses/by/4.0/).