Abstract
Mélanges are heterogeneous geological deposits and represent the most widespread bimrock (block-in-matrix) formations. This paper presents the efforts undertaken to characterise an Italian mélange composed of a clayey-marly matrix enclosing strong calcareous blocks. Due to its low uniaxial compressive strength, this geomaterial can be classified as a soft rock. The weak nature of the marly matrix and its water sensitivity, as well as the presence of rock inclusions, made the collection and preparation of intact specimens extremely complex and time-consuming operations. The difficulties encountered during these phases are described in detail; the various non-conventional procedures considered and developed to overcome these problems are also presented. The potential of the solutions proposed lies in the fact that they can be conveniently applied to other soft rocks with a block-in-matrix internal arrangement, such as the Italian mélange. To characterise the Italian mélange, point load and uniaxial compressive tests were carried out. From the results of these tests, a conversion factor equal to 14 is proposed to correct the point load strength index in order to estimate the uniaxial compressive strength of soft rocks, such as the mélange under study. Moreover, to estimate local strains and the deformability of the geomaterial, the non-destructive digital image correlation technique was applied.
1. Introduction
Mélanges (a French word meaning “mixtures”) are chaotic, heterogeneous geological formations composed of rock blocks embedded in a pervasively deformed fine grained matrix [1,2,3,4,5]. These geological units belong to structurally complex formations and are the most widespread bimrocks (block-in-matrix rocks) [3,6,7,8,9]. This term, which has no geological connotation, was coined by Medley (1994) to indicate “mixtures of rocks, composed of geotechnically significant blocks within a bonded matrix of finer texture”.
Due to the erratic variability of the mechanical properties of mélanges, considerable difficulties may arise in their sampling, testing and characterisation [10,11,12,13,14,15,16]. Moreover, the design and execution of geotechnical works in/on these geomaterials, such as tunnel excavations or landslide repairs, have proven to be extremely challenging [1,10,11,17,18,19,20,21].
Mélanges are often composed of a clayey-marly matrix. In this case, they usually present a low uniaxial compressive strength (UCS). For this reason, they also belong to the category of soft (or weak) rocks, which are characterised by UCS values that typically fall between 0.5 MPa and 25 MPa [22,23,24,25,26]. Typical soft rocks include mudrocks, marls, ignimbrites, conglomerates, and poorly cemented sandstones [27], shales, greywackes or sedimentary rocks [28,29], flysches [30,31], kakirites [32], chalks [25] and breccias [13,17,33,34].
Soft rocks are extremely problematic geomaterials, since they exhibit very poor mechanical properties and they degrade very quickly when submerged in water [22,35]. As a consequence, undisturbed sampling and laboratory specimen preparation are very challenging, as well as time-consuming and expensive, operations [26,31,34,36,37,38,39,40,41]. This implies that it is rarely possible to obtain high-quality specimens for laboratory tests for the determination of their strength. Hence, less rigorous approaches are necessary for their characterisation. Among these, point load (PL) tests and qualitative descriptions of the strength of intact rocks (Table 1) are the most common.

Table 1.
Field estimates of uniaxial compressive strength of intact rocks (After [30], modified from [42]).
Moreover, since soft rocks constitute transition materials between (hard) rocks and (stiff) soils, they are often too soft to be tested in rock mechanics apparatus and too hard for soil mechanics equipment [13,28,43]. Furthermore, they present numerous undesirable characteristics, such as low strength, disaggregation, presence of rock inclusions, capillarity suction, crumbling, high plasticity, slaking, and fast weathering [8,13,23,25,27,28,31,44,45,46]. These issues are responsible for a lack of knowledge about their mechanical behaviour, which often leads to the adoption of very conservative parameters to the detriment of cost effectiveness.
Many authors have worked on these complex geomaterials in order to:
- study how the presence of water affects their behaviour (degradation or weathering behaviour) [25,27,31,43,44,46,47]. In fact, water induces a very rapid decrease in stiffness and strength in most weak rocks;
- correlate the history of the geological processes of soft rocks to their mechanical behaviour, since different forming and alteration processes result in specific properties that inevitably influence the overall behaviour of these geomaterials [26,28];
- evaluate and correlate the uniaxial compressive strength to other test results, i.e., the Point Load Strength Index, the Block Punch Index, and the needle penetration test results [15,25,37,39,41,48,49,50].
In this paper, a widespread heterogeneous Italian mélange was chosen and studied in detail to explore and address the challenges of working with a soft rock composed of a marly matrix enclosing small quantities of calcareous rock blocks. Specifically, non-conventional operative and laboratory procedures were developed and used to tackle most of the technical difficulties encountered in the preparation of regular specimens for laboratory tests. The potential of these procedures is that they can also be applied to other soft rocks that present the same problems. Moreover, the mechanical behaviour under compression of the marly matrix of this complex formation was investigated by performing PL tests and uniaxial compressive tests. In this regard, in order to reliably predict the UCS of soft rocks, such as the Italian mélange, from PL tests, an appropriate value of the conversion factor, C (to apply to the point load strength index, IS(50)), was proposed.
Finally, because of the weakness of the geomaterial and the dusty, irregular, and heterogeneous surfaces of the specimens, neither strain gauges nor direct contact extensometers could be used during the UC tests to measure local strains. Hence, the non-destructive digital image correlation (DIC) technique was applied to evaluate the deformability of the specimens tested. The DIC technique compares a series of digital images, for example, of the surface of a loaded specimen, and measures the displacements by matching the same pixels in consecutive photographs, before and after deformation. This technique, used in many research fields, has been widely and successfully employed in rock mechanics [51,52,53].
2. The Italian Sedimentary Mélange
The Materials and Methods should be described.
The Italian sedimentary mélange studied in this paper is located in the Oltrepò Pavese area and presents a chaotic block-in-matrix fabric (Figure 1a). This internal structural arrangement results from the stacking of different Late Oligocene—Early Miocene cohesive submarine debris flows [15,54]. Each debris flow ranges from meters to tens of metres in thickness. As shown in Figure 1b, each stratigraphic layer is composed of rock inclusions characterised by an inverse grading of the largest blocks above a basal shear zone a few centimetres thick. The blocks are mainly limestones of irregular shape embedded in a foliated and water sensitive clayey-marly matrix [54].
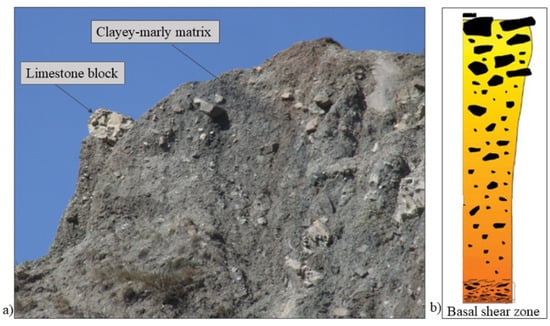
Figure 1.
(a) The chaotic Italian mélange under study; (b) conceptual stratigraphic column of a single mélange layer, modified after [54].
2.1. Collection of Intact Samples
The composition of the matrix posed severe difficulties during the on-site sampling. In fact, the water sensitivity of the matrix did not allow the extraction of undisturbed samples with the classic coring techniques, since the use of perforation fluids would have irreversibly damaged the material. Moreover, the dry drilling technique did not provide good results, as the material jammed into the drill bit; it was not possible to extract the core without damaging it. For these reasons, only a manual coring could be performed.
In order to obtain mélange samples that are as intact and undisturbed as possible, the superficial weathered material (about 0.4 m thick) was removed before collecting the samples by means of hammers, picks and chisels. Moreover, the material was extracted at depths (rather close to the basal shear zone) at which sufficiently small rock blocks could be found, so as to be able to perform laboratory tests with standard equipment.
Although a great number of lumps were split during the sampling due to the weak nature of the marl, a sufficient number of irregular lumps, with dimensions of approximately 25 × 30 × 30 cm, were collected (an example is given in Figure 2).
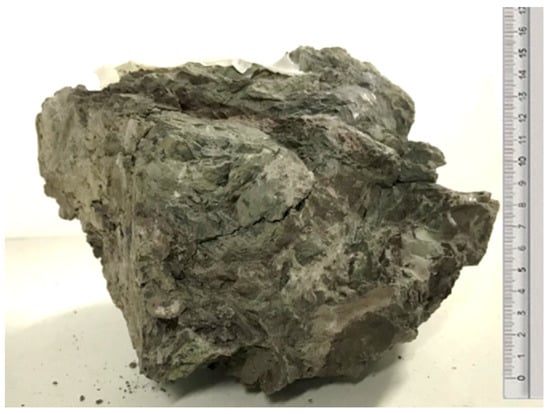
Figure 2.
A typical irregular mélange lump extracted manually.
The samples were carefully wrapped and transported to the geotechnical laboratory operating in the Department of Structural, Geotechnical and Building Engineering (DISEG) of Politecnico di Torino for the preparation of specimens for laboratory testing.
2.2. Preparation of Specimens for Laboratory Tests
The presence of the clay in the mélange matrix made it extremely challenging to obtain good-quality specimens, since no standard techniques requiring cooling fluids, such as core drillings, oil circular saws or water circular saws, could be used without irreversibly damaging the material. Therefore, alternative techniques, such as laser-cutting and waterjet, were evaluated. However, the former technique could not be applied, since all the specimens were higher than 2–3 cm, which was the maximum thickness that the laser could have cut. The waterjet technique also failed because the trial sample was badly damaged by the water, although it had been expected that a jet of water of thousands of bars of pressure emitted from an orifice a few microns wide would have allowed for a good cut to be executed.
Hence, it was necessary to resort to a dry cutting technique, by constructing a diamond band saw with a sufficient cutting height and weight to avoid vibrations during the cutting operations [15]. Specifically, the Fervi 0764/455 wood band saw was modified by replacing the supplied blade with a diamond blade customized by the Italian Turri Technologies S.r.l. (Figure 3a,b). This blade was built for reducing vibrations and cutting the stronger rock inclusions without deforming the softer matrix.
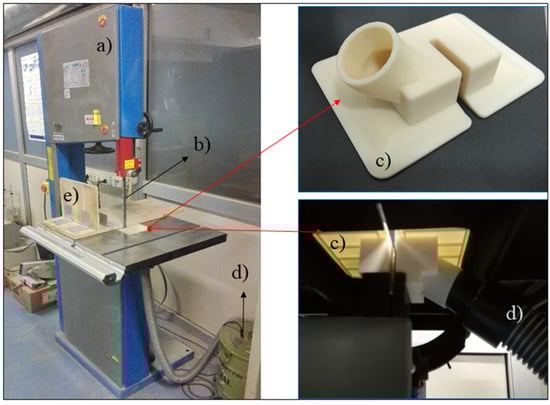
Figure 3.
Diamond band saw—(a) the FERVI 0764/455 wood band saw; (b) new diamond blade; (c) plastic element for dust containment assembled on the worktable of the Fervi saw and connected to a vacuum cleaner hose; (d) vacuum cleaner; € boards.
In order to contain the dust produced during the cutting, a plastic element to be connected to a vacuum cleaner was also designed and printed at DISEG (Figure 3c,d).
To work in safe conditions, two specially made boards were constructed and used to push the irregular lumps manually towards the rotating band saw (Figure 3e). Moreover, to make the samples more stable, they were incorporated in the grout, taking care to protect them from the water (contained in the fresh grout) by putting them into plastic bags.
With the use of these devices, the cutting was able to be carried out safely and more easily. However, it was an extremely time-consuming operation and far from being simple and flawless. In fact, the weak nature of the marly matrix and the presence of bedding planes and innate micro and macro fractures often caused the formation of cracks and, in any case, required a great number of cuts before a regular specimen could be obtained. Moreover, rock inclusions were frequently found at (or very close to) the edges of the specimens. In these cases, block detachments often occurred which produced holes. Consequently, too small, irregular and useless specimens were often obtained, as shown in Figure 4.
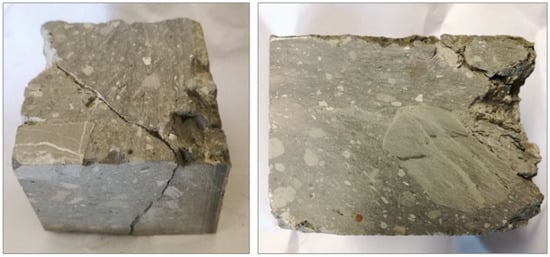
Figure 4.
Mélange samples damaged during the cutting phase.
Due to such difficulties, some defects were in any case accepted in the specimens used for laboratory tests.
A total of 45 specimens were obtained by sawing the samples retrieved on site. According to their dimensions, 37 of them were used for PL tests, while the remaining 8 were tested under uniaxial compression conditions. In fact, due to the difficulties encountered during the cutting phase, only a very limited number of specimens with an adequate geometry for unconfined compression tests could be successfully prepared. The specimens were cut following the ISRM (2007) recommendations as much as possible and trying to keep the natural discontinuities of the material as perpendicular as possible to the direction of application of the load.
As clearly visible in Figure 4, almost all the specimens contained small quantities of rock inclusions. The number of blocks contained in a sample can be quantified by computing its volumetric block proportion (VBP), which is the ratio between the volume of the rock blocks inside the specimen and the total specimen volume. This parameter was evaluated on all the specimens used for the unconfined compression tests. Specifically, after the tests, each specimen was dissolved in water and the rock inclusions were collected by sieving. Since the VBPs of all the specimens were extremely low (see Table 3), according to previous findings from the literature [2,3,7], it was assumed that the mechanical behaviour of the mélange was not affected by the presence of the rock inclusions.
3. Laboratory Tests
3.1. Point Load Tests
When dealing with soft rocks, the PL test is often the only possibility for evaluating their uniaxial compressive strength (UCS). In fact, many technical problems arise when preparing regular prismatic or cylindrical specimens to be tested in uniaxial compression [25]. On the contrary, PL tests can be easily conducted even on shapeless lumps and cut blocks [48,55,56,57,58].
The test is performed with the aim of determining the point load strength index, IS(50), of the rock specimens. The relationship between the IS(50) and UCS is expressed by a conversion factor, C. The value of this coefficient is generally set as equal to 24 for hard rocks. However, for soft rocks (i.e., argillaceous rocks, siltstones, flysches, etc.), it could be much lower than this value. Previous findings from the literature [25,30,41,45,48,58,59] have indeed shown that C varied from 5 up to 24 for chalks, from about 7 to 21 for sandstones and from 13 to 15 for argillaceous rocks. Hence, a conversion factor equal to 14 was considered reliable and used for the mélange under study.
PL Test Results
The PL tests were performed on 37 specimens according to the ASTM recommendations [56] using the apparatus of the geotechnical laboratory operating in the DISEG of Politecnico di Torino (Figure 5a). After each test, the failure surface of the specimen was inspected to verify the validity of the test (Figure 5c).
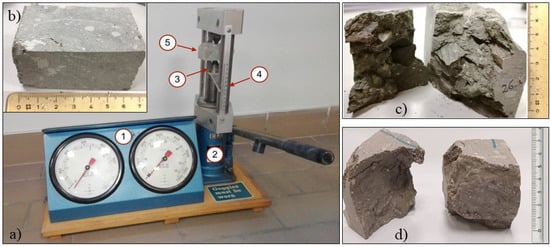
Figure 5.
(a) DISEG point load test apparatus: gauges for reading the applied load (1), jack (2), steel tips for applying the load (3), ruler for measuring the distance between the tips (4), specimen (5); (b) a mélange specimen; (c) mélange specimen n. 11 successfully tested and showing a highly irregular failure surface; (d) mélange specimen n. 22 split along a plane of weakness.
The results obtained for the mélange under study are shown in Table 2.
Table 2.
PL test results. “Inv.” stands for invalid test while “min” and “Max” refer to the minimum and maximum obtained UCS, respectively, which were discarded according to the ASTM Standards. A conversion factor equal to 14 was used to compute the UCS values.
Two specimens yielded invalid tests and twelve specimens provided no significant result (null IS50 values). This outcome and the dispersion in the test results were mainly ascribed to the presence of bedding planes within the material and to their variable orientation, which was not always perpendicular to the direction of application of the load. In fact, some irregular samples possessed undulated, variably oriented and/or not clearly visible bedding planes, which could not be identified before the tests were carried out. (e.g., see Figure 2 and Figure 5d). Therefore, the variability of the results obtained, which requires a great number of tests to be carried out, is a peculiarity of this type of geomaterial and is ascribed to its heterogeneous composition and foliated (so, anisotropic) matrix.
The minimum and maximum strengths were 0.77 MPa and 5.24 MPa, respectively, while the average UCS obtained was 2.1 MPa, with a standard deviation as equal to 1.12.
3.2. Unconfined Compression Tests
The UCS of the mélange under study was also estimated by means of uniaxial compression tests performed at the geotechnical laboratory operating in the DISEG of Politecnico di Torino. These tests were also carried out with the aim of estimating the deformability of the material and validating the value of the conversion factor, C, used to process the point load test results.
Due to the difficulties encountered during the preparation of the specimens, only 8 specimens with a sufficiently regular geometry could be obtained from the shapeless samples and tested. The specimens were expected to have null or very low block contents, which were assumed to not have affected the UC test results. In fact, previous findings from the literature [2,3,7] demonstrated (experimentally and numerically) that no strength increase is registered in heterogeneous materials with VBPs lower than 20%–25%. The assumption of very low block contents was later confirmed from sieve analyses, which were carried out after each test.
The tests were performed under axial displacement control at a constant rate of 0.005 mm/min. During the tests, a data acquisition system recorded the values of time, axial displacement of the piston (acquired by an LVDT transducer) and axial load (acquired by a load cell), with a sampling rate of 100 Hz. Moreover, in order to estimate local strains and the deformability of the mélange by means of the DIC technique, a Canon EOS 550D digital camera was placed on a tripod in front of one specimen surface to take photos every 5 s. This time interval was considered sufficiently large to allow the photos to be stored but, at the same time, small enough to capture the displacements during each test.
Unconfined Compression Test Results
Since the samples were cut with the diamond band saw, a few indications of the ISRM Standards (2007) could not be met. First, it was not possible to obtain cylindrical specimens. Moreover, the final geometry of the prismatic specimens was never completely free of irregularities since the specimen ends were often far from being smooth and perpendicular to its axis (Figure 6).
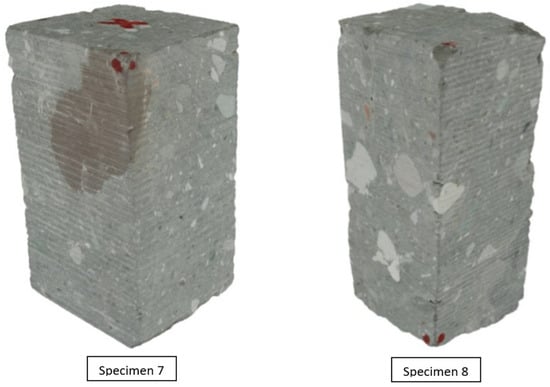
Figure 6.
Non-standard mélange specimens n. 7 and 8.
In addition, the height to diameter (i.e., width) ratio of 2.5 suggested by the ISRM Standards (2007) could never be obtained. Specifically, the specimens tested had a variable H/D ratio, ranging from 1.38 to 2.10, as indicated in Table 3.
Table 3.
Values of VBP, H/D, UCS and elastic modulus in terms of global strains (Eglob) and local strains (EaverageDIC), of the specimens tested.
The use of non-standard specimens may seem to be a potentially significant limitation of this study. However, according to previous findings from the literature [42,60,61,62], it can be assessed that the prismatic shape and the rather low slenderness ratios (average H/D = 1.7) of the mélange specimens tested produced modest effects on the UCS values obtained. In fact, the work of Xu and Cai (2017) demonstrated that the peak strength of rocks tested in uniaxial compression was very slightly affected by the cross-sectional shape (circular, square or rectangular) of the specimens. Moreover, laboratory tests [42,61,63] and numerical analyses [60,62] carried out on specimens with different slenderness ratios revealed that the non-homogeneous strain field induced in the specimens by the friction of the end plates caused an overestimation of the uniaxial stresses for H/D ratios generally lower than 2.5. However, the strength increased with decreasing H/D ratios from 2.5 to 1.7 was found to be moderate in most cases.
Therefore, according to the outcomes of these investigations, the average UCS obtained in this research can be considered only slightly overestimated and, in any case, quite representative of the real strength of the geomaterial.
4. Results
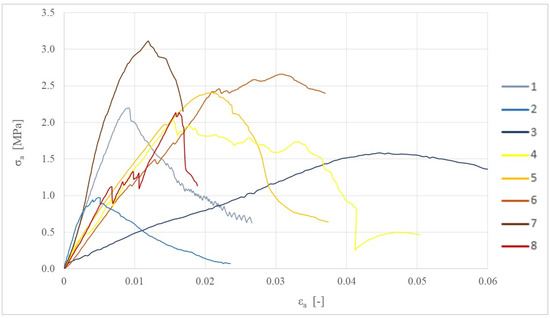
Figure 7.
Stress–strain curves in terms of global strains of the specimens.
From Figure 7, it is possible to observe a significant variability in the mechanical behaviour of the 8 mélange specimens tested, in terms of stiffness, peak and post-peak strength and strain at failure.
Specimens 1, 2 and 7 presented the most regular stress–strain curves, as well as the lowest deformability and strains at failure, although their UCS was remarkably different: specimen 2 showed the lowest UCS, while specimen 7 of the maximum strength of all the specimens tested. On the other hand, abrupt changes in stress values can be observed, both before and after reaching the peak, in almost all the stress–strain curves, especially for specimens 4, 6 and 8. This behaviour was attributed to both natural micro fractures within the material and local failures at block-matrix contacts, which occurred during the tests. A completely different behaviour was exhibited by specimen 3, which showed a lower strength, an almost elastic, perfectly plastic behaviour and a much lower stiffness. The variability in the results could be due to the heterogeneity of the bimrock samples as well as to the anisotropy of the specimens tested (i.e., micro fractures and presence of bedding planes, which were also occasionally found to be non iso-oriented).
The stress–strain curves shown in Figure 7 were subsequently processed to determine the average UCS and the deformability modulus (in terms of global strains), Eglob, of the mélange (Table 3). Eglob was then compared to that obtained by using the DIC technique (in terms of local strains).
Strength
By averaging the peak strength values obtained, an UCS value equal to 2.14 MPa was found. Therefore, according to the PLT results, the mélange under study can be classified as a soft rock belonging to the grade R1 of the ISRM classification shown in Table 1.
A particularly striking finding to emerge from this result is that the average strength obtained with the UC tests was comparable to that obtained by the PL tests (i.e., 2.1 MPa). This outcome, while preliminary, suggests that a conversion factor C equal to 14 can be applied to the point load strength index to reliably predict the UCS of soft rocks, such as the Oltrepò Pavese mélange. It is worth pointing out that this value also fit well with the empirical relation proposed by Sonmez and Osman [64]. In this relation, the conversion factor, C, is obtained according to the following Equation (1):
where mi is the rock material constant of Hoek and Brown criterion.
C = 3.3 mi0.665
Specifically, from Equation (1), if an mi = 7 ± 2 is assumed for marls [65], C ranged from 9.6 to 14.2.
Deformability
An estimation of the elastic modulus, Eglob, of the mélange was obtained by analysing the global strains inferred from the LVDT mounted on the edge of the samples. Specifically, the pseudo-linear portion of the stress–strain curve of each specimen was considered, providing the results listed in Table 3. From these results, an average Eglob equal to about 0.21 GPa was found.
However, the deformability evaluated based on global strains is generally affected by some degree of error. The friction between the specimen ends and the steel plates and the different elastic properties of the two materials (i.e., steel and mélange) cause shear stresses at the specimen ends, because of the end restraint. This condition induces a triaxial state of stress (close to the ends of the specimen) that tends to transform into a uniaxial state of stress towards the centre of the specimen [61]. Consequently, the elastic modulus found using global strains is generally different (i.e., lower) from that evaluated analysing local strains. Therefore, direct contact extensometers and strain gauges are generally used to measure local strains and determine the deformability of the material under study. Nevertheless, due to the high weakness of the material, as well as to the dusty, irregular, and heterogeneous surfaces of the specimens, neither instrument could be used. Moreover, it is worth pointing out that, in this research, the heterogeneity of the geomaterial and the settling/rotation of the top loading plate due to both the non-planarity and non-parallelism of the specimen bases may have induced an even greater overestimation of global strains. In light of the above considerations, the average of 0.21 GPa should be considered only as a preliminary and conservative result.
In order to estimate a more reliable value of the elastic modulus of the mélange, the DIC technique was applied by using the 2D open source Ncorr software package implemented in Matlab [66]. The Ncorr program requires the definition of a region of interest (ROI) on the reference image (Figure 8). In this research, the edges of the specimen were excluded from the ROI to prevent numerical errors that could arise during the computation since the edges of the specimens used are not perfectly regular (for example the jagged right edge in Figure 8) nor perfectly vertical (for example, the left edge in Figure 8), as well as to avoid boundary effects due to the contact between the loading plates and the sample faces.
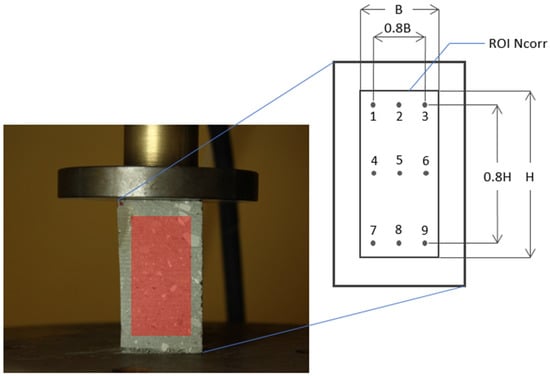
Figure 8.
An example of the ROI of a heterogeneous specimen tested.
To obtain results representative of the overall behaviour of the mélange, we decided to take into account the deformations of the three vertical lines joining points 1–7, 2–8 and 3–9 of Figure 8.
From the analysis of the axial displacements of these lines, intersecting both blocks and matrix, their deformations could easily be obtained from Equation (2):
being:
- the axial deformation at time i between two points, say P0 and P1;
- and the vertical displacements of points P0 and P1 at time i;
- the initial (vertical) distance between points P0 and P1.
The results obtained (i.e., stress–strain curves) are shown in Figure 9 for specimen n. 7, by way of example. The blue part of each curve indicates the data that were linearized and then used to determine the elastic modulus. This linearization interval was chosen to have an almost linear elastic stress–strain behaviour.
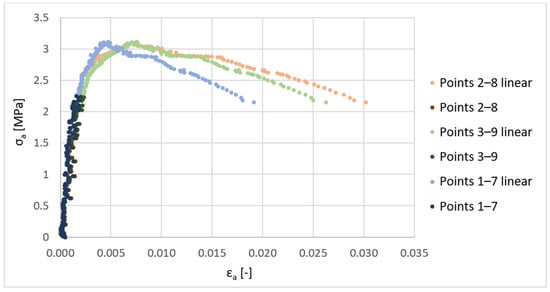
Figure 9.
Axial stress vs. axial strain curve of specimen n. 7, obtained for the three lines (joining points 1–7, 2–8 and 3–9 of Figure 8) with the DIC technique.
As can be seen from Table 3, the average deformability modulus obtained for each specimen with the DIC analysis, EaverageDIC, is significantly higher (up to 5 times) than that found using the global deformations, Eglob. This outcome seems to confirm the consistency and reliability of the results found with the DIC technique. Moreover, this result indicates that the estimation of the deformability modulus should not be performed using global deformations, which are affected by the many uncertainties described above and can lead to a significant underestimation of the E values.
Finally, the results shown in Table 3 also highlight that important differences in the deformability of this geomaterial do exist. Specifically, the deformability moduli of specimens 1, 4 and 5 seem to be much lower than those of specimens 2, 7 and 8, although no relevant differences in their UCS were generally found. This discrepancy in the results is difficult to explain. However, it could be argued that factors such as the presence of some rock inclusions in specimens 7 and 8, variably oriented bedding planes and/or innate micro-fractures within specimens 1, 4 and 5 may have affected the deformability of the mélange differently. Likewise, microfractures or other defects on the surface of specimens analysed with the DIC technique may also have influenced the result of these analyses, leading to lower elastic moduli than expected. This could be the case of specimen 1, whose elastic modulus EaverageDIC was only 0.39 GPa. In fact, from the stress–strain curves of Figure 7, the highest elastic moduli were expected to be obtained for specimens 1 and 7.
To conclude, the specimens tested and analysed with the DIC technique provided an overall average elastic modulus of 0.79 GPa, with a minimum of 0.2 GPa and a maximum value equal to 1.44 GPa.
5. Conclusions
Soft rocks such as marls are extremely problematic geomaterials, since they exhibit very poor mechanical properties, degrade very fast when submerged in water and can also contain bedding planes and rock inclusions. As a consequence, undisturbed sampling, specimen preparation and laboratory tests are usually very challenging, as well as time-consuming and expensive operations.
In this paper, a heterogeneous Italian marly mélange was chosen and characterised in order to explore and address the challenges of working with water-sensitive soft rocks with a block-in-matrix internal arrangement.
Several technical difficulties were encountered during the collection and preparation of intact specimens for laboratory tests. In this regard, various non-conventional operative methodologies were considered and applied, and an effective procedure was developed. In order to obtain specimens as regular as possible, the construction of a dry cutting machine was found to be the only suitable solution. Specifically, a wood band saw was modified to include additional appropriate devices to contain vibrations, dust and sample deformations, as well as to guarantee safe working conditions. The potential of the solutions proposed in this research lies in the fact that they can be conveniently applied to other (heterogeneous) soft rocks, such as the Italian mélange.
The mechanical behaviour of the mélange under compression was investigated by carrying out a series of PL and UC tests, from which an average UCS of about 2.1 MPa was found. According to the classification proposed by ISRM (1981), the geomaterial under study could be defined as a very weak rock.
Another highly relevant outcome of the experimental research carried out in this study is that a conversion factor C equal to 14 was found, which can be applied to the IS50 to reliably predict the UCS of soft rocks, such as the Italian mélange, from PL tests. This outcome can be particularly useful, since PL tests are often the only way to determine the strength of soft rocks.
Finally, since neither strain gauges nor direct contact extensometers could be used to measure local strains, a preliminary estimation of the deformability of the mélange specimens was determined using the global deformations recorded using the LVDT. The average elastic modulus was found to be equal to 0.21 GPa. However, since the deformability evaluated by using global strain values is generally affected by some degree of error, the non-destructive digital image correlation (DIC) technique was also used to determine the elastic modulus of the geomaterial in terms of axial strains. The result of this analysis showed that the elastic modulus found using the global deformations strongly underestimates (up to 5 times) the stiffness of the specimens. Therefore, when dealing with soft rocks, such as the Italian mélange, the use of the DIC technique is highly recommended to obtain a reliable estimation of the elastic modulus of the material.
Author Contributions
All authors contributed to the study conception and design. Material preparation, Investigation and Data curation were performed by M.L.N. and L.M. Interpretation of data were performed by all authors. The first draft of the manuscript was written by M.L.N., and all authors commented on previous versions of the manuscript and read and approved its final version. All authors have read and agreed to the published version of the manuscript.
Funding
This research received no external funding.
Data Availability Statement
Data sharing not applicable.
Conflicts of Interest
The authors declare no conflict of interest. All authors certify that they have no affiliations with or involvement in any organization or entity with any financial interest or non-financial interest in the subject matter or materials discussed in this manuscript.
References
- Button, E.; Riedmuller, G.; Schubert, W.; Klima, K.; Medley, E. Tunnelling in tectonic melanges—Accommodating the impacts of geomechanical complexities and anisotropic rock mass fabrics. Bull. Eng. Geol. Environ. 2004, 63, 109–117. [Google Scholar] [CrossRef]
- Lindquist, E.S.; Goodman, R.E. Strength and deformation properties of a physical model melange. In Proceedings of the 1st North America Rock Mechanics Symposium; Nelson, P.P., Laubach, S.E., Eds.; A.A. Balkema: Austin, TX, USA, 1994; pp. 843–850. [Google Scholar]
- Medley, E.W. The Engineering Characterization of Melanges and Similar Block-in-Matrix Rocks (Bimrocks). Ph.D. Thesis, University of California, Berkeley, CA, USA, 1994. [Google Scholar]
- Medley, E.W. Estimating Block Size Distributions of Melanges and Similar Block-in-Matrix Rocks (Bimrocks). In Proceedings of the 5th North American Rock Mechanics Symposium (NARMS), Toronto, ON, Canada, 7–10 July 2002; pp. 509–606. [Google Scholar]
- Wakabayashi, J.; Medley, E.W. Geological Characterization of Melanges for Practitioners. Felsbau 2004, 22, 10–18. [Google Scholar]
- Barla, G.; Perello, P. Introduzione alla caratterizzazione geologica e geotecnica delle formazioni complesse. In Proceedings of the MIR 2014—XV ciclo di Conferenze di Meccanica e Ingegneria delle Rocce, Torino, ON, USA, 19–20 November 2014; pp. 11–38. [Google Scholar]
- Lindquist, E.S. The Strength and Deformation Properties of Melange. Ph.D. Thesis, University of California, Berkeley, CA, USA, 1994. [Google Scholar]
- D’Elia, B.; Distefano, D.; Esu, F.; Federico, G. Slope movements in structurally complex formations. In Proceedings of the International Symposium on Engineering in Complex Rock Formations, Beijing, China, 3–7 November 1986; pp. 430–436. [Google Scholar]
- Anagnostou, G.; Schuerch, R.; Ramoni, M. TBM tunnelling in complex rock formations. In Proceedings of the XV MIR Conference “Interventi e Opere Nelle Formazioni Complesse”, Torino, ON, USA, 19–20 November 2014; Chapter 15. pp. 307–330. [Google Scholar]
- Medley, E.W.; Lindquist, E.S. The engineering significance of the scale-independence of some Franciscan melanges in California, USA. In Proceedings of the the 35th U.S. Symposium on Rock Mechanics (USRMS), Reno, NV, USA, 5–7 June 1995; pp. 907–914. [Google Scholar]
- Medley, E.W. Orderly Characterization of Chaotic Franciscan Melanges. Felsbau 2001, 19, 20–33. [Google Scholar]
- Festa, A.; Pini, G.A.; Dilek, Y.; Codegone, G. Mélanges and mélange-forming processes: A historical overview and new concepts. Int. Geol. Rev. 2010, 52, 1040–1105. [Google Scholar] [CrossRef]
- Dong, W.; Pimentel, E.; Anagnostou, G. Experimental Investigations into the Mechanical Behaviour of the Breccias Around the Proposed Gibraltar Strait Tunnel. Rock Mech. Rock Eng. 2013, 46, 923–944. [Google Scholar] [CrossRef]
- Cen, D.; Huang, D.; Ren, F. Shear deformation and strength of the interphase between the soil-rock mixture and the benched bedrock slope surface. Acta Geotech. 2017, 12, 391–413. [Google Scholar] [CrossRef]
- Napoli, M.L.; Barbero, M.; Scavia, C. Geomechanical characterization of an Italian complex formation with a block-in-matrix fabric. In Proceedings of the Mechanics and Rock Engineering, from Theory to Practice (EUROCK 2021), Torino, Italy, 20–25 September 2021; p. 8. [Google Scholar]
- Napoli, M.L.; Milan, L.; Barbero, M.; Scavia, C. Identifying uncertainty in estimates of bimrocks volumetric proportions from 2D measurements. Eng. Geol. 2020, 278, 105831. [Google Scholar] [CrossRef]
- Adam, D.; Markiewicz, R.; Brunner, M. Block-in-Matrix Structure and Creeping Slope: Tunneling in Hard Soil and/or Weak Rock. Geotech. Geol. Eng. 2014, 32, 1467–1476. [Google Scholar] [CrossRef]
- Napoli, M.L.; Barbero, M.; Scavia, C. Tunneling in heterogeneous rock masses with a block-in-matrix fabric. Int. J. Rock Mech. Min. Sci. 2021, 138, 11. [Google Scholar] [CrossRef]
- Napoli, M.L. 3D slope stability analyses of a complex formation with a block-in-matrix fabric. In Proceedings of the Challenges and Innovations in Geomechanics. IACMAG 2021. Lecture Notes in Civil Engineering; Springer: Turin, Italy, 2021; Volume 126, p. 7. [Google Scholar]
- Napoli, M.L.; Barbero, M.; Scavia, C. Analyzing slope stability in bimrocks by means of a stochastic approach. In Proceedings of the European Rock Mechanics Symposium, EUROCK 2018, Saint Petersburg, Russia, 22–26 May 2018. [Google Scholar]
- Napoli, M.L.; Barbero, M.; Scavia, C. Slope stability in heterogeneous rock masses with a block-in-matrix fabric. In Proceedings of the Rock Mechanics for Natural Resources and Infrastructure Development-Proceedings of the 14th International Congress on Rock Mechanics and Rock Engineering, ISRM, Foz do Iguassu, Brazil, 13–18 September 2019; pp. 3482–3489. [Google Scholar]
- Pinyol, N.M.; Vaunat, J.; Alonso, E.E. A constitutive model for soft clayey rocks that includes weathering effects. Géotechnique 2007, 57, 29. [Google Scholar] [CrossRef]
- Alonso, E.E.; Pinyol, M.N. Slope stability in slightly fissured claystones and marls. Landslides 2015, 12, 643–656. [Google Scholar] [CrossRef]
- ISRM. Rock Characterization, Testing and Monitoring—ISRM Suggested Methods; Brown, E.T., Ed.; Pergamon Press: Oxford, UK, 1981; ISBN 978-975-93675-4-1. [Google Scholar]
- Agustawijaya, D.S. The uniaxial compressive strength of soft rock. Civ. Eng. Dimens. 2007, 9, 9–14. [Google Scholar]
- Zhai, H.; Canbulat, I.; Hebblewhite, B.; Zhang, C. Review of Current Empirical Approaches for Determination of the Weak Rock Mass Properties. Procedia Eng. 2017, 191, 908–917. [Google Scholar] [CrossRef]
- Cano, M.; Tomas, R. An approach for characterising the weathering behaviour of Flysch slopes applied to the carbonatic Flysch of Alicante (Spain). Bull. Eng. Geol. Env. 2015, 74, 443–463. [Google Scholar] [CrossRef][Green Version]
- Ahmad, N.R.; Jamin, N.H. Preliminary view of geotechnical properties of soft rocks of Semanggol formation at Pokok Sena, Kedah. IOP Conf. Ser. Earth Environ. Sci. 2018, 140, 012117. [Google Scholar] [CrossRef]
- Bonini, M.; Debernardi, D.; Barla, M.; Barla, G. The mechanical behaviour of clay shales and implications on the design of tunnels. Rock Mech. Rock Eng. 2009, 42, 361–388. [Google Scholar] [CrossRef]
- Marinos, P.; Hoek, E. Estimating the geotechnical properties of heterogeneous rock masses such as Flysch. Bull. Eng. Geol. Environ. 2001, 60, 85–92. [Google Scholar] [CrossRef]
- Miscevic, P.; Vlastelica, G. Durability Characterization of Marls from the Region of Dalmatia, Croatia. Geotech. Geol. Eng. 2011, 29, 771–781. [Google Scholar] [CrossRef]
- Dong, W.; Pimentel, E.; Anagnostou, G. On the Mechanical Behaviour of the Gibraltar Strait Breccias. In Proceedings of the The Second International Symposium on Constitutive Modeling of Geomaterials: Advances and New Applications (IS-Model 2012), Beijing, China, 15–16 October 2012; pp. 409–416. [Google Scholar]
- Kahraman, S.; Alber, M.; Fener, M.; Gunaydin, O. Evaluating the geomechanical properties of Misis fault breccia (Turkey). Int. J. Rock Mech. Min. Sci. 2008, 45, 1469–1479. [Google Scholar] [CrossRef]
- Kahraman, S.; Alber, M. Estimating unconfined compressive strength and elastic modulus of a fault breccia mixture of weak blocks and strong matrix. Int. J. Rock Mech. Min. Sci. 2006, 43, 1277–1287. [Google Scholar] [CrossRef]
- D’Elia, B.; Picarelli, L.; Leroueil, S.; Vaunant, J. Geotechnical characterisation of slope movements in structurally complex clay soil and stiff jointed clays. Riv. Ital. Geotec. 1998, 3, 5–32. [Google Scholar]
- Akram, M.S. Physical and numerical investigation of conglomeratic rocks. Ph.D. Thesis, The University of New South Wales, Sydney, Australia, 2010. [Google Scholar]
- Li, Z.; Xu, G.; Zhao, X.; Fu, Y.; Su, C. Applicability of Needle Penetration Test on Soft Rocks. EJGE 2016, 21, 7209–7222. [Google Scholar]
- Nikolaidis, G.; Saroglou, C. Engineering geological characterization of block-in-matrix rocks. Bull. Geol. Soc. Greece 2016, 50, 874–884. [Google Scholar] [CrossRef]
- Ulusay, R.; Gokceoglu, C. The modified block punch index test. Can. Geotech. J. 1997, 34, 991–1001. [Google Scholar] [CrossRef]
- Sonmez, H.; Tuncay, E.; Gokceoglu, C. Models to predict the uniaxial compressive strength and the modulus of elasticity for Ankara Agglomerate. Int. J. Rock Mech. Min. Sci. 2004, 41, 717–729. [Google Scholar] [CrossRef]
- Singh, T.N.; Kainthola, A.; Venkatesh, A. Correlation between point load index and uniaxial compressive strength for different rock types. Rock Mech. Rock Eng. 2012, 45, 259–264. [Google Scholar] [CrossRef]
- Tuncay, E.; Hasancebi, N. The effect of length to diameter ratio of test specimens on the uniaxial compressive strength of rock. Bull. Eng. Geol. Environ. 2009, 68, 491–497. [Google Scholar] [CrossRef]
- Vlastelica, G.; Miščević, P.; Pavić, N. Testing the shear strength of soft rock at different stages of laboratory simulated weathering. Građevinar 2017, 68, 955–965. [Google Scholar] [CrossRef][Green Version]
- Alonso, E.E.; Pineda, J.A.; Cardoso, R. Degradation of marls; two case studies from the Iberian Peninsula. Geol. Soc. Lond. Eng. Geol. Spec. Publ. 2010, 23, 47–75. [Google Scholar] [CrossRef]
- Kanjii, M.A. Critical issues in soft rocks. J. Rock Mech. Geotech. Eng. 2014, 6, 186–195. [Google Scholar] [CrossRef]
- Zhou, H.; Zhang, C.; Li, Z.; Hu, D.; Hou, J. Analysis of mechanical behavior of soft rocks and stability control in deep tunnels. J. Rock Mech. Geotech. Eng. 2014, 6, 219–226. [Google Scholar] [CrossRef]
- Pineda, J.A.; Alonso, E.E.; Romero, E. Environmental degradation of claystones Environmental degradation of claystones. Géotechnique 2013, 64, 64–82. [Google Scholar] [CrossRef]
- Alitalesh, M.; Mollaali, M.; Yazdani, M. Correlation between uniaxial strength and point load index of rocks. In Proceedings of the Japanese Geotechnical Society Special Publication the 15th Asian Regional Conference on Soil Mechanics and Geotechnical Engineering, Kukuoka City, Japan, 9–13 November 2015; pp. 504–507. [Google Scholar]
- Sonmez, H.; Tunusluoglu, C. New considerations on the use of block punch index for predicting the uniaxial compressive strength of rock material. Int. J. Rock Mech. Min. Sci. 2008, 45, 1007–1014. [Google Scholar] [CrossRef]
- Rabat, A.; Cano, M.; Tomás, R.; Tamayo, E.; Alejano, L.R. Evaluation of Strength and Deformability of Soft Sedimentary Rocks in Dry and Saturated Conditions Through Needle Penetration and Point Load Tests: A Comparative Study. Rock Mech. Rock Eng. 2020, 53, 2707–2726. [Google Scholar] [CrossRef]
- Lenoir, N.; Bornert, M.; Desrues, J.; Bésuelle, P.; Viggiani, G. Volumetric digital image correlation applied to x-ray microtomography images from triaxial compression tests on argillaceous rock. Strain 2007, 43, 193–205. [Google Scholar] [CrossRef]
- Lin, Q.; Labuz, J.F. Fracture of sandstone characterized by digital image correlation. Int. J. Rock Mech. Min. Sci. 2013, 60, 235–245. [Google Scholar] [CrossRef]
- Caselle, C.; Umili, G.; Bonetto, S.; Costanzo, D.; Ferrero, A.M. Evolution of local strains under uniaxial compression in an anisotropic gypsum sample. In Proceedings of the Geotechnical Research for Land Protection and Development, CNRIG, Lecco, Italy, 3–5 July 2019; pp. 454–461. [Google Scholar]
- Festa, A.; Ogata, K.; Pini, G.A.; Dilek, Y.; Codegone, G.; Macedonio, T. Late Oligocene—Early Miocene olistostromes (sedimentary mélanges) as tectono-stratigraphic constraints to the geodynamic evolution of the exhumed Ligurian accretionary complex (Northern Apennines, NW Italy). Int. Geol. Rev. 2015, 57, 540–562. [Google Scholar] [CrossRef]
- RIG. Raccomandazioni ISRM per la Misura Della Resistenza al Punzonamento. 1994, Volume 1, pp. 63–71. Available online: https://associazionegeotecnica.it/articoli_rig/raccomandazioni-per-la-misura-della-resistenza-al-punzonamento/ (accessed on 25 November 2021).
- ASTM. In D5731 Standard Test Method for Determination of the Point Load Strength Index of Rock; American Society for Testing and Materials: West Conshohocken, PA, USA, 1995; pp. 1–7.
- ISRM. The Complete ISRM Suggested Methods for Rock Characterization, Testing & Monitoring: 1974–2006; Ulusay, R., Hudson, J.A., Eds.; Compilation arranged by the ISRM Turkish National Group: Ankara, Turkey, 2007; ISBN 978-975-93675-4-1. [Google Scholar]
- Frankovská, J.; Durmekova, T. Specific features of weak rock laboratory testing. In Proceedings of the 15th European Conference on Soil Mechanics and Geotechnical Engineering, Athens, Greece, 12–15 September 2011; pp. 337–342. [Google Scholar]
- Tsiambaos, G. Engineering Geological behaviour of heterogeneous and chaotic rock masses. In Proceedings of the 12th International Congress—Bulletin of the Geological Society of Greece, Patras, Greece, 19–22 May 2010. [Google Scholar]
- Xu, Y.; Cai, M. Numerical study on the influence of cross-sectional shape on strength and deformation behaviors of rocks under uniaxial compression. Comput. Geotech. 2017, 84, 129–137. [Google Scholar] [CrossRef]
- Pellegrino, A.; Sulem, J.; Barla, G. The effects of slenderness and lubrication on the uniaxial behavior of a soft limestone. Int. J. Rock Mech. Min. Sci. 1997, 34, 333–340. [Google Scholar] [CrossRef]
- Peng, J.; Wong, L.N.Y.; Teh, C.I. A re-examination of slenderness ratio effect on rock strength: Insights from DEM grain-based modelling. Eng. Geol. 2018, 246, 245–254. [Google Scholar] [CrossRef]
- Hawkins, A.B. Aspects of rock strength. Bull. Eng. Geol. Environ. 1998, 57, 17–30. [Google Scholar] [CrossRef]
- Sönmez, H.; Osman, B. The Limitations of Point Load Index for Predicting of Strength of Rock Material and a New. In Proceedings of the 61st Geological Congress of Turkey, Ankara, Turkey, 24–28 March 2008. [Google Scholar]
- Marinos, P.; Hoek, E. GSI: A geologically friendly tool for rock mass strength estimation. In Proceedings of the ISRM International Symposium, Melbourne, Australia, 19–24 November 2000. [Google Scholar]
- Blaber, J.; Adair, B.; Antoniou, A. Ncorr: Open-source 2D Digital Image Correlation Matlab software. Exp. Mech. 2015, 55, 1105–1122. [Google Scholar] [CrossRef]


Publisher’s Note: MDPI stays neutral with regard to jurisdictional claims in published maps and institutional affiliations. |
© 2022 by the authors. Licensee MDPI, Basel, Switzerland. This article is an open access article distributed under the terms and conditions of the Creative Commons Attribution (CC BY) license (https://creativecommons.org/licenses/by/4.0/).