1. Introduction
Nowadays, 3D modeling is applied in many fields, such as cultural heritage preservation [
1], underground survey [
2], coastal monitoring [
3], indoor mapping [
4], quarry’s studies [
5], and landfill monitoring [
6].
Three-dimensional models include digital elevation models (DEMs) that are typically used to visualize the variation of the Earth’s surface [
7] and produced through many procedures such as remote sensing, photogrammetry, and land surveying [
8]. A continuous representation of the examined part of the Earth surface is typically generated using appropriate interpolators that can be applied to topographic data as well as to hydrographic data [
9].
Interpolation is founded on the principles of spatial autocorrelation, which assumes that closer points are more similar compared to farther ones [
10], in accordance with the first law of geography formulated by Tobler [
11]. In other terms, we can define spatial interpolation as the procedure to predict the value of attributes at unobserved points within a study area covered by existing observations [
12]. Using points with known values (sample points), interpolation techniques allow for predicting unknown values for any geographic point data, such as elevation, rainfall, chemical concentrations, noise levels, etc. [
13]. Typically applied to grids with estimates made for all cells, interpolation methods generate a surface from the points [
14]. They have been classified as global or local [
15]. The difference between the two groups lies in the use of points with known values for assessing unknown values: a global method uses all the data available in the initial dataset while a local method uses only a selection of them, typically the points closest to the single grid node in which the value must be calculated [
16]. Interpolation methods are also classified as either exact or approximate methods because of the characteristic of preserving or not preserving the original sample point values on the inferred surface [
17]. Another distinction is made between deterministic and stochastic methods. The former use point values directly and can be applied when there is sufficient knowledge about the geographical surface being modeled so as to describe its character as a mathematical function [
18]. The latter utilize the statistical properties of the measured points: they quantify the spatial autocorrelation among sample points and consider the spatial configuration of the measured points around the prediction location [
19].
Some of the most used deterministic methods are: Inverse Distance Weighting (IDW), local polynomial functions (first, second, third, …, nth order), and radial basis functions [
20]. Particularly, IDW estimates interpolated points considering their distance from known values: each measured point is weighted by the inverse of its distance from the interpolation point [
21]. Consequently, as the distance increases, the weight decreases rapidly [
22].
Polynomial interpolation fits a smooth surface defined by a mathematical function (a polynomial) to the input sample points [
23]. The order of the polynomial ranges from first-order to higher-order: in every case, the values of the coefficients included in the polynomial equation must be determined using the measured values in the sample points [
24]. Global polynomial functions use the entire dataset to define the equation of a single surface capable of representing the entire area by itself. Local polynomial functions use a local subset defined by a window rather than all the measured points: the window is moved across the analyzed region, positioned on each grid node, and the surface value at the center of this moving box is assessed. The window is so large that it contains a sufficient number of data points for defining the surface equation [
25], e.g., no less than 10 points for a third-order polynomial function [
26].
Radial basis functions are conceptually similar to fitting a rubber membrane through the measured sample points while minimizing the total curvature of the surface [
27]. They include different basis functions (e.g., completely regularized spline, spline with tension thin-plate spline, multiquadric function, inverse multiquadric function, etc.) and depending on which you select, it will determine how the rubber membrane will fit between the values [
15]. Radial basis functions are exact interpolators, thus they require the surface to pass through the measured points; however, they can predict values above the maximum and below the minimum measured values.
Geostatistical methods include the concept of randomness, whereby the interpolated surface is hypothesized as one of many that might have been observed and all of which could generate the known data points [
28]. Some of the most used stochastic methods are Ordinary Kriging and Universal Kriging [
29]. Particularly, since they were used for the experiments carried out in our research, these methods are described in detail in the next section.
Several interpolation algorithms are available in literature and a large part of them is already implemented in GIS software, but the choice of the most suitable of them cannot be made a priori since it requires them to be evaluated each time [
26]. Their use concerns terrain as well as sea-bottom representation.
Three-dimensional bathymetric models, which are investigated in this article, are fundamental for many purposes: the spatial representation of the seabed morphology allows for the development of studies such as those on navigation safety [
30], coastal dynamics [
31], sea ecosystems [
32], seagrass meadows mapping [
33], port dredging [
34], infrastructure projects [
35], etc.
Depth data that can be interpolated for 3D bathymetric model creation are usually acquired by the hydrographic authority through bathymetric survey and used for nautical chart production. The acquisition of bathymetric data of the sea surrounding the Italian peninsula and the construction of the relative nautical charts is the prerogative of the “Istituto Idrografico della Marina Militare” (I.I.M.M.), which is the hydrographic authority in Italy [
36].
Bathymetric surveys can be carried out using different types of instrumentation based on acoustic signal transmission through the water; single-beam sonar (SBS) [
37], multi-beam sonar (MBS) [
38], and side-scan sonar (SSS) [
39] are widely diffused techniques for hydrographic survey that supply datasets for seabed representation. Furthermore, bathymetric data can be extracted from multispectral satellite images (Satellite Derived Bathymetry, SDB) [
40] or from the Electronic Navigational Chart (ENC) [
41]. SBS, MBS, and SSS convert into a range the measurement of the time lag between transmitting and receiving an acoustic signal that travels through the water, springs back the seabed, and returns to the sounder [
42,
43]. SDB is carried out by processing the remotely sensed images using specific techniques, such as the band ratio method [
44], which takes into account the relationships between bands [
45].
Single-beam data as well as depth data derived from a nautical chart are point cloud datasets that are submitted to spatial interpolation processes that allow for generating 3D models [
46]. Those irregularly spaced measured points are used as input to calculate the depths in the nodes of appropriate grids that are spaced in relation to the accuracy of the input data [
26,
47]. In other terms, established by the extension of the study area, the accuracy of the generated model is proportional to the number of nodes that compose the grid covering this area: the greater the number of nodes, the better will be the output model. Obviously, particular attention must be paid to choosing this number because it is of no use to create a 1000 × 1000 grid if the map only contains three sounding values [
48].
The accuracy of the resulting 3D models is affected by the points numerosity and distribution [
49]. In literature, mathematical models are proposed to take into account several independent variables, such as the surface slope, the density of points, the spatial distribution of these points, and the interpolation method, in order to explain the accuracy of a given DEM [
50]. Aguilar et al. (2002) [
51] recognized three factors that influence the accuracy of a DEM: the morphology of the terrain, the density of the measured points, and the interpolation method used. Several studies have been conducted on the influence of points density for DEMs generation and a large part of them considers laser scanner techniques, particularly LiDAR (Light Detection and Ranging) applications [
52,
53,
54]. Regardless of the acquisition technique used to capture measured points, some studies focus on the relationship between the DEM accuracy and the sampling density. Aguilar et al. (2005) analyzed this relationship and analytically adjusted it to a decreasing potential function [
55]. Chaplot et al. (2005) evaluated the performance of interpolation techniques for the generation of the DEM of natural landscapes of differing morphologies and over a large range of scales [
56]: five interpolation techniques (inverse-distance weighting, Ordinary Kriging, Universal Kriging, the multiquadratic radial basis function, and regularized spline with tension) were applied and their performance evaluated using data for both a mountainous area of northern Laos and a gentle landscape of western France at nested spatial scales, with sampling densities from 4 to 10
9 points/km
2.
This article aims to analyze the performance of Kriging approaches for bathymetric data interpolation in dependence of the location and density of the sample points related to the morphological situations. Each algorithm available in GIS software to interpolate height/depth values has its own advantages and disadvantages [
57] but Kriging interpolators are included among the most performing ones [
58], thus we preferred to use two of them in this study, namely Universal Kriging and Ordinary Kriging. Experiments were carried out on MBS datasets covering a sea-bottom area near Giglio Island (Italy) and results analyzed in reference to the sounding density. A new index named the Morphological Variation Index (MVI) is proposed to numerically express the level of variation of the seabed morphology to establish the useful number of points to be interpolated in dependence of the bottom conformation.
2. Study Area and Datasets
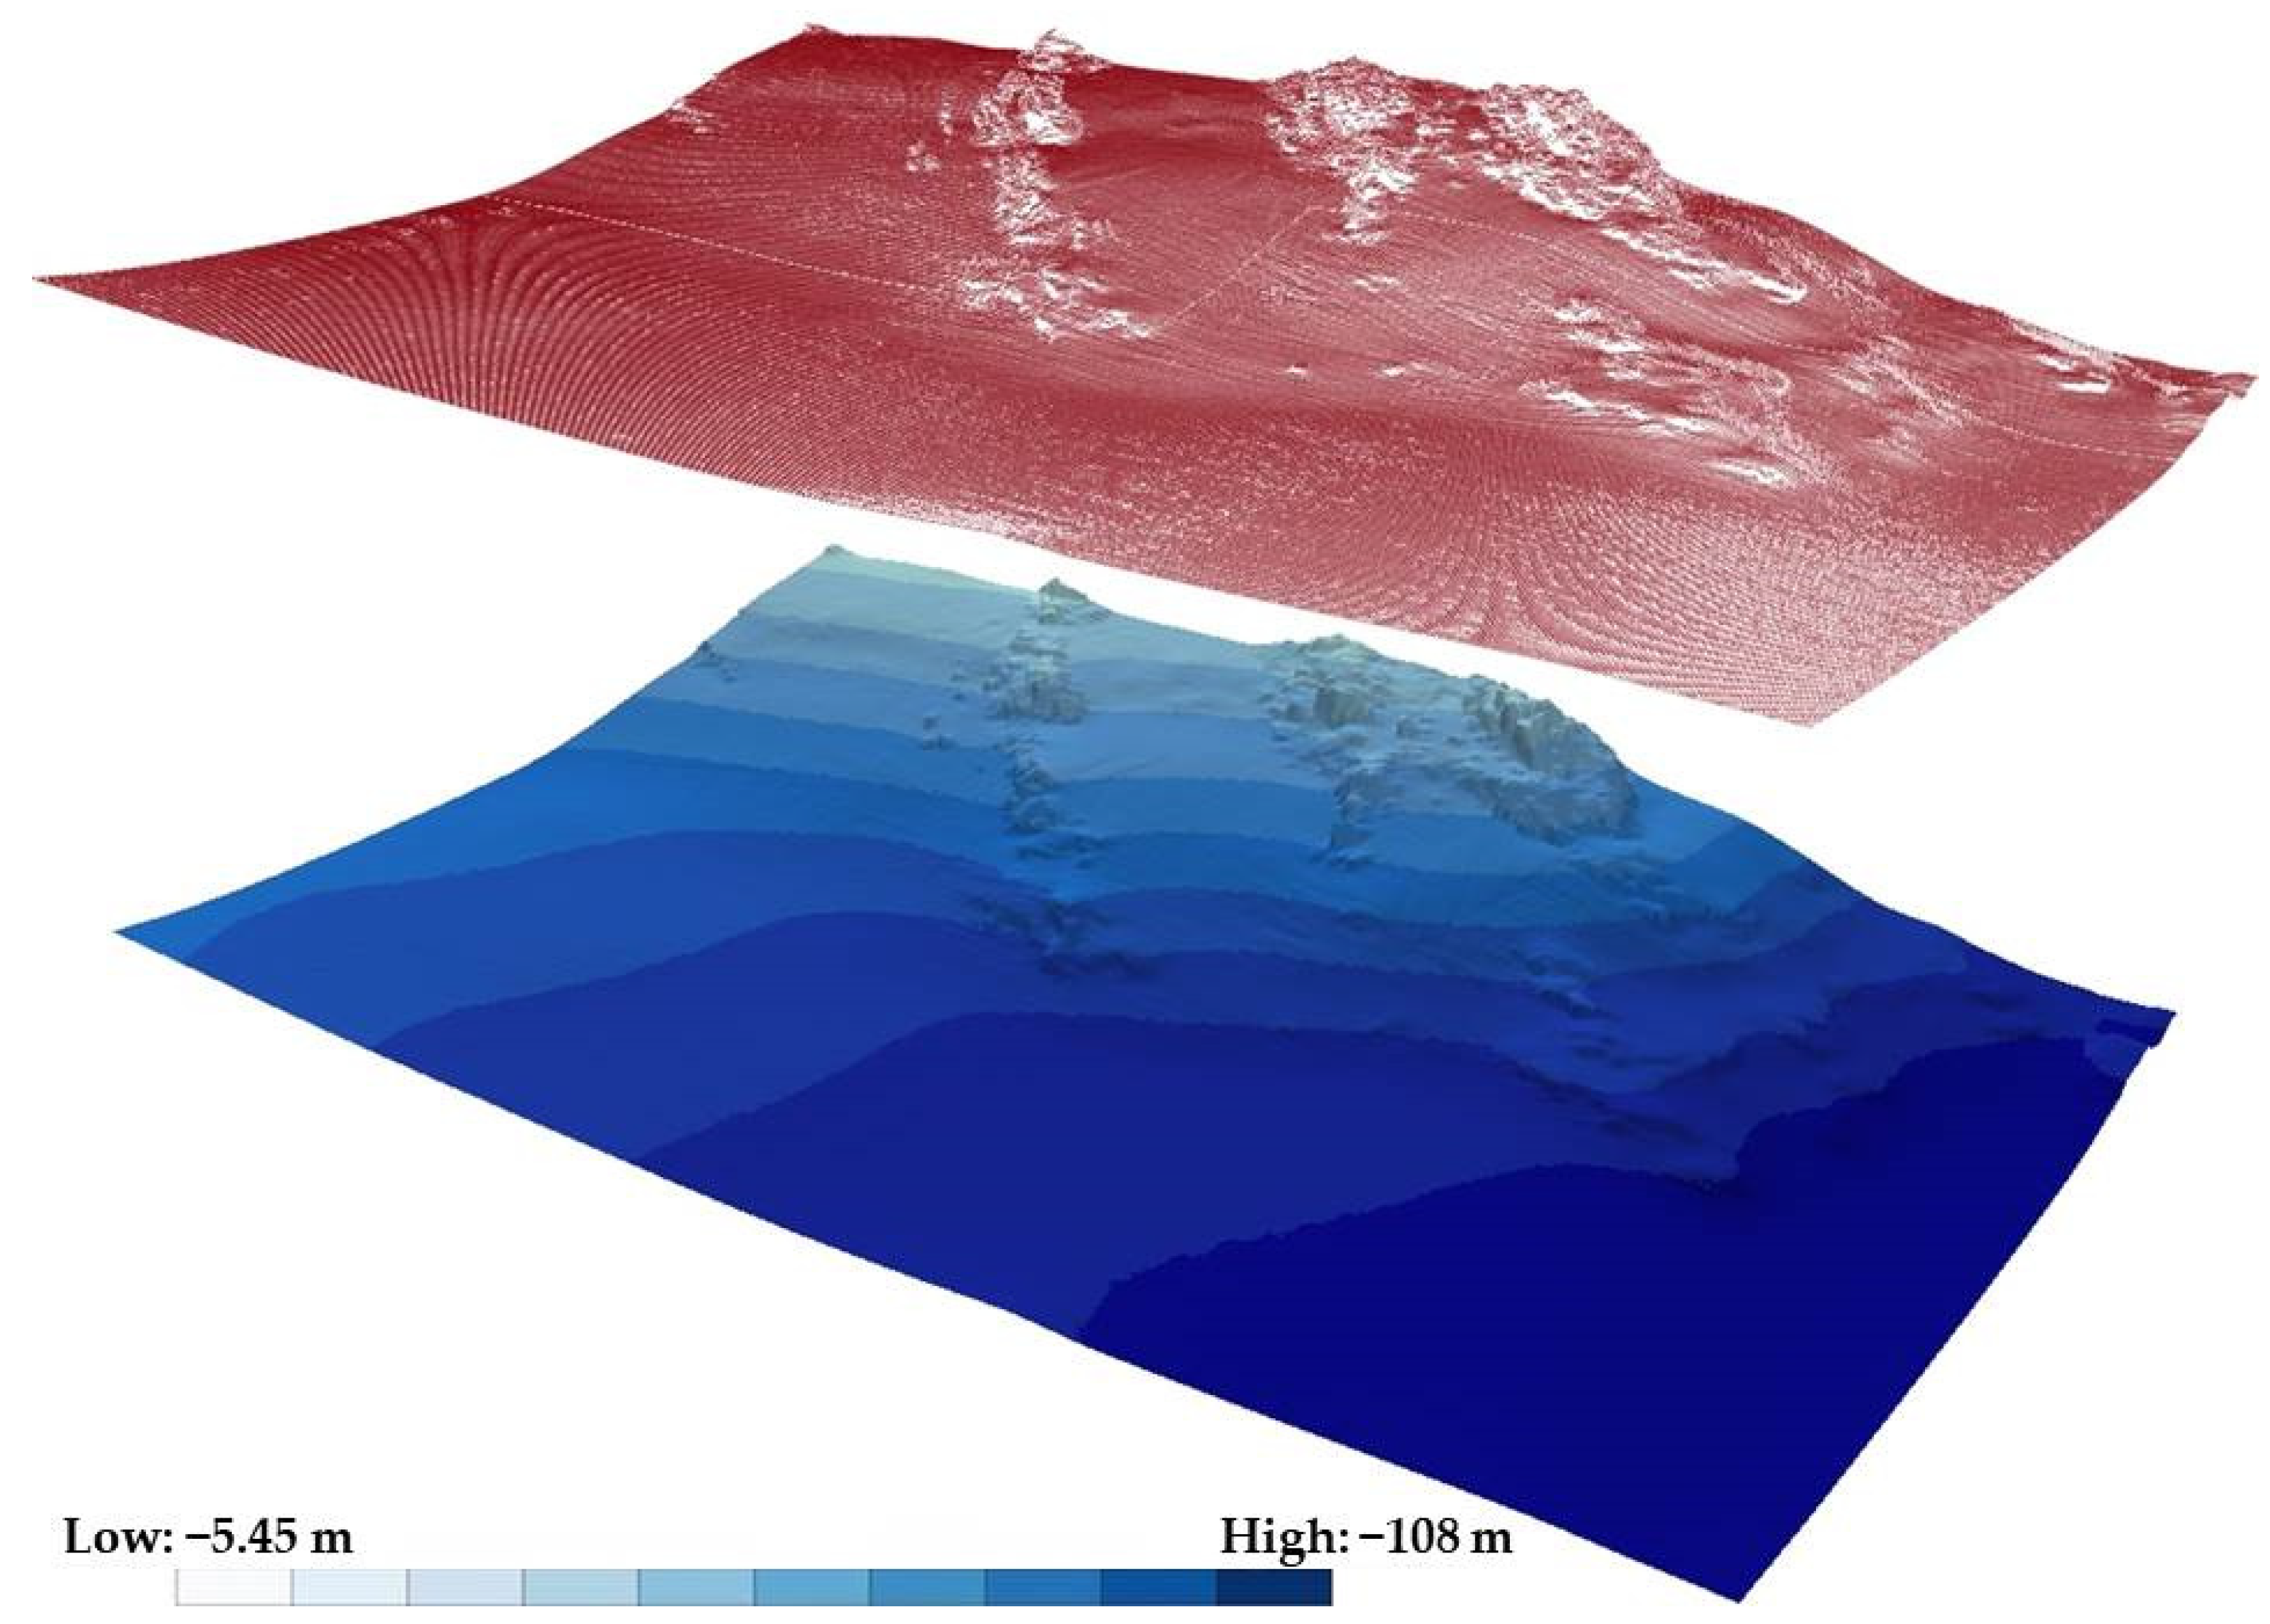
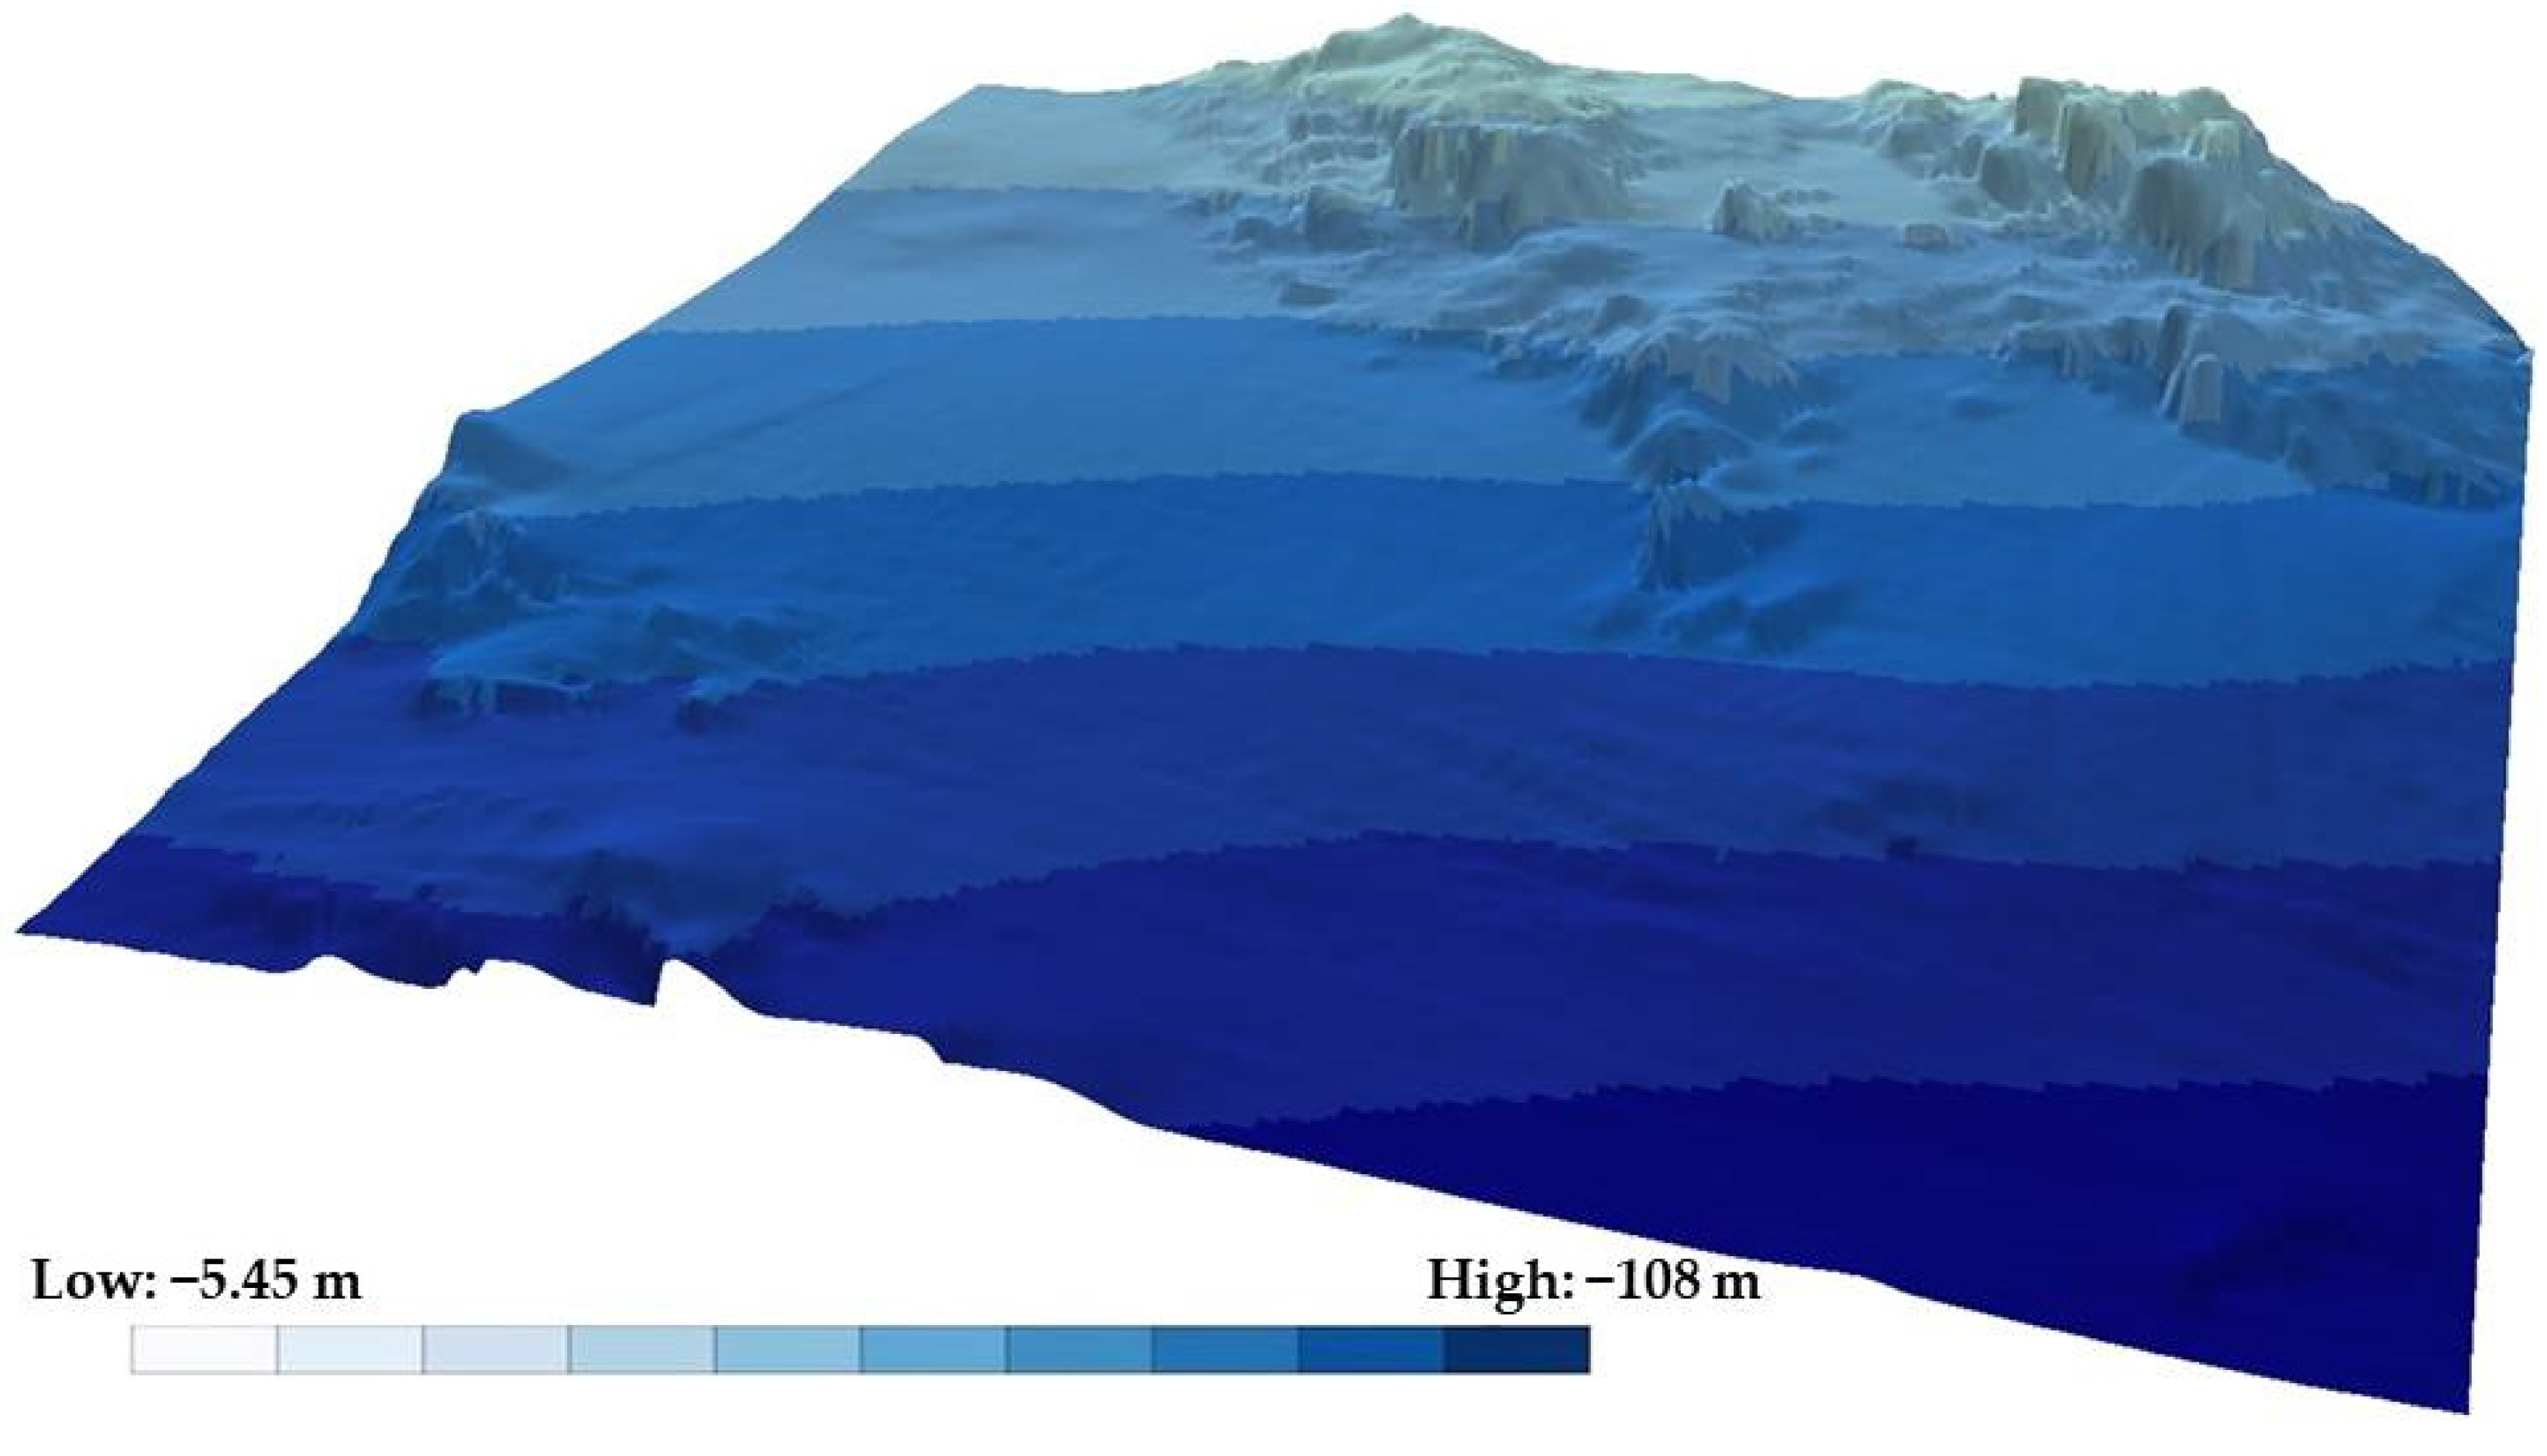
The experiments are carried out on a MBD that includes 240,000 measured points (
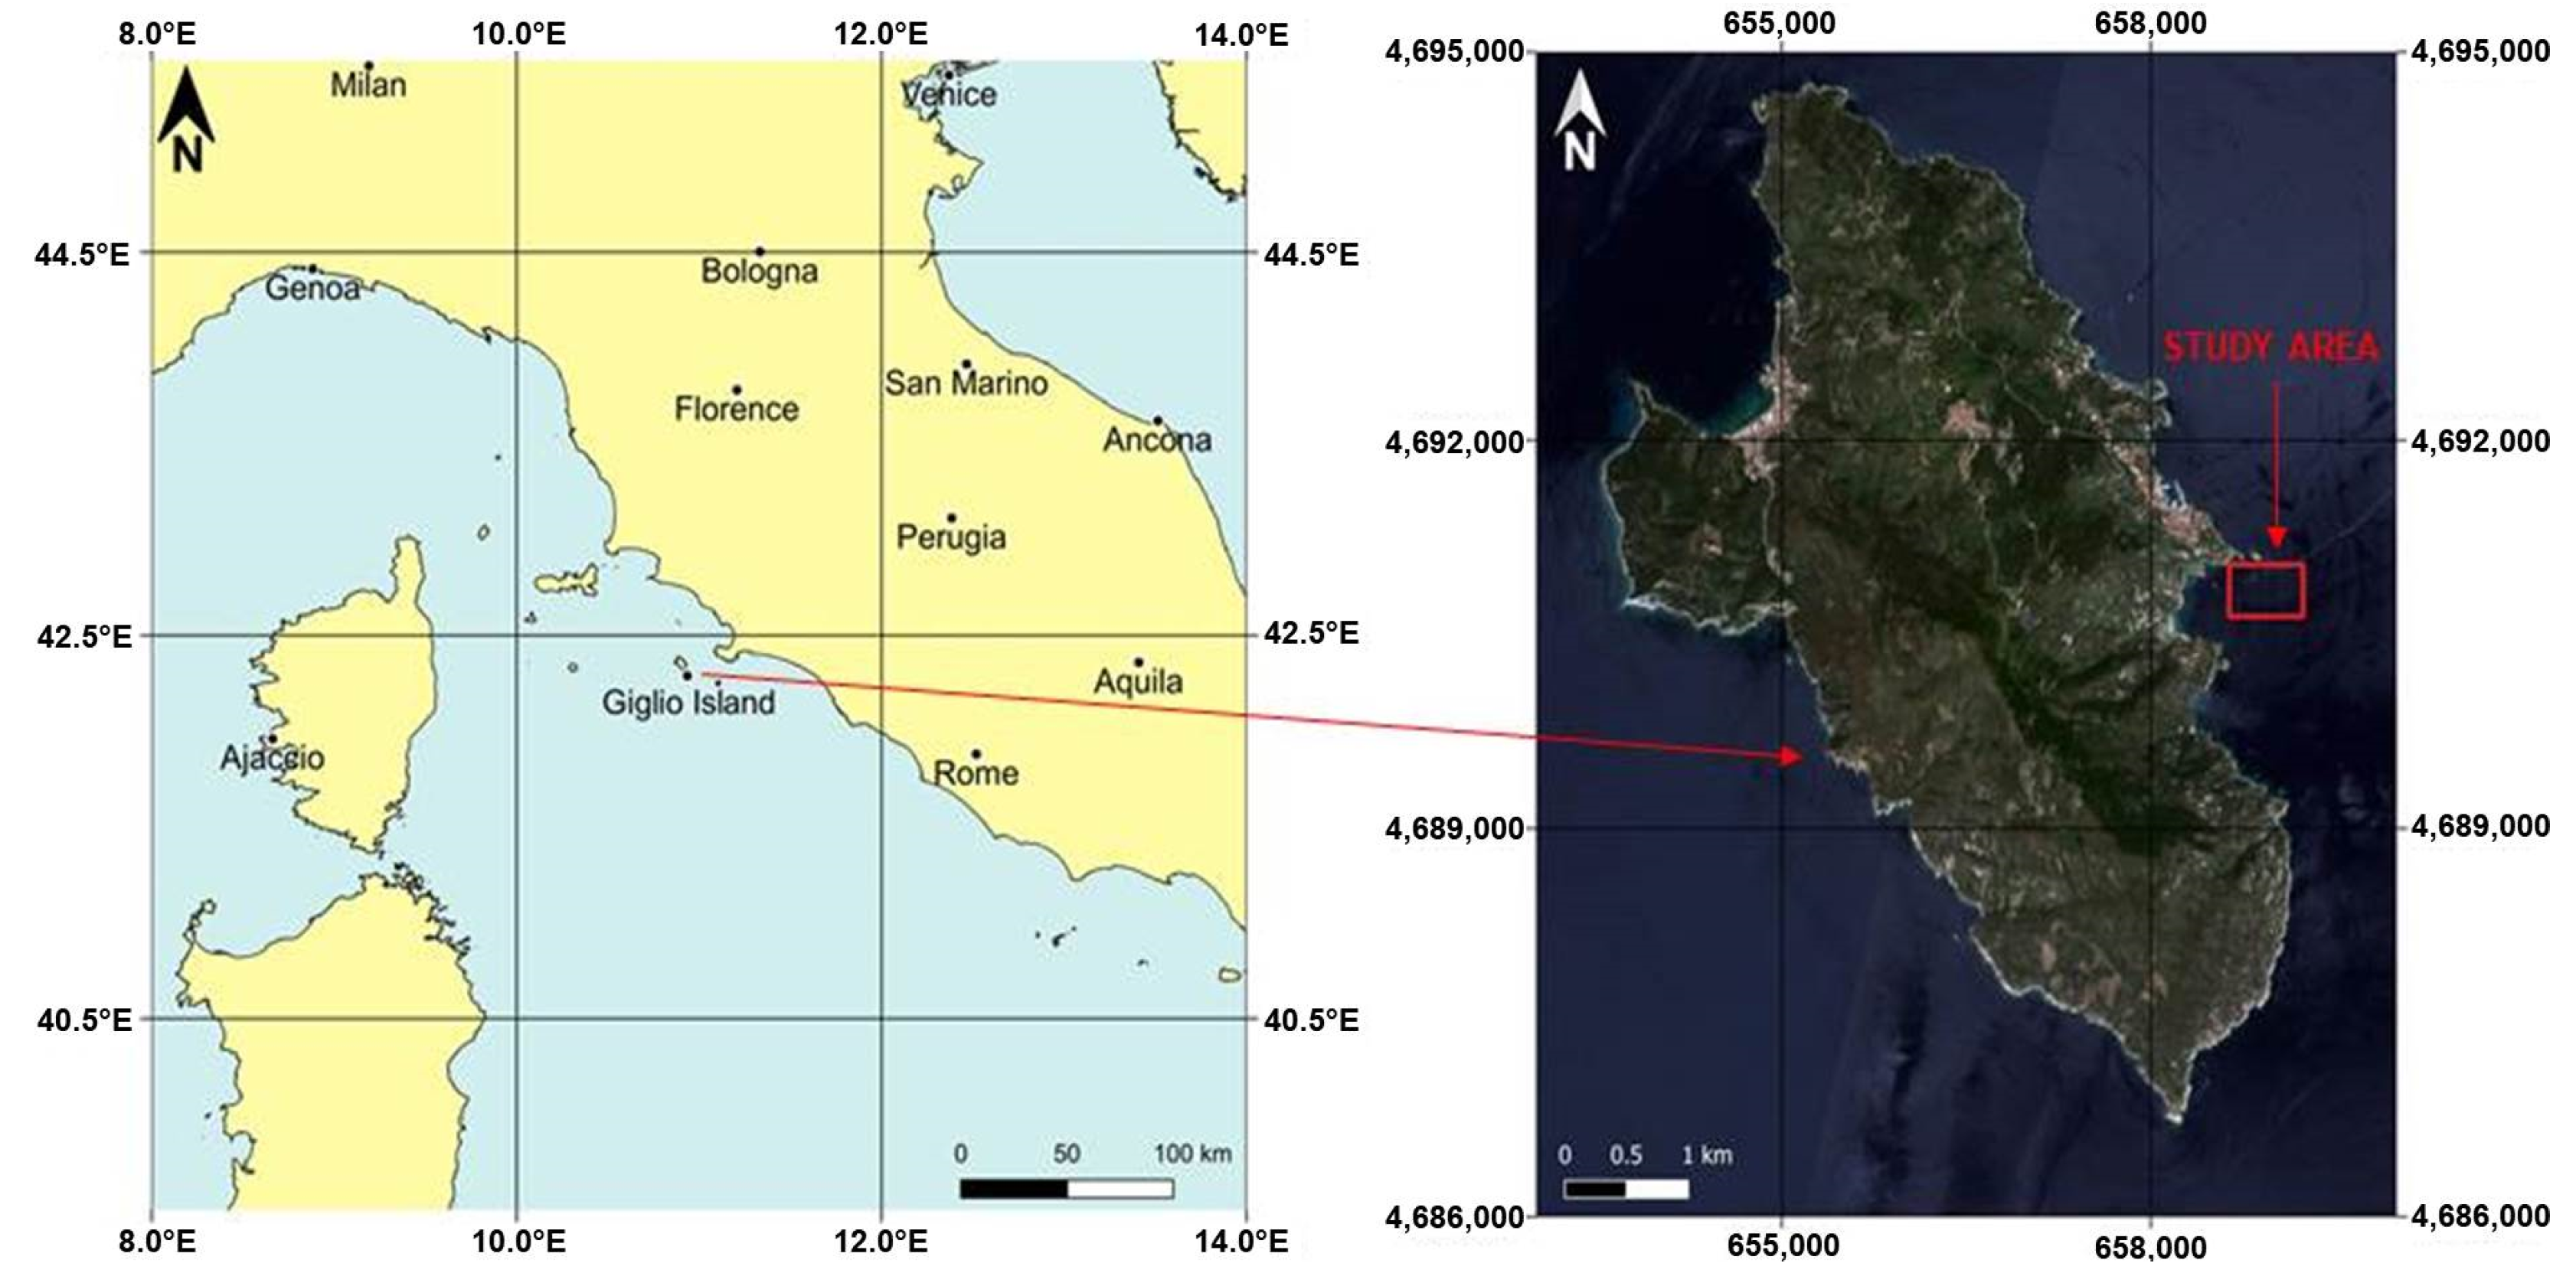
Figure 1) and covers an area of the sea bottom near the coasts of the Giglio Island (Italy) in the Tuscan archipelago (
Figure 2), with an extension of 240,000 m
2 (one point per square meter). The original dataset counts a total of 825,602 points and is provided by I.I.M.M., who also carried out the bathymetric survey in 2012.
The study area was chosen because it is of great interest; in fact, several hydrographic campaigns have been carried out on it over time. Furthermore, this area is characterized by a high level of variability of the seabed; in fact, it has both particularly steep and jagged areas, and some almost flat areas [
59]. The sea bottom, beneath 50 m of depth, consists of more than 60% clay [
60].
The area extends 400 m × 600 m within the following UTM/WGS84 plane coordinates −32T zone: E1 = 658,640 m, E2 = 659,240 m, N1 = 4,690,639 m, and N2 = 4,691,039 m.
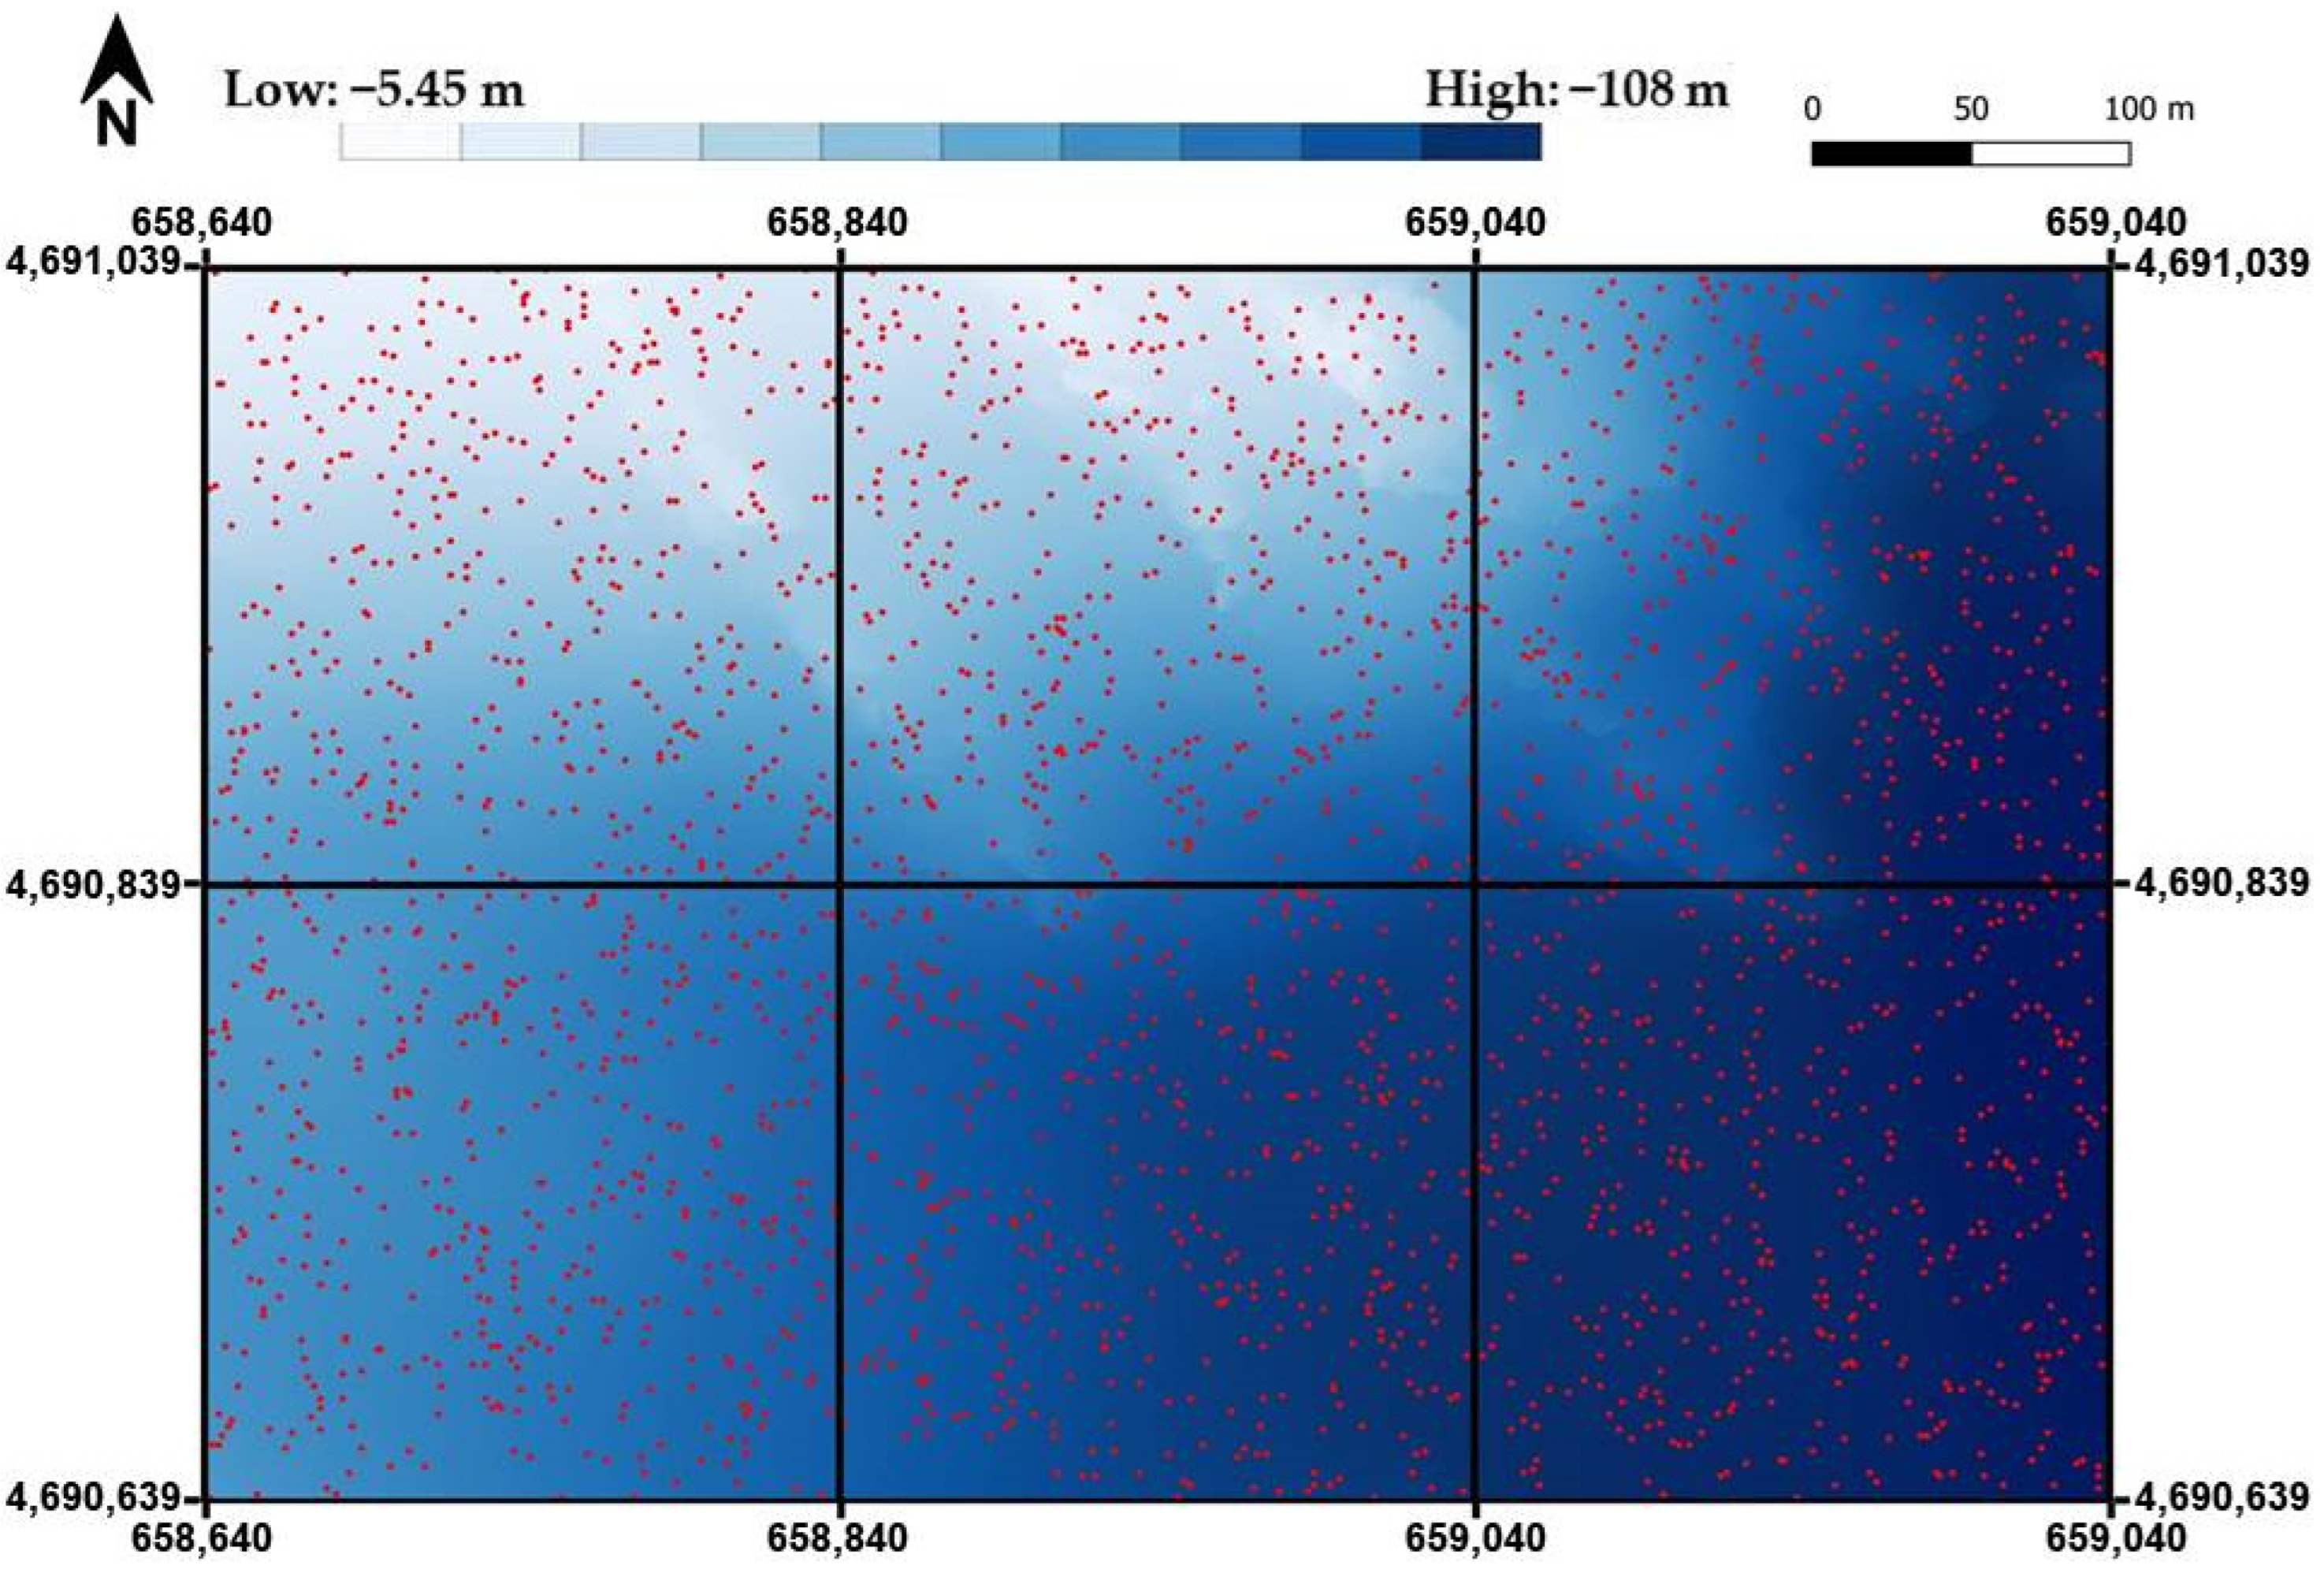
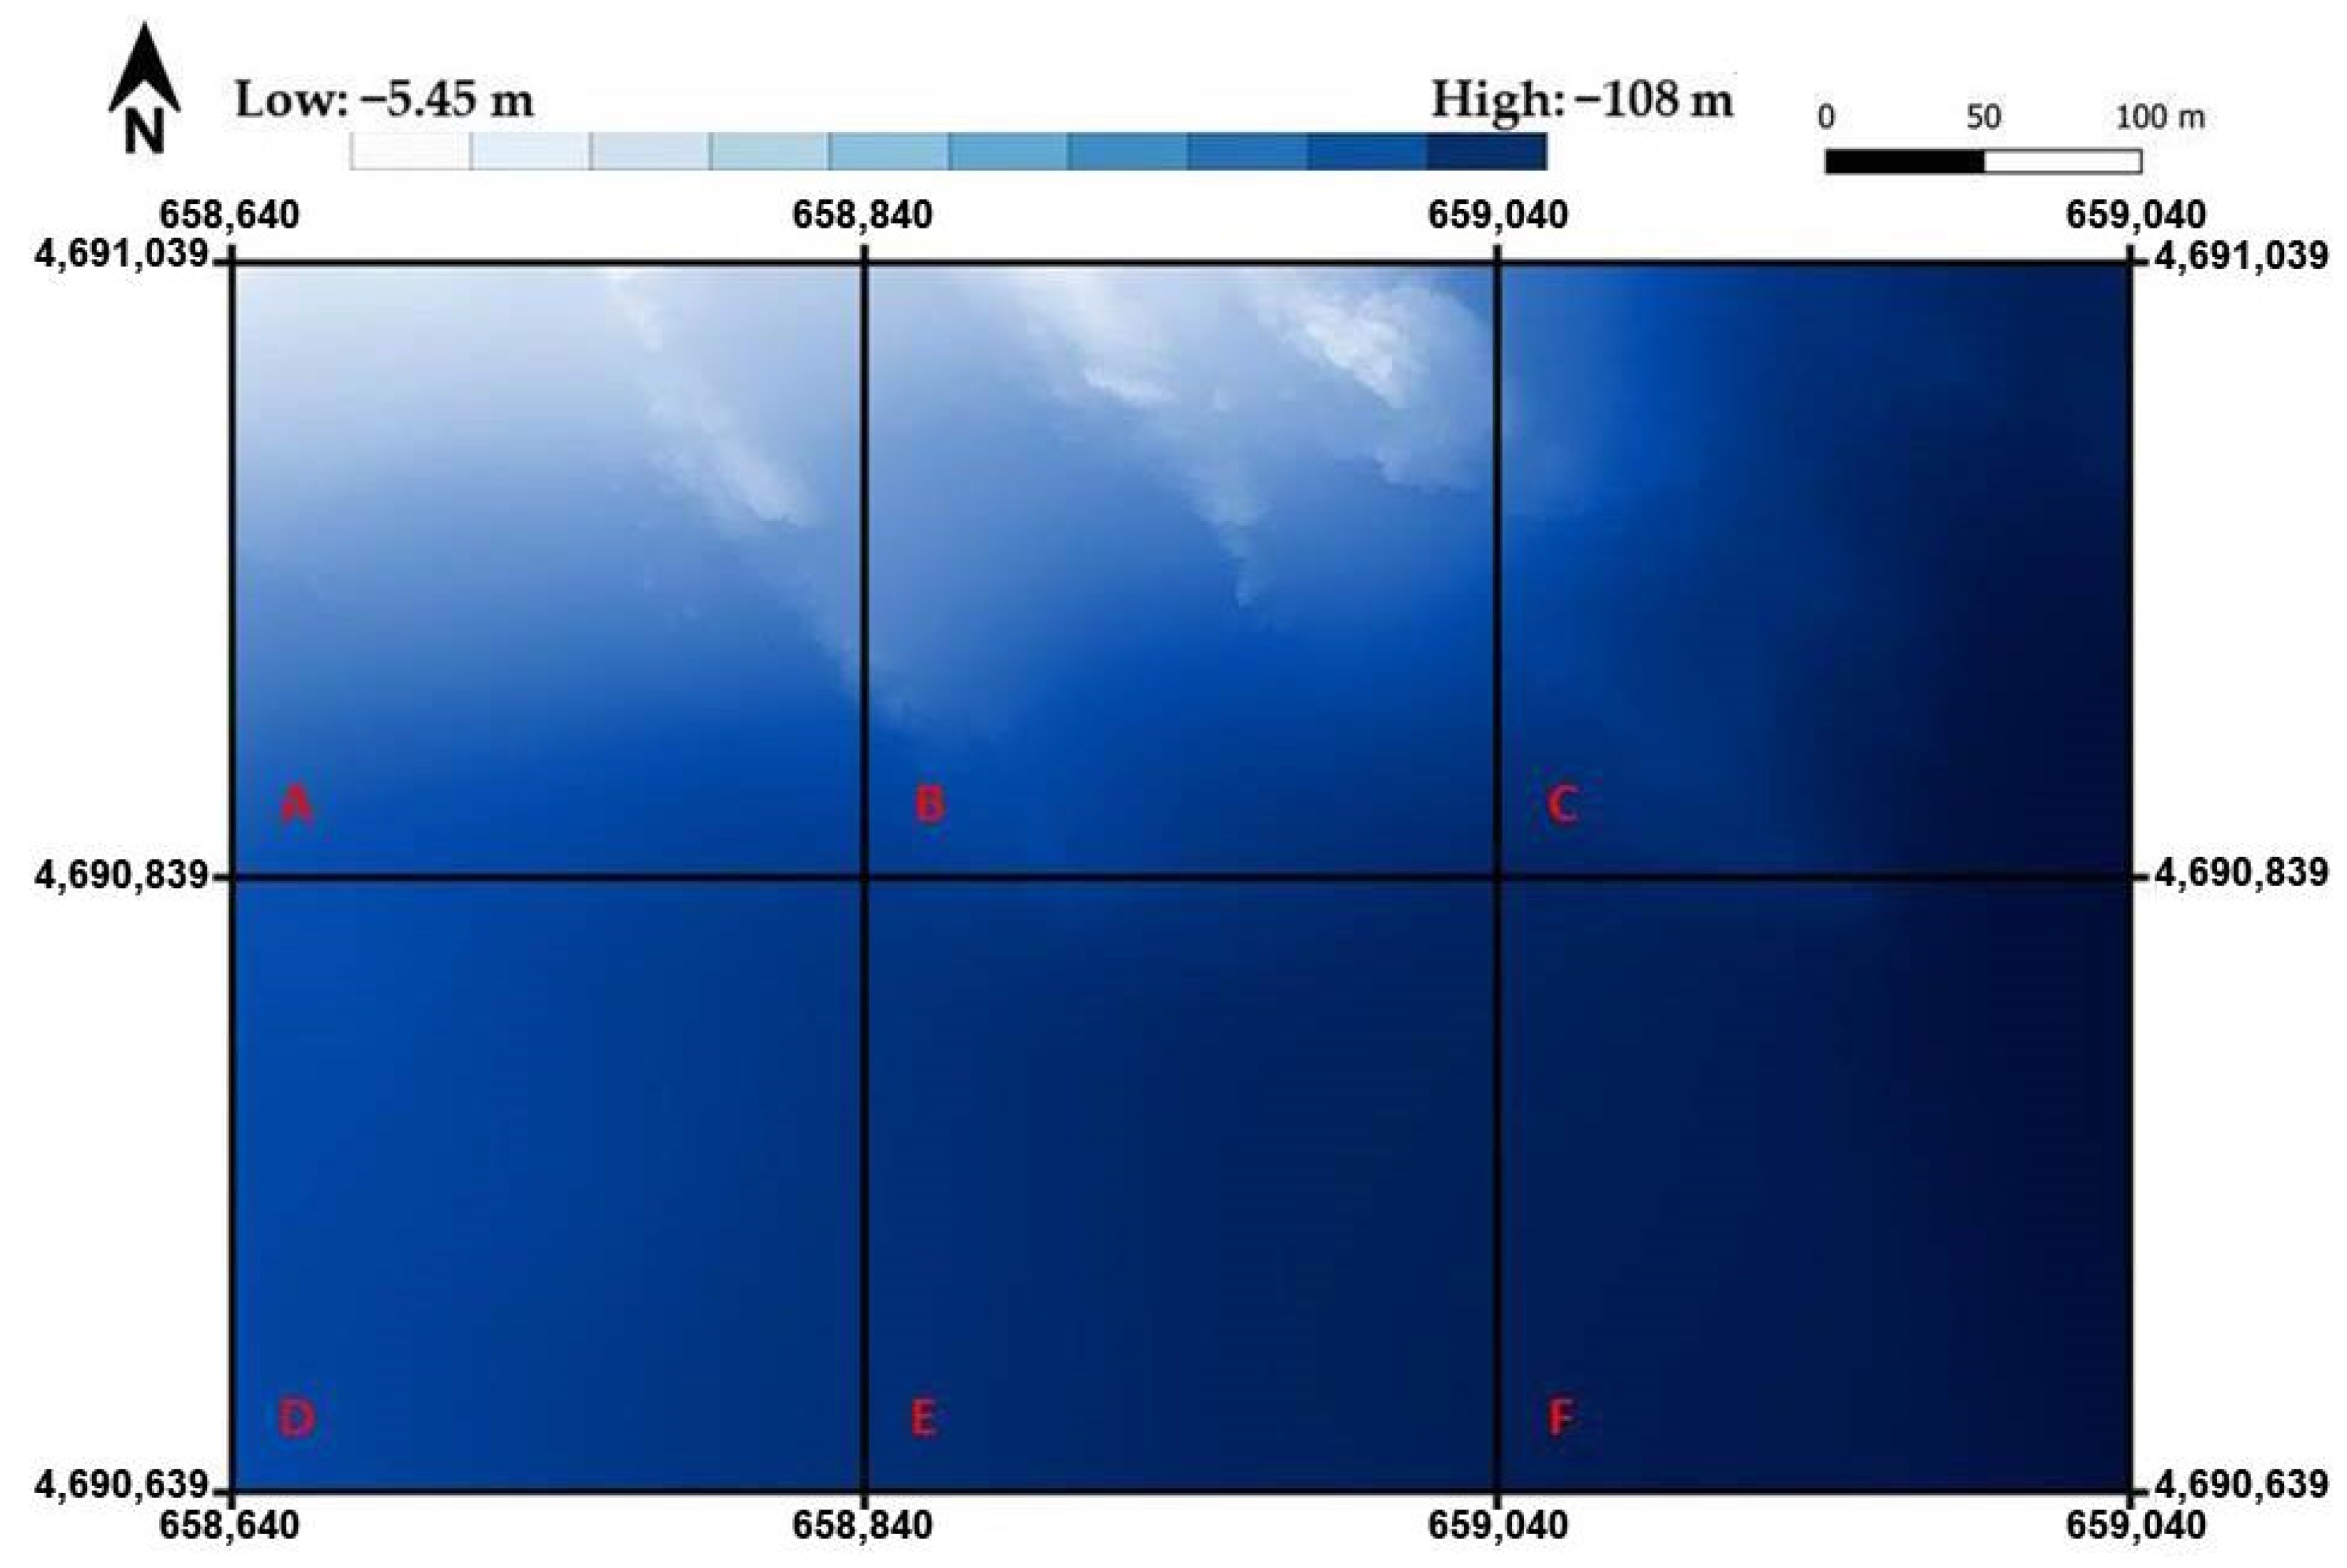
MBS data were organized as grid points containing X, Y, and Z values. Depth values range between −5.45 m and −108 m in the selected area, with a precision of 1 cm on depths. Different subsets were derived in random way from the initial MBS, selecting an increasing number of points (24, 48, 120, 240, 480, 1200, and 2400). Particularly, the area was subdivided in six sectors extending 200 m × 200 m (
Figure 3) and the selection was carried out to ensure an equal number of points included in each sector. As shown in
Section 3 and
Section 4, this data organization permits us to identify different morphological situations so that each sector can represent a local typical variability of the seabed.
4. Results and Discussion
The statistic values of all the residuals for each dataset are shown in
Table 1 for Ordinary Kriging applications analyzed by cross-validation and in
Table 2 for the same applications analyzed by direct comparison. Similarly, statistic values of all the residuals for each dataset are shown in
Table 3 for Universal Kriging applications analyzed by cross-validation and in
Table 4 for the same applications analyzed by direct comparison.
By examining the RMSE values, the results confirm the efficiency of both considered Kriging methods, remarking the augmentation of the accuracy level related to the increment of the number of measured points in the same area. Ordinary Kriging applications produce RMSE values that rapidly decrease from the first to the seventh subset (from 4.489 m to 0.503 m using cross-validation and from 4.053 m to 0.537 m using direct comparison). Universal Kriging models present similar trends of the residuals related to the measured point density, even if the results are slightly less accurate as testified by the RMSE values (from 5.105 m to 0.628 m using cross-validation and from 4.863 m to 0.647 m using direct comparison).
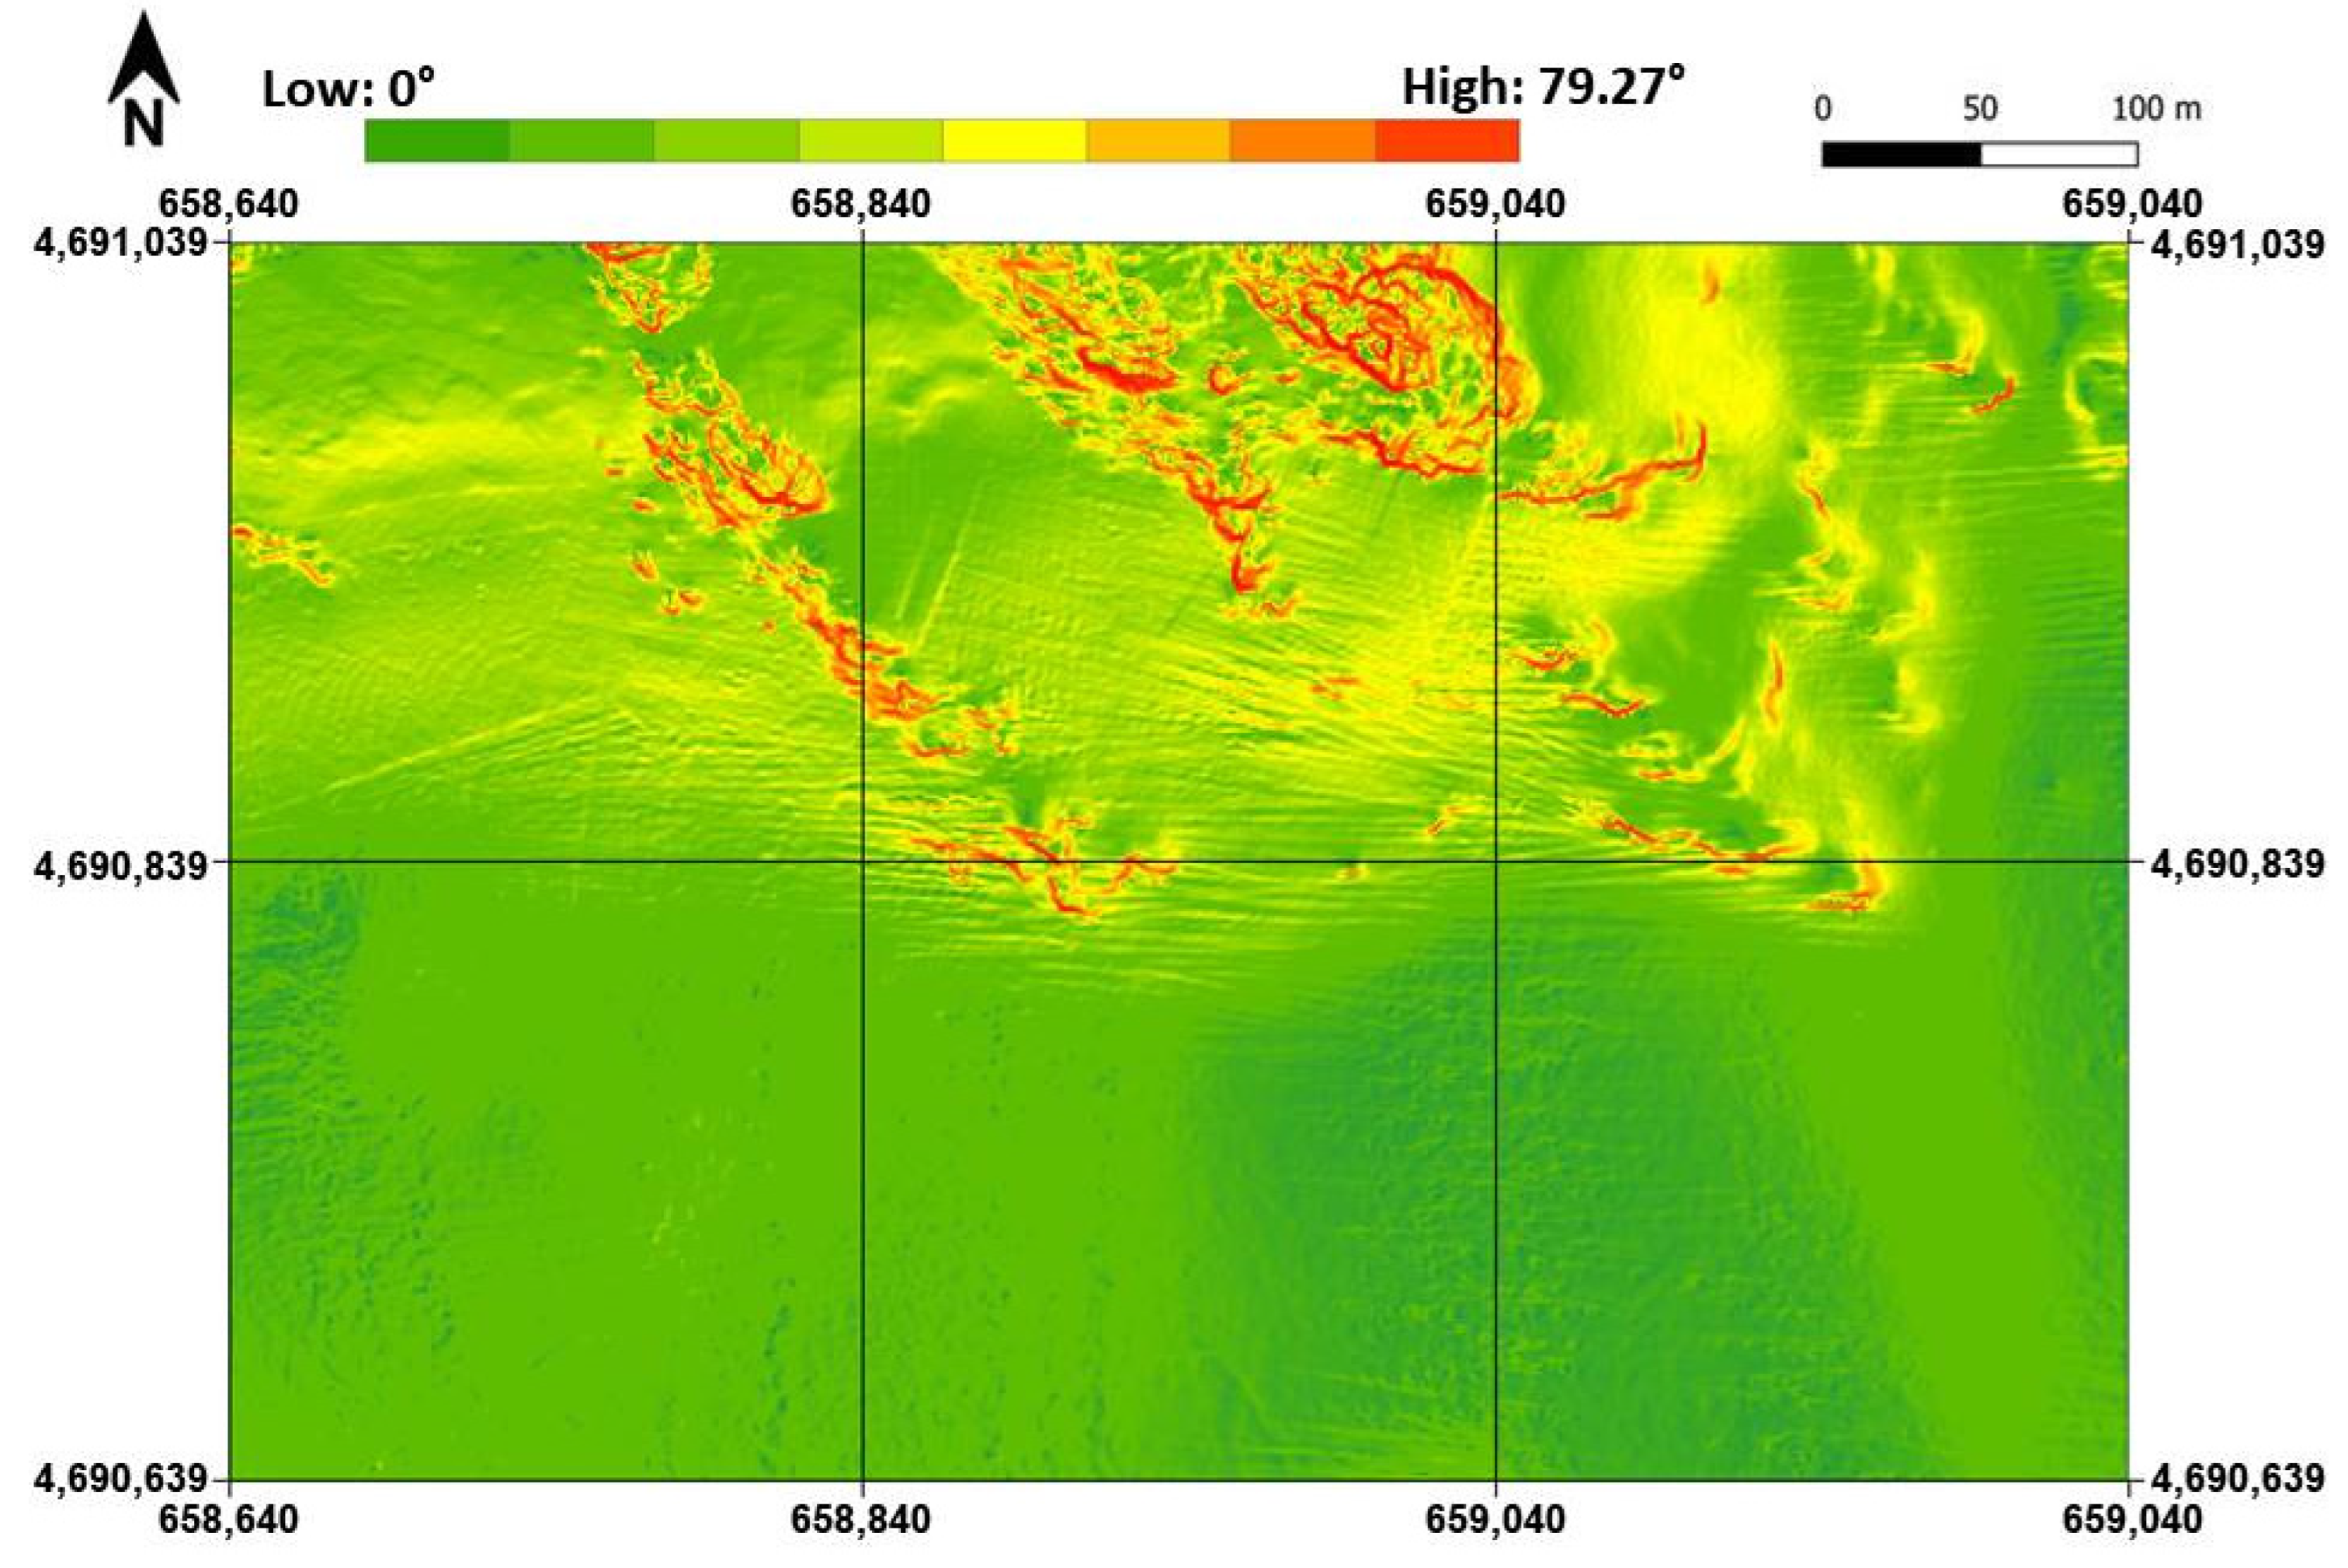
By analyzing the other statistics of the residuals, it is evident that the direct comparison produces very high maximum and minimum values. This effect is due to the particular morphology of the considered area that is extremely rugged in one of the six sectors (B), with a rapid alternation of ups and downs as well as abrupt changes in slopes.
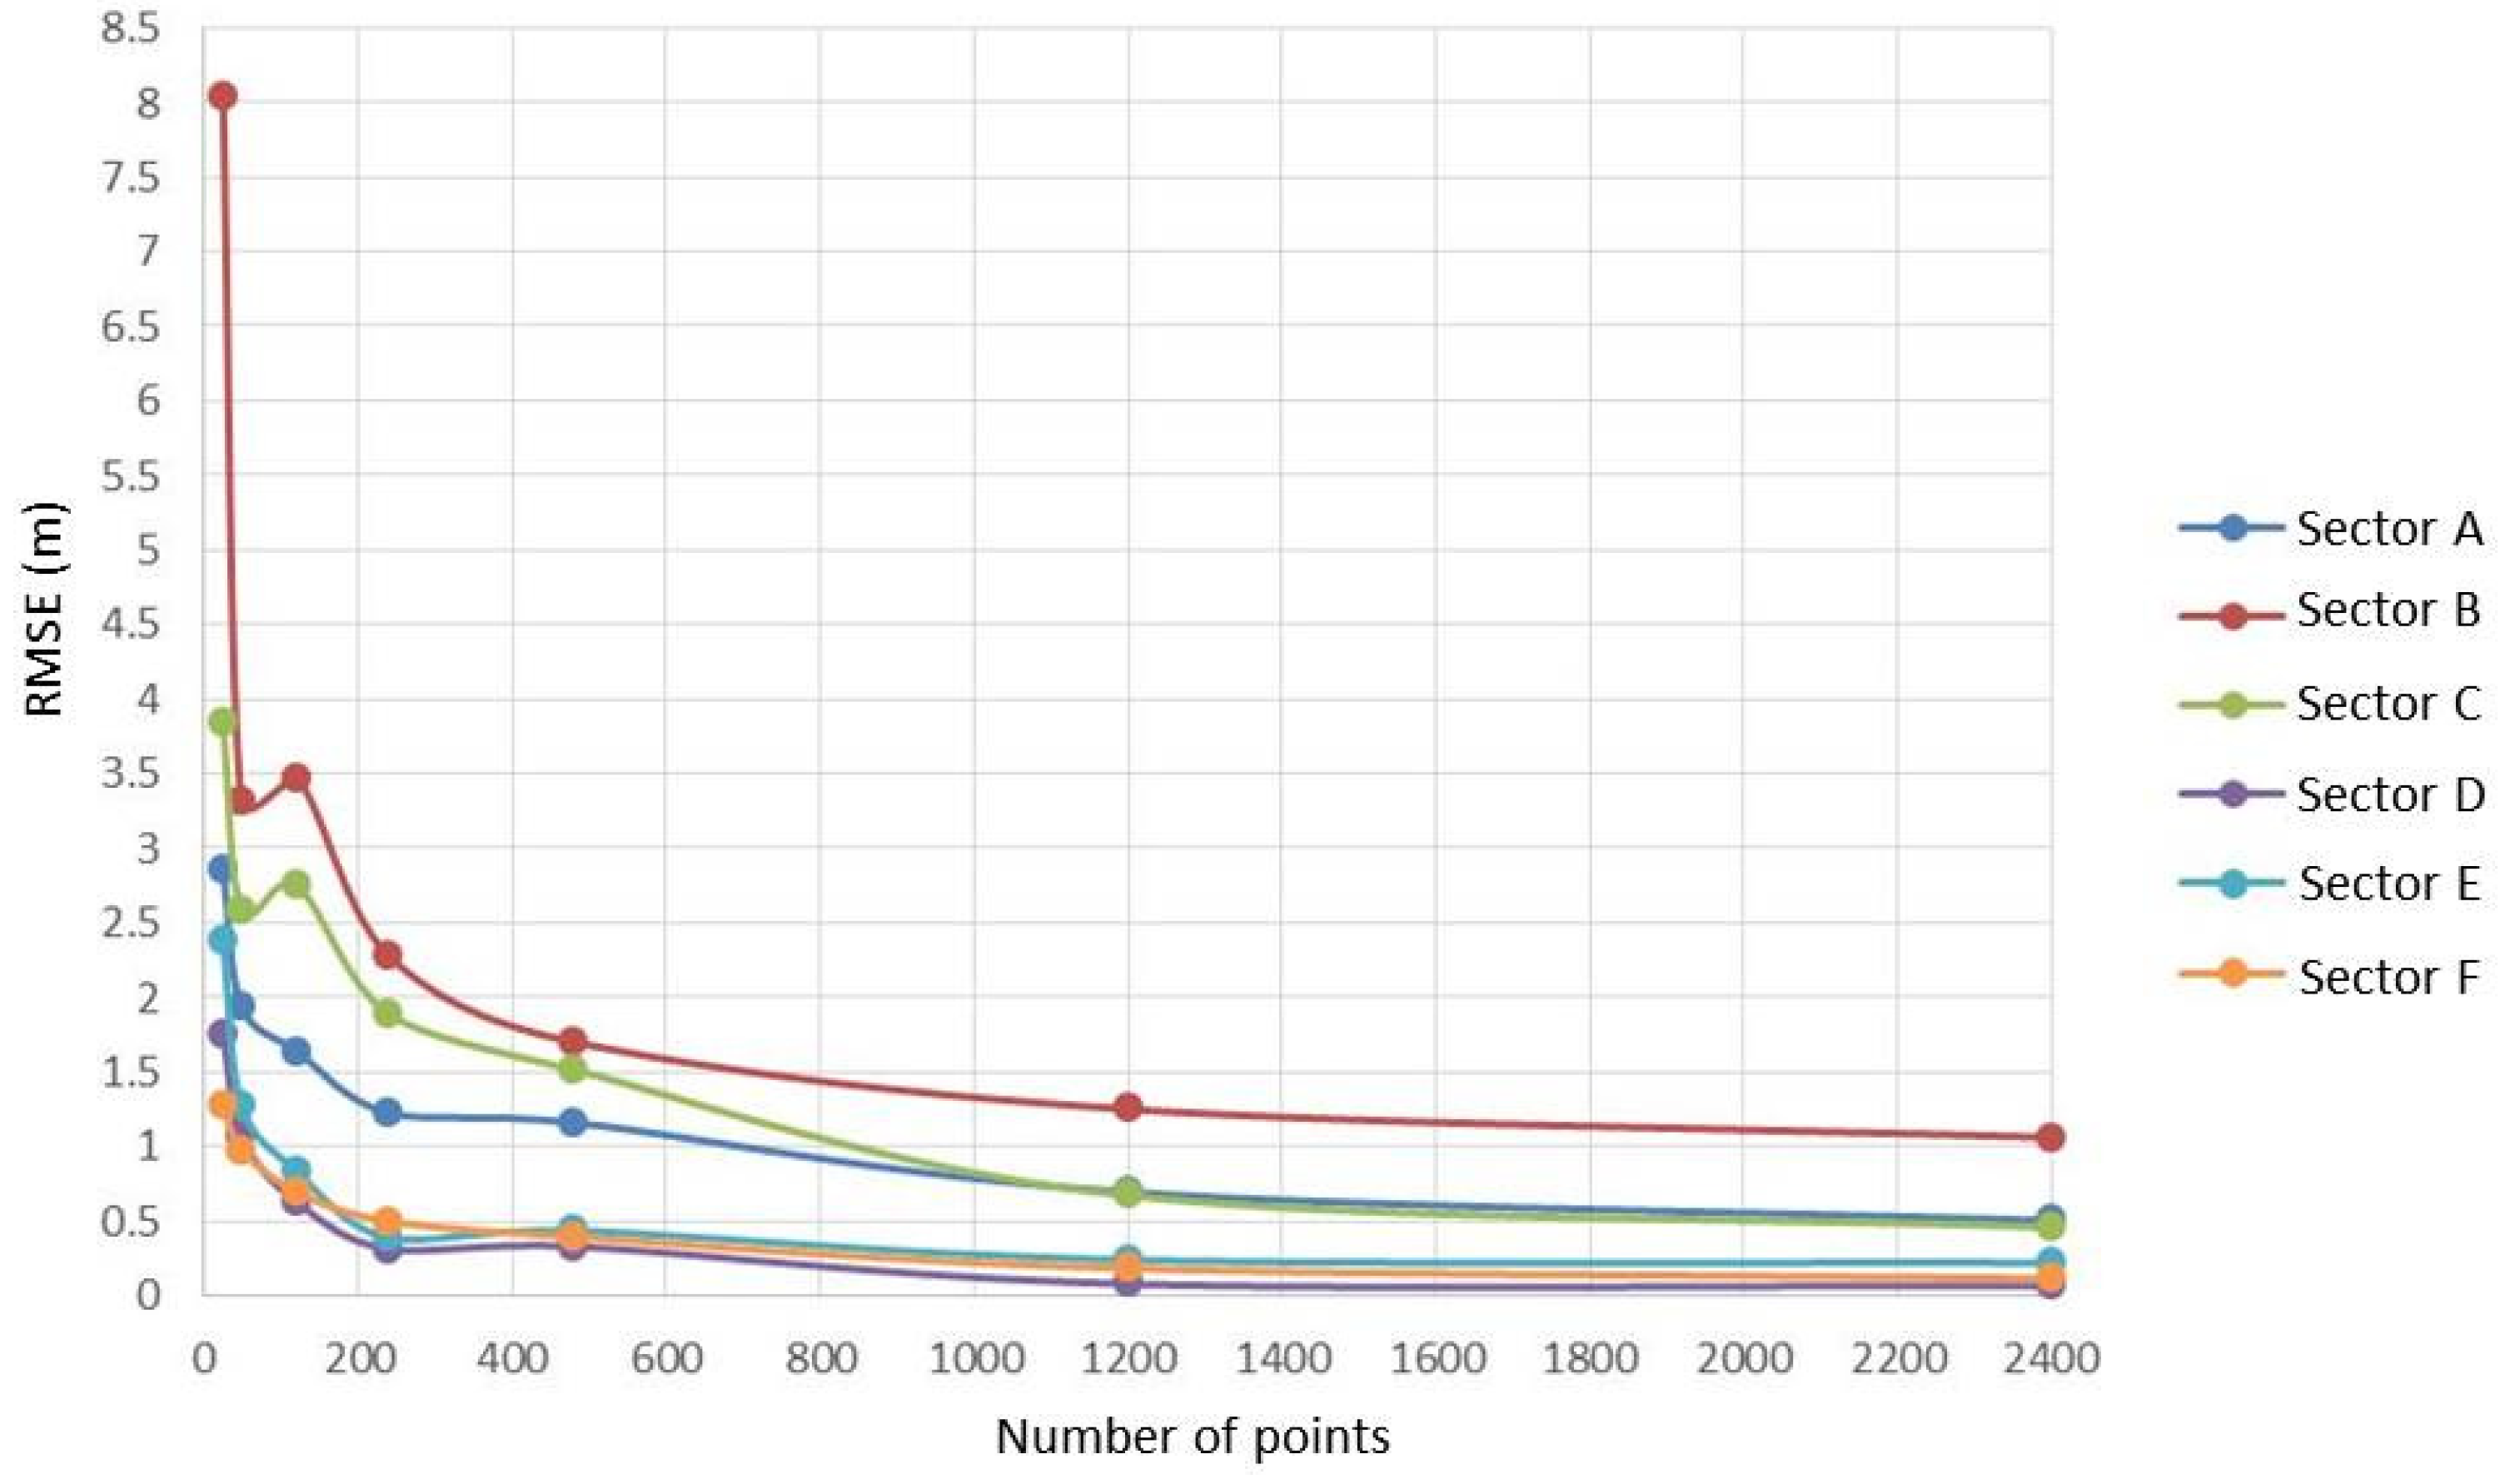
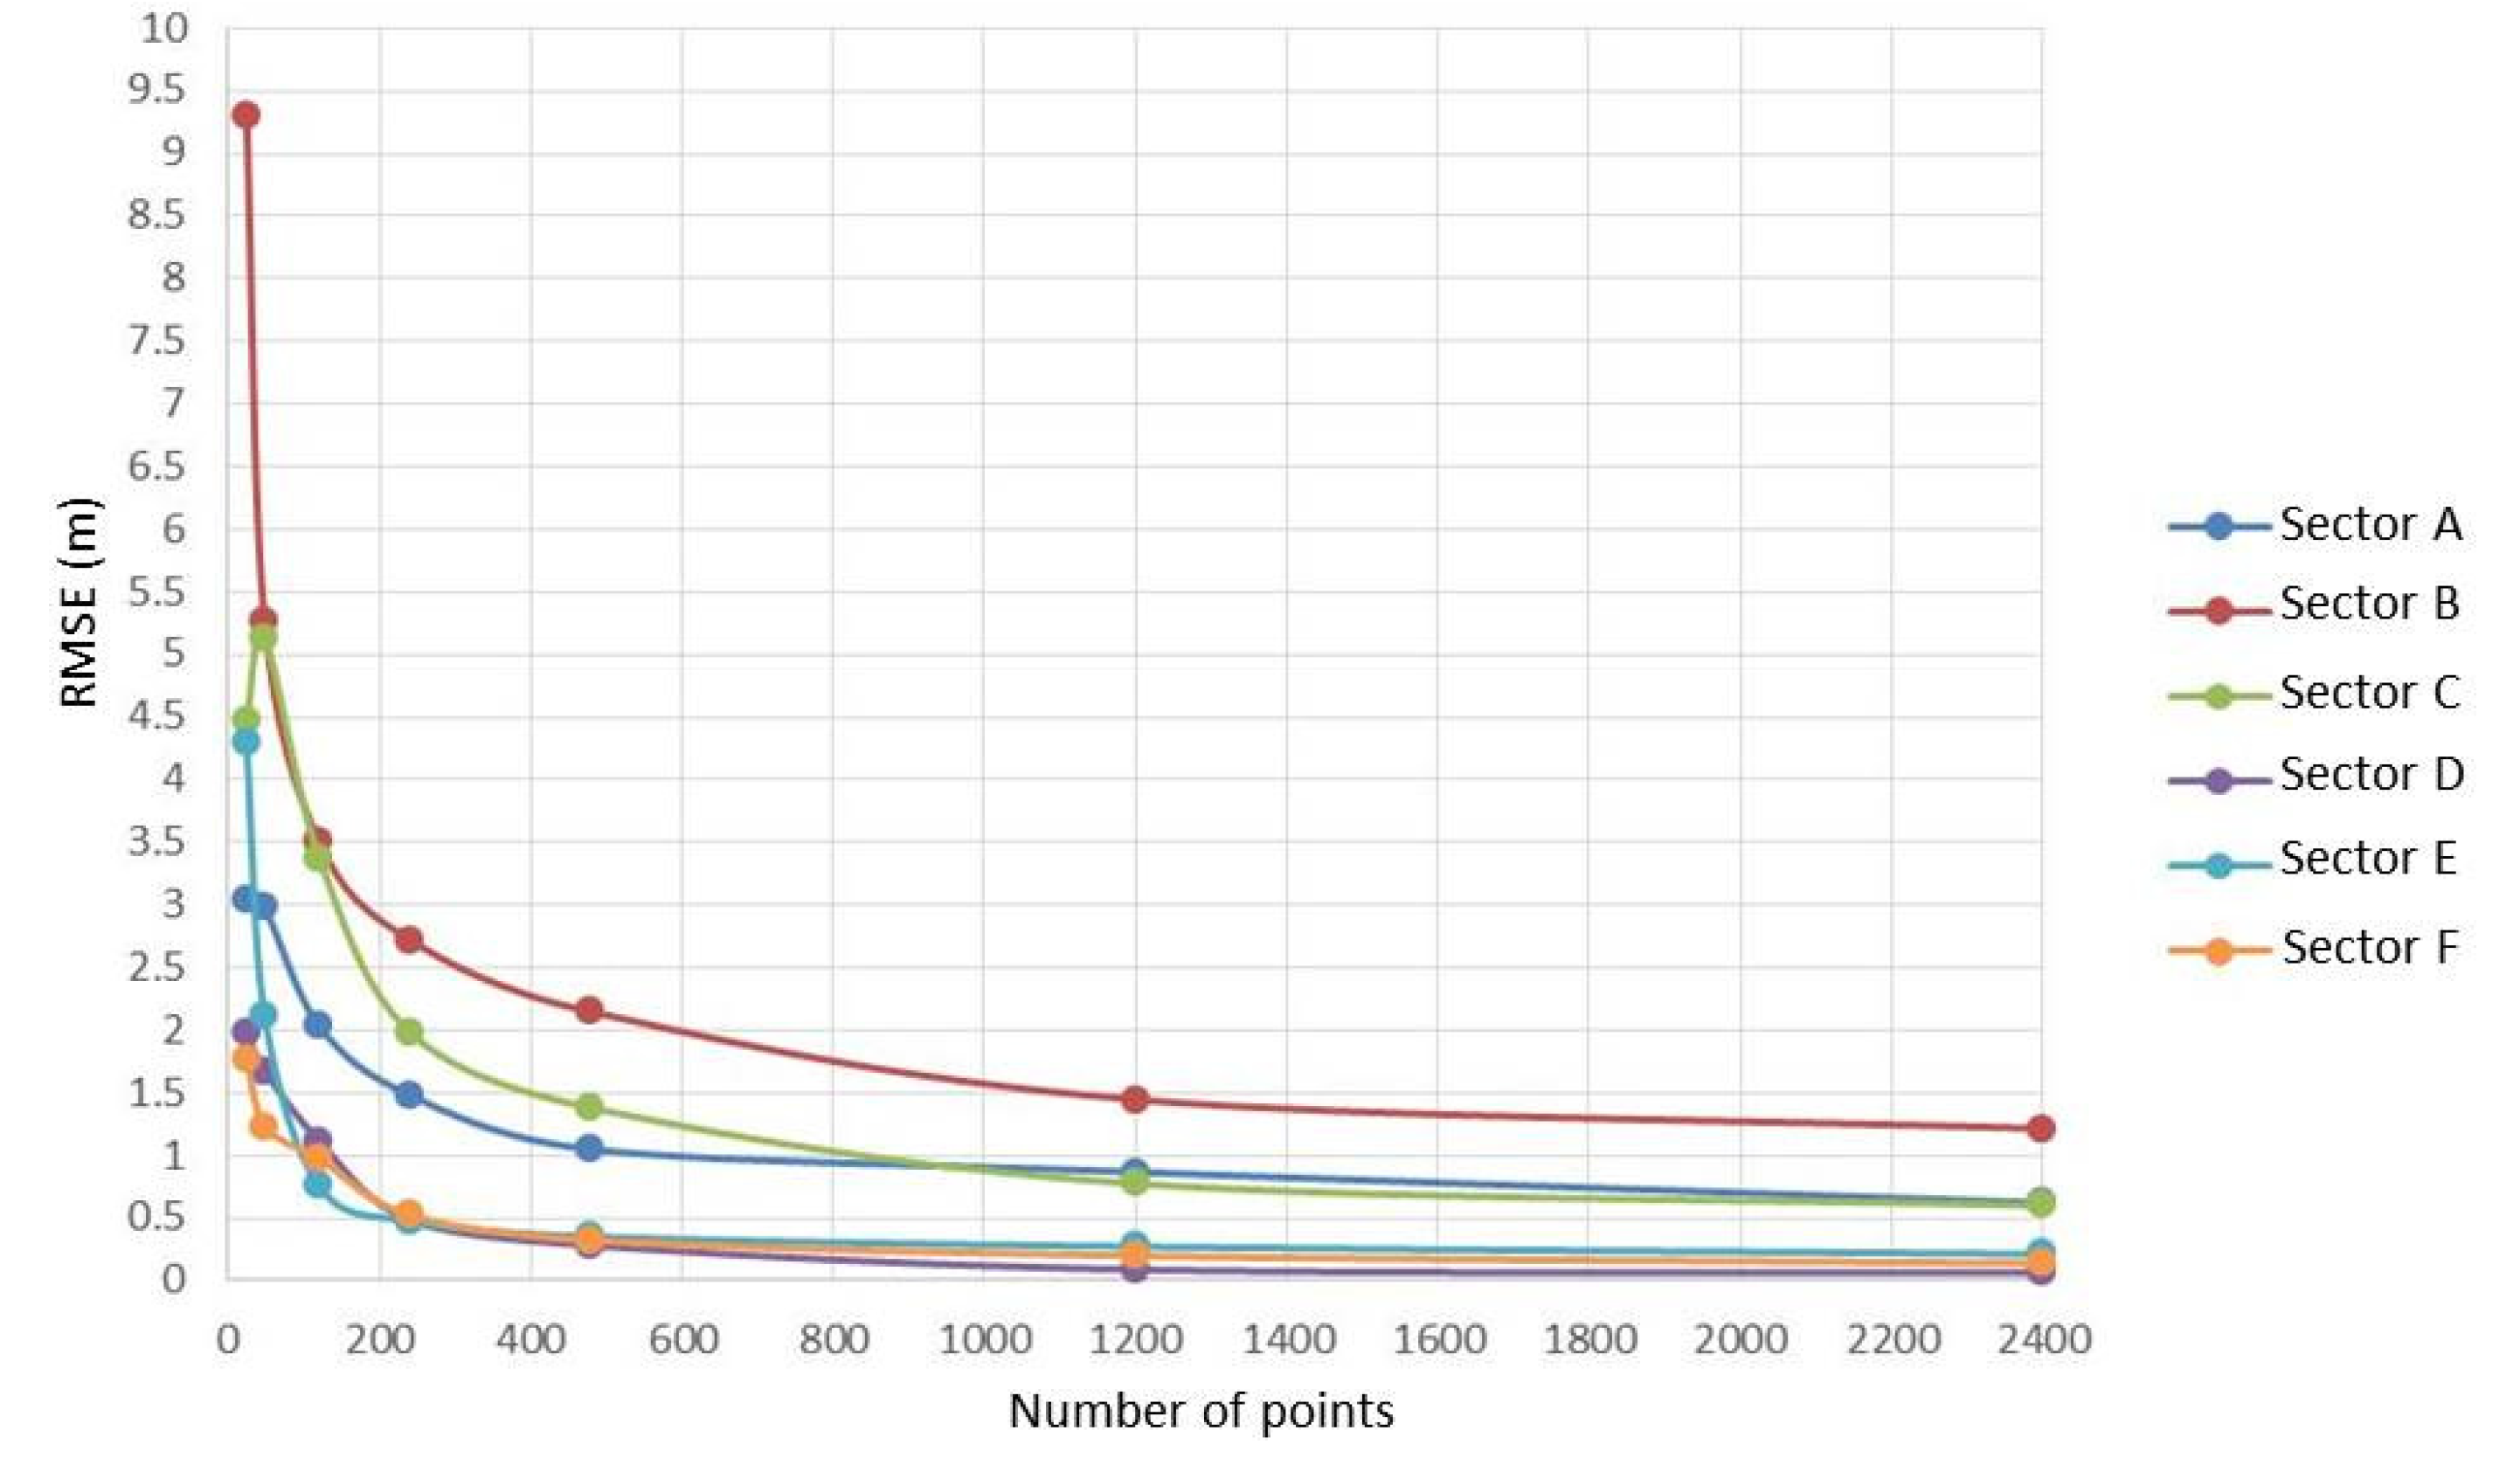
For this reason, a statistical analysis was carried out for each sector through direct comparison with MBD. In particular,
Figure 6 and
Figure 7 show the trend of the RMSE as a function of the number of points obtained in each sector for Ordinary Kriging and Universal Kriging, respectively.
In both cases, the data clearly show that the highest values of RMSE are obtained in sector B while the lowest in sector D: for this reason, we report in
Table 5 and
Table 6 the statistical values relating to these two sectors with 2400 points used.
In analyzing the RMSE values as the number of points varies, it is noted that as the points increase, the RMSE generally decreases, except for some special cases, due to the particular conformation of the seabed and by the totally random distribution of the points. Ordinary Kriging provides slightly better results than Universal Kriging in all sectors. Regardless of the adopted method, it is possible to notice how the RMSE values drop below 1 m when already using 1200 points, except in sector B. By doubling the number of points, the RMSE values in the second sector still remain above 1 m, even if, in the case of the Ordinary Kriging, the RMSE is only 61 mm above the meter (1.061 m).
The statistical values obtained for sector B are always the most extreme: it has the highest maximum, standard deviation, and RMSE values, as well as the lowest minimum value. This is due to the particular conformation of this sector, which can be seen in detail in
Figure 8. Nevertheless, the higher variability of sector B is remarked also by the MVI; starting from MBD, this index is calculated for all sectors to investigate the level of accuracy of the Kriging models related to the morphological aspects.
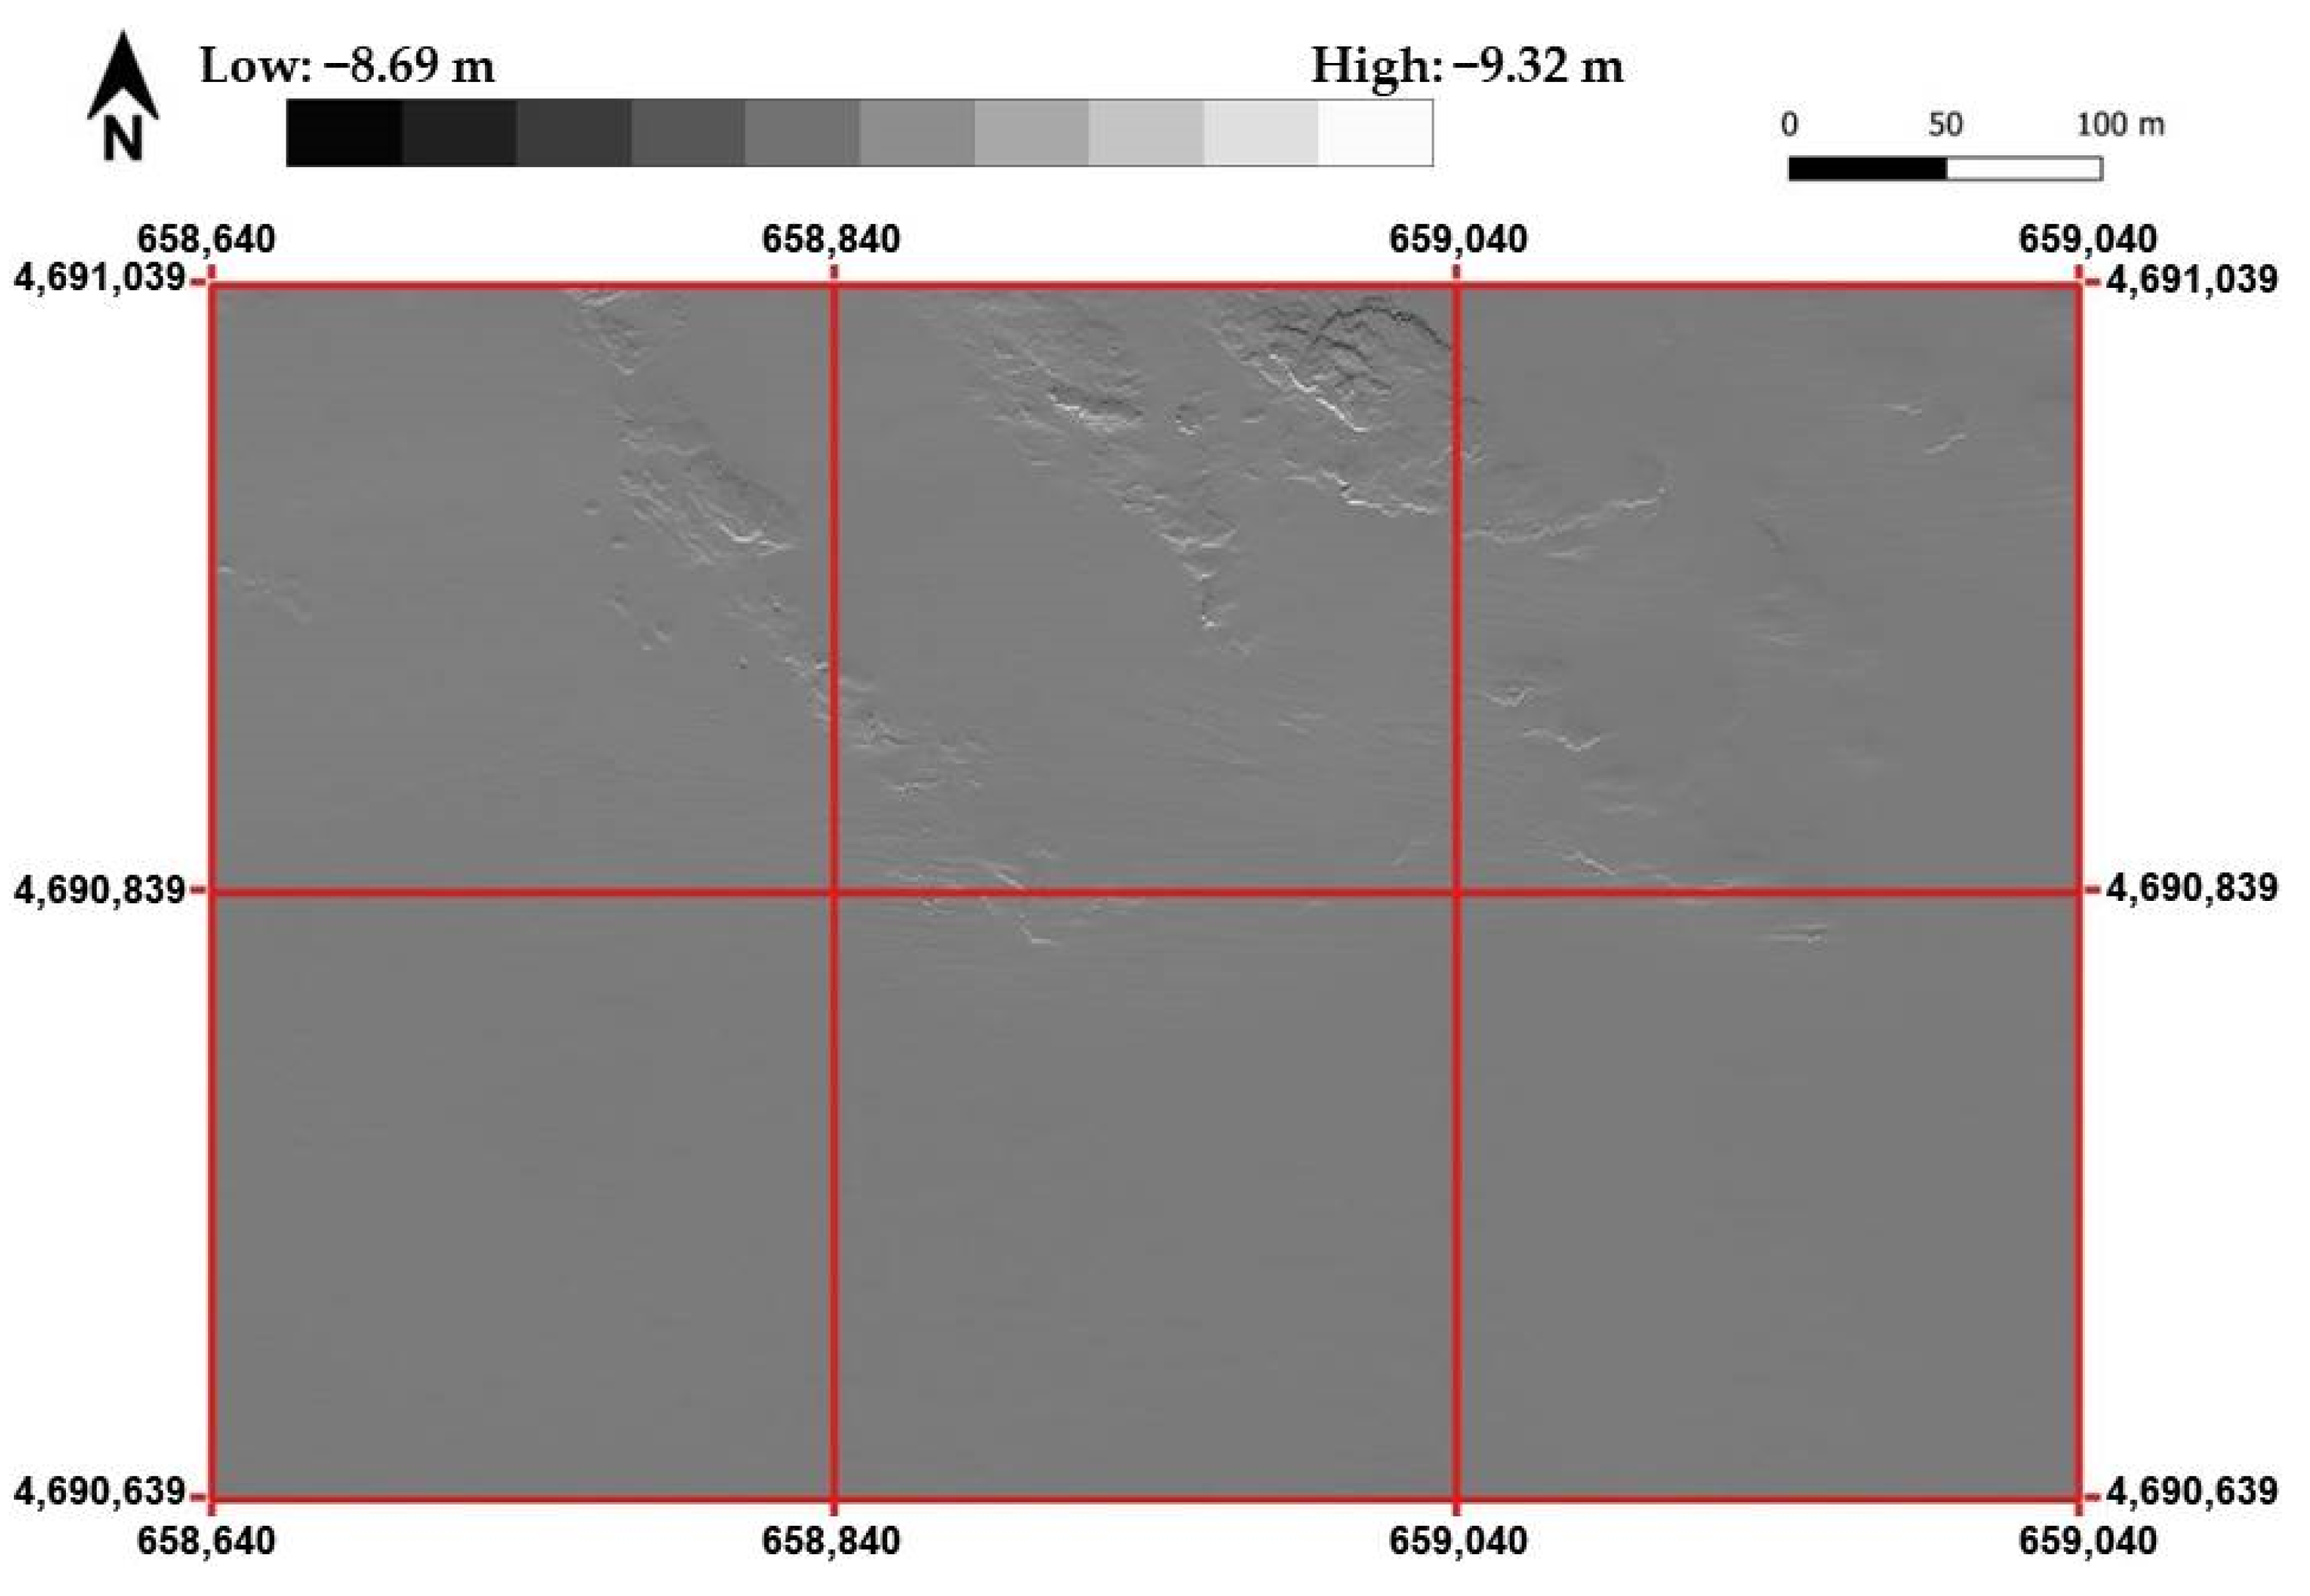
The calculation of the MVI was carried out in successive steps. In particular, the first step consisted of calculating the differences in the depth values of the pixels along x as well as along y, obtaining two images. The image related to the y direction is shown in
Figure 9.
For the sake of completeness, the statistical values of the depth differences between successive pixels are reported in
Table 7 (along x) and
Table 8 (along y).
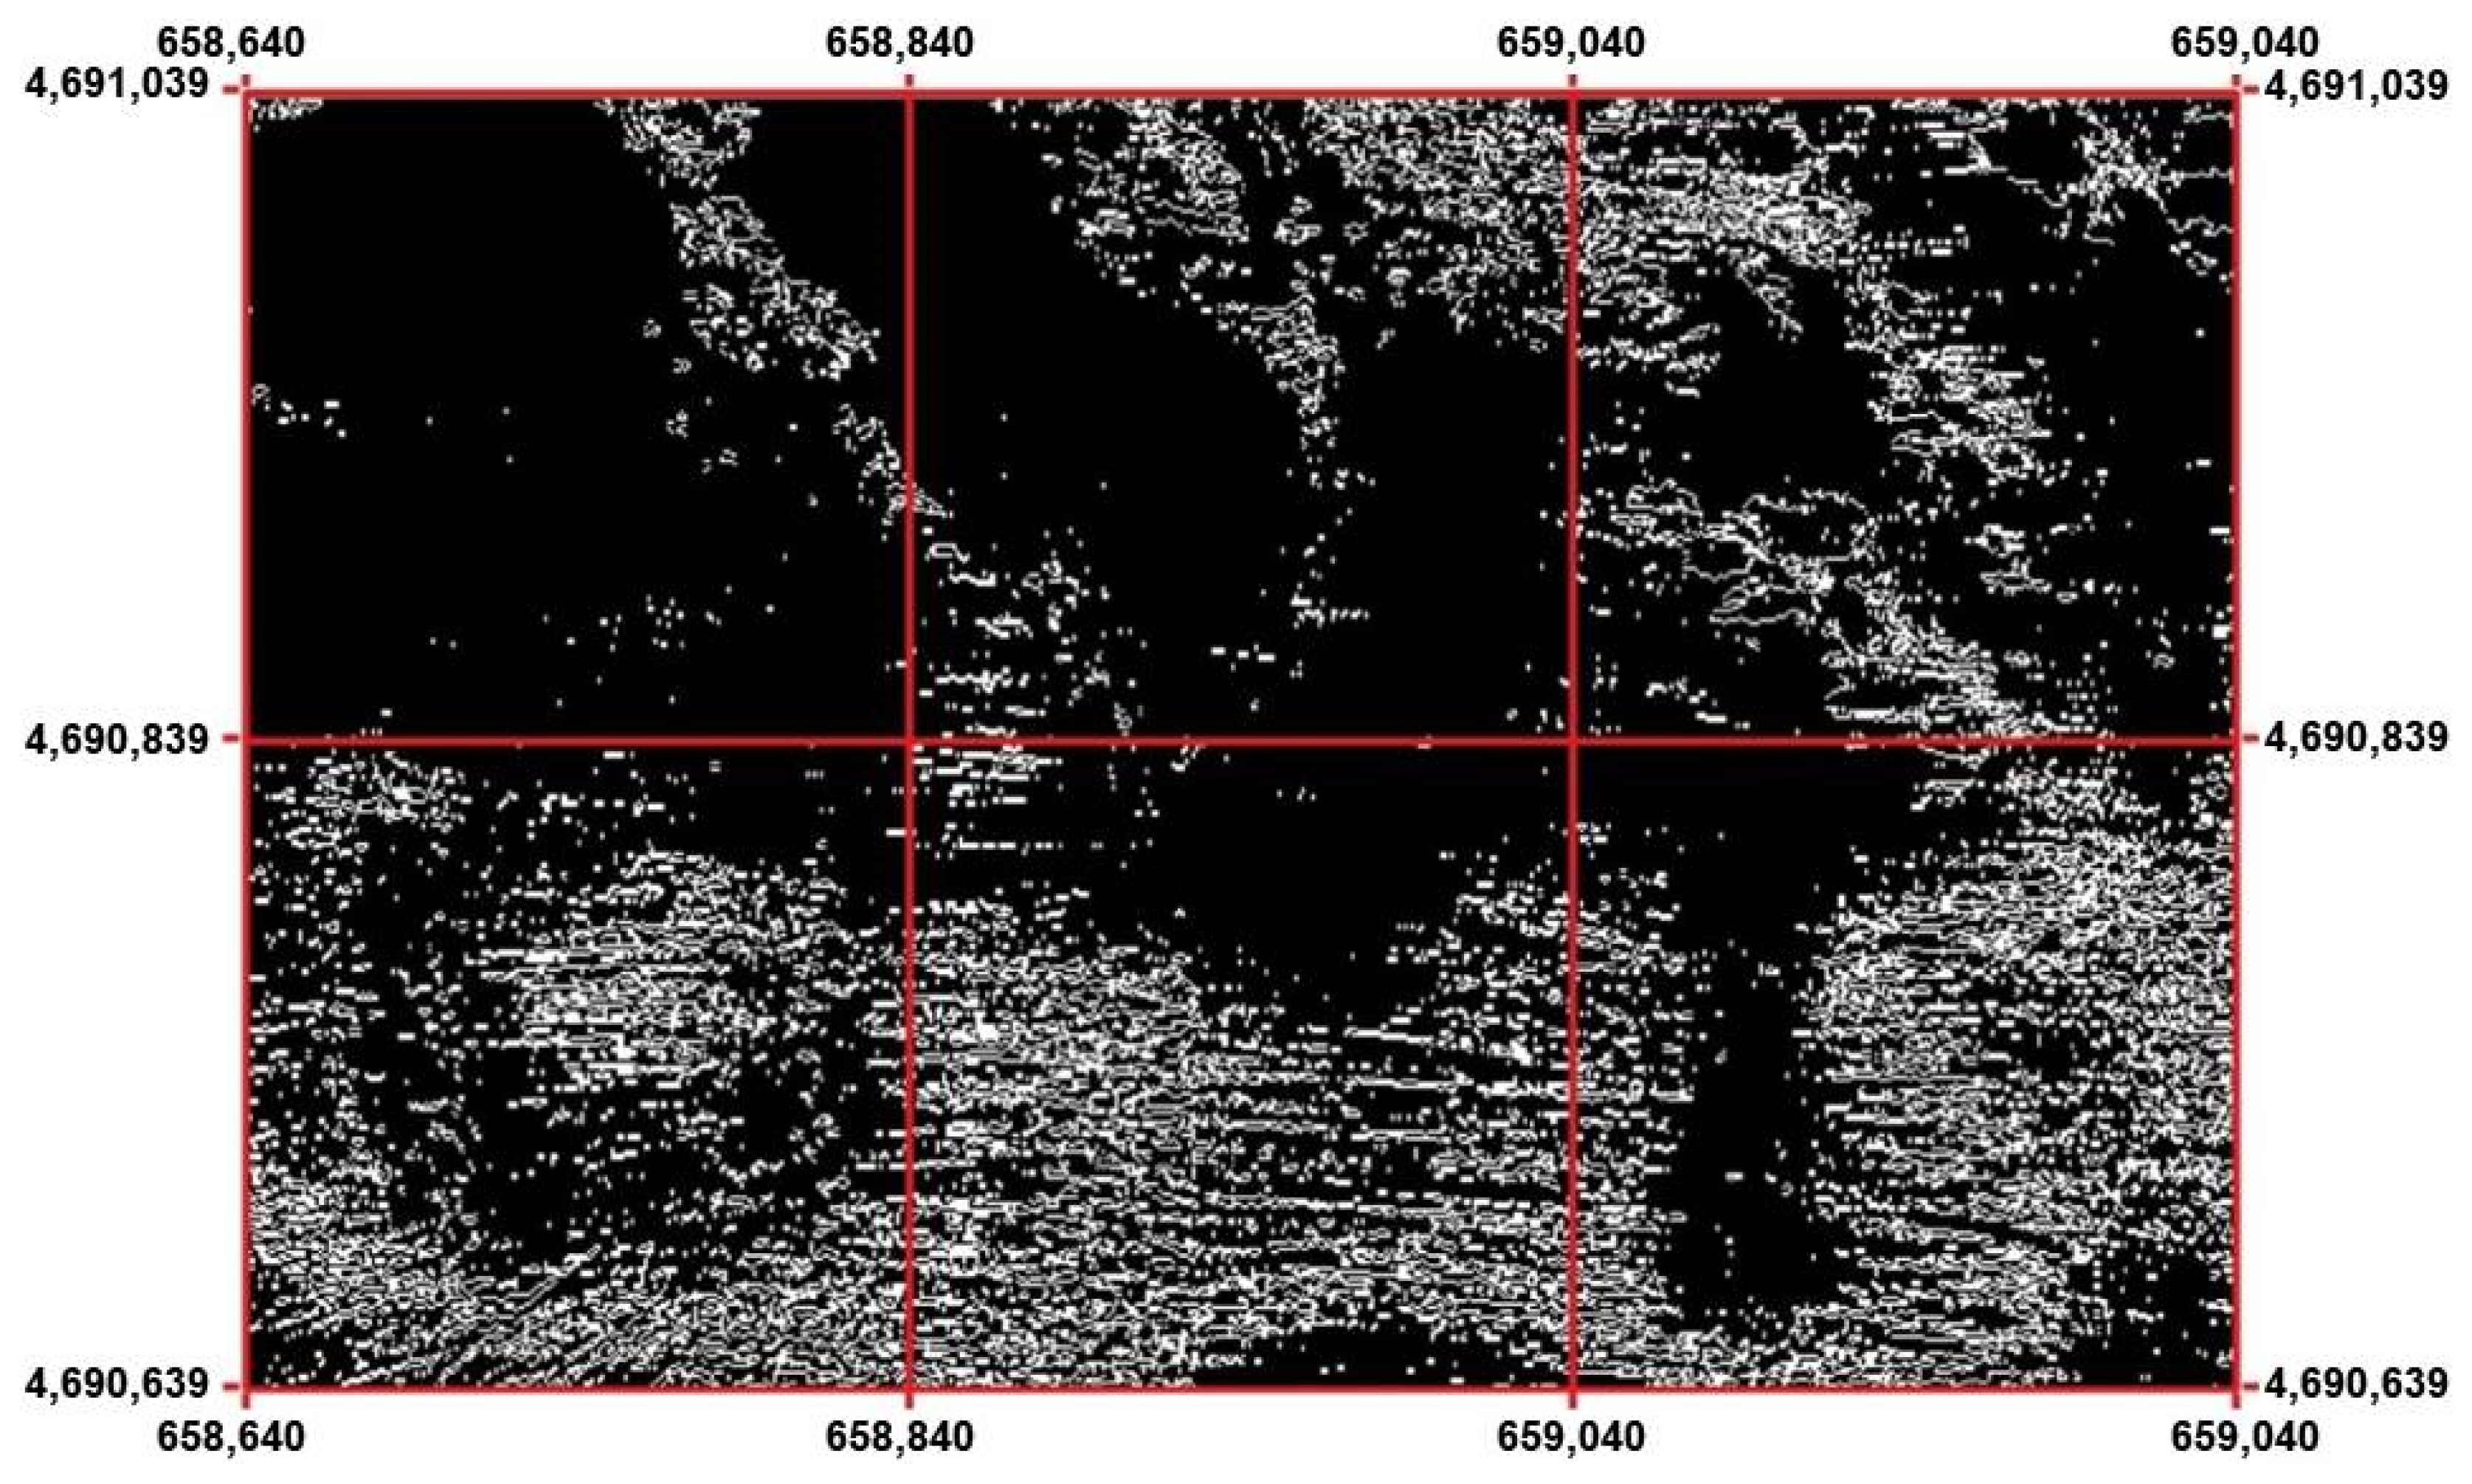
The second step analyzes the variability of the direction of the slope (ascending or descending) along the x and y directions; in particular the slope inversions between successive pixels are identified according to the procedure illustrated in
Section 3.2.2. The image concerning the slope inversions along the y direction is shown in
Figure 10.
Those raster files already provide an important indication for themself, namely the number of slope-reversals for each sector. Since the value 1 indicates the slope inversion and 0 the absence of variation, the mean value of all the pixels present in each sector was calculated as a parameter of the variability of the seabed. The two values calculated (one for the x direction and the other for the y direction) were used to achieve Ixy.
However, this is not enough for the purpose of studying the morphology of the seabed as an almost flat surface could still have many slope inversions, as in the case of sector D; in fact, in the neighboring pixels, they often have very similar depth values. Consequently other steps were necessary for determining the further parameter and Sxy was introduced in the MVI to take into account the level of inclination of the seabed and its variation. The study area has both low slope and steep slopes, often alternating with each other even at short distances, thus high values of abrupt variations were found.
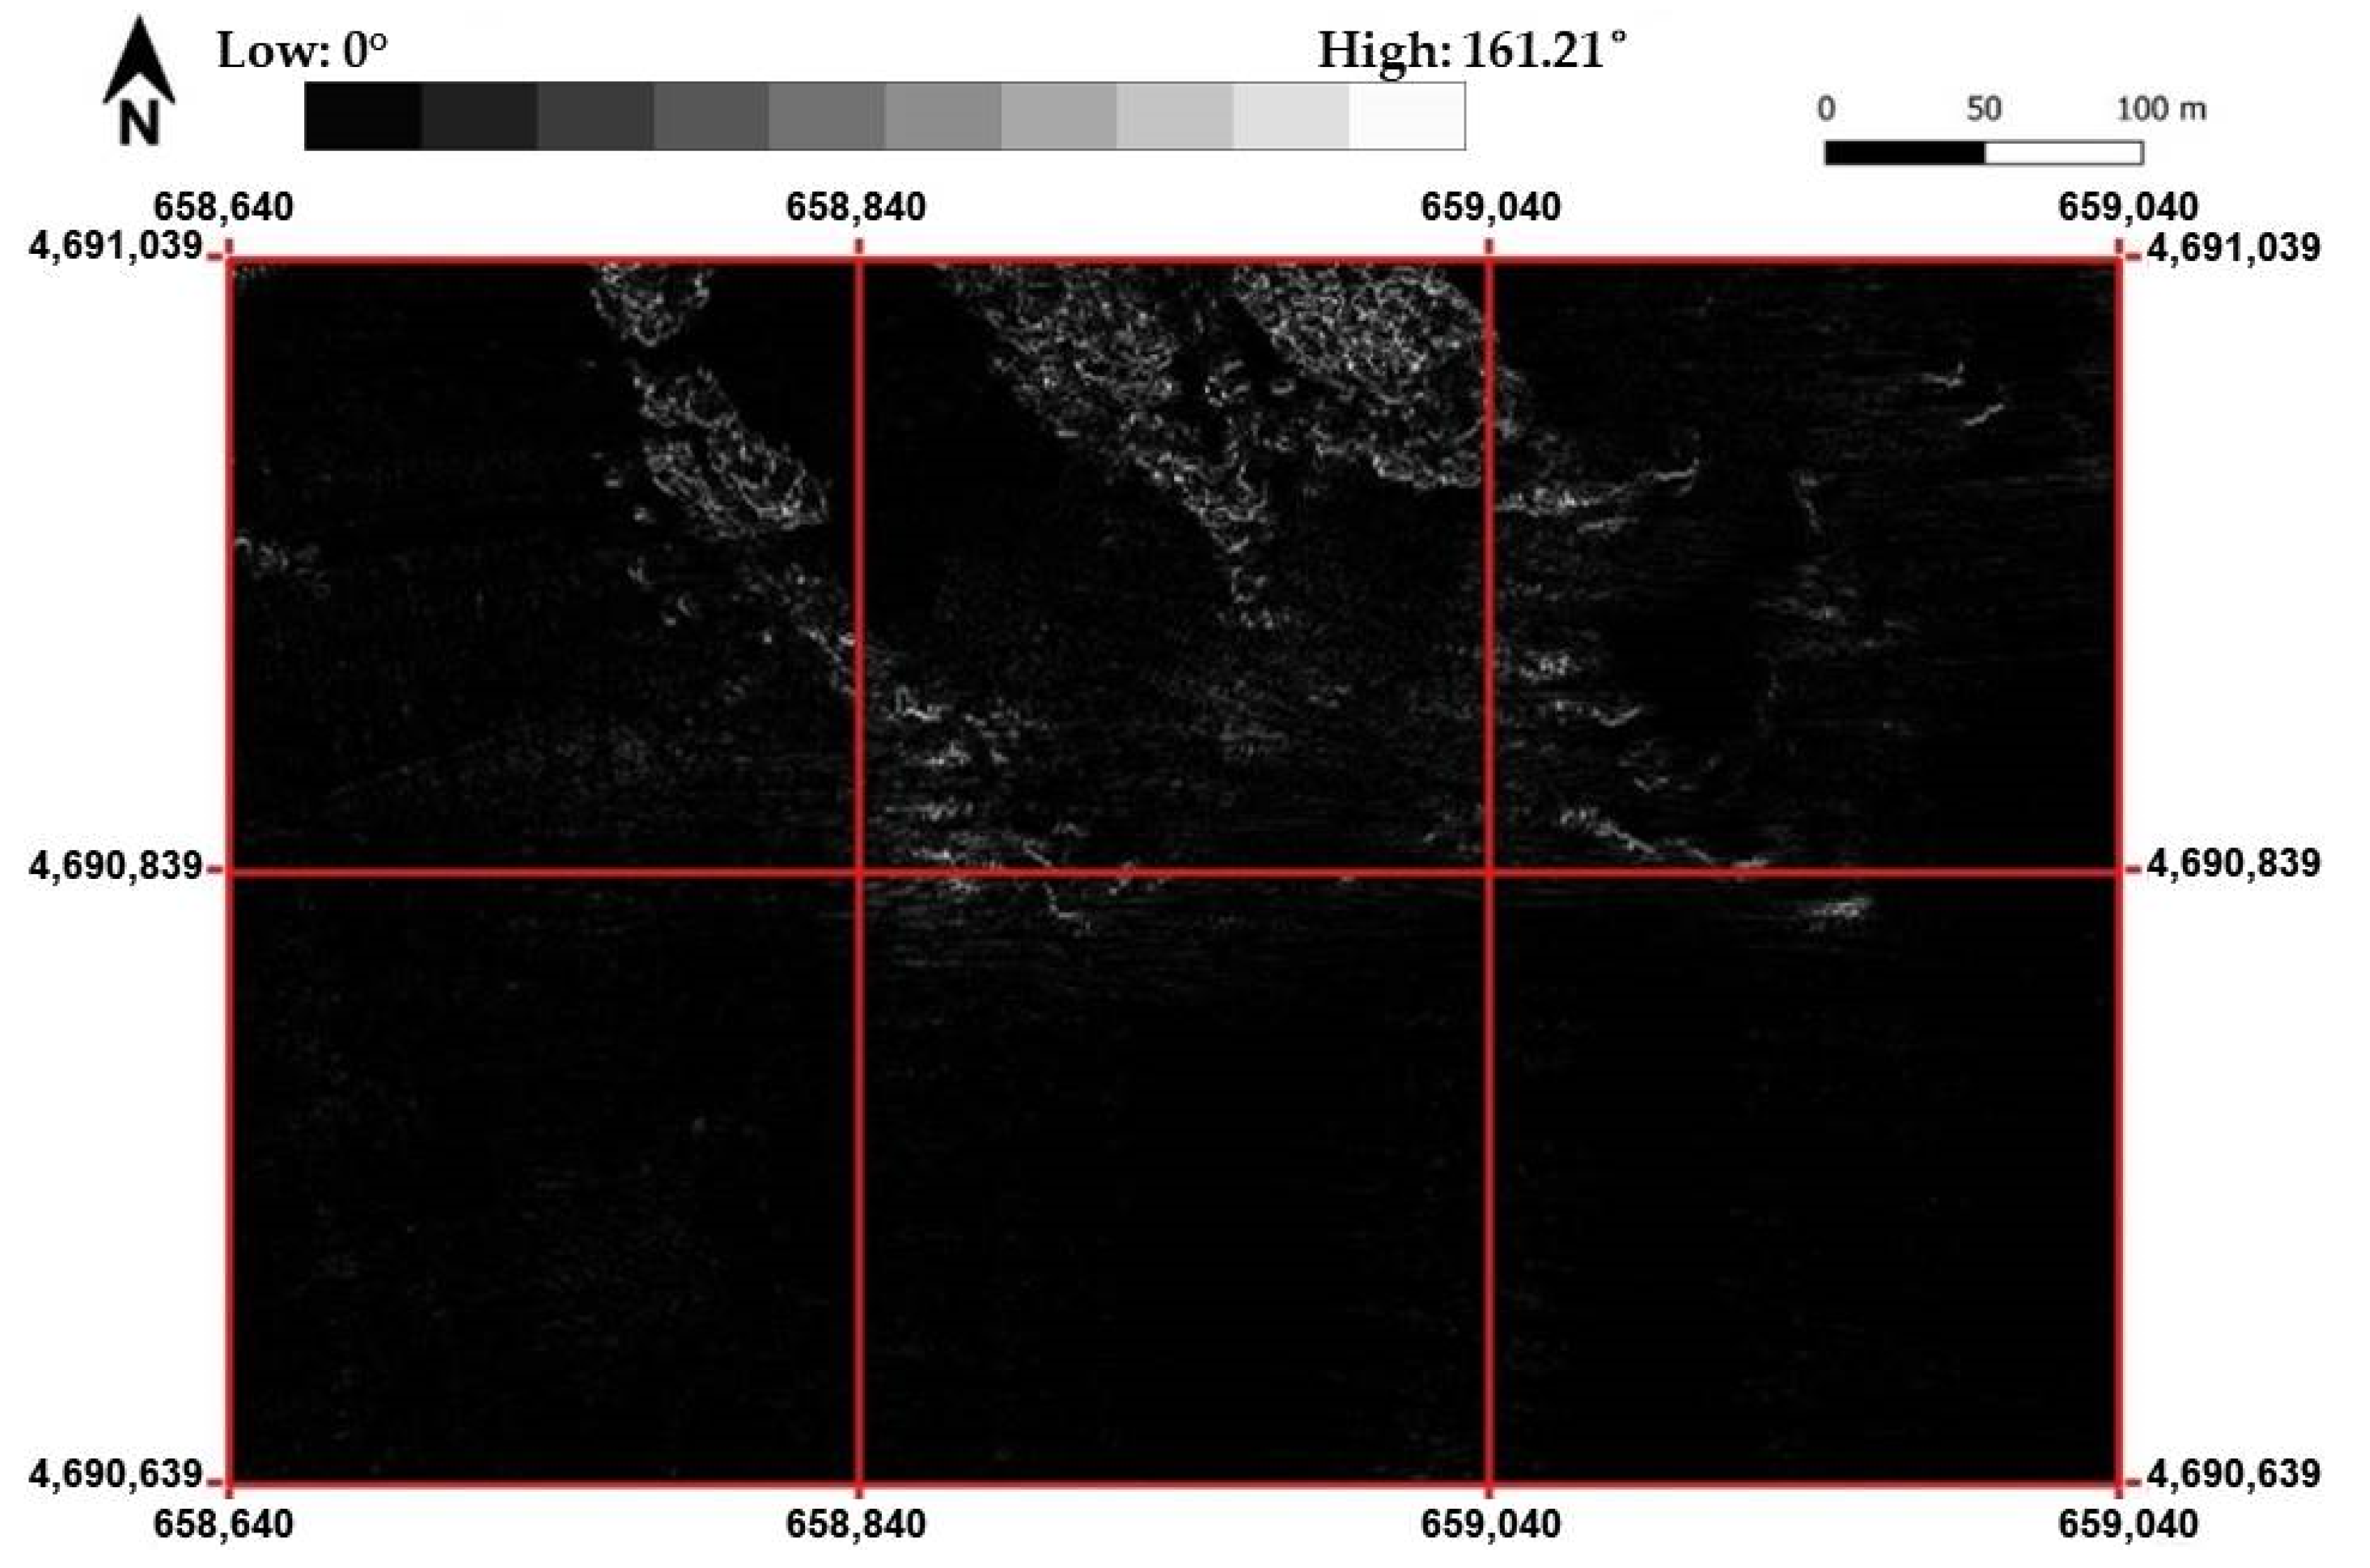
The third step involves calculating the variation of the slope along the x and y directions. Initially, using the raster calculator, the values of the depth difference between consecutive pixels were normalized with respect to the grid step size; the arctangent function applied to them provides the values of the slope in each pixel. Subsequently, in continuing to use the raster calculator, the variations of the slope between consecutive pixels were determined. The image concerning the slope variations along the y direction is shown in
Figure 11.
These values were normalized by dividing by the theoretical maximum limit value of the slope variation (180°). In the end, we derived two images: the first relating to the slope variations along x and the other to the slope variations along y. The average of all the recorded values is Sxy.
From these values, the proposed index MVI was calculated according to Equation (15). The results are shown in
Table 9.
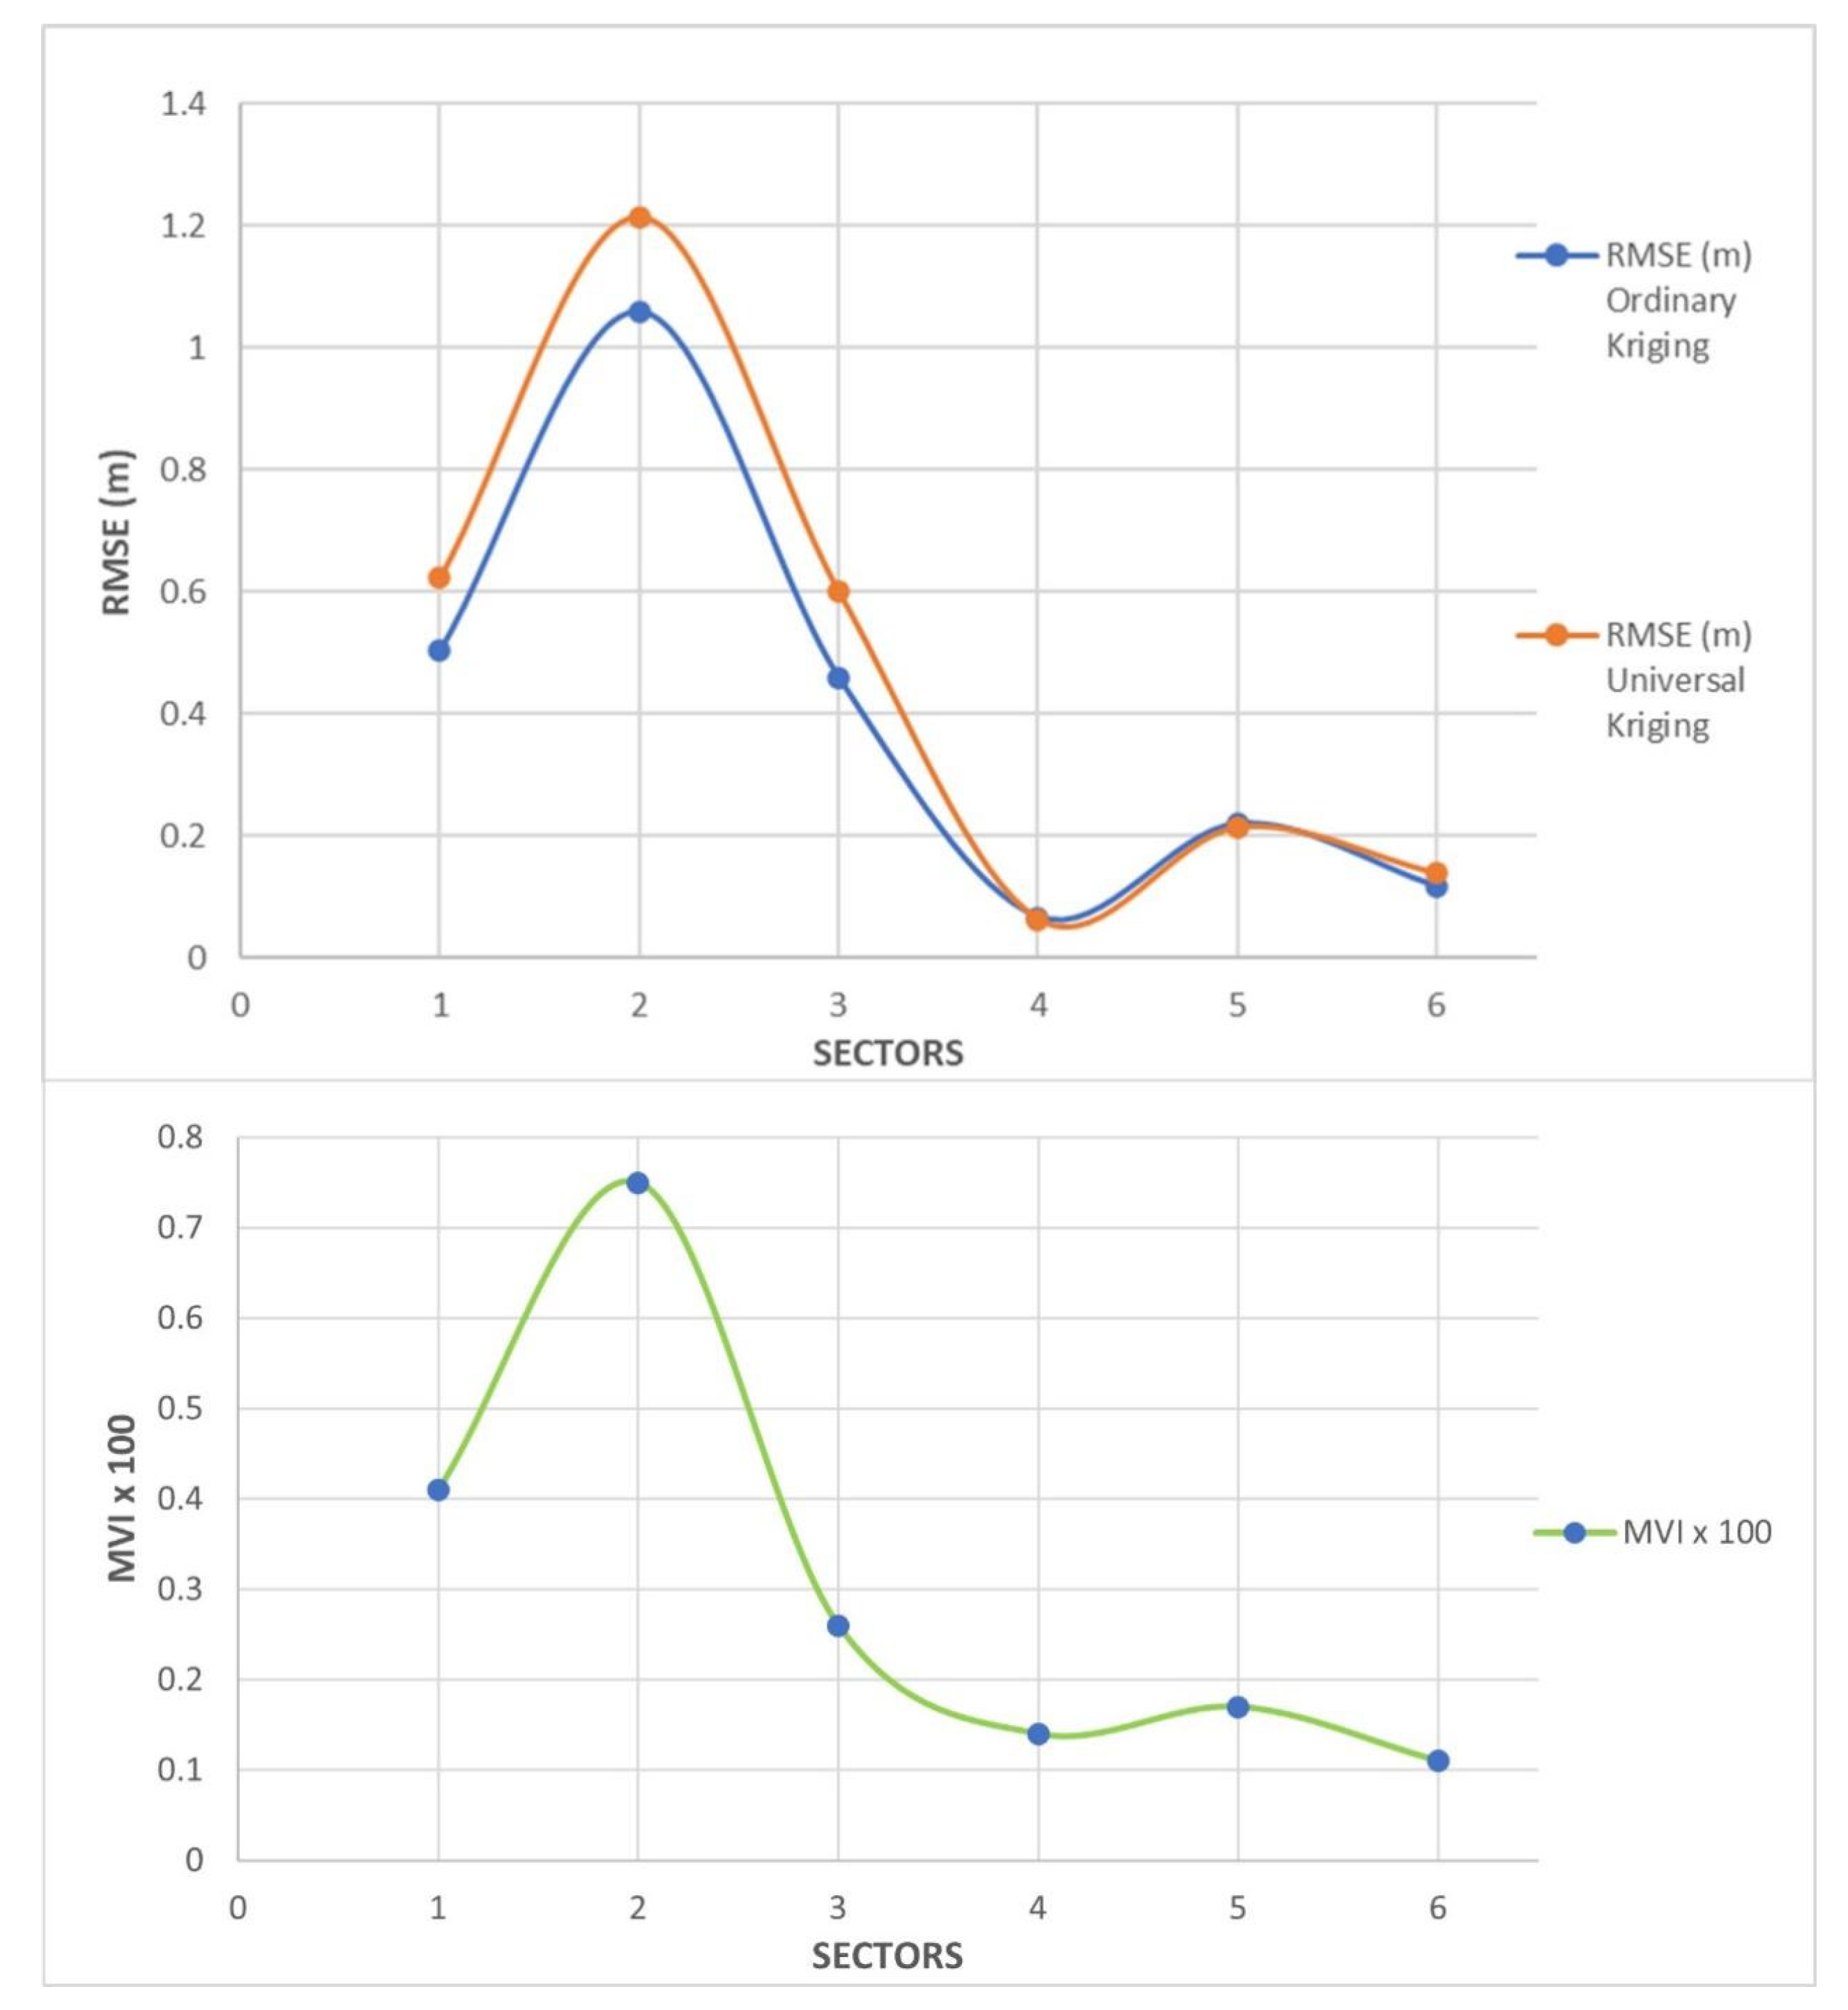
By comparing those values with the RMSE values, it is evident that, once the number of points to be interpolated is fixed, more accurate results are achieved in the presence of a low level of morphological variation. The
Figure 12 highlights this aspect in the case of 2400 points.
At this point of our analysis, we wanted to reconsider the graphs shown in
Figure 6 and
Figure 7 in relation to the MVI indicator.
In the sectors where the lowest values of the indicator are recorded (sector D, E, and F), the RMSE values of the residuals decrease rapidly as the number of known points increases. A density equal to at least 1 point every 1000 m2 is sufficient to make the RMSE values fall below 1 m for both Ordinary Kriging and Universal Kriging. On the contrary, for the sectors where the MVI indicator has the highest values, the RMSE below 1 m is much higher. In sector B, characterized by the highest value of MVI, 1 point per 100 m2 is just enough to obtain an RMSE of approximately 1 m but only in the case of the Ordinary Kriging. In fact, in the case of Universal Kriging, the same concentration determines an RMSE value that remains higher than 1 m (RMSE = 1.214 m).
Finally, we wanted to remark that in the presence of a high MVI, even if RMSE is not higher than 1 m, residuals can reach considerable values in some points, as evidenced by the statistics in sector B, as shown in
Table 5 (−14.037 m for Universal Kriging) and
Table 6 (−14.469 m for Ordinary Kriging).
5. Conclusions
In the case of very varied seabed morphology, it is essential, for different purposes (e.g., safe navigation or geological studies), to have a detailed and accurate bathymetric model. To achieve these results, particular attention must be given to the interpolation algorithms used to reproduce 3D models, starting from a dataset consisting of a point cloud.
The results of our study validate the efficiency of the Kriging methods, remarking the influence of the dataset location and density on the 3D model accuracy in the case of the interpolation process. To investigate this relationship, a new index called MVI was introduced as a measurement of the level of variation of seabed morphology; this index results from the product of two components: the first component (Ixy) is related to the frequency of the variation of the slope direction (ascending or descending) and the second (Sxy) is associated to the variation of the value of the slope, both considered for the x direction as well as y direction.
The experiments demonstrate that by using Universal Kriging as well as Ordinary Kriging, a density equal to at least 1 point every 1000 m2 is sufficient to produce an accurate model in areas characterized by a low level of variation of seabed morphology (not only RMSE but also minimum and maximum values fall below 1 m). On the contrary, a density 10 times greater than that is necessary to produce an accurate model in areas characterized by a high level of variation of seabed morphology; in this case, even if the RMSE drops below 1 m, there may be strong differences between the predicted and observed depths in some places, thus a further increment of the measured points is required.
MVI is useful to represent the seabed variation as a unique value but to calculate it in an accurate way, the morphology must be already known. In our study, we have determined its value because a grid model derived by MB survey is already available. Consequently, we used it to establish the relationship between point density and model accuracy; if we want to define a priori the optimal number of depths to measure in an unknown area for a bathymetric survey, we can try to calculate MVI using information available, e.g., previous survey data and/or nautical charts even on a smaller scale. In this case, you must know that the calculated MVI is an approximate value and does not provide the exact photograph of reality, thus the advantage of using it may be limited.
Concerning the future developments of this work, further studies will be focused on the relationship between bathymetric point density and seabed model accuracy. In particular, other datasets representative of different seabed configurations will be considered both in terms of depth range (in the proposed study, depths not exceeding 108 m were analyzed) and in terms of the extension of the study area. Higher values of point density will be investigated to achieve better results also in roughness areas. In addition, further tests will be carried out to validate the efficiency of the proposed MVI to represent the variation of seabed morphology.
