

Relations between Fault and Fracture Network Affecting the Lastoni di Formin Carbonate Platform (Italian Dolomites) and Its Deformation History


Abstract
1. Introduction
2. Geological and Structural Setting
Tectonic Evolution of the Dolomites
3. Materials and Method
3.1. Data
3.2. Method
3.2.1. 2D Structural Analysis
3.2.2. 3D Structural Analysis
4. Results
4.1. Fracture Orientation
4.2. Fracture Displacement and Kinematics
4.3. Fracture Intensity
4.4. Fracture Network Topology
5. Discussion
Relative Timing and Deformation History
6. Conclusions
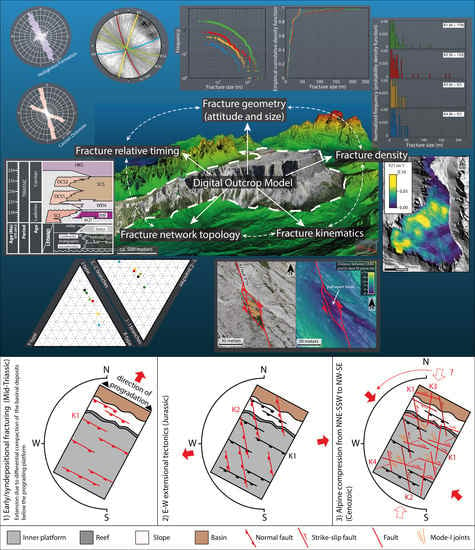
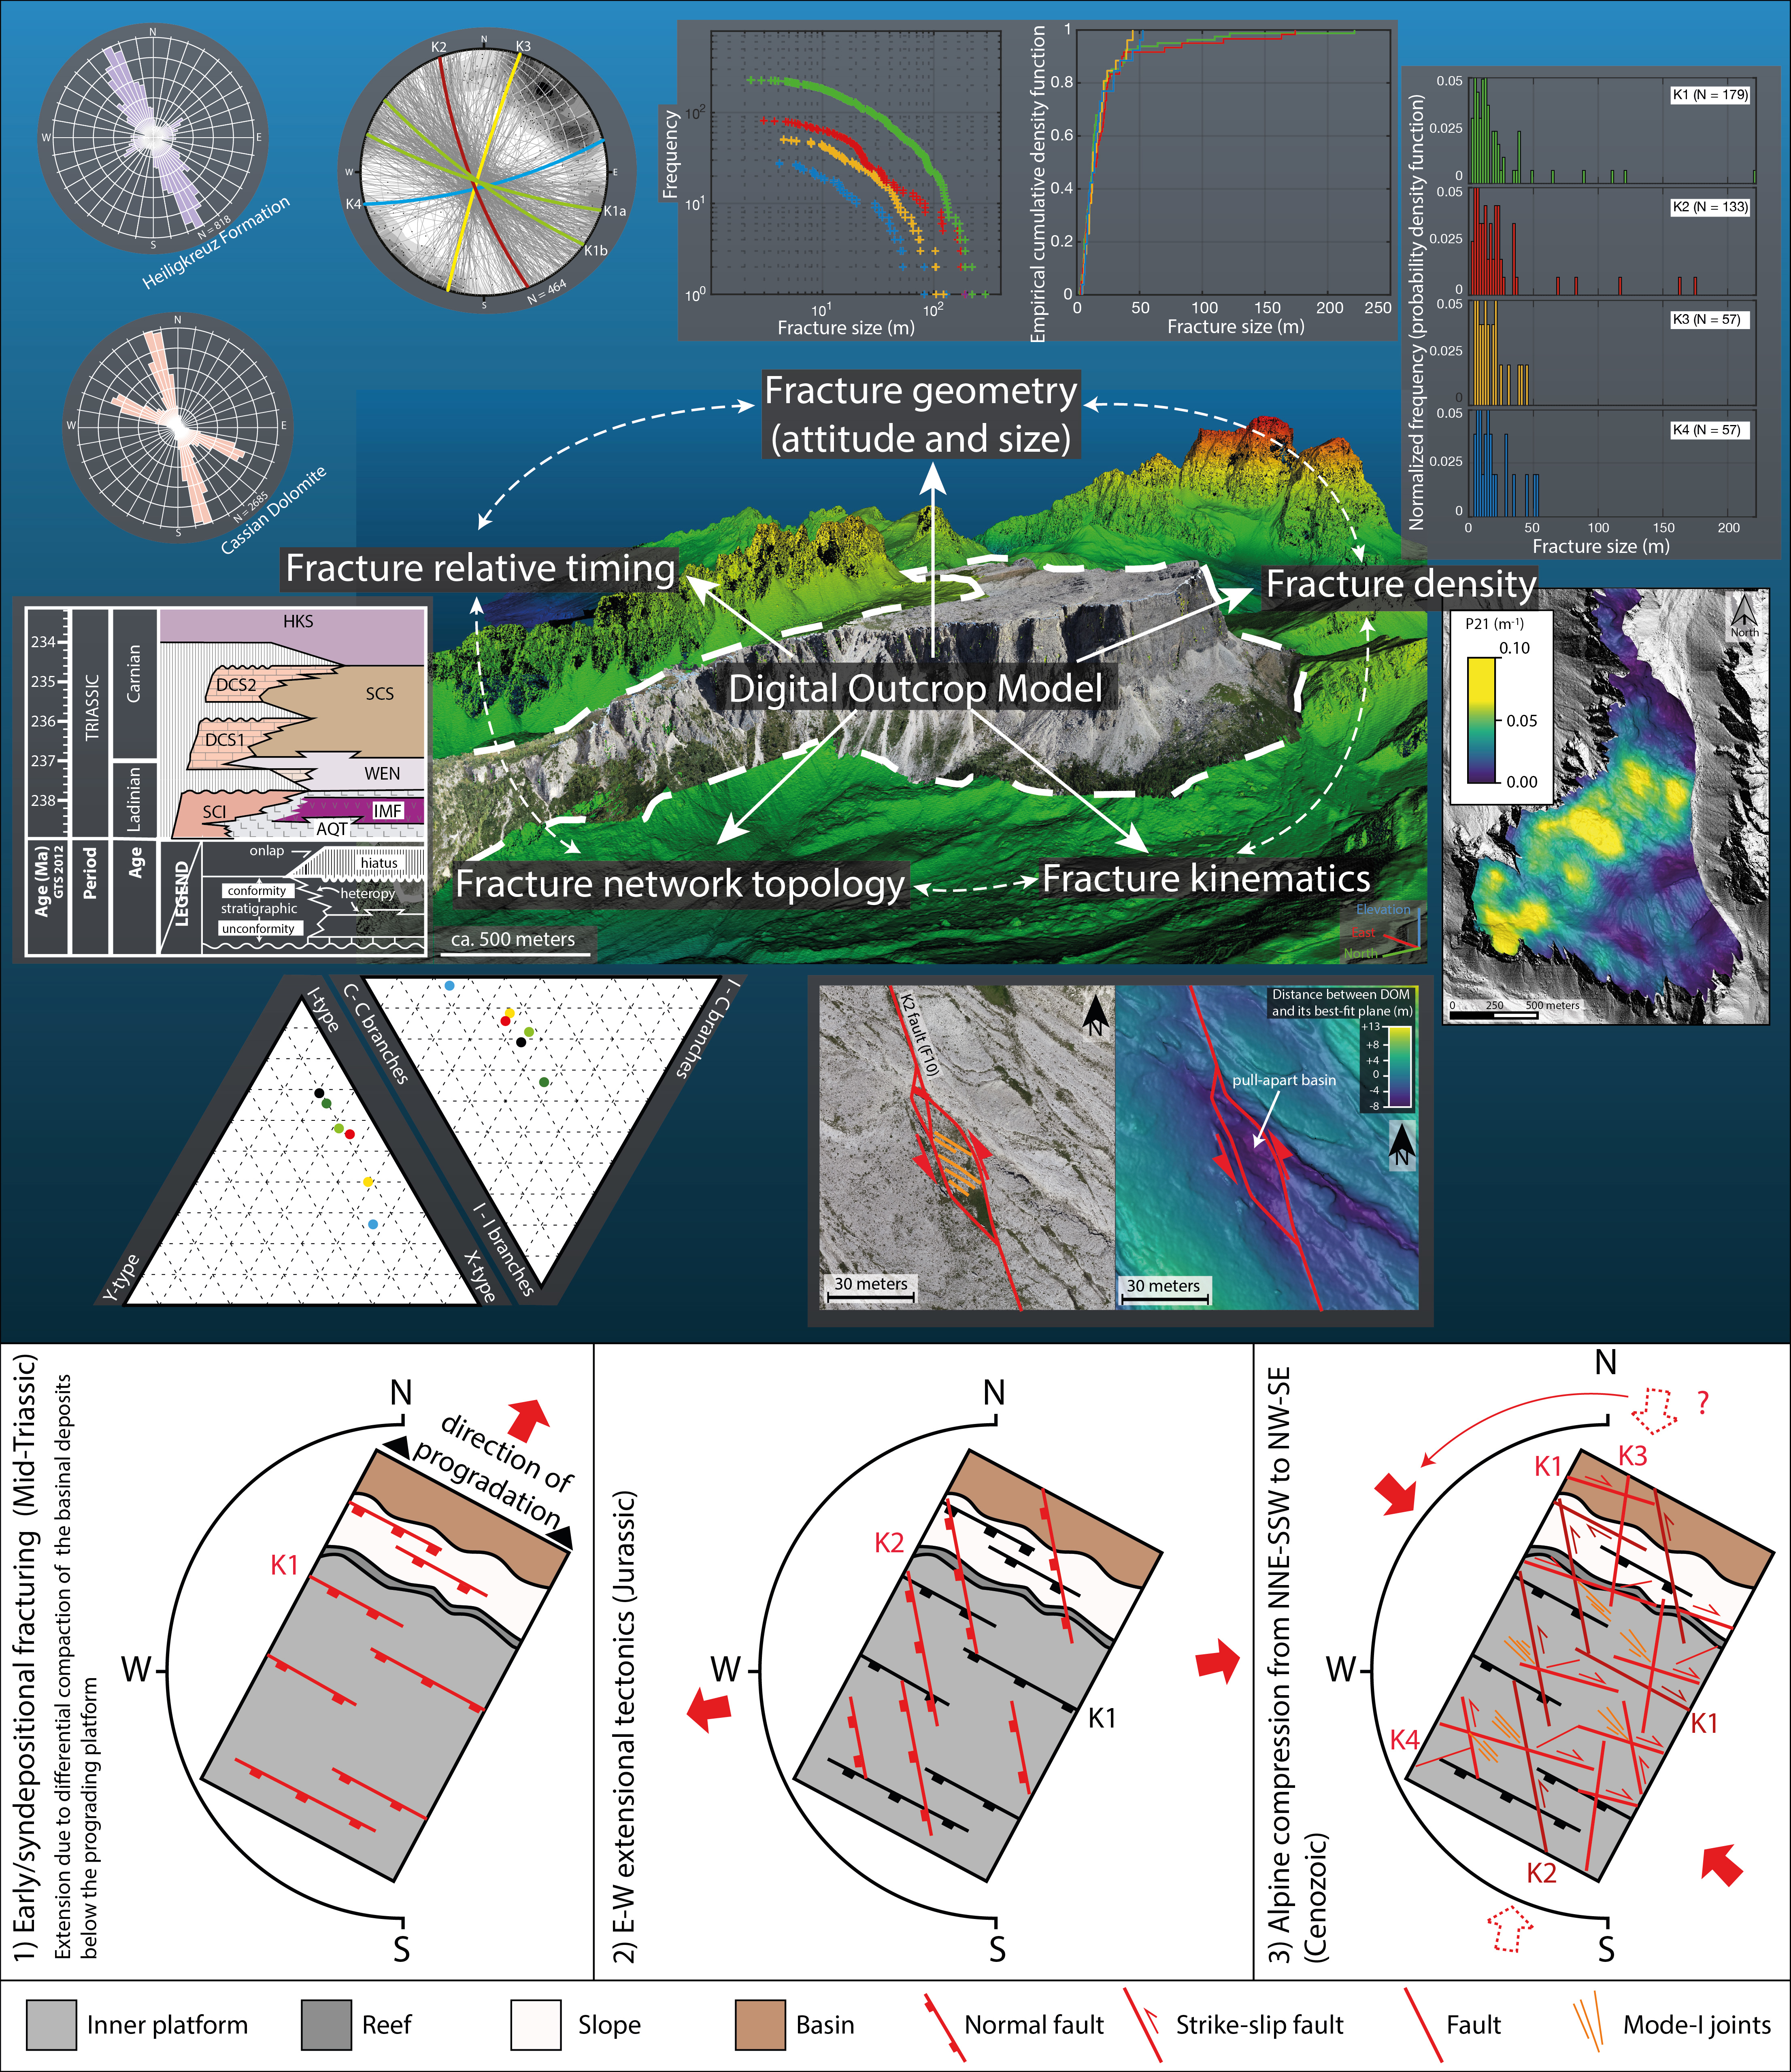
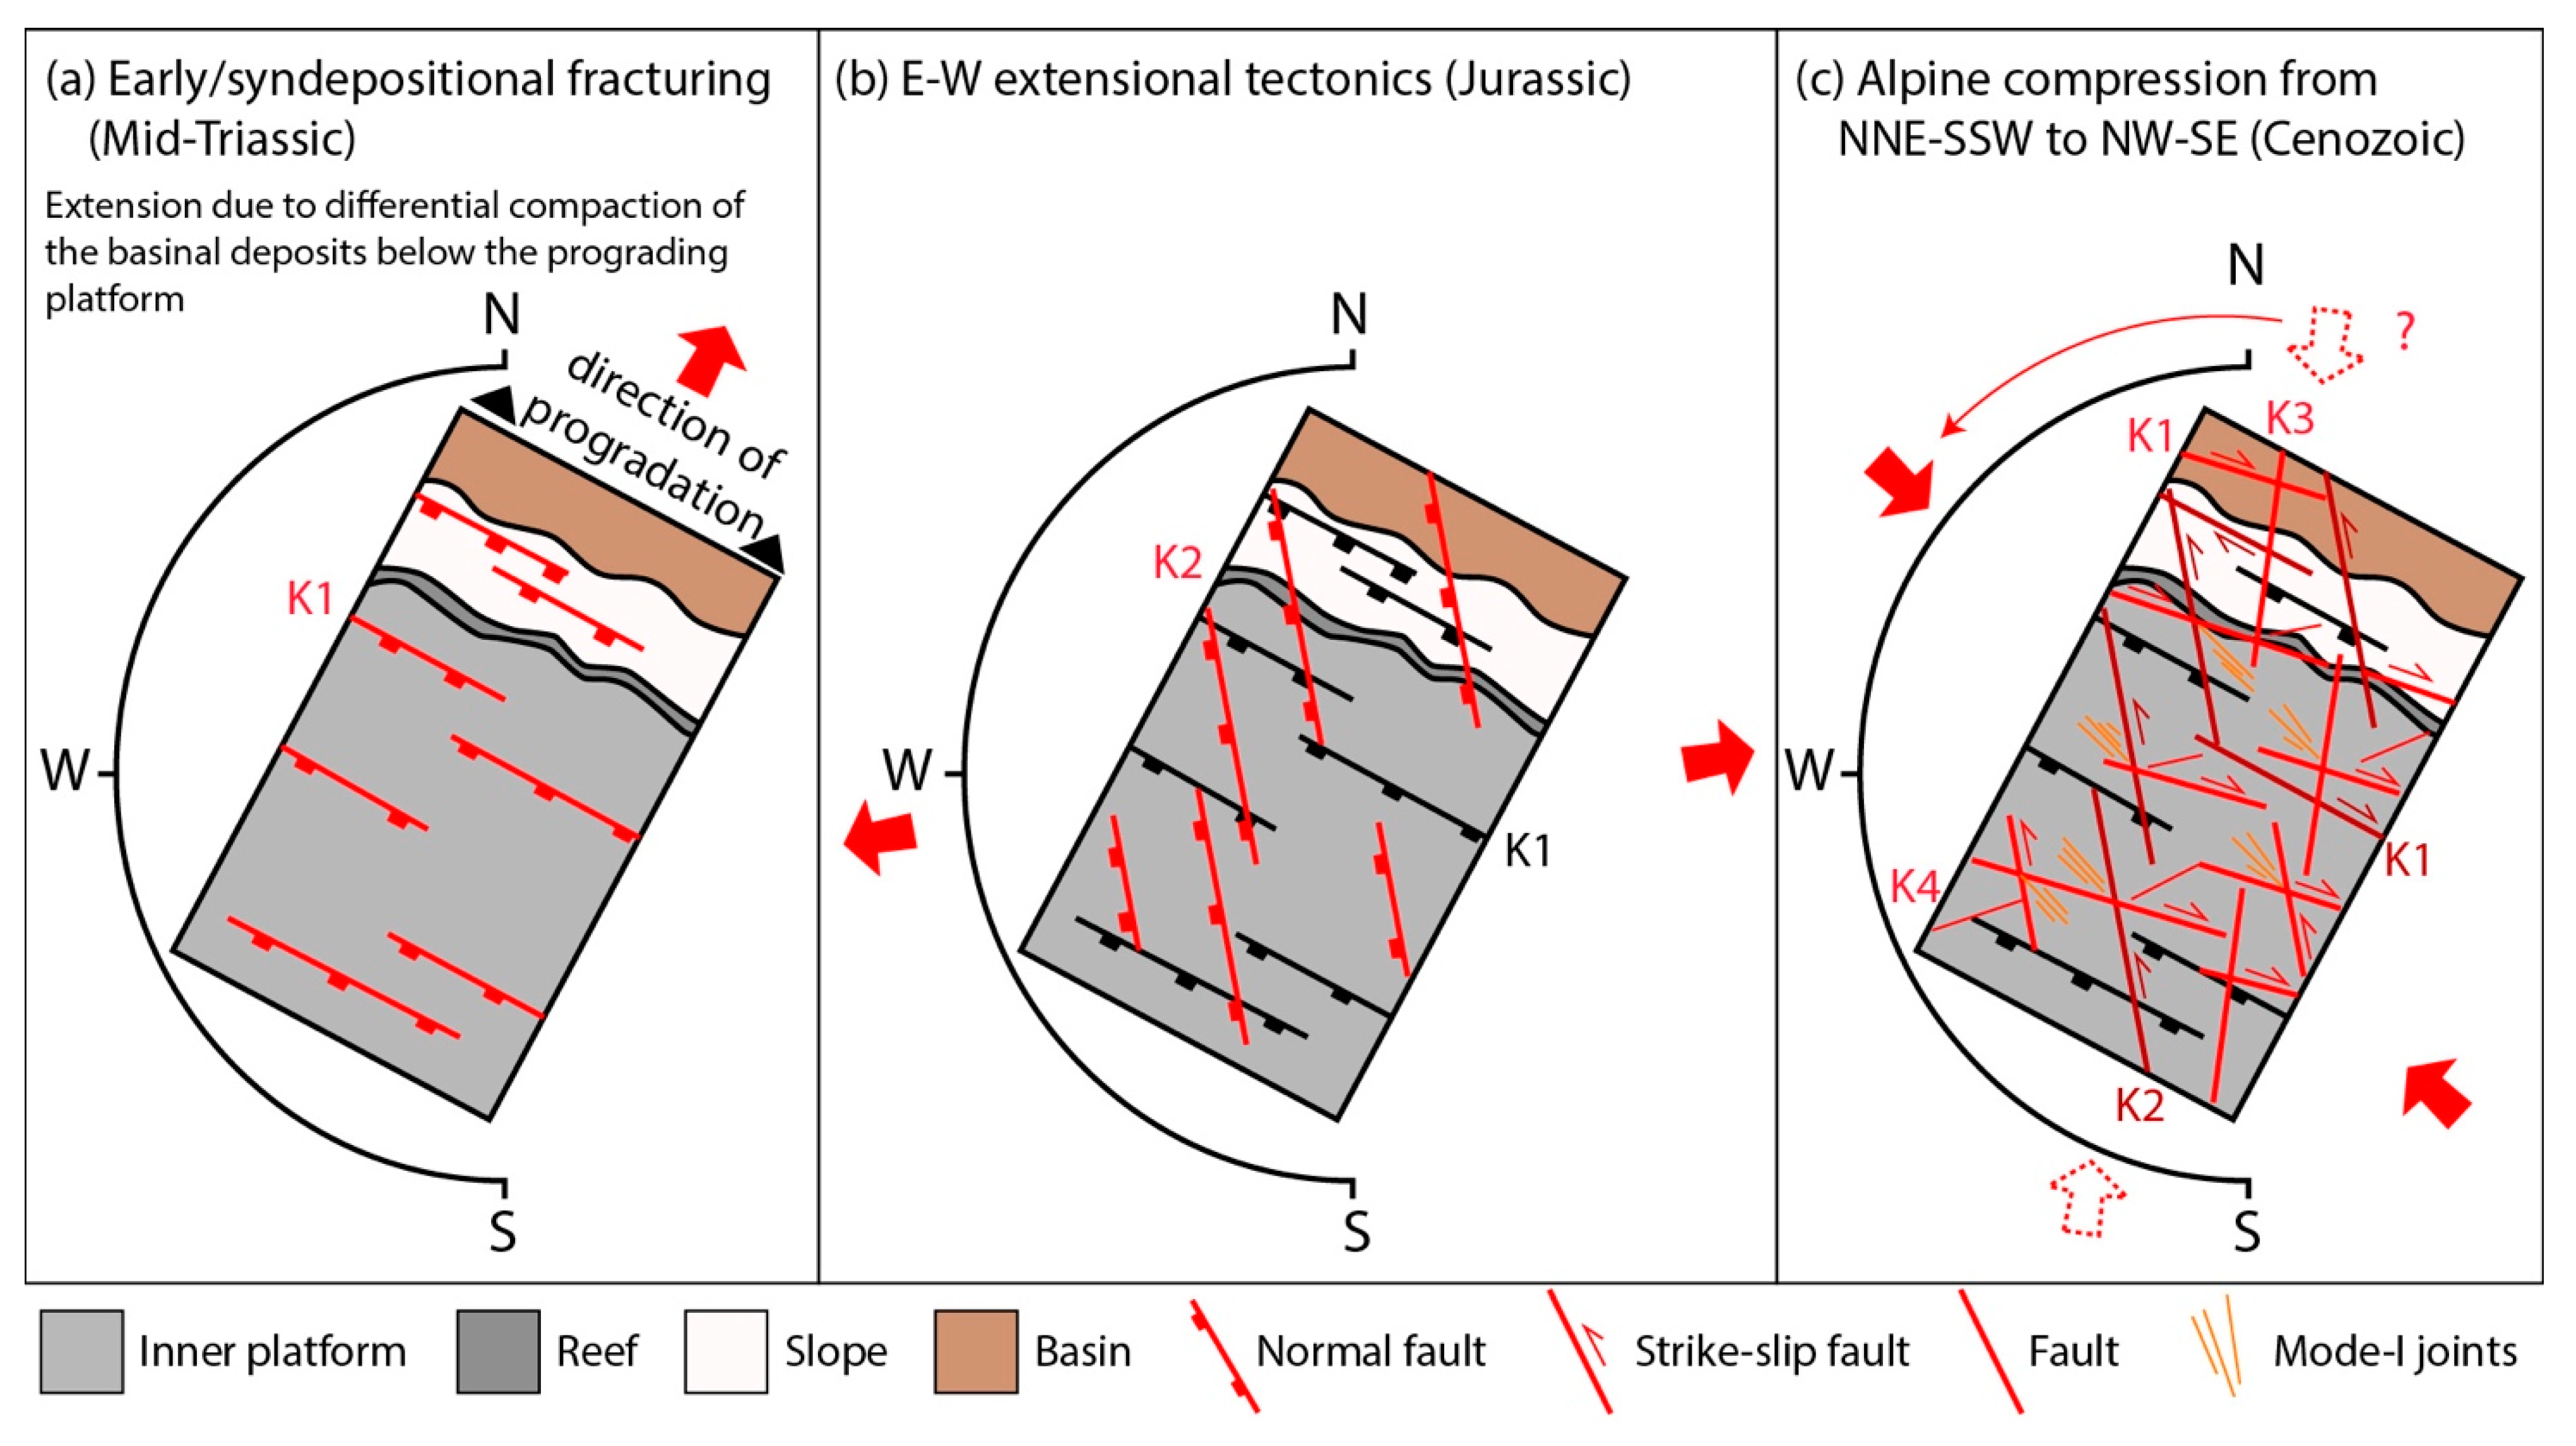
- Compaction-induced deformation that generated WNW-ESE-trending K1 extensional fractures and normal faults, perpendicular to the direction of platform progradation, likely active during or shortly after the platform growth (Late Ladinian, Early Carnian).
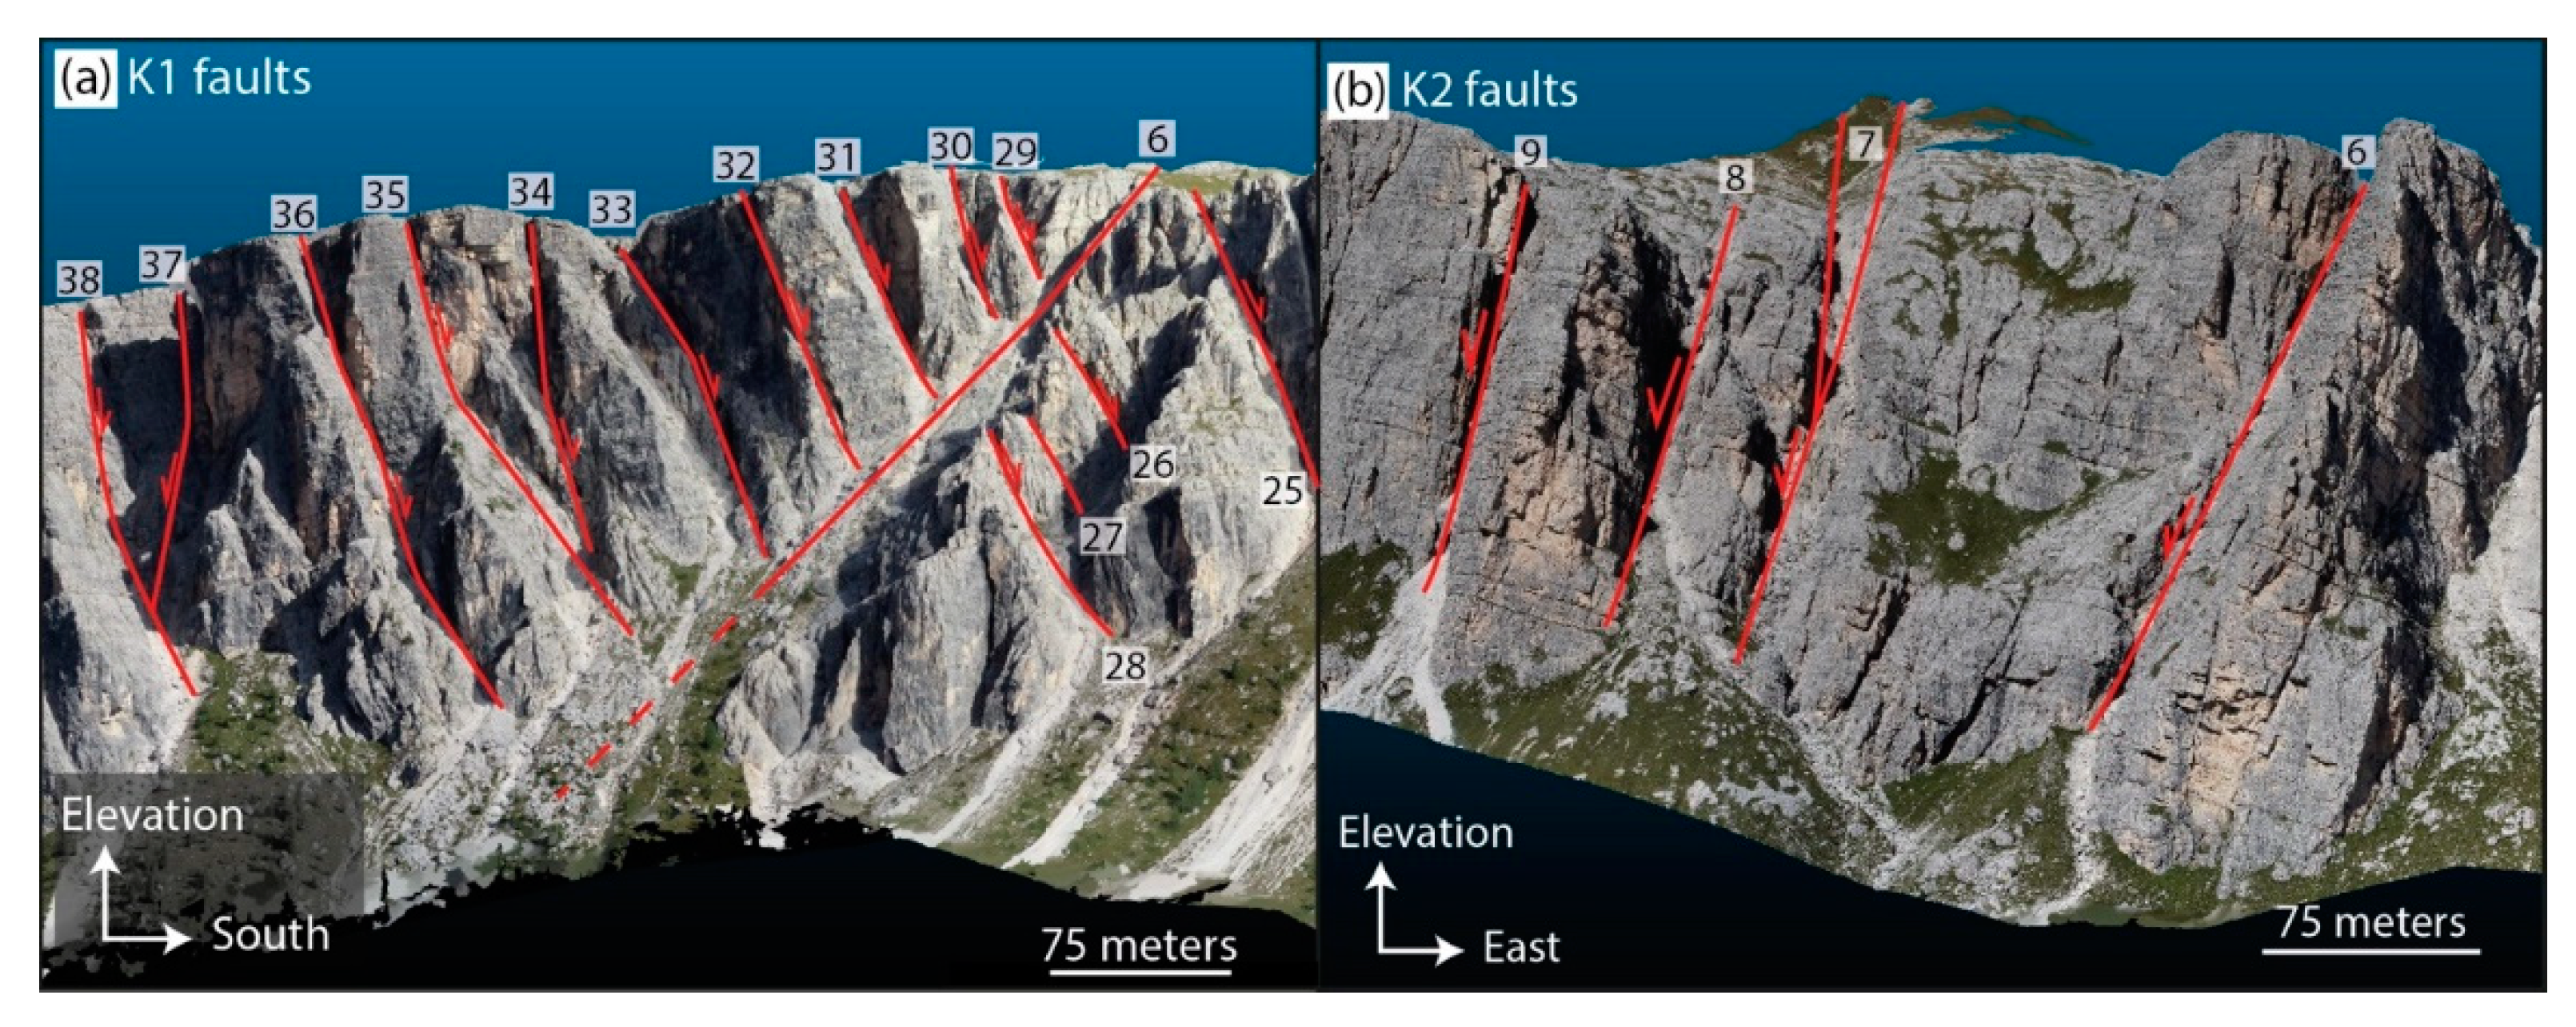
- Extensional tectonics, likely related to the Jurassic rifting phase, led to the formation of NNW-SSE striking K2 fractures and westward-dipping normal faults.
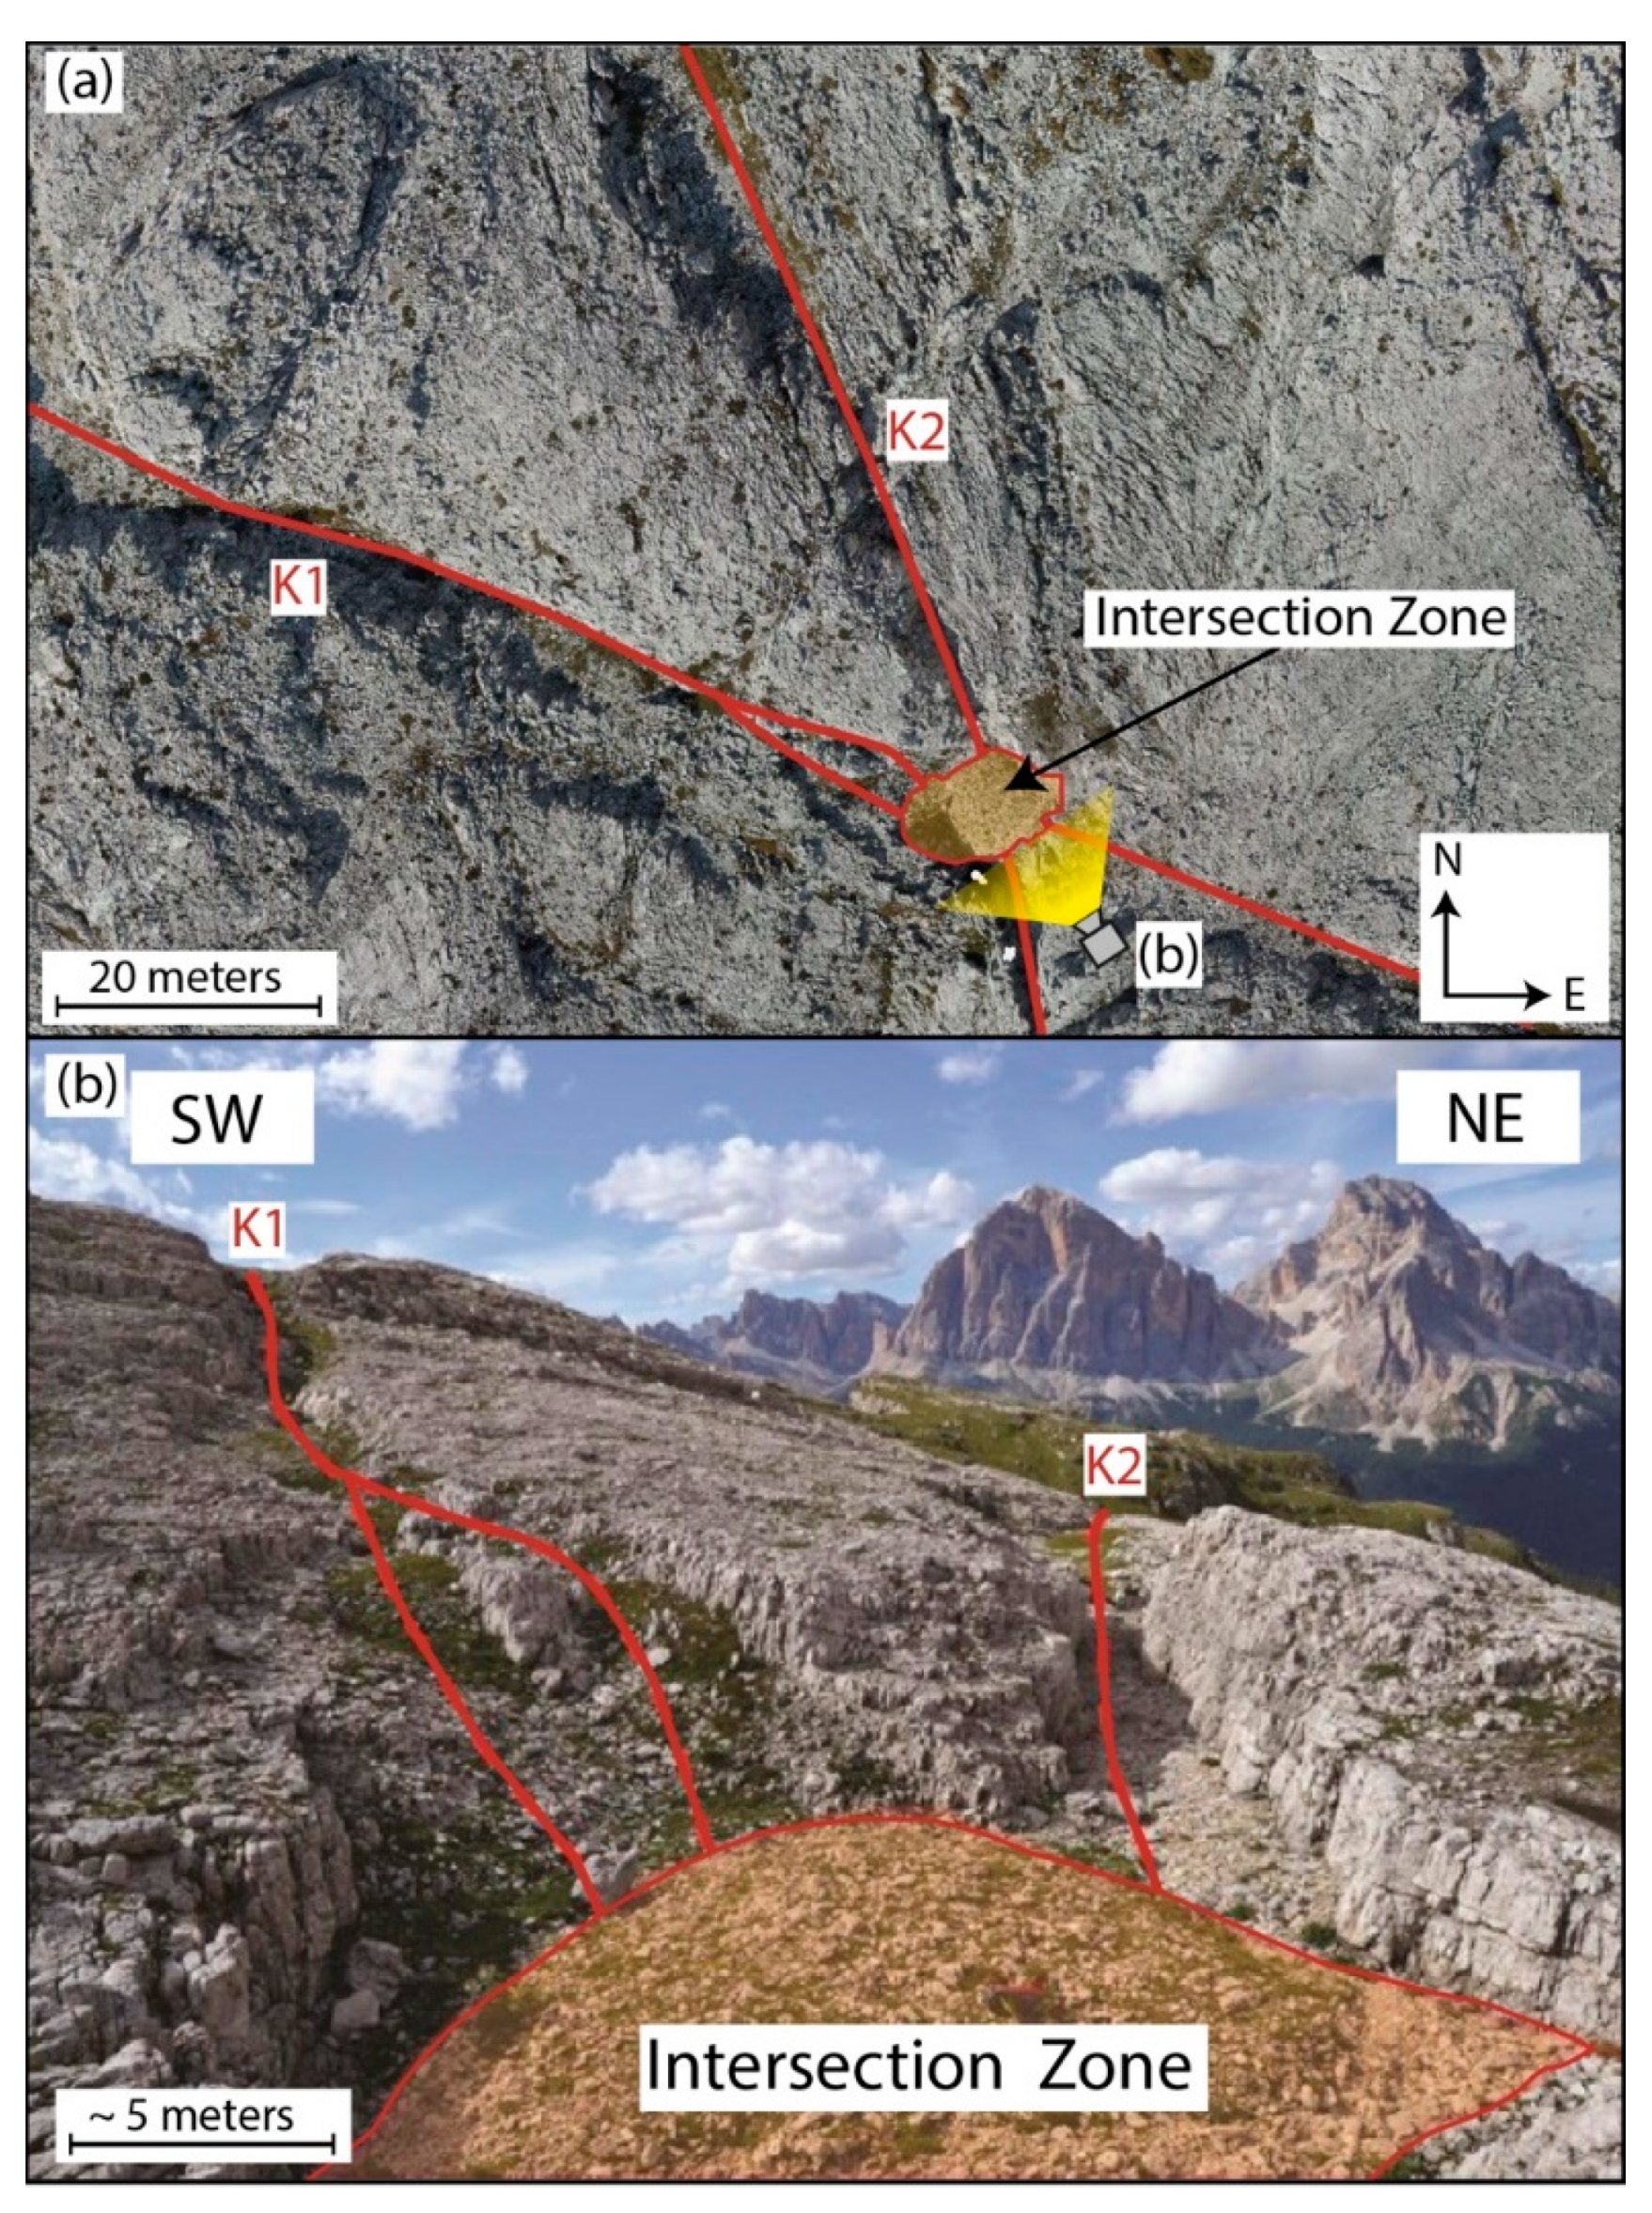
- Neogene compressional tectonics, characterized by an N-S to NW-SE crustal shortening that deformed the platform essentially with fractures and strike-slip structures: The best-documented deformational phase is characterized by an NW-SE-trending maximum compressional axis and is associated with the formation of new 100–120° N-trending right strike-slip faults and K3 sinistral strike-slip structures that intersected the preceding extensional K1 and K2 fractures and faults. The partial transcurrent reactivation of the preceding K1 and K2 structures together with the generation of new sets of fractures (K3 and K4) suggest that the Neogene strike-slip tectonics could be characterized by a reorientation of the maximum compressional axis from N-S (or NNE-SSW) to NW-SE.
Author Contributions
Funding
Acknowledgments
Conflicts of Interest
References
- Inama, R.; Menegoni, N.; Perotti, C. Syndepositional fractures and architecture of the Lastoni di Formin carbonate platform: Insights from virtual outcrop models and field studies. Mar. Pet. Geol. 2020, 121, 104606. [Google Scholar] [CrossRef]
- Menegoni, N.; Inama, R.; Crozi, M.; Perotti, C. Early deformation structures connected to the progradation of a carbonate platform: The case of the Nuvolau Cassian platform (Dolomites—Italy). Mar. Pet. Geol. 2022, 138, 105574. [Google Scholar] [CrossRef]
- Keim, L.; Schlager, W. Automicrite facies on steep slopes (Triassic, Dolomites, Italy). Facies 1999, 41, 15–25. [Google Scholar] [CrossRef]
- Keim, L.; Schlager, W. Quantitative compositional analysis of a Triassic carbonate platform (Southern Alps. Italy). Sediment. Geol. 2001, 139, 261–283. [Google Scholar] [CrossRef]
- Schlager, W. Benthic carbonate factories of the Phanerozoic. Int. J. Earth Sci. 2003, 92, 445–464. [Google Scholar] [CrossRef]
- Neuweiler, F.; Gautret, P.; Thiel, V.; Lange, R.; Michaelis, W.; Reitner, J. Petrology of Lower Cretaceous carbonate mud mounds (Albian, N. Spain): Insights into organomineralic deposits of the geological record. Sedimentology 1999, 46, 837–859. [Google Scholar] [CrossRef]
- Neuweiler, F.; Bourque, P.A.; Boulvain, F. Why is stromatactis so rare in Mesozoic carbonate mud mounds? Terra Nov. 2001, 13, 338–346. [Google Scholar] [CrossRef]
- Flajs, G.; Vigener, M.; Keupp, H.; Meischner, D.; Neuweiler, F.; Paul, J.; Reitner, J.; Warnke, K.; Weller, H.; Dingle, P.; et al. Mud mounds: A polygenetic spectrum of fine-grained carbonate buildups. Facies 1995, 32, 1–69. [Google Scholar] [CrossRef]
- Guido, A.; Mastandrea, A.; Stefani, M.; Russo, F. Role of autochthonous versus detrital micrite in depositional geometries of Middle Triassic carbonate platform systems. Bull. Geol. Soc. Am. 2016, 128, 989–999. [Google Scholar] [CrossRef]
- Guido, A.; Russo, F.; Miriello, D.; Mastandrea, A. Autochthonous micrite to aphanodolomite: The microbialites in the dolomitization processes. Geosciences 2018, 8, 451. [Google Scholar] [CrossRef]
- Panara, Y.; Menegoni, N.; Carboni, F.; Inama, R. 3D digital outcrop model-based analysis of fracture network along the seismogenic Mt. Vettore Fault System (Central Italy): The importance of inherited fractures. J. Struct. Geol. 2022, 161, 104654. [Google Scholar] [CrossRef]
- Espejel, R.L.; Alves, T.M.; Blenkinsop, T.G. Multi-scale fracture network characterisation on carbonate platforms. J. Struct. Geol. 2020, 140, 104160. [Google Scholar] [CrossRef]
- La Bruna, V.; Lamarche, J.; Agosta, F.; Rustichelli, A.; Giuffrida, A.; Salardon, R.; Marié, L. Structural diagenesis of shallow platform carbonates: Role of early embrittlement on fracture setting and distribution, case study of Monte Alpi (Southern Apennines, Italy). J. Struct. Geol. 2020, 131, 103940. [Google Scholar] [CrossRef]
- McCaffrey, K.J.W.; Jones, R.R.; Holdsworth, R.E.; Wilson, R.W.; Clegg, P.; Imber, J.; Holliman, N.; Trinks, I. Unlocking the spatial dimension: Digital technologies and the future of geoscience fieldwork. J. Geol. Soc. London. 2005, 162, 927–938. [Google Scholar] [CrossRef]
- Bistacchi, A.; Balsamo, F.; Storti, F.; Mozafari, M.; Swennen, R.; Solum, J.; Tueckmantel, C.; Taberner, C. Photogrammetric digital outcrop reconstruction, visualization with textured surfaces, and three-dimensional structural analysis and modeling: Innovative methodologies applied to fault-related dolomitization (Vajont Limestone, Southern Alps, Italy). Geosphere 2015, 11, 2031–2048. [Google Scholar] [CrossRef]
- Bertrand, L.; Géraud, Y.; Le Garzic, E.; Place, J.; Diraison, M.; Walter, B.; Haffen, S. A multiscale analysis of a fracture pattern in granite: A case study ofthe Tamariu granite, Catalunya, Spain. J. Struct. Geol. 2015, 78, 52–66. [Google Scholar] [CrossRef]
- Martinelli, M.; Bistacchi, A.; Mittempergher, S.; Bonneau, F.; Balsamo, F.; Caumon, G.; Meda, M. Damage zone characterization combining scan-line and scan-area analysis on a km-scale Digital Outcrop Model: The Qala Fault (Gozo). J. Struct. Geol. 2020, 140, 104144. [Google Scholar] [CrossRef]
- Doglioni, C. Tectonics of the Dolomites (southern alps, northern Italy). J. Struct. Geol. 1987, 9, 181–193. [Google Scholar] [CrossRef]
- Stefani, M.; Furin, S.; Gianolla, P. The changing climate framework and depositional dynamics of Triassic carbonate platforms from the Dolomites. Palaeogeogr. Palaeoclimatol. Palaeoecol. 2010, 290, 43–57. [Google Scholar] [CrossRef]
- Servizio Geologico d’Italia—ISPRA; Compagnoni, B.; Galluzzo, F.; Bonomo, R.; Capotorti, F.; D’Ambrogi, C.; Di Stefano, R.; Graziano, R.; Martarelli, L.; Pampaloni, M.L.P.; et al. Carta Geologica alla Scala 1 a 1,000,000, 5th ed.; SELCA: Firenze, Italy, 2011; Available online: http://sgi.isprambiente.it/milione/milione5ed.html (accessed on 10 January 2022).
- Bigi, G.; Castellarin, A.; Coli, M.; Dal Piaz, G.V.; Sartori, R.; Scandone, P.; Vai, G.B. Structural Model of Italy Scale 1:500.000, Sheet 1; Progetto Finalizzato Geodinamica, C.N.R., Ed.; SELCA: Firenze, Italy, 1990; Available online: https://www.socgeol.it/438/structural-model-of-italy-scale-1-500-000.html (accessed on 10 January 2022).
- Bigi, G.; Castellarin, A.; Coli, M.; Dal Piaz, G.V.; Vai, G.B. Structural Model of Italy Scale 1:500.000, Sheet 2; Progetto Finalizzato Geodinamica, C.N.R., Ed.; SELCA: Firenze, Italy, 1990; Available online: https://www.socgeol.it/438/structural-model-of-italy-scale-1-500-000.html (accessed on 10 January 2022).
- Brondi, A.; Fuganti, A.; Mittempergher, M.; Murara, G.; Nardin, M.; Rossi, D.; Scudeler Baccelle, L.; Sommavilla, E.; Zirpoli, G. Note Illustrative della Carta Geologica d ‘Italia alla scala 1: 50.000: Foglio 027-Bolzano; Nuova Tecnica Grafica: Roma, Italy, 1974. Available online: https://www.isprambiente.gov.it/Media/carg/note_illustrative/27_Bolzano.pdf (accessed on 10 January 2022).
- Brondi, A.; Mittempergher, M.; Panizza, M.; Rossi, D.; Sommavilla, E.; Vuillermin, F. Note Illustrative della Carta Geologica d ‘Italia alla Scala 1: 50.000: Foglio 028-La Marmolada; Litografia Artisitica Cartografica: Firenze, Italy, 1977. Available online: https://www.isprambiente.gov.it/Media/carg/note_illustrative/28_Lamarmolada.pdf (accessed on 10 January 2022).
- Costa, V.; Doglioni, C.; Grandesso, P.; Masetti, D.; Pellegrini, G.B.; Tracanella, E. Note Illustrative della Carta Geologica d’Italia alla Scala 1: 50.000: Foglio 063-Belluno; Istituto Poligrafico e Zecca dello Stato: Roma, Italy, 1996. Available online: https://www.isprambiente.gov.it/Media/carg/note_illustrative/63_Belluno.pdf (accessed on 10 January 2022).
- Neri, C.; Gianolla, P.; Furlanis, S.; Caputo, R.; Bosellini, A. Note Illustrative della Carta Geologica d’Italia. alla Scala 1:50.000: Foglio 029-Cortina d’Ampezzo; ISPRA: Roma, Italy, 2007. Available online: https://www.isprambiente.gov.it/Media/carg/note_illustrative/29_CortinaAmpezzo.pdf (accessed on 10 January 2022).
- Gianolla, P.; Morelli, C.; Cucato, M.; Siorpaes, C. Note Illustrative della Carta Geologica d’Italia alla Scala 1: 50.000: Foglio 016-Dobbiaco; ISPRA: Roma, Italy, 2018. Available online: https://www.isprambiente.gov.it/Media/carg/note_illustrative/16_Dobbiaco_ita.pdf (accessed on 10 January 2022).
- Geoportale Nazionale of Ministero dell’Ambiente e della Tutela del Territorio e del Mare. Available online: http://www.pcn.minambiente.it (accessed on 1 August 2022).
- Preto, N.; Gianolla, P.; Franceschi, M.; Gattolin, G.; Riva, A. Geometry and evolution of Triassic high-relief, isolated microbial platforms in the Dolomites, Italy: The Anisian Latemar and Carnian Sella platforms compared. Am. Assoc. Pet. Geol. Bull. 2017, 101, 475–483. [Google Scholar] [CrossRef]
- Caputo, R. Tettonica Polifasica nei Dintorni di Cortina d’Ampezzo, Dolomiti Orientali. Rend Online Soc. Geol. Ital. 2008, 1, 57–61. Available online: https://www.researchgate.net/profile/Riccardo-Caputo/publication/285919639_Polyphase_tectonics_in_the_Cortina_dAmpezzo_area_eastern_Dolomites/links/5cf2f816a6fdcc8475fce7cf/Polyphase-tectonics-in-the-Cortina-dAmpezzo-area-eastern-Dolomites.pdf (accessed on 10 January 2022).
- Leonardi, P. Le Dolomiti. Geologia dei Monti tra Isarco e Piave; Manfrini: Rovereto, Italy, 1968; 1021p. [Google Scholar]
- Bosellini, A.; Masetti, D.; Neri, C. La geologia del Passo del Falzarego. In Guide Geologiche Regionali—Guida alla Geologia del Sudalpino Centro-Orientale; Castellarin, A., Vai, G.B., Eds.; Pitagora: Bologna, Italy, 1983; pp. 273–278. ISBN 9788837118952. [Google Scholar]
- Blendinger, W.; Blendinger, E. Windward-leeward effects on Triassic carbonate bank margin facies of the Dolomites, northern Italy. Sediment. Geol. 1989, 64, 143–166. [Google Scholar] [CrossRef]
- Keim, L.; Brandner, R. Facies interfingering and synsedimentary tectonics on late ladinian-early carnian carbonate platforms (Dolomites, Italy). Int. J. Earth Sci. 2001, 90, 813–830. [Google Scholar] [CrossRef]
- De Zanche, V.; Gianolla, P.; Mietto, P.; Sjorpaes, C.; Vail, P.R. Triassic Sequence Stratigraphy in the Dolomites (Italy). Mem. Sci. Geol. 1993, 45, 1–27. [Google Scholar]
- Stefani, M.; Brak, P.; Gianolla, P.; Keim, L.; Mauer, M.; Neri, C.; Preto, N.; Riva, A.; Roghi, G.; Russo, F. Field Guide Book P44—Triassic carbonate platforms of the Dolomites: Carbonate production, relative sealevel fluctuations and the shaping of the depositional architecture. In Proceedings of the 32nd International Geologic Congress, Florence, Italy, 20–28 August 2004; Guerrieri, L., Rischia, I., Serva, L., Eds.; APAT: Roma, Italy, 2004; Volume 5. 68pAvailable online: https://www.isprambiente.gov.it/contentfiles/00006600/6621-p44.pdf (accessed on 10 January 2022).
- Simms, M.J.; Ruffell, A.H. Synchroneity of climatic change and extinctions in the Late Triassic. Geology 1989, 17, 265–268. [Google Scholar] [CrossRef]
- Simms, M.J.; Ruffell, A.H. Climatic and biotic change in the late Triassic. J.-Geol. Soc. 1990, 147, 321–327. [Google Scholar] [CrossRef]
- Gattolin, G.; Breda, A.; Preto, N. Demise of late Triassic carbonate platforms triggered the onset of a tide-dominated depositional system in the dolomites, northern Italy. Sediment. Geol. 2013, 297, 38–49. [Google Scholar] [CrossRef]
- Gattolin, G.; Preto, N.; Breda, A.; Franceschi, M.; Isotton, M.; Gianolla, P. Sequence stratigraphy after the demise of a high-relief carbonate platform (Carnian of the Dolomites): Sea-level and climate disentangled. Palaeogeogr. Palaeoclimatol. Palaeoecol. 2015, 423, 1–17. [Google Scholar] [CrossRef]
- Roghi, G. Palynological investigations in the Carnian of the Cave del Predil area (Julian Alps, NE Italy). Rev. Palaeobot. Palynol. 2004, 132, 1–35. [Google Scholar] [CrossRef]
- Preto, N.; Kustatscher, E.; Wignall, P.B. Triassic climates—State of the art and perspectives. Palaeogeogr. Palaeoclimatol. Palaeoecol. 2010, 290, 1–10. [Google Scholar] [CrossRef]
- Dal Corso, J.; Mietto, P.; Newton, R.J.; Pancost, R.D.; Preto, N.; Roghi, G.; Wignall, P.B. Discovery of a major negative δ13C spike in the Carnian (Late Triassic) linked to the eruption of Wrangellia flood basalts. Geology 2012, 40, 79–82. [Google Scholar] [CrossRef]
- Dal Corso, J.; Bernardi, M.; Sun, Y.; Song, H.; Seyfullah, L.J.; Preto, N.; Gianolla, P.; Ruffel, A.; Kustatscher, E.; Roghi, G.; et al. Extinction and dawn of the modern world in the Carnian (Late Triassic). Sci. Adv. 2020, 6, eaba0099. [Google Scholar] [CrossRef] [PubMed]
- Bosellini, A.; Gianolla, P.; Stefani, M. Geology of the Dolomites. Episodes 2003, 26, 181–185. [Google Scholar] [CrossRef]
- Doglioni, C. Tectonics of the Dolomites. Bull. Fuer Angew. Geol. 2007, 12, 11–15. [Google Scholar]
- Castellarin, A.; Lucchini, F.; Rossi, P.L.; Selli, L.; Simboli, G. The Middle Triassic magmatic-tectonic arc development in the Southern Alps. Tectonophysics 1988, 146, 79–89. [Google Scholar] [CrossRef]
- Abbas, H.; Michail, M.; Cifelli, F.; Mattei, M.; Gianolla, P.; Lustrino, M.; Carminati, E. Emplacement modes of the Ladinian plutonic rocks of the Dolomites: Insights from anisotropy of magnetic susceptibility. J. Struct. Geol. 2018, 113, 42–61. [Google Scholar] [CrossRef]
- Bertotti, G. Subsidence, deformation, thermal and mechanical evolution of the mesozoic South Alpine rifted margin: An analogue for Atlantic-type-margins. Geol. Soc. Spec. Publ. 2001, 187, 125–141. [Google Scholar] [CrossRef]
- Berra, F.; Carminati, E. Subsidence history from a backstripping analysis of the Permo-Mesozoic succession of the Central Southern Alps (Northern Italy). Basin Res. 2010, 22, 952–975. [Google Scholar] [CrossRef]
- Polino, R.; Dal Piaz, G.V.; Gosso, G. Tectonic erosion at the Adria margin and accretionary processes for the Cretaceous orogeny of the Alps. Mémoires Société Géologique Fr. 1996, 156, 345–367. [Google Scholar]
- Schmid, S.M.; Pfiffner, O.A.; Froitzheim, N.; Schönborn, G.; Kissling, E. Geophysical-geological transect and tectonic evolution of the Swiss-Italian Alps. Tectonics 1990, 15, 1036–1064. [Google Scholar] [CrossRef]
- Caputo, R. The polyphase tectonics of Eastern Dolomites, Italy. Mem. Sci. Geol. 1996, 48, 93–106. [Google Scholar]
- Caputo, R.; Stefani, M.M.; Dal Piaz, G. Contractional and transcurrent tectonics in the Marmolada group (Dolomites, Italy). Mem. Sci. Geol. 1999, 51, 63–77. [Google Scholar]
- Caputo, R.; Poli, M.E.; Zanferrari, A. Neogene-Quaternary tectonic stratigraphy of the eastern Southern Alps, NE Italy. J. Struct. Geol. 2010, 32, 1009–1027. [Google Scholar] [CrossRef]
- Schönborn, G. Balancing cross sections with kinematic constraints: The Dolomites (northern Italy). Tectonics 1999, 18, 527–545. [Google Scholar] [CrossRef]
- Antonellini, M.; Mollema, P.N. A natural analog for a fractured and faulted reservoir in dolomite: Triassic Sella Group, northern Italy. Am. Assoc. Pet. Geol. Bull. 2010, 84, 314–344. [Google Scholar] [CrossRef]
- Castellarin, A.; Cantelli, L.; Fesce, A.M.; Mercier, J.L.; Picotti, V.; Pini, G.A.; Prosser, G.; Selli, L. Alpine compressional tectonics in the southern Alps: Relationships with the N-Apennines. Ann. Tecton. 1992, 6, 62–94. [Google Scholar]
- Mazzoli, S.; Helman, M. Neogene patterns of relative plate motion for Africa-Europe: Some implications for recent central Mediterranean tectonics. Geol. Rundsch. 1994, 83, 464–468. [Google Scholar] [CrossRef]
- Menegoni, N.; Giordan, D.; Perotti, C.; Tannant, D.D. Detection and geometric characterization of rock mass discontinuities using a 3D high-resolution digital outcrop model generated from RPAS imagery—Ormea rock slope, Italy. Eng. Geol. 2019, 252, 145–163. [Google Scholar] [CrossRef]
- QGIS.org. QGIS Geographic Information System; QGIS Association: Online, 2022. Available online: http://www.qgis.org (accessed on 10 January 2022).
- Nyberg, B.; Nixon, C.W.; Sanderson, D.J. NetworkGT: A GIS tool for geometric and topological analysis of two-dimensional fracture networks. Geosphere 2018, 14, 1618–1634. [Google Scholar] [CrossRef]
- Menegoni, N.; Meisina, C.; Perotti, C.; Crozi, M. Analysis by UAV digital photogrammetry of folds and related fractures in the Monte Antola Flysch Formation (Ponte Organasco, Italy). Geosciences 2018, 8, 299. [Google Scholar] [CrossRef]
- CloudCompare—Open Source Project. Available online: https://www.danielgm.net/cc/ (accessed on 1 August 2022).
- Panara, Y.; Khanna, P.; Chandra, V.; Finkbeiner, T.; Vahrenkamp, V. 3D Digital Outcrop Model-based fracture network analsysis of Reservoir Outcrop Analogue, Upper Jubaila Formation, Saudi Arabia. In Proceedings of the 3rd EAGE Annual Conference and Exibithion, Madrid, Spain, 6–9 June 2022; Volume 1, pp. 1–5. [Google Scholar] [CrossRef]
- Thiele, S.T.; Grose, L.; Samsu, A.; Micklethwaite, S.; Vollgger, S.A.; Cruden, A.R. Rapid, semi-automatic fracture and contact mapping for point clouds, images and geophysical data. Solid Earth 2017, 8, 1241–1253. [Google Scholar] [CrossRef]
- Tziavou, O.; Pytharouli, S.; Souter, J. Unmanned Aerial Vehicle (UAV) based mapping in engineering geological surveys: Considerations for optimum results. Eng. Geol. 2018, 232, 12–21. [Google Scholar] [CrossRef]
- Watkins, H.; Bond, C.E.; Healy, D.; Butler, R.W. Appraisal of fracture sampling methods and a new workflow to characterise heterogeneous fracture networks at outcrop. J. Struct. Geol. 2015, 72, 67–82. [Google Scholar] [CrossRef]
- Menegoni, N.; Giordan, D.; Inama, I.; Perotti, C. DICE: An open-source MATLAB application for quantification and parametrization of Digital Outcrop Model-based fracture datasets. J. Rock Mech. Geotech. Eng. 2022, in press. [CrossRef]
- DICE—GitHub Repository. Available online: https://github.com/nicmenegoni/DICE (accessed on 1 August 2022).
- Sanderson, D.J.; Nixon, C.W. The use of topology in fracture network characterization. J. Struct. Geol. 2015, 72, 55–66. [Google Scholar] [CrossRef]
- Koša, E.; Hunt, D.W. Growth of syndepositional faults in carbonate strata: Upper Permian Capitan platform, New Mexico, USA. J. Struct. Geol. 2005, 27, 1069–1094. [Google Scholar] [CrossRef]
- Frost, E.L.; Kerans, C. Platform-margin trajectory as a control on syndepositional fracture patterns, Canning Basin, Western Australia. J. Sediment. Res. 2009, 79, 44–55. [Google Scholar] [CrossRef]
- Sharp, I.; Gillespie, P.; Morsalnezhad, D.; Taberner, C.; Karpuz, R.; Vergés, J.; Horbury, A.; Pickard, N.; Garland, J.; Hunt, D. Stratigraphic architecture and fracture-controlled dolomitization of the Cretaceous Khami and Bangestan groups: An outcrop case study, Zagros Mountains, Iran. Geol. Soc. Spec. Publ. 2010, 329, 343–396. [Google Scholar] [CrossRef]
- Berra, F.; Carminati, E. Differential compaction and early rock fracturing in high-relief carbonate platforms: Numerical modelling of a Triassic case study (Esino Limestone, Central Southern Alps, Italy). Basin Res. 2012, 24, 598–614. [Google Scholar] [CrossRef]
- Budd, D.A.; Frost, E.L.; Huntington, K.W.; Allwardt, P.F. Syndepositional Deformation Features in High-Relief Carbonate Platforms: Long-Lived Conduits for Diagenetic Fluids. J. Sediment. Res. 2013, 83, 12–36. [Google Scholar] [CrossRef]
- La Bruna, V.; Agosta, F.; Prosser, G. New insights on the structural setting of the Monte Alpi area, Basilicata, Italy. Ital. J. Geosci. 2017, 136, 220–237. [Google Scholar] [CrossRef]
- La Bruna, V.; Agosta, F.; Lamarche, J.; Viseur, S.; Prosser, G. Fault growth mechanisms and scaling properties in foreland basin system: The case study of Monte Alpi, Southern Apennines, Italy. J. Struct. Geol. 2018, 116, 94–113. [Google Scholar] [CrossRef]
- Mollema, P.N.; Antonellini, M. Development of strike-slip faults in the dolomites of the Sella Group, Northern Italy. J. Struct. Geol. 1999, 21, 273–292. [Google Scholar] [CrossRef]


| UAV type | Sensor type | Sensor resolution | Sensor size | Focal length |
| DJI Matrice 200 | Zenmuse X4S (CMOS) | 5472 × 3078 pixels | 13.2 × 8.8 mm | 8.8 mm |
| N. of flights | N. of photographs | Mean overlap and sidelap | Mean camera-outcrop distance | Mean resolution |
| 16 (ca. 20 min each) | ca. 12,000 | 95% | 200 m | 5 cm/pixel |
| N. of Ground Control Points * | DOM mean horizontal absolute accuracy | DOM mean vertical absolute accuracy | DOM mean relative accuracy in length | DOM mean relative accuracy in orientation |
| 22 | 120 cm | 72 cm | 0.17% | <1° |
| Fault Number | Dip Direction (°N) | Dip (°) | Stratigraphic Separation | ||
|---|---|---|---|---|---|
| Type | Mean Value (m) | N. of Measures | |||
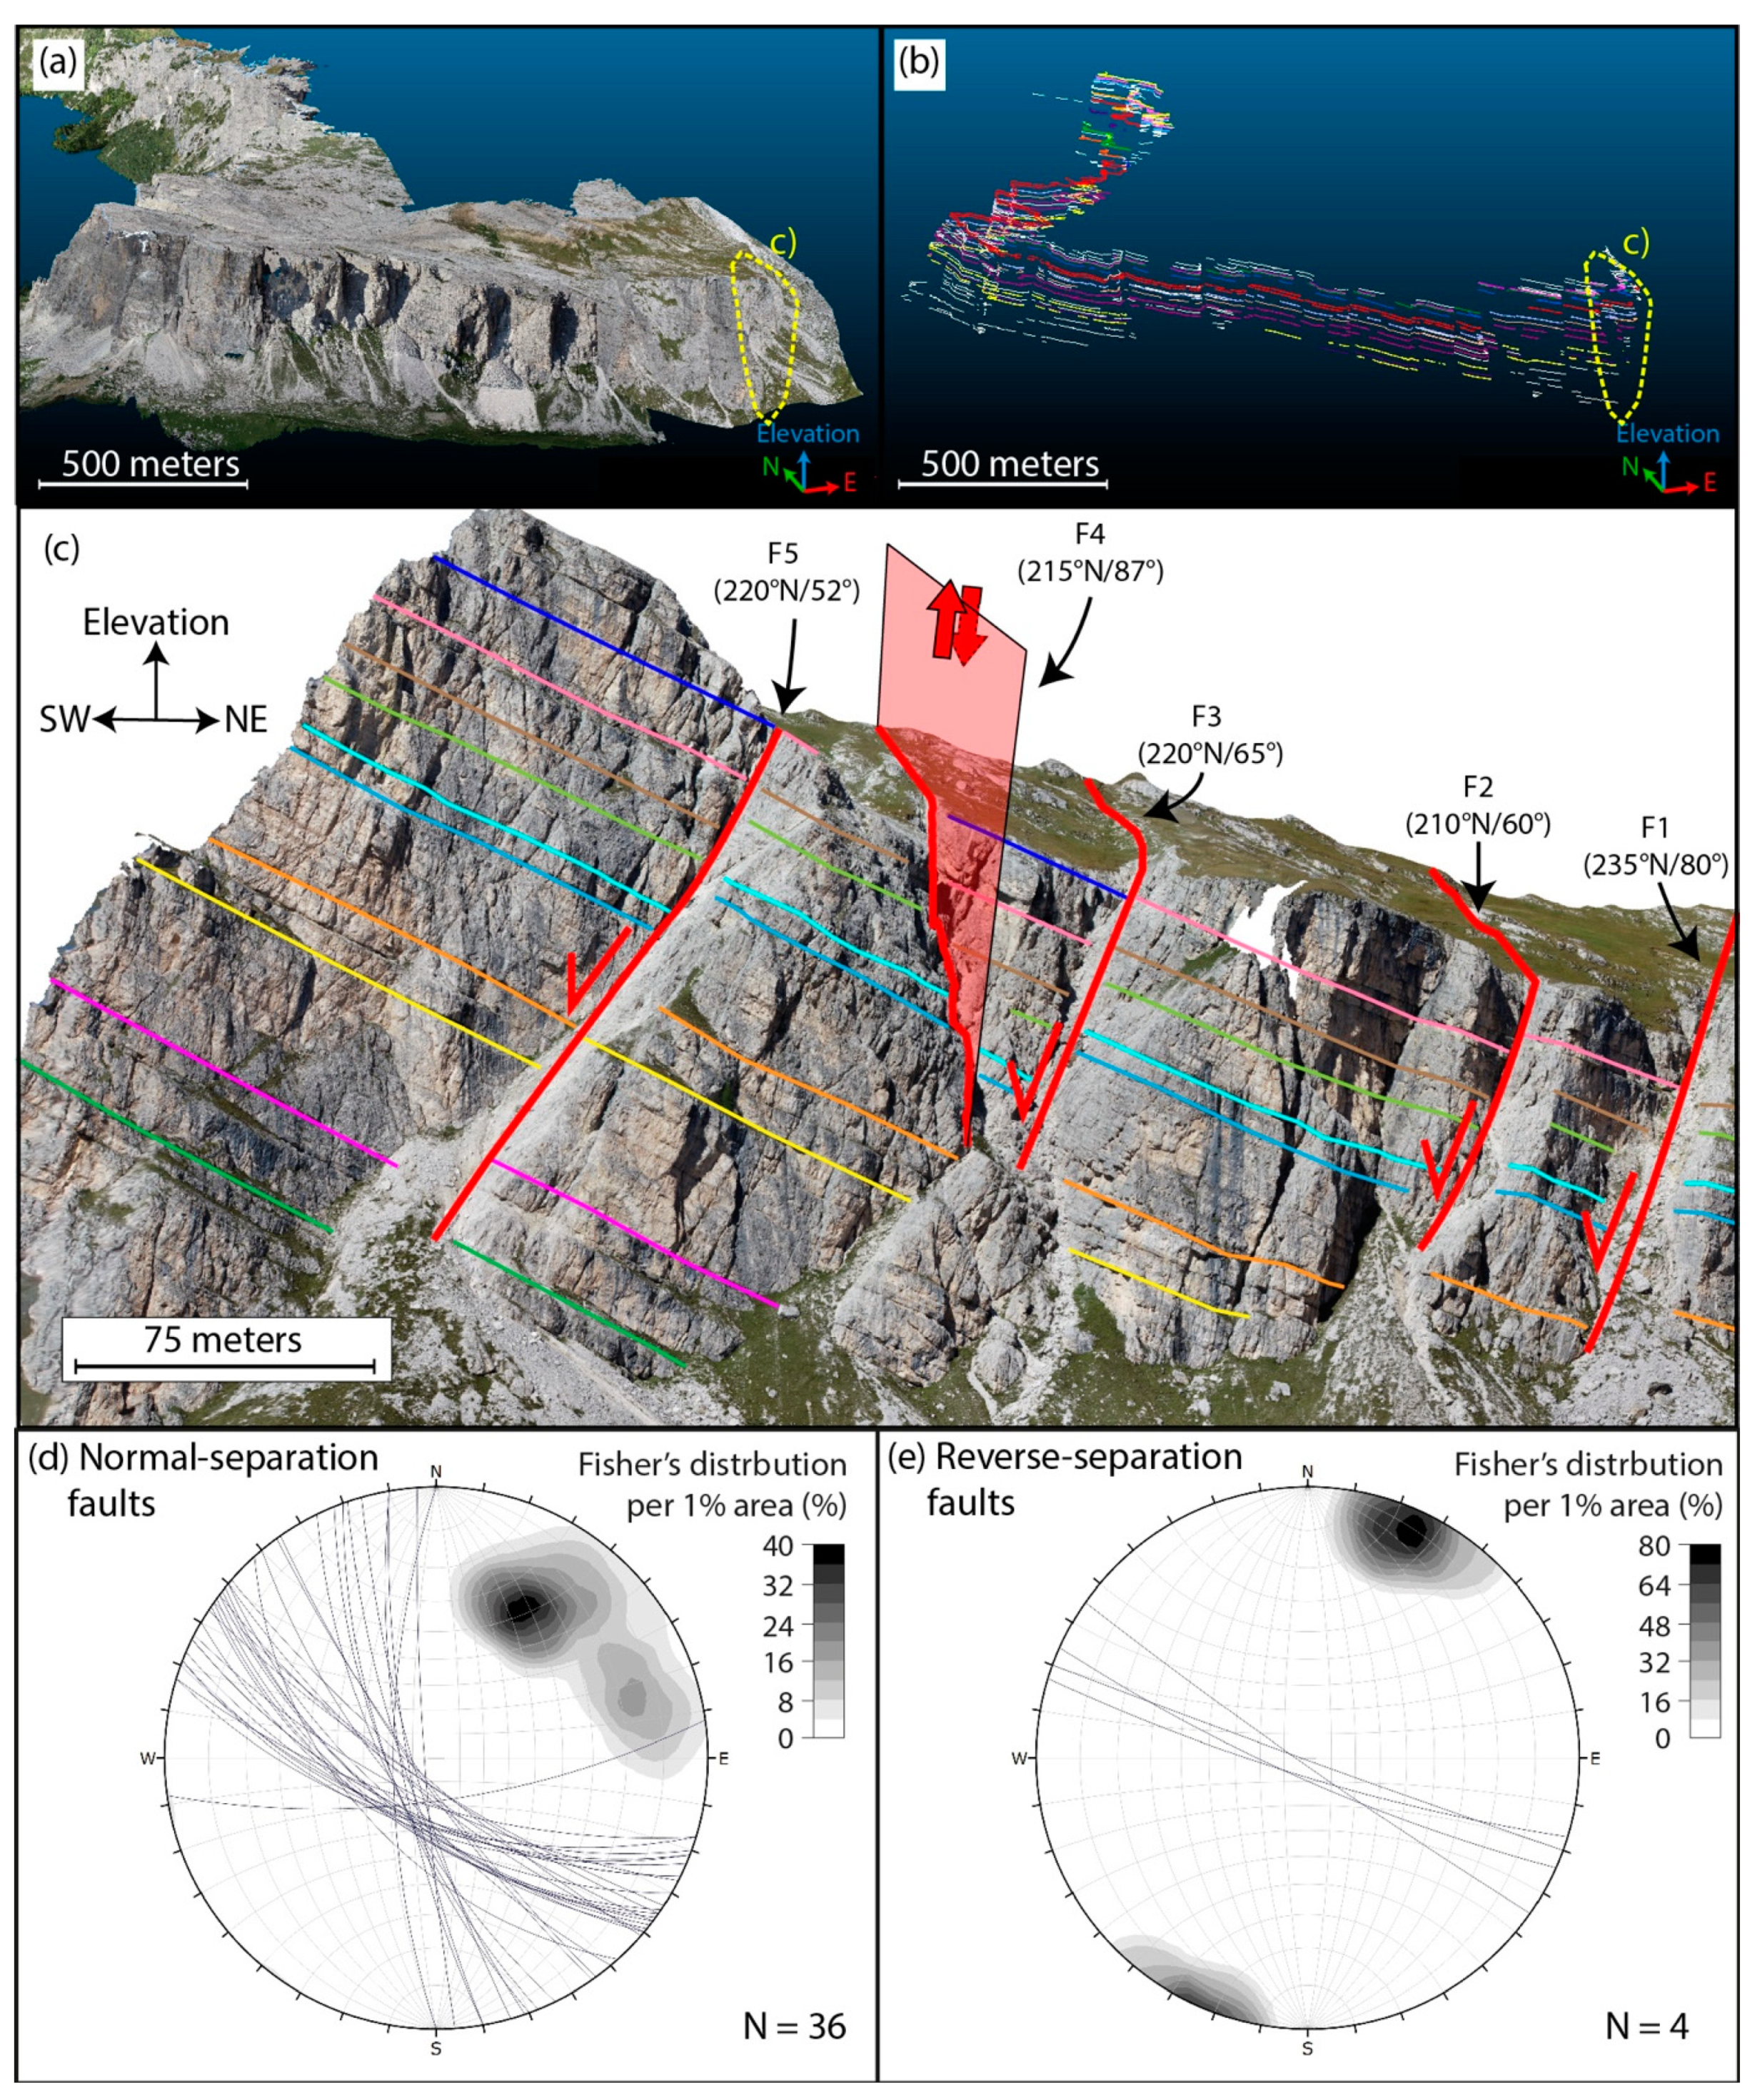
| 1 | 235 | 80 | normal | 7.7 | 2 |
| 2 | 210 | 60 | normal | 7.2 | 4 |
| 3 | 220 | 65 | normal | 15.9 | 3 |
| 4 | 215 | 87 | reverse | 9.3 | 7 |
| 5 | 220 | 52 | normal | 11.9 | 9 |
| 6 | 270 | 72 | normal | 18.8 | 9 |
| 7 | 250 | 70 | normal | 31.2 | 3 |
| 8 | 260 | 78 | normal | 18.9 | 3 |
| 9 | 248 | 70 | normal | 11.0 | 8 |
| 10 | 244 | 69 | normal | 2.1 | 7 |
| 11 | 260 | 75 | normal | 4.3 | 5 |
| 12 | 220 | 75 | normal | 3.9 | 5 |
| 13 | 230 | 70 | normal | 4.4 | 6 |
| 14 | 266 | 85 | normal | 3.8 | 7 |
| 15 | 234 | 81 | normal | 4.3 | 7 |
| 16 | 172 | 72 | normal | 7.0 | 7 |
| 17 | 254 | 80 | normal | 9.0 | 6 |
| 18 | 213 | 79 | normal | 5.0 | 12 |
| 19 | 251 | 76 | normal | 2.3 | 2 |
| 20 | 204 | 81 | reverse | 19.3 | 4 |
| 21 | 200 | 89 | reverse | 1.1 | 5 |
| 22 | 197 | 82 | reverse | 5.0 | 2 |
| 23 | 218 | 63 | normal | 6.1 | 12 |
| 24 | 217 | 63 | normal | 9.4 | 4 |
| 25 | 215 | 59 | normal | 4.5 | 5 |
| 26 | 200 | 64 | normal | 7.2 | 3 |
| 27 | 216 | 60 | ND | ND | 0 |
| 28 | 201 | 60 | normal | 7.7 | 1 |
| 29 | 214 | 59 | normal | 13.2 | 1 |
| 30 | 207 | 72 | normal | ||
| 31 | 203 | 63 | normal | 3.6 | 4 |
| 32 | 201 | 62 | normal | 2.4 | 2 |
| 33 | 215 | 79 | normal | ||
| 34 | 206 | 65 | normal | 3.2 | 3 |
| 35 | 206 | 65 | normal | 1.8 | 3 |
| 36 | 219 | 62 | normal | 4.4 | 5 |
| 37 | 221 | 81 | normal | 2.3 | 3 |
| 38 | 197 | 70 | normal | 6.5 | 11 |
| 39 | 228 | 53 | ND | ND | 0 |
| 40 | 197 | 62 | ND | ND | 0 |
| Set | Nodes | ||
|---|---|---|---|
| I-Type | X-Type | Y-Type | |
| All sets | 1162 (68%) | 343 (20%) | 193 (12%) |
| K1a | 219 (59%) | 120 (32%) | 35 (9%) |
| K1b | 492 (66%) | 183 (24%) | 74 (10%) |
| K2 | 317 (57%) | 199 (36%) | 41 (7%) |
| K3 | 114 (40%) | 141 (49%) | 30 (11%) |
| K4 | 20 (27%) | 42 (56%) | 13 (17%) |
| Set | Nodes | ||
|---|---|---|---|
| I-Type | X-Type | Y-Type | |
| All sets | 39 (80%) | 3 (6%) | 7 (14%) |
| K1a | 3 (60%) | 1 (20%) | 1 (20%) |
| K1b | 1 (33%) | 1 (33%) | 1 (33%) |
| K2 | 34(77%) | 3 (7%) | 7 (16%) |
| K3 | 1 (50%) | 0 (0%) | 1 (50%) |
| K4 | - | - | - |
Publisher’s Note: MDPI stays neutral with regard to jurisdictional claims in published maps and institutional affiliations. |
© 2022 by the authors. Licensee MDPI, Basel, Switzerland. This article is an open access article distributed under the terms and conditions of the Creative Commons Attribution (CC BY) license (https://creativecommons.org/licenses/by/4.0/).
Share and Cite
Menegoni, N.; Inama, R.; Panara, Y.; Crozi, M.; Perotti, C. Relations between Fault and Fracture Network Affecting the Lastoni di Formin Carbonate Platform (Italian Dolomites) and Its Deformation History. Geosciences 2022, 12, 451. https://doi.org/10.3390/geosciences12120451
Menegoni N, Inama R, Panara Y, Crozi M, Perotti C. Relations between Fault and Fracture Network Affecting the Lastoni di Formin Carbonate Platform (Italian Dolomites) and Its Deformation History. Geosciences. 2022; 12(12):451. https://doi.org/10.3390/geosciences12120451
Chicago/Turabian StyleMenegoni, Niccolò, Riccardo Inama, Yuri Panara, Matteo Crozi, and Cesare Perotti. 2022. "Relations between Fault and Fracture Network Affecting the Lastoni di Formin Carbonate Platform (Italian Dolomites) and Its Deformation History" Geosciences 12, no. 12: 451. https://doi.org/10.3390/geosciences12120451
APA StyleMenegoni, N., Inama, R., Panara, Y., Crozi, M., & Perotti, C. (2022). Relations between Fault and Fracture Network Affecting the Lastoni di Formin Carbonate Platform (Italian Dolomites) and Its Deformation History. Geosciences, 12(12), 451. https://doi.org/10.3390/geosciences12120451