

Formation of Metastability of Pore Gas Hydrates in Frozen Sediments: Experimental Evidence

 ,
, 
 ,
,
Abstract
1. Introduction
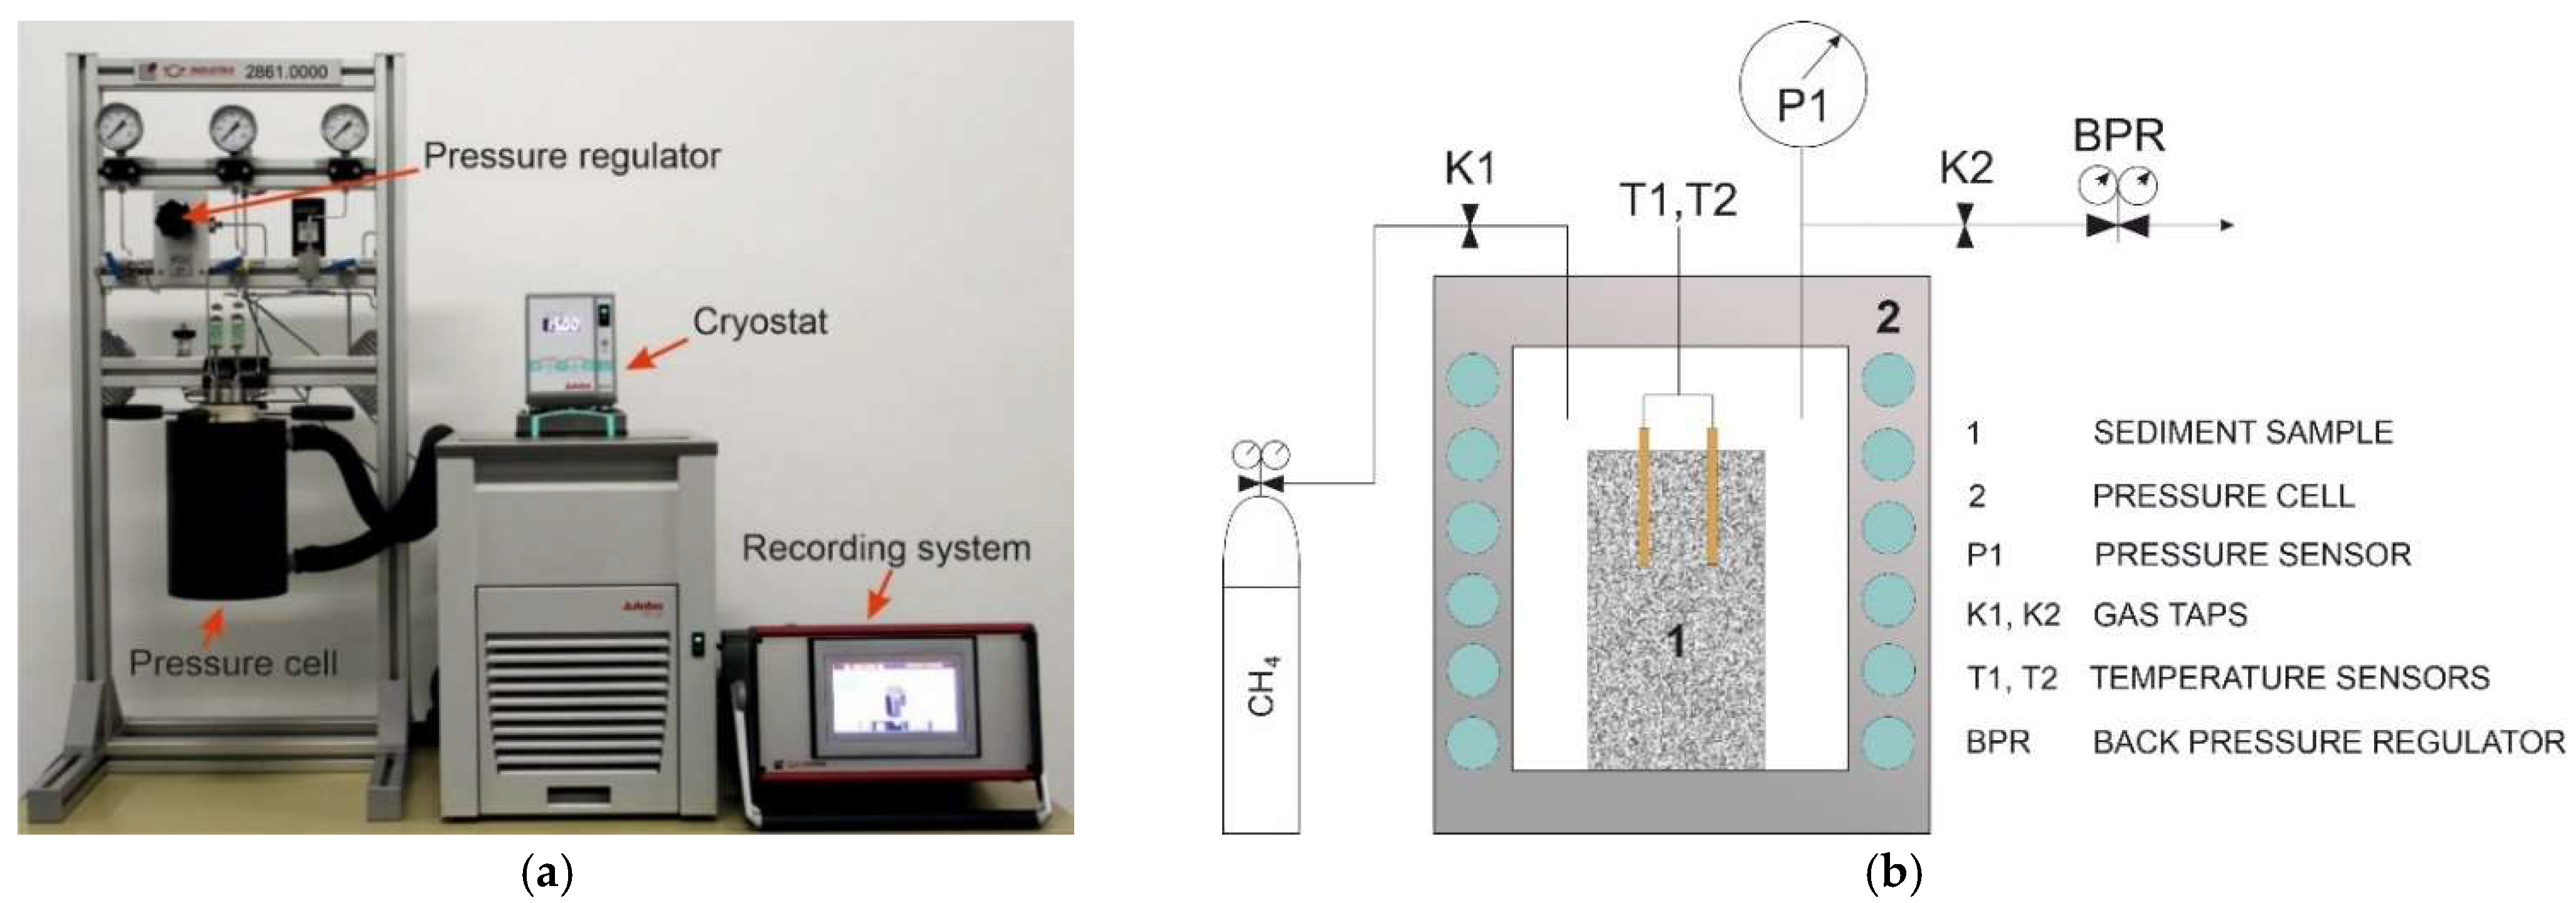
2. Materials and Methods
3. Results and Discussion
3.1. Structure Defects in Gas Hydrate Particles
3.2. Clay Content and Mineralogy
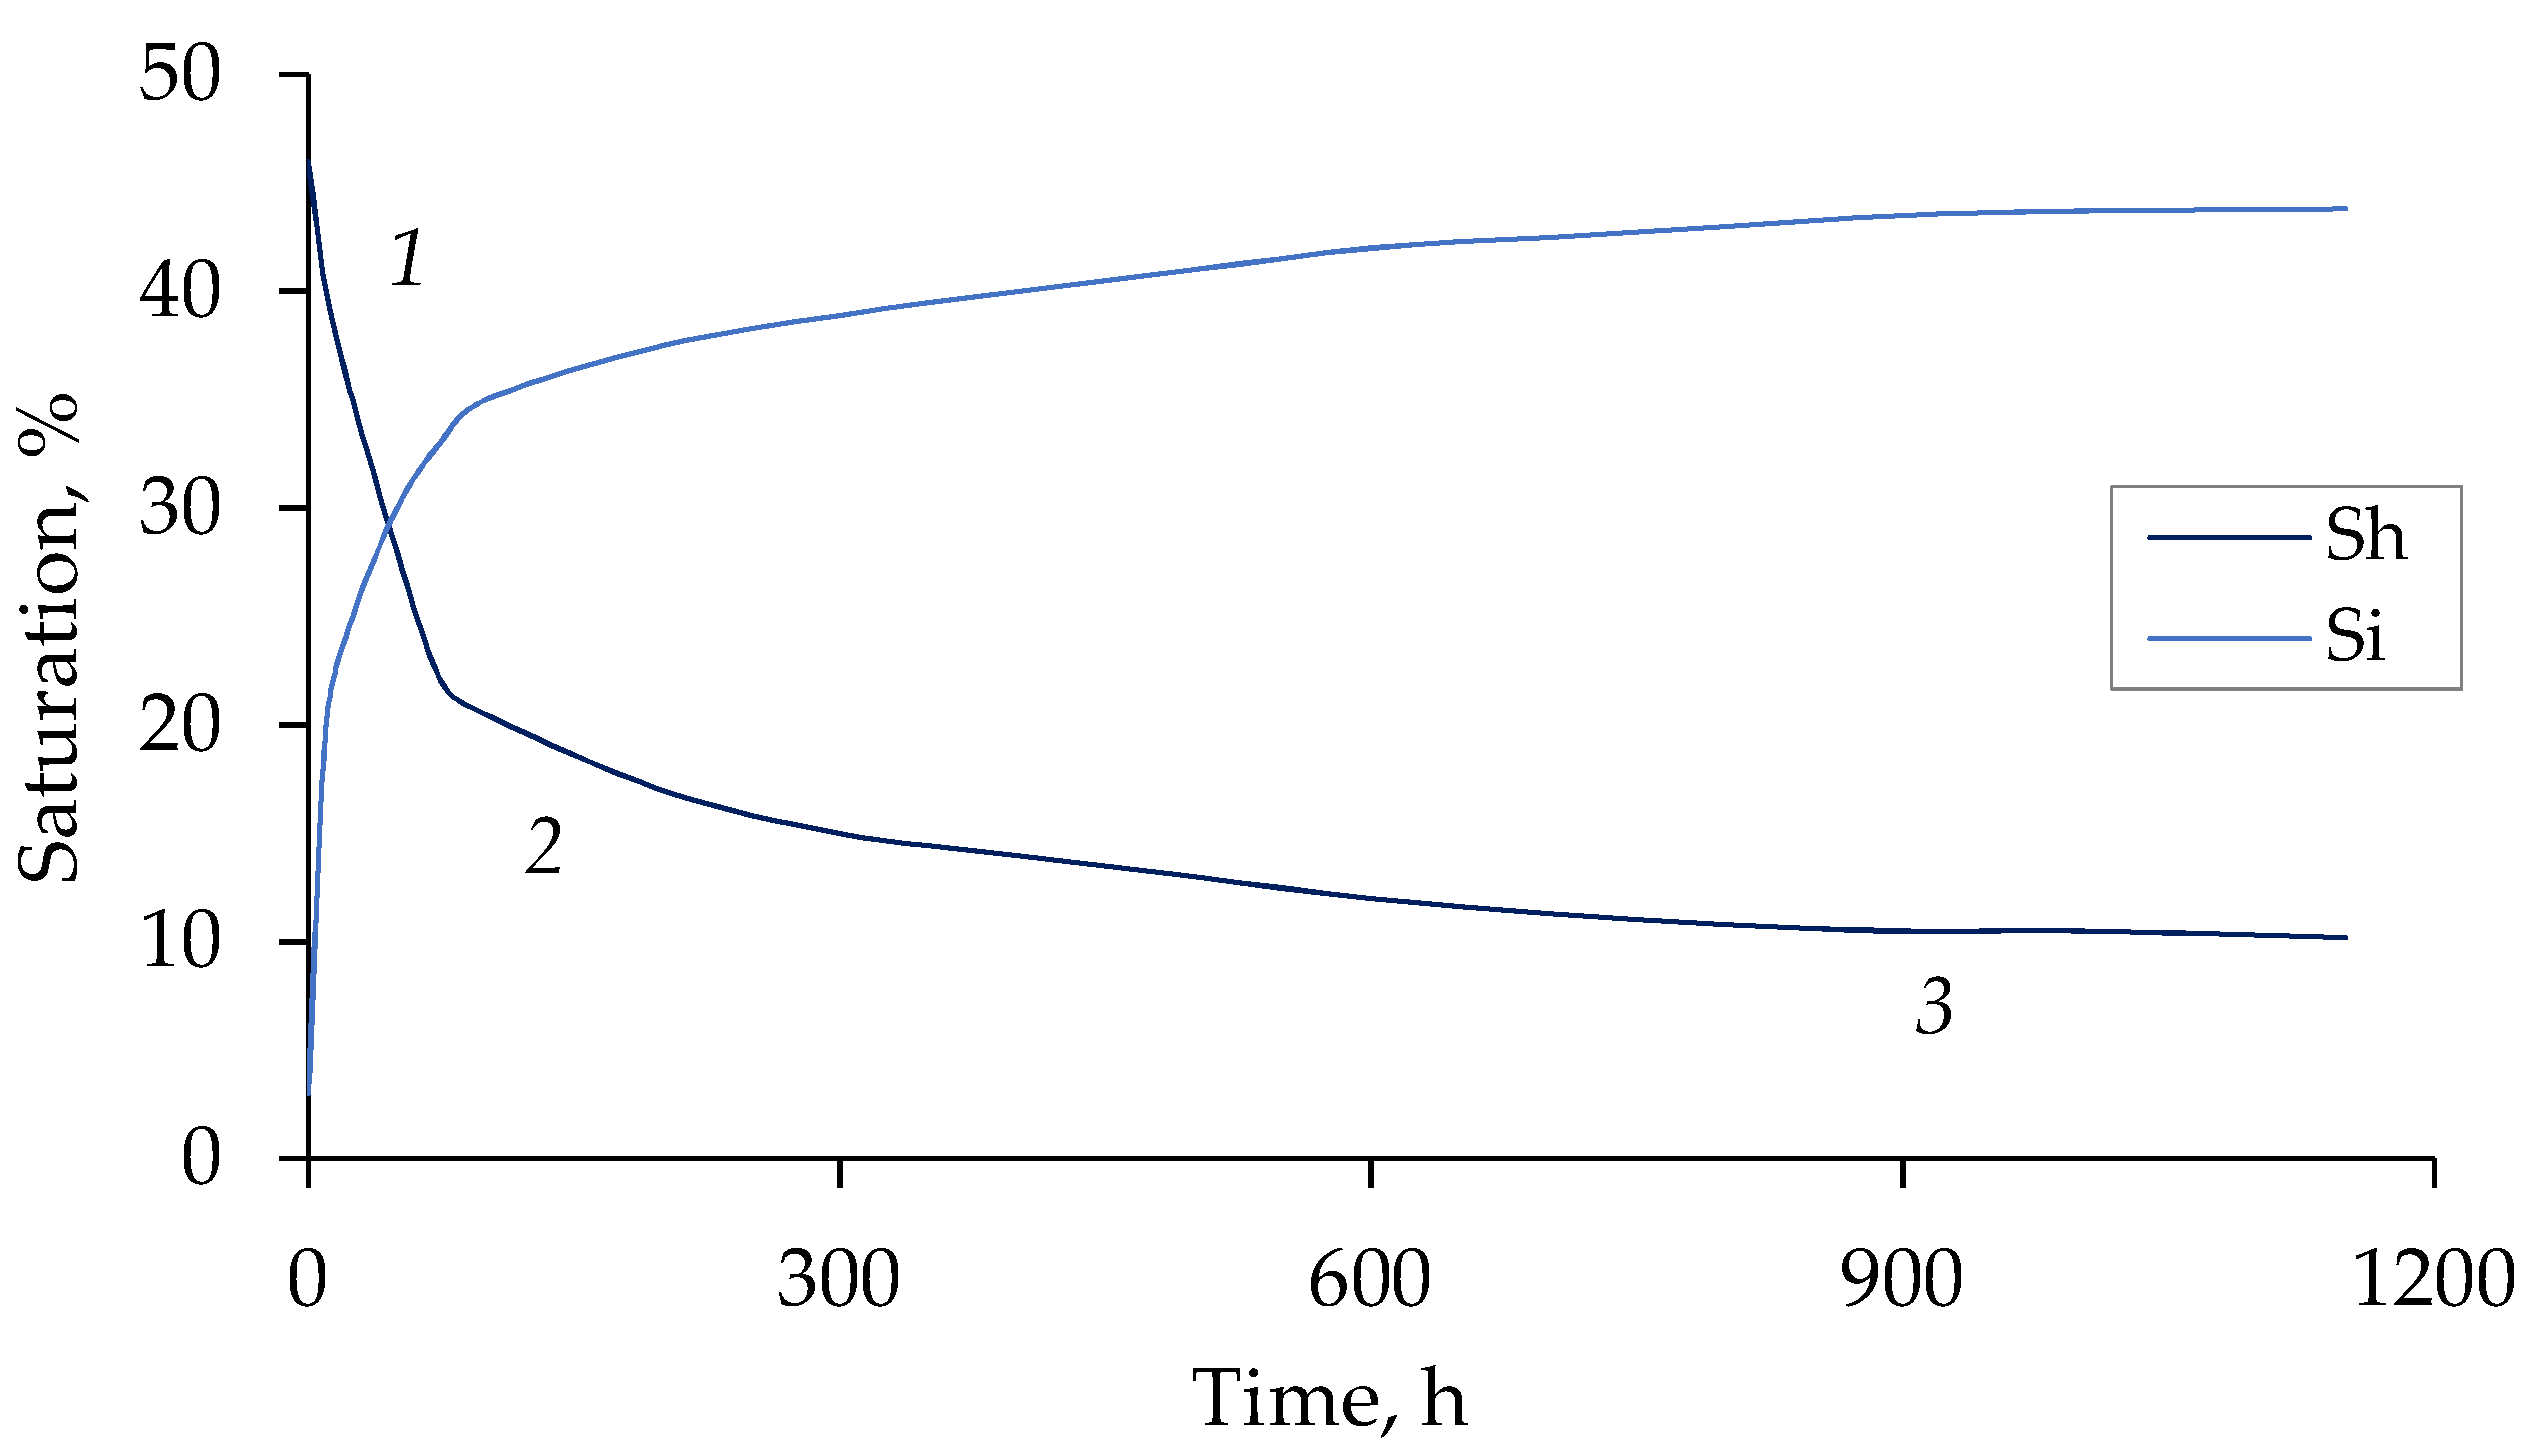
3.3. Hydrate Saturation
3.4. Salinity
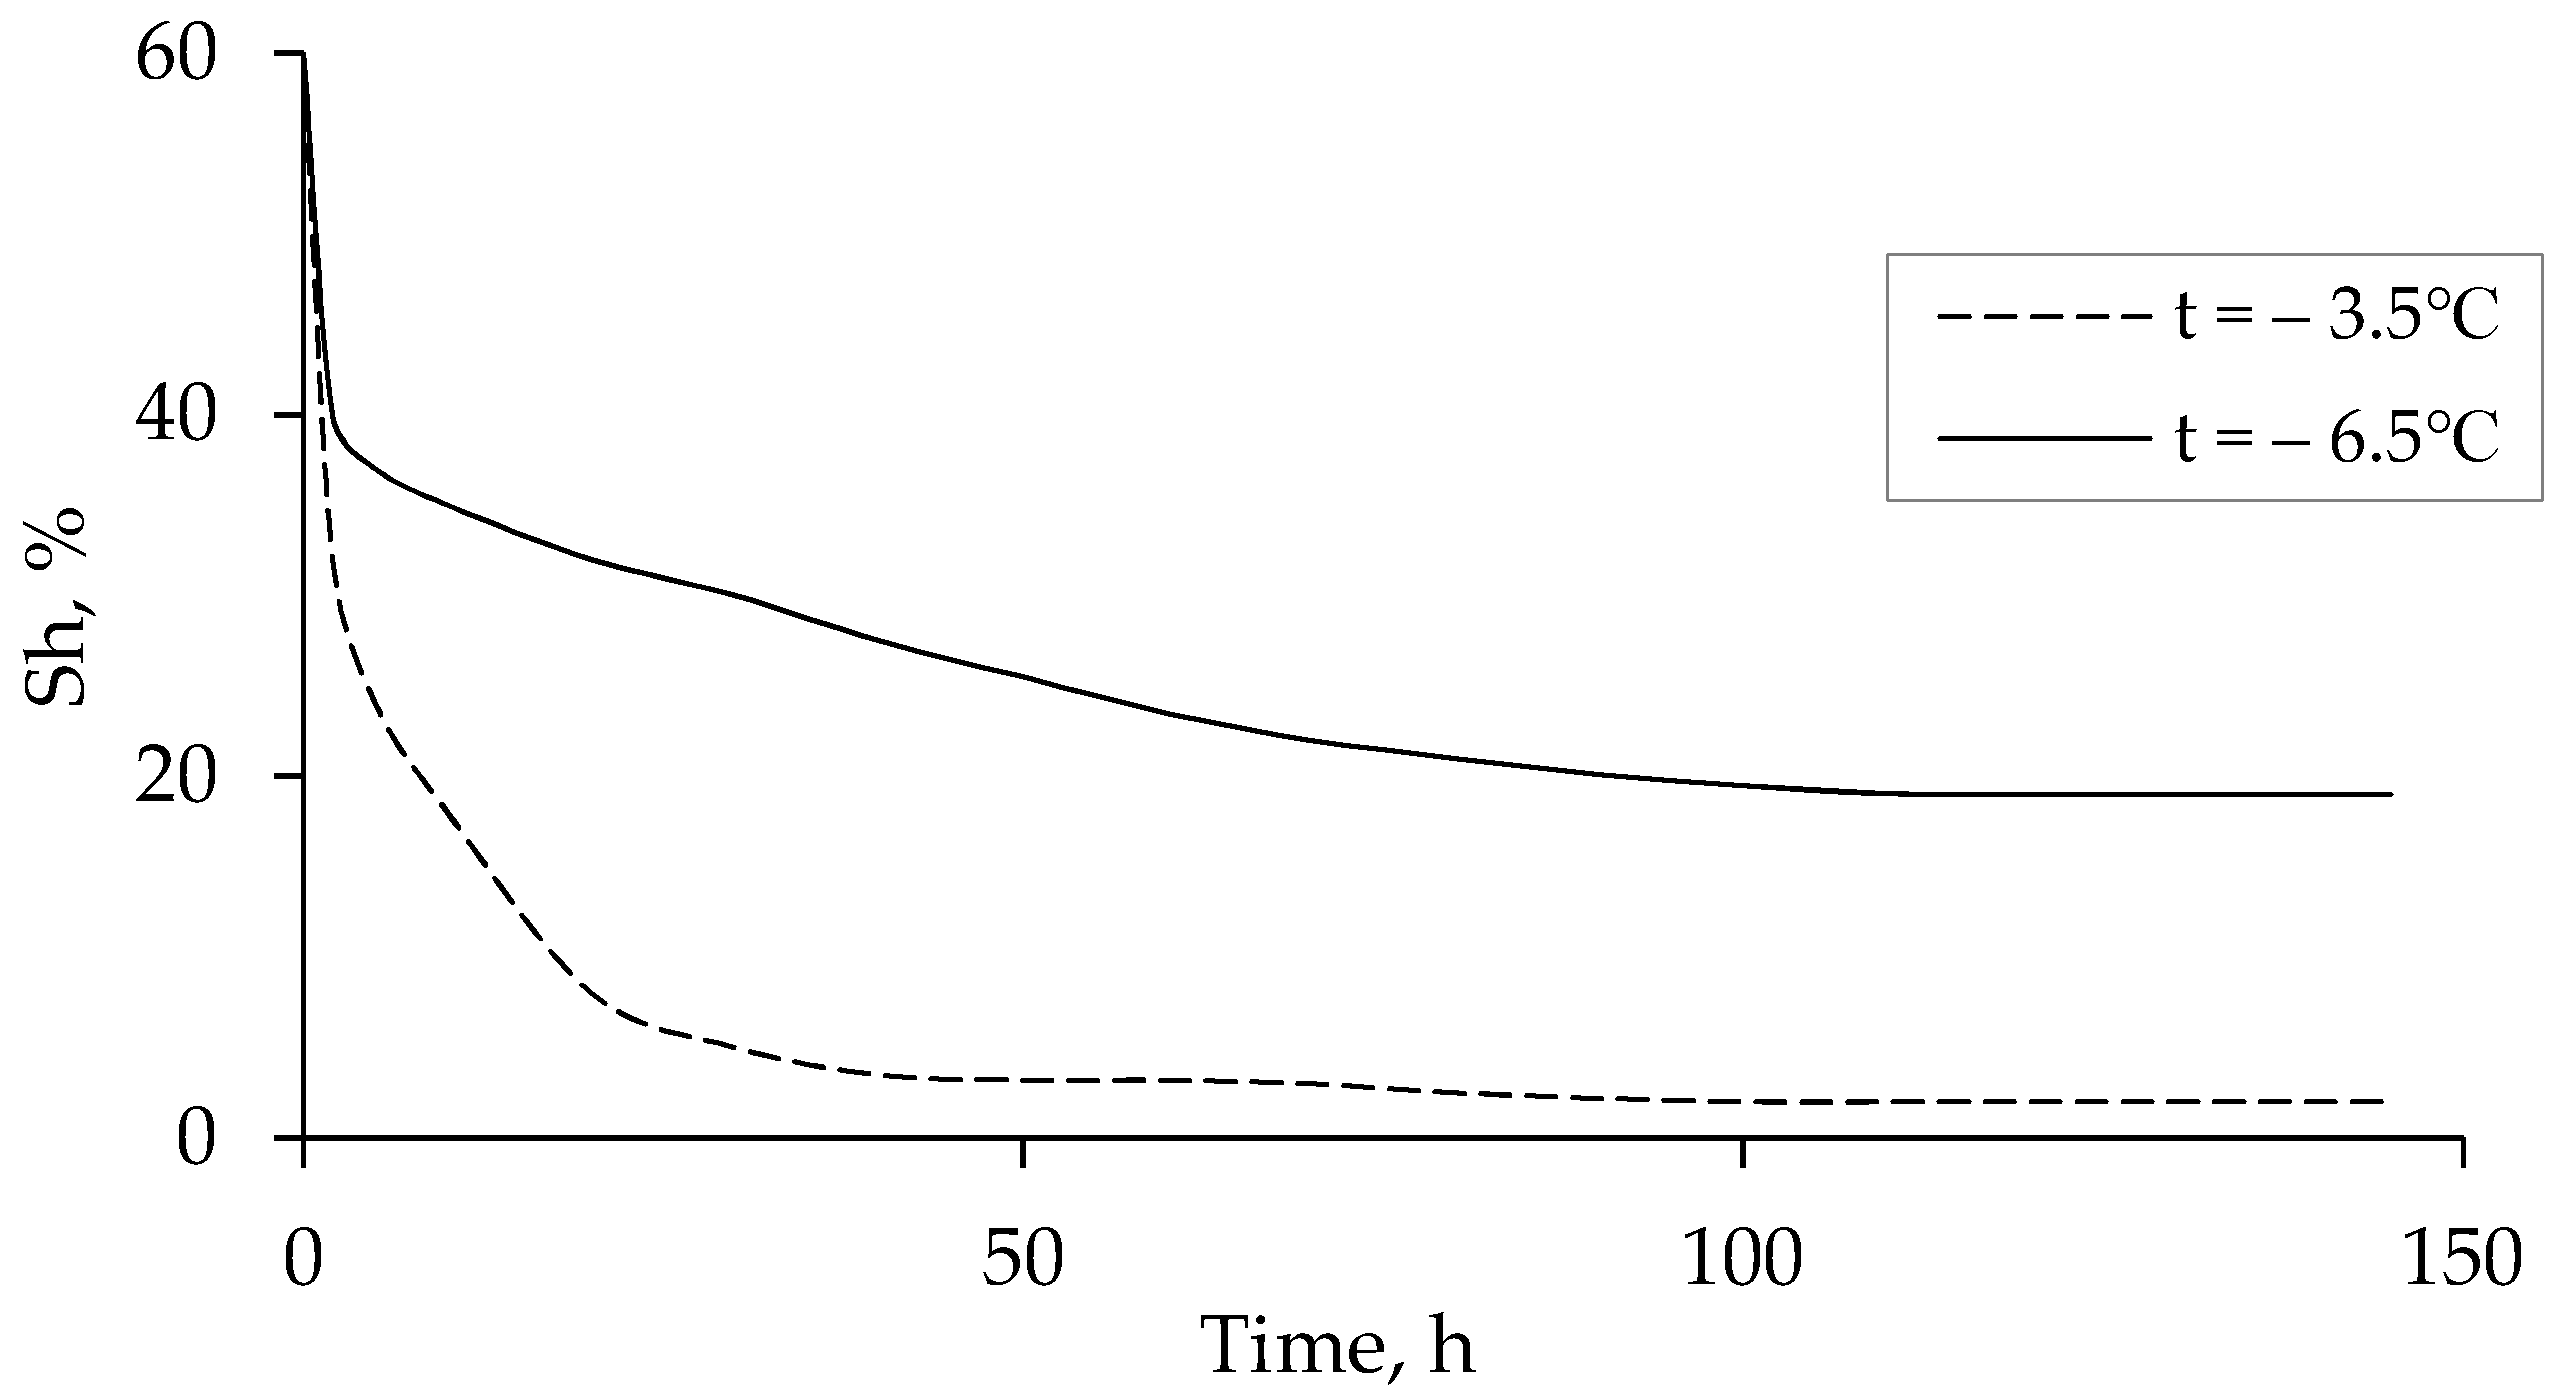
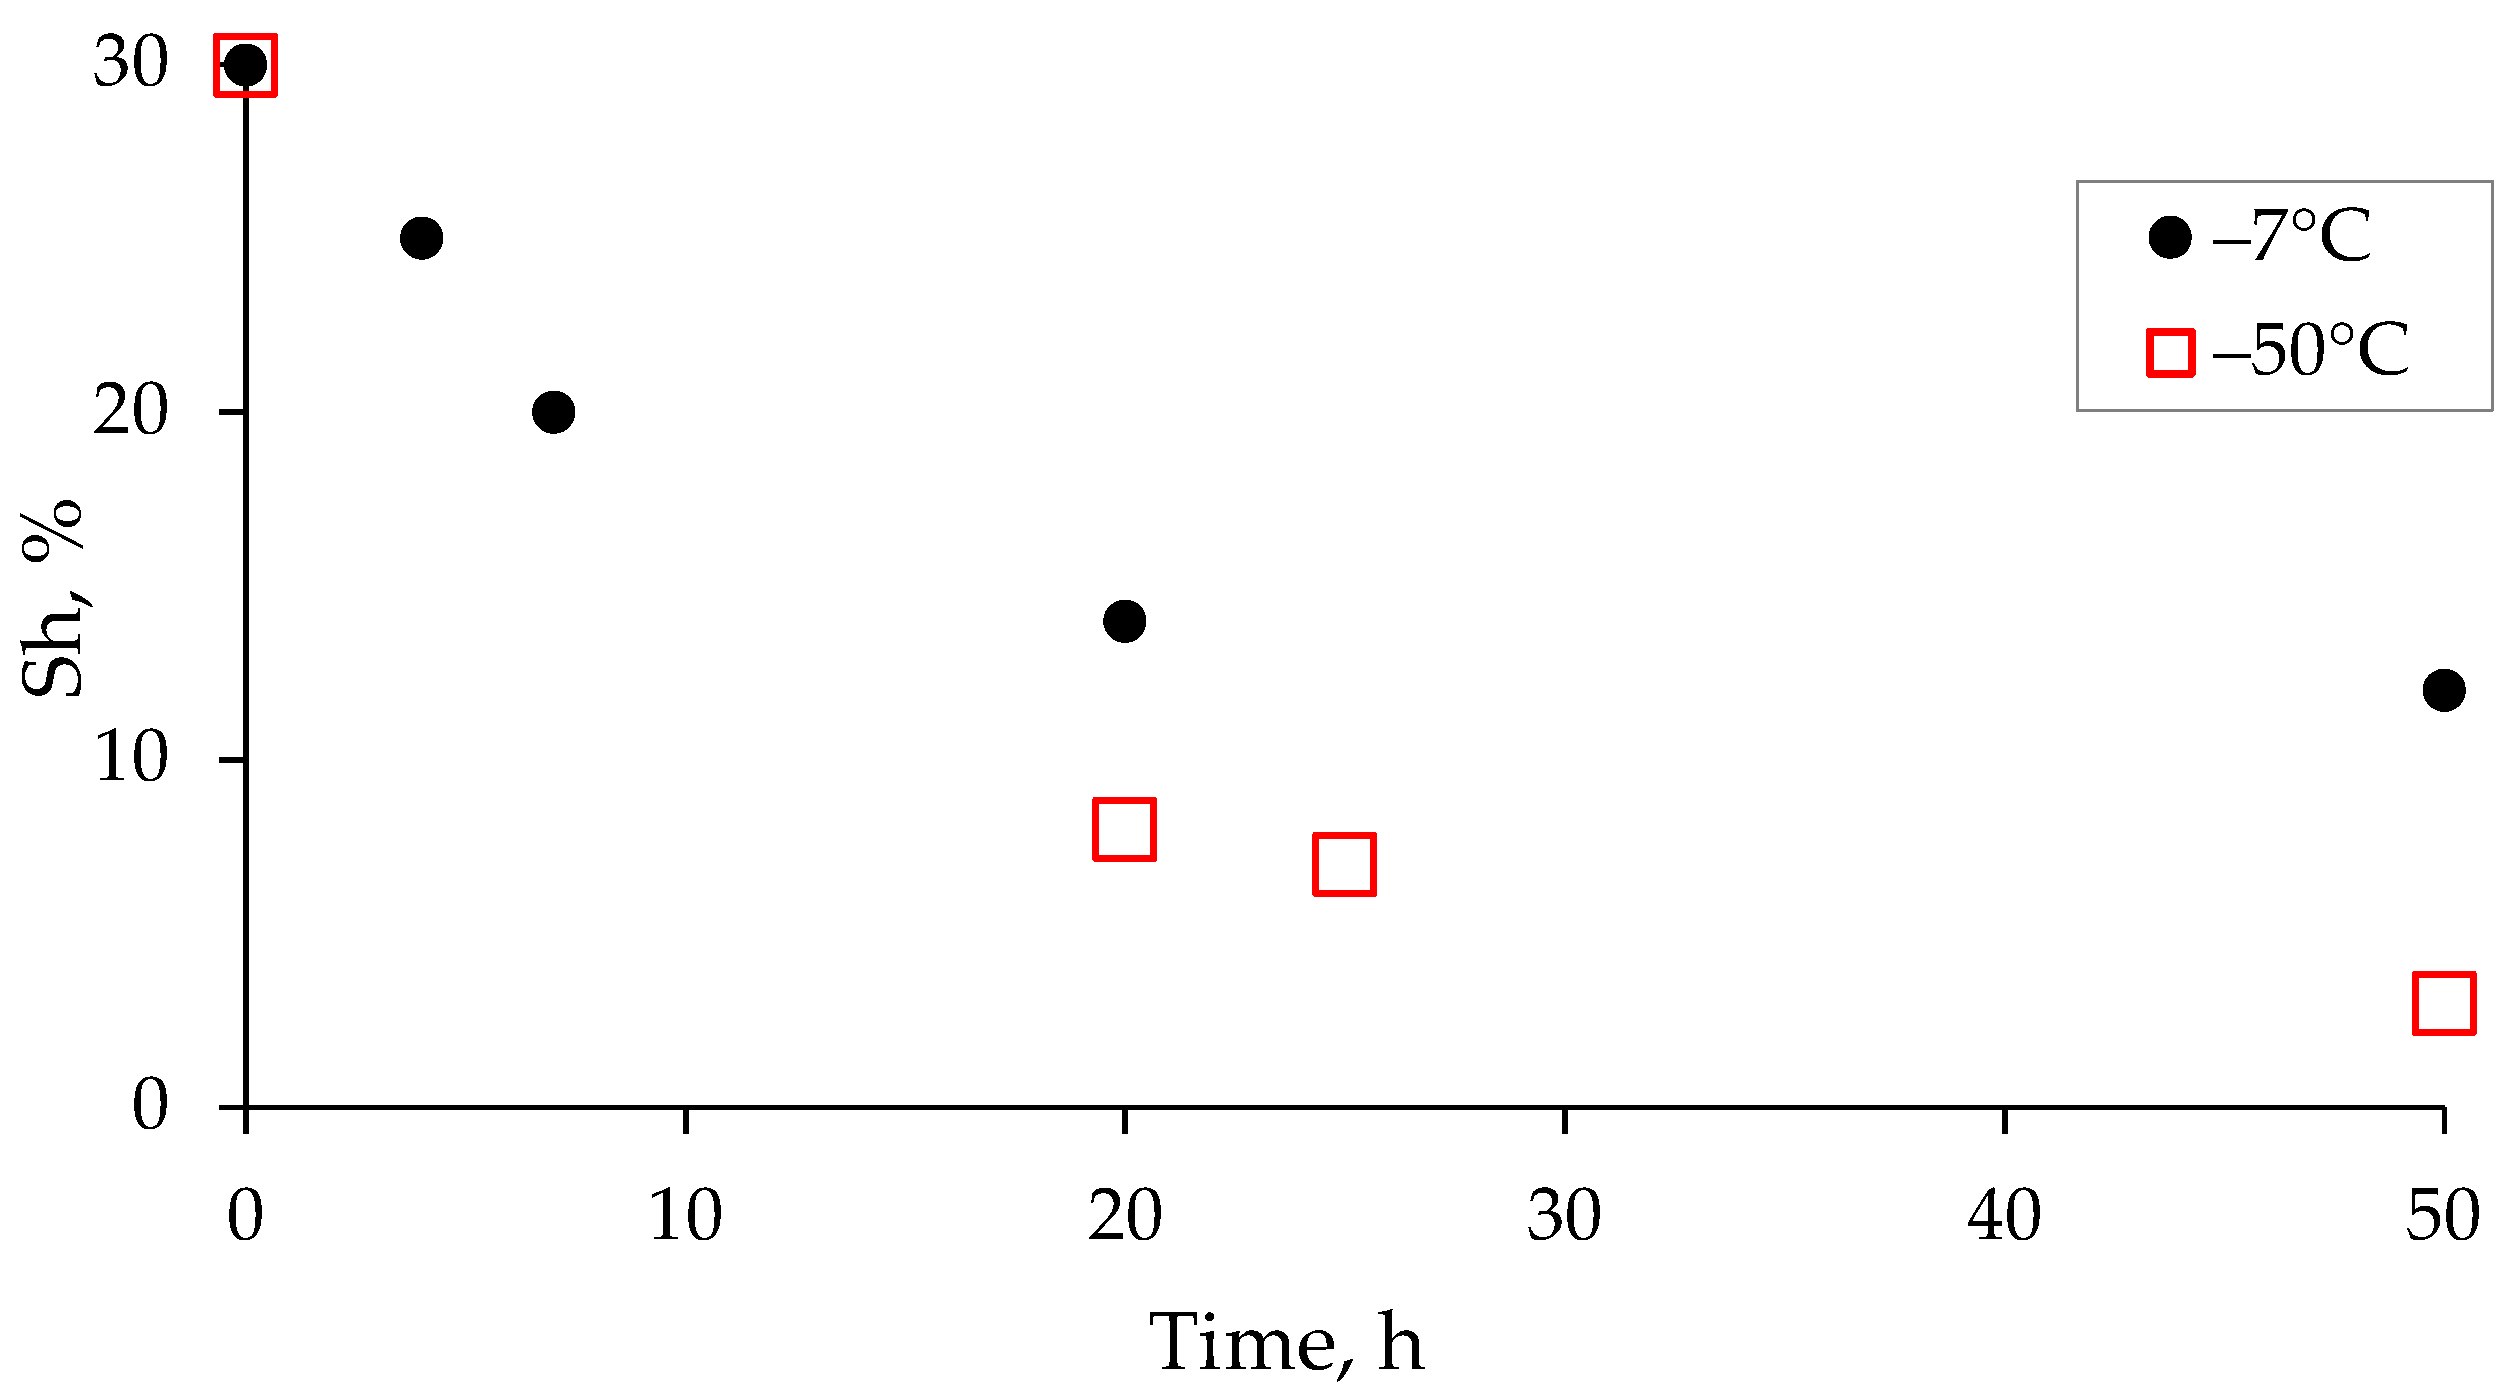
3.5. Temperature
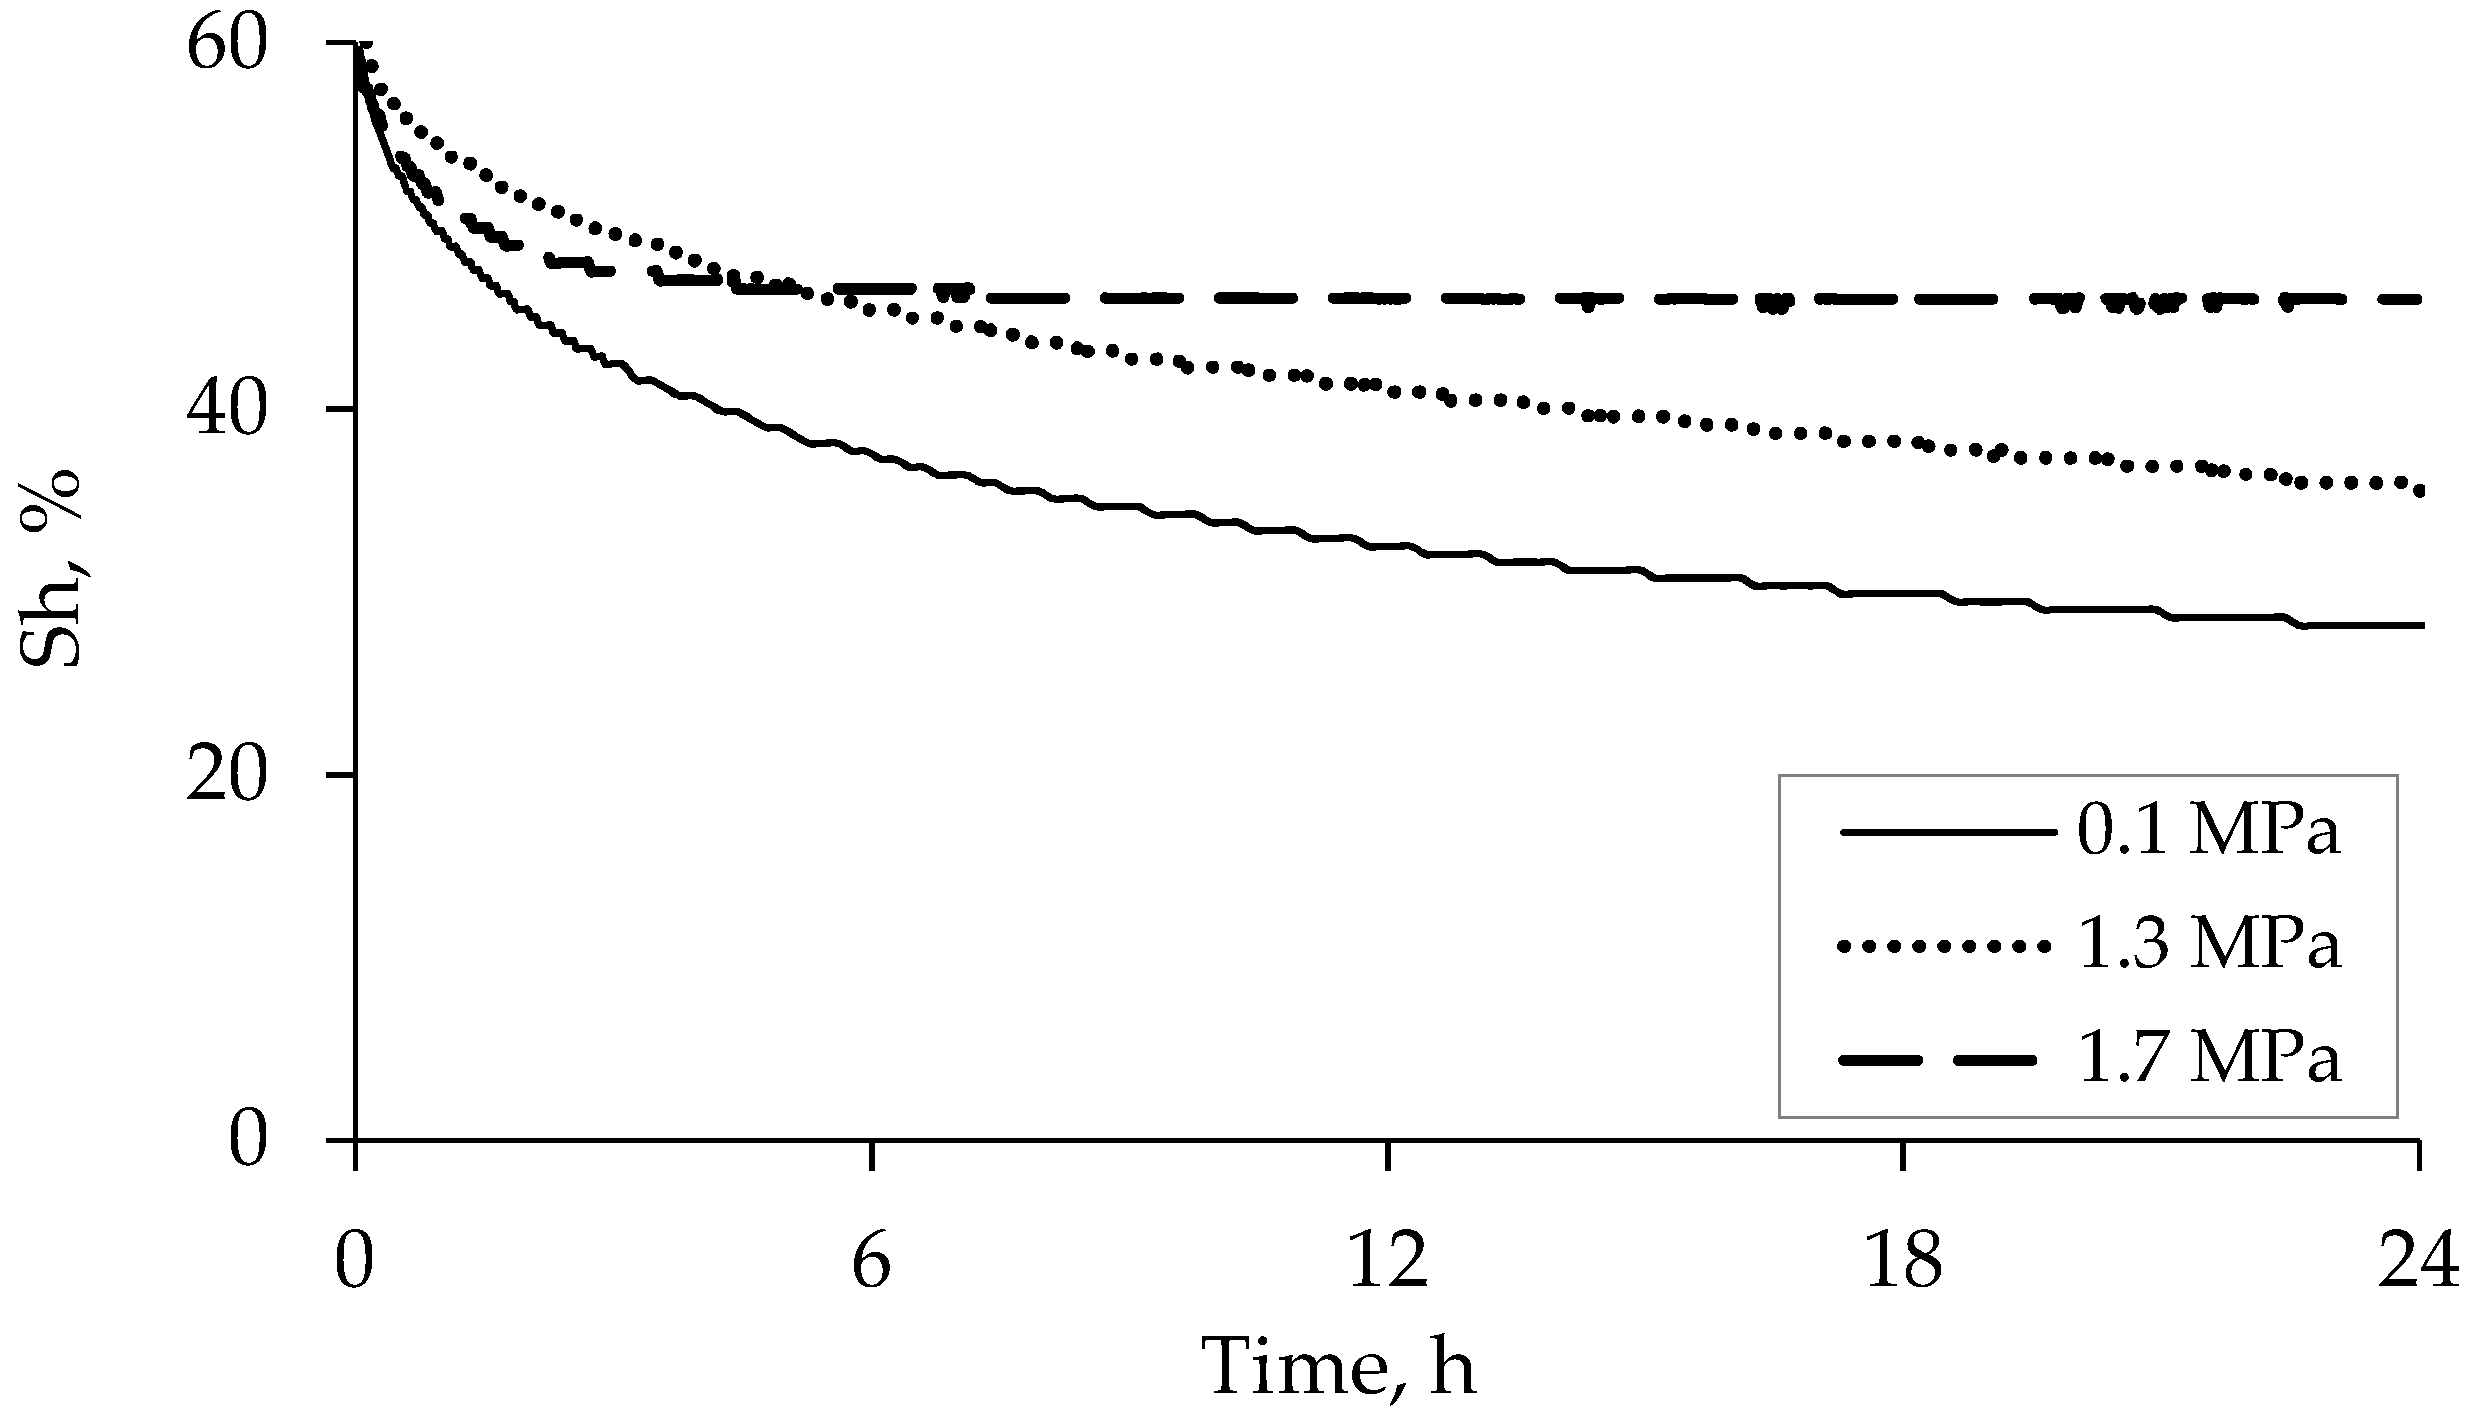
3.6. Gas Pressure
4. Conclusions
Author Contributions
Funding
Institutional Review Board Statement
Informed Consent Statement
Data Availability Statement
Acknowledgments
Conflicts of Interest
References
- Chersky, N.J.; Makogon, Y.F. Solid Gas World Reserves Are Enormous. Oil Gas Int. 1970, 10, 82–84. [Google Scholar]
- Max, M.D. Natural Gas Hydrate in Oceanic and Permafrost Environments; Kluwer Acad: Dordrecht, London, UK, 2000; p. 414. ISBN 1384-6434. [Google Scholar] [CrossRef]
- Sloan, E.D.; Koh, C.A. Clathrate Hydrates of Natural Gases, 3rd ed.; CRC Press: Boca Raton, FL, USA, 2008; p. 752. ISBN 9780429129148. [Google Scholar] [CrossRef]
- Dallimore, S.R.; Collett, T.S. Interpermafrost gas hydrates from a deep core hole in the Mackenzie Delta, Northwest Territories, Canada. Geology 1995, 23, 527–530. [Google Scholar] [CrossRef]
- Dallimore, S.R.; Chuvilin, E.M.; Yakushev, V.S.; Grechischev, S.E.; Ponomarev, V.; Pavlov, A. Field and laboratory characterization of interpermafrost gas hydrates, Mackenzie Delta, NWT Canada. In Proceedings of the 2th International Conference on Gas Hydrate, Toulouse, France, 2–6 June 1996; pp. 525–531. [Google Scholar]
- Chuvilin, E.M.; Yakushev, V.S. Structure and some properties of frozen hydrate-containing soils. In Proceedings of the International Symposium on Methane Hydrates Resourses in the Near Future, JNOC, Chiba City, Japan, 20–22 October 1998; pp. 239–246. [Google Scholar]
- Yakushev, V.S.; Chuvilin, E.M. Natural gas and hydrate accumulation within permafrost in Russia. Cold Reg. Sci. Technol. 2000, 149, 46–50. [Google Scholar] [CrossRef]
- Istomin, V.A.; Yakushev, V.S.; Mokhonina, N.A.; Kwon, V.G.; Chuvilin, E.M. Self-preservation phenomenon of gas hydrate. Gas Ind. Russ. 2006, 4, 16–27. (In Russian) [Google Scholar]
- Davidson, D.W.; Garg, S.K.; Gough, S.R.; Hand, Y.P.; Ratcliffe, C.I.; Ripmeester, J.A.; Tse, J.S.; Lawson, W.F. Laboratory analysis of a naturally occurring gas hydrate from sediment of the Gulf of Mexico. Geochim. Cosmochim. Acta 1986, 50, 619–623. [Google Scholar] [CrossRef]
- Handa, Y.P. Calorimetric determinations of the composition, enthalpies of dissociation and heat capacities in the range 85 to 270 K for clathrate hydrates of xenon and krypton. J. Chem. Thermodyn. 1986, 18, 891–902. [Google Scholar] [CrossRef]
- Handa, Y.P. A calorimetric study of naturally occurring gas hydrates. Ind. Eng. Chem. Res. 1988, 27, 872–874. [Google Scholar] [CrossRef]
- Yakushev, V.S. Experimental study of the methane hydrate dissociation kinetics at negative temperatures. EI VNIIGazprom Ser. Dev. Oper. Gas Gas Condens. Fields 1988, 4, 11–14. (In Russian) [Google Scholar]
- Ershov, E.D.; Lebedenko, Y.P.; Chuvilin, E.M.; Yakushev, V.S. Experimental study of the microstructure of the ice-methane hydrate agglomerate. Eng. Geol. 1990, 3, 38–44. (In Russian) [Google Scholar]
- Ershov, E.D.; Lebedenko, Y.P.; Chuvilin, E.M.; Istomin, V.A.; Yakushev, V.S. Features of gas hydrate occurrence in permafrost. USSR Acad. Sci. 1991, 321, 788–791. (In Russian) [Google Scholar]
- Ershov, E.D.; Yakushev, V.S. Experimental research on gas hydrate decomposition in frozen rocks. Cold Reg. Sci. Technol. 1992, 20, 147–156. [Google Scholar] [CrossRef]
- Gudmundsson, J.S.; Parlaktuna, M.; Knokhar, A. Storing natural gas as frozen hydrate. SPE Prod. Facil. 1994, 9, 69–73. [Google Scholar] [CrossRef]
- Stern, L.; Circone, S.; Kirby, S.; Durham, W. Anomalous Preservation of Pure Methane hydrate at 1 atm. J. Phys. Chem. B 2001, 105, 1756–1762. [Google Scholar] [CrossRef]
- Stern, L.; Circone, S.; Kirby, S.H.; Durham, W. Temperature, pressure, and compositional effects on anomalous or “self” preservation of gas hydrates. Can. J. Phys. 2003, 81, 271–283. [Google Scholar] [CrossRef]
- Majid, A.A.A.; Koh, C.A. Self-Preservation Phenomenon in Gas Hydrates and its Application for Energy Storage. In Intra- and Intermolecular Interactions between Non-Covalently Bonded Species; Elsevier: Amsterdam, The Netherlands, 2021; pp. 267–285. [Google Scholar] [CrossRef]
- Chuvilin, E.M.; Kozlova, E.V. Experimental estimation of hydrate-bearing sediments stability. In Proceedings of the 5th International Conference on Gas Hydrate Thermodynamic Aspects, Trondheim, Norway, 13–16 June 2005. [Google Scholar]
- Chuvilin, E.M.; Guryeva, O.M. Experimental study of self-preservation effect of gas hydrates in frozen sediments. In Proceedings of the 9th International Conference on Permafrost, Fairbanks, AK, USA, 23 June–3 July 2008; pp. 263–267. [Google Scholar]
- Kwon, T.-H.; Cho, G.-C.; Santamarin, J.C. Gas hydrate dissociation in sediments: Pressure-temperature evolution. Geochem. Geophys. Geosyst 2008, 9, Q03019. [Google Scholar] [CrossRef]
- Chuvilin, E.M.; Buhanov, B.A.; Guryeva, O.M.; Istomin, V.A.; Takeya, S.; Hachikubo, A. Experimental study of self-preservation mechanisms during gas hydrate decomposition in frozen sediments. In Proceedings of the 7th International Conference on Gas Hydrates (ICGH 2011), Edinburgh, UK, 17–21 July 2011; pp. 1–9. [Google Scholar]
- Hachikubo, A.; Takeya, S.; Chuvilin, E.; Istomin, V. Preservation phenomena of methane hydrate in pore spaces. Phys. Chem. Chem. Phys. 2011, 13, 17449–17452. [Google Scholar] [CrossRef] [PubMed]
- Takeya, S.; Fujihisa, H.; Gotoh, Y.; Istomin, V.; Chuvilin, E.; Sakagami, H.; Hachikubo, A. Methane clathrate hydrates formed within hydrophilic and hydrophobic porous media: Kinetics of dissociation and distortion of host structure. J. Phys. Chem. C 2013, 117, 7081–7085. [Google Scholar] [CrossRef]
- Chuvilin, E.; Bukhanov, B.; Davletshina, D.; Grebenkin, S.; Istomin, V. Dissociation and Self-Preservation of Gas Hydrates in Permafrost. Geosciences 2018, 8, 431. [Google Scholar] [CrossRef]
- Podenko, L.S.; Drachuk, A.O.; Molokitina, N.S.; Nesterov, A.N. Effect of silica nanoparticles on dry water gas hydrate formation and self-preservation efficiency. Zhurnal Fiz. Khimii 2018, 92, 239–246. (In Russian) [Google Scholar] [CrossRef]
- Yakushev, V.S. Mechanisms of natural gas concentration in the cryolithozone. Actual Probl. Oil Gas 2018, 4, 71. [Google Scholar] [CrossRef]
- Nikitin, V.V.; Dugarov, G.A.; Duchkov, A.A.; Fokin, M.I.; Drobchik, A.N.; Shevchenko, P.D.; Francesco De, C.; Rajmund, M. Dynamic in-situ imaging of methane hydrate formation and self-preservation in porous media. Mar. Pet. Geol. 2020, 115, 104234. [Google Scholar] [CrossRef]
- Takeya, S.; Ebinuma, T.; Uchida, T.; Nagao, J.; Narita, H. Self-preservation effect and dissociation rates of CH4 hydrate. J. Cryst. Growth 2002, 237, 379–382. [Google Scholar] [CrossRef]
- Takeya, S.; Uchida, T.; Nagao, J.; Ohmura, R.; Shimada, W.; Kamata, Y.; Ebinuma, H.; Narita, H. Particle size effect of CH4 hydrate for self-preservation. Chemecal Eng. Sci. 2005, 60, 1383–1387. [Google Scholar] [CrossRef]
- Takeya, S.; Yoneyama, A.; Ueda, K.; Mimachi, H.; Takahashi, M.; Sano, K.; Hyodo, K.; Takeda, T.; Gotoh, Y. Anomalously preserved clathrate hydrate of natural gas in pellet form at 253 K. J. Phys. Chem. C 2012, 116, 13842–13848. [Google Scholar] [CrossRef]
- Takeya, S.; Mimachi, H.; Murayama, T. Methane storage in water frameworks: Self-preservation of methane hydrate pellets formed from NaCl solutions. Appl. Energy 2018, 230, 86–93. [Google Scholar] [CrossRef]
- Kuhs, W.F.; Genov, G.; Staykova, D.K.; Hansen, T. Ice perfection and onset of anomalous preservation of gas hydrates. Phys. Chem. Chem. Phys. 2004, 6, 4917–4920. [Google Scholar] [CrossRef]
- Shimada, W.; Takeya, S.; Kamata, Y.; Uchida, T.; Nagao, J.; Ebinuma, T.; Narita, H. Mechanism of self-preservation during dissociation of methane clathrate hydrate. In Proceedings of the 5th International Conference on Gas Hydrate, Trondheim, Norway, 13–16 June 2005. [Google Scholar]
- Falenty, A.; Kuhs, W.F. “Self-Preservation” of CO2 Gas Hydratess Surface Microstructure and Ice Perfection. J. Phys. Chem. B 2009, 113, 15975–15988. [Google Scholar] [CrossRef]
- Melnikov, V.P.; Nesterov, A.N.; Reshetnikov, A.M.; Zavodovsky, A.G. Evidence of liquid water formation during methane hydrates dissociation below the ice point. Chem. Eng. Sci. 2009, 64, 1160–1166. [Google Scholar] [CrossRef]
- Melnikov, V.P.; Nesterov, A.N.; Reshetnikov, A.M.; Istomin, V.A. Metastable states during dissociation of carbon dioxide hydrates below 273 K. Chem. Eng. Sci. 2011, 66, 73–77. [Google Scholar] [CrossRef]
- Takeya, S.; Ripmeester, J.A. Anomalous Preservation of CH4 hydrate and its dependence on the morphology of hexagonal ice. Phys. Chem. Chem. Phys. 2010, 11, 70–73. [Google Scholar] [CrossRef]
- Ohno, H.; Nishimura, O.; Suzuki, K.; Narita, H.; Nagao, J. Morphological and compositional characterization of self-preserved gas hydrates by low-vacuum scanning electron microscopy. Chem. Phys. Chem. 2011, 12, 1661–1665. [Google Scholar] [CrossRef] [PubMed]
- Uchida, T.; Kida, M.; Nagao, J. Dissociation termination of methane–ethane hydrates in temperature-ramping tests at atmospheric pressure below the melting point of ice. Chem. Phys. Chem. 2011, 12, 1652–1656. [Google Scholar] [CrossRef] [PubMed]
- Nguyen, A.H.; Koc, M.A.; Shepherd, T.D.; Molinero, V. Structure of the Ice–Clathrate Interface. J. Phys. Chem. C 2015, 119, 4104–4117. [Google Scholar] [CrossRef]
- Zhong, J.-R.; Zeng, X.-Y.; Zhou, F.-H.; Ran, Q.-D.; Sun, C.-Y.; Zhong, R.-Q.; Yang, L.-Y.; Chen, G.-J.; Koh, C.A. Self-preservation and structural transition of gas hydrates during dissociation below the ice point: An in-situ study using Raman spectroscopy. Sci. Rep. 2016, 6, 13. [Google Scholar] [CrossRef]
- Mimachi, H.; Takeya, S.; Yoneyama, A.; Hyodo, K.; Takeda, T.; Gotoh, Y.; Murayama, T. Natural gas storage and transportation within gas hydrate of smaller particle: Size dependence of self-preservation phenomenon of natural gas hydrate. Chem. Eng. Sci. 2014, 118, 208–213. [Google Scholar] [CrossRef]
- Prasad, P.S.R.; Kiran, B.S. Self-preservation and Stability of Methane Hydrates in the Presence of NaCl. Sci. Rep. 2019, 9, 5860. [Google Scholar] [CrossRef]
- Stoporev, A.S.; Manakov, A.Y.; Altunina, L.K.; Strelets, L.A. Self-Preservation of Gas Hydrate Particles Suspended in Crude Oils and Liquid Hydrocarbons: Role of Preparation Method, Dispersion Media, and Hydrate Former. Energy Fuels 2016, 3011, 9014–9021. [Google Scholar] [CrossRef]
- Kuhs, W.F.; Staykova, D.K.; Salamatin, A.N. Formation of methane hydrate from polydisperse ice powders. Phys. Chem. B 2006, 110, 13283–13295. [Google Scholar] [CrossRef]
- Ershov, E.D.; Yakushev, V.S.; Chuvilin, E.M. Laboratory studies of frozen natural and artificial hydrate-bearing rock samples. In Proceedings of the 2th International Conference on Gas Hydrate, France, Toulouse, 2–6 June 1996; pp. 525–531. [Google Scholar]
- Minagawa, H.; Ohmura, R.; Kamata, Y. Water permeability measurements of gas hydrate-bearing sediments. In Proceedings of the Fifth International Conference on Gas Hydrates, Trondheim, Norway, 13–16 June 2005; Tapir Academic Press: Trondheim, Norway, 2005; pp. 398–401. [Google Scholar]
- Murray, D.; Fukuhara, M.; Khong, C.K.; Namikawa, T.; Yamamoto, K. Permeability estimates in gas hydrate reservoirs of the Nankai trough. In Proceedings of the SPWLA 47th Annual Logging Symposium, Veracruz, Mexico, 4–7 June 2006; pp. 1–6. [Google Scholar]
- Kumar, A.; Maini, B.; Bishnoi, P.R.; Clarke, M.; Zatsepina, O.; Srinivasan, S. Experimental determination of permeability in the presence of hydrates and its effect on the dissociation characteristics of gas hydrates in porous media. J. Pet. Sci. Eng. 2010, 70, 114–122. [Google Scholar] [CrossRef]
- Miyazaki, K.; Masui, A.; Sakamoto, Y.; Aoki, K.; Tenma, N.; Yamaguchi, T. Triaxial compressive properties of artificial methane-hydrate-bearing sediment. J. Geophys. Res. 2011, 116(B06102), 1–11. [Google Scholar] [CrossRef]
- Hyodo, M.; Li, Y.; Yoneda, J.; Nakata, Y.; Yoshimoto, N.; Nishimura, A.; Song, Y. Mechanical behavior of gas-saturated methane hydrate-bearing sediments. J. Geophys. Res. Solid Earth 2013, 118, 5185–5194. [Google Scholar] [CrossRef]
- Chuvilin, E.M.; Grebenkin, S.I. Gas permeability variations in gas-filled soils upon hydrate formation and freezing: An experimental study. Kriosf. Zemli 2015, 19, 67–74. (In Russian) [Google Scholar]
- Santamarina, J.C.; Dai, S.; Terzariol, M.; Jang, J.; Waite, W.F.; Winters, W.J. Hydro-bio-geomechanical properties of hydrate bearing sediments from Nankai Trough. Mar. Pet. Geol. 2015, 66, 434–450. [Google Scholar] [CrossRef]
- Yoneda, J.; Masui, A.; Konno, Y.; Jin, Y.; Egawa, K.; Kida, M. Mechanical properties of hydrate-bearing turbidite reservoir in the first gas production test site of the Eastern Nankai Trough. Mar. Pet. Geol. 2015, 66, 471–486. [Google Scholar] [CrossRef]
- Li, Y.; Liu, W.; Zhu, Y.; Chen, Y.; Song, Y.; Li, Q. Mechanical behaviors of permafrost-associated methane hydrate-bearing sediments under different mining methods. Appl. Energy 2016, 162, 1627–1632. [Google Scholar] [CrossRef]
- Chuvilin, E.M.; Bukhanov, B.A. Effect of hydrate accumulation conditions on thermal conductivity of gas-saturated soils. Energy Fuels 2017, 31, 5246–5254. [Google Scholar] [CrossRef]
- Liu, Z.; Dai, S.; Ning, F.; Peng, L.; Wei, H.; Wei, C. Strength estimation for hydrate-bearing sediments from direct shear tests of hydrate-bearing sand and silt. Geophys. Res. Lett. 2018, 45, 715–723. [Google Scholar] [CrossRef]
- Chuvilin, E.M.; Bukhanov, B.A.; Grebenkin, S.I.; Doroshin, V.V.; Iospa, A.V. Shear strength of frozen sand with dissociating pore methane hydrate: An experimental study. Cold Reg. Sci. Technol. 2018, 153, 101–105. [Google Scholar] [CrossRef]
- Chuvilin, E.M.; Grebenkin, S.I.; Zhmaev, M. Gas Permeability Behavior in Frozen Sand Controlled by Formation and Dissociation of Pore Gas Hydrates. Geosciences 2022, 12, 321. [Google Scholar] [CrossRef]
- Yang, J.; Hassanpouryouzband, A.; Tohidi, B.; Chuvilin, E.; Bukhanov, B.; Istomin, V.; Cheremisin, A. Gas hydrates in permafrost: Distinctive effect of gas hydrates and ice on the geomechanical properties of simulated hydrate-bearing permafrost sediments. JGR Solid Earth 2019, 124, 2551–2563. [Google Scholar] [CrossRef]
- Chuvilin, E.M.; Guryeva, O.M. Experimental investigation of CO2 gas hydrate formation in porous media of frozen and freezing sediments. Kriosf. Zemli 2009, 13, 70–79. (In Russian) [Google Scholar]
- Chuvilin, E.M.; Davletshina, D.A.; Lupachik, M.V. Hydrate formation in frozen and thawing methane-saturated sediments. Earth’s Cryosphere 2019, 23, 44–52. [Google Scholar] [CrossRef]
- Davletshina, D.A.; Chuvilin, E.M. Estimation of potential gas hydrate formation in finely dispersed soils at negative temperatures: Experimental modeling. Earth’s Cryosphere 2020, 24, 25–33. [Google Scholar]
- Jahn, R.; Blume, H.P.; Spaargaren, O.; Schad, P. Guidelines for Soil Description; Food and Agriculture Organization of the United Nations: Rome, Italy, 2006. [Google Scholar]
- Chuvilin, E.M.; Petrakova, S.Y.; Guryeva, O.M.; Istomin, V.A. Formation of carbon dioxide gas hydrates in freezing sediments and decomposition kinetics of the hydrates formed. In Proceedings of the 11th Intern. Conference, Physics and Chemistry of Ice, Cambridge, UK, 23–28 July 2007. [Google Scholar]
- Minagawa, H.; Nishikawa, Y.; Ikeda, I.; Miyazaki, K.; Takahara, N.; Sakamoto, Y.; Komai, T.; Narita, H. Characterization of sand sediment by pore size distribution and permeability using proton nuclear magnetic resonance measurement. J. Geophys. Res. 2008, 113, B07210. [Google Scholar] [CrossRef]
- Yang, M.; Chong, Z.R.; Zheng, J.; Song, Y.-C.; Linga, P. Advances in nuclear magnetic resonance (NMR) techniques for the investigation of clathrate hydrates. Renew. Sustain. Energy Rev. 2017, 74, 1346–1360. [Google Scholar] [CrossRef]
- Zhan, J.; Zhang, P.; Wang, Y.; Wu, Q. Experimental research on methane hydrate formation in porous media based on the low-field NMR technique. Chem. Eng. Sci. 2021, 244, 116804. [Google Scholar] [CrossRef]
- Ji, Y.K.; Liu, C.L.; Zhang, Z.; Meng, Q.G.; Liu, L.L.; Zhang, Y.C.; Wu, N.Y. Experimental study on characteristics of pore water conversion during methane hydrates formation in unsaturated sand. China Geol. 2022, 5, 276–284. [Google Scholar] [CrossRef]
- Chuvilin, E.M.; Kozlova, E.V.; Petrakova, S.Y. Kinetics of gas hydrate dissociation in permafrost at negative temperatures. Gazov. Promyshlennost 2006, 47–50. (In Russian) [Google Scholar]
- Yershov, E. General Geocryology (Studies in Polar Research); Williams, P., Ed.; Cambridge University Press: Cambridge, UK, 1998; p. 550. ISBN 9780521607575. [Google Scholar]
- Chuvilin, E.M.; Bukhanov, B.A.; Mukhametdinova, A.Z.; Grechishcheva, E.S.; Alekseev, A.G.; Istomin, V.A. Freezing point and unfrozen water contents of permafrost soils: Estimation by the water potential method. Cold Reg. Sci. Technol. 2022, 196, 103488. [Google Scholar] [CrossRef]
- Vlasov, V.A.; Zavodovsky, A.G.; Madygulov, M.S.; Reshetnikov, A.M. Formation of supercooled water on dissociation of gas hydrates, from nuclear magnetic resonance data. Earth’s Cryosphere 2011, 15, 83–85. [Google Scholar]
- Melnikov, V.P.; Nesterov, A.N.; Podenko, L.S.; Reshetnikov, A.M.; Shalamov, V.V. NMR evidence of supercooled water formation during gas hydrate dissociation below the melting point of ice. Chem. Eng. Sci. 2012, 71, 573. [Google Scholar] [CrossRef]
- Zavodovsky, A.G.; Madygulov, M.S.; Reshetnikov, A.M. Equilibrium conditions and the region of metastable states of Freon-12 gas hydrate. Russ. J. Phys. Chem. 2015, 89, 2178–2182. [Google Scholar] [CrossRef]


| Sample | Sampling Site | Mineralogy, % | |
|---|---|---|---|
| Sand 1 | Lubertsy | Quartz | >90 |
| Sand 2 | Yamburg GCF | Quartz Microcline+Albite Illite Kaolinite + Chlorite | 38 45 9 5 |
| Sand 3 | South-Tambey GCF | Quartz | >93 |
| Montmorillonite clay | Dzhembel (Turkmenistan) | Montmorillonite Andesine Biotite | 93.4 2.9 2.9 |
| Kaolinite clay | Novokaolinovy (Chelyabinsk region) | Kaolinite Quartz Muscovite | 92 6 2 |
| Sample | Particle Size Distribution, % | Salinity, % | Solid Particles Density, g/cm3 | Classification * | ||
|---|---|---|---|---|---|---|
| 1–0.05 mm | 0.05–0.001 mm | <0.001 mm | ||||
| Sand 1 | 100 | − | − | 0.01 | 2.65 | Fine sand |
| Sand 2 | 84.3 | 13.7 | 2 | 0.09 | 2.60 | Fine sand |
| Sand 3 | 95.6 | 4.4 | − | 0.08 | 2.60 | Fine sand |
| Montmorillonite clay | 0.3 | 46.2 | 53.5 | 1.99 | 2.45 | Heavy clay |
| Kaolinite clay | 4.5 | 70.9 | 24.6 | 0.04 | 2.66 | Silty clay |
| Sample | Clay Content, % (Montmorillonite) | Hydrate Coefficient | ||
|---|---|---|---|---|
| Equilibrium Pressure | 30 min After Pressure Drop to 0.1 MPa | |||
| 1 | 0 | 0.75 | 0.72 | 3.6 |
| 2 | 3 | 0.40 | 0.37 | 7.5 |
| 3 | 7 | 0.36 | 0.29 | 19 |
Publisher’s Note: MDPI stays neutral with regard to jurisdictional claims in published maps and institutional affiliations. |
© 2022 by the authors. Licensee MDPI, Basel, Switzerland. This article is an open access article distributed under the terms and conditions of the Creative Commons Attribution (CC BY) license (https://creativecommons.org/licenses/by/4.0/).
Share and Cite
Chuvilin, E.; Davletshina, D.; Bukhanov, B.; Mukhametdinova, A.; Istomin, V. Formation of Metastability of Pore Gas Hydrates in Frozen Sediments: Experimental Evidence. Geosciences 2022, 12, 419. https://doi.org/10.3390/geosciences12110419
Chuvilin E, Davletshina D, Bukhanov B, Mukhametdinova A, Istomin V. Formation of Metastability of Pore Gas Hydrates in Frozen Sediments: Experimental Evidence. Geosciences. 2022; 12(11):419. https://doi.org/10.3390/geosciences12110419
Chicago/Turabian StyleChuvilin, Evgeny, Dinara Davletshina, Boris Bukhanov, Aliya Mukhametdinova, and Vladimir Istomin. 2022. "Formation of Metastability of Pore Gas Hydrates in Frozen Sediments: Experimental Evidence" Geosciences 12, no. 11: 419. https://doi.org/10.3390/geosciences12110419
APA StyleChuvilin, E., Davletshina, D., Bukhanov, B., Mukhametdinova, A., & Istomin, V. (2022). Formation of Metastability of Pore Gas Hydrates in Frozen Sediments: Experimental Evidence. Geosciences, 12(11), 419. https://doi.org/10.3390/geosciences12110419