Article

Vs30 Structure of Almeria City (SE Spain) Using SPAC and MASW Methods and Proxy Correlations

by
Fernando López
1,
Manuel Navarro
2,
Pedro Martínez-Pagán
3,*,
Antonio García-Jerez
2,
Jaruselsky Pérez-Cuevas
4 and
Takahisa Enomoto
5
1
Civil Protection Service of Junta de Andalucía, 04004 Almeria, Spain
2
Department of Chemistry and Physics, Universidad de Almeria, 04120 Almeria, Spain
3
Department of Mining and Civil Engineering, Universidad Politecnica de Cartagena, 30203 Cartagena, Spain
4
Faculty of Engineering Sciences, Pontificia Universidad Catolica Madre y Maestra, Santo Domingo 2748, Dominican Republic
5
Department of Building Engineering, Kanagawa University, Yokohama 221-8686, Japan
*
Author to whom correspondence should be addressed.
Geosciences 2022, 12(11), 403; https://doi.org/10.3390/geosciences12110403
Submission received: 14 September 2022 / Revised: 23 October 2022 / Accepted: 28 October 2022 / Published: 31 October 2022
(This article belongs to the Section Natural Hazards)

Abstract

:
The topographic slope method is an innovative, fast and very low-cost technique for estimating the average S-wave velocity in the upper 30 m (Vs30) based on the relationship between this quantity and the slope of the ground, obtained using a Digital Elevation Model (DEM). The method is based on the good linear correlations log(Vs30)–log(slope) found experimentally, which, ideally, should be determined for each region. If measured Vs30 data are not available to carry out this fitting for the study area, correlations from other areas could be used, although the reliability of the estimated Vs30 results would be lower. In this article, Vs30 observations are made for the city of Almeria, using Spatial Autocorrelation Surveys (SPAC) and Multichannel Analysis of Surface Waves (MASW), obtaining two types of fitting: (a) linear relationship log(Vs30)–log(slope); and (b) considering additional dependence on geological units. The reliability, evaluated by Multiple R-Squared (MRS), varies between 79.2% in the first case and 87.0% in the second, lowering the mean absolute values of the residuals at the observation points in the first case from 40.0 m/s to 29.0 m/s. Using a more generic correlation obtained for other areas of the world, the mean absolute residuals increase to 74.7 m/s.

1. Introduction

The average shear-wave velocity in the uppermost 30 m ground thickness (Vs30) has found widespread use as a relevant parameter for characterizing local site response for a considerable variety of applications, such as seismic zonation map [1,2], seismic hazard, and risk maps [3,4,5]. In fact, the Vs30 parameter was initially introduced [6,7,8] to provide objective definitions of site classes and site coefficients for the estimation of site-dependent response spectra for use in the 1994 edition of the “Recommended National (US) Earthquake Hazard Reduction Program (NEHRP) Building Code Provisions” [9].
Consequently, these crucial Vs30-based maps would provide the potential variations in earthquake shaking due to local site effects based on subsurface ground conditions, such as degree of stiffness and the thickness of the geological materials. These maps are of vital importance in ground motion modeling and probabilistic seismic hazard assessment [10]. Therefore, Vs30 is a primary indicator of both the stiffness of near-surface formations and their site effects, since it provides closed-form expressions relating short- and mid-period amplification factors with depth [2,10,11,12].
This important parameter can be precisely obtained using borehole logging methods such as PS-logging, downhole logging, and cross-hole logging [10,13], and also by employing surface geophysical methods like multichannel analysis of surface waves (MASW) and ambient noise array methods [10,14,15,16,17]. Several surface-wave methods-based either on the analysis of ambient noise (e.g., SPAC method, [18]) or on controlled seismic sources (e.g., MASW method, [19]) are practical alternatives for evaluating soil stiffness and have been used as valuable tools in the determination of the Vs structure of soils [1,20].
However, in recent years, a topographic slope-based methodology has been adopted to quickly estimate ground motion in areas of the world for which detailed geophysical and borehole data are not accessible [21,22,23]. This topographic slope methodology uses proxy correlations between slope and Vs30 to create a site response map [22,23,24,25]. Topographic slope correlates quite well with Vs30 because stiffer rocks, which are associated with higher Vs30 values, tend to maintain steeper slopes. In contrast, softer, more fine-grained and soil-like materials associated with lower Vs30 values tend to be deposited on flatter slopes [26]. There are currently three classes of proxies: (i) surficial geology; (ii) generic site categories or classifications, which are loosely based on geology; and (iii) physiographic characteristics such as topographic slope [20,21].
Based on Wald et al. (2011) [27], this work examines the capabilities of estimating Vs30 values from a proxy-based methodology using topographic slope and geological information. Compared toVs30 values derived from surface geophysical methods, the applicability of this proxy-based methodology for urban areas is assessed.

2. Study Area and Geological Setting

2.1. Almeria City

Almeria city, with around 200,000 inhabitants and a 4.1 km × 4.5 km urban area surface, is located in Andalucía region (southern Spain). This area belongs to the eastern part of the Betic region (Figure 1), an Alpine chain placed at the westernmost part of the Eurasian and African Plates interaction zone [28]. Despite the low to moderate seismic activity of this region in a worldwide context, this region is the most hazardous seismic area in Spain [29]. According to the new probabilistic seismic hazard map of Spain [30], Almeria city presents a peak ground acceleration (PGA) on the rock of 0.19 g for a 475-year return period.

2.2. Neotectonics of the Almeria Area

The Almeria area is located in the Internal Zones of the Betics Cordillera (Figure 1), commonly referred to as the Alborán Domain [31]. This area is composed of Palaeozoic, Mesozoic and Paleogene rocks, which were structured into a thrust stack during the Alpine Orogeny [3,28]. The Betics range represents a tectonic domain consisting of the Alborán Sea and the Betics and Rif ranges, which is the result of a complex Neogene deformation expanding along a broad zone (more than 500 km wide) stretching from the High Atlas in Morocco to the Betics in Spain [3,28,29].
To identify the primary fault zones and fault-bounded crustal blocks in the study area, a neotectonics map is provided (Figure 1). Figure 1 shows the three major shear fault zones and corridors that affect the Almeria area: the Alpujarras Fault Zone (AFZ), the Alhama–Alquian Fault Zone (AAFZ), and the Carboneras Fault Zone (CFZ) [32]. These faults generate vertical movements responsible for the uplift and tilting of the Gádor and Alhamilla mountainous ranges [31]. Of all those fault zones, the Alhama–Alquian Fault Zone and the Carboneras Fault Zone are the most important due to their proximity to Almeria city (Figure 1). The Alhama–Alquian Fault Zone is located in the Almeria basin, which is mainly composed of Neotectonic materials as well as characterized by an important concentration of Quaternary faults predominantly with NW–SE direction [31]. The Carboneras Fault Zone lies south of Almeria city into the Alboran Sea, with Quaternary faults predominantly in the NE–SW direction (see location in Figure 1) [30].

2.3. Local Geology of Almeria City

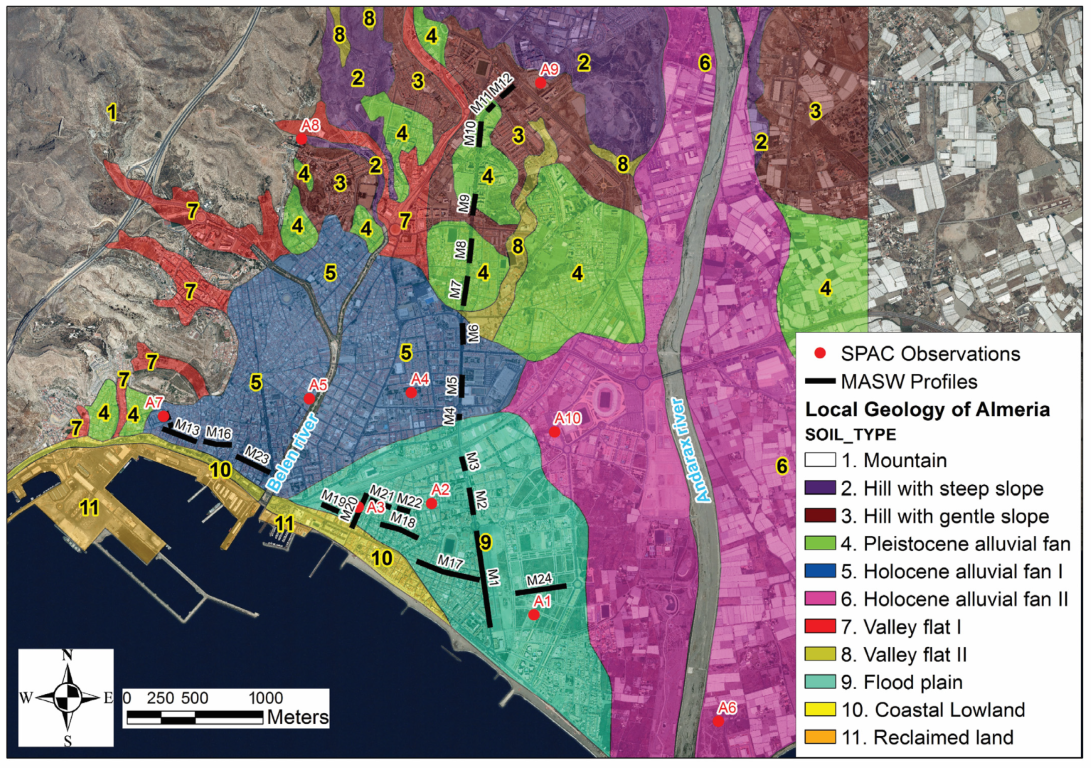
Eleven landform units were identified in the urban area of Almeria city (Figure 2) by combining aerial photography, geological, and geotechnical information [33]. These units range from mountains formed by Pre-Pliocene rocks to coastal lowlands composed of Holocene alluvial deposits (sands, clays, and silts). Two Holocene alluvial fans are the main landforms in this area. One is the Belen river fan and the other is the Andarax river fan.
The Belen river spreads from a point of about 50 m in height to the coast. The mean gradient of the fan is approximately 25/1000. The top of the Andarax river fan has a ground height of about 40 m. The Andarax river fan is considerably longer than the Belen river fan, and presents a gentler slope, with a gradient of 11/1000.
A flood plain placed between the two river fans presents the worst soil condition from the geotechnical point of view in the studied area. The surface deposits are composed of clay and silt with 8 m maximum thickness and normalized 30 cm standard penetration value (N30) less than 10. An important city quarter (Garden City) is located between these two river fans [33]. Most MASW profiles and some SPAC arrays were laid-out in that area (Figure 2).
The coastal lowland located near the mouth of the Belen river is characterized by a height of 2 m (Figure 2). It was formed by the sea level lowering after the Frandrian transgression [34]. This coastal lowland cuts the Holocene deposits and the uppermost Pleistocene deposits in which their normalized 30 cm standard penetration values (N30) are between 10 and 30.
Hills are characterized by steep slopes and a ground height between 80 and 200 m consisting of Pleistocene materials (clay, sands, and conglomerates) and N30 values above 50 [33]. Finally, there is reclaimed land for which various and heterogeneous materials have been used, such as demolition debris. Considering this context, the soils located in the Holocene alluvial fans, in the flood plain, and in the reclaimed land could be prone to liquefaction phenomena. It is worth recalling that MASW and SPAC layouts were planned based on this geological context and the previous geotechnical information.

3. Methodology

In this section, the seismic methodologies for determining the calculated Vs30 values in Almeria city are described. These methodologies were the Spatial Autocorrelation (SPAC) method [18] and the Multichannel Analysis of Surface Waves (MASW) [19]. Additionally, the proxy-based Topographic Slope method [27] used to estimate Vs30 values in Almeria city is introduced.

3.1. SPAC Method

The SPAC observations were carried out in 10 open spaces in Almeria city (Figure 2). The vertical components of ground motion, excited by ambient noise, were recorded at the surface using circular-shaped arrays. Five high-sensitivity VSE-15D sensors surrounding a sixth central sensor with the same characteristics and an SPC-35 digitizer were used. The radii ranged from 2.5 to 94 m. Different radii were used depending on the thickness of the geological formations and on the dimensions of the open areas. The recording time was 30 min, and the signal was sampled at a rate of 100 samples per second. All records were analyzed using our own implementation of the SPAC method [18].
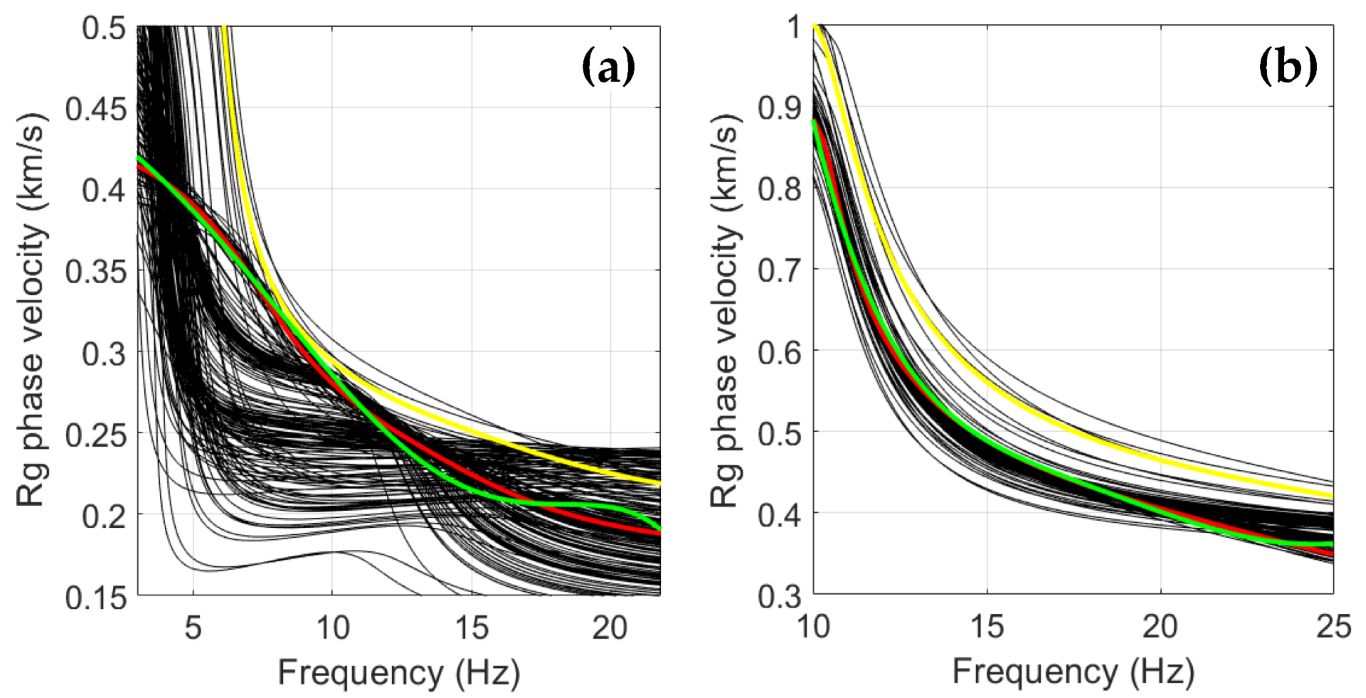
The correlation coefficient ρ(f, R) was calculated from the cross-correlations between records on the circle and the central station, in the frequency domain, divided by the autocorrelation at the center. The correlation coefficients were separately computed for a set of time intervals and plotted on a time-dependent diagram. The time windows used were 20 s long with an overlap of 80%. The stability of ρ(f, R) was checked for the set of time windows and those with anomalous values were not considered. Finally, the phase velocity of the Rayleigh wave c(f) was computed (Figure 3) for each frequency f using Equation (1) and applying a polynomial fit of the ρ vs. f relation
ρ f , R = J 0 2 π f c f R
where J0 represents the zero-order Bessel function and R is the radius of the array.

3.2. MASW Method

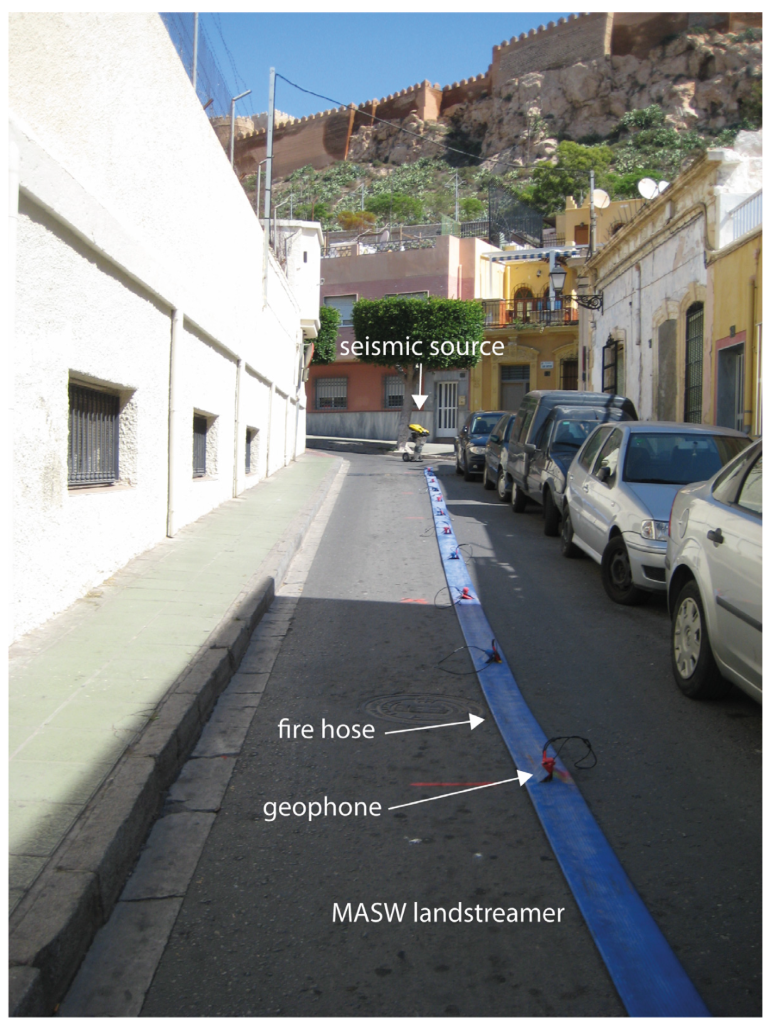
The MASW survey was conducted through the streets of Almeria city, consisting of 7.1 km of linear seismic transects (Figure 2) carried out in active mode using a Wacker Neuson BS60-4s vibratory rammer as the seismic source. A total of 24 geophones (12 of 28 Hz and 12 of 4.5 Hz natural frequency) were interleaved and screwed onto metal plates with 2 m spacing (Figure 4). The offset (distance between the seismic source and the first geophone) was 4 m. The acquisition array, which was 46 m in length, was displaced 10 m between consecutive shots.
For active-mode MASW measurements, the shallowest resolvable depth of investigation (zmin) is between approximately λmin/3 and λmin/2, where λmin ~ 2 × Δx, Δx being the receiver spacing. The expected maximum investigation depth (zmax) is between approximately λmax/3 and λmax/2, where λmax corresponds to the array length [35]. Active surveys typically provide dispersion curves in a relatively high frequency (short wavelength) band (usually 20–50 Hz).
To reach high productivity in terms of the surveyed transect length per day (approximately 1 km per day), a towed landstreamer was built using a heavy-duty fire hose [17,36] (Figure 4). The recording equipment was a Summit II Compact unit from DMT, Germany.
The SurfSeis software package from the Kansas Geological Survey, USA was used for MASW seismic data processing. This algorithm made it possible to obtain a dense series of dispersion curves from which local 1D shear-wave velocity (Vs) models could be obtained using an inversion process as discussed in Park (2013) [37] and Boiero et al. (2013) [38].
Generating a dispersion curve is one of the most crucial steps in obtaining an accurate and reliable 1D shear-wave velocity (Vs) model. A frequency-domain approach is used to generate the dispersion curve from impulsive seismic data or shot-gather data [19]. This wavefield transformation is as follows according to Park et al. (1998) [39]:
A Fourier transformation can be applied to the time axis of u(x,t), which is the offset-time (x-t) domain representation of a shot-gather to obtain U(x,w) [39]:
U ( x , w ) = u ( x , t ) e i w t d t
where w is the circular frequency. U(x,w) can then be expressed as the multiplication of two terms:
U ( x , w ) = P ( x , w ) A ( x , w )
where P(x,w) and A(x,w) are phase and amplitude spectra, respectively. Each frequency component in U(x,w) is totally individualized from other frequencies and the arrival time information is maintained in the phase spectrum P(x,w). As a result, P(x,w) contains all the information about dispersion properties, and A(x,w) provides the information about other aspects such as attenuation and spherical divergence. Consequently, U(x,w) can be written as [39]:
U ( x , w ) = e i Φ x A ( x , w )
where Φ = w / c w , and cw is the phase velocity for a frequency w. Then, applying the appropriate integral transformation to U(x,w), the expression for V(w,ϕ) is defined as follows:
V ( w , ϕ ) = e i Φ x U x , w U ( x , w ) d x = e i ( Φ ϕ ) x A ( x , w ) A ( x , w ) d x
In which, for a given w, |V(w,ϕ)| gives a maximum if the following is satisfied:
ϕ = Φ = w c w
For a value of ϕ where a peak of |V(w,ϕ)| occurs, the phase velocity (cw) can be determined. Additionally, if higher modes get a noticeable amount of energy, then there will be more than one peak. Therefore, dispersion curves result from transforming V(w,ϕ) to I(w,cw) =|V(w, w / c w )| by variable changing. The locus along these peaks of I(w,cw) over different values of w allows the images of dispersion curves to be constructed [15,19,39].
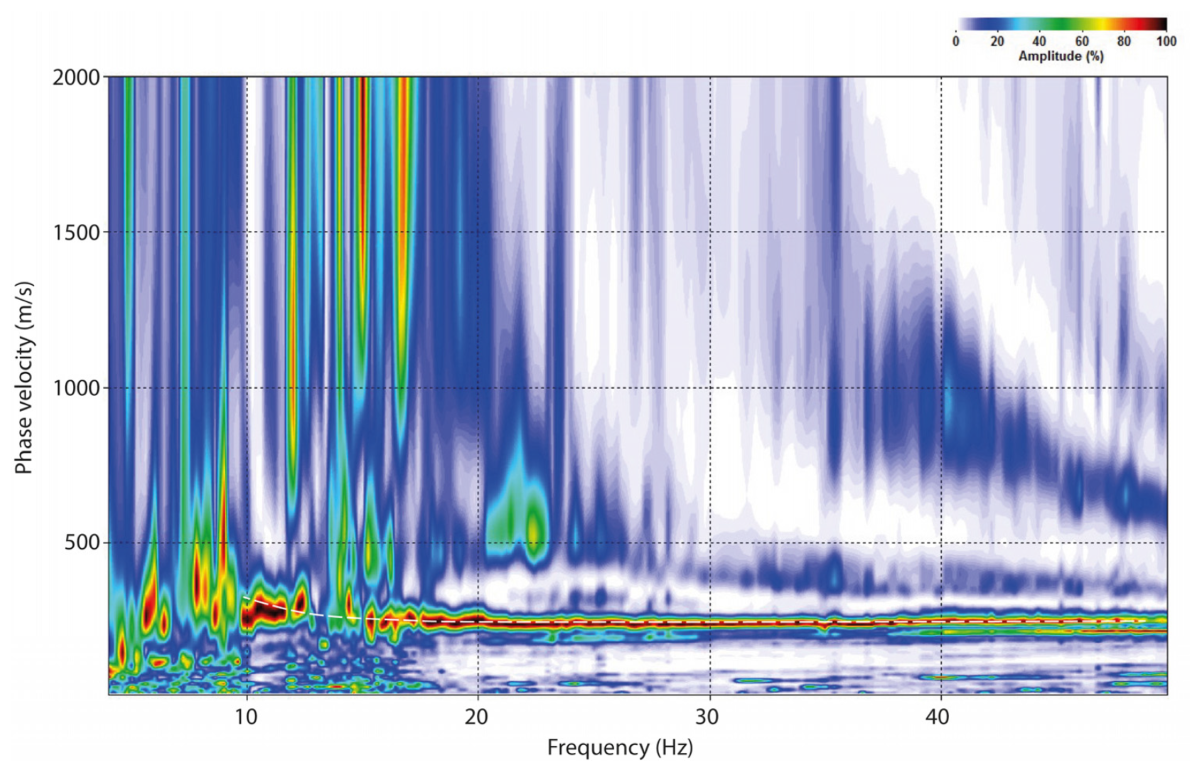
Figure 5 shows an example of the dispersion curve obtained from M1 MASW profile (Figure 2) through Mediterranean Avenue in Almeria city. This dispersion curve is provided from the natural mode, but other superior modes are recognizable in Figure 5 as well.

3.3. Topographic Slope Method

This method is based on the linear relationship between the measured values of log(Vs30) and the topographic slope of the ground [26], which can easily be obtained using a Digital Elevation Model (DEM). Considering the measured Vs30 values, a new fitting was performed that included the dependence on the geological units through additive βi constants [27].
The ordinary least squares method was applied, and two possible functional forms: (a) linear relationship between calculated Vs30 and topographic slope (Equation (7)); and (b) linear expression including the dependence on the geological units (Equation (8)).
log ( V s 30 ) = β 0 + β s l o p e log ( s l o p e ) + r
log ( V s 30 ) = β 0 + β i x i + β s l o p e log ( s l o p e ) + r
where xi is an indicator variable for the geological units, which can take a value of 1 (if the surveyed point belongs to the geologic unit) or 0 (otherwise), βi, and βslope are the coefficients to be calculated using least squares regression, Vs30 is the observed mean velocity in m/s, slope is the topographic gradient computed from the DEM in m/m, and r is the residual.

4. Results

4.1. SPAC-Based Vs30 Values

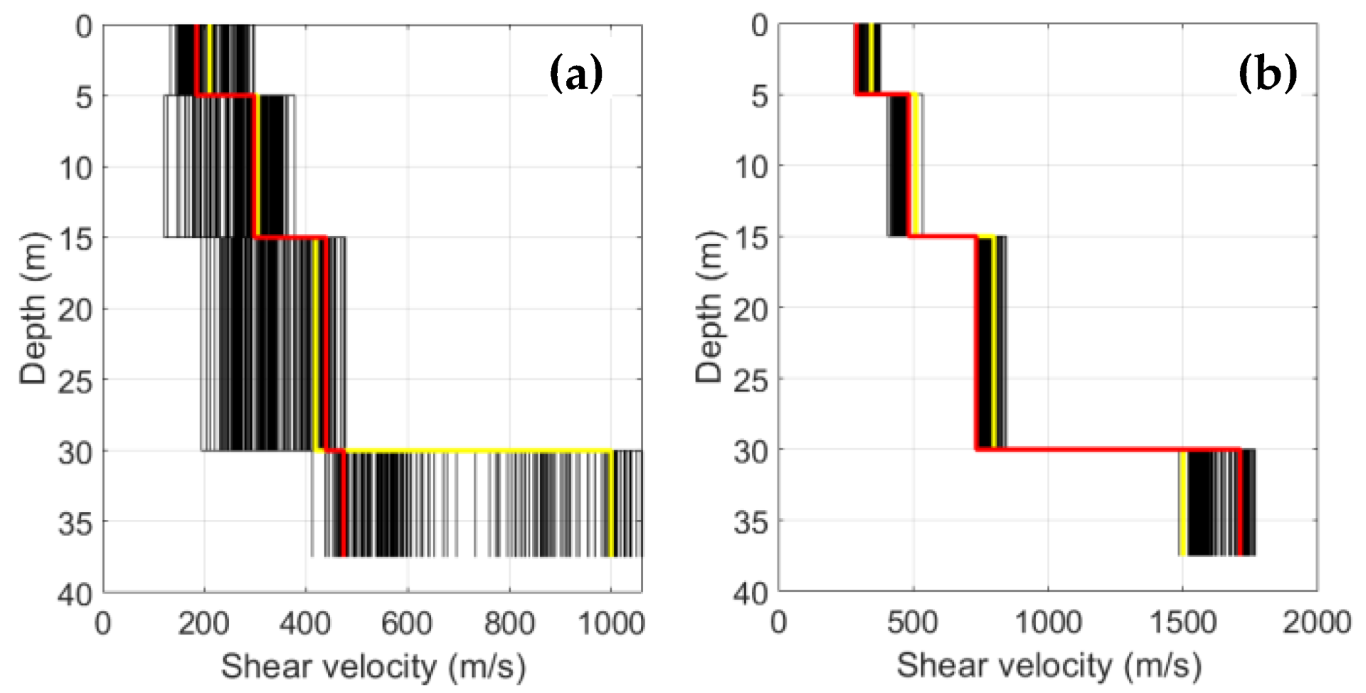
Figure 6 presents examples of shear-wave velocity profiles derived from SPAC measurements. The frequencies of the obtained dispersion curves ranged from 2.0 to 30.0 Hz (Table 1) and the phase velocities varied between 191 and 904 m/s. Because of the important differences among the dispersion curves, both in frequency and in phase velocities (e.g., Figure 3), the number of layers and the ranges for thicknesses and shear velocities were different for each site. The obtained shear-wave velocity profiles showed depths from 37.5 to 107 m and shear-wave velocity values between 176 and 1711 m/s (Table 1).
Finally, the average shear-wave velocity of the uppermost 30 m (Vs30) was computed for each model (Table 1). The lowest value found was 293 m/s, corresponding to the array A1 (see location in Figure 2), located on flood plain. The highest value of Vs30 was 596 m/s, corresponding to the array A7, which is located in Holocene alluvial fan I.
Attending to the range of Vs30 values stated by the EC8 (1998), a large area of Almeria city meets the requirements to be classified into the B ground class. Due to the variety of geological/seismic conditions and the ranges of Vs involved, an internal division was proposed: B1 ground subclass with Vs30 values in the 500–800 m/s range and B2 ground subclass with Vs30 values in the 360–500 m/s range.

4.2. MASW-Based Vs30 Values

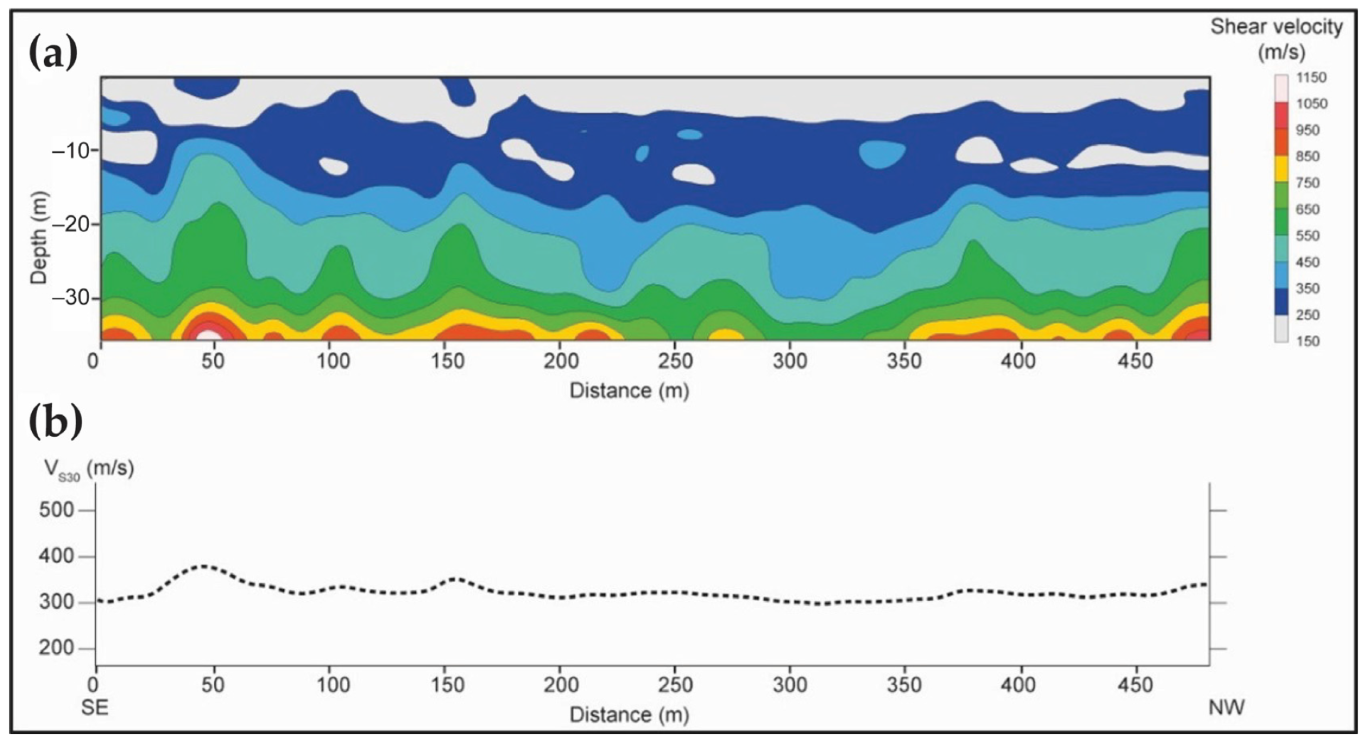
Regarding MASW-based results, dispersion curves obtained from the 7.1 km of MASW surveys showed a frequency range from 2.0 to above 40 Hz and Rayleigh wave phase velocity values between 191 and 904 m/s. Moreover, the Vs values ranged from 176 to 1374 m/s. All MASW 1D Vs models for each MASW profile were combined to obtain a 2D Vs section (Figure 7a) from which Vs30 values could be retrieved (Figure 7b). MASW profiles conducted on flood plain (e.g., M1, M2, M3, M17, etc., see location in Figure 2) provided the lowest Vs30 values, ranging from 333 to 419 m/s, which classifies that area as C ground class according to EC8 (1998), prone to the occurrence of ground motion amplification. Those MASW-based Vs30 values are consistent with SPAC-based values obtained in the same area (e.g., SPAC A1, A2, and A3). On the other hand, higher Vs30 values between 522 and 605 m/s were retrieved from MASW profiles traced in the north of Almeria city (e.g., M9, M10, M11, and M12, Figure 2). That area, associated with Pleistocene alluvial fan materials, is characterized by better geological/seismic conditions since it is constituted of more stable rocks associated with higher Vs30 values. Thus, this zone is defined as being within the B1 ground subclass in terms of Eurocode 8 (EC8, 1998) classification. This EC8 classification for this northern area is corroborated by SPAC arrays (e.g., A9). Similarly, the west of the city is the area in which the highest Vs30 values were obtained from MASW surveying, and thus it presents the best ground in terms of geological/seismic conditions according to MASW technique. In this way, MASW M13 profile provided a Vs30 value of 603 m/s, which classifies that area as a B1 ground subclass zone. This zone is also made up of Pleistocene alluvial fan materials. Similar Vs30 values for this area were obtained using the SPAC method (e.g., A7). This fact proves the consistency and complementarity of both methods for classifying urban areas in terms of EC8 class. Table 2 summarizes the Vs30 values measured with MASW through the main streets of Almeria city (Figure 2).

4.3. Topographic Slope-Based Vs30 Values

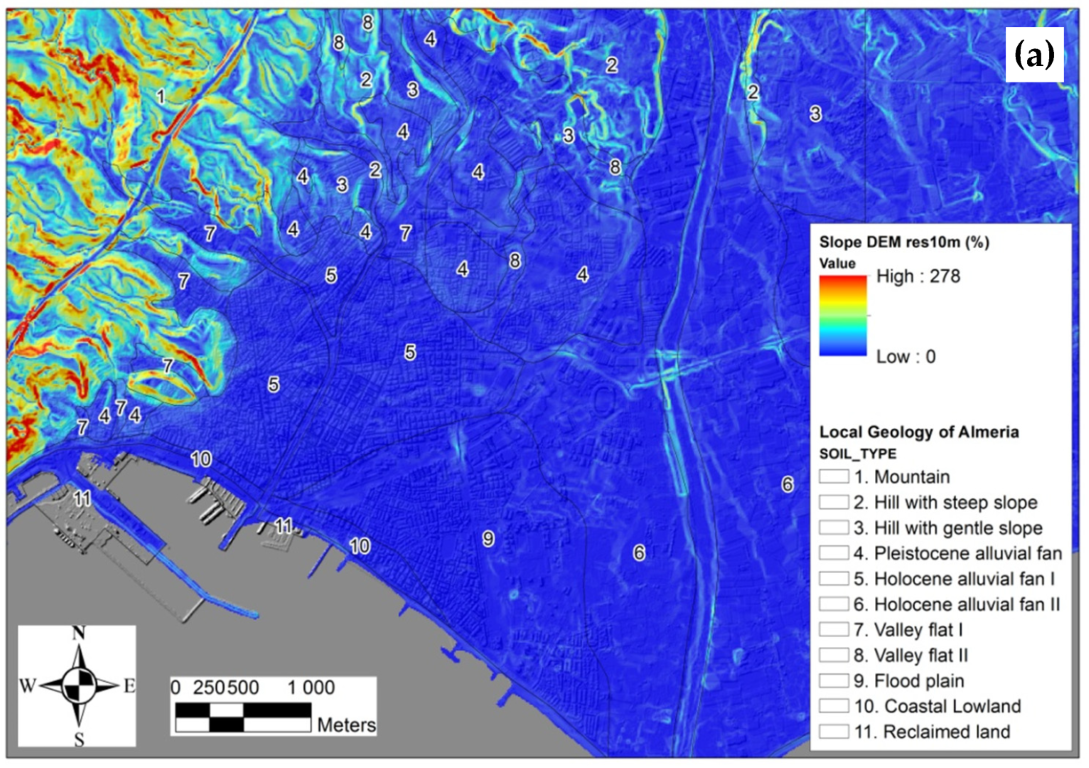
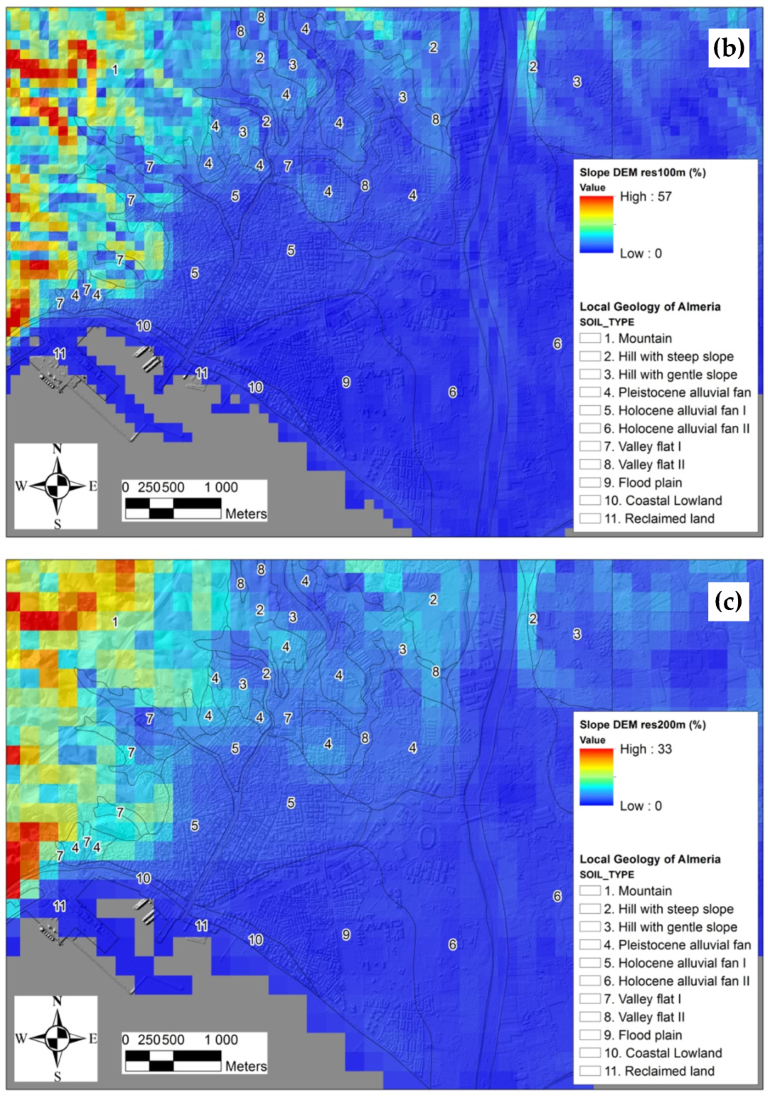
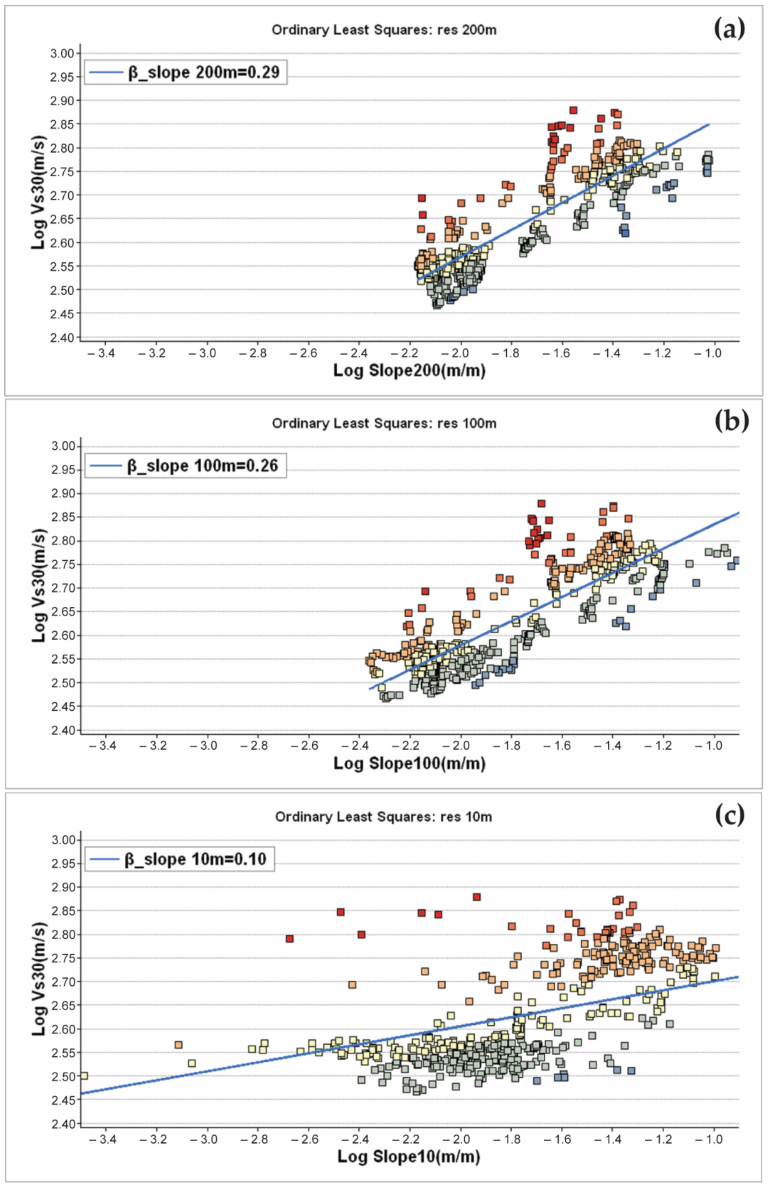
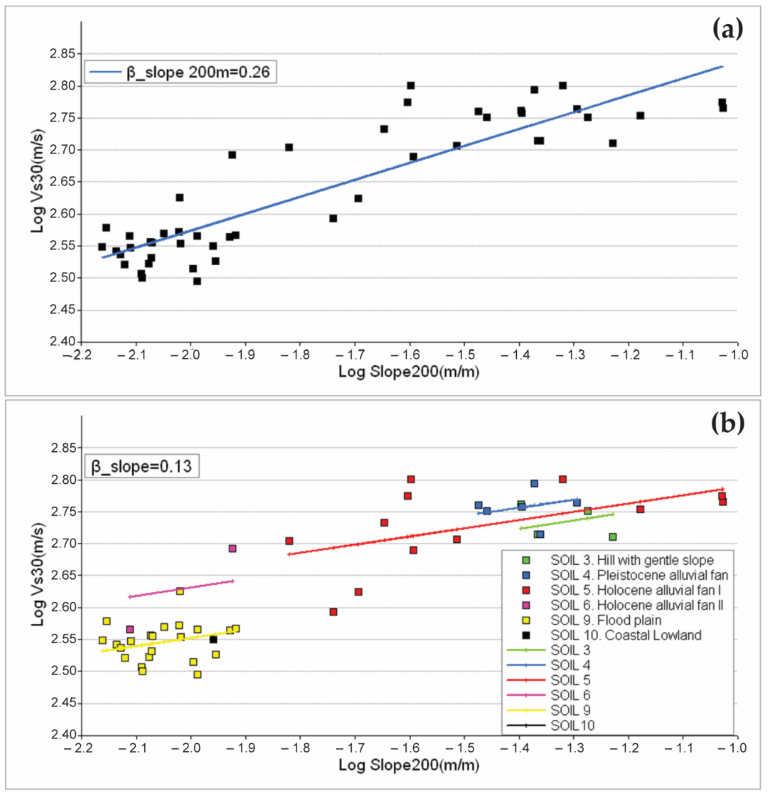
To check the sensitivity of the Vs30-slope relationship to the slope map resolution, Equation (7) was fitted for the city of Almeria (only βslope coefficient) using a slope map with three different resolutions (200 m, 100 m and 10 m) and the Vs30 values measured with SPAC and MASW. Figure 8 shows, on the one hand, the improvement in the topographic description of Almeria with increasing DEM resolution. On the other hand, when the resolution is decreased, the heights of the higher resolution pixels included in another of lower resolution are averaged, and therefore a significant reduction of the average slope occurs: 9.7% slope for 10 m (Figure 8a); 5.1% slope for 100 m (Figure 8b) and 3.9% slope for 200 m (Figure 8c). Figure 9 shows how using higher-resolution slope maps has a negative impact on the quality of the fit in terms of decreasing βslope: 0.29 for 200 m; 0.26 for 100 m and 0.10 for 10 m, respectively. In fact, data fitting reliability estimated from the Multiple R-Squared method (MRS) decreases from an MRS of 77.0% for 200 m map resolution (Figure 9a) to an MRS of 71.9% for 100 m resolution (Figure 9b) and, finally, to 24.3% for 10 m slope map resolution (Figure 9c).
Therefore, considering the MASW profiles, for which there are sampling points every 10 m (a total of 497), it is interesting to perform an average every 200 m (resulting in a total of 37 sites, Figure 10), since the model obtains better correlations with the slopes for a DEM resolution of 200 m per pixel. This also results in a more similar weight of the SPAC and the MASW measurements in the model fitting, since SPAC arrays (a total of 10) are smaller and not affected by the resolution lowering down to 200 m. In this way, the reliability (MRS) increases from 77.0% to 79.2% for the 200 m resolution DEM model.
Wald and Allen (2007) [26] correlate the Vs30 experimental values and the topographic slopes, obtained in various studies from the United States, Taiwan, Italy and Australia (for tectonically active regions). We will refer to this approach as model MD1. Although it is not recommended, this expression could be used in other studies if measured Vs30 values are not available in the area. Otherwise, if measured Vs30 values exist, it is recommended to obtain a specific correlation in the form of Equation (7). This approach will be referred to as model MD2 from here on. A specific correlation can be also performed including geological coefficients βi (Equation (8)) if geological unit-related information is available (model MD3).
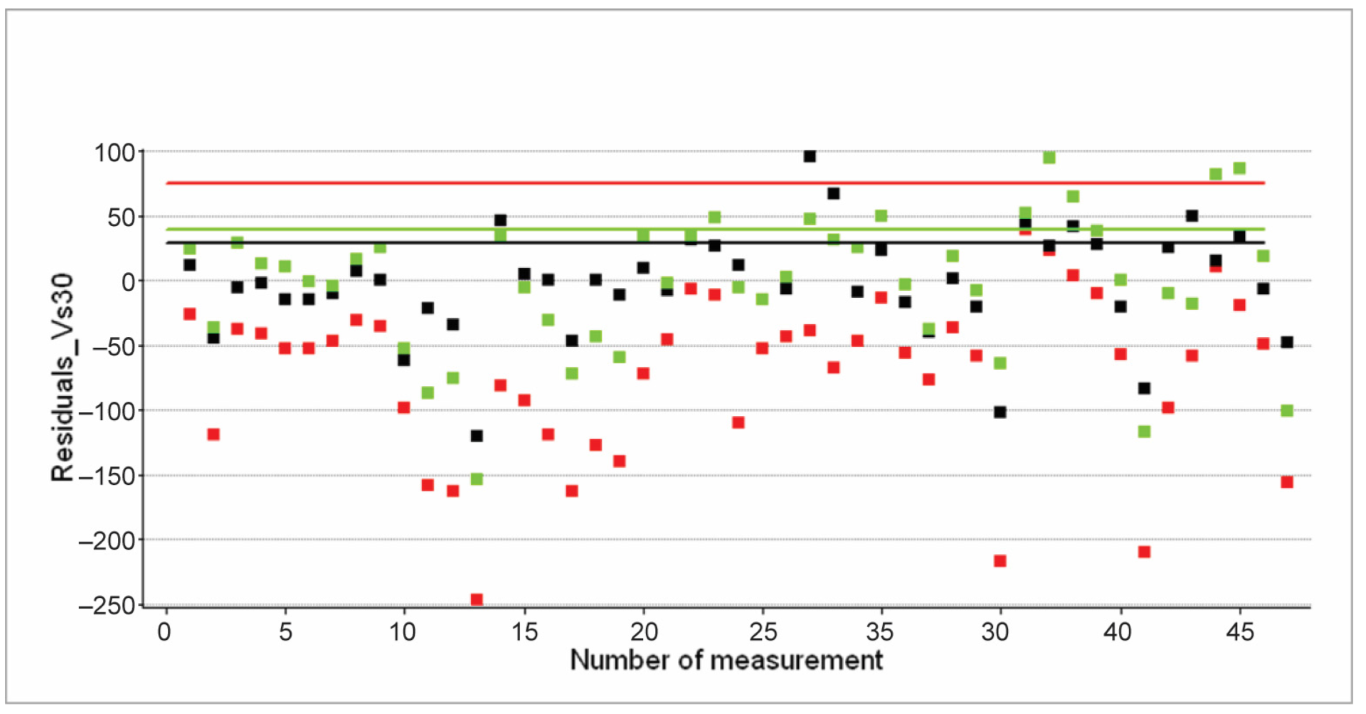
A comparison is made between these models for the city of Almeria, using a 200 m resolution DEM, the measured SPAC and MASW (averaged) Vs30 values (for model M2), and the eleven geological units identified in the urban area of Almeria [35] (for model MD3). The reliability is given by an MRS of 79.2% for model MD2, and it increases to 87.0% considering local geological units (model MD3). Figure 10 shows the residuals obtained at the Vs30 sampling points, the mean of which is 74.7 m/s for MD1, 40.0 m/s for MD2 and 29.0 m/s for MD3.
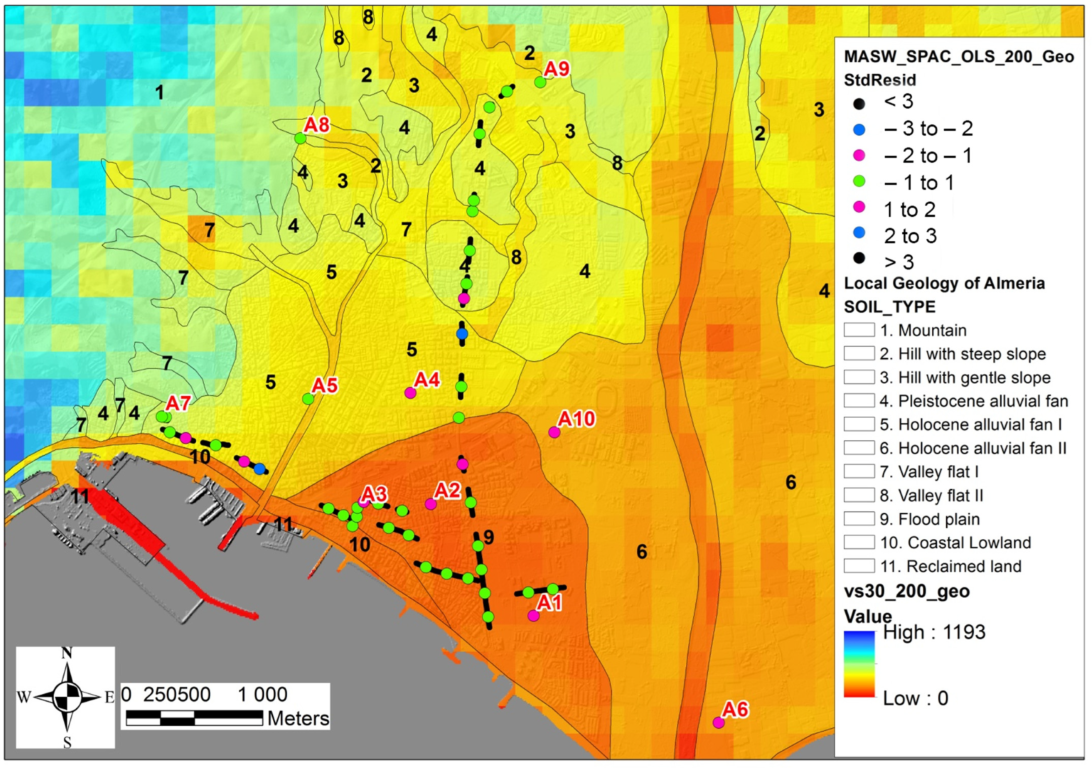
Finally, a raster map of Vs30 values (Figure 11) was drawn using the correlation with slope and geological units (Equation (8), model MD3) in the areas where such geological units were identified, and only the correlation with the slope in the rest of the zones (Equation (7), model MD2).

5. Discussion

5.1. SPAC Array vs. MASW

The mean Vs30 values calculated from SPAC and MASW methods have been compared for different geological units (Table 3). In general, a good agreement between them is observed. In both cases, the lower values are located in the southeast of the study area, composed of alluvial fan deposits. The values grow moving towards the northwest of the city.
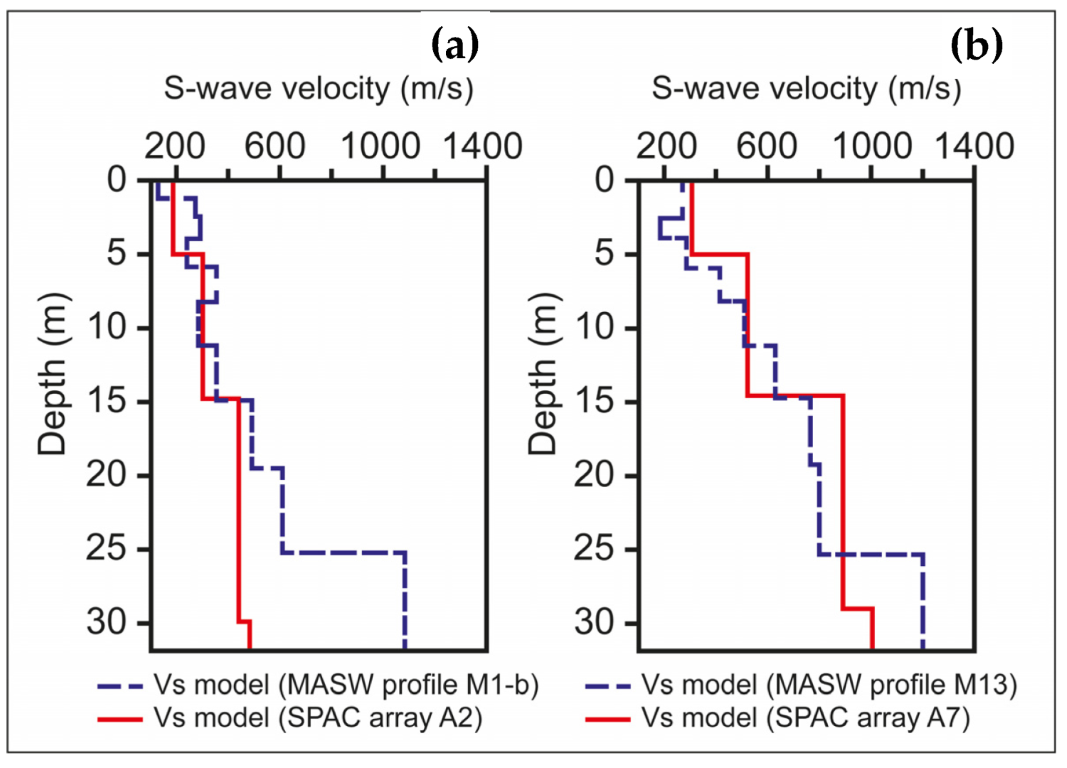
Figure 12 compares SPAC and MASW 1D Vs models retrieved from two close locations in the Holocene flood plain (Figure 2). Comparison between MASW profile M1 and SPAC array A2 depicts a similar trend down to a depth of 20 m, at which point MASW Vs values shift away, probably due to the presence of more compacted materials under profile M1 than those under array A2. Additionally, that slight model shift is reflected in terms of Vs30 value since SPAC and MASW give Vs30 values of 293 and 352 m/s, respectively (Table 1 and Table 2). Conversely, model comparison for MASW profile M13 and SPAC A7 depicts the same trend for even deeper layers. This agreement was somehow expected, since these two sites are closer than those in the previous example. In terms of Vs30, SPAC and MASW give Vs30 values of 596 and 603 m/s, respectively (Table 1 and Table 2). Therefore, 1D Vs models obtained with these two methods show, in general, a similar tendency at nearby sites, corroborating that both seismic techniques, SPAC and MASW, are complementary and allow similar Vs values to be obtained.

5.2. Topographic Slope-Based Vs30 Values vs. SPAC and MASW

Estimated Vs30 values, summarized within the zones defined by the geological units, were compared for the different proxy models, and with the measured values (SPAC and MASW methods).
Regarding the measured values of Vs30 (Table 4), the oldest materials corresponding to the Pleistocene (PAF and HGS) present mean Vs30 higher than those from the Holocene (HAF-I, HAF-II, CL and FP). However, for models MD1 and MD2, the trend from highest to lowest mean Vs30 follows the same pattern as the mean topographic slope (Table 4) since these models only include that variable in the estimation of Vs30. Sorted from the largest mean slope to the smaller, the landform codes are MT; HSS; VF-I; VF-II; HGS; PAF; HAF-I; CL; RL; HAF-II and FP (see description in Table 4). The introduction of uniform geological properties within the area defined for each unit causes a substantial change in the MD3 model results. This change is due to the fact that in the MD3 model, the values of Vs30 are somehow standardized within each landform, reducing the weight of the correlation with the slope (Table 4 and Figure 13).
The Vs30 values estimated from the MD3 model are more consistent with the average measured values obtained from the SPAC and MASW methods. Table 5 shows the mean unsigned residuals obtained at the Vs30 sampling points for each proxy model (MD1 to MD3) within these zones, suggesting the adequacy of the cartographic geometry used to define these units, since the residuals within each zone are lower for MD3 model.
The results obtained by proxy method MD2 were compared with the Vs30 proxy model recently calculated for the Iberian Peninsula [20]. In that study, 580 measured Vs30 values were used, including some of those used in this work, as well as three slope resolutions (1000 m, 500 m and 200 m) and two types of geological unit characterization (lithology and geological age). The 200 m slope resolution model provided a coefficient βslope = 0.2, and MRS = 26.9%. However, the relationship represented by our model MD2 indicates better performance (βslope = 0.29 with MRS = 77%). This improvement can be explained by the remarkably lower dispersion degree associated with our dataset, which is focused on a much smaller study area than that by Crespo et al. (2022) [20]. Regarding the model with geological units, the comparison has not been made because, in addition to using different geological units, Crespo et al. (2022) [20] applied a different βslope coefficient for each of them (different coefficients βslope_i for each unit). Since we deal with a much more specific area of study, only a single βslope coefficient was used in Expression (8).

6. Conclusions

A zonation based on eleven units was proposed for Almeria city from geological and geotechnical information. The floodplain presents the worst soil conditions in terms of seismic hazard. Slope failure may occur in hills with steep slopes if an earthquake occurs in the zone.
The analysis of the Vs30 structure obtained by SPAC and MASW methods allowed characterizing some geological units from their average Vs30 value. The mean measured Vs30 values range from 352 ± 24 m/s in the floodplain, mainly composed of clay and silt, to 573 ± 30 m/s on the Pleistocene alluvial fan, formed by gravel and sand.
A predicted Vs30 map of Almeria city based on a relationship found between that mean velocity, the geological units, and the slope (MRS 86.9%) was proposed. The ground conditions for Almeria city were obtained according to EC8 soil classification, resulting in EC8 soil class B being the most extended. Urban zones with soil class B have been here subclassified into two new ones: very dense soil (500–800 m/s) and stiff soil (360–500 m/s), respectively, with the former being more profuse. An important area of Almeria city is on class C soil (soft soil). The city is growing towards areas of soil types B and C.
Regarding the influence of the DEM resolution on the proxy model, the correlation with the Vs30 worsens slightly when the resolution is increased from 200 m to 100 m, and this becomes even more noticeable if it is increased from 100 m to 10 m. These results suggest that the use of a high-resolution map (e.g., 10 m DEM) is not appropriate, possibly since these more precise maps show abrupt variations in slopes that are not reflected in the soil geomorphology. Therefore, according to our results, the most adequate DEM resolution to develop a proxy model is 200 m. However, from a cartographic point of view, it is always convenient to work on the most precise scale possible, to be consistent with the required soil geomorphology detail.
The comparison between the different proxy models (MD1, MD2 and MD3) clearly shows an improvement in the deviation of the estimated Vs30 values from the measured Vs30 values when using a specific proxy model that includes dependence on geological units (MD3 model). This deviation increases when geological units are not included (MD2), and takes the highest value when the general relationship found by Wald and Allen (2007) [26] (MD1) is used (Figure 10). The estimated values of Vs30 using this model MD1 are in general considerably lower than those obtained from MD2 and MD3, as well as the measured values of Vs30.
These results highlight the importance of using site-specific correlations.

Author Contributions

The individual contribution of the authors in the development of the article is as follows: Conceptualization, M.N. and F.L.; methodology, M.N., F.L., P.M.-P. and A.G.-J.; software, F.L. and A.G.-J.; validation, M.N., F.L., P.M.-P., A.G.-J., J.P.-C. and T.E.; formal analysis, M.N., F.L. and P.M.-P.; investigation, M.N., F.L. and P.M.-P.; resources, M.N., F.L. and P.M.-P.; data curation, M.N., F.L., P.M.-P., A.G.-J., J.P.-C. and T.E.; writing—original draft preparation, M.N., F.L. and P.M.-P.; writing—review and editing, M.N., F.L., P.M.-P., A.G.-J., J.P.-C. and T.E.; visualization, M.N., F.L. and P.M.-P.; supervision, M.N., F.L., P.M.-P. and A.G.-J.; project administration, M.N., F.L. and P.M.-P.; funding acquisition, M.N. and A.G.-J. All authors have read and agreed to the published version of the manuscript.

Funding

This study was partly funded by the EU with the 2014–2020 operative program of the European Regional Development Fund and the Consejería de Economía, Conocimiento, Empresas y Universidad of Junta de Andalucía (Spain) under project UAL2020-RNM-B1980, and by the RNM194 (Research Group belonging to Junta de Andalucía and to the University of Almeria, Spain).

Acknowledgments

The authors gratefully acknowledge the support provided by the local government of Almeria city for their help in taking the measurements and by the Civil Protection Staff of Junta de Andalucía.

Conflicts of Interest

The authors declare no conflict of interest.

References

  1. Navarro, M.; García-Jerez, A.; Alcalá, F.J.; Vidal, F.; Enomoto, T. Local site effect microzonation of Lorca town (SE Spain). Bull. Earthq. Eng. 2014, 12, 1933–1959. [Google Scholar] [CrossRef]
  2. García-Jerez, A.; Seivane, H.; Navarro, M.; Martínez-Segura, M.; Piña-Flores, J. Joint analysis of Rayleigh-wave dispersion curves and diffuse-field HVSR for site characterization: The case of El Ejido town (SE Spain). Soil Dyn. Earthq. Eng. 2019, 121, 102–120. [Google Scholar] [CrossRef] [Green Version]
  3. Benito, M.B.; Navarro, M.; Vidal, F.; Gaspar-Escribano, J.; García-Rodríguez, M.J.; Martínez-Solares, J.M. A new seismic hazard assessment in the region of Andalusia (Southern Spain). Bull. Earthq. Eng. 2010, 8, 739–766. [Google Scholar] [CrossRef]
  4. Torres, Y.; Molina, S.; Martínez-Cuevas, S.; Navarro, M.; Martínez-Díaz, J.J.; Benito, B.; Galiana-Merino, J.J.; Belizaire, D. A first approach to earthquake damage estimation in Haiti: Advices to minimize the seismic risk. Bull. Earthq. Eng. 2016, 14, 39–58. [Google Scholar] [CrossRef] [Green Version]
  5. Molina, S.; Navarro, M.; Martínez-Pagan, P.; Pérez-Cuevas, J.; Vidal, F.; Navarro, D.; Agea-Medina, N. Potential damage and losses in a repeat of the 1910 Adra (Southern Spain) earthquake. Nat. Hazards 2018, 92, 1547–1571. [Google Scholar] [CrossRef]
  6. Borcherdt, R.D. On the observation, characterisation, and predictive GIS mapping of strong ground shaking for seismic zonation. Bull. New Zealand Soc. Earthq. Eng. 1991, 24, 287–305. [Google Scholar] [CrossRef] [Green Version]
  7. Borcherdt, R. Simplified Site Classes and Empirical Amplification Factors for Site-Dependent Code Provisions and Initial “Proposed Vs30 Definition of Site Classes and Site Class Amplification Factors” for Revision of NEHRP Recommended Code Provisions; University of Southern California: Los Angeles, CA, USA, 1992. [Google Scholar]
  8. Borcherdt, R.D. Estimates of Site-Dependent Response Spectra for Design (Methodology and Justification). Earthq. Spectra 1994, 10, 617–653. [Google Scholar] [CrossRef]
  9. FEMA 222A. 1994 Edition: NEHRP Recommended Provisions for Seismic Regulations for New Buildings; Federal Emergency Management Agency: Washington, DC, USA, 1994; pp. 4–7. [Google Scholar]
  10. Sairam, B.; Singh, A.P.; Patel, V.; Chopra, S.; Kumar, M.R. VS30 mapping and site characterization in the seismically active intraplate region of Western India: Implications for risk mitigation. Near Surf. Geophys. 2019, 17, 533–546. [Google Scholar] [CrossRef]
  11. Borcherdt, R.D. VS30—A site-characterization parameter for use in building Codes, simplified earthquake resistant design, GMPEs, and ShakeMaps. In Proceedings of the 15th World Conference on Earthquake Engineering, Lisbon, Portugal, 24–28 September 2012. [Google Scholar]
  12. Ramírez Gaytan, A.; Flores Estrella, H.; Preciado, A.; Bandy, W.L.; Lazcano, S.; Alcántara Nolasco, L.; Aguirre González, J.; Korn, M. Subsoil classification and geotechnical zonation for Guadalajara City, México: Vs30, soil fundamental periods, 3D structure and profiles. Near Surf. Geophys. 2020, 18, 175–188. [Google Scholar] [CrossRef] [Green Version]
  13. Sil, A.; Sitharam, T.G. Dynamic Site Characterization and Correlation of Shear Wave Velocity with Standard Penetration Test ‘N’ Values for the City of Agartala, Tripura State, India. Pure Appl. Geophys. 2014, 171, 1859–1876. [Google Scholar] [CrossRef]
  14. Sairam, B.; Rastogi, B.K.; Aggarwal, S.; Chauhan, M.; Bhonde, U. Seismic site characterization using Vs30 and site amplification in Gandhinagar region, Gujarat, India. Curr. Sci. 2011, 100, 754–761. [Google Scholar]
  15. Socco, L.V.; Strobbia, C. Surface-wave method for near-surface characterization: A tutorial. Near Surf. Geophys. 2004, 2, 165–185. [Google Scholar] [CrossRef]
  16. Carnevale, M.; Park, C.B. Wave-Energy Source for MASW? In Symposium on the Application of Geophysics to Engineering and Environmental Problems 2010; Symposium on the Application of Geophysics to Engineering and Environmental Problems Proceedings; Environment and Engineering Geophysical Society: Denver, CO, USA, 2010; pp. 517–527. [Google Scholar]
  17. Martínez-Pagán, P.; Navarro, M.; Pérez-Cuevas, J.; Alcalá, F.J.; García-Jerez, A.; Vidal, F.R. Shear-wave velocity structure from MASW and SPAC methods: The case of Adra town, SE Spain. Near Surf. Geophys. 2018, 16, 356–371. [Google Scholar] [CrossRef]
  18. Aki, K. Space and Time Spectra of Stationary Stochastic Waves, with Special Reference to Microtremors. Bull. Earthq. Res. Inst. 1957, 35, 415–456. [Google Scholar]
  19. Park, C.B.; Miller, R.D.; Xia, J. Multichannel analysis of surface waves. Geophysics 1999, 64, 800–808. [Google Scholar] [CrossRef] [Green Version]
  20. Crespo, M.J.; Benjumea, B.; Moratalla, J.M.; Lacoma, L.; Macau, A.; González, Á.; Gutiérrez, F.; Stafford, P.J. A proxy-based model for estimating VS30 in the Iberian Peninsula. Soil Dyn. Earthq. Eng. 2022, 155, 107165. [Google Scholar] [CrossRef]
  21. Magistrale, H.; Rong, Y.; Silva, W.; Thompson, E. A Site Response Map of the Continental US. In Proceedings of the Fifteenth World Conference on Earthquake Engineering 2012, Lisbon, Portugal, 24–28 September 2012. [Google Scholar]
  22. Allen, T.I.; Wald, D.J. Topographic Slope as a Proxy for Seismic Site-Conditions (VS30) and Amplification around the Globe; US Geological Survey: Reston, VA, USA, 2007. [Google Scholar]
  23. Thompson, E.M.; Wald, D.J.; Worden, C. A VS30 map for California with geologic and topographic constraints. Bull. Seismol. Soc. Am. 2014, 104, 2313–2321. [Google Scholar] [CrossRef]
  24. Vilanova, S.; Narciso, J.; Carvalho, J.; Lopes, I.; Ferreira, M.; Pinto, C.; Moura, R.; Borges, J.; Nemser, E. Developing a Geologically-Based Vs30 Site-Conditions Model for Portugal: Methodology and Assessment of the Performance of Proxies. Bull. Seismol. Soc. Am. 2018, 108, 322–337. [Google Scholar] [CrossRef]
  25. Wills, C.J.; Petersen, M.; Bryant, W.; Reichle, M.; Saucedo, G.; Tan, S.; Taylor, G.; Treiman, J. A site-conditions map for California based on geology and shear-wave velocity. Bull. Seismol. Soc. Am. 2000, 90, S187–S208. [Google Scholar] [CrossRef]
  26. Wald, D.J.; Allen, T.I. Topographic Slope as a Proxy for Seismic Site Conditions and Amplification. Bull. Seismol. Soc. Am. 2007, 97, 1379–1395. [Google Scholar] [CrossRef] [Green Version]
  27. Wald, D.; McWhirter, L.; Thompson, E.; Hering, A. A New Strategy for Developing Vs30 Maps. In Proceedings of the AGU Fall Meeting Abstracts, San Francisco, CA, USA, 5–9 December 2011; p. 2300. [Google Scholar]
  28. Sanz de Galdeano, C.; López Casado, C.; Delgado, J.; Peinado, M.A. Shallow seismicity and active faults in the Betic Cordillera. A preliminary approach to seismic sources associated with specific faults. Tectonophysics 1995, 248, 293–302. [Google Scholar] [CrossRef]
  29. Buforn, E.; Sanz de Galdeano, C.; Udías, A. Seismotectonics of the Ibero-Maghrebian region. Tectonophysics 1995, 248, 247–261. [Google Scholar] [CrossRef]
  30. IGN-UPM Working Group. Actualización de Mapas de Peligrosidad Sísmica de España 2012; Editorial Centro Nacional de Información Geográfica: Madrid, Spain, 2013; Available online: https://www.ign.es/web/ign/portal/libros-digitales/peligrosidad-sismica2012 (accessed on 12 June 2022). (In Spanish)
  31. Martínez-Díaz, J.J.; Hernández-Enrile, J.L. Neotectonics and morphotectonics of the southern Almería region (Betic Cordillera-Spain) kinematic implications. Int. J. Earth Sci. 2004, 93, 189–206. [Google Scholar] [CrossRef]
  32. García-Mayordomo, J.; Insua-Arévalo, J.M.; Martínez-Díaz, J.J.; Jiménez-Díaz, A.; Martín-Banda, R.; Martín-Alfageme, S.; Álvarez-Gómez, J.A.; Rodríguez-Peces, M.; Pérez-López, R.; Rodríguez-Pascua, M.A.; et al. The Quaternary Faults DB of Iberia (QAFI v.2.0). J. Iber. Geol. 2012, 38, 285–302. [Google Scholar] [CrossRef] [Green Version]
  33. Navarro, M.; Enomoto, T.; Sánchez, F.J.; Matsuda, I.; Iwatate, T.; Posadas, A.M.; LuzóN, F.; Vidal, F.; Seo, K. Surface Soil Effects Study Using Short-period Microtremor Observations in Almería City, Southern Spain. In Earthquake Microzoning; Roca, A., Oliveira, C., Eds.; Birkhäuser: Basel, Switzerland, 2001; pp. 2481–2497. [Google Scholar]
  34. Aldaya, F.; Baena, J.; Ewert, K.; Granados, L.F.; Pan-Arana, T.; Fernández-Luanco, M.C.; Ruiz, P.; Instituto Geológico y Minero de España (IGME). Geologic Maps of Spain (MAGNA Series), Scale 1:50000. 1983. Available online: https://info.igme.es/cartografiadigital/geologica/Magna50Hoja.aspx?Id=967&language=es (accessed on 13 September 2022).
  35. Foti, S.; Hollender, F.; Garofalo, F.; Albarello, D.; Asten, M.; Bard, P.-Y.; Comina, C.; Cornou, C.; Cox, B.; Di Giulio, G.; et al. Guidelines for the good practice of surface wave analysis: A product of the InterPACIFIC project. Bull. Earthq. Eng. 2018, 16, 2367–2420. [Google Scholar] [CrossRef]
  36. Martínez-Pagán, P.; Navarro, M.; Pérez-Cuevas, J.; Alcalá, F.J.; García-Jerez, A.; Sandoval-Castaño, S. Shear-wave velocity based seismic microzonation of Lorca city (SE Spain) from MASW analysis. Near Surf. Geophys. 2014, 12, 739–750. [Google Scholar] [CrossRef]
  37. Park, C. MASW for geotechnical site investigation. Lead. Edge 2013, 32, 656–662. [Google Scholar] [CrossRef]
  38. Boiero, D.; Socco, L.V.; Stocco, S.; Wisén, R. Bedrock mapping in shallow environments using surface-wave analysis. Lead. Edge 2013, 32, 664–672. [Google Scholar] [CrossRef]
  39. Park, C.B.; Miller, R.D.; Xia, J. Imaging dispersion curves of surface waves on multi-channel record. In SEG Technical Program Expanded Abstracts 1998; SEG Technical Program Expanded Abstracts; Society of Exploration Geophysicists: Houston, TX, USA, 1998; pp. 1377–1380. [Google Scholar]
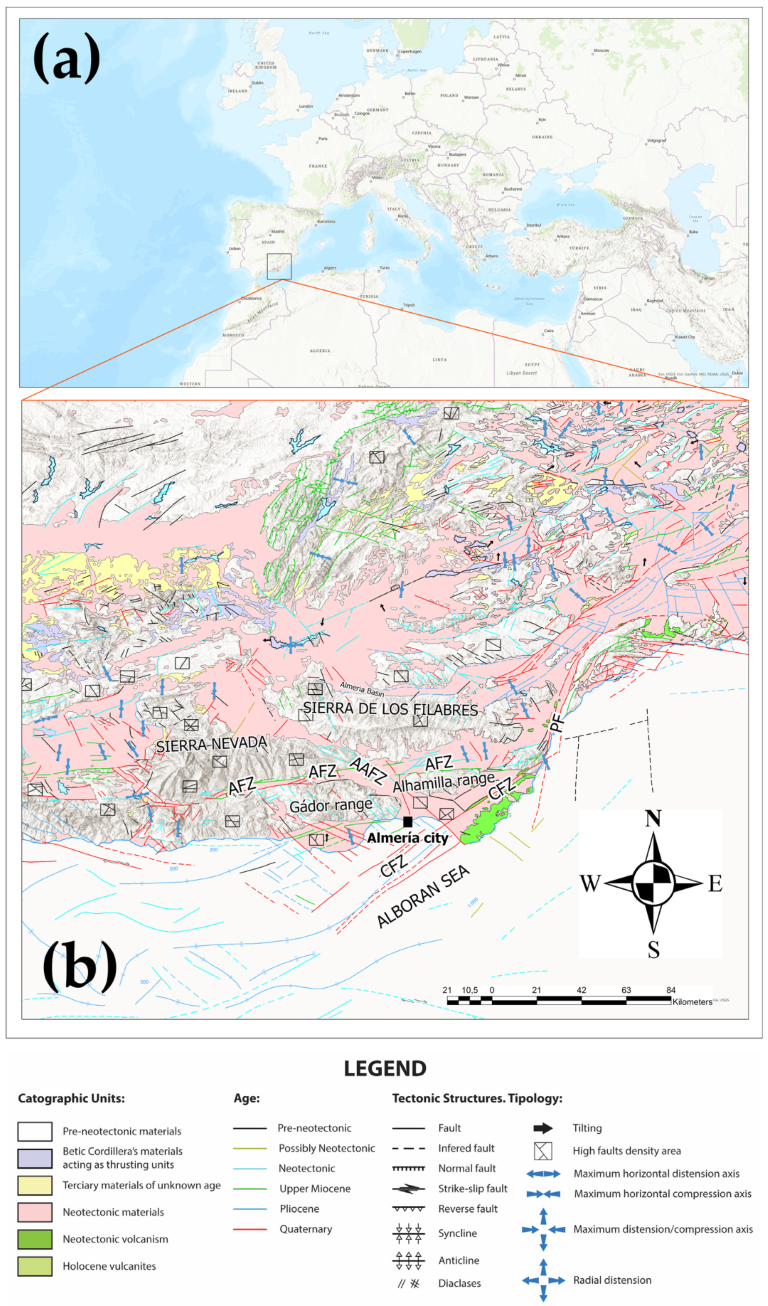
Figure 1. (a) Geographical location of Almeria city; (b) structural map of the southeastern Betic Cordillera (Spain).
Geosciences 12 00403 g001
Figure 2. Local geology map of Almeria City providing the location of SPAC arrays (labels from A1 to A10) and MASW profiles (labels from M1 to M24).
Geosciences 12 00403 g002
Figure 3. Examples of Rayleigh wave phase velocity dispersion curves at different places (see Figure 2). Experimental dispersion curve (green color), dispersion curve obtained from the initial model (yellow), dispersion curves obtained during the inversion process (black lines), and theoretical dispersion curve for the final model (red line) are shown. (a) A2 site (flood plain); (b) A8 site (hill with a gentle slope).
Geosciences 12 00403 g003
Figure 4. MASW landstreamer layout through Almeria city streets, with the seismic source at the back of the acquisition system.
Geosciences 12 00403 g004
Figure 5. Example of a dispersion curve (white dashed curve) obtained for a shot-gather in Almeria city with MASW.
Geosciences 12 00403 g005
Figure 6. Examples of shear-wave velocity models derived from inversion of phase velocities determined from SPAC measurement at different places (see location in Figure 2). Initial model (yellow line), partial models obtained during the inversion process (black lines), and final model (red line) are shown. (a) A2 site (flood plain); (b) A8 site (hill with gentle slope).
Geosciences 12 00403 g006
Figure 7. (a) MASW 2D Vs section from MASW M17 profile (Bilbao Street); (b) Vs30 value vs. distance graph from M17 profile.
Geosciences 12 00403 g007
Figure 8. Terrain slopes in Almeria city for a DEM resolution of: (a) 10 m; (b) 100 m; (c) 200 m.
Geosciences 12 00403 g008aGeosciences 12 00403 g008b
Figure 9. Correlations obtained between log(Vs30 [m/s]) and log(slope [m/m]), for Almeria city using different slope map resolutions: (a) 200 m; (b) 100 m; (c) 10 m.
Geosciences 12 00403 g009
Figure 10. Comparison of residuals at the sampling points for the correlations obtained in Almeria city: MD1 (red points), MD2 (green points) and MD3 (black points).
Geosciences 12 00403 g010
Figure 11. Predicted Vs30 map of Almeria city from the correlation using geological units and slopes (MRS 86.9%) for the sampled area, and the correlation with slope only (MRS 79.1%) for the rest of the municipality. The Vs30 observations (SPAC and average MASW) are represented by dots with a different color according to the standardized residuals between the predicted and the observed values.
Geosciences 12 00403 g011
Figure 12. Examples of SPAC and MASW 1D Vs model comparison: (a) MASW profile M1-b vs. SPAC array A2; and (b) MASW profile M13 vs. SPAC array A7. (See locations in Figure 2).
Geosciences 12 00403 g012
Figure 13. Correlation between calculated Vs30 values and slope: (a) using only those variables (MD2); and (b) considering indicator variables for the geological units (MD3).
Geosciences 12 00403 g013
Table 1. Summary of Vs30 values measured using the SPAC technique. In addition, equivalence with the EC8 classification is provided, including the internal division of B ground class.
SPACΔf (Hz)ΔcR (m/s)ΔVs (m/s)Vs30 (m/s)EC8 1
A14.8–17.0215–412176–625293C
A23.0–21.8191–419185–474317C
A33.0–13.9312–554283–665359C
A46.4–29.8471–674378–748595B1
A57.0–20.0288–701214–824490B2
A62.0–18.0257–904293–1136368B2
A710.5–30.0397–775345–997596B1
A810.0–25.0362–882290–1711513B1
A910.0–19.9495–707415–1374564B1
A1010.0–21.8362–554288–589365B2
1 Eurocode 8 (EC8) site code standards for site classification.
Table 2. Summary of measured Vs30 values with MASW technique. Additionally, the Vs30 value equivalence with EC8 classification is provided, including the internal division of B ground class.
ProfileStreetLength (m)ΔVs30
(m/s)
Vs30 Average
(m/s)
EC8 1
M1Mediterráneo700293–383352C
M2Mediterráneo200336–412367B2
M3Mediterráneo110335–483419B2
M4Mediterráneo40479–535505B1
M5Mediterráneo170463–699538B1
M6Mediterráneo160540–770640B1
M7Mediterráneo220471–624547B1
M8Mediterráneo180522–611574B1
M9Mediterráneo160542–704605B1
M10Mediterráneo180523–649566B1
M11Mediterráneo60525–643569B1
M12Mediterráneo120416–637522B1
M13Pedro Jover250494–763603B1
M14San Juan70555–609585B1
M15San Juan50537–604567B1
M16Braulio Moreno200406–727502B1
M17Bilbao480299–355333C
M18Lérida310326–446356C
M19José Morales Abad240314–434354C
M20La Marina270317–497372B2
M21Chile160330–378354C
M22Chile80333–388349C
M23Gerona250375–507409B2
M24Adolfo Suárez360307–376345C
1 Eurocode 8 (EC8) site code standards for site classification.
Table 3. Comparison of the mean Vs30 values from SPAC and MASW methods for different geological units.
LandformMean Vs30 (m/s)
SPACMASW
1. Mountain (MT)
2. Hill with steep slope (HSS)
3. Hill with gentle slope (HGS)539 ± 26548 ± 30
4. Pleistocene alluvial fan (PAF) 573 ± 30
5. Holocene alluvial fan I (HAF-I)560 ± 50531 ± 80
6. Holocene alluvial fan II (HAF-II)431 ± 63
7. Valley flat I (VF-I)
8. Valley flat II (VF-II)
9. Flood plain (FP)330 ± 21356 ± 23
10. Coastal Lowland (CL) 355 ± 0
11. Reclaimed land (RL)
Table 4. Mean slope (%) for a 200 m resolution DEM and Mean Vs30 values (m/s), within each geological unit. Vs30 estimation methods: Wald and Allen (2007) [26] for tectonically active regions (MD1); Equation (7) (MD2); Equation (8) (MD3); measured values.
LandformMean Slope (%)Mean Vs30 (m/s)
Estimated Values Measured Values
MD1MD2MD3
1. Mountain (MT)12.7 ± 5.7784 ± 252720 ± 84720 ± 84
2. Hill with steep slope (HSS)5.5 ± 1.7497 ± 54584 ± 50584 ± 50
3. Hill with gentle slope (HGS)3.8 ± 1.4437 ± 51525 ± 52521 ± 26543 ± 28
4. Pleistocene alluvial fan (PAF)3.5 ± 2.0425 ± 82507 ± 75551 ± 41573 ± 30
5. Holocene alluvial fan I (HAF-I)3.1 ± 1.7411 ± 58500 ± 58524 ± 29539 ± 74
6. Holocene alluvial fan II (HAF-II)1.4 ± 0.9334 ± 40396 ± 54439 ± 29431 ± 63
7. Valley flat I (VF-I)5.6 ± 2.4496 ± 78580 ± 67580 ± 67
8. Valley flat II (VF-II)3.8 ± 0.8441 ± 31533 ± 29533 ± 29
9. Flood plain (FP)1.1 ± 0.3322 ± 14379 ± 26358 ± 12352 ± 24
10. Coastal Lowland (CL)2.9 ± 5.1392 ± 179445 ± 118379 ± 46355 ± 0
11. Reclaimed land (RL)3.2 ± 5.4378 ± 198415 ± 173415 ± 173
Table 5. Unsigned deviations between measured Vs30 (SPAC, MASW) and estimated values at those sampling points, averaged within each geological unit. Vs30 estimation methods: Wald and Allen (2007) [23] for tectonically active regions (MD1); Equation (7) (MD2); Equation (8) (MD3).
LandformVs30 (m/s)
Residuals at Sample Points
MD1MD2MD3
1. Mountain (MT)
2. Hill with steep slope (HSS)
3. Hill with gentle slope (HGS)654424
4. Pleistocene alluvial fan (PAF)1204118
5. Holocene alluvial fan I (HAF-I)1156854
6. Holocene alluvial fan II (HAF-II)1075949
7. Valley flat I (VF-I)
8. Valley flat II (VF-II)
9. Flood plain (FP)412219
10. Coastal Lowland (CL)37295
11. Reclaimed land (RL)
Publisher’s Note: MDPI stays neutral with regard to jurisdictional claims in published maps and institutional affiliations.