Article

Study of Micro-Parameters of DEM Model on the Laboratory Experiment Results Obtained from Poorly Cemented Sandstone

1
School of Civil, Environmental, and Mining Engineering, University of Adelaide, Adelaide, SA 5005, Australia
2
Department of Energy Resources Engineering, Stanford University, Stanford, CA 94305, USA
*
Author to whom correspondence should be addressed.
Geosciences 2022, 12(10), 373; https://doi.org/10.3390/geosciences12100373
Submission received: 20 August 2022 / Revised: 6 October 2022 / Accepted: 7 October 2022 / Published: 9 October 2022
(This article belongs to the Section Geomechanics)

Abstract

:
Borehole convergence during or after drilling is one of the primary indicators of borehole instability. Early recognition of borehole instability is critical in achieving successful and timely completion of drilling operations and for borehole exploitation. A series of numerical simulations was conducted to investigate the borehole convergence of poorly cemented sandstones using the Discrete Element Method (DEM). Rectangular 2-dimensional Particle Flow Code 2D (PFC2D) models were generated to study the effect of contributing micro-parameters such as stiffness ratio, friction angle, friction coefficient and effective modulus on the behaviour of poorly cemented sandstone subjected to triaxial compression tests. A good agreement between the calibrated numerical models and the experimental data obtained from the laboratory was observed. The results showed that the stiffness ratio was found to be a dominant factor in calibrating the numerical model, and the friction coefficient was the most influential micro-parameter.

1. Introduction

Drilling exploration boreholes in the ground is one of the most widely used methods for investigating the subsurface formations in the energy and mineral resources industry [1]. As with any other excavation, drilling a borehole disturbs local pre-existing stresses in the vicinity of an opening, and this may result in rock failure due to the induced local stresses exceeding the rock strength. In practice, borehole instabilities may occur seemingly unpredictably at any stage of drilling operations, resulting in a loss of time and equipment, as well as, in extreme cases, in abandoning the borehole [2]. It has been estimated that about 70% of the world’s hydrocarbon reservoirs are found within poorly cemented formations, where borehole instabilities are most likely to occur [3]. Furthermore, a significant number of exploration boreholes being drilled through poorly cemented formations worldwide, and particularly in Australia, often result in technical difficulties such as stuck pipes [1].
Borehole instability problems typically account for 5–10% of the total drilling costs and add up to the annual cost of hundreds of millions of dollars worldwide [4]. Therefore, predicting the poorly cemented rock behaviour in the vicinity of excavation is essential for maintaining its stability and, consequently, for reducing the drilling costs. Numerical modelling provides the possibility of simulating a synthetic material consisting of an assembly of rigid grains that interact at contacts. Cundall [5] proposed the Discrete Element Method (DEM) to simulate the microstructure features and mechanical properties of intact rocks. The Particle Flow Code (PFC) is the most widely used DEM code in geomechanics, the PFC model is capable of simulating both granular and bonded materials as well as an interface that can be inserted into the bonded materials. The PFC model simulates the movement of particles and their mechanical interaction at pair-wise contacts. Previous studies show that borehole convergence of granular materials is affected by many factors, including the stress level, loading path, particle strength, degree of cementation and borehole size [6]. Among all these factors, the effect of degree of cementation has not been fully clarified. Limited studies show that stress level is dependent on the degree of cementation. However, the mechanism of the effect of degree of cementation on borehole convergence is still not clear. This may be due to the difficulties of carrying out experimental research on poorly cemented sandstone specimen. Numerical modelling enables investigation of how microscopic parameters of the DEM model impact on the behaviour of the numerical model. The DEM provides an opportunity to incorporate the damage mechanisms into the force–displacement law of the contact, which allows for more realistic numerical framework compared to other numerical modelling methods. PFC has been widely used to simulate rock behaviour [7]. Recently, numerical models have been applied to simulate the progression of breakouts [8,9,10,11,12,13]. This study focuses on the effect of contributing parameters such as stiffness ratio, friction angle, friction coefficient and effective modulus on the behaviour of poorly cemented sandstone subjected to triaxial compression tests using DEM. A comparison between experimental and numerical results was conducted to validate the outcome of the DEM simulations.

2. Discrete Element Modelling

2.1. Bonded-Particle Model

In the discrete element model, the boundary conditions do not only constrain the particle’s motion, but they also allow for loading the specimen by setting its boundary’s motion speed. There are three possible boundary conditions that can be configured in the PFC2D discrete element software: wall boundary, discrete particle boundary, and mixed boundary. The wall boundary was used in this study, and the loading fixture for the boundary wall simulation in the actual test was established on the upper and lower parts of the specimen, and a constant motion speed was applied to the wall element to simulate the loading speed during the actual test. Bonded Particle Model (BPM) can be utilized to numerically model and simulate the behaviour of both the mechanical and microstructural behaviours of intact rock particle assemblies bonded by cementations. The mechanical behaviours investigated in the literature include elasticity [14,15], fracturing [16,17], failure processes [18], damage zones [19], rock cutting [20], crack initiation and coalescence processes [21,22,23] and shearing behaviours of soil–rock mixture [24].
PFC2D allows for three BPMs, the linear-bonded model (LBM), the parallel-bonded model (PBM) and the flat-jointed model (FJM). The PBM and FJM are the most widely used in rock simulations, which enables simulating an excellent match of mechanical behaviours of rocks at lab scales. However, a BPM with an LBM or a PBM suffers from three intrinsic problems: unrealistic ratio of uniaxial compressive strength (UCS) to tensile strength (TS), unrealistic low internal friction angle, and unrealistic linear failure envelope [14,25,26]. These limitations can be addressed in two ways: By either increasing interlock in the numerical models, i.e., creating clumps of particles [25], which increases computation time, or by introducing a grain-based model. The calculations performed in the DEM alternate between the application of Newton’s second law to the particles and a force–displacement law at the contacts. Newton’s second law is used to determine the motion of each particle arising from the contact and body forces acting upon it, while the force–displacement law is used to update the contact forces arising from the relative motion at each contact. One of the major issues identified using BPM is the bond failure and contact stress reduction leading to an abrupt energy release in DEM simulation. A gradual yielding of the bonds is involved in the process of fracture initiation and propagation [27]. In order to make the bond breakage process in DEM more realistic, a softening constitutive model can be assigned on the DEM contacts. Such softening response at a microscopic level allows for controlling of the overall energy dissipation of the simulation while maintaining stable macroscopic failure growth.

2.2. Constitutive Relationships

In a DEM simulation, macroscopic failure behaviour is controlled by the contact constitutive models. Hence, the failure characteristics of the material, i.e., gradual softening, must be appropriately incorporated in the contact model. There are several cohesive models available in the literature [28,29,30,31] that can be used as contact models in DEM.

2.3. Calibration

The micro-parameters must be calibrated prior to comparing the results of the DEM with the laboratory experimental results. The selection of an appropriate set of micro-parameters is a critical step in DEM simulation. The most commonly used method of calibrating the micro-parameters of PFC DEM includes comparing the results of uniaxial compressive tests and triaxial tests of physical specimens obtained from the laboratory and reproducing the macroscopic behaviour of the physical specimen [32,33]. In this study, a series of laboratory experimental test results obtained from synthetic poorly cemented sandstone specimens was used. The micro-parameters of the numerical model were calibrated against the laboratory experimental test results. The numerical macroscopic shear stiffness, normal stiffness, and friction coefficient were compared with their experimental counterparts.
The dimension of a physical specimen used for uniaxial compressive tests was 127 mm in height and 63.5 mm in width. A rectangular specimen matching the physical specimen dimension was created in PFC2D. The minimum particle radius was chosen to be 0.225 mm, and the ratio of the maximum particle radius to minimum particle radius was chosen to be 1.66, as it is the most common choice for the simulation of rocks [34]. The inverse calibration method was used to obtain the micro-parameters such as the contact strength, the softening parameter, the friction of coefficient, normal to shear stiffness ratio, and dilation coefficient of the cohesive contacts.
The contact deformability method proposed by Potyondy and Cundall [14] was employed to calibrate the model. The first step involved matching the macroscopic Young’s modulus with its experimental counterpart. The linear elastic behaviour of the DEM specimen is controlled by the effective modulus and the friction of coefficient. These two parameters were modified to match the macroscopic Young’s modulus. During the calibration of the linear elastic stage, the contact strength was considered to be high enough to avoid any possible damage in the specimen. The subsequent step is to calibrate the Poisson’s ratio (𝜐), which is controlled by normal shear stiffness ratio. This parameter was calibrated in an iterative procedure with the first stage of calibration. Finally, the UCS of the model was reproduced by altering the bonding parameters, the friction coefficient of the contacts, and the softening parameter. The strength of the cohesive contacts was controlled by the bonding parameters, and the softening parameter controls the softening behaviour of the contacts during post-peak stage. The friction coefficient of the contacts also influences the strength of the contacts, which in the macroscopic scale can control the UCS of the model.
In the model generation stage, the rectangular boundary wall was established in PFC2D. The wall uses the software’s built-in FISH language to achieve particle delivery. In the process of generating the target porosity using the shrink-and-expansion method, the wall stiffness needs to be set to prevent particles from escaping from the model boundary. The solid model and hollow cylinder model generated in PFC2D are shown below in Figure 1a,b, respectively.
The default procedure to set up a PFC2D model for numerical simulations involved following the four steps below proposed by Potyondy and Cundall [14].
  • Generate particles randomly with diameters in a specified range within a vessel bounded by frictionless walls.
  • Adjust the system by allowing particles to move under zero friction.
  • Apply low isotropic stress by modifying the diameters of all particles simultaneously.
  • Modify the diameters of particles that have less than two contacts iteratively so that these particles have at least two contacts.
The numerical model used for the calibration is a cylinder with a diameter of 63.5 mm and a height of 127 mm, and it was generated using the default procedure in PFC2D. After a numerical model is generated, the specimen is confined by top, bottom and side walls. The specimen is loaded by moving the top and bottom walls towards each other at a specified loading rate that ensures a quasi-static loading condition. A constant axial loading at a displacement rate of 0.07 mm/min was applied to keep the numerical simulation results comparable to experimental laboratory test results. Simulation time was largely dependent on the minimum radius size of the ball particles where a specimen with a minimum ball radius of 0.25 mm, as shown in Figure 1a, took approximately 13 min to simulate.
Figure 2 illustrates a comparison of stress–strain curves obtained from PFC2D DEM numerical modelling and laboratory tests under 2 MPa of confining pressure for solid specimens under triaxial tests. A close agreement was observed between the experimental data and the calibrated numerical results. The results also showed that the obtained results for the pre-peak behaviour of the laboratory tests and simulations are quite accurate, whereas the matching level is not quite as accurate in the last stages of the post-peak deformation behaviour, especially at the stage following the peak where the deformation curve gradually drops. It was observed that the rate of drop in the deformation curve was more prevalent for the numerical simulation conducted on the specimen with a 14% cement content compared to the specimens with a cement content less than 10%. The slight variation in the post-peak deformation behaviour observed between the experimental data and calibrated numerical results is likely caused by the inability of conventional rock mechanics testing machines to perfectly match with a numerically created testing environment in PFC2D. This slight variation between numerical and laboratory stress–strain curves of triaxial tests have also been observed by other researchers [11,18,23].

3. Experimental Test Results

The synthetic sandstone specimens used in this study were prepared according to the mixture preparation procedure for a poorly cemented formation proposed by Hashemi et al. [1]. The mixture was composed of natural silica sands with two different grain size ranges, namely, coarse grain sands with a grain size between 0.425 and 1.4 mm, and fine grain sands with a grain size between 0.15 and 0.355 mm, Portland cement type II (specific gravity, Gs = 3.15 g/cm³) and water. The components were thoroughly mixed together to achieve a homogeneous mixture for specimens, and the time spent between pouring water into the dry mixture and compacting it into metal moulds was maintained to be within 30 min to avoid initial setting of the cement. Each sample was prepared by compacting the mixture into three equal layers of 42 mm thickness. The top surface of the bottom layer was scratched before the subsequent layer was compacted on top of it to ensure thorough interlocking between the successive layers. The mixture was not strong enough to bond sand grains in the early curing stage. Thus, the samples were left in the mould for five days and then were removed from the mould and cured for another three days and wrapped in a plastic film at room temperature (18–23 °C) before testing. Mechanical properties of the specimens are presented in Table 1.
Picture of the side and top views of the synthetic cylinder and the TWHC specimens used for laboratory testing are shown in Figure 3 below.
UCS tests were conducted on cylinder specimens. The UCS test results showed that the maximum strength and the pre-maximum stiffness increase as the cement content increased. The influence of cement content on the peak strength was substantial. The UCS increased by 48% when the cement content was increased from 10% to 12%. Further increases in the cement content to 14% and 16% resulted in 35% and 25% increases in the UCS, respectively, indicating that the influence of the cement content on the maximum strength becomes less significant as the cement content increases. This can be caused by a reduction in the grain-to-grain space available for cementation due to the increased cement content which pushes grains closer. Furthermore, according to Chen and Wu [35], a low water-to-cement ratio results in decreased cement hydration. Thus, the increase in the cement content for the same water content could also have contributed to reduced cement hydration due to excess cement particles not reacting with water. Laboratory studies by Saidi et al. [36] also observed that in granular materials, adding an additional cementing agent to the specimens with a low cement content of less than 20% is more likely to significantly increase their maximum strength than adding a more cementing agent to the specimens with a higher cement content. The post-peak stress–strain trend of samples with 10% cement content showed a greater ductile behaviour compared to the samples with a higher cement content of 12% and 14%. Moreover, the effect of water content was studied by varying the amount of water content between 10% and 12% while keeping other components unchanged. The increase in the water content resulted in strength reduction as a result of the increased total porosity. This outcome is in agreement with previous studies by Hashemi et al. [1] conducted on synthetic sandstones with 10% water content and by Heo et al. [37].

3.1. Cut-Off UCS

Poorly cemented sandstones are characterized by low strength, poor cementation and high porosity [38]. The UCS test results are generally considered for classification of weak sandstones from stronger hard rocks [39,40]. In this study, Baud and Gambin’s [41] approach for selecting the soft rocks based on the UCS upper limit of 10 MPa, as well as Liu and Wu’s [42] guidance on classifying weak sandstone from stronger sandstone based on the UCS have been taken into consideration. To identify the mechanical properties, a series of UCS tests was conducted on synthetic sandstones with various cement contents while keeping the water and sand components constant. Synthetic sandstone samples with four different cement contents, namely, 10%, 12%, 14%, and 16%, were considered for studying the effect of cement content on the UCS. These UCS tests were conducted based on the ISRM-suggested methods [39] and under the same testing conditions. Figure 4a–c illustrate the compactor used to achieve uniform compaction of the specimen mixture in the mould, the synthetic rock specimens cast in the metal moulds, and the final solid synthetic specimens prepared for UCS testing, respectively. The specimens were tested after 8 days of curing time, and the average dry density was measured to be 1.79 g/cm³.
The stress–strain diagrams obtained from the UCS tests are presented in Figure 5. The results show that the maximum strength, σmax and the pre-maximum stiffness increase as the cement content increases. This trend is in agreement with the UCS test results obtained by Hashemi et al. [1] who used a lower range of cement content between 5% and 8%. It was observed that an increase in the cement content resulted in a higher maximum strength, which also matches closely with other studies conducted on the influence of cement content on the UCS of synthetic sandstone specimens [36,43].
As can be seen from Figure 5, the solid specimens with higher than 14% cement content exceeded the UCS of 10 MPa; therefore, 14% was identified as the upper cut-off cement content for this study, as increasing the cement content beyond this level resulted in a stronger specimen which does not meet the strength characteristic of a poorly cemented rock [44]. Three cementation levels (i.e., 10%, 12% and 14%) were considered for TWHC experiments.

3.2. Triaxial Test Results on Solid Specimens

Triaxial tests were carried out on solid cylindrical specimens with three different cement contents based on the preliminary UCS test results. Specimens with cement contents of 10%, 12%, and 14% were tested under different stress conditions. Figure 6a–c present the deviatoric stress (σdeviatoric = σ1 − σhydrostatic) versus the axial strain diagram for solid specimens with different cement contents.

3.3. Triaxial Tests on Thick-Walled Hollow Cylinder Specimens

Triaxial tests were conducted on TWHC specimens with 15 mm diameter borehole for three different cement contents (10%, 12%, and 14%) and various confining pressures. Figure 7 presents the deviatoric stress (σdeviatoric = σ1 − σhydrostatic) versus the axial strain diagram for TWHC specimens with cement contents between 10% and 14%.

4. Numerical Simulation Results

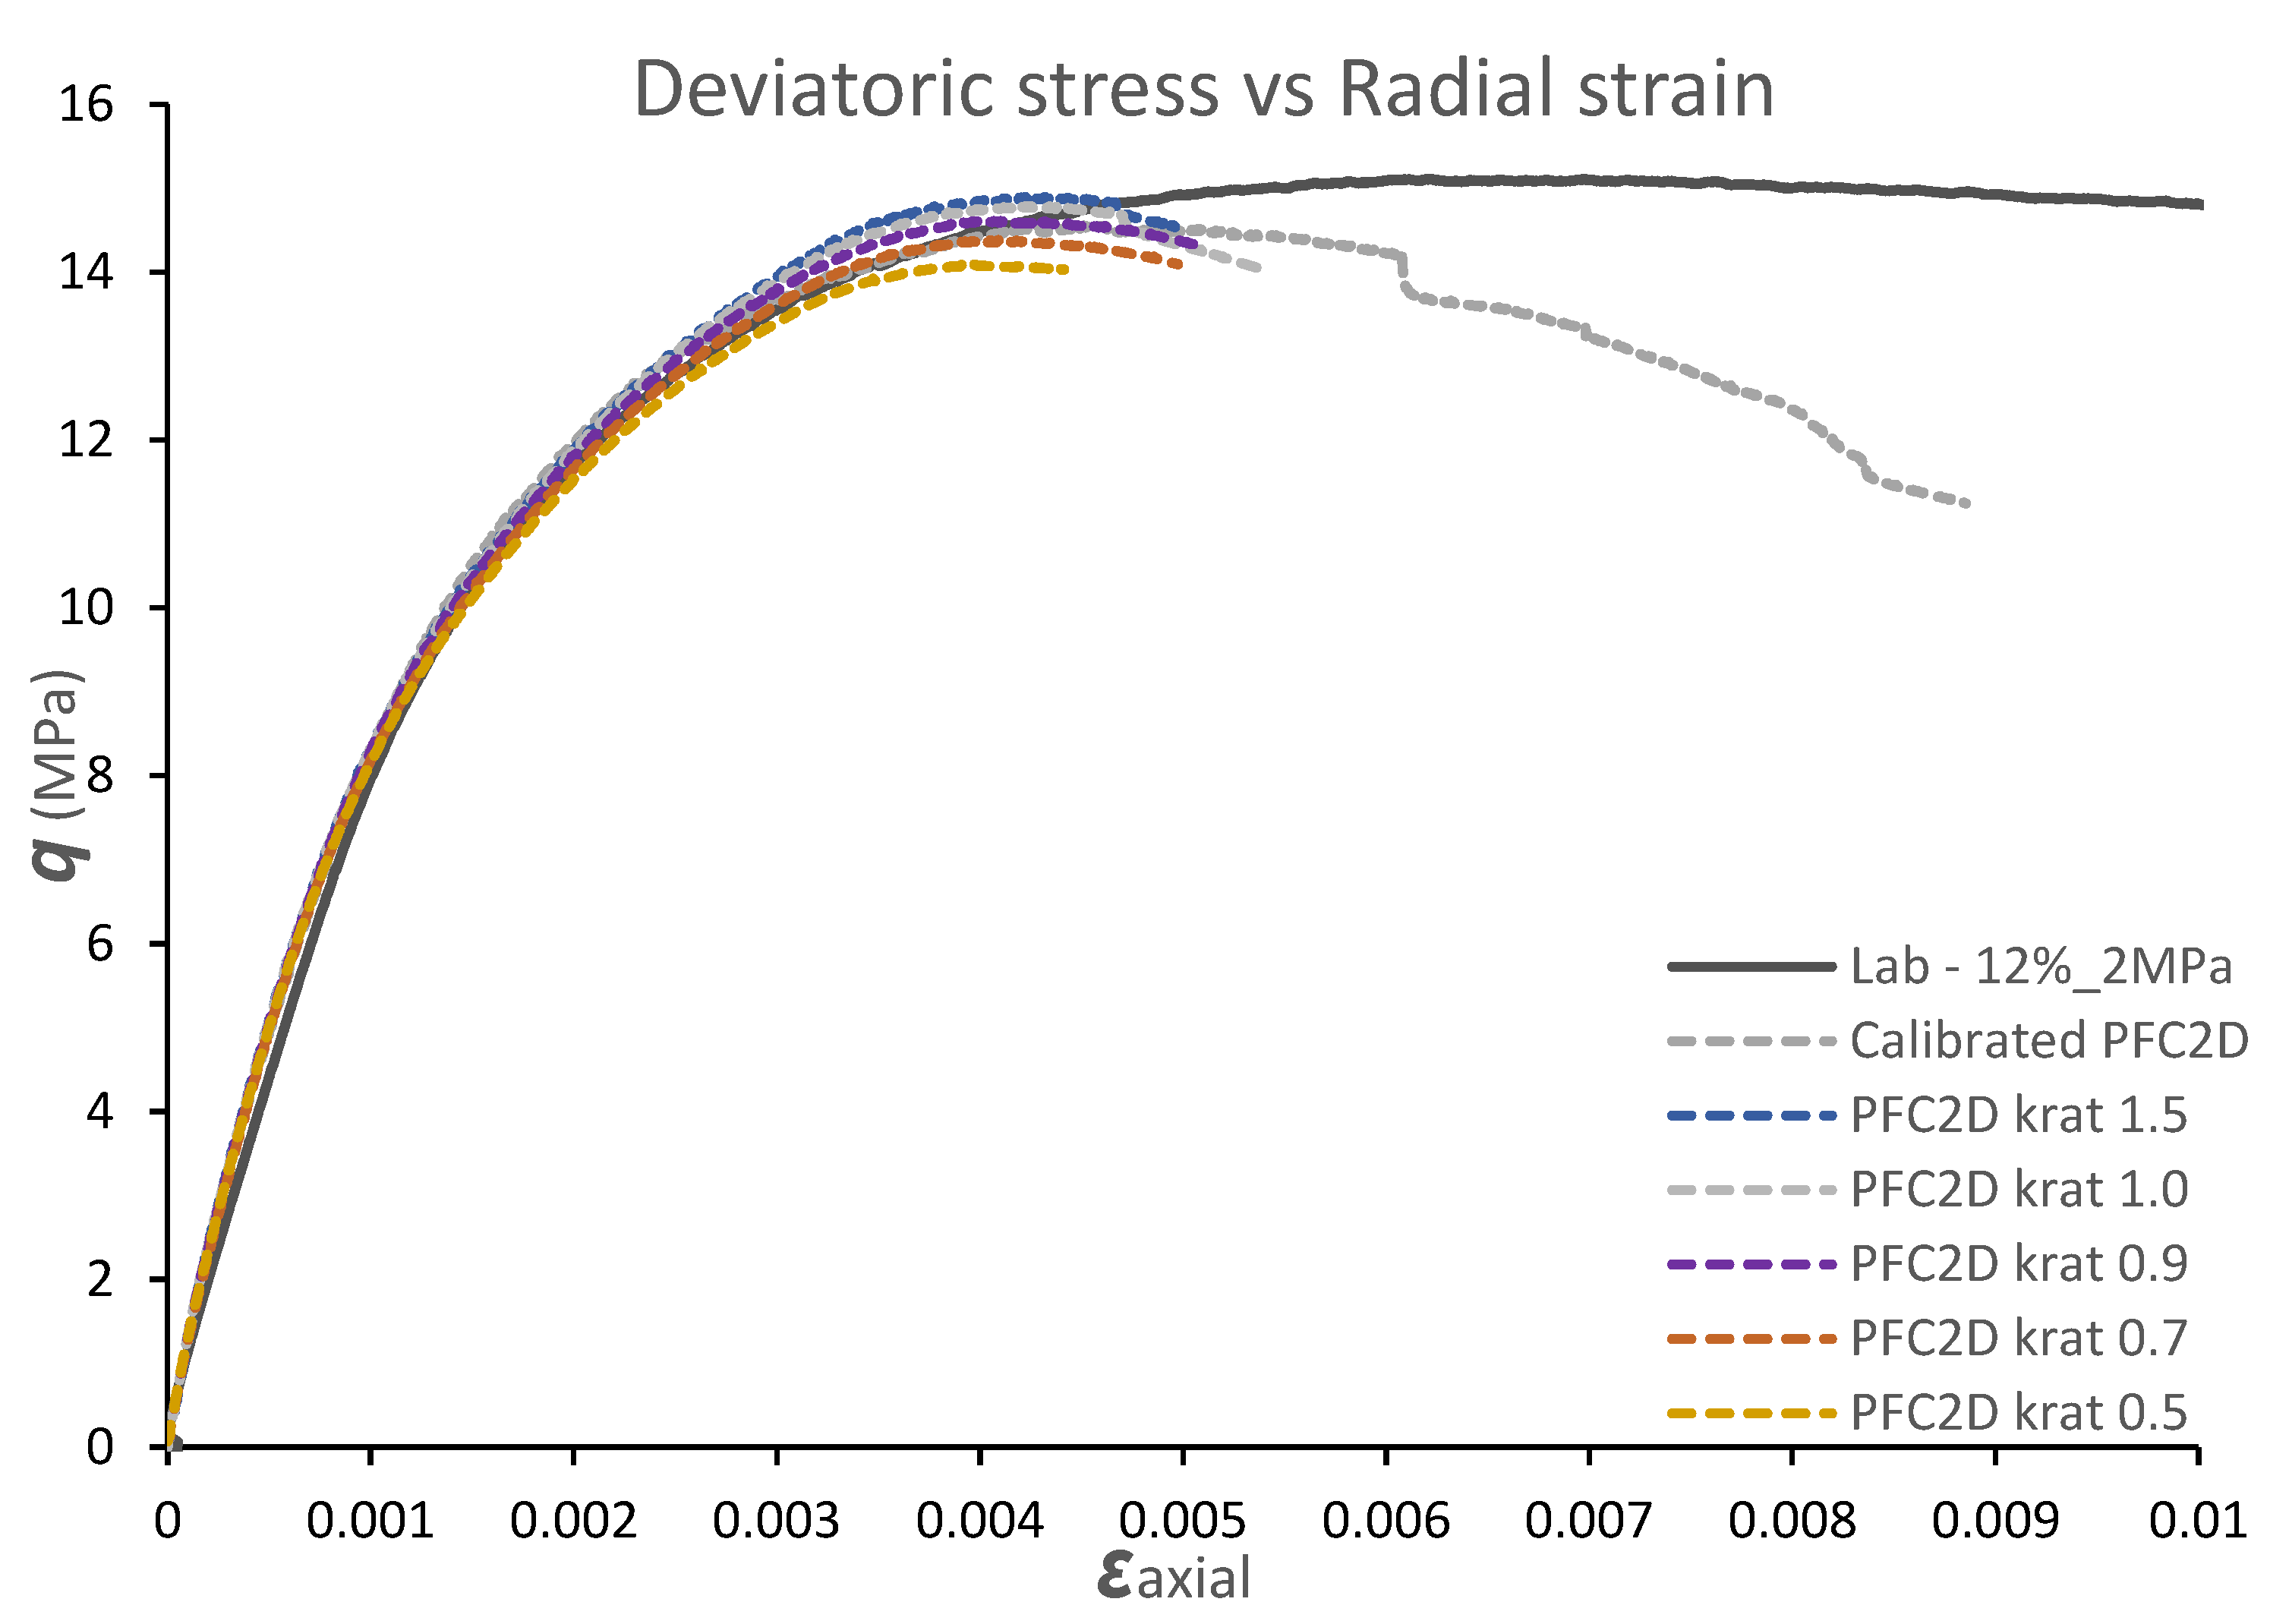
4.1. Stiffness Ratio

The effects of the stiffness ratio on the deviatoric stress (q) of the synthetic rock are illustrated in Figure 8. When the stiffness ratio increases from 0.5 to 1.5, the deviatoric stress of the numerical model increases along with the Young’s modulus. These results are consistent with previous numerical simulation conducted by Huang [45], Yang et al. [46], Fakhimi and Villegas [19] and He and Xu [20], where the stiffness ratio is a dominant factor in calibrating the deviatoric stress and the Young’s modulus.

4.2. Friction Angle

Friction angle was varied to assess its influence on the deviatoric stress. The friction angle varied between 10 and 50 degrees as illustrated in Figure 9. The variations in the friction angle below 40 degrees had limited impact on the deviatoric stress. The friction angle has no influence on the Young’s modulus until the friction angle increases above 40 degrees, and this was due to the friction angle having no effect until the bond breaks and sliding between particles occur. This observation is in agreement with Wu and Xu’s [26] DEM numerical simulation results that showed that the friction angle has no effect on the pre-failure macroscopic parameters.

4.3. Friction Coefficient

Figure 10 illustrates that the deviatoric stress increases with an increase in the friction coefficient. This observation indicates that particle breakage of granular materials depends on the friction coefficient. The particle friction coefficient was the most influential micro-parameter. When the friction coefficient was increased from 0.15 to 0.45, the deviatoric stress increased by threefold from 5 to 15 MPa. Friction forces dominate the contact forces between particles during compression, and as a result, the increase in friction coefficient resulted in an increase in the deviatoric stress. The PFC2D simulation of triaxial tests carried out by Zhao et al. [16] also demonstrated the significance of the particle friction coefficient. The simulation showed that particles with higher friction coefficient resulted in higher shear strength under compression, which matches with this study. This implies that there was a significant sliding movement between particles during compression, where friction between particles played a major role in the resultant shear strength.

4.4. Effective Modulus (E*)

The effect of effective modulus values on the deviatoric stress are illustrated in Figure 11. An increase in the effective modulus resulted in an increase in both Young’s modulus and the deviatoric stress. This result is consistent with a previous study completed by Zhou et al. [17] where the Young’s modulus E was found to be linearly dependent on the effective modulus. Furthermore, the effect of increasing the effective modulus values on the deviatoric stress compared to other micro-parameters was found to be greater.

5. Conclusions

In conclusion, the PFC2D numerical models calibrated using the triaxial experimental data obtained from the laboratory showed good agreement in the deviatoric stress versus radial strain relationship in their experimental counterparts. Through various attempts of numerical simulations, the calibrated numerical models successfully simulated the behaviour of poorly cemented sandstone specimens tested in the laboratory. The effects of micro-parameters such as stiffness ratio, friction angle, friction coefficient, and effective modulus were investigated to identify how each of the selected micro-parameters impacted the deviatoric stress under the triaxial test. The results showed that the particle friction coefficient is the most influential micro-parameter. The presented numerical simulations using PFC2D have helped to gain a better understanding of the effects of various micro-parameters on the borehole deformation behaviour and failure stress. It is important to be able to predict the behaviour of poorly cemented sandstone to understand the detailed failure propagation developed under different confining pressures.

Author Contributions

Conceptualization, J.H.H.; validation, J.H.H.; formal analysis, J.H.H.; investigation, J.H.H.; writing—original draft preparation, J.H.H.; writing—review and editing, J.H.H.; supervision, S.S.H. and N.M. All authors have read and agreed to the published version of the manuscript.

Funding

This research received no external funding.

Conflicts of Interest

The authors declare no conflict of interest.

References

  1. Hashemi, S.S.; Melkoumian, N.; Taheri, A.; Jaksa, M. The failure behaviour of poorly cemented sands at a borehole wall using laboratory tests. Int. J. Rock Mech. Min. Sci. 2015, 77, 348–357. [Google Scholar] [CrossRef]
  2. Fjar, E.; Holt, R.; Raaen, A.; Risnes, R.; Horsrud, P. Petroleum Related Rock Mechanics, 2nd ed.; Elsevier: Amsterdam, The Netherlands, 2008; pp. 309–310. [Google Scholar]
  3. Bianco, P.M.; Halleck. Mechanisms of arch instability and sand production in two-phase saturated poorly consolidated sandstones. In Proceedings of the SPE European Formation Damage Conference, Hague, The Netherlands, 21–22 May 2001. [Google Scholar]
  4. Al-Ajmi, A.; Zimmerman, R. Stability analysis of vertical boreholes using the Mogi–Coulomb failure criterion. Int. J. Rock Mech. Min. Sci. 2006, 43, 1200–1211. [Google Scholar] [CrossRef]
  5. Cundall, P.A. Distinct Element Models of Rock and Soil Structure. In Analytical and Computational Methods in Engineering Rock Mechanics; Brown, E.T., Ed.; Brown Allen and Unwin: London, UK, 1987; pp. 129–163. [Google Scholar]
  6. Hashemi, S.S.; Melkoumian, N. Effect of different stress path regimes on borehole instability in poorly cemented granular formations. J. Pet. Sci. Eng. 2016, 146, 30–49. [Google Scholar] [CrossRef]
  7. Potyondy, D.O. The bonded-particla model as a tool for rock mechanics research and application: Current trends and future directions. Geosyst. Eng. 2015, 18, 1–28. [Google Scholar] [CrossRef]
  8. Papanastasiou, P.C.; Vardoulakis, I.G. Numerical treatment of progressive localization in relation to borehole stability. Int. J. Numer. Anal. Methods Geomech. 1992, 16, 389–424. [Google Scholar] [CrossRef]
  9. Rahmati, H.; Nouri, A.; Chan, D.; Vaziri, H. Simulation of drilling-induced compaction bands using discrete element method. Int. J. Numer. Anal. Methods Geomech. 2014, 38, 37–50. [Google Scholar] [CrossRef]
  10. Duan, K.; Kwok, C.Y. Evolution of stress-induced borehole breakout in inherently anisotropic rock: Insights from discrete element modeling. J. Geophys. Res. Solid Earth 2016, 121, 2361–2381. [Google Scholar] [CrossRef] [Green Version]
  11. Lee, H.; Moon, T.; Haimson, B.C. Borehole breakouts induced in arkosic sandstones and a discrete element analysis. Rock Mech. Rock Eng. 2016, 49, 1369–1388. [Google Scholar] [CrossRef]
  12. Setiawan, N.B.; Zimmerman, R.W. Wellbore breakout prediction in transversely isotropic rocks using true-triaxial failure criteria. Int. J. Rock Mech. Min. Sci. 2018, 112, 313–322. [Google Scholar] [CrossRef]
  13. Li, X.; El Mohtar, C.S.; Gray, K. EModeling progressive breakouts in deviated wellbores. J. Pet. Sci. Eng. 2019, 175, 905–918. [Google Scholar] [CrossRef]
  14. Potyondy, D.O.; Cundall, P.A. A bonded-particle model for rock. Int. J. Rock Mech. Min. Sci. 2004, 41, 1329–1364. [Google Scholar] [CrossRef]
  15. Schöpfer, M.P.; Childs, C.; Walsh, J.J. Two-dimensional distinct element modeling of the structure and growth of normal faults in multilayer sequences: 1. Model calibration, boundary conditions, and selected results. J. Geophys. Res. Solid Earth 2007, 112. [Google Scholar] [CrossRef]
  16. Zhao, W.; Huang, R.; Yan, M. Mechanical and fracture behaviour of rock mass with parallel concentrated joints with different dip angle and number based on PFC simulation. Geomech. Eng. 2015, 8, 757–767. [Google Scholar] [CrossRef]
  17. Zhou, C.; Xu, C.; Karakus, M.; Shen, J. A systematic approach to the calibration of micro-parameters for the flat-jointed bonded particle model. Geomech. Eng. 2018, 16, 471–482. [Google Scholar]
  18. Duan, K.; Kwok, C.Y.; Pierce, M. Discrete element method modeling of inherently anisotropic rocks under uniaxial compression loading. Int. J. Numer. Anal. Methods Geomech. 2016, 40, 1150–1183. [Google Scholar] [CrossRef]
  19. Fakhimi, A.; Villegas, T. Application of dimensional analysis in calibration of a discrete element model for rock deformation and fracture. Rock Mech. Rock Eng. 2007, 40, 193–211. [Google Scholar] [CrossRef]
  20. He, X.; Xu, C. Discrete element modelling of rock cutting: From ductile to brittle transition. Int. J. Numer. Anal. Methods Geomech. 2015, 39, 1331–1351. [Google Scholar] [CrossRef]
  21. Vesga, L.F.; Vallejo, L.E.; Lobo-Guerrero, S. DEM analysis of the crack propagation in brittle clays under uniaxial compression tests. Int. J. Numer. Anal. Methods Geomech. 2008, 32, 1405–1415. [Google Scholar] [CrossRef]
  22. Ning, J.; Liu, X.; Tan, Y.; Wang, J.; Tian, C. Relationship of box counting of fractured rock mass with Hoek-Brown parameters using particle flow simulation. Geomech. Eng. 2015, 9, 619–629. [Google Scholar] [CrossRef]
  23. Tian, W.L.; Yang, S.Q. Experimental and numerical study on the fracture coalescence behaviour of rock-like materials containing two non-coplanar filled fissures under uniaxial compression. Geomech. Eng. 2017, 12, 541–560. [Google Scholar] [CrossRef]
  24. Xu, W.J.; Li, C.Q.; Zhang, H.Y. DEM analyses of the mechanical behaviour of soil and soil-rock mixture via the 3D direct shear test. Geomech. Eng. 2015, 9, 815–827. [Google Scholar] [CrossRef]
  25. Cho, N.A.; Martin, C.D.; Sego, D.C. A clumped particle model for rock. Int. J. Rock Mech. Min. Sci. 2007, 44, 997–1010. [Google Scholar] [CrossRef]
  26. Wu, S.; Xu, X. A study of three intrinsic problems of the classic discrete element method using flat-joint model. Rock Mech. Rock Eng. 2016, 49, 1813–1830. [Google Scholar] [CrossRef]
  27. Khazaei, C.; Hazzard, J.; Chalaturnyk, R. Damage quantification of intact rocks using acoustic emission energies recorded during uniaxial compression test and discrete element modeling. Comput. Geotech. 2015, 67, 94–102. [Google Scholar] [CrossRef]
  28. Le, L.A.; Nguyen, G.D.; Bui, H.H.; Sheikh, A.H.; Kotousov, A.; Khanna, A. Modelling jointed rock mass as a continuum with an embedded cohesive-frictional model. Eng. Geol. 2017, 228, 107–120. [Google Scholar] [CrossRef]
  29. Le, L.A.; Nguyen, G.D.; Bui, H.H.; Sheikh, A.H.; Kotousov, A.; Khanna, A. Localised failure mechanism as the basis for constitutive modelling of geomaterials. Int. J. Eng. Sci. 2018, 133, 284–310. [Google Scholar] [CrossRef]
  30. Nguyen, N.H.T.; Bui, H.H.; Nguyen, G.D.; Kodikara, J. A cohesive damage-plasticity model for DEM and its application for numerical investigation of soft rock fracture properties. Int. J. Plast. 2017, 98, 175–196. [Google Scholar] [CrossRef]
  31. Nguyen, N.H.T.; Bui, H.H.; Nguyen, G.D.; Kodikara, J.; Arooran, S.; Jitsangiam, P. A thermodynamics-based cohesive model for discrete element modelling of fracture in cemented materials. Int. J. Solids Struct. 2017, 117, 159–176. [Google Scholar] [CrossRef]
  32. Bahaaddini, M.; Sharrock, G.; Hebblewhite, B.K. Numerical direct shear tests to model the shear behaviour of rock joints. Comput. Geotech. 2013, 51, 101–115. [Google Scholar] [CrossRef]
  33. Gutiérrez, J.G.; Senent, S.; Melentijevic, S.; Jimenez, R. Distinct element method simulations of rock-concrete interfaces under different boundary conditions. Eng. Geol. 2018, 240, 123–139. [Google Scholar] [CrossRef]
  34. Koyama, T.; Jing, L. Effects of model scale and particle size on micro-mechanical properties and failure processes of rocks—A particle mechanics approach. Eng. Anal. Bound. Elem. 2007, 31, 458–472. [Google Scholar] [CrossRef]
  35. Chen, X.; Wu, S. Influence of water-to-cement ratio and curing period on pore structure of cement mortar. Constr. Build. Mater. 2013, 38, 804–812. [Google Scholar] [CrossRef]
  36. Saidi, F.; Bernabe, Y.; Reuschle, T. The mechanical behaviour of synthetic, poorly consolidated granular rock under uniaxial compression. Tectonophysics 2003, 370, 105–120. [Google Scholar] [CrossRef]
  37. Heo, J.H.; Melkoumian, N.; Hashemi, S.S. Evaluating the Effect of Different Stress Path Regimes on Borehole Deformation Using Convergence Measuring Device. Geosciences 2022, 12, 317. [Google Scholar] [CrossRef]
  38. Bosio, J.J.; Kanji, M.A. Soft rocks of the Rio de la Plata Basin. In International Symposium on Indurated Soils and Soft Rocks; AGI: Naples, Italy, 1998; pp. 65–71. [Google Scholar]
  39. ISRM. Rock characterization, testing, and monitoring. ISRM suggested methods. Int. J. Rock Mech. Min. Sci. Geomech. Abstr. 1981, 18, 109. [Google Scholar] [CrossRef]
  40. Kanji, M. Critical issues in soft rocks. J. Rock Mech. Geotech. Eng. 2014, 6, 186–195. [Google Scholar] [CrossRef] [Green Version]
  41. Baud, J.P.; Gambin, M. Classification of soils and rocks based on pressuremeter tests under high pressure. In Proceedings of the 15th European Conference on Soil Mechanics and Geotechnical Engineering, Athens, Greece, 11–15 September 2011; pp. 325–330. [Google Scholar]
  42. Liu, K.; Wu, B. Predicting Reservoir Rock Mechanical Properties Directly from Sedimentary Characterisation. In Proceedings of the SPE Asia Pacific Oil & Gas Conference and Exhibition, Perth, Australia, 25–27 October 2016. [Google Scholar]
  43. Bernabe, Y.; Fryer, D.; Hayes, J. The effect of cement on the strength of granular rocks. Geophys. Res. Lett. 1992, 19, 1511–1514. [Google Scholar] [CrossRef]
  44. Klein. An approach to the classification of weak rock for tunnel projects. In Proceedings of the Rapid Excavation and Tunneling Conference, San Diego, MA, USA, 6–12 October 2001. [Google Scholar]
  45. Huang, H. Discrete Element Modeling of Tool-Rock Interactio. Ph.D. Thesis, The University of Minnesota, Minneapolis, MN, USA, 1999. [Google Scholar]
  46. Yang, B.; Jiao, Y.; Lei, S. A study on the effects of microparameters on macroproperties for specimens created by bonded particles. Eng. Comput. 2006, 23, 607–631. [Google Scholar] [CrossRef]
Figure 1. (a) Solid model generated in PFC. (b) Hollow cylinder model generated in PFC.
Geosciences 12 00373 g001
Figure 2. Comparison of the triaxial test results from the laboratory experiments and DEM simulations.
Geosciences 12 00373 g002
Figure 3. (a) Cylinder sample side view, (b) TWHC sample side view, (c) cylinder sample top view, (d) TWHC sample top view.
Geosciences 12 00373 g003
Figure 4. (a) Compactor, (b) samples in the moulds, (c) unmoulded samples.
Geosciences 12 00373 g004
Figure 5. Stress versus axial strain behaviour for specimens subjected to UCS testing.
Geosciences 12 00373 g005
Figure 6. Deviatoric stress versus axial strain behaviour of solid specimens subjected to triaxial testing, (a) 10% cement content, (b) 12% cement content, (c) 14% cement content.
Geosciences 12 00373 g006aGeosciences 12 00373 g006b
Figure 7. Deviatoric stress versus axial strain for TWHC specimens: (a) 10% cement content, (b) 12% cement content, (c) 14% cement content.
Geosciences 12 00373 g007aGeosciences 12 00373 g007b
Figure 8. The effects of stiffness ratio on deviatoric stress.
Geosciences 12 00373 g008
Figure 9. The effect of friction angle on deviatoric stress q.
Geosciences 12 00373 g009
Figure 10. The effect of friction coefficient values on deviatoric stress q.
Geosciences 12 00373 g010
Figure 11. The effect of effective modulus values on deviatoric stress q.
Geosciences 12 00373 g011
Table 1. Mechanical properties of the synthetic specimens.
Cement Content (%)Uniaxial Compressive Strength (MPa)Poisson’s Ratio (ν)Bulk Density
ρ ( kg m 3 )
104.960.2431792
127.340.2371859
149.900.2311913
Publisher’s Note: MDPI stays neutral with regard to jurisdictional claims in published maps and institutional affiliations.

