Article

Influence of a Thin Horizontal Weak Layer on the Mechanical Behaviour of Shallow Foundations Resting on Sand

Department of Engineering, University of Palermo, 90128 Palermo, Italy
*
Author to whom correspondence should be addressed.
Geosciences 2021, 11(9), 392; https://doi.org/10.3390/geosciences11090392
Submission received: 24 July 2021 / Revised: 3 September 2021 / Accepted: 14 September 2021 / Published: 16 September 2021
(This article belongs to the Special Issue Numerical Modeling in Geotechnical Engineering)

Abstract

:
The presence of minor details of the ground, including soil or rock masses, occurs more frequently than what is normally believed. Thin weak layers, shear bands, and slickensided surfaces can substantially affect the behaviour of foundations, as well as that of other geostructures. In fact, they can affect the failure mechanisms, the ultimate bearing capacity of footings, and the safety factor of the geotechnical system. In this research, numerically conducted through Finite Element Code Plaxis 2D, the influence of a horizontal thin weak layer on the mechanical behaviour of shallow footings was evaluated. The obtained results prove that the weak layer strongly influences both the failure mechanism and the ultimate bearing capacity if its depth is lower than two to four times the footing width. In fact, under these circumstances, the failure mechanisms are always mixtilinear in shape because the shear strains largely develop on the weak layer. However, the reduction in the ultimate bearing capacity is a function of the difference between the shear strength of the foundation soil and the layer. The presence of a thin weak layer decreases the ultimate bearing capacity up to 90%. In conclusion, this research suggests that particular attention must be paid during detailed ground investigations to find thin weak layers. Based on the obtained results, it is convenient to increase the soil volume investigation to a depth equal to four times the width of the foundation.

1. Introduction

Foundation soils are frequently characterized by secondary or “minor” constitution details, such as interfaces, shear bands, and thin lenses of materials. These “minor details” can have different constitutive features (e.g., mineralogical and grain size composition, index properties) and hydro-mechanical characteristics (stiffness, shear strength, hydraulic conductivity) from those of the adjoining materials. In natural soils, weak layers can be of sedimentological origin (i.e., produced by layering processes). In this case, they are considered to be inherited weak layers. However, they are considered to be induced weak layers if they have geochemical (produced by leaching in the flow of water rich in mineral salts) or geotechnical origins (e.g., in strain-softening sediments where progressive failure can be achieved or in thin strata with increased pore water pressure and hydraulic conductivity). Due to their limited thickness, these minor constitution details are frequently undetected from direct (i.e., observation trenches and boreholes) and indirect (e.g., seismic and electrical surveys) geotechnical investigations. However, their influence on the pore pressure regimes and the consolidation processes can be noticeable, as observed in some cases documented in the literature [1,2]. In addition, there are many real case studies in which the presence of a weak layer affected the failure mechanism of slopes [3,4,5,6,7,8,9,10,11] dams, tunnels, and other excavations [12,13,14,15,16]. Moreover, they can have a strong impact on the mechanical response of both shallow and deep foundations [17,18,19,20,21,22,23]. In this regard, it is worth mentioning that tests performed, both under single gravity (1 g) [24] and in geotechnical centrifuges up to 40 g [25], on small-scale physical models of a strip footing resting on a dense sand bed including a thin weak layer showed that the latter can strongly influence both the failure mechanisms and the ultimate bearing capacity. In particular, these laboratory tests, conducted with foundations having a width equal to 3 ÷ 6 cm and resting on a limited number of foundation soils types (silica sand bed including a thin layer of talc powder or humidified bentonite) showed that the detrimental effect on the ultimate bearing capacity was significant when the depth of the weak layer was not deep, i.e., lower than three to four times the footing width depending on the relative shear strength and stiffness of the base soil and the weak layer.
In this paper, the results of comprehensive numerical research are presented in order to highlight the influence of a horizontal thin weak layer on the mechanical behaviour of shallow footings resting on sands. The study of the problem by means of a numerical perspective based on Finite Element (FE) modelling will make it possible to approach the problem from a more general point of view and to analyse many cases by varying the soil parameters in a wide range of realistic values.

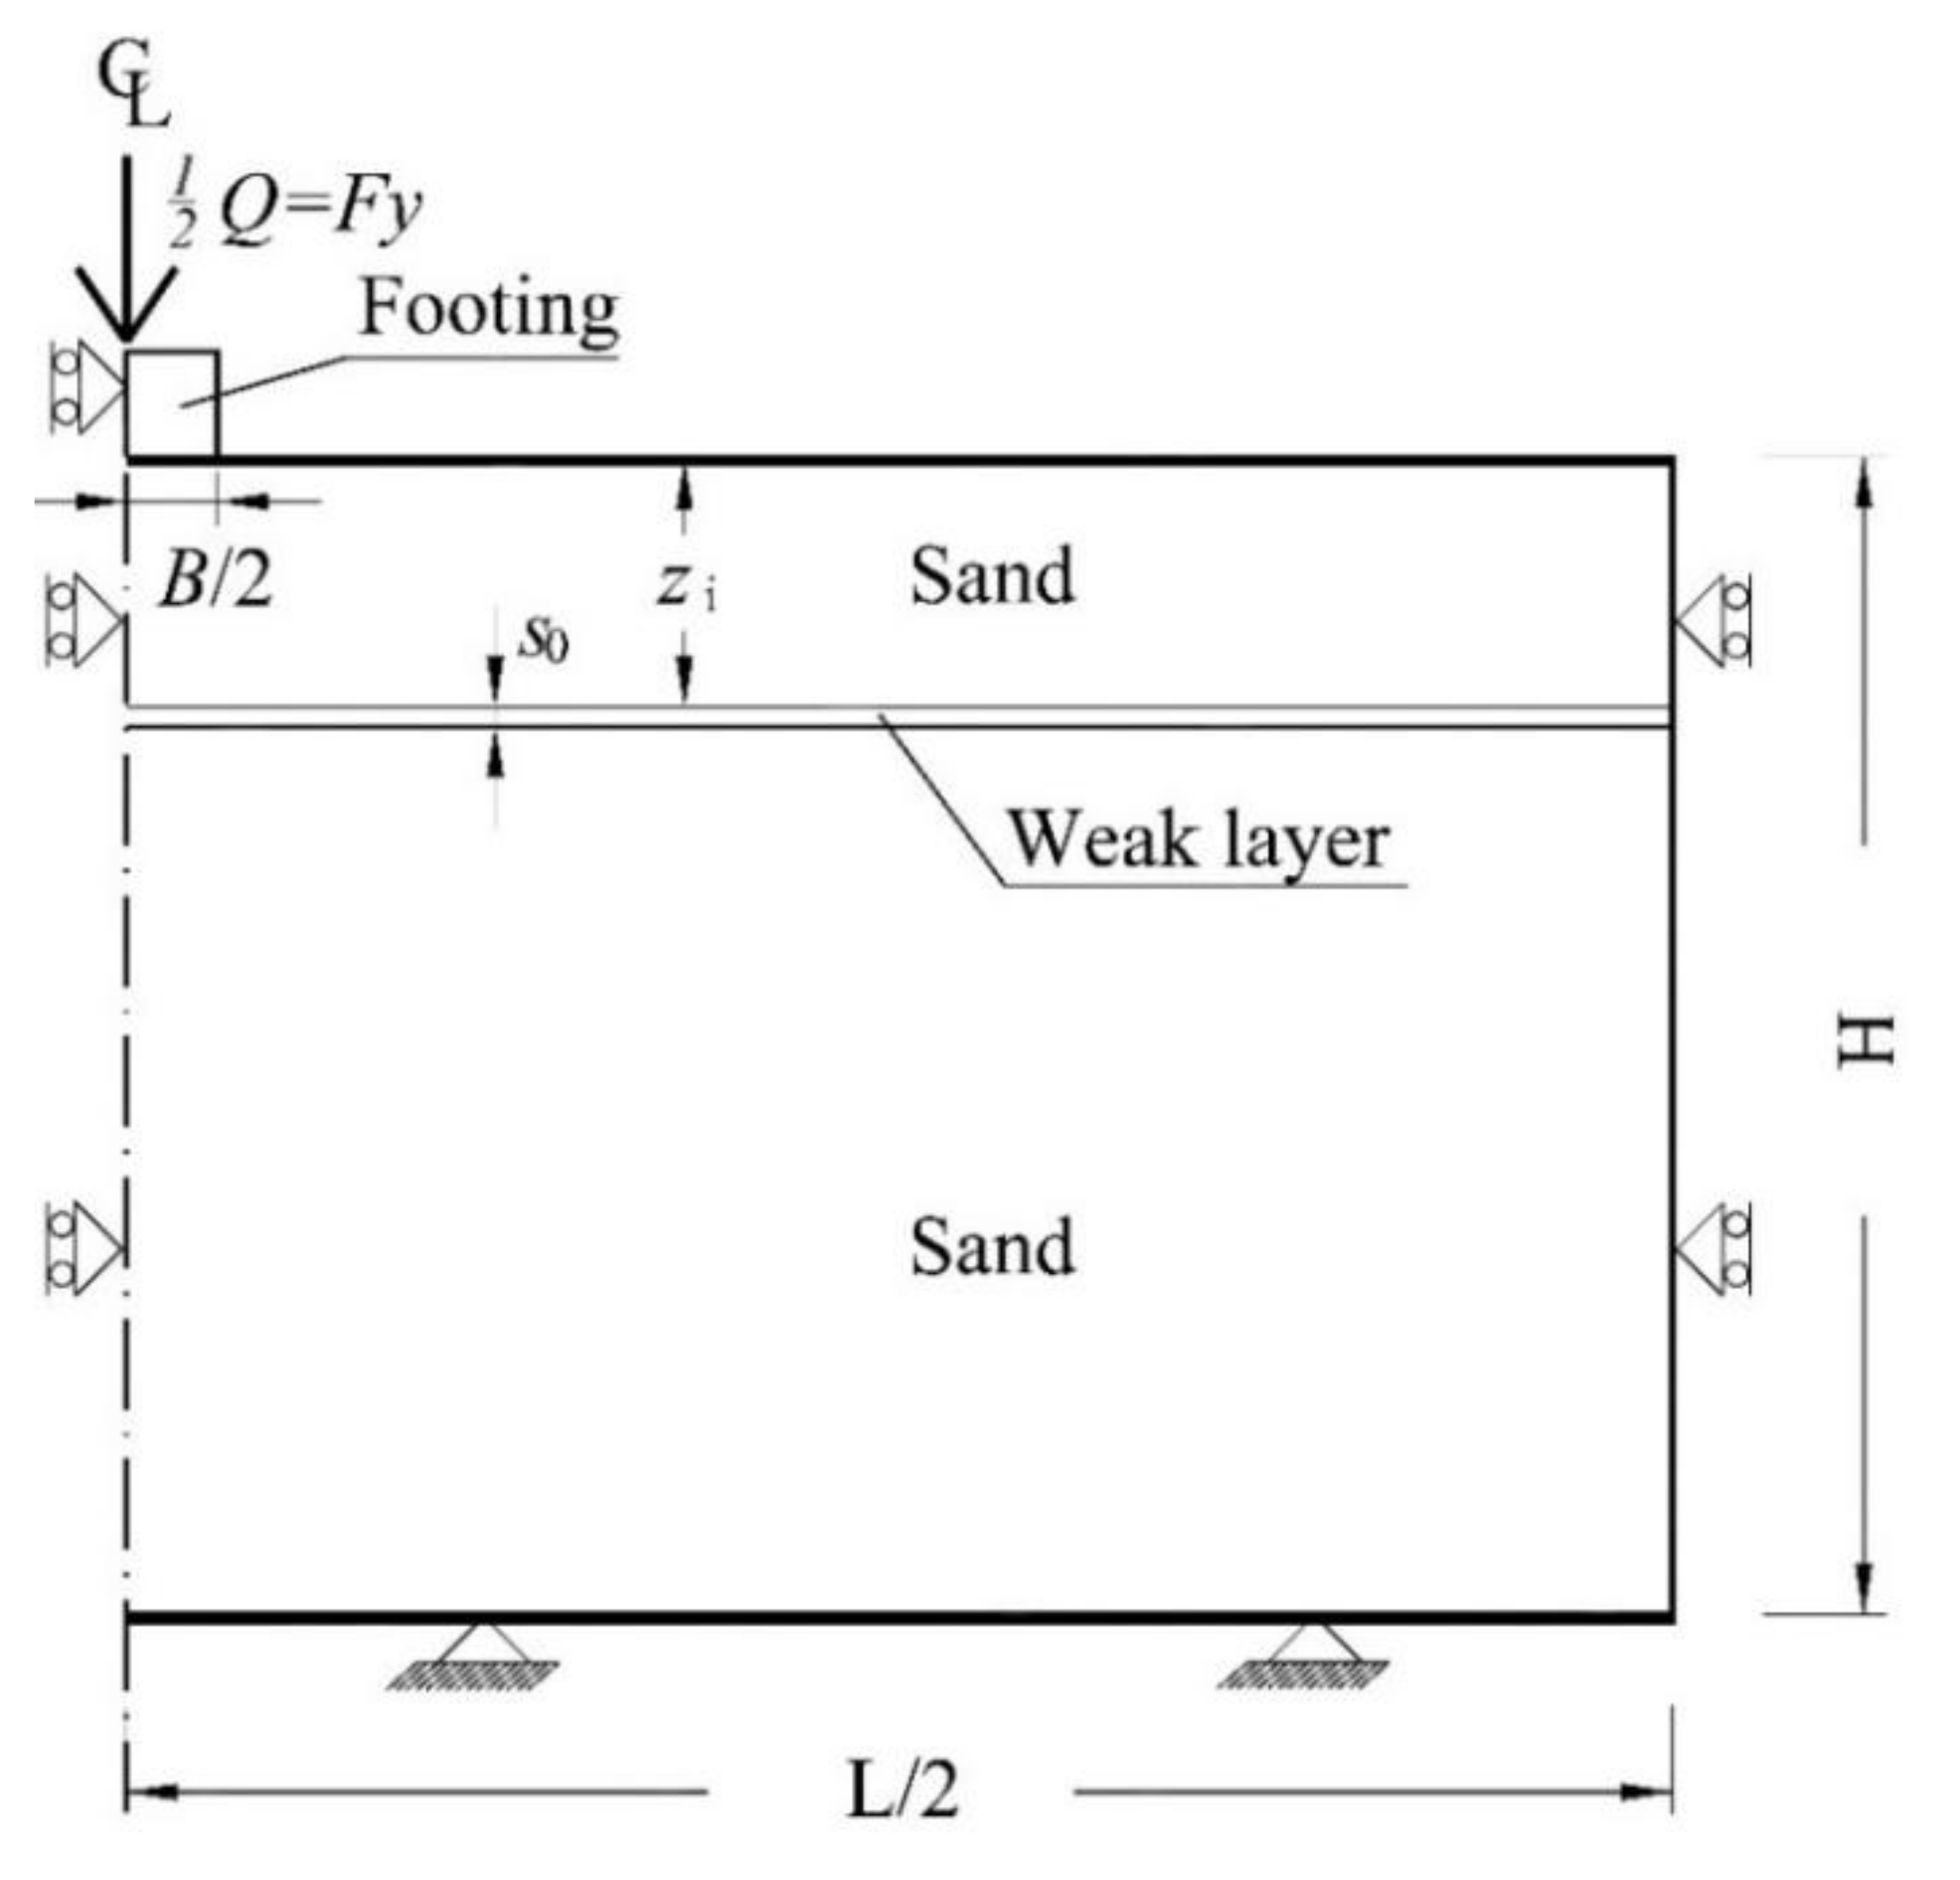
2. The Problem Considered: Scheme and Method of Calculation

The paper analyses the case of the mechanical behaviour of a shallow strip foundation resting on a sand bank, including a horizontal thin weak layer. The scheme of the studied problem is depicted in Figure 1, where a horizontal weak layer with thickness s0 and depth equal to zi is also presented.
The footing has a width B and is characterized by an infinite stiffness. The applied load Q is vertical and centred. The soils (sand and weak layer) are dry, homogeneous, and isotropic. Pore water pressure is considered nil. Preliminary calculations were conducted to choose the best dimensions of the model, as well as the boundary conditions, for the numerical solving of the problem.
The calculations were performed by means of the software Plaxis (Version 8.6. 2008), a 2D FEM code [26]. The geometrical characteristics of the model are reported in Table 1, while the mechanical properties of modelled soils are listed in Table 2.
The cohesion intercept is always considered negligible; however, as recommended by the calculation code, a value of 0.1 kPa for both the sand and the weak layer has been used. In order to cover all the possible origins of the weak layer (sedimentological, geochemical or geotechnical origin) a rather wide range of the shear strength angle was considered for the weak layer (Table 2). In this way, the influences of the variation of the physical properties [27,28]) and the geotechnical conditions [29,30,31] on the shear strength of the soil involved in the weak layer have been implicitly taken into account.
A plane strain state and drained conditions are assumed. Preliminary analyses were conducted to define an optimum mesh, which allowed us to obtain reliable results with an appropriate computational effort. To avoid mesh-related dissymmetry, only half of the model was analysed. Therefore, the reference scheme for FE analysis along with the boundary conditions is shown in Figure 2.
The vertical load Q corresponds to an average bearing pressure q on the soil-footing interface. In fact, a uniform vertical settlement of the footing base was imposed by using the prescribed displacement procedure [26].
A mesh of 15 node triangular elements was used to model the numerical domain. However, these preliminary calculations showed that the results were not significantly influenced by the discretization of the domain of the model. Preliminary studies performed on the thickness s0 of the weak layer (s0 = 0.1 ÷ 0.6 m) highlighted that it did not significantly affect the numerical results. The adopted mesh for the case having B = 1 m and zi/B = 0.5 is reported in Figure 3.
For all soils (sand and weak layer), the simple elastic–perfectly plastic Mohr–Coulomb constitutive model with non-associated flow rule was adopted. Ziccarelli et al. [25] highlighted that the dilatant behaviour should be taken into account to model the behaviour of shallow foundations on very dense sand. Then, for the completeness of the study, the calculations were also conducted for the dilation angle of the sand equal to the shear strength angle (i.e., associated flow rule). Simplification of the numerical simulation does not make the study lose generality. In fact, as demonstrated by Hettler and Gudheus [32], a reduced value of the shear strength angle can be used in an associated flow rule that corresponds to a case of non-associated flow rule with a dilation angle different from the shear strength angle. To define the initial stress state, the K0 procedure [26] was adopted by assuming the coefficient of lateral pressure at rest K0 = 1 − sen φ′.

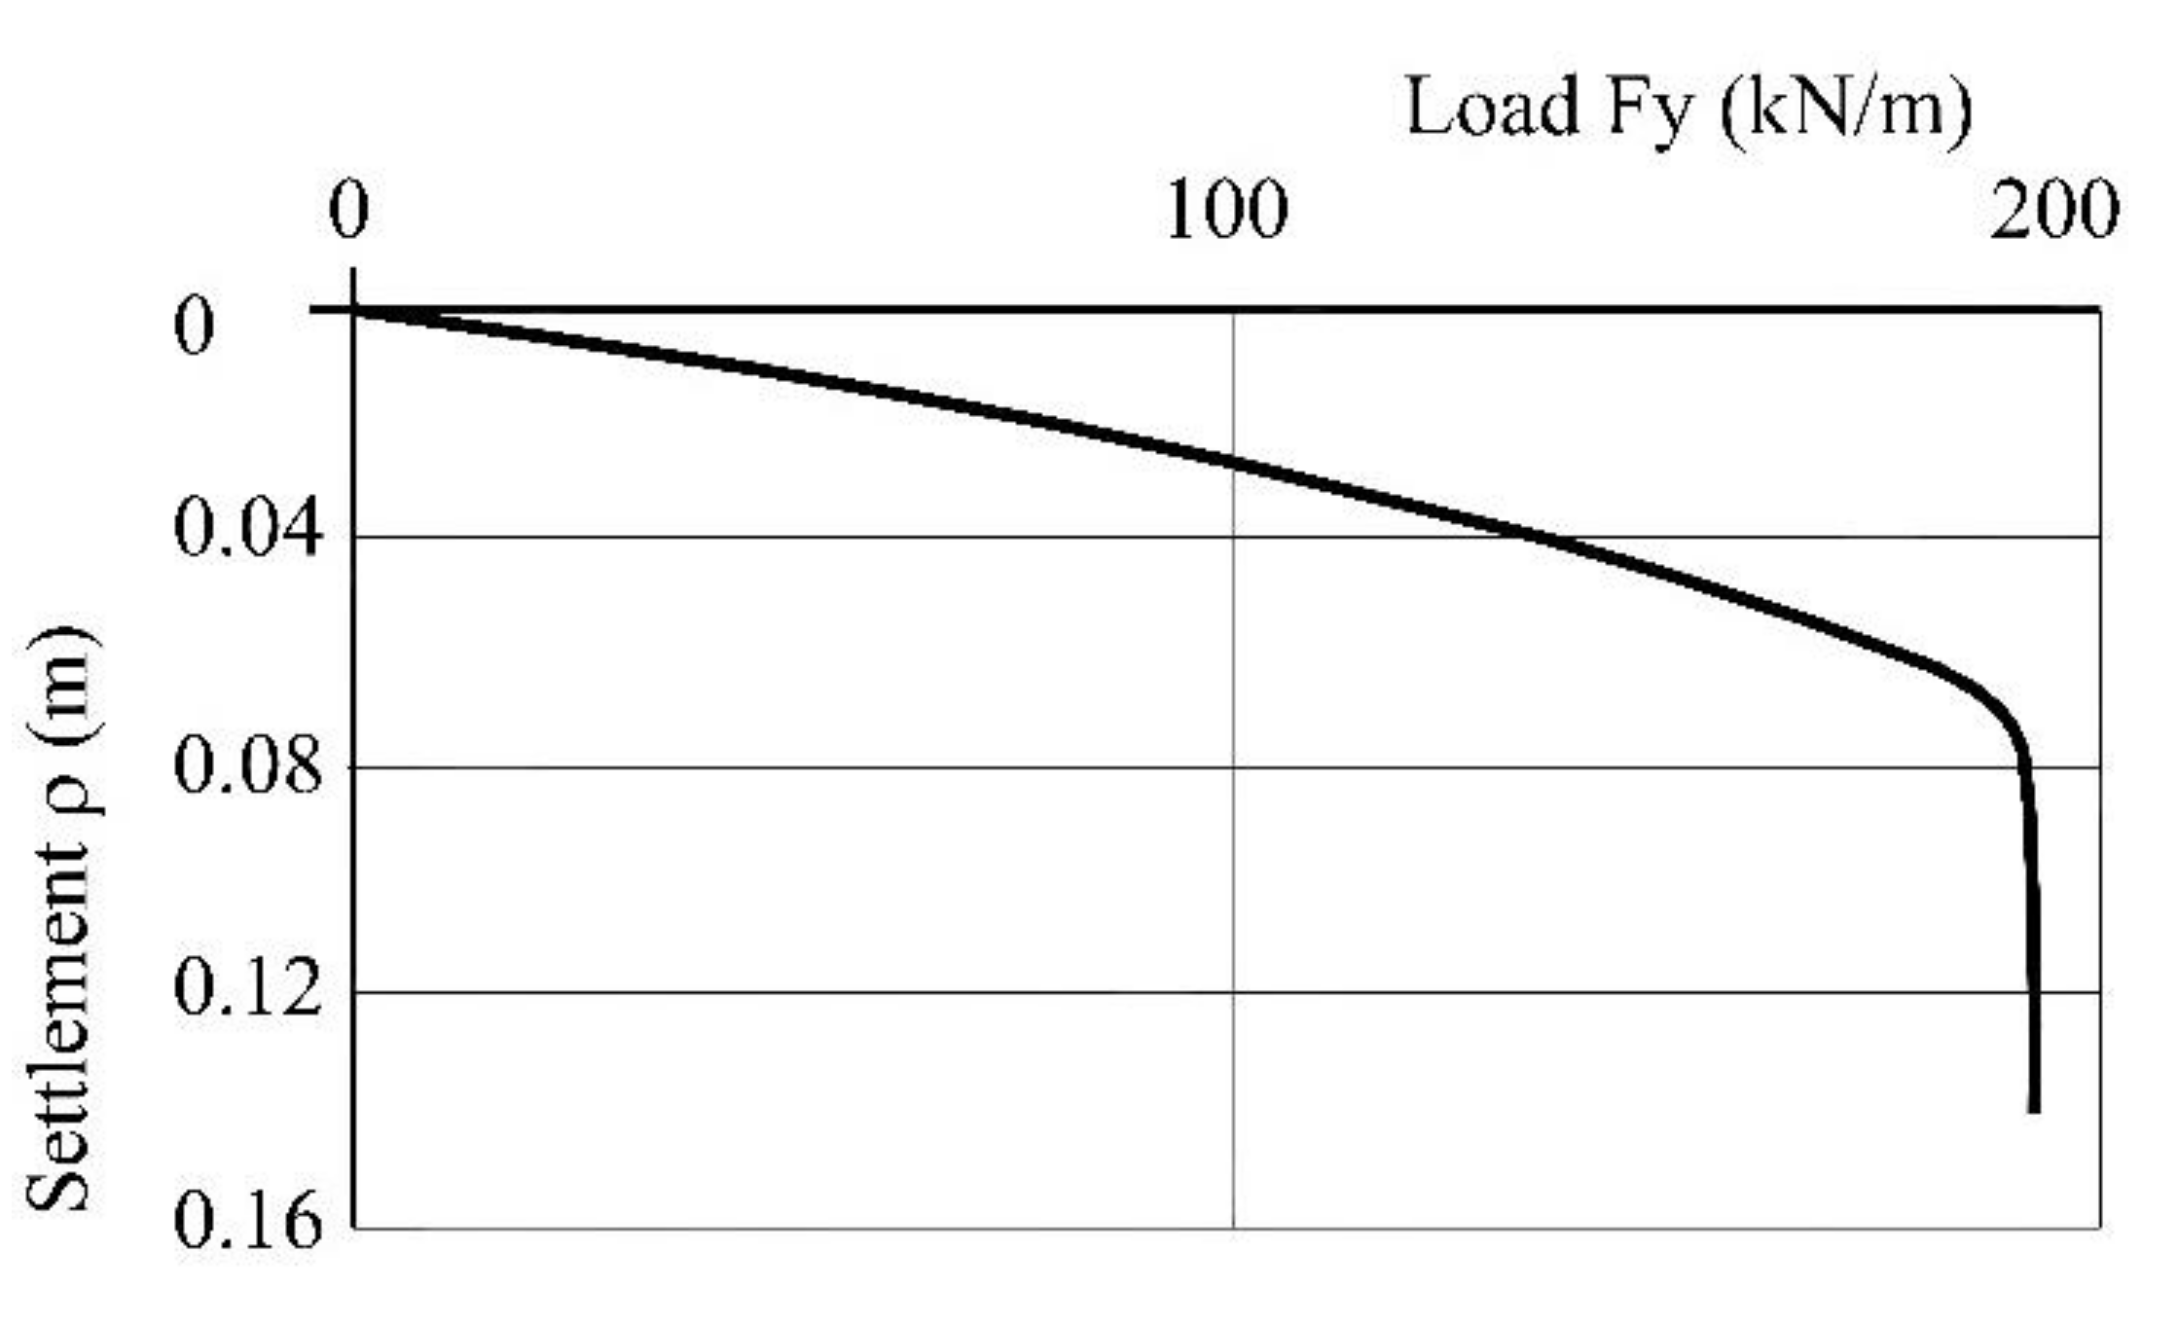
3. Results and Discussion

This section presents the results of the numerical analyses performed to investigate the effect of the weak layer on the mechanical response of the shallow foundations, paying attention to the failure mechanisms (Section 3.1), and on the influence on the ultimate bearing capacity (Section 3.2).
Preliminary calculations were performed to study the influence of the domain dimensions, of the influence of the mesh employed and of the thickness of the weak layer. Validation of the numerical results was done with reference to the case of homogeneous foundation soil constituted of sand. For this aim, a series of calculations were performed to determine the bearing capacity of the foundation, and the coefficient Nγ was back-calculated. These calculated values were compared with the theoretical definitions of this parameter from the literature. In order to clarify the adopted validation procedure, the numerical load-settlement curve, obtained by means of the prescribed displacement procedure, for the case of soil foundation made of sand with φ′ = 35° and ψ′ = φ′, is presented in Figure 4. The calculated curve proved that the FE simulation well reproduced the problem of the ultimate bearing capacity for the shallow foundations. In fact, Figure 4 shows that, for this case, the limit load value Fy was reached for a settlement ρ of about 7 cm. Subsequently, the value of the load remained constant because the geotechnical system reached the plasticity conditions. The corresponding value of Nγ was calculated as Nγ = 4 Fy/(γ B2) = 4 × 195/(16 × 12) = 48.75. Fy is the result of the effective vertical stresses (force per unit length) provided directly by the numerical code, while the ultimate bearing capacity qlim is equal to qlim = 2 Fy/B.
Figure 5 presents the incremental shear strains at failure always for the case of B = 1 m, φ′ = 35°, and ψ′ = φ′. The extension of the failure mechanism is about 2.7 B, while the maximum depth is about 1.2 B. The failure mechanism is very similar to that of Prandtl (Prandtl, 1920 [33]).
In Figure 6, the relationship between Nγ and φ′, as obtained from the numerical results, is reported. For comparison, in the figure, some theoretical relationships [34,35,36,37,38,39,40] are also plotted. The numerical results are in excellent agreement with the theoretical ones. In fact, they are very similar to the ones obtained with the expression of Meyerhof [35] and Kumar & Kouzer [40]. Furthermore, for the classical values of the foundation width B (1 and 2 m), no significant differences were found.

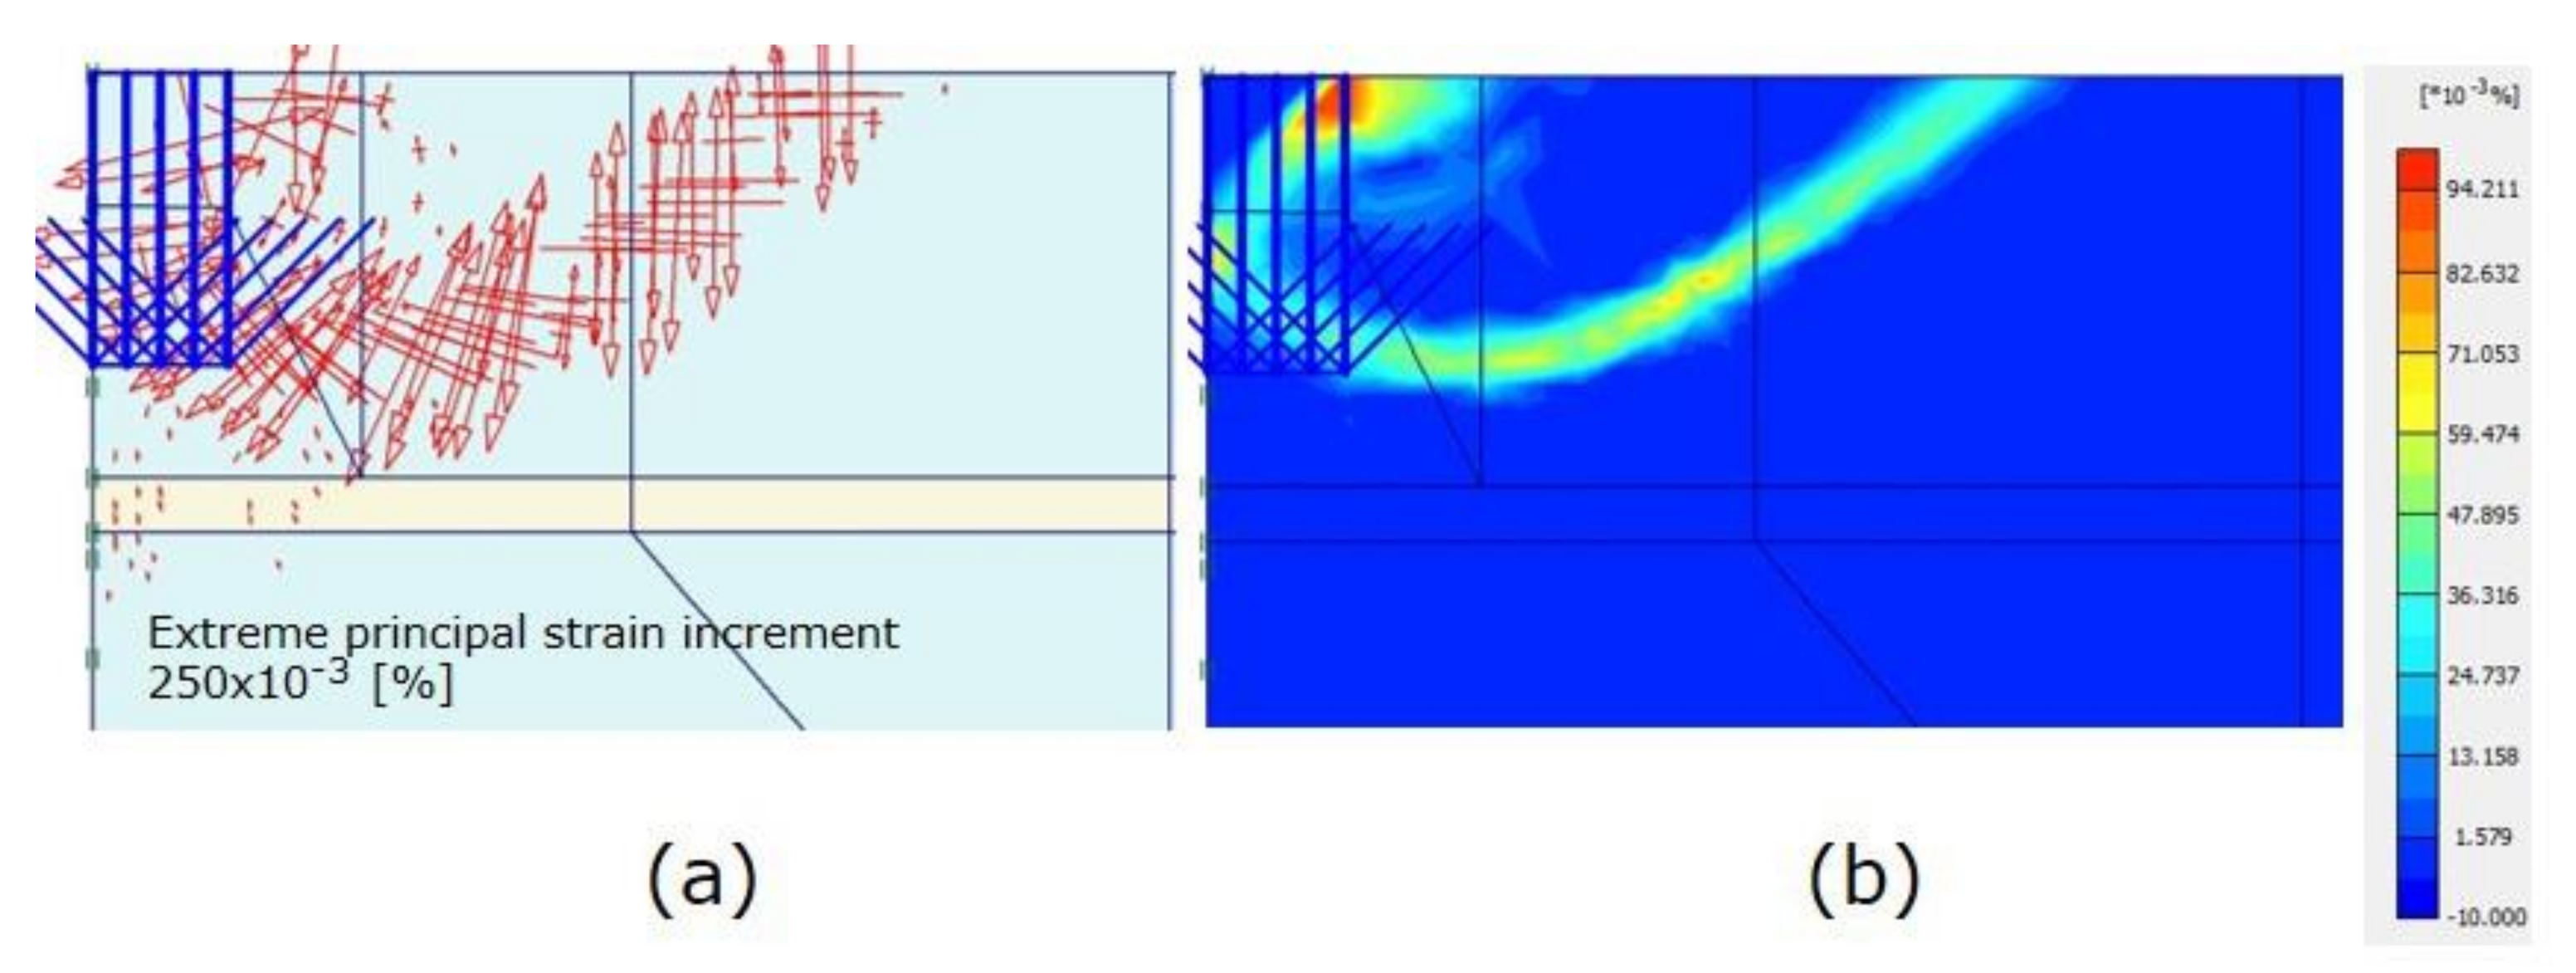
3.1. Effect of the Weak Layer on the Failure Mechanism

In this section, the different failure mechanisms obtained by means of FE simulations are compared. For this aim, Figure 7 shows the incremental shear strains for the case of zi/B = 1.5. In this simulation, the mechanical parameters adopted for the sand were φ′1 = 40° and ψ′1 = 15°, while for the weak layer, φ′2 = 10° and ψ′2 = 0 were adopted. In Figure 7a, the principal directions of the incremental shear strain vectors (length of the arrows represents their intensity) are resented, while in Figure 7b, the shadings of the same strain are depicted. These representations identify the failure mechanism, which is mixtilinear in type. The failure mechanism starts from the edge of the foundation and it develops in part along the weak layer. Then, it rises through the upper soil layer and emerges on the ground surface. This peculiar failure mechanism characterizes all the simulations where the difference between φ′1 and φ′2 is significant. Moreover, the presence of the weak layer has a strong influence on the dimension of the failure mechanism. In fact, in the case of the homogeneous foundation soil, its lateral extension is equal to about 2.7 B (Figure 5), while as a consequence of the presence of the weak layer, it increases to about 4.5 B (Figure 7). Indeed, the depth of the failure mechanism is greater than the case of homogeneous foundation soil. Moreover, for the case of homogeneous soil shown in Figure 5 (φ′1 = 35°, ψ′1 = φ′1), the maximum depth of the failure mechanism is equal to 1.2 B, while due to its presence, the extension of the failure mechanism reaches the depth of the weak layer (1.5 B in Figure 7). However, when φ′2 approaches the value of φ′1, the failure mechanism tends to the one of the homogeneous foundation soil. In this regard, Figure 8 shows the results of the FE simulation in terms of shear strain in the case of foundation soil having φ′1 = 40° and ψ′1 = 40°, while the weak layer has φ′2 = 35° and ψ′2 = 35°. The weak layer has a depth of zi/B = 1.5. However, in this case, the value of the ultimate bearing capacity qlim is affected by the weak layer and its value is about 80% of the ultimate bearing capacity calculated for the homogeneous case.
Figure 9 shows the comparison between the principal strain increment vectors (represented both in terms of modulus and direction) obtained by modelling the problem considering the case of homogeneous foundation soil (φ′1 = 40° and ψ′1 = 2/3φ′1 = 26.7°) (a), the presence of the weak layer (φ′2 = 15°and ψ′2 = 0) located at zi/B = 0.5 (b), at zi/B = 1 (c), at zi/B = 1.5 (d), at zi/B = 2 (e), at zi/B = 3 (f). This representation is effective in representing the influence of the depth of the weak layer on the failure mechanism.
In fact, when the weak layer is quite superficial (zi/B = 0.5 and 1, Figure 9b,c), the soil volume associated with the shear strain is deeply constrained by the weak layer if compared with the homogeneous case (Figure 9a). However, for zi/B = 1.5 and zi/B = 2 (Figure 9d,e), the soil volume associated with the deformation mechanism at failure increases significantly to always involve the weak layer. When the weak layer is located at great depths (zi/B = 3 in Figure 9f), the induced deformation mechanism at failure approaches the homogeneous one again (Figure 9a). Considering the modulus and the distribution of the principal strain increment vectors represented in Figure 9, it is possible to depict the shape of the failure mechanism in the different cases, as reported in Figure 10. In the case of homogeneous soil (Figure 10a), the failure surface is quite similar to the failure mechanism reported by Prandtl [33]). In fact, the log spiral and the active and passive triangular wedges are well recognized. However, when the weak layer is located at depth zi/B = 0.5 (Figure 10b), at zi/B = 1 (Figure 10c), at zi/B = 1.5 (Figure 10d), and at zi/B = 2 (Figure 10e), Prandtl’s classical shape is unrecognisable because the weak layer controls the failure mechanism. In these cases, a straight section characterizes the failure mechanism due to the concentration of shear strain within the layer. This can have two different outcomes. If the layer is superficial, the failure mechanism reduces its extension; if the weak layer is deeper, the volume of soil associated with the failure mechanism increases. Only in the case where the layer is present at the maximum depth does the failure mechanism decrease again, even if it is still a little more extensive than the homogeneous soil mechanism. Considering that the difference between φ′1 and φ′2 is significant, the failure mechanism (see Figure 7) appears to be very similar to the one observed in the physical model tested at 1 g [24] and in the centrifuge apparatus at 40 g [25].

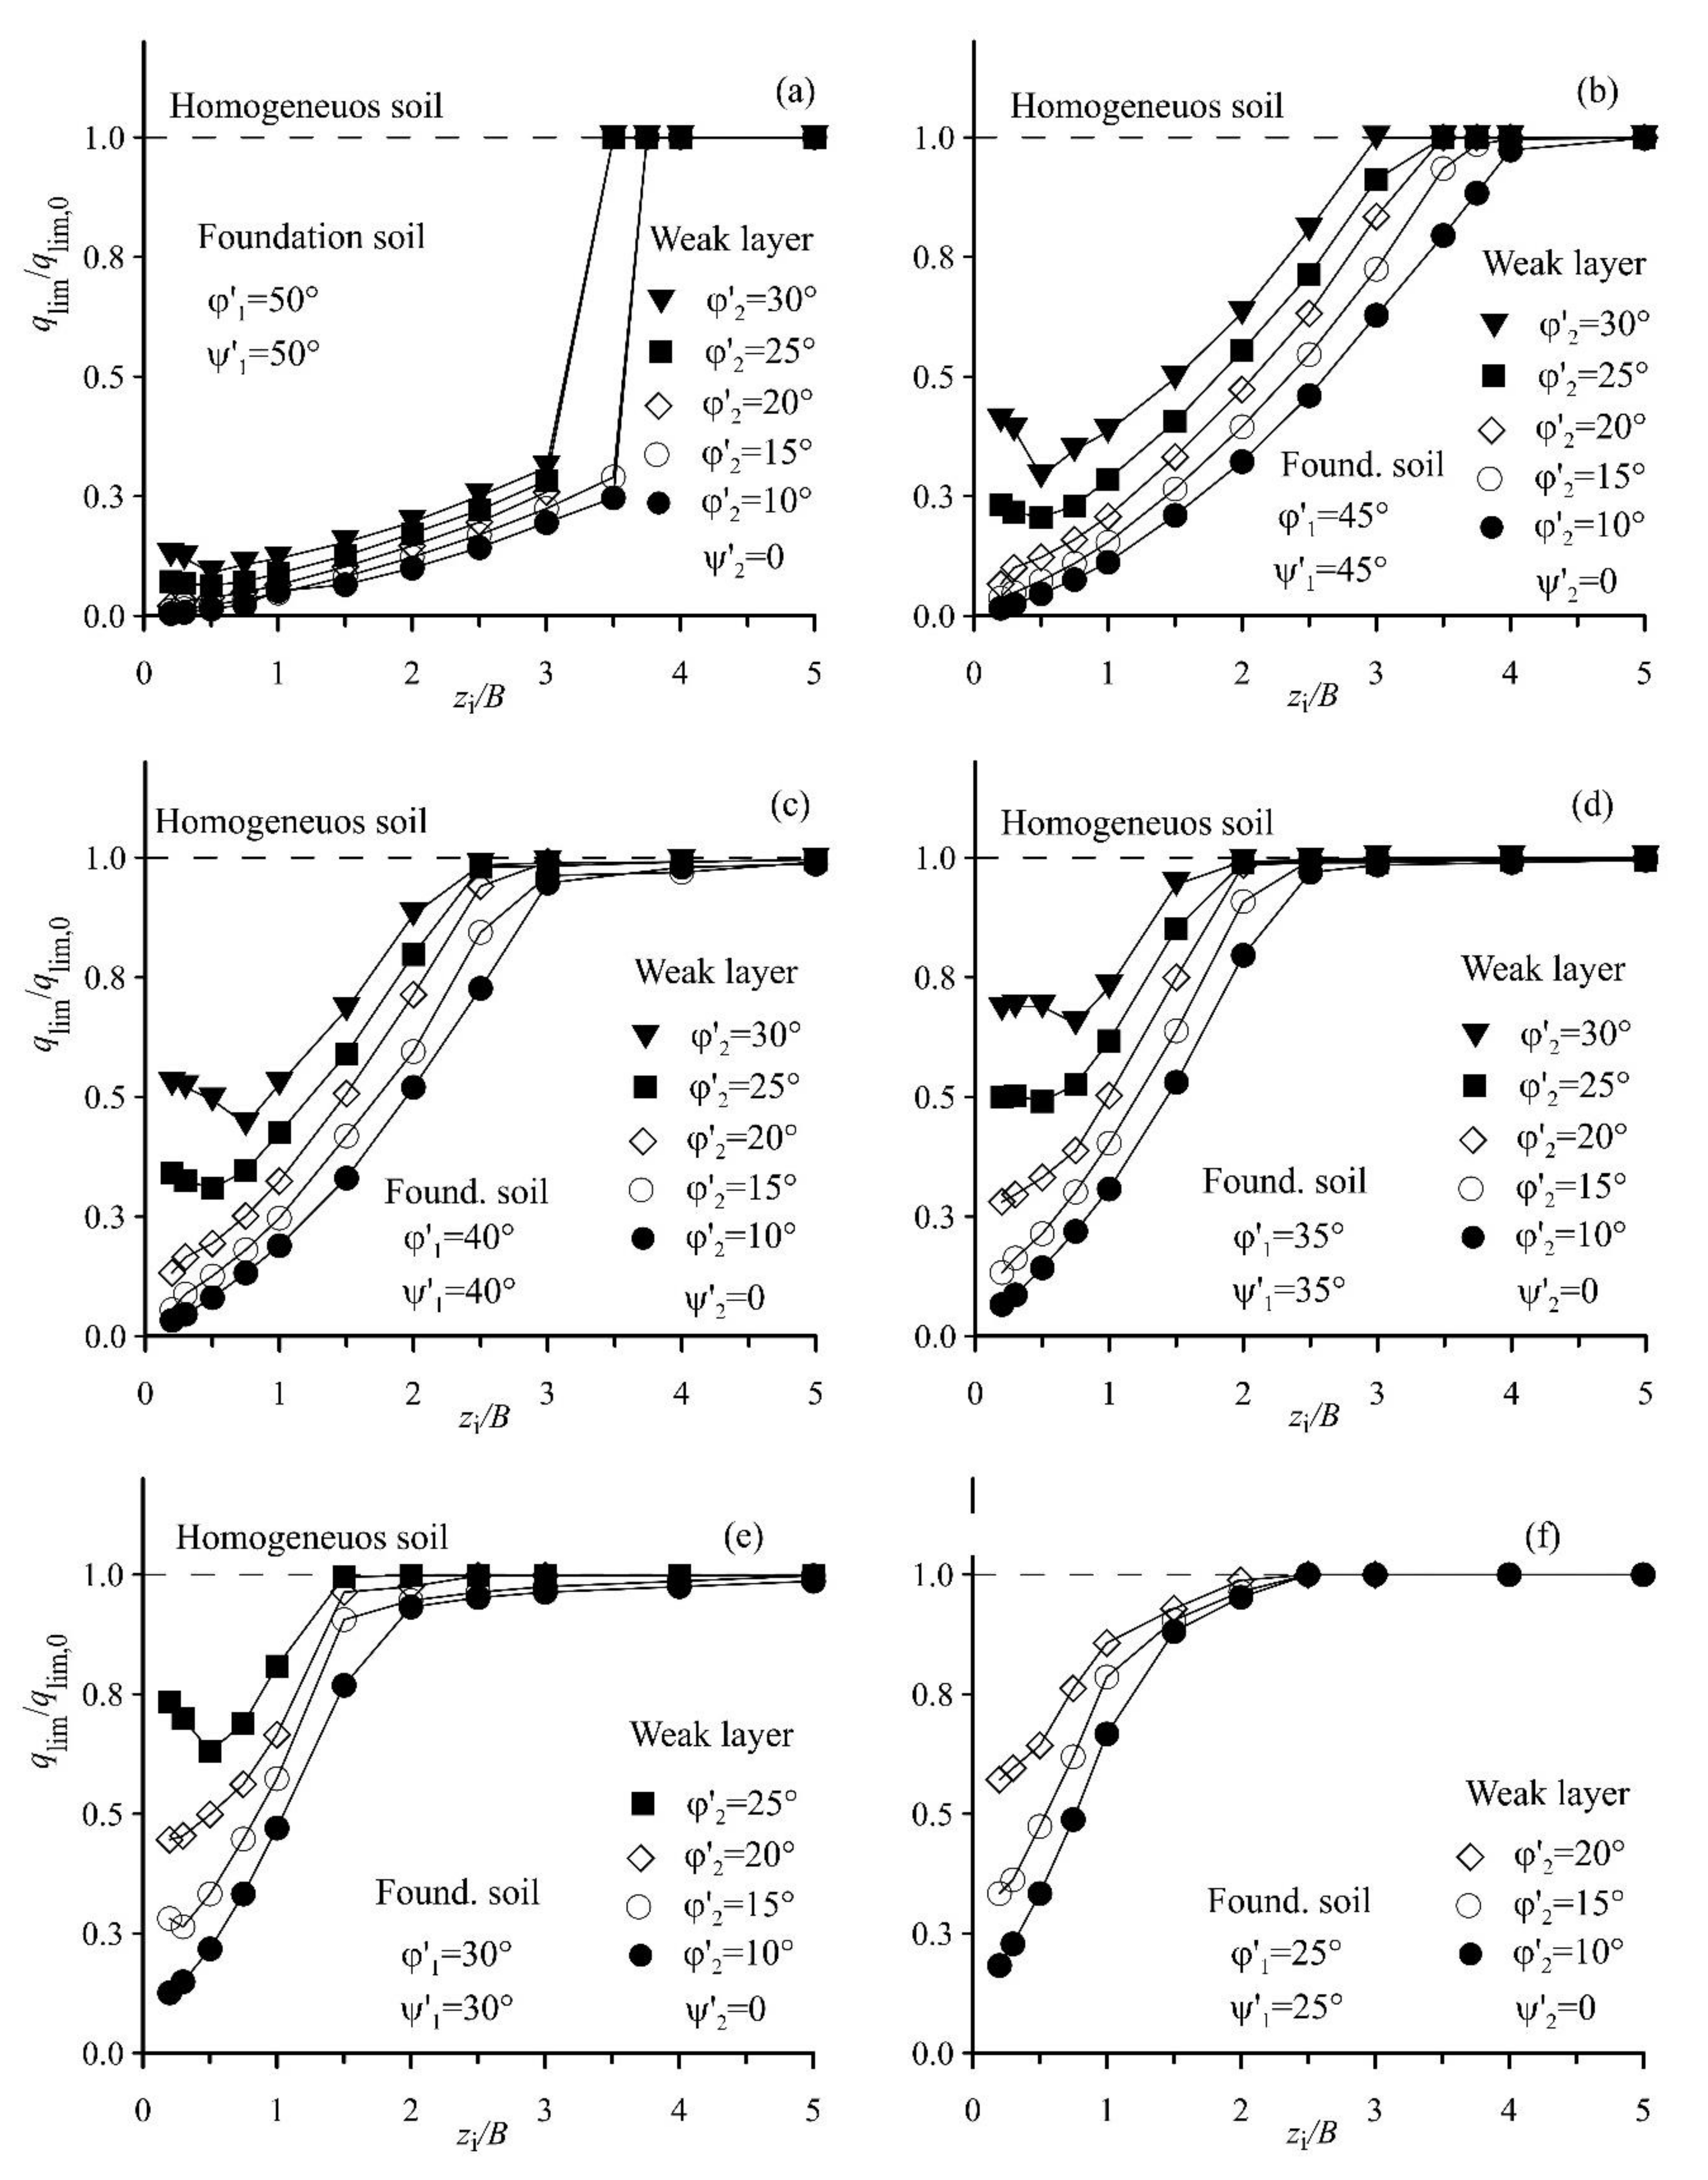
3.2. Effect of the Weak Layer on the Ultimate Bearing Capacity

The values of the ultimate bearing capacity qlim were determined for all the cases simulated by means of the load-settlement curve obtained with the prescribed displacement procedure [26].
In order to assess the influence of the weak layer on the bearing capacity of the shallow foundation, the ultimate bearing capacity qlim was normalized with respect to the ultimate bearing capacity relative to the homogeneous foundation soil qlim,0. Then, the ratio qlim/qlim,0 was plotted in Figure 11 as a function of the ratio between the depth of the weak layer zi and the width of the foundation B. The results presented consider a range of the shear strength angle of the foundation soil (sand) between 25 and 50°, while the shear strength angle of the weak layer ranges between 10 and 30°. When the shear strength angle of the foundation soil is fixed to 25° and 30°, the maximum value of the shear strength angle of the weak layer is 20° and 25°, respectively.
Calculations were performed considering both the values of dilation angle ψ′1 and ψ′2 of the foundation soil and the weak layer ranging from zero to the value of the angle of shear strength φ′1 and φ′2, respectively. However, Figure 11 reports only results relative to φ′1 = ψ′1 and ψ′2 = 0. Results obtained for φ′1 ≠ ψ′1 and ψ′2 ≠ 0 present similar trends, and hence have been omitted, without the study losing generality.
The results obtained always show that if the weak layer is located at a deep depth, the ultimate bearing capacity is independent of the shear strength of the weak layer. In fact, in this condition, the failure mechanism is unaffected by the presence of the weak layer, being more superficial, and the ultimate bearing capacity is practically the same as the corresponding one in the homogeneous foundation soil. In all cases examined, the shallower the weak layer, the lower the ultimate bearing capacity. However, the depth at which the layer starts to affect both the failure mechanism and the ultimate bearing capacity is dependent on the shear strength of the weak layer compared to the foundation soil. Obviously, when the ratio qlim/qlim,0 starts to decrease from the unit value, for a constant value of zi/B, the bearing capacity decreases with the difference between the shear strength angles.
Figure 11 show that the tendency of the ratio qlim/qlim,0 is not always monotonic in type. In fact, for the cases in which the weak layer is characterized by a shear strength angle φ′2 ≥ 25°, the ratio qlim/qlim,0 reaches a minimum value at about zi/B = 0.5, and then it starts to increase. The particular behaviour observed in these cases is the consequence of the quite high shear strength of the weak layer (φ′2 ≥ 25°), which allows the failure mechanism to cross the weak layer, as depicted for the example showed in Figure 12 where φ′1 = 40° and the weak layer has φ′2 = 35. In these cases, the weak layer is able to transfer part of the shear stresses to the soil located beneath the weak layer, involving a greater volume of foundation soils, and consequently, the value of the ultimate bearing capacity increases again. In any case, the lowest values of the ratio qlim/qlim,0 were obtained when the foundation soil was considered having a φ′1 = 50° and the weak layer had φ′2 =10 ÷ 30° (Figure 11a), that is, when the difference between the shear strength of the foundation soil and the weak layer was at a maximum.
In Figure 13, the results of the numerical analyses in terms of the ratio qlim/qlim,0 are plotted as a function of φ′1 (25° ≤ φ′1 ≤ 50°). In the diagrams, the shear strength angle of the weak layer φ′2 varies between 10 and 35° while the values of the ratio zi/B are 0.5, 1, 2, 3, 3.5, and 4. These diagrams show that, for a constant value of zi/B, the higher the difference between φ′1 and φ′2, the lower the ratio qlim/qlim,0. The reduction of qlim/qlim,0 increased with the decrease in zi/B. Moreover, for the lowest values of zi/B, the reduction of qlim/qlim,0 was always significant. For φ′1 ≤ 40°, the influence of the weak layer was negligible when the latter was located at a depth of zi/B = 3 (Figure 13d). As shown in Figure 13d,f, for the highest values of the shear strength angle of the foundation soil (φ′1 = 45 ÷ 50°), the influence of the weak layer was still significant for values of zi/B equal to 3.5 and 4 and when φ′2 was very low (φ′2 = 10 ÷ 15°).
Hence, for the reasonable values of the shear strength angle of the sands (30° ≤ φ′1 ≤ 40°), the influence of the weak layer on the bearing capacity was significant for zi/B ≤ 3. Taking into account the typical values for very dense sands (φ′1 > 40°), the weak layer affected the bearing capacity of the foundation for zi/B ≥ 3 especially if the shear strength angle of the layer was very low (10° ≤ φ′2 ≤ 15°).

4. Conclusions

The paper presented the results of a numerical study aimed to assess the influence of the presence of a thin horizontal weak layer on the mechanical behaviour of shallow foundations resting on sands. For this aim, a comprehensive numerical programme was conducted by means of Finite-Element code Plaxis 2D [26]. The main results can be summarised as follows.
The weak layer strongly affects both the failure mechanism and the ultimate bearing capacity qlim if its depth from the ground does not exceed a critical value of about 2 ÷ 4 times the footing width B.
The failure mechanism cuts through the weak layer when it is located at small depths beneath the footing. This depth depends on the difference between the mechanical properties of the soil foundation (φ′1) and weak layer (φ′2). The weak layer forces the failure mechanism to run partly along the horizontal weak layer before rising through the upper soil layer and emerging on the ground surface. Therefore, the failure mechanism is always mixtilinear in shape until the depth of the layer is such that the failure mechanism returns to be similar to that of Prandtl’s and no longer reaches the weak layer (i.e., for depth zi greater than 4B for φ′1 = 50°). For zi < 2 ÷ 4B, regardless of the value of φ′1, the ultimate bearing capacity qlim is always lower than qlim,0, which is the value related to the homogeneous foundation soil. At a given depth of the weak layer zi, and for a given value of φ′1, the decrease in qlim is greatest at the lowest shear strength angle (φ′2) of the weak layer. The numerical simulations show that the reduction of the bearing capacity can reach 90% when the shear strength angle of the weak layer is very low and that of the foundation soil is very high. Therefore, the simulations highlight that the shape of the failure mechanism controls the reduction in the bearing capacity of the shallow foundation induced by the weak layer.
The results obtained in this research prove the importance of detailed ground investigations and surveys. In fact, the simulations show that a footing with high safety factors can become unstable if a weak layer, also of small thickness, is involved in the deformation mechanism. Therefore, a careful geotechnical investigation aimed to find the weak layers should be conducted when preliminary knowledge may suggest their possible presence in the ground.
The numerical results show that the soil volume associated with the failure mechanism depends on the width of the foundation as well as on the geotechnical parameters of the weak layer. In this regard, an operative conclusion can be drawn from this numerical study: a preliminary evaluation of the strength of the soil in the layer can be useful to update the soil volume to be explored during the execution of ground geotechnical investigations. In any case, as a precautional measure, the soil volume to be investigated in detail should be increased at least up to a depth equal to 4B, where B is the footing width, compared to the value of 1.5 ÷ 2B, which is frequently used by practitioners.

Author Contributions

All authors contributed equally to the work. All authors have read and agreed to the published version of the manuscript.

Funding

No funding was used for the research.

Institutional Review Board Statement

Not applicable.

Informed Consent Statement

Not applicable.

Data Availability Statement

The data presented in this study are available on request.

Conflicts of Interest

The authors declare no conflict of interest.

References

  1. Terzaghi, K. Effects of minor geologic details on the safety of dams. In Geology and Engineering for Dams and Reservoirs; Technical Publication 215; American Institute of Mining and Metallurgical Engineers: New York, NY, USA, 1929; pp. 31–44. [Google Scholar]
  2. Rowe, P.W. A reassessment of the causes of the Carsington embankment failure. Géotechnique 1991, 41, 395–421. [Google Scholar] [CrossRef]
  3. Lewis, K.B. Slumping on a continental slope inclined at 1°–4°. Sedimentology 1971, 16, 97–110. [Google Scholar] [CrossRef]
  4. Locat, A.; Lee, H.J. Submarine landslides: Advances and challanges. Can. Geotech. J. 2002, 39, 193–212. [Google Scholar] [CrossRef]
  5. L’Heureux, J.S.; Longva, O.; Steiner, A.; Hansen, L.; Vardy, M.E.; Vanneste, M.; Haflidason, H.; Brendryen, J.; Kvalstad, T.J.; Forsberg, C.F.; et al. Identification of weak layers and their role for the stability of slopes at Finneidfjord, Northern Norway. In Submarine Mass Movements and Their Consequences. Advances in Natural and Technological Hazards Research; Yamada, Y., Kawamura, K., Ikehara, K., Ogawa, Y., Urgeles, R., Mosher, D., Chaytor, J., Strasser, M., Eds.; Springer: Dordrecht, The Netherlands, 2012; Volume 31, pp. 321–330. [Google Scholar] [CrossRef]
  6. Locat, J.; Leroueil, S.; Locat, A.; Lee, H. Weak layers: Their definition and classification from a geotechnical perspective. In Submarine Mass Movements and Their Consequences. Advances in Natural and Technological Hazards Research; Krastel, S., Behrmann, J.-H., Völker, D., Stipp, M., Berndt, C., Urgeles, R., Chaytor, J., Huhn, K., Strasser, M., Harbitz, C.B., Eds.; Springer: Dordrecht, The Netherlands, 2014; Volume 37, pp. 3–12. [Google Scholar] [CrossRef]
  7. Locat, A.; Leroueil, S.; Fortin, A.; Demers, D.; Jostad, H.P. The 1994 landslide at Sainte-Monique, Quebec: Geotechnical investigation and application of progressive failure analysis. Can. Geotech. J. 2015, 52, 490–504. [Google Scholar] [CrossRef]
  8. Zhang, W.; Wang DRandolph, M.F.; Puzrin, A.M. Catastrophic failure in planar landslides with a fully softened weak zone. Géotechnique 2015, 65, 755–769. [Google Scholar] [CrossRef] [Green Version]
  9. Zhang, W.; Randolph, M.F.; Alexander MPuzrin, A.M.; Wang, D. Criteria for planar shear band propagation in submarine landslides along weak layers. Landslides 2020, 17, 855–876. [Google Scholar] [CrossRef]
  10. Zhang, W.; Wang, D. Stability analysis of cut slope with shear band propagation along a weak layer. Comput. Geotech. 2020, 125, 103676. [Google Scholar] [CrossRef]
  11. Ziccarelli, M.; Rosone, M. Stability of embankments resting on foundation soils with a weak layer. Numer. Model. Geotech. Eng. Geosci. 2021, 11, 86. [Google Scholar] [CrossRef]
  12. Leonards, G.A. Investigation of failures. J. Geotech. Eng. Div. 1982, 108, 222–283. [Google Scholar]
  13. Silvestri, V. The bearing capacity of dikes and fills founded on soft soils of limited thickness. Can. Geotech. J. 1983, 20, 428–436. [Google Scholar] [CrossRef]
  14. Scott, R.F. Failure. Géotechnique 1987, 37, 423–466. [Google Scholar] [CrossRef] [Green Version]
  15. Skempton, A.W.; Vaughan, P.R. The failure of Carsington dam. Géotechnique 1993, 43, 151–173. [Google Scholar] [CrossRef]
  16. Michalowski, R.L. Limit analysis of weak layers under embankments. Soils Found. 1993, 33, 155–168. [Google Scholar] [CrossRef] [Green Version]
  17. Lee, K.K.; Cassidy, M.J.; Randolph, M.F. Bearing capacity on sand overlying clay soils: Experimental and finite element investigation of potential punch-through failure. Géotechnique 2013, 63, 1271–1284. [Google Scholar] [CrossRef] [Green Version]
  18. Valore, C.; Ziccarelli, M. The stabilization of a slope-viaduct system without closing traffic. In Geotechnical Engineering for Infrastructure and Development, Proceedings of the XVI ECSMGE, Edinburg, UK, 13–17 September 2015; Winter, M.G., Smith, D.M., Eldred, P.J.L., Toll, D.G., Eds.; pp. 367–372.
  19. Eshkevari, S.S.; Abbo, A.J.; Kouretzis, G. Bearing Capacity of Strip Footings on Layered Sands. Comput. Geotech. 2019, 114, 103101. [Google Scholar] [CrossRef]
  20. Hanna, A.; Abou Farah, C.; Abdel-Rahman, M. Shallow foundations resting on strong sand overlaying weak sand. J. Eng. Appl. Sci. 2020, 67, 1399–1414. [Google Scholar]
  21. Haghsheno, H.; Chenari, R.J.; Javankhoshdel, S.; Banirostam, T. Seismic Bearing Capacity of Shallow Strip Footings on Sand Deposits with Weak Inter-layer. Geotech. Geol. Eng. 2020, 38, 6741–6754. [Google Scholar] [CrossRef]
  22. Das, P.P.; Khatri, V.K.; Dutta, R.K. Bearing capacity of ring footing on weak sand layer overlying a dense sand deposit. Geomech. Geoeng. 2021, 16, 249–262. [Google Scholar] [CrossRef]
  23. Pham, Q.N.; Ohtsuka, S. Ultimate Bearing Capacity of Rigid Footing on Two-Layered Soils of Sand–Clay. Int. J. Geomech. 2021, 21, 7. [Google Scholar] [CrossRef]
  24. Valore, C.; Ziccarelli, M.; Muscolino, S.R. The bearing capacity of footings on sand with a weak layer. Geotech. Res. 2017, 4, 12–29. [Google Scholar] [CrossRef] [Green Version]
  25. Ziccarelli, M.; Valore, C.; Muscolino, S.R.; Fioravante, V. Centrifuge tests on strip footings on sand with a weak layer. Geotech. Res. 2017, 4, 47–64. [Google Scholar] [CrossRef] [Green Version]
  26. Plaxis. Plaxis 2D, Version 8.6. 2008. Available online: http://www.plaxis.nl/ (accessed on 14 June 2021).
  27. Lupini, J.F.; Skinner, A.E.; Vaughan, P.R. The drained residual strength of cohesive soils. Géotechnique 1981, 31, 181–213. [Google Scholar] [CrossRef]
  28. Stark, T.D.; Hussain, M. Empirical correlations: Drained shear strength for slope stability analyses. J. Geotech. Geoenviron. Eng. 2013, 139, 853–862. [Google Scholar] [CrossRef] [Green Version]
  29. Ferrari, A.; Rosone, M.; Ziccarelli, M.; Giger, S.B. The shear strength of Opalinus Clay shale in the remoulded state. Geomech. Energy Environ. 2020, 21, 100142. [Google Scholar] [CrossRef]
  30. Skempton, A.W. Long-term stability of clay slopes. Géotechnique 1964, 14, 77–102. [Google Scholar] [CrossRef] [Green Version]
  31. Eid, H.T.; Rabie, K.H. Fully softened shear strength for soil slope stability analyses. Int. J. Geomech. 2017, 17, 1–10. [Google Scholar] [CrossRef]
  32. Hettler, A.; Gudheus, G. Influence of the foundation width on the bearing capacity factor. Soils Found. 1988, 28, 81–92. [Google Scholar] [CrossRef] [Green Version]
  33. Prandtl, L. Über die härte plastischer körper. Nachrichten Von der Königlichen Gesellschaft der Wissenschaften zu Göttingen. In Mathematisch–Physikalische Klasse; Berlin Weidmannsche Buchhandlung: Berlin, Germany, 1920; pp. 74–85. (In German) [Google Scholar]
  34. Terzaghi, K. Theoretical Soil Mechanics; John Wiley and Sons: New York, NY, USA, 1943. [Google Scholar]
  35. Meyerhof, G.G. The ultimate bearing capacity of foundations. Géotechnique 1951, 2, 301–332. [Google Scholar] [CrossRef]
  36. Brinch Hansen, J. A Revised and Extended Formula for Bearing Capacity; Bull. N. 28; Danish Geotechnical Institute: Lyngby, Denmark, 1970; pp. 5–11. [Google Scholar]
  37. Vesić, A.S. Analysis of ultimate loads of shallow foundations. J. Geotech. Eng. Div. 1973, 99, 45–73. [Google Scholar]
  38. Bolton, M.D.; Lau, C.K. Scale effects in the bearing capacity of granular soils. In Proceedings of the 12th ICSMFE, Rio de Janeiro, Brazil, 13–18 August 1989; Volume 2, pp. 895–898. [Google Scholar]
  39. Bolton, M.D.; Lau, C.K. Vertical bearing capacity factors for circular and strip footings on Mohr-Coulomb soil. Can. Geotech. J. 1993, 30, 1024–1033. [Google Scholar] [CrossRef]
  40. Kumar, J.; Kouzer, K.M. Effect of footing roughness on bearing capacity factor Nγ. J. Geotech. Geoenviron. Eng. 2007, 133, 502–511. [Google Scholar] [CrossRef]
Figure 1. Scheme for the formulation of the problem: the weak layer is horizontal and is located at depth zi from the ground surface. The boundary conditions and the dimensions of the model are also presented in the figure.
Geosciences 11 00392 g001
Figure 2. Problem geometry: dimensions and boundary conditions are sketched in the figure (only half of the domain in Figure 1 has been modelled). The horizontal weak layer is located at depth zi from the ground.
Geosciences 11 00392 g002
Figure 3. Finite element discretization adopted for the case with B = 1 m and zi/B = 0.5. The mesh is very fine in the proximity of the footing FEM and is larger in the other areas of the domain; (a) global mesh, (b) enlargement of the part enclosed in the rectangle reported in (a).
Geosciences 11 00392 g003
Figure 4. The load-settlement curve for foundation soil made of sand with φ′ = 35°, ψ′ = φ′, and B = 1 m.
Geosciences 11 00392 g004
Figure 5. Incremental shear strain at failure for the case of a homogeneous soil foundation made of sand with φ′ = 35° and ψ′ = φ′ (B = 1 m).
Geosciences 11 00392 g005
Figure 6. Comparison between the values of the coefficient Nγ obtained with FEM simulation and some theoretical relationships.
Geosciences 11 00392 g006
Figure 7. Incremental strains at failure for the case in which the sand has φ′1 = 40° and ψ′1 = 15°, while the weak layer is characterised by φ′2 = 10°and ψ′2 = 0; the depth of the weak layer is zi/B = 1.5. (a) principal directions; (b) shear shadings.
Geosciences 11 00392 g007
Figure 8. Incremental strains at failure for the case in which the sand has φ′1 = 40° and ψ′1 = 40, while the weak layer is characterised by φ′2 = 35° and ψ′2 = 35; the depth of the weak layer is zi/B = 1.5. (a) principal directions; (b) shear shadings.
Geosciences 11 00392 g008
Figure 9. Incremental strains (principal directions) at failure for φ′1 = 40°, ψ′1= 2/3φ′1 = 26.7° (sand), φ′2 = 15°, ψ′2 = 0 (weak layer), as a function of the relative depth zi/B of the weak layer (B = 1 m).
Geosciences 11 00392 g009
Figure 10. Failure mechanism for φ′1 = 40°, ψ′1 = (2/3) φ′1 = 26.7° (sand), φ′2 = 15°, ψ′2 = 0 (weak layer) as a function of the relative depth and zi/B of the weak layer (B = 1 m). For comparison, the failure mechanism of the case of homogeneous soil is represented in all cases.
Geosciences 11 00392 g010
Figure 11. Evolution of the normalised bearing capacity qlim/qlim,0 with the depth of the weak layer zi/B, for different values of the shear strength angle of the foundation soil φ′1 and the weak layer φ′2.
Geosciences 11 00392 g011
Figure 12. Incremental strains for the case in which the sand has φ′1 = 40° and ψ′1 = 40 while the weak layer is characterised by φ′2 = 30° and ψ′2 = 30; the depth of the weak layer is zi/B = 0.5. (a) principal directions; (b) shear shadings.
Geosciences 11 00392 g012
Figure 13. Normalised bearing capacity qlim/qlim,0 as a function of the shear strength angle φ′1 of the foundation soil for different values of the shear strength angle of the weak layer φ′2 and of the normalised depth of the weak layer zi/B.
Geosciences 11 00392 g013
Table 1. Dimensions of the scheme reported in Figure 1.
L
(m)
H
(m)
B
(m)
zi
(m)
s0
(m)
60201, 20 ÷ 50.2
Table 2. Mechanical parameters of the materials. γd: dry unit weight; c′: effective intercept cohesion; φ′: effective shear strength angle; ψ′: dilation angle; E′: Young modulus; ν′: Poisson′s ratio.
Materialγd (kN/m3)c′(kPa)φ′ (°)ψ′ (°)E′ (kPa)ν′
Sand160.125 ÷ 5010 ÷ φ′20,0000.3
Weak layer160.110 ÷ 300 ÷ φ′20000.3
Publisher’s Note: MDPI stays neutral with regard to jurisdictional claims in published maps and institutional affiliations.

