Article

Trace Element Geochemistry of Chalcopyrites and Pyrites from Golpu and Nambonga North Porphyry Cu-Au Deposits, Wafi-Golpu Mineral District, Papua New Guinea

1
Geological Survey Division, Mineral Resources Authority, P.O. Box 1906, NCD, Port Moresby 121, Papua New Guinea
2
Earth Sciences Division, School of Natural and Physical Sciences, University of Papua New Guinea, P.O. Box 205, NCD, Port Moresby 134, Papua New Guinea
*
Author to whom correspondence should be addressed.
Geosciences 2021, 11(8), 335; https://doi.org/10.3390/geosciences11080335
Submission received: 31 May 2021 / Revised: 19 July 2021 / Accepted: 20 July 2021 / Published: 9 August 2021
(This article belongs to the Special Issue The Geoscience of the Pacific Islands Region: Theory and Practice)

Abstract

:
Studying elemental geochemistry of hypogene sulphides can discriminate the hydrothermal fluids responsible for ore formation. To determine whether Golpu porphyry Cu-Au deposits are related to the Nambonga North porphyry system which is located 2.5 km apart in the Wafi-Golpu Mineral District, Papua New Guinea, we compare the trace element compositions of drill core chalcopyrites and pyrites analysed using Laser Ablation Inductively Coupled Plasma Mass Spectrometry (LA-ICPMS). The results for the Golpu chalcopyrites revealed high concentrations of Au, As, Se, Mo, Sb, Te and Bi and lower concentrations of Ag and Zn compared to those from Nambonga. Pd and Pt were below the detection limit in chalcopyrites for both deposits. The results for the Golpu pyrites indicated high concentrations of Pt, Au, Se, Mo, Sb, and Te and lower concentrations of Cu, Zn, As, Ag, Pb, Pd and Bi compared to those from Nambonga North. Au concentrations in the pyrites from both the porphyry deposits were higher compared to chalcopyrites, which mean that pyrite is the Au-bearing sulphide responsible for the higher Au content. In contrast, Cu values in pyrites from Nambonga North are higher than those from Golpu. Overall, it is envisaged that the ore fluids were exsolved at different times during the evolution of both porphyry deposits, although these porphyry centres may be related in space and time.

1. Introduction

Papua New Guinea’s unique geological heritage and its striking natural resources result from its location in the Southwest Pacific along the famous ‘Pacific Ring of Fire’. Porphyry Cu-Au and epithermal Au deposits are common [1,2,3] along the major magmatic arcs of the northward-moving Indo-Australian plate and the westward-moving Pacific plate [4,5,6].
The northwest trending collisional zone in the interior of mainland PNG defines the New Guinea Orogenic Belt and hosts several porphyry and epithermal deposits such as Ok Tedi, Porgera, Mt Kare, Frieda River-Nena, Wafi-Golpu, Hidden Valley and Tolukuma (Figure 1).
The metallogenesis of the porphyry and epithermal deposits is not fully understood because of the complex tectonic history and the lack of robust geological datasets over the region [6]. New trace element chemistry data of hydrothermal minerals associated with ore deposition in the region, particularly the New Guinea Orogenic Belt that hosts the Wafi-Golpu Mineral District (WGMD), can add more insights to the understanding of the metallogenesis.
The WGMD hosts the Golpu and Nambonga North porphyry Cu-Au deposits. Golpu has multi-phase, calc-alkaline, dioritic porphyries with associated epithermal and carbonate-base metal-Au deposits, whereas Nambonga North is a smaller porphyry system situated 2.5 km to the northwest. The Golpu deposit has a total resource of 830 Mt with 0.71 g/t Au, 1.1% Cu, 1.3 g/t Ag (measured and indicated grades) with an overall contained metal resource of 18.8 Moz Au, 8.7 Mt Cu and 32.6 Moz Ag [7]. The Nambonga North porphyry contains an inferred resource of 48 Mt, with a grading of 0.2% Cu and 0.69 g/t Au and with a contained metal of 1.1 Moz Au and 0.094 Mt Cu [8].
This paper focuses only on the pyrites and chalcopyrites which are the two most common Au-bearing sulphides of the Golpu and Nambonga North porphyry deposits. Although mineralisation also occurs in other mineral phases such as enargite, covellite, tennantite, pyrite and chalcopyrite are quite distinct, making them easier to work on in this study.
Using LA-ICPMS to determine their trace element compositions, we unravel the metal residence and concentrations and their elemental substitution and replacement, including closely associated mineral phases and their complexing agents. This information is also important for the mill and metallurgical processes that are required for optimal metal recovery.

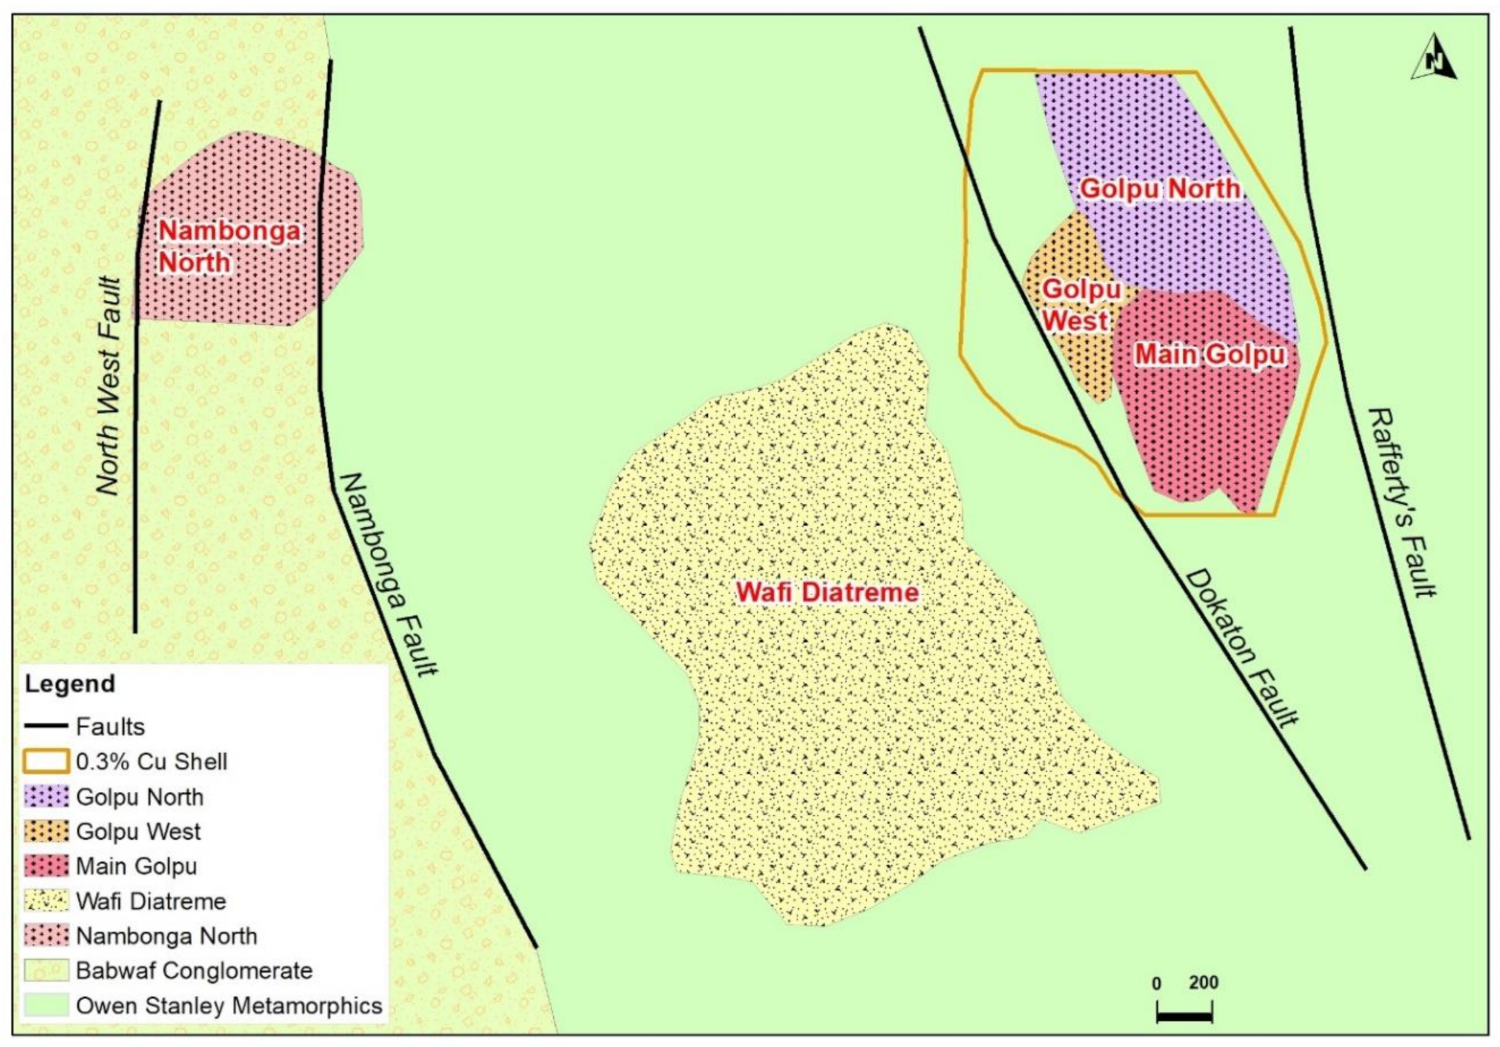
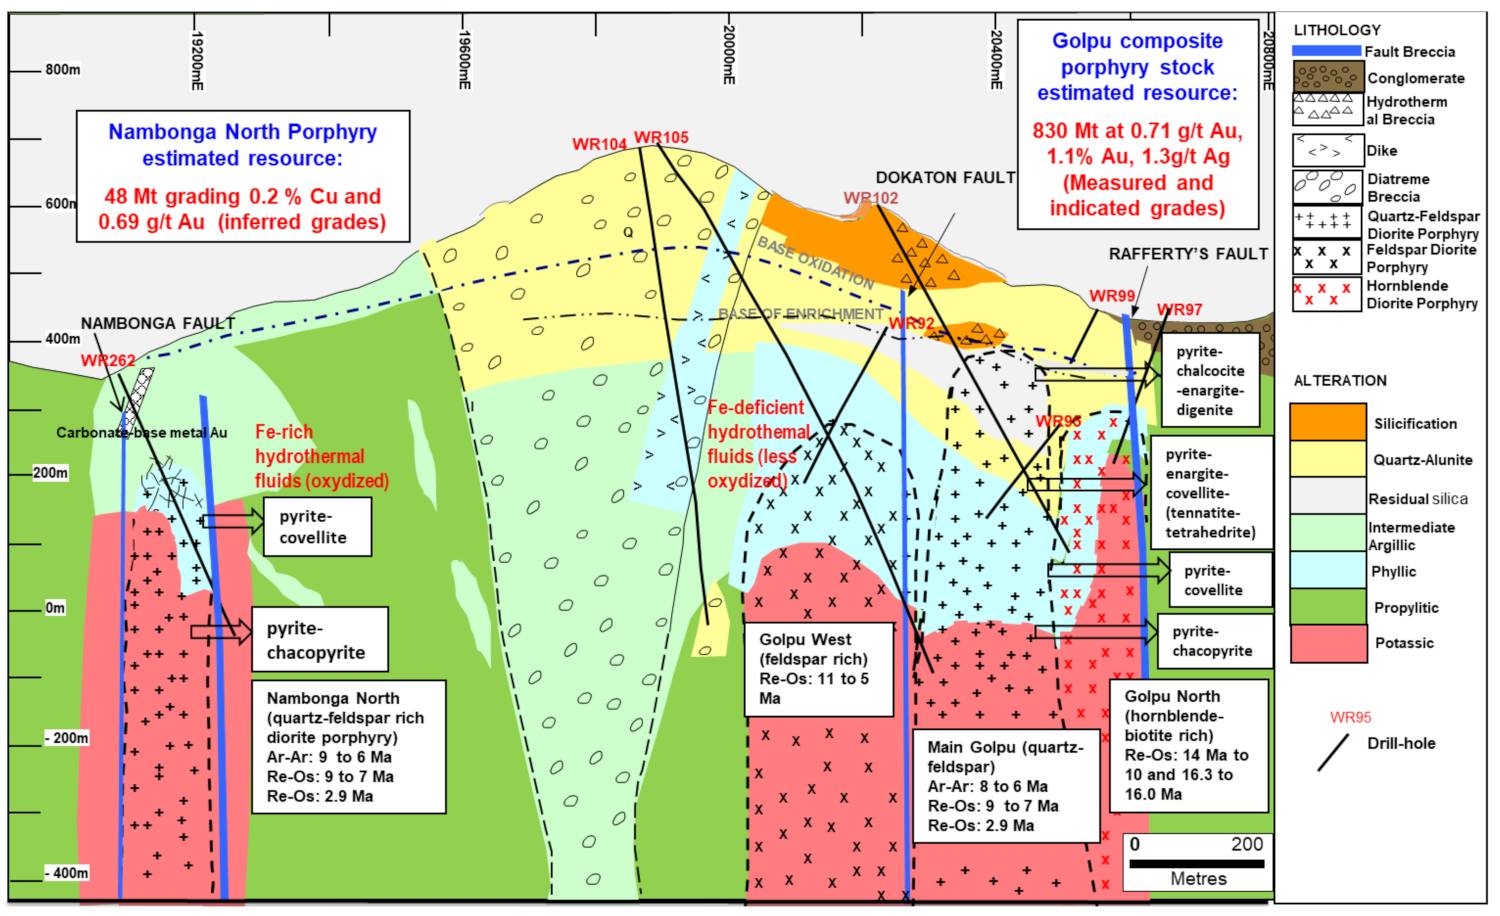
2. Geological Setting

The geological evolution of Papua New Guinea is intricate with a mix of terranes comprising of sialic continental crusts, volcanic island arcs and oceanic micro-plates that have undergone fold-and-thrust belt deformation, metamorphism, magmatism, ophiolite obduction, uplift and sedimentation [4,5,9,10,11,12,13,14]. Papua New Guinea has experienced major tectonic reconstructions since the start of the break-up of Gondwana in the Triassic period and continues to do so because of its location at the centre of the northerly moving continental Indo-Australian plate and the west-north-westerly moving oceanic Pacific plate [14,15,16]. How these large and exquisite Cu- and Au-mineralised porphyries formed on the island of New Guinea during the geological evolution has been a topic of debate for many decades. As new scientific data becomes available, our knowledge and understanding of porphyry deposits continues to improve [17]. Situated in the New Guinea Orogenic Belt, the geology of the WGMD has been reported in many company reports and publications e.g., [18,19,20,21] and is generally summarised in this paper.

2.1. Stratigraphy

The oldest rocks are Jurassic to Cretaceous in age and belong to the Owen Stanley Metamorphic Complex (OSMC) units. The units consist of interbedded siltstone, sandstone and conglomerate and shale; shale is carbonaceous in parts. These rocks have been regionally metamorphosed to greenschist facies, are weakly to moderately foliated with a northerly strike and dip 40–60° to the east-southeast.
Middle Miocene Langimar Beds unconformably overlie the basement in the west. The Beds are comprised of volcanolithic pebble to cobble conglomerate with a tuffaceous matrix, silty sandstone, interbedded marl, mudstone, and lenses of detrital limestone, including lavas and pyroclastic units of basaltic to andesitic composition.
The Pliocene Babwaf Formation lies unconformably on the basement in the west. The Formation includes poorly sorted, weakly consolidated polymictic conglomerates, sandstones and siltstones.
Holocene and Quaternary Deposits fill depressions and cover topographic highs throughout the district. The Wafi Conglomerate occurs in the east and constitutes a sequence of unconsolidated conglomerate, gravel, sand, siltstone, clay and organic material.

2.2. Structures

The two major structural trends in the region surrounding WGMD are the northwest to north-northwest striking, arc-parallel (accretionary) structures and the northeast to north-northeast trending, arc-normal (transfer) structures [1,2,10]. These structures developed in response to the oblique plate convergence of the Indo-Australian plate and the Pacific plate, which created isoclinal folding, thrust faulting and sinistral transverse faulting parallel to the thrust direction [2].
The north-northwest striking structures are extensional faults related to the Wandumi and Watut Faults in the southern Wau Basin, a region that hosts the Morobe Goldfields (Figure 2). The arc-normal structures developed due to the east-southeast-directed compression of the northwest-moving Pacific plate against the Indo-Australian plate, which also generated isoclinal folding and thrust faulting. The Golpu and Nambonga North porphyries are controlled by the northeast to north-northeast striking faults. Rafferty’s Fault and Dokaton Fault bound the Golpu porphyry deposit and its associated intrusive phases to the east and west, respectively (Figure 3).

2.3. Intrusions of the Golpu and Nambonga North Porphyry Centres

The Golpu intrusive phases are bounded by Rafferty’s Fault in the east and Dokaton Fault in the west. At the time of the study, the Golpu intrusions were classified as the Main Golpu porphyry, Golpu West porphyry and Golpu North porphyry based on the textural and mineralogical characteristics (C. Muller, personal communication; 9 April 2010). The Golpu composite porphyry suite extends over about 800 m north-south by 500 m west-east, and was drill tested to a depth of more than 2000 m [8]. The Main Golpu porphyry is rich in quartz and feldspar. The Golpu West porphyry is directly west of and is more feldspar-rich than the main Golpu porphyry. The Golpu North porphyry is located at the northern margin of the main Golpu porphyry and is rich in hornblende.
Nambonga North is a quartz and feldspar-rich diorite porphyry similar to the Main Golpu porphyry located 2.5 km northwest of the Golpu intrusions. It intrudes both the OSMC units and Babwaf Formation and covers an area of about 200 × 200 m with a vertical extent of at least 800 m [8]. The diorite porphyry hosts the porphyry-related alteration-mineralisation with a minor high sulphidation overprint and argillic alteration assemblages [8].

2.4. Other Intrusive Suites

The Wafi Diatreme is a phreato-magmatic breccia or maar-related breccia pipe with steeply dipping, northeast-oriented margins that are vented to the surface west of the Golpu porphyries. The diameter of the diatreme is about 2 km from the north-northeast to south-southwest direction. The diatreme is comprised of intrusive, sedimentary, volcaniclastic and tuffaceous rocks, which are poorly sorted, matrix-supported and heterolithic with clasts sizes not greater than 10 mm in diameter. The rock fragments include sub-rounded shale clasts, weakly bedded siltstone, undifferentiated metasedimentary rocks and crystals of quartz and feldspar in a matrix of fine-grained hydrothermally altered clays and fragments of quartz vein material.
The Wafi Dacite porphyry intrudes the Wafi Diatreme and Golpu porphyries in the east as small dikes. This porphyry is fine- to medium-grained and is comprised of quartz and feldspar phenocrysts. It also hosts discrete quartz and pyrite veins and can be termed as a late-mineral dike.
The Hekeng Andesite porphyry is situated south-southwest and south-southeast of the Golpu porphyries and the Wafi Diatreme, respectively. Similar to the Golpu porphyries, it is bounded by the Rafferty’s and Dokaton Faults, and cross-cuts the Wafi Diatreme and Wafi Dacite porphyry. The andesite porphyry is fine- to medium-grained, is partly brecciated and denotes a late- to post-mineral intrusive phase. Kaolinite alteration is predominant.

2.5. Alteration and Mineralisation

The Golpu and Nambonga North porphyries are comprised of central early potassic (quartz-magnetite-secondary biotite ± K-feldspar ± anhydrite) cores grading into propylitic (actinolite-chlorite-epidote-carbonate ± magnetite) alteration; pervasive phyllic (quartz-sericite-pyrite) alteration variably superimposes earlier-formed alteration types (Figure 4). The minerals associated with the potassic alteration are pyrite, chalcopyrite, bornite and molybdenite. The phyllic-related mineralisation is defined by pyrite-chalcopyrite-molybdenite mineral assemblage.
The Wafi high sulphidation epithermal alteration-mineralisation consists of A and C Zones and is spatially, temporally and genetically related to the Golpu porphyry deposit (Figure 3). The earlier formed hydrothermal alteration is zoned from silica-alunite (advanced argillic) to kaolinite-dickite-pyrophyllite (intermediate argillic) to illite-smectite (argillic) mineral assemblages. The late-stage mineralisation is characterised by the presence of enargite-covellite-tennantite-pyrite-arsenopyrite mineral assemblage and is comprised predominantly of refractory Au in arsenopyrite and arsean pyrite, including some pyritic phases.
The low sulphidation epithermal alteration-mineralisation is comprised of B and Link Zones and is located at the southeastern margin of the Wafi Diatreme. The zones consist of quartz veins with illite-smectite-chlorite-carbonate alteration selvages and pyrite ± marcasite mineralisation. The veins are cross-cut by more than one generation of pyrite-sphalerite-galena-carbonate mineral assemblages.
Several carbonate-base metal ± Au zones (i.e., Western, Malaria, Nambonga and Hesson Creek) occur at the marginal areas of the two porphyry Cu-Au deposits. These zones are considered to have formed through wall-rock interaction and/or the mixing of the magmatic-hydrothermal fluids derived from the source porphyry intrusion(s).
Supergene fluids have formed an oxide-hosted cap at the top, which is underlain by a weakly developed enrichment blanket consisting of secondary chalcocite and covellite. Iron oxides, quartz and alunite are the predominant minerals in the oxidised horizon.

3. Trace Element Geochemistry of Pyrite and Chalcopyrite

3.1. Sampling Method and Analytical Procedures

The trace element geochemistry of pyrite and chalcopyrite was determined using LA-ICPMS at the Friedrich Alexander University, Erlangen, Germany. The trace elements measured for the pyrites were Pd, Pt, Au, Cu, Zn, As, Se, Mo, Ag, Sb, Te, Pb and Bi. The measurements comprised samples from the Main Golpu porphyry (n = 39), Golpu West porphyry (n = 40), Golpu North porphyry (n = 50) and Nambonga North porphyry (n = 36). The trace elements measured for chalcopyrites were Pd, Pt, Au, Zn, As, Se, Mo, Ag, Sb, Te, Pb and Bi (excluding Cu). The measurements included samples also from the Main Golpu porphyry (n = 29), Golpu West porphyry (n = 28), Golpu North porphyry (n = 19) and Nambonga North porphyry (n = 38).
Calibration was completed using external standards Po724 B2 SRM (Sulphide Standard, Memorial University Newfoundland) for Pd, Pt and Au and Mass-1 (Polymetal Sulphide Standard, United States Geological Survey) for Cu, Zn, As, Se, Mo, Ag, Sb, Te, Pb and Bi, respectively. A single spot with a 25 µm crater-diameter was analysed by a time-resolved analysis method with the measurements taken at the maximum peak and at a 15 Hz repetitive rate. A few smaller grains were also analysed using a 15 to 20 µm crater size. The analysis time was 20 s after a 20 s instrumental background analysis (carrier gas + LA-ICPMS). The carrier gases of the Agilent 7500i were He and Ar and the Plasma power was 1310 W.

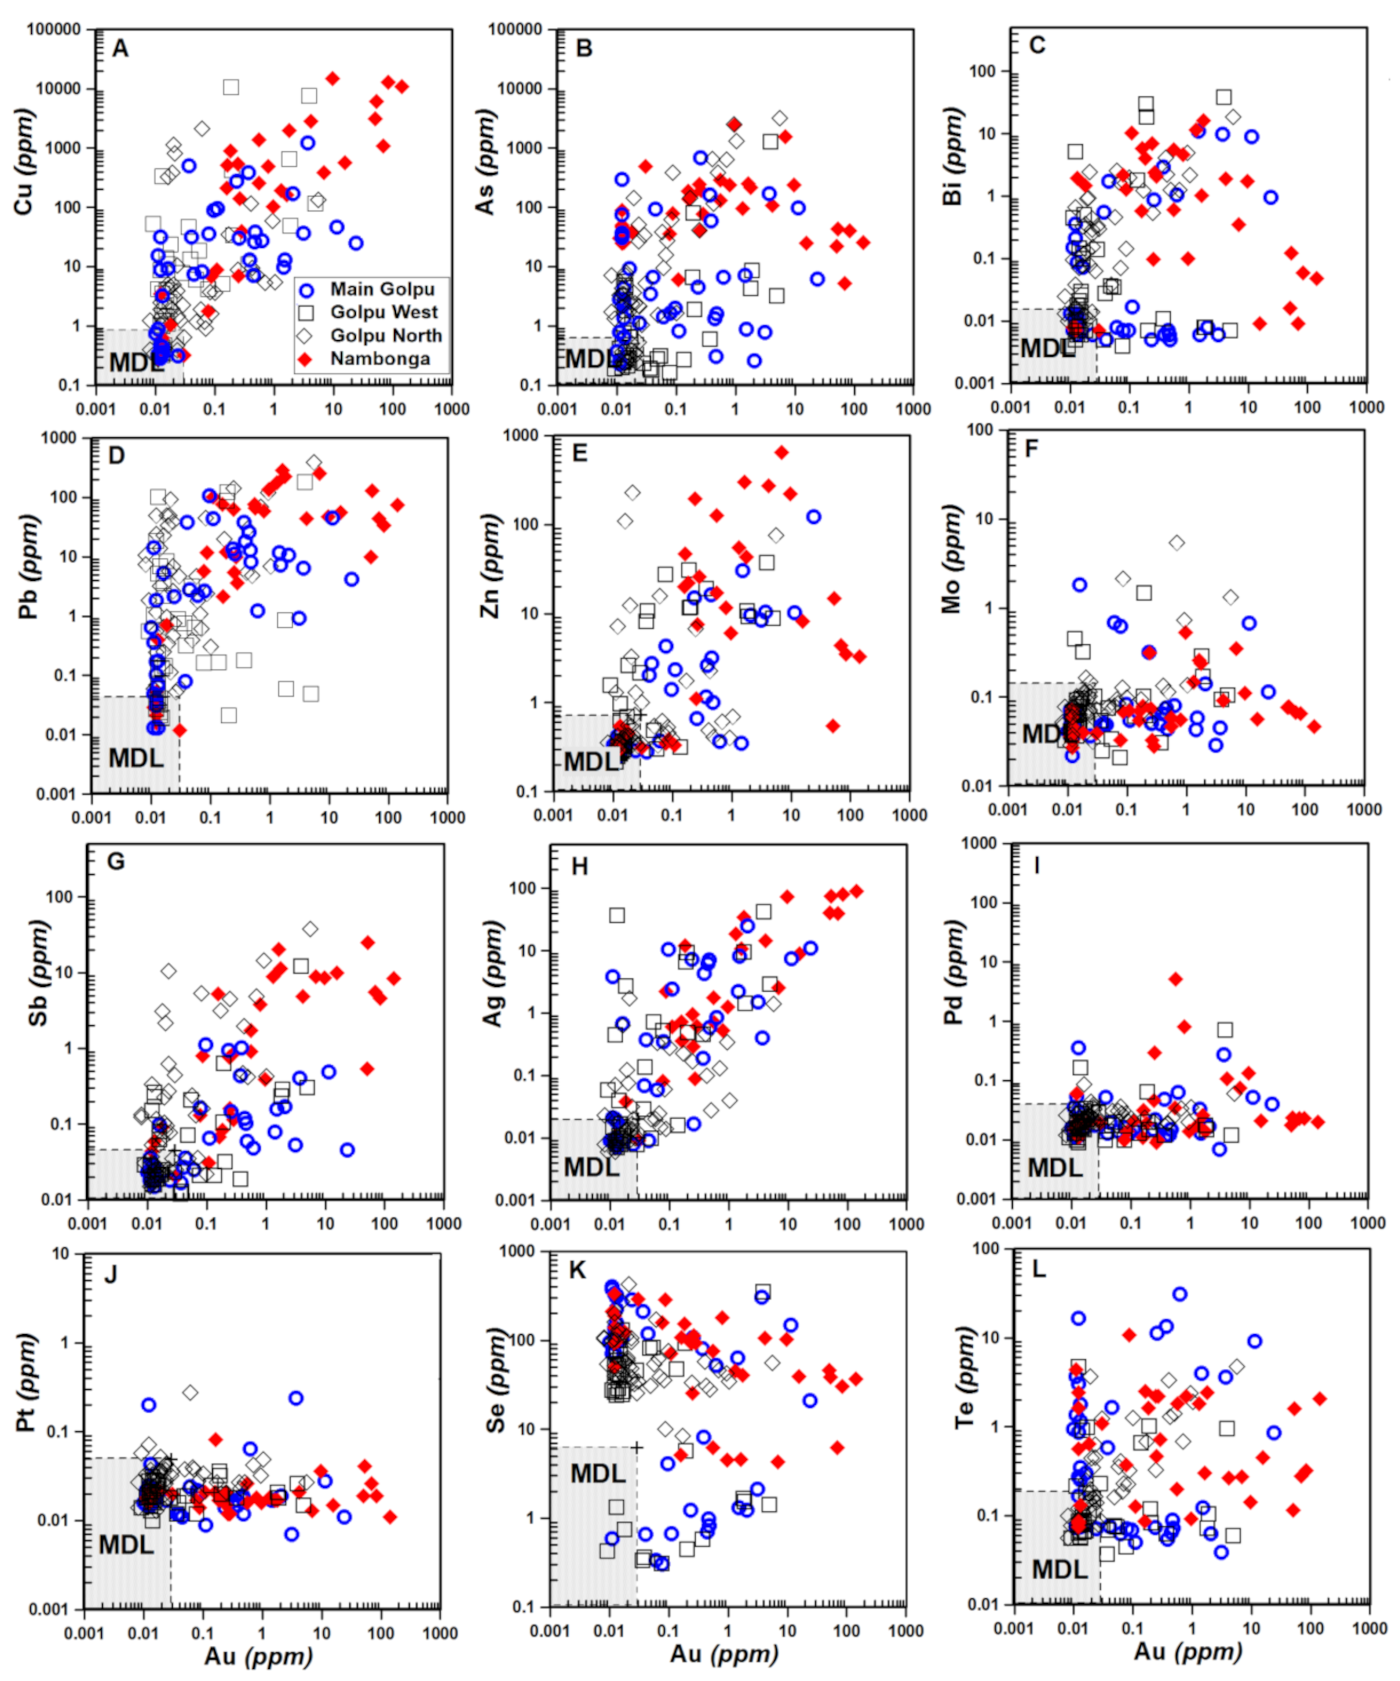
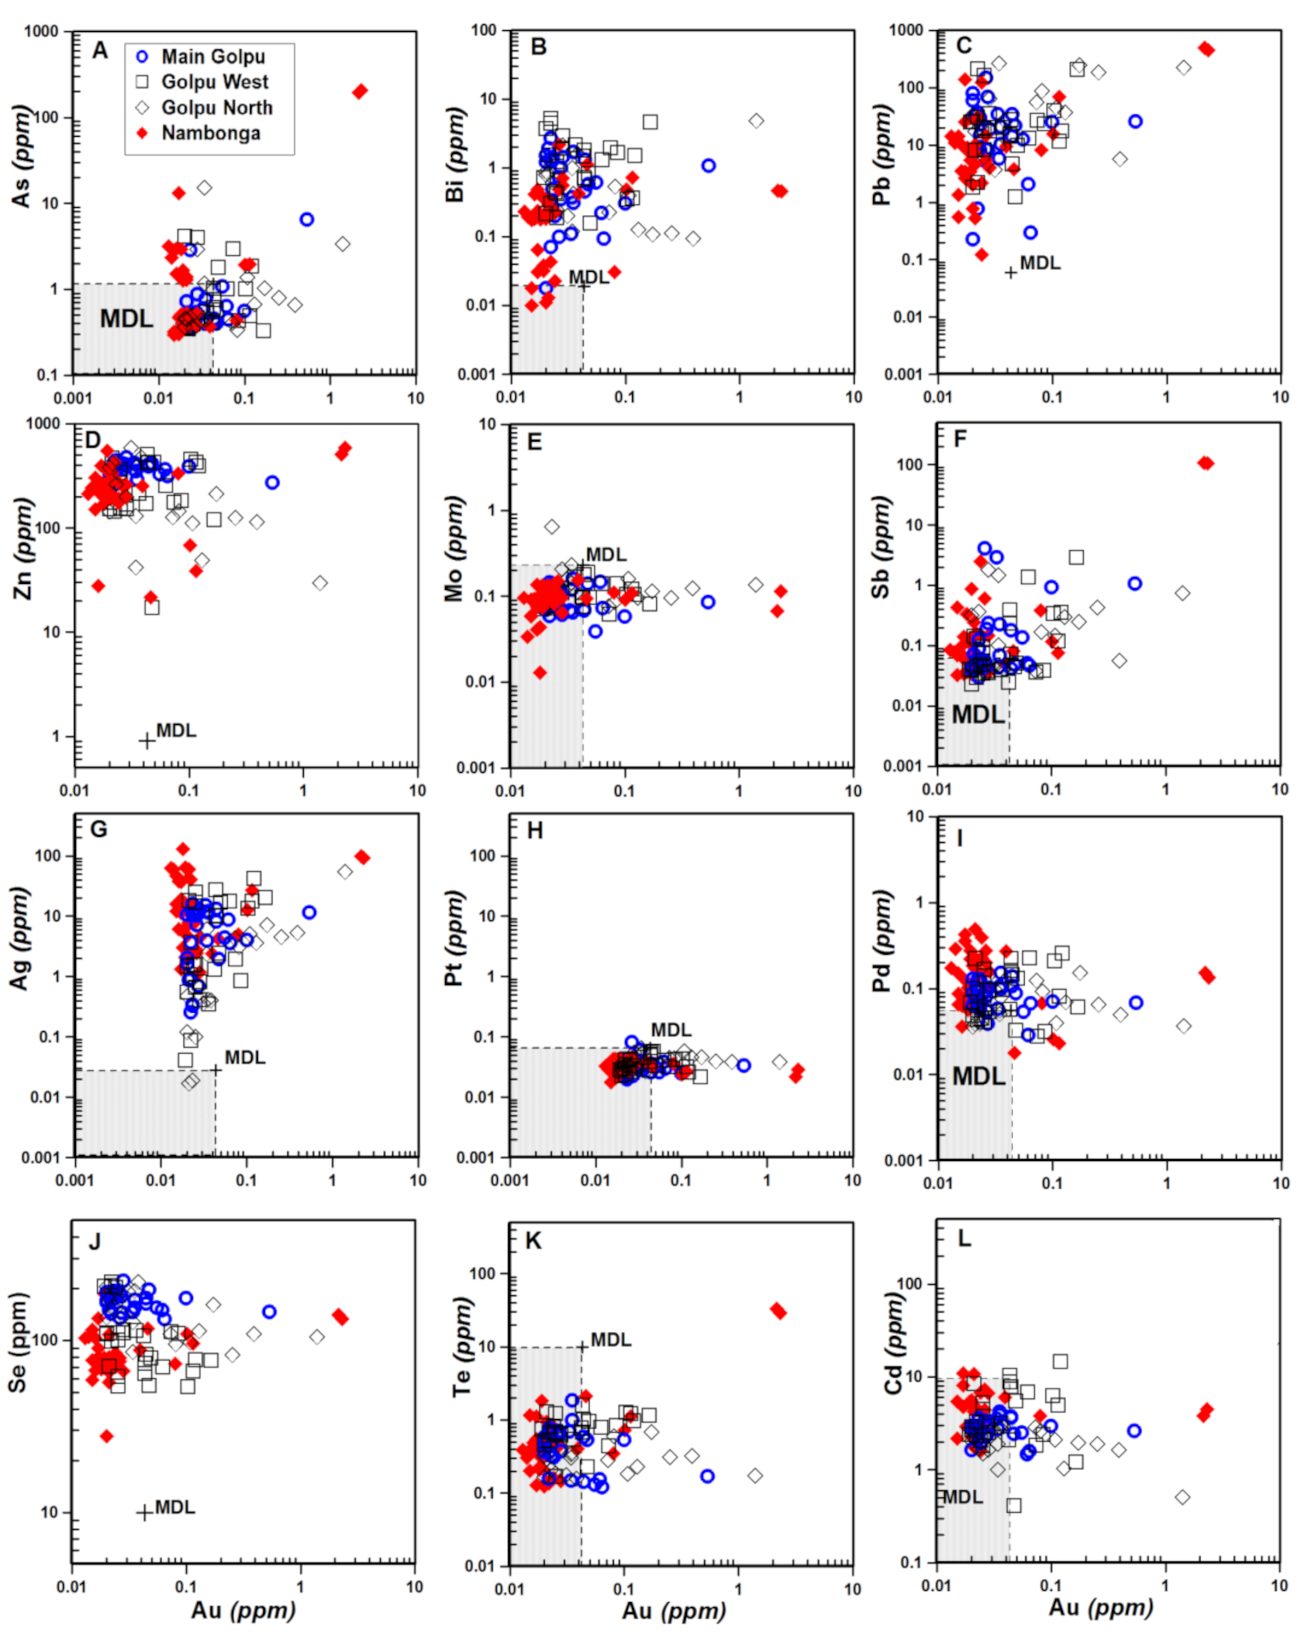
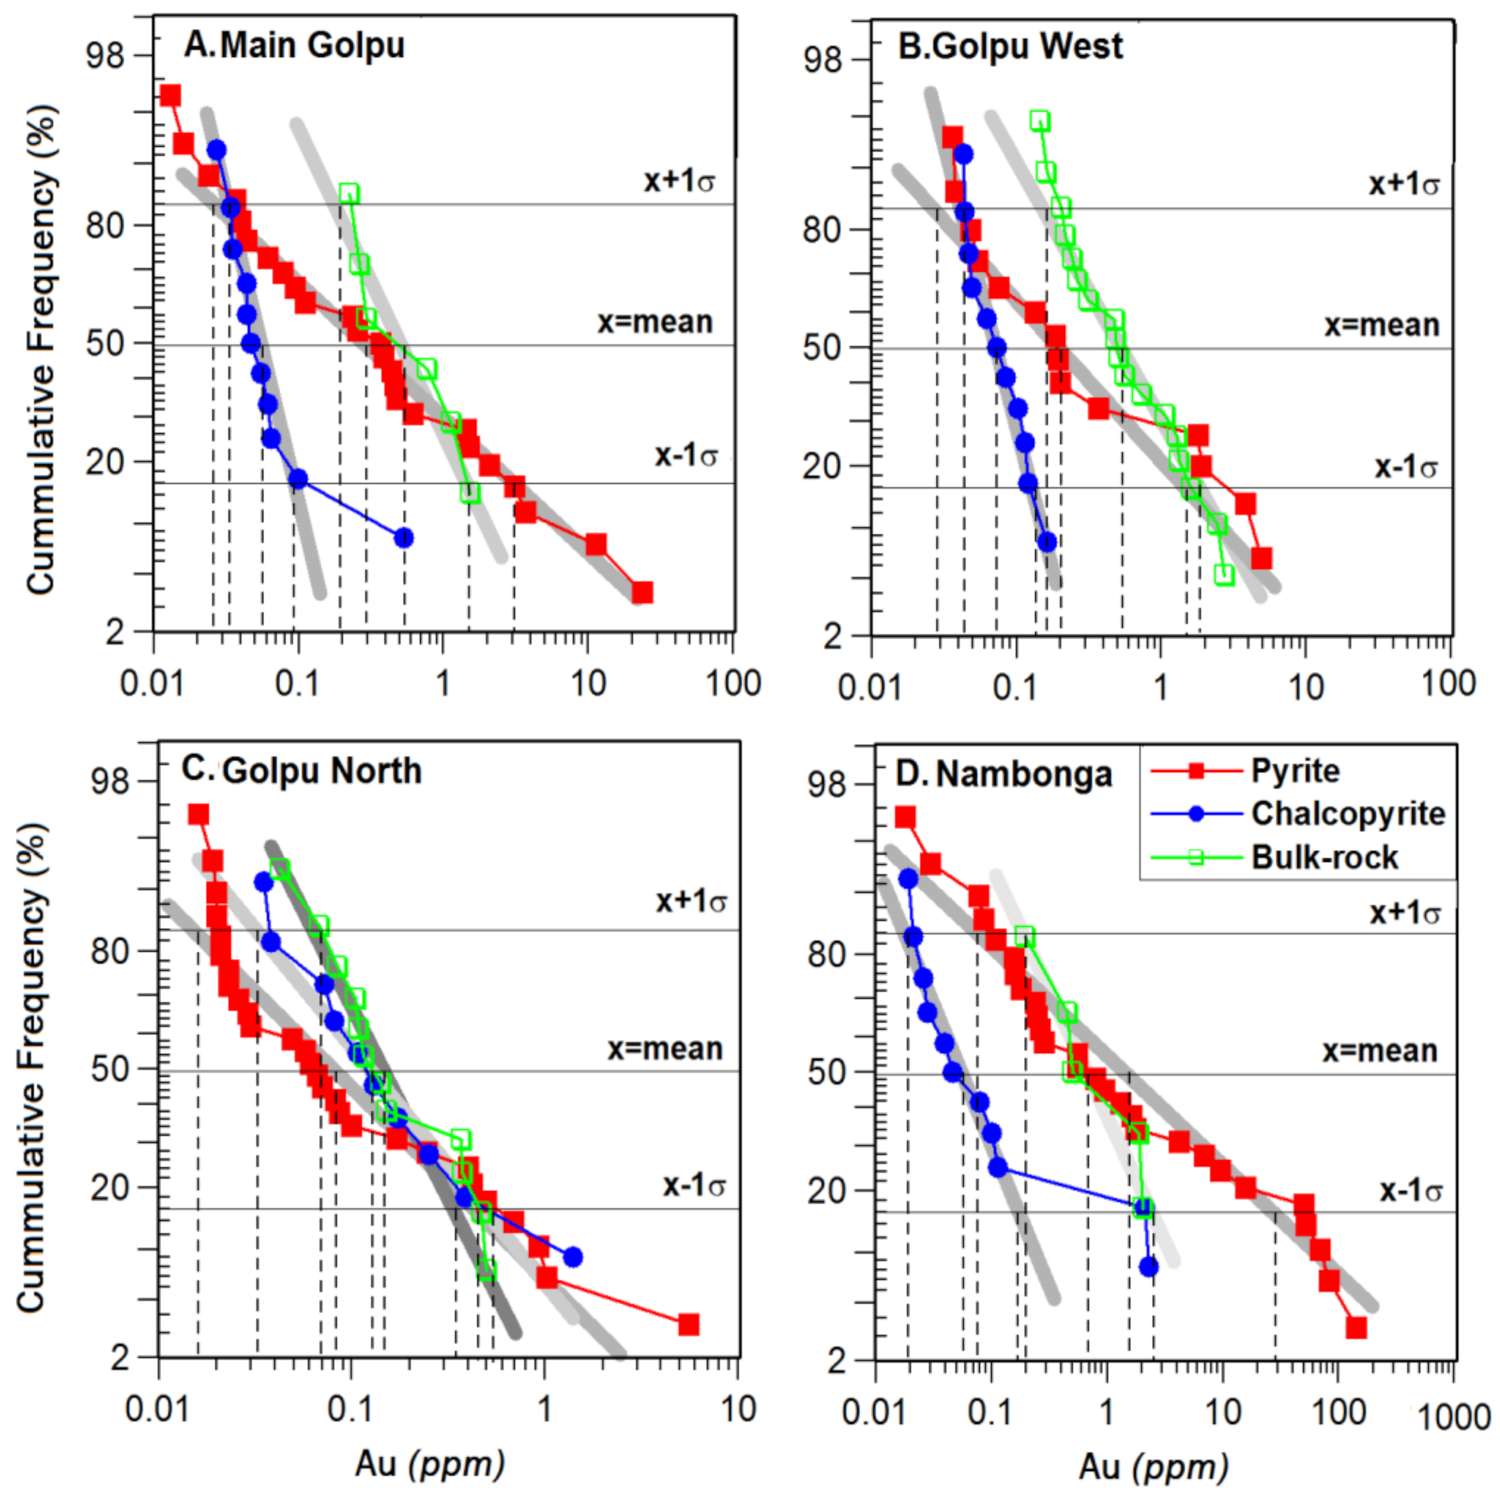
3.2. Analytical Results

The trace element results of the pyrites and chalcopyrites are shown in Appendix A and Appendix B, respectively. Logarithmic plots of the trace element concentrations of the pyrites are shown in Figure 5. The Main Golpu porphyry had 39 pyrite analyses where 13 of them were below the detection limit (<11–13 ppb Au) and the highest Au content was 23,700 ppb. The Golpu West porphyry had 40 Au pyrite analyses; 25 of these analyses were below the detection limit (<9–18 ppb Au) and the highest Au content was 4910 ppb. The Golpu North porphyry had 50 Au analyses of pyrite where 21 of them were below the detection limit (<8–24 ppb Au) and the highest Au content was 5580 ppb. The Nambonga North porphyry had 36 Au analyses of pyrite; seven of these analyses were below the detection limit (<1–12 ppb Au) and the highest Au content was 143,000 ppb.
Similarly, Figure 6 shows the logarithmic plots of the trace element concentrations of the chalcopyrites. The Main Golpu porphyry had 29 Au analyses of chalcopyrite; 17 of the analyses were below the detection limit (<20–35 ppb Au); the Au content was up to 530 ppb. The Golpu West porphyry had 28 Au analyses and 16 of them were below the detection limit (<19–43 ppb Au); the Au content was up to 160 ppb. The Golpu North porphyry had 19 Au analyses and eight of the analyses were below the detection limits (<20–34 ppb Au); the Au content was up to 1340 ppb. The Nambonga North porphyry had 38 Au analyses and 26 of them were below the detection limit (13 to 28 ppb Au); the highest Au content was 2300 ppb.
The Au in pyrite and chalcopyrite, together with the bulk-rock Au content, was evaluated using cumulative frequency plots and a geometric mean that was derived by taking into account those data below the analytical detection limit (Figure 7). The data revealed an approximate log-normal distribution of the Au concentration in the Main Golpu porphyry, Golpu West porphyry, Golpu North porphyry and Nambonga North porphyry.
The Main Golpu porphyry had a mean of 300 ppb Au (27–3000 ppb; 1 σ range variation) for pyrite (n = 26) and a mean of 48 ppb Au (34–90 ppb) for chalcopyrite (n = 12). The bulk-rock Au concentration for the Main Golpu porphyry (n = 7) had a mean of 550 ppb Au (200–1600 ppb; 1 σ range variation). The Golpu West porphyry had a mean of 200 ppb Au (28–1600 ppb; 1 σ range variation) for pyrite (n = 15) and 60 ppb Au (44–140 ppb; 1 σ range variation) for chalcopyrite (n = 12). The bulk-rock Au concentration for the Golpu West porphyry (n = 19) had a mean of 550 ppb Au (170–1800 ppb; 1 σ range variation). The Golpu North porphyry had a mean of 82 ppb Au (17–450 ppb; 1 σ range variation) for pyrite (n = 29) and 140 ppb Au (32–550 ppb) for chalcopyrite (n = 11). The bulk-rock Au concentration for the Golpu North porphyry (n = 13) had a mean of 160 ppb Au (60–350 ppb; 1 σ range variation). The Nambonga North porphyry had a mean of 1700 ppb Au (75–30,000 ppb; 1 σ range variation) for pyrite (n = 29) and 50 ppb Au (10–180 ppb) for chalcopyrite (n = 12). Its bulk-rock (n = 6) Au concentration had a mean of 700 ppb Au (200–2500 ppb; 1 σ range variation). The distribution shows that Au in the pyrites from the Nambonga North porphyry is higher than those from the Main Golpu porphyry, Golpu West porphyry and Golpu North porphyry.
The approximate log-normal mean Au concentrations in pyrite and the approximate log-normal mean Au concentration in the bulk-rock for each of the porphyries are plotted in Figure 8A. Note that these means represent the geometric means. The mean Au concentration in both the pyrite and bulk rock is the highest for the Nambonga North porphyry whereas the Golpu North porphyry has the least mean Au contents. The Main Golpu porphyry has slightly higher mean Au in the pyrite than Golpu West porphyry while the mean Au in the bulk-rock of both porphyries is the same. The approximate log-normal mean Au concentration in chalcopyrite and the approximate log-normal mean Au concentration in the bulk-rock for each of the porphyries are plotted in Figure 8B. It is apparent that the Golpu North porphyry has the highest mean Au in chalcopyrite compared to the other porphyries, whereas the Nambonga North porphyry has the highest mean Au in the pyrite.
A close inspection of the pyrites at the Nambonga North porphyry deposit reveals two distinct generations. The two pyrite generations have similar vein mineralogy but discrete morphological textures which also correspond to the differences in their Au contents.
The first pyrite type, found in Sample N1, is from the diamond drill hole WR272 and is found at a depth of 396.00 m. The sample is a diorite that is pervasively altered by K-feldspar-sericite-chlorite mineral assemblage cross-cut by sheeted quartz veins and quartz stock-work, both of which are superimposed by magnetite-chalcopyrite-pyrite as veins, dissemination and fracture-fill. Hence, the first pyrite type is present as infill in a 2 cm-wide quartz ± magnetite ± pyrite ± chalcopyrite vein (Figure 9). It forms granoblastic to idiomorphic textures which precipitated from the magmatic-hydrothermal fluids.
The second pyrite type in Sample N10 is from the same diamond drill hole but was collected at a depth of 294.30 m, a shallower depth than N1. The intrusive type, alteration minerals and sequence of alteration–mineralisation are the same as those of Sample N1. The second type of pyrite also occurs in 1 to 2 mm-wide quartz-magnetite ± chalcopyrite ± pyrite veins (Figure 10). It is platy, tabular and lamellar in shape and is formed as pseudomorphic replacement of hematite, i.e., by a sulphidation reaction that is similar to the replacement of magnetite by pyrite. The pyrites in Sample N10 are variably replaced by chalcopyrite along their grain boundaries.
The coexistence of both N1 and N10 pyrites suggests several stages of deposition, and the pseudomorphic pyrite (N10) seems to be the most favourable for Au fixation.
Figure 11 shows the logarithmic plots of the trace element concentrations of the pyrites from the Nambonga North porphyry; bulk-rock Au is used as an arbitrary reference. A total of 31 pyrites analysed from five samples from the drill hole WR272 were assessed.
Sample N10 (294.30 m) had nine pyrite analyses and the highest Au value was 143,000 ppb. Sample N11 (309.50 m) had only three pyrite analyses, of which the highest value was 787 ppb Au. Sample N5 (376.30 m) had six pyrite analyses and the highest Au value was 6870 ppb. Sample N1 (396.00 m) had seven pyrite analyses, of which five were below the detection limit (11 to 12 ppb Au) and the highest value was 109 ppb Au. Sample N16 (506.80 m) had six pyrite analyses, one of which had the highest value of 6870 ppb Au. The highest Au values occurred at the shallowest depths (N10; ≤294.30 m) and the lowest Au values occurred at a greater depth (N16; 506.80 m). There was a positive correlation of Au and Cu and Au with Ag in all the samples. The Pd, Pt, Mo, Cd, Te, Se, Sb and Pb abundances appear to show similar distribution patterns. However, the As, Bi and Zn data showed an odd depletion in sample N10 (sample at shallow depth).
For a quantitative evaluation of the Au contribution in pyrite to the bulk-rock Au content in each porphyry system, the maximum possible amount of pyrite in each system was calculated using the sulphur (S) concentration in the bulk-rock analyses multiplied by the stoichiometric molar ratio in pyrite of FeS2/S2. This calculation gives only an upper limit, as there are other but less abundant S-bearing minerals in the system (anhydrite, chalcopyrite, marcasite, sphalerite, molybdenite and galena). Overall, there seems to be no correlation between the calculated Au concentration in the pyrite and the Au content in the bulk-rock, as shown in Figure 12.
The pyrite from the Main Golpu porphyry provides about 16 ppb Au to the bulk-rock (5.34 wt% pyrite × 550 ppb Au in pyrite) which is about 3% of the total Au in the bulk-rock. The pyrite from the Golpu West porphyry supplies about 6.7 ppb Au (3.35 wt% pyrite × 550 ppb Au in pyrite) which is about 1% of the total Au in the bulk-rock. The pyrite from the Golpu North porphyry contributes about 6.5 ppb Au (7.93 wt% pyrite × 160 ppb Au in pyrite) which is about 4% of the total Au in the bulk-rock.
The pyrite from Nambonga North porphyry contributes about 63 ppb Au to the bulk-rock (3.72 wt% pyrite × 1700 ppb Au in pyrite) with a mean of 700 ppb Au. This is about 9% of the total Au in the bulk rock.
This mass balance shows that more than 90% of the Au in each of the porphyries comes from elsewhere, apart from pyrite. Considering this and taking into account the low Au concentration in the chalcopyrite, there must be a third Au-carrier in the porphyries. The third Au-carrier is most likely sub-microscopic native Au observed as aggregates and inclusions.

4. Discussion

4.1. Implications of the Trace Element Composition of Pyrite

The trace elements of pyrite from the Main Golpu, Golpu West and Golpu North porphyries display no significant correlation except where a high content of Au exists. High Au contents are associated with high Cu (e.g., Sample G22 from Main Golpu: WR331, 1214.20 m). This pyrite is associated with the potassic alteration. Locally, a high Au content is also associated with high As, Ag, Te and Bi contents (e.g., Sample G17 from Main Golpu: WR331, 1481.00 m). This element association may be pyrite that was deposited by high sulphidation fluids. At the Golpu West porphyry, high Au contents correlate positively with high Cu and Ag contents; Bi content is locally high too (e.g., Sample G6: WR327A, 756.40 m). Such a correlation may be indicative of pyrite deposited during phyllic alteration. There are instances where a high Au content correlates well with high Cu, As, Ag, Te and Bi contents (e.g., Sample GW15: WR321, 941.20 m). This relationship identifies pyrite deposited by high sulphidation fluids that remobilised and redeposited elements deposited during the porphyry stage. Sample GN23 (WR351, 957.00 m) from Golpu North reveals a positive correlation between high Au, As, Sb, Te and Bi contents with local high Cu contents, suggesting pyrite deposition by high sulphidation fluids. In all, fluids associated with potassic, phyllic and high sulphidation alteration types are differentiated from the local overprint of porphyry-related mineralisation by high sulphidation fluids.
Nambonga North pyrites show a positive relationship between Au, Cu, As and Ag contents. High Au contents correspond to high Cu, As and Ag contents (e.g., Sample N10: WR272, 294.00 m). In addition, high contents of Sb, Te and Bi are associated with the elements mentioned above (e.g., Sample N11: WR272, 376.30 m). This relationship is considered to be associated with pyrite deposited during phyllic alteration, implying that there is a high potential of remobilising and redepositing elements deposited during the Potassic-associated mineralisation. It can also be inferred that the Au and Cu deposited immediately after phyllic alteration were transported as bisulphide complexes.
The pyrite generations at Nambonga North show that high Au grades are associated with the phyllic alteration assemblage and a particularly negative correlation of the Au is displayed by As, Bi and Zn. Some studies show that Au is spatially associated with the enrichment of local As in pyrite grains [22,23,24]. Research on the As and Au intake of the arsenic-rich pyrite, marcasite and arseno-pyrite in sediment-hosted Au deposits at Carlin in Nevada (USA) revealed that Au is removed from the ore fluids by chemosorption at As-rich and Fe-deficient surface sites and is incorporated into the solids in a metastable solid solution [25]. However, this is not usually common since the Au hosted in the pyrite from Yangzhaiyu lode Au deposit in China is associated with Te and not with As [26]. As noted above, it is evident here that the As-deficient pyrite associated with the phyllic alteration at Nambonga North is enriched in Au. Hence, this is indicative of pyrite metal speciation and partitioning e.g., ref. [27] where in this case the granoblastic textured pyrite detected lower Au and deficient As whereas the platy, prismatic and lamellar textured pseudomorphic pyrite has a higher Au content and is rich in As.

4.2. Implications of Trace Element Composition of Chalcopyrite

Main Golpu chalcopyrites have relatively low Au contents and elevated Ag and Te contents, including Bi found locally (e.g., Sample G21: WR331, 1214.20 m). It is most likely that these chalcopyrites were deposited during potassic alteration. Local High Au content correlates with high As, Ag, Sb, Te and Bi contents, indicating a possible deposition of the chalcopyrite during phyllic and/or chlorite-sericite alteration during boiling and metal precipitation. Golpu West and Golpu North have trace element compositions that are similar to Main Golpu. Therefore, the interpretation of Main Golpu can be applied to both Golpu West and Golpu North.
An analysis of Nambonga North chalcopyrites shows that there are no clear relations between the elements; although few elements appear to correlate positively, there is no consistency. Locally high Au content is positively correlated with high As, Ag, Te and Bi contents. This mineral association can be interpreted as being related to the deposition of chalcopyrite during phyllic and/or chlorite-sericite alteration types.
A quantitative evaluation of the Au contribution from the pyrite to the bulk-rock Au content in each porphyry system shows that 90% comes from elsewhere. This means that Au is in the other sulphides such as bornite and is present as native Au. Figure 13 shows the graph of the Au versus Cu contents of large porphyry deposits in the Circum-Pacific region. The Cu content in the Golpu porphyries plots below the Grasberg deposit in Indonesia and above the Bingham deposit in USA, Batu-Hijau in Indonesia and Panguna and Ok Tedi in PNG. The Au content of the Golpu porphyry deposit is also slightly higher than Ok Tedi and Batu-Hijau. However, the Nambonga North Au is higher than all three deposits including the Cadia Hill deposit in Australia. As alluded to earlier, the high Au content was deposited during the phyllic alteration assemblage and/or the chlorite-sericite alteration.
Sulphur isotope studies confirmed that the high Cl contents corresponded to fluid inclusions with high salinity brines ranging between 40 and 74 wt%, with the NaCl equivalents trapped in quartz formed during potassic alteration at 423 to 600 °C [28]. While the presence of chlorine implies that the magmatic-hydrothermal fluids depositing secondary biotites and phlogopites during the potassic alteration were enriched in chloride ions and saline, the magmatic–hydrothermal fluids also transported Au as chloride complexes.
Similar to the study undertaken by [27] and as the hydrothermal pyrite suggests, Cu and Au occur as micro- to nano-sized particles of chalcopyrite and native Au (or Au tellurides) while As occurs as a structurally bonded element in pyrite. Hence, this clearly confirms that pyrite controls metal speciation and partitioning during porphyry Cu mineralisation [27].

4.3. Porphyry-Related Alteration and Mineralisation

4.3.1. Potassic Alteration

Potassic alteration is comprised of secondary biotite-quartz-magnetite ± K-feldspar ± anhydrite mineral assemblage. Secondary biotite is paragenetically the earliest mineral to be deposited, followed by quartz veinlets, magnetite ± quartz and anhydrite ± quartz. Quartz gradually forms dense stock-work or occurs as sheeted veins with K-feldspar selvages. Most quartz veins correspond to A-, B- and D-type veins e.g., ref. [29], which are characterised by secondary biotite-quartz-magnetite-anhydrite-chalcopyrite-pyrite, quartz-molybdenite-pyrite ± anhydrite and quartz-sericite-chalcopyrite-pyrite mineral assemblages, respectively. Some of the ear-liest quartz veins are pale gray to grayish white, sinuous, associated with abundant magnetite, local plagioclase halos, barren of infill minerals and are cross-cut by late mineralised quartz veins; the former quartz veins could be a variant of the A-type vein or correspond to the M-type vein e.g., ref. [30].

4.3.2. Propylitic Alteration

The propylitic alteration was formed at about the same time as the potassic alteration via heat transfer but in a peripheral area [2]. This alteration type is subdivided into inner propylitic and outer propylitic based on the predominance of actinolite-epidote and chlorite-carbonate (mostly calcite), respectively, as index minerals [31]. The mineral assemblage of porphyry-related propylitic alteration is similar to that of sub-greenschist to greenschist metamorphic facies of the OSMC, making differentiation very difficult.

4.3.3. Chlorite-Sericite Alteration

Paragenetic work suggests that chlorite-sericite alteration may occur or is transitional between potassic and phyllic alteration [32]. It is considered to have formed after potassic alteration but before phyllic alteration. Chlorite replaces mafic minerals and sericite replaces plagioclase. Both mineral species are disseminated and fracture controlled. The condition and sequence of the formation of chlorite-sericite alteration in the evolution of the porphyry Cu system is similar to that described in [33].

4.3.4. Phyllic Alteration

The volatiles released during retrograde boiling (induced by the fracturing of the carapace or the cupola of the cooling porphyry) subsequently condensed upon interaction with groundwater. The condensated fluid attained its acidity due to the presence of HCl ± SO2 gas(es) and formed phyllic alteration as it migrated downwards, overprinting the potassic and inner propylitic alteration zones. The phyllic alteration is comprised of quartz, sericite and pyrite, and is accompanied by varying amounts of chlorite and illite. The occurrence of sericite indicates a pH of 4–5.

4.3.5. Relation of the Wafi High Sulphidation Au Deposits to the Golpu Porphyry Cu-Au System

Highly acidic, oxidised fluids generated after the formation of the potassic alteration produced a downward zonation from vuggy silica/quartz, to advanced argillic (vuggy silica-alunite ± pyrophyllite), through intermediate argillic (dickite-kaolinite ± sericite ± illite) and to argillic (smectite-illite-chlorite ± carbonate) zones at deeper depths [34]. This zonation indicates an increasing pH, a decreasing temperature and increasing wall-rock dilution as the acidic fluids condensed from rising magmatic volatiles that migrated downwards via fractures, fracture systems or faults [2]. Figure 14 is a diagram showing the paragenesis of the porphyry-related alteration-mineralisation in the Golpu and Nambonga North porphyry Cu-Au deposits.
Deposition of Au occurred after the high sulphidation alteration. Most (refractory) Au resides in arsenic-rich pyrite and minor enargite-luzonite in the intermediate argillic zone e.g., ref. [34]. Such an occurrence is unusual because most of the Au is in the central vuggy silica of similar deposits such as Lepanto in the Philippines e.g., ref. [35], Nena in PNG e.g., ref. [36] and Nansatsu in southern Kyushu Island, Japan e.g., ref. [37]. Therefore, Au was transported by magmatic volatiles exsolved via boiling to permit deposition due to condensation and the chemical reaction with previously acid altered wallrocks in the intermediate argillic zone cf., [38].
Sulphur isotope signatures of chalcopyrite and chalcopyrite-pyrite at Golpu range from 0.23 to 0.60 δ34S; the sulphur isotope signatures of anhydrite and chalcopyrite-pyrite at Nambonga North are 10.06–11.74 δ34S and 2.16 δ34S, respectively [28]. The range of sulphur isotope signatures approaches zero, which implies that sulphur and mineralising fluids were derived from a magmatic source. It also means that metals such as Cu and Au are of magmatic origin too e.g., [39]. The anhydrite-chalcopyrite and anhydrite-pyrite mineral pairs from Nambonga North are considered to be in chemical equilibrium and estimate sulphur isotope fractionation temperatures of 551–634 ± 40 °C and 522–603 ± 40 °C, respectively [28], estimating the temperature of Cu–Au mineralisation at Nambonga North. Under such a high temperature range (i.e., >350 °C), Cu and Au at Nambonga North and by inference Golpu, would be mostly transported as chloride complexes such as AuCl2 [39]. However, bisulphide complexes may be the main carriers of Au and Cu during sericite-chlorite and quartz-sericite-pyrite alteration events if the temperatures were less than 500–300 °C. This means the potassic-related Au and Cu would be remobilised, transported as a bisulphide complex (e.g., Au(HS)2, [39]) and redeposited.

5. Conclusions

The porphyry-related alteration and mineralisation are centred at the Golpu Porphyries and Nambonga North Porphyry, which are separate porphyry systems but cooling intrusions responsible for supplying magmatic-hydrothermal fluids may be sourced from the same, larger magma chamber at depth. Although the characteristics of the alteration-mineralisation are similar, there are some major differences. The Golpu porphyry deposit has a diatreme emplaced before the expulsion of the highly oxidised, magmatic-hydrothermal fluids and late high sulphidation epithermal system. In contrast, Nambonga North has no diatreme and high sulphidation epithermal alteration–mineralisation.
Copper-gold mineralisation at both the porphyry centres is characterised by pyrite-chalcopyrite-bornite-gold-molybdenite mineral assemblage that is hosted in sheeted quartz veins and fractures. Pyrite and chalcopyrite are the main ore minerals. Native Au also occurs as minute inclusions in chalcopyrite, pyrite and bornite. Most ore mineralisation is closely associated with and occurred after the potassic alteration. Some of the Au and Cu deposited after the potassic alteration were remobilised and re-deposited as components of the mineralisation associated with the sericite-chlorite and/or phyllic alterations.
Petrographic studies and age dating [32] including the sulphur isotope studies [28] confirm that the Wafi high sulphidation epithermal Au deposit overprints and is spatially, temporally and genetically related to the Golpu porphyry system. Similar observations have been noted by previous investigators such as [18,20,33,40].

Author Contributions

Conceptualization, M.L. and J.O.E.; methodology, M.L. and J.O.E.; software, M.L.; validation, M.L. and J.O.E.; formal (lab) analysis, M.L.; investigation, M.L.; resources, M.L. and J.O.E.; data curation, M.L. and J.O.E.; writing—original draft preparation, M.L.; writing—review and editing, J.O.E.; visualization, M.L.; supervision, J.O.E.; project administration, M.L. and J.O.E. All authors have read and agreed to the published version of the manuscript.

Funding

The postgraduate studies of ML at the Earth Sciences Division, University of Papua New Guinea, was funded by GEOMAP Project F under the auspices of Papua New Guinea Mineral Resources Authority. European Union provided funds for the GEOMAP Project F.

Data Availability Statement

Data supporting this research paper may be obtained with permission from the Mineral Resources Authority, Email: [email protected].

Conflicts of Interest

M.L. and J.O.E. declare no conflict of interest.

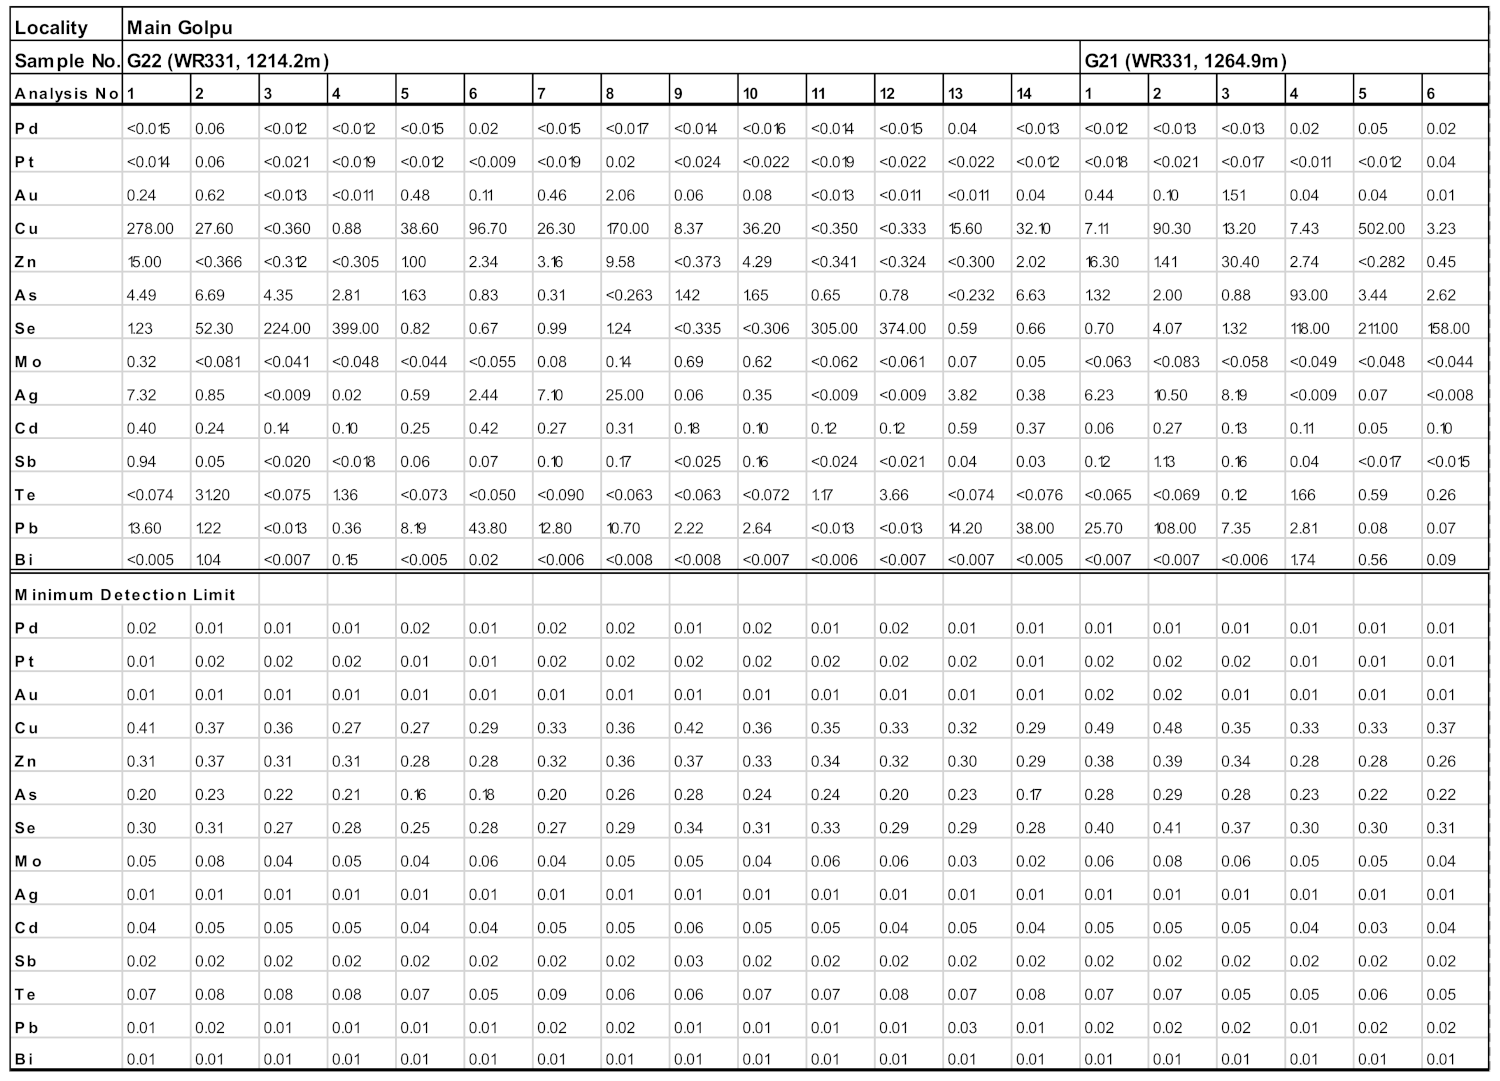
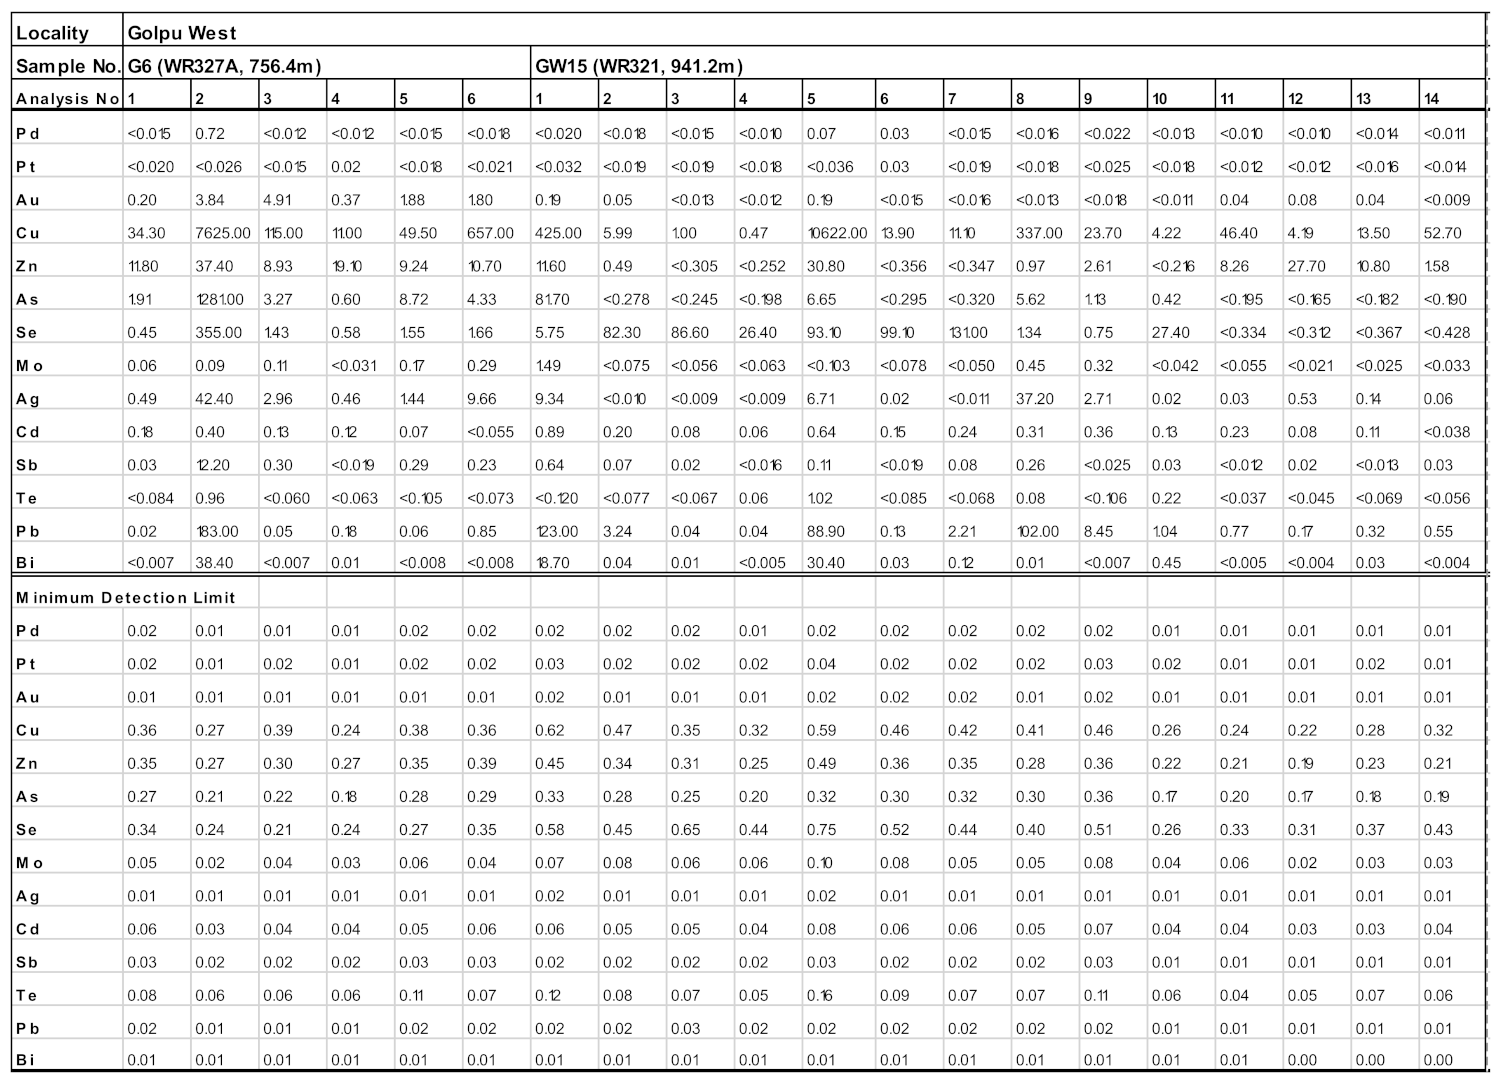
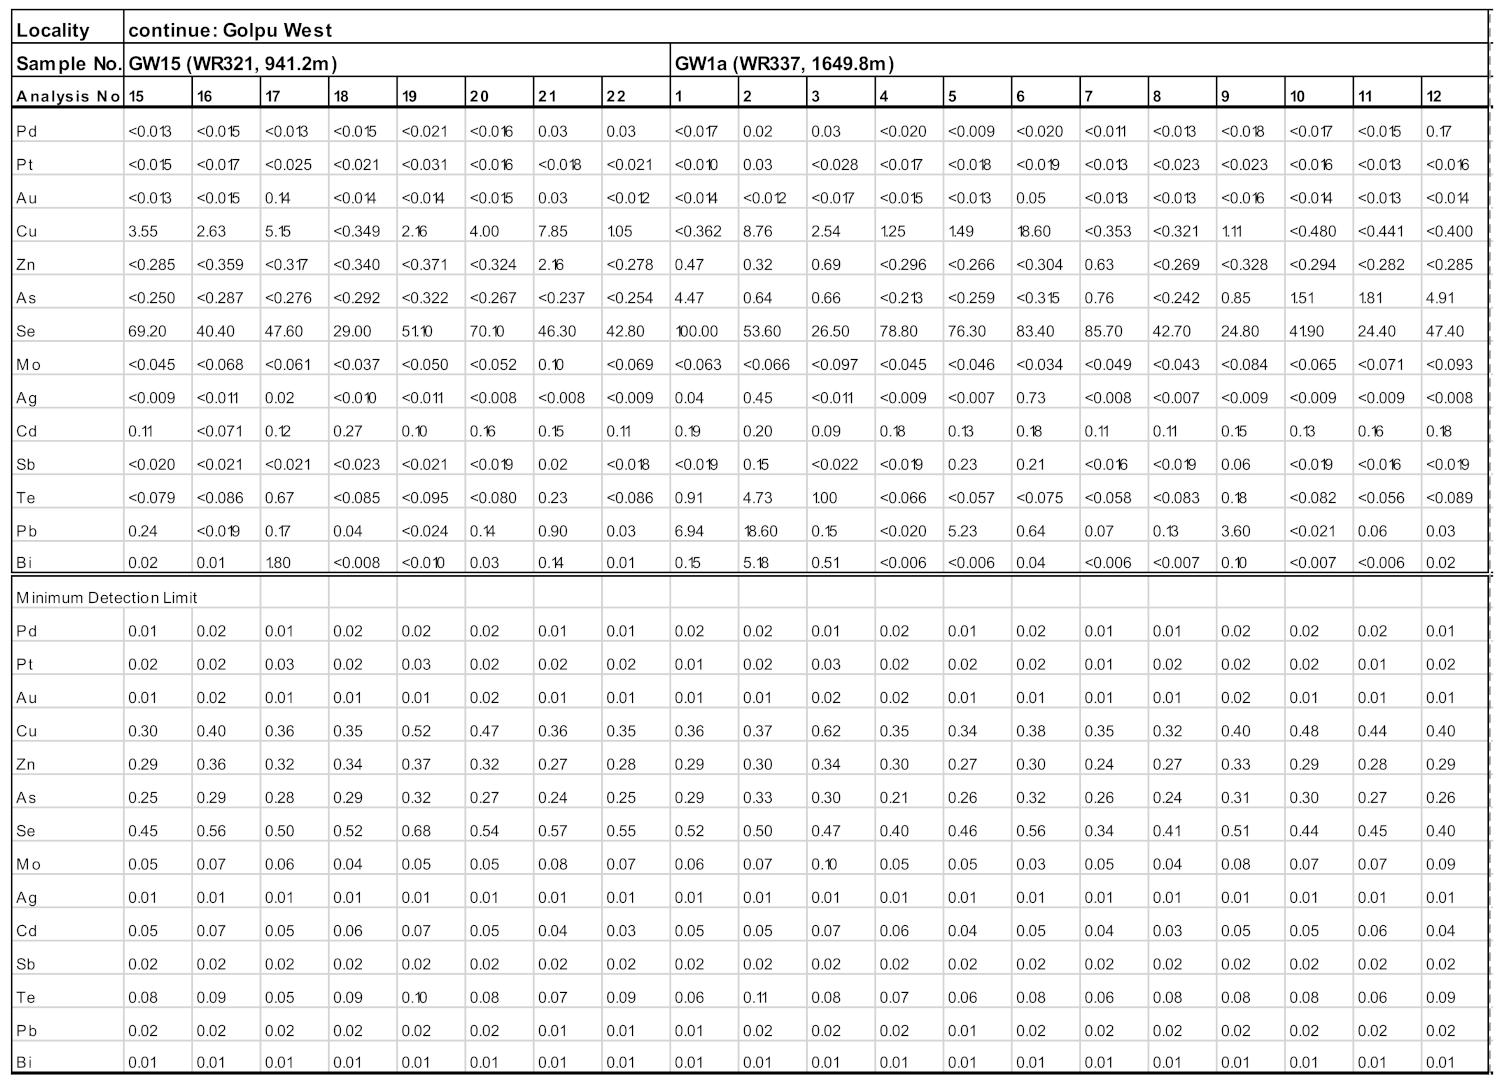
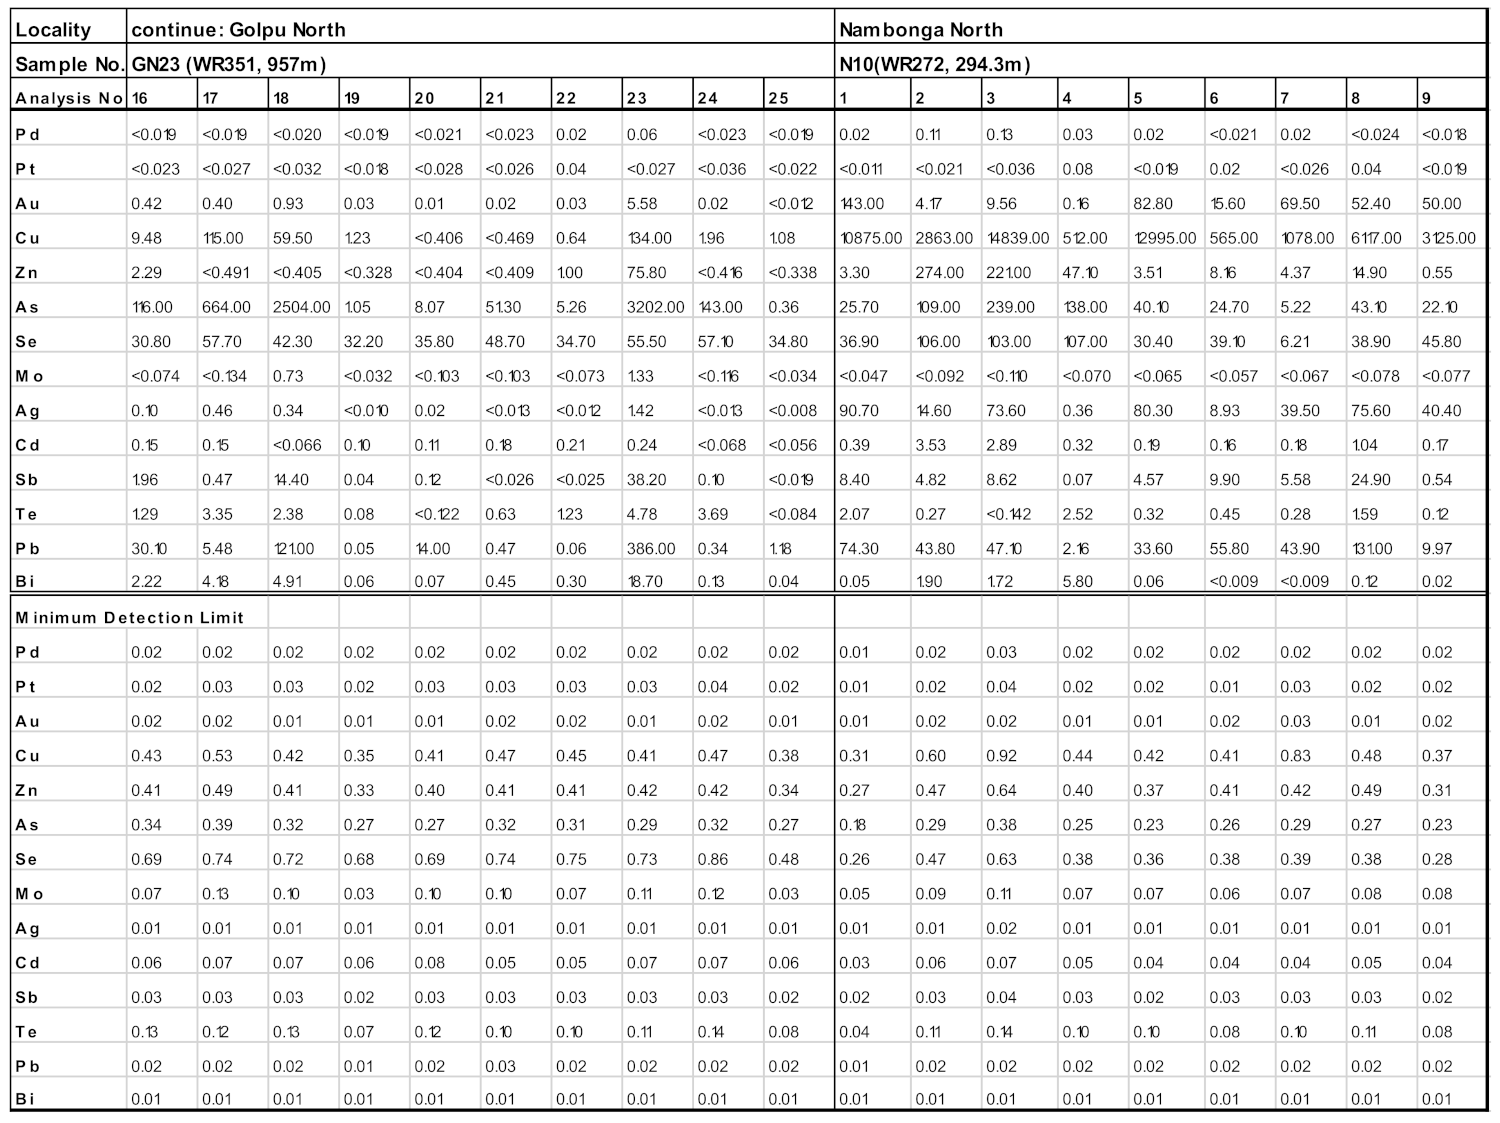
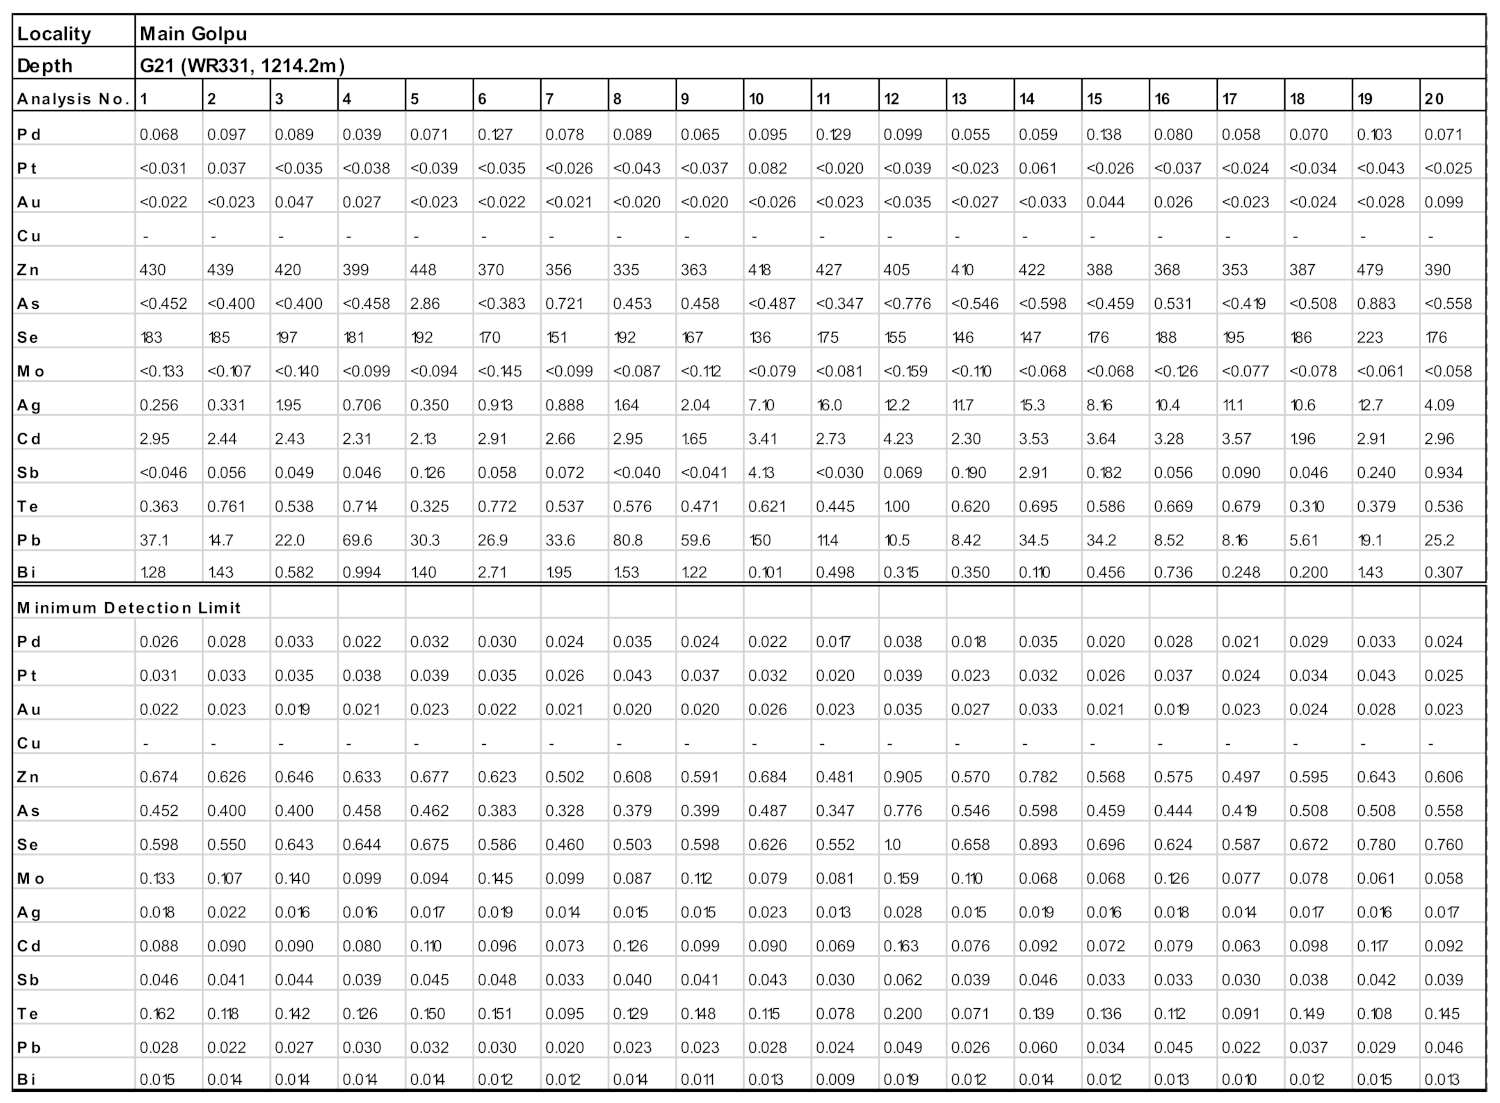
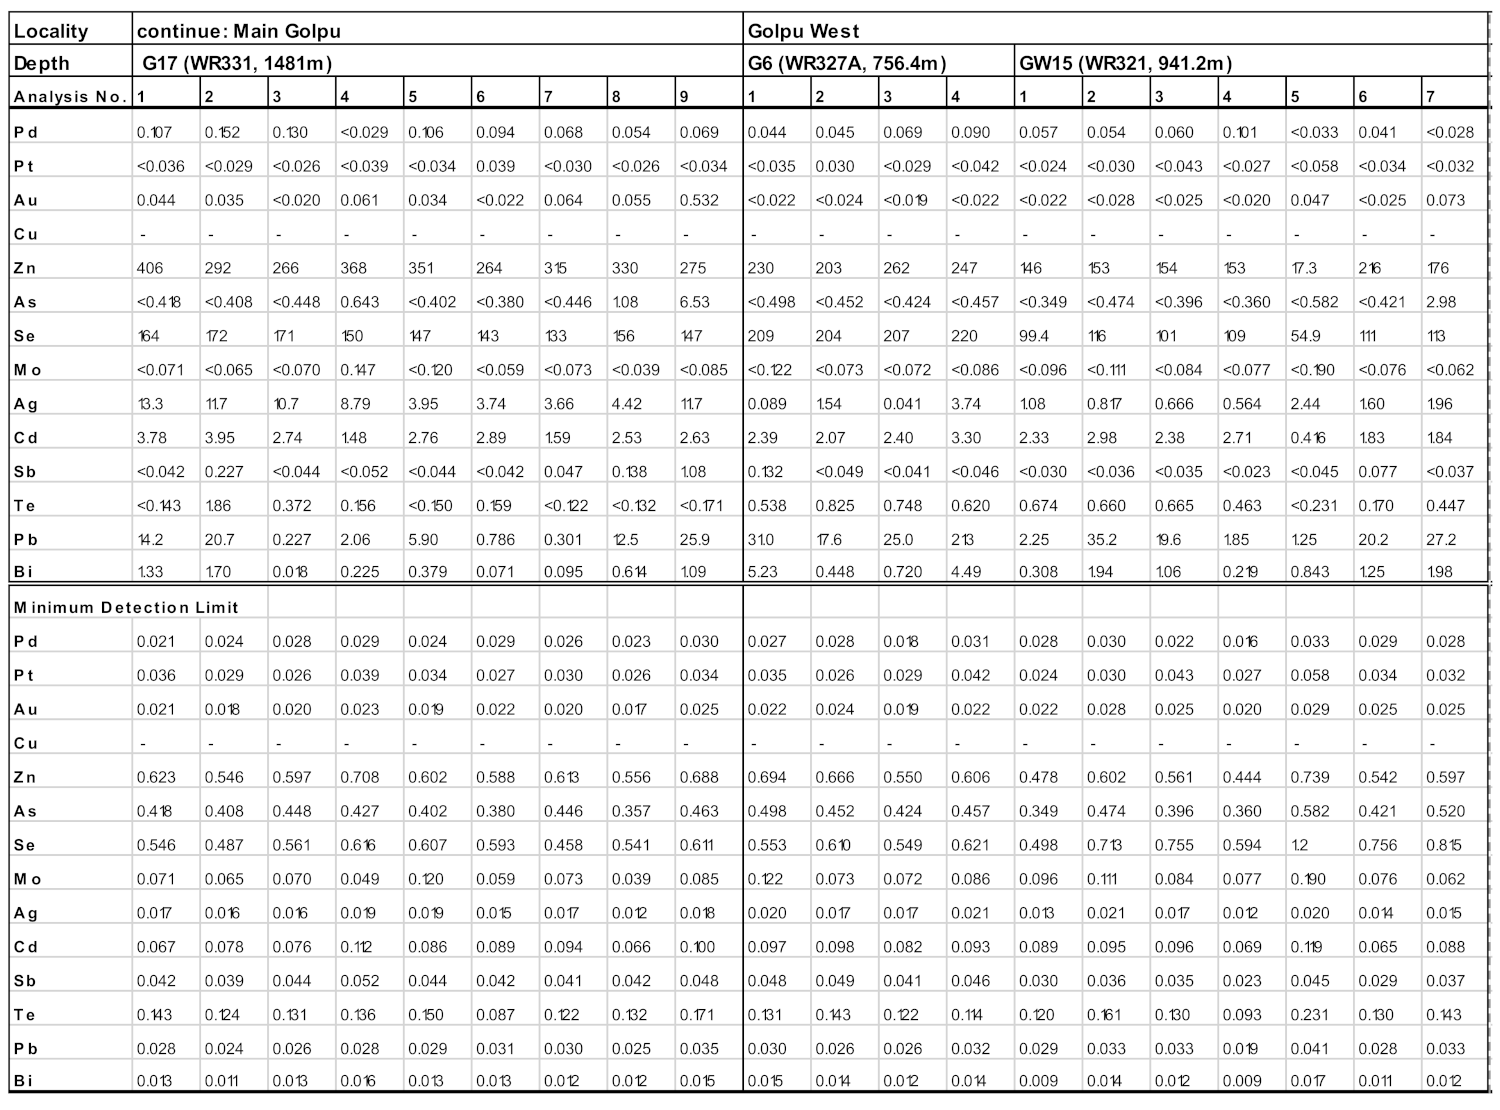
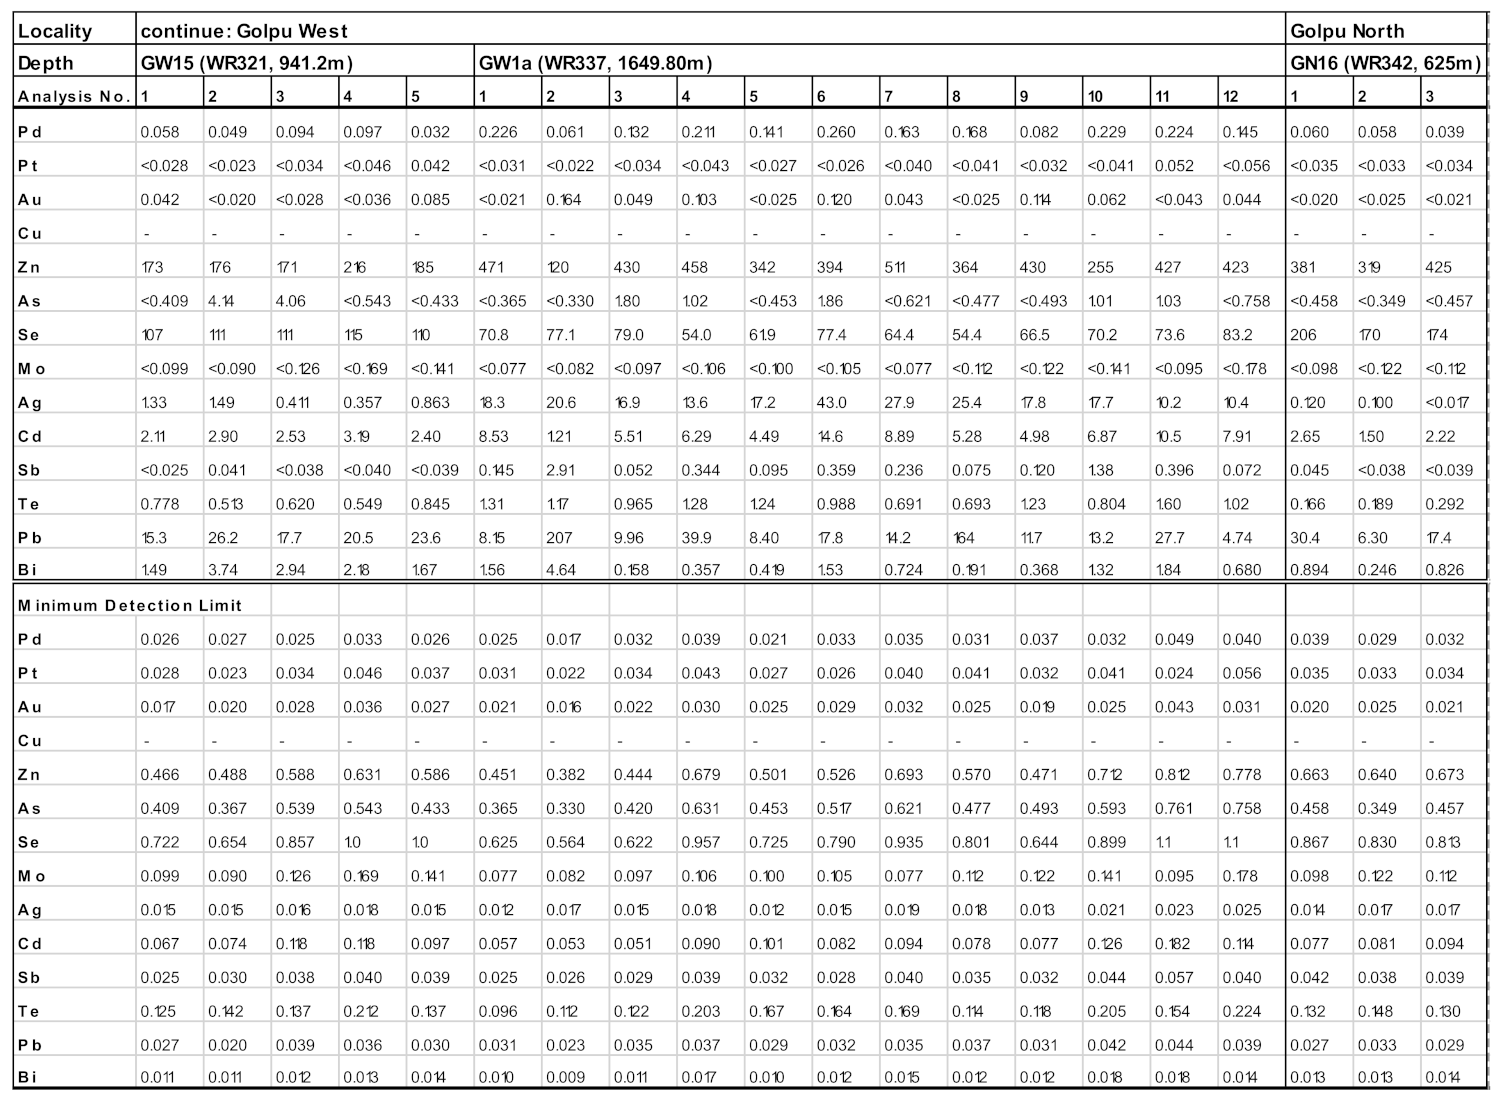
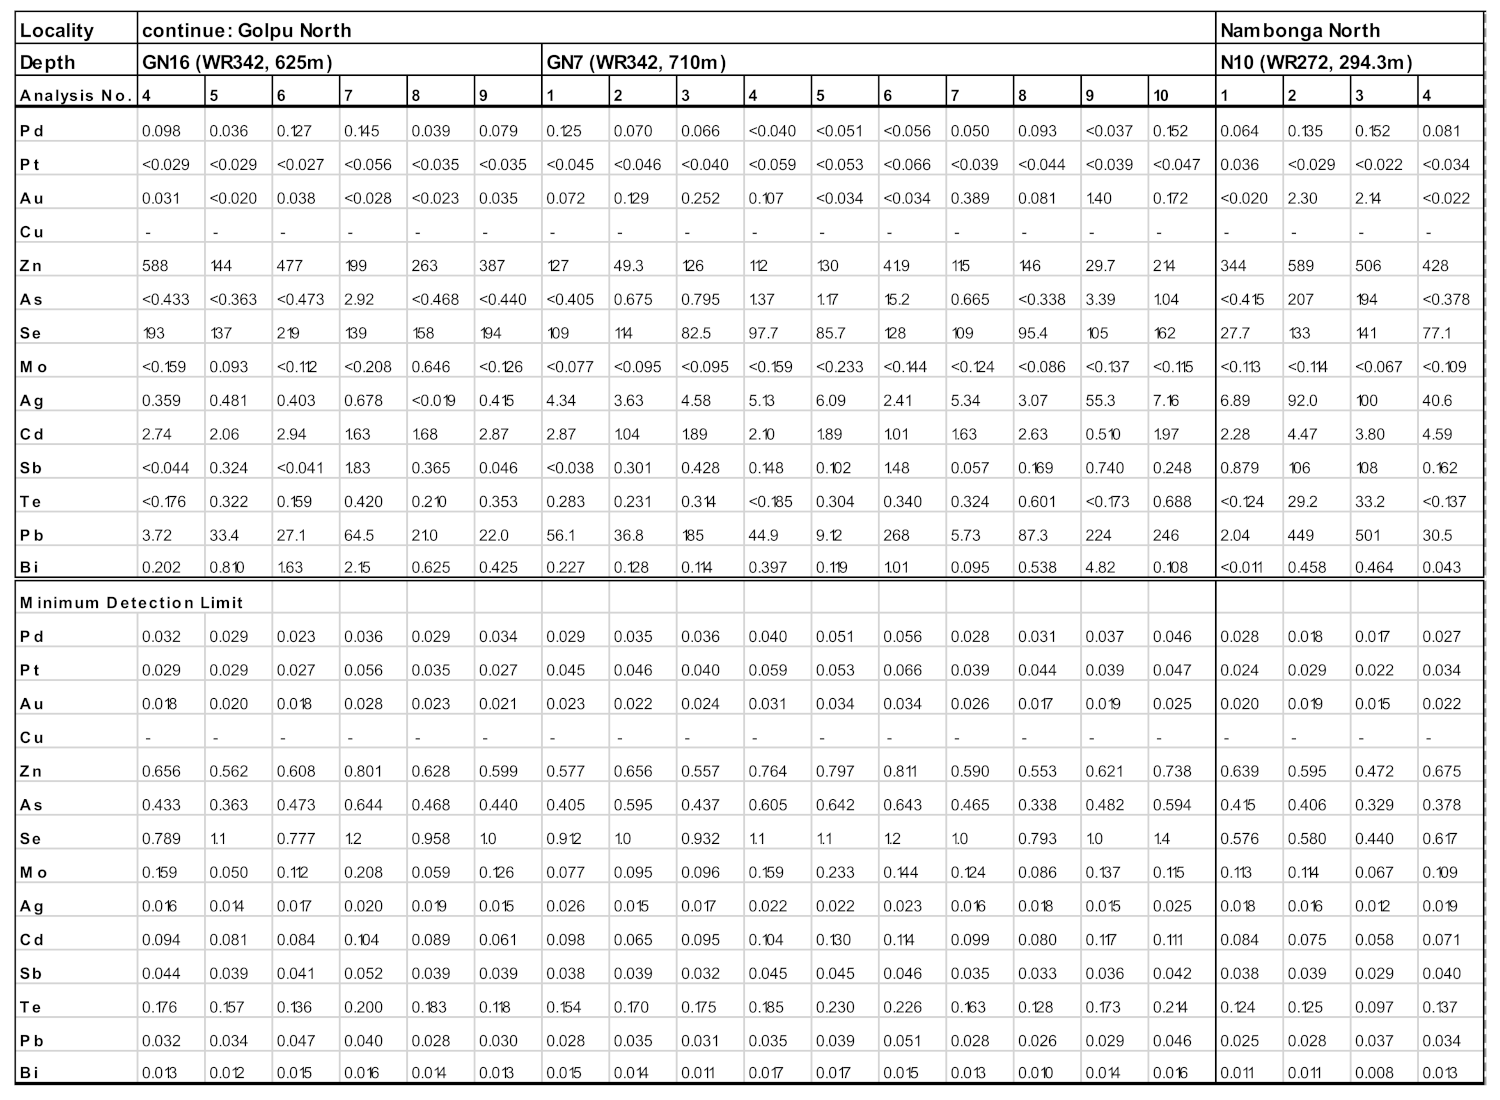
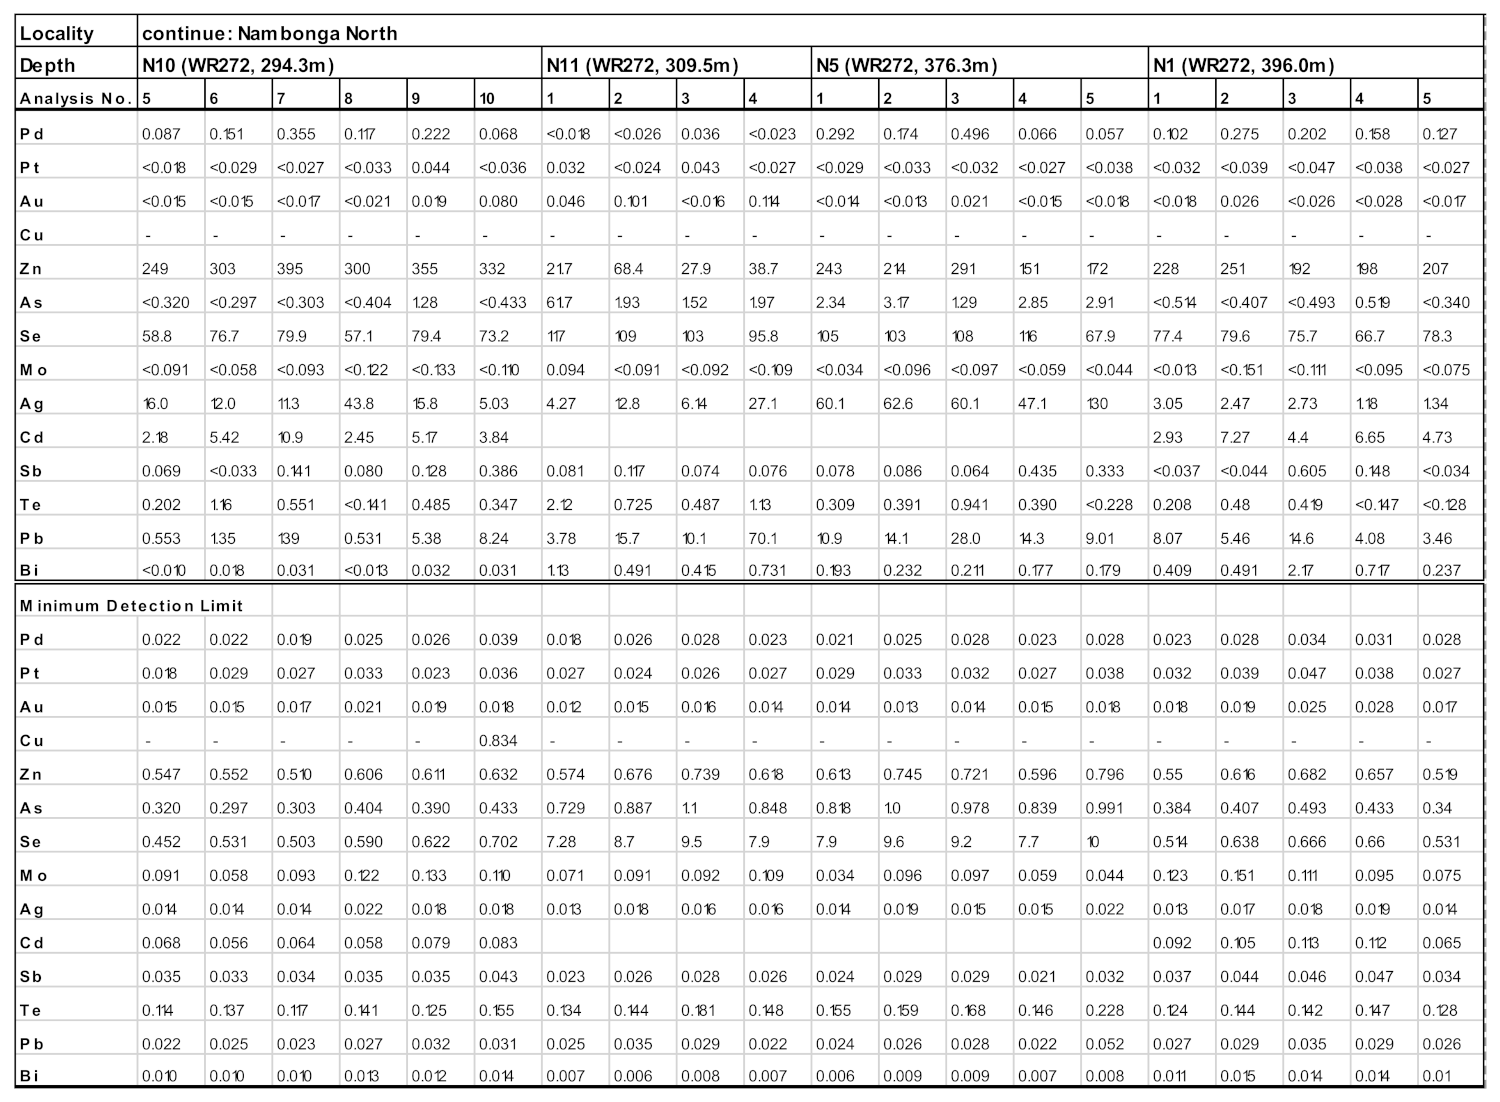
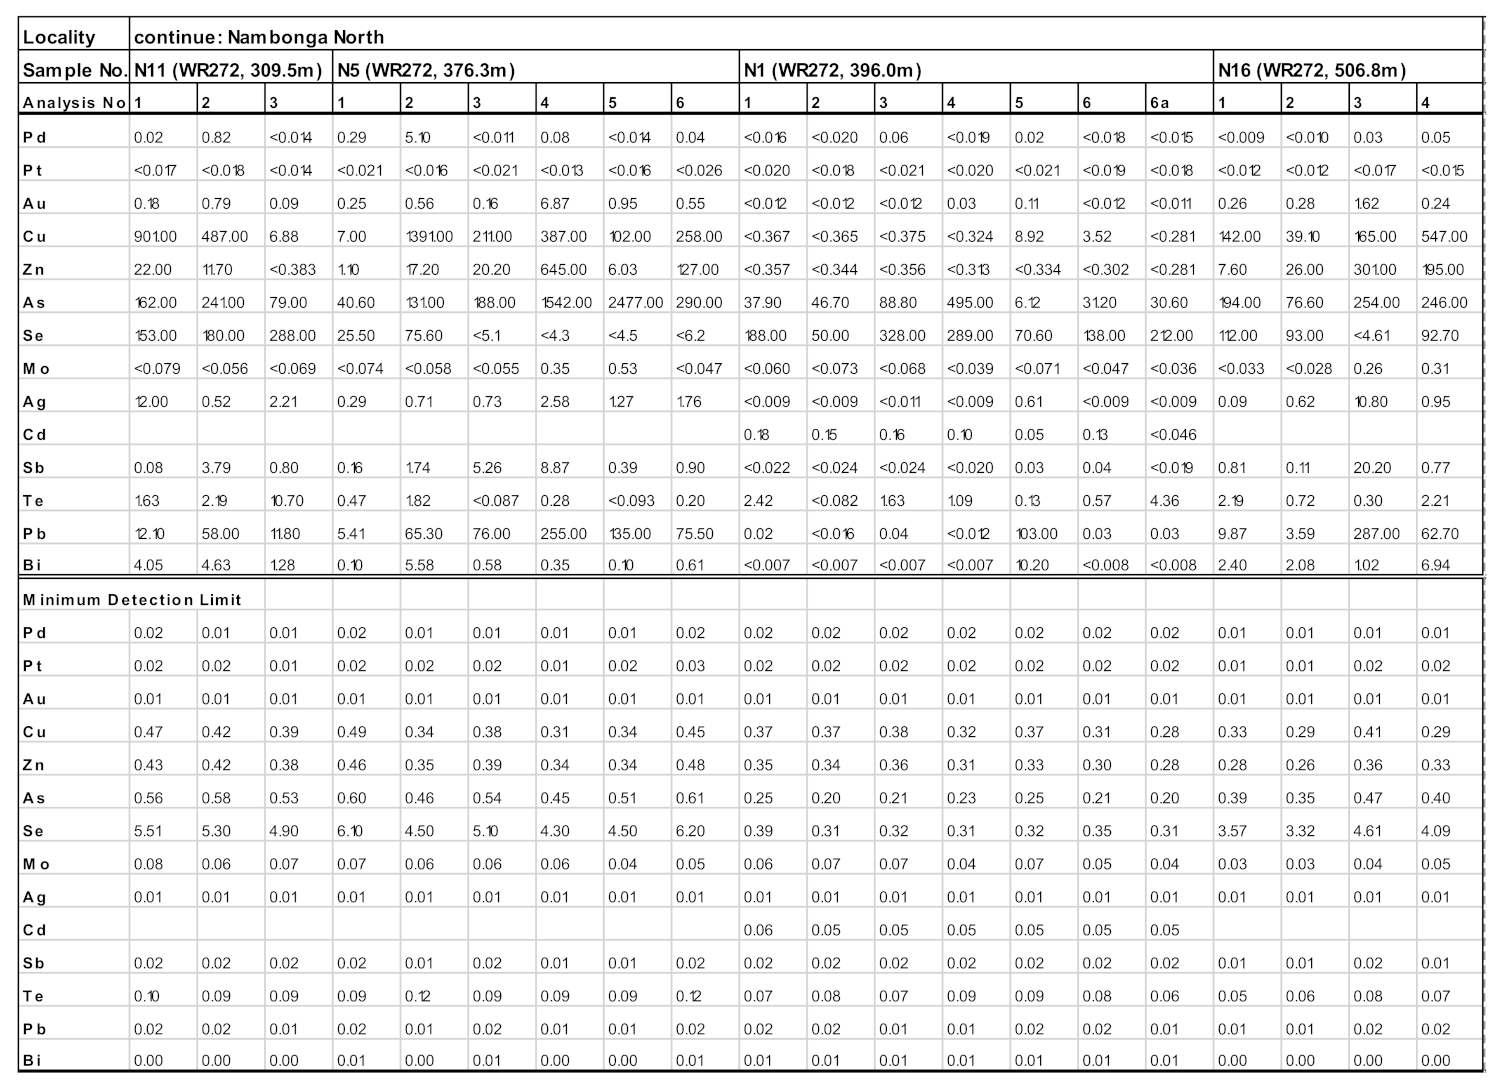
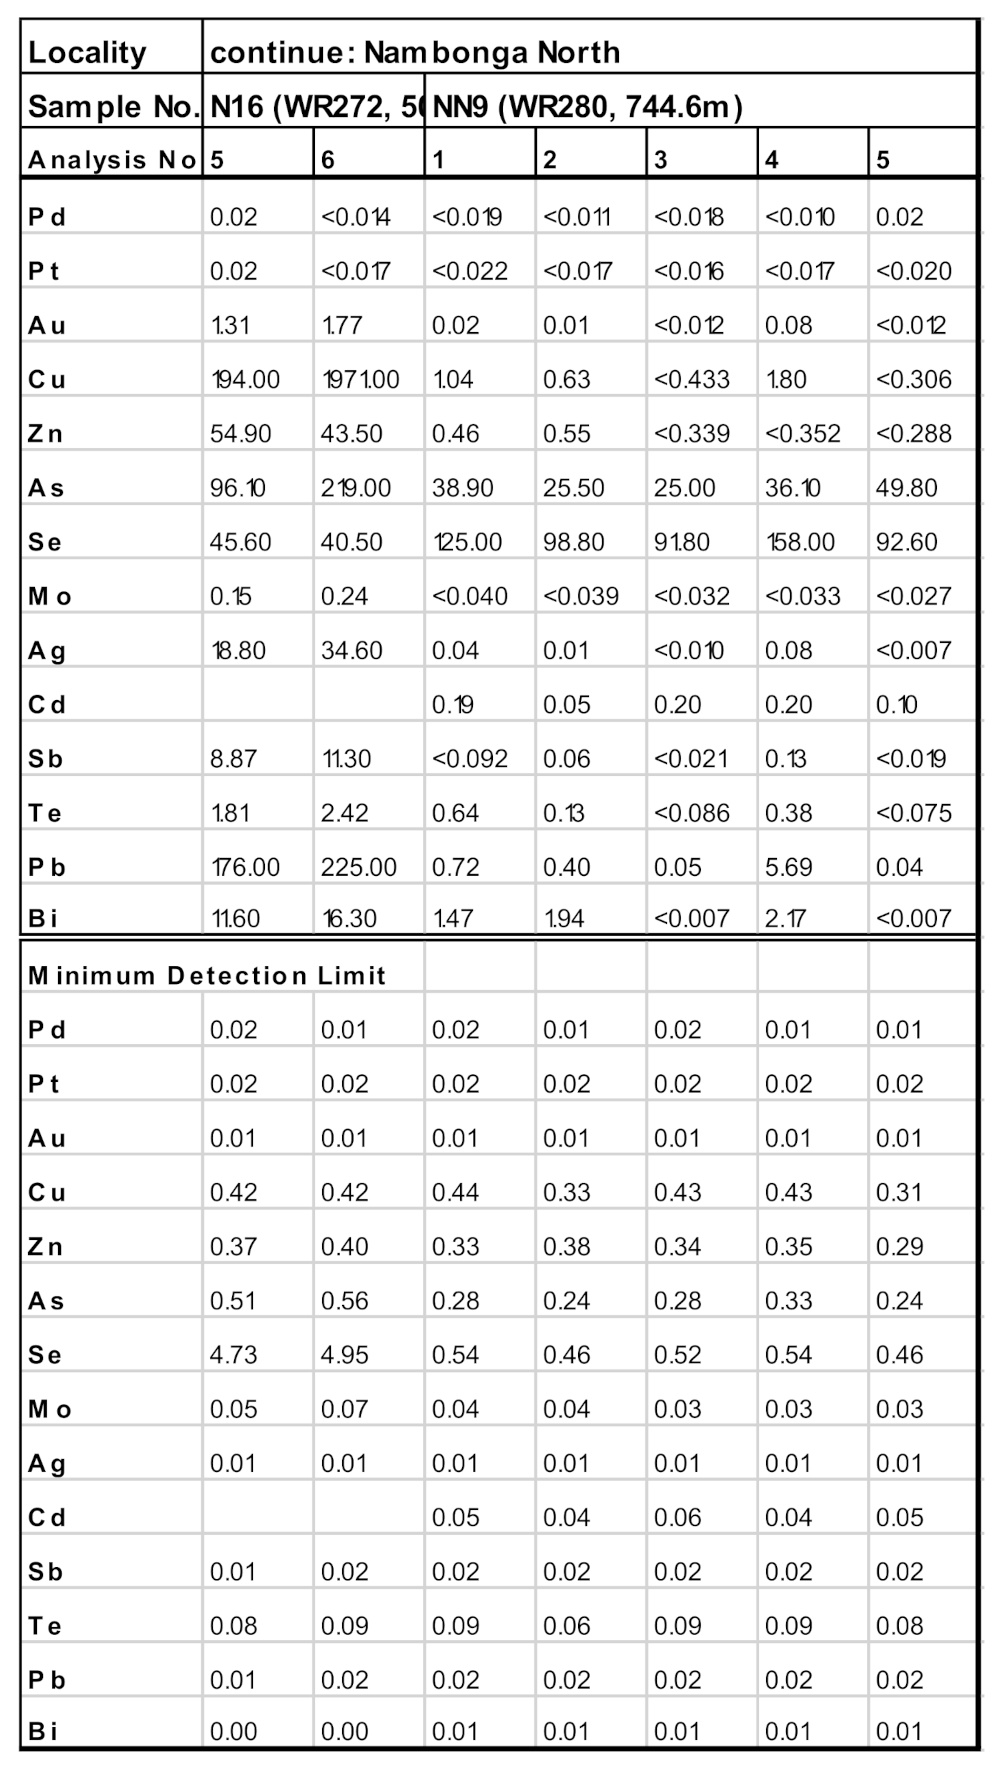
Appendix A. LA-ICPMS Results from the Pyrite Samples from the Golpu and Nambonga North Porphyry Deposits, WGMD, PNG

Figure A1. LA-ICPMS trace element results of pyrite (all results are in ppm).
Geosciences 11 00335 g0a1aGeosciences 11 00335 g0a1bGeosciences 11 00335 g0a1cGeosciences 11 00335 g0a1dGeosciences 11 00335 g0a1eGeosciences 11 00335 g0a1fGeosciences 11 00335 g0a1gGeosciences 11 00335 g0a1hGeosciences 11 00335 g0a1i

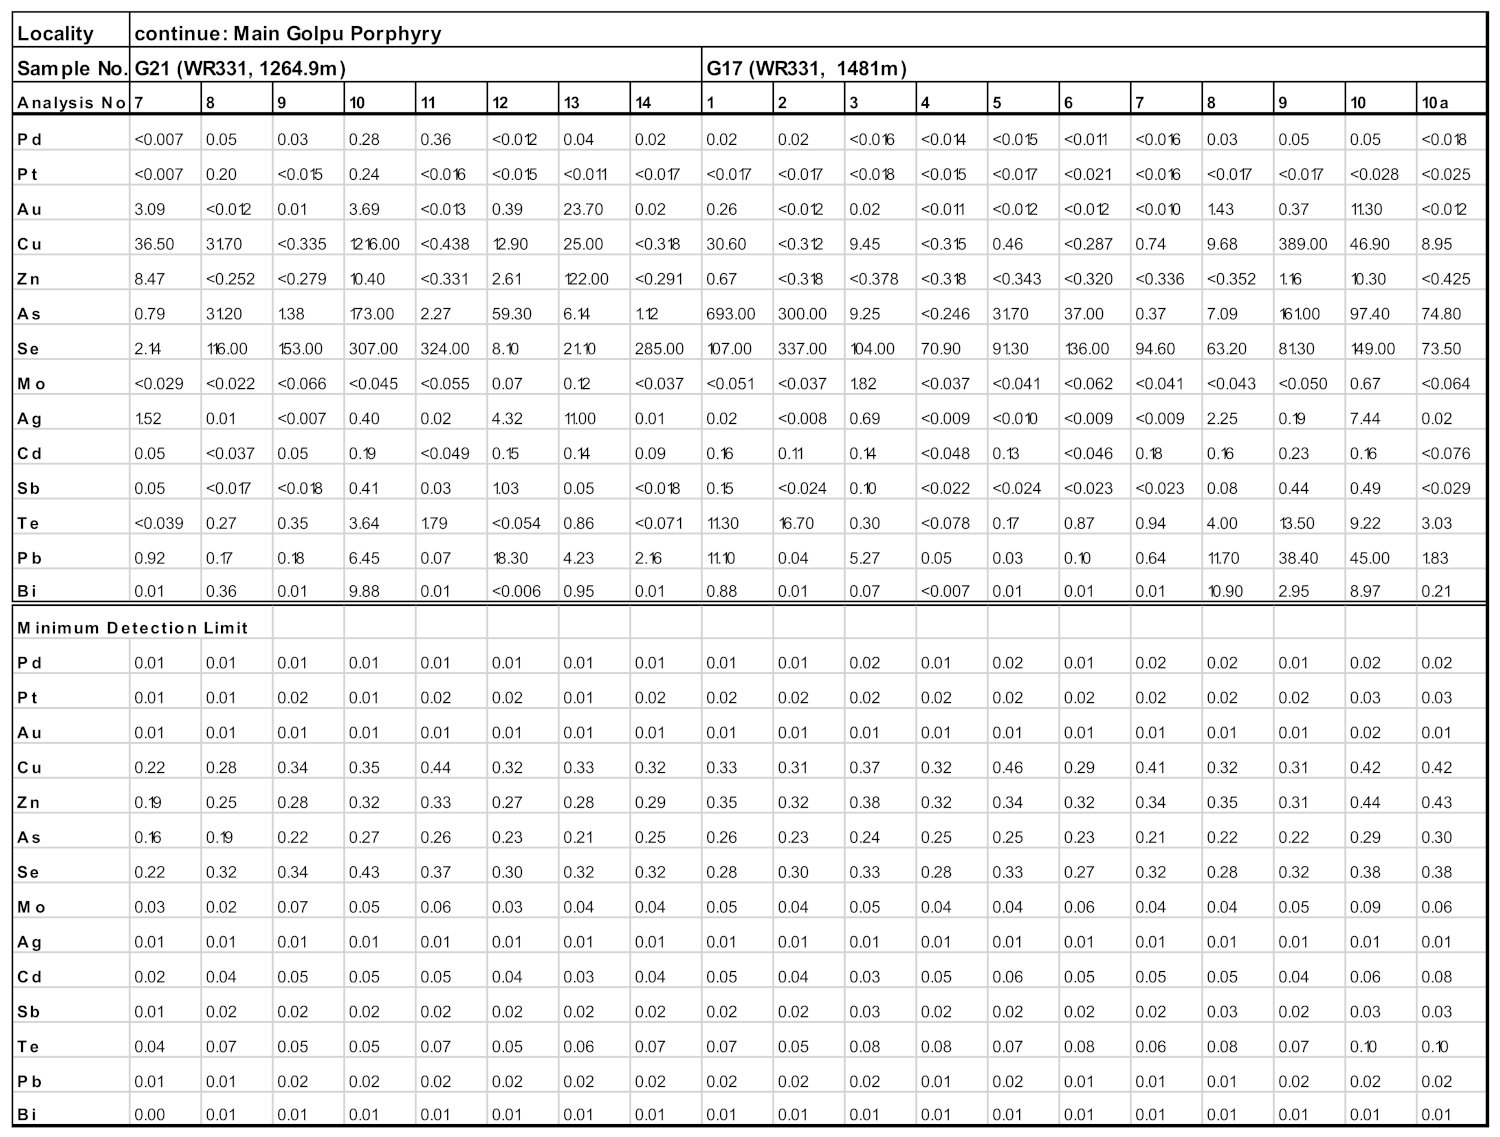
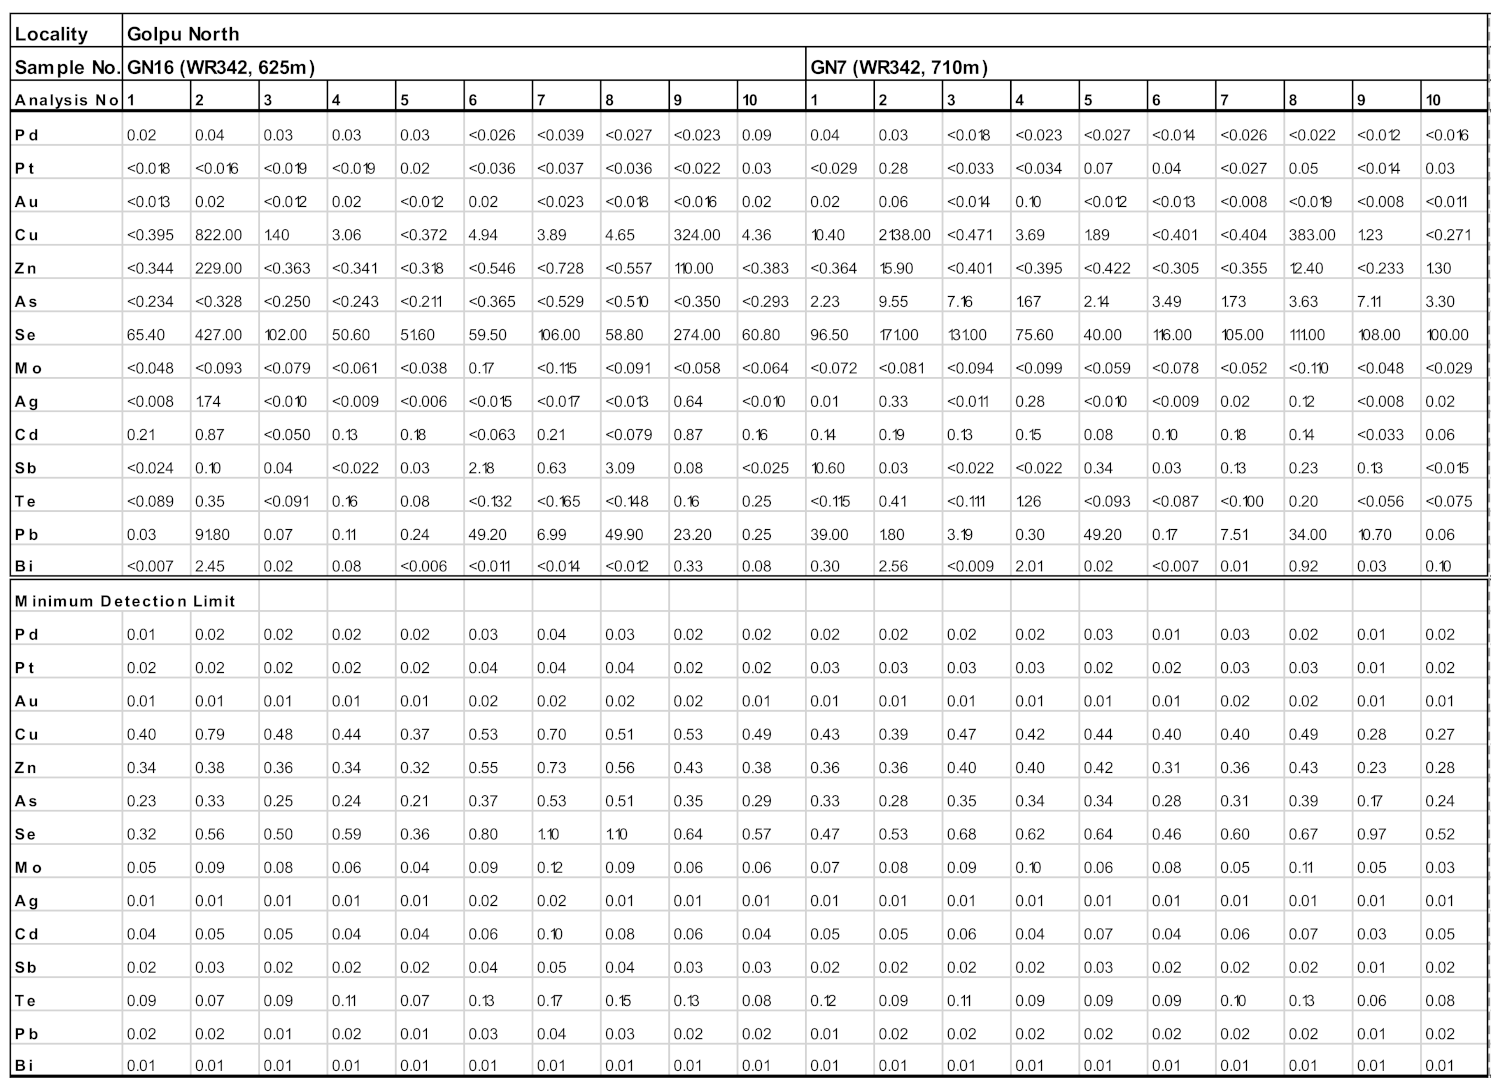
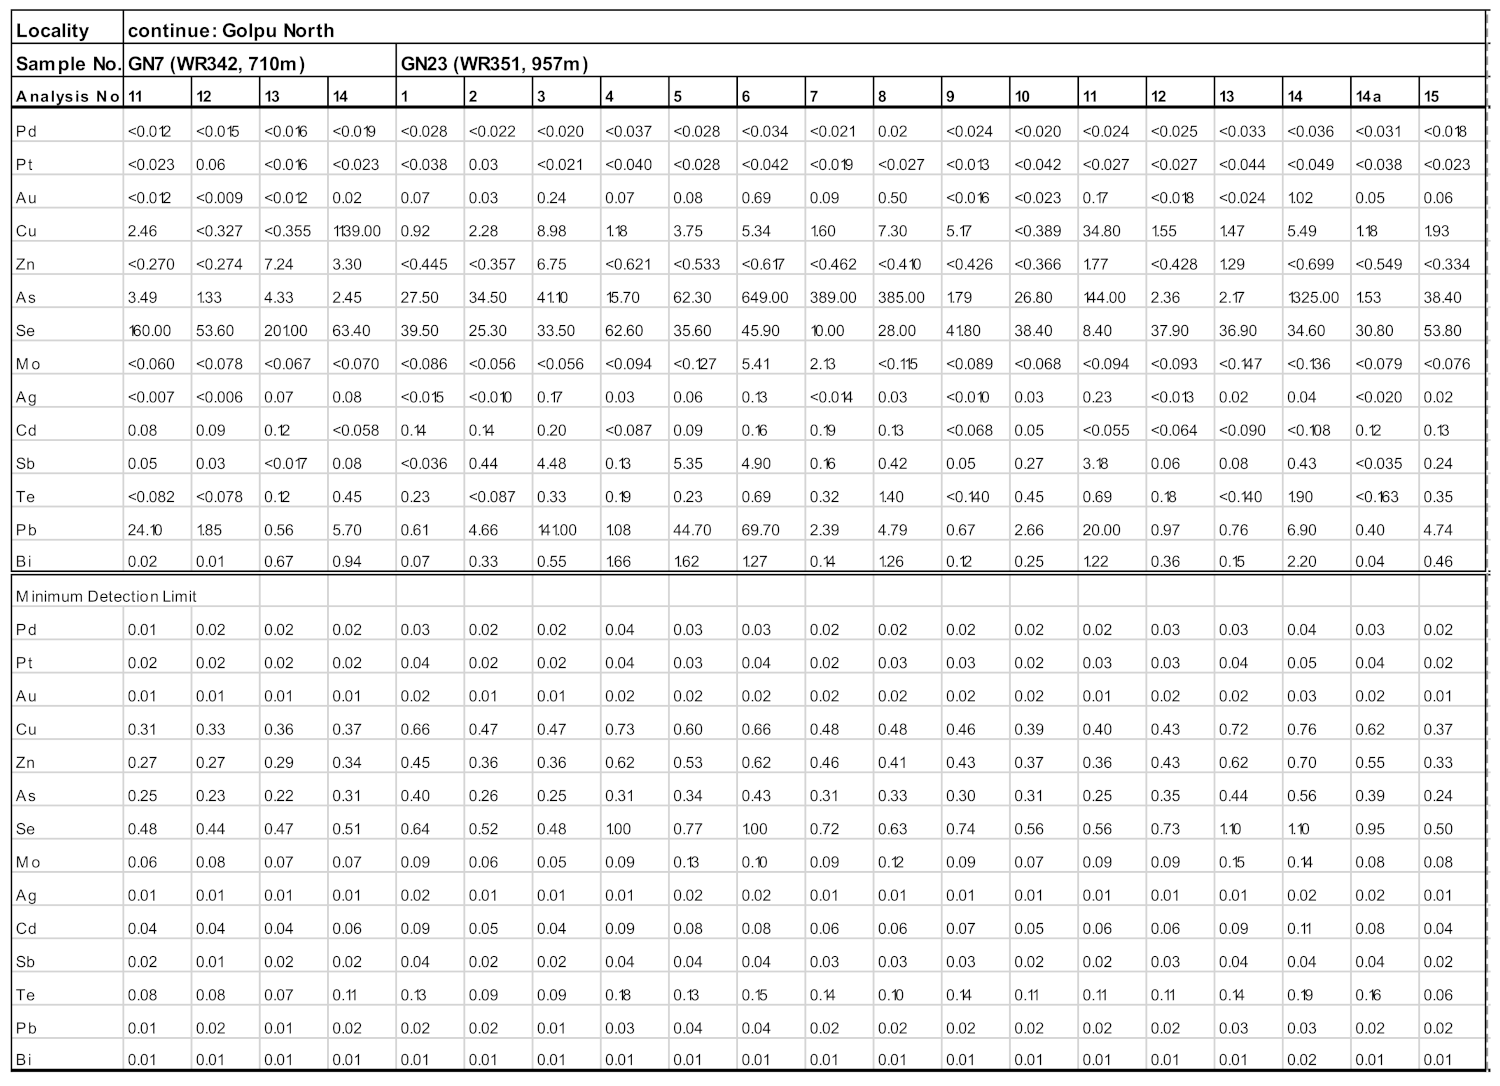
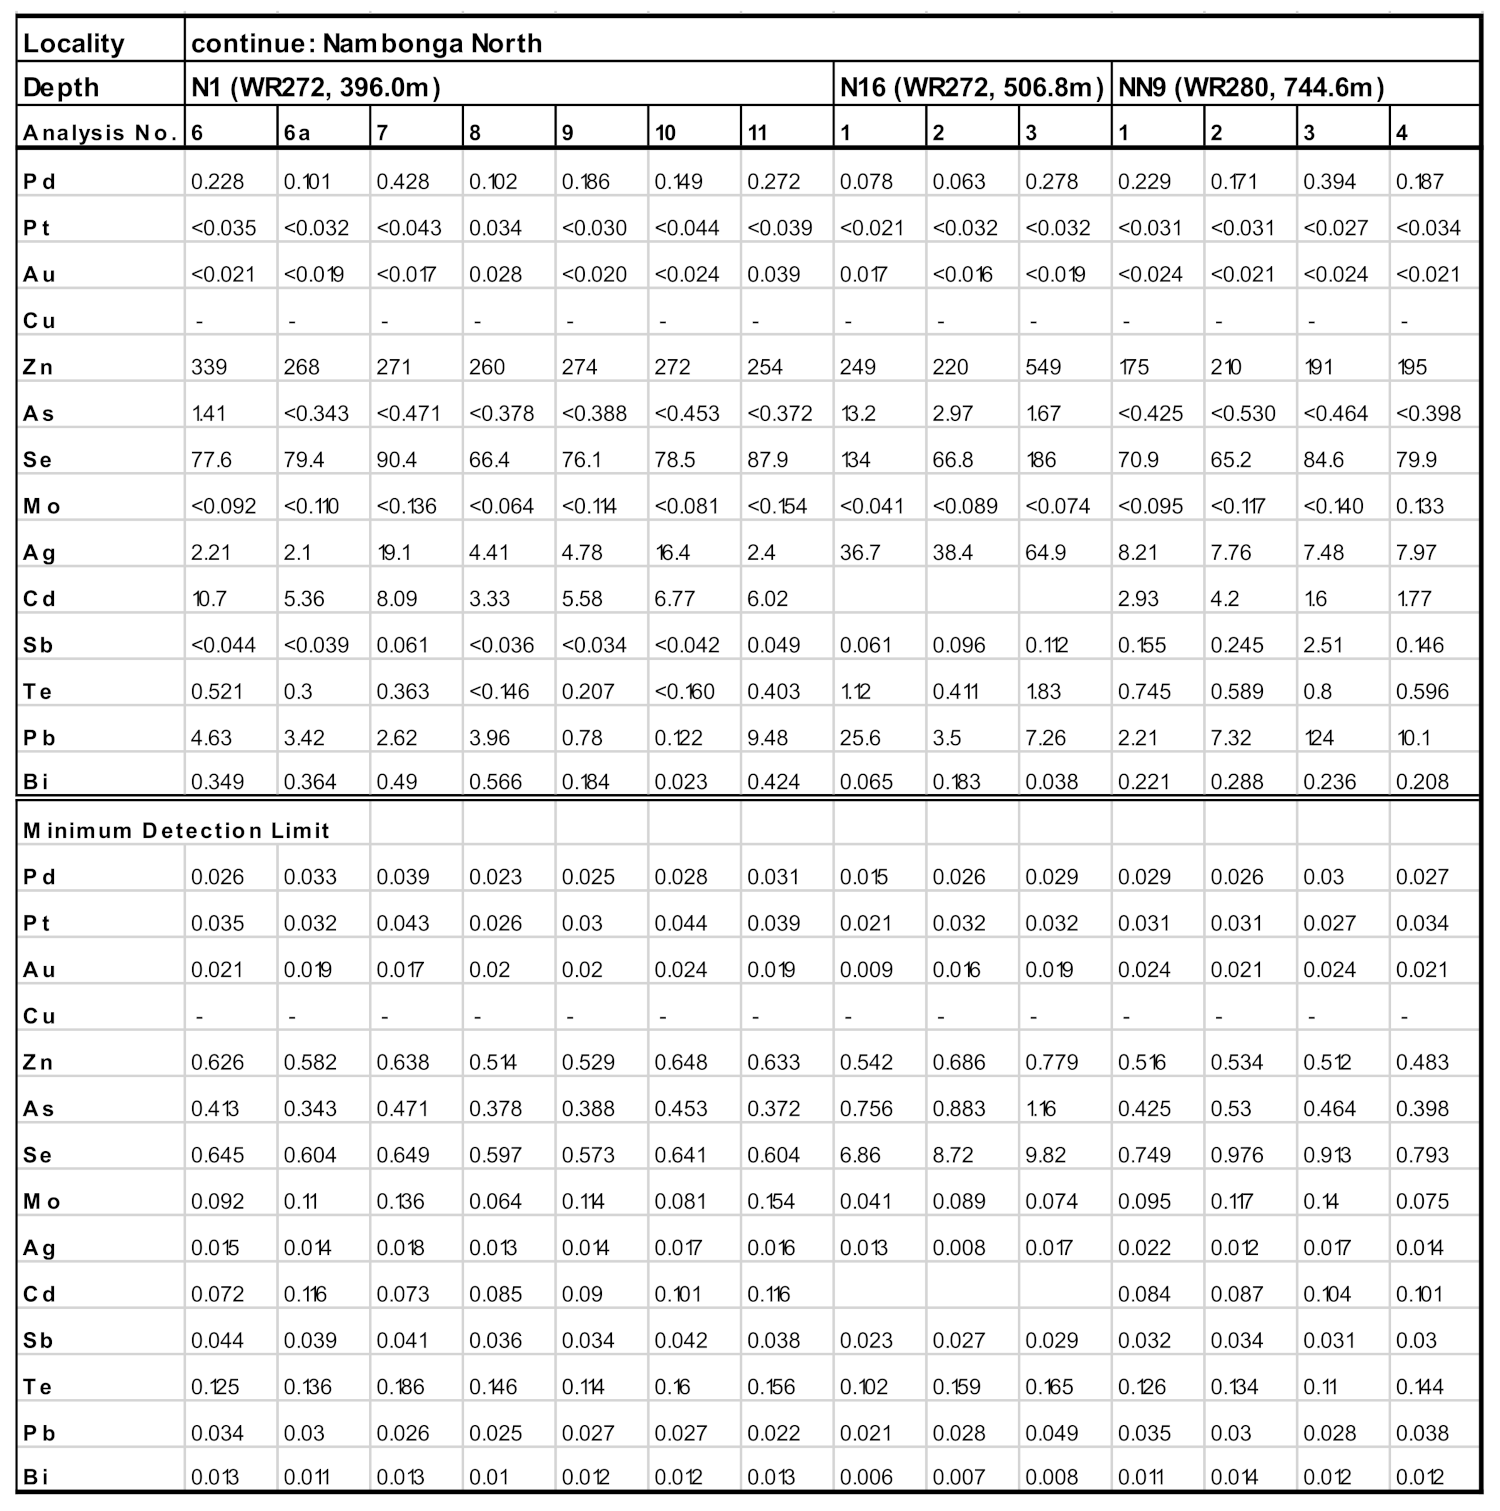
Appendix B. LA-ICPMS Results from the Chalcopyrite Samples from the Golpu and Nambonga North Porphyry Deposits, WGMD, PNG

Figure A2. LA-ICPMS trace element results of chalcopyrite (all results are in ppm).
Geosciences 11 00335 g0a2aGeosciences 11 00335 g0a2bGeosciences 11 00335 g0a2cGeosciences 11 00335 g0a2dGeosciences 11 00335 g0a2eGeosciences 11 00335 g0a2f

References

  1. Corbett, G.J. Regional structural control of selected Cu/Au occurrences. In Proceedings of the Papua New Guinea Geology, Exploration and Mining Conference, Lae, Papua New Guinea, 19–21 August 1994; Rogerson, R., Ed.; The Australasian Institute of Mining and Metallurgy: Melbourne, Australia, 1994; pp. 57–70. [Google Scholar]
  2. Corbett, G.J.; Leach, T.M. Southwest Pacific Au-Cu Systems: Structure, Alteration and Mineralization; Special Publication 6; Society of Economic Geologists: Littleton, CO, USA, 1998; Volume 238. [Google Scholar]
  3. Leach, T.M. Evolution of selected porphyry Cu-Au systems in the southwest Pacific region and its relevance to exploration Environments. In Proceedings of the Pacrim’99, Bali, Indonesia, 10–13 October 1999; The Australasian Institute of Mining and Metallurgy: Melbourne, Australia, 1999; pp. 211–225. [Google Scholar]
  4. Klootwijk, C.; Giddings, J.; Pigram, C.; Loxton, C.; Davies, H.L.; Rogerson, R.; Falvey, D. Papua New Guinea Highlands: Plaeomagnetic constraints on terrane tectonics. Tectonophysics 2003, 362, 239–272. [Google Scholar] [CrossRef]
  5. Davies, H.L. The Geology of New Guinea—The Cordilleran Margin of the Australian Continent; Episodes; International Union of Geological Sciences: Chuncheon, Korea, 2012; Volume 35, pp. 87–102. [Google Scholar]
  6. Holm, R.J.; Rosenbaum, G.; Richards, S.W. Post 8 Ma reconstruction of Papua New Guinea and Solomon Islands: Microplate tectonics in a convergent plate boundary setting. Earth Sci. Rev. 2016, 156, 66–81. [Google Scholar] [CrossRef] [Green Version]
  7. Holm, R.J.; Tapster, S.; Jelsma, H.A.; Rosenbaum, G.; Mark, D.F. Tectonic evolution and Cu-Au metallogenesis of the Papua New Guinea and Solomon Islands region. Ore Geol. Rev. 2019, 104, 208–226. [Google Scholar] [CrossRef] [Green Version]
  8. Newcrest Mining Limited. Wafi-Golpu Project, Morobe Province, Papua New Guinea, NI-43 101 Technical Report; Newcrest Mining Limited: Melbourne, Australia, 2020; Volume 345. [Google Scholar]
  9. Dow, D.B. A Geological Synthesis of Papua New Guinea; Bulletin 201; Australian Bureau of Mineral Resources, Geology and Geophysics: Canberra, Australia, 1977. [Google Scholar]
  10. Pigram, C.J.; Davies, H.L. Terranes and the accretion history of the New Guinea orogen. BMR J. Aust. Geol. Geophys. 1987, 10, 193–212. [Google Scholar]
  11. Rogerson, R.; Hilyard, D.; Francis, G.; Finlayson, E. The foreland thrust belt of Papua New Guinea. In Proceedings of the Pacific Rim Congress 87, Gold Coast, Australia, 26–29 August 1987; The Australasian Institute of Mining and Metallurgy: Parkville, MO, USA, 1987; pp. 579–583. [Google Scholar]
  12. Hill, K.C.; Hall, R. Mesozoic-Cainozoic Evolution of Australia’s New Guinea Margin in A West Pacific Context; Special Publication; Geological Society of Australia: New South Wales, Australia, 2003; Volume 22, pp. 259–283. [Google Scholar]
  13. Quarles van Ufford, A.; Corbett, M. Cainnozoic tectonics of New Guinea. AAPG Bull. 2005, 89, 119–140. [Google Scholar] [CrossRef]
  14. Holm, R.J.; Spandler, C.; Richards, S.W. Continental collision, orogenesis and arc magmatism of the Miocene Maramuni arc, Papua New Guinea. Gondwana Res. 2015, 28, 1117–1136. [Google Scholar] [CrossRef]
  15. Hall, R. Cenozoic geological and plate tectonic evolution of South-east Asia and the South-west Pacific: Computer-based reconstructions, model and animations. J. Asian Earth Sci. 2002, 20, 353–431. [Google Scholar] [CrossRef]
  16. Sheppard, S.; Cranfield, L. Geological Framework and Mineralisation of Papua New Guinea: An Update; Geological Survey Division, Mineral Resources Authority: Port Moresby, Papua New Guinea, 2012; pp. 2–3. [Google Scholar]
  17. Holm, R.; Gold, D.; White, L.; Webb, M.; Mahoney, L.; McLaren, S.; Heilbronn, K.; Oesterle, J.; Mizera, M.; Saroa, D.; et al. Provenance and Tectonics of the Allochthonous New Guinea Terranes: Implications for the Formation and Evolution of Regional Basins. In Proceedings of the 2020 1st AAPG/EAGE PNG Geoscience Conference and Exhibition, PNG’s Oil and Gas Industry Maturing Through Exploration, Development and Production, Port Moresby, Papua New Guinea, 25–27 February 2020. [Google Scholar]
  18. Leach, T.M.; Erceg, M.M. The Wafi River high sulphur epithermal Au deposit, Papua New Guinea. In Proceedings of the Pacific Rim Congress 90, Gold Coast, QLD, Australia, 6–12 May 1990; The Australasian Institute of Mining and Metallurgy: Parkville, MO, USA, 1990; pp. 451–456. [Google Scholar]
  19. Funnell, F.R. Wafi River Au prospect. In Geology of the Mineral Deposits of Australia and Papua New Guinea 1990; The Australian Institute of Mining and Metallurgy: Melbourne, Australia, 1990; pp. 1731–1733. [Google Scholar]
  20. Tau-Loi, D.; Andrew, R.L. Wafi Cu-Au deposit. In Geology of Australian and Papua New Guinean Mineral Deposits; Berkman, D.A., Mackenzie, D.H., Eds.; The Australasian Institute of Mining and Metallurgy: Melbourne, Australia, 1998; Volume 22, pp. 827–832. [Google Scholar]
  21. Rinne, M.L.; Cooke, D.R.; Harris, A.C.; Finn, D.J.; Allen, C.M.; Heizler, M.T.; Creaser, R.A. Geology and Geochronology of the Golpu porphyry and Wafi epithermal deposit, Morobe Province, Papua New Guinea. Econ. Geol. 2018, 113, 271–294. [Google Scholar] [CrossRef]
  22. Wells, J.D.; Mullens, T.E. Gold-bearing arsenian pyrite determined by microprobe analysis, Cortez and Carlin Au mines, Nevada. Econ. Geol. 1973, 68, 187–201. [Google Scholar] [CrossRef]
  23. Fleet, M.E.; Chryssoulis, S.L.; MacLean, P.J.; Davidson, R.; Weisener, C.G. Arsenian pyrite from Au deposits: Au and As distribution investigated by SIMS and EMP and colour staining and surface oxidation by XPS and LIMS. Can. Mineral. 1993, 31, 1–17. [Google Scholar]
  24. Mumin, A.H.; Fleet, M.E.; Chryssoulis, S.L. Gold mineralisation in As-rich mesothermal Au ores of the Bogosu-Prestea mining district of the Ashanti Gold Belt, Ghana: Remobilisation of “invisible” Au. Miner. Depos. 1994, 29, 445–460. [Google Scholar] [CrossRef]
  25. Fleet, M.E.; Mumin, A.H. Gold-bearing arsenian pyrite and marcasite and arsenopyrite from Carlin Trend Au deposits and laboratory synthesis. Am. Mineral. 1997, 82, 182–193. [Google Scholar] [CrossRef]
  26. Shi Jian, B.; Jian Wei, L.; Mei Fu, Z.; Zhan Ke, L. Gold distribution in As-deficient pyrite and telluride mineralogy of the Yangzhaiyu Au deposit, Xiaoqinling district, southern North China craton. Miner. Depos. 2011, 46, 925–941. [Google Scholar]
  27. Reich, M.; Deditius, A.; Chryssoulis, S.; Li, J.-W.; Ma, C.-Q.; Parada, M.A.; Barra, F.; Mittermayr, F. Pyrite as a record of hydrothermal fluid evolution in a porphyry copper system: A SIMS/EMPA trace element study. Geochim. Cosmochim. Acta 2013, 104, 42–62. [Google Scholar] [CrossRef]
  28. Weissmann, A. Petrochemistry, Sulfur Isotope and Fluid Inclusion Study on Some Porphyry Cu Deposits on the Island of New Guinea. Master’s Thesis, Clausthal University of Technology, Clausthal-Zellerfeld, Germany, 2012. [Google Scholar]
  29. Gustafson, L.B.; Hunt, J.P. The porphyry copper deposit at El Salvador, Chile. Econ. Geol. 1975, 70, 857–912. [Google Scholar] [CrossRef]
  30. Clark, A.H. Are Outsize Porphyry Copper Deposits Either Anatomically or Environmentally Distinctive? Special Publication 2; Society of Economic Geologists: Littleton, CO, USA, 1993; pp. 213–283. [Google Scholar]
  31. Williamson, A.; Hancock, G. (Eds.) The Geology and Mineral. Potential of Papua New Guinea: Papua New Guinea Department of Mining; Papua New Guinea Department of Mining: Port Moresby, Papua New Guinea, 2005; Volume 152. [Google Scholar]
  32. Lunge, M. A Mineralogical, Geochemical and Geochronological Study of the Golpu and Nambonga North Porphyry Cu-Au Systems, Wafi-Golpu Mineral District, Papua New Guinea. Master’s Thesis, University of Papua New Guinea, Port Moresby, Papua New Guinea, 2013. [Google Scholar]
  33. Sillitoe, R.H. Porphyry copper systems. Econ. Geol. 2010, 105, 3–41. [Google Scholar] [CrossRef] [Green Version]
  34. Corbett, G.J. Geology and Mineral Potential of Papua New Guinea; Papua New Guinea Department of Mining: Port Moresby, Papua New Guinea, 2005; Volume 152. [Google Scholar]
  35. Arribas, A., Jr.; Hendequist, J.W.; Itaya, T.; Okada, T.; Concepción, R.A.; Garcia, J.S., Jr. Contemporaneous formation of adjacent porphyry and epithermal Cu-Au deposits over 300 ka in northern Luzon, Philippines. Geology 1995, 23, 337–340. [Google Scholar] [CrossRef]
  36. Espi, J.O. Nena High Sulfidation-Type Deposit, Frieda River, Papua New Guinea: Host-Rock Types, Hydrothermal Alteration and Copper-gold Mineralization. In Pacrim Congress 1999, Bali Indonesia; Weber, G., Ed.; Australasian Institute of Mining and Metallurgy (Melbourne): Melbourne, Australia, 1999; pp. 473–481. [Google Scholar]
  37. Hedenquist, J.W.; Matsuhisa, Y.; Izawa, E.; White, N.C.; Giggenbach, W.; Oaki, M. Geology, geochemistry and origin of high sulfidation Cu-Au mineralization in the Nansatsu district, Japan. Econ. Geol. 1994, 89, 1–30. [Google Scholar] [CrossRef]
  38. Mavrogenes, J.A.; Berry, A.J.; Newville, M.; Tutton, S.R. Copper speciation in vapor-phase inclusions from the Mole Granite, Australia. Am. Mineral. 2002, 87, 1360–1364. [Google Scholar] [CrossRef]
  39. Gammons, C.H.; Williams-Jones, A.E. Chemical mobility of gold in the porphyry-epithermal environment. Econ. Geol. 1997, 92, 45–59. [Google Scholar] [CrossRef]
  40. Erceg, M.M.; Craighead, G.A.; Halfpenny, R.; Lewis, P.J. The exploration history, geology and metallurgy of a high sulphidation epithermal Au deposit at Wafi River, Papua New Guinea. In Proceedings of the Geology, Exploration and Mining Conference, Rabaul, Papua New Guine, 7–9 November 1991; Rogerson, R., Ed.; The Australasian Institute of Mining and Metallurgy: Parkville, MO, USA; pp. 58–65. [Google Scholar]
Figure 1. Location of some intrusion-related Cu and Au deposits in Papua New Guinea. The WGMD, represented by the Wafi-Golpu mineralized systems, is located west-southwest of Lae and north-northwest of the Hidden Valley mine.
Geosciences 11 00335 g001
Figure 2. Regional geology of the Bulolo-Wau area, Morobe Province, Papua New Guinea (Lunge, 2013). Red dot in EL440 Mt Wanion indicates the location of the WGMD.
Geosciences 11 00335 g002
Figure 3. Plan view showing the Golpu porphyries, Nambonga North porphyry and Wafi Diatreme in the WGMD. Other intrusive suites have not been displayed.
Geosciences 11 00335 g003
Figure 4. Geological cross-section of the Golpu and Nambonga North porphyry systems. Age dating results are from Lunge (2013). The mineral resources estimates were taken from the Newcrest Mining Limited Technical Report (2020).
Geosciences 11 00335 g004
Figure 5. Log-plots of the trace element concentrations in the pyrite samples from the Nambonga North and Golpu porphyries, (A) Au versus Cu, (B) Au versus As, (C) Au versus Bi, (D) Au versus Pb, (E) Au versus Zn, (F) Au versus Mo, (G) Au versus Sb, (H) Au versus Ag, (I) Au versus Pd, (J) Au versus Pt; (K) Au versus Se, and (L) Au versus Te. MDL is abbreviated for Minimum Detection Limit. The full results are shown in Appendix A.
Geosciences 11 00335 g005
Figure 6. Log-plots of the trace element concentrations in the chalcopyrite samples from the Nambonga North and Golpu porphyries, (A) Au versus As, (B) Au versus Bi, (C) Au versus Pb, (D) Au versus Zn, (E) Au versus Mo, (F) Au versus Sb, (G) Au versus Ag, (H) Au versus Pt, (I) Au versus Pd, (J) Au versus Se, (K) Au versus Te, and (L) Au versus Cd. MDL is abbreviated for Minimum Detection Limit. The full results are shown in Appendix B.
Geosciences 11 00335 g006
Figure 7. Cumulative frequency graphs of LA-ICPMS Au measurements in pyrite, chalcopyrite and bulk-rock, (A) Main Golpu porphyry; (B) Golpu West porphyry; (C) Golpu North porphyry; and (D) Nambonga North porphyry.
Geosciences 11 00335 g007
Figure 8. Geometric mean for the Au distribution of pyrite and chalcopyrite compared with the geometric mean Au values of the bulk-rock from the Golpu, Golpu West, Golpu North and Nambonga North porphyries. (A) Au in pyrite, and (B) Au in chalcopyrite. Dashed line defines 1σ variation range.
Geosciences 11 00335 g008
Figure 9. Photomicrograph of pyrite crystals from sample N1 (i.e., drill hole = WR272, depth = 396.00 m). Pyrite crystals commonly have granoblastic textures.
Geosciences 11 00335 g009
Figure 10. Photomicrograph of pyrite crystals from sample N10 (i.e., drill hole = WR272, depth = 294.30 m). Pyrites in sample N10 have platy, prismatic and lamellar textures. The textures indicate a pseudomorphic replacement of a hexagonal mineral, most likely hematite. Note that the pyrite is overgrown and is replaced by late chalcopyrite.
Geosciences 11 00335 g010
Figure 11. Log-plots of the trace element concentrations in the pyrite samples from drill hole WR272 at the Nambonga North porphyry deposit, (A) Au versus Cu, (B) Au versus As, (C) Au versus Bi, (D) Au versus Pb, (E) Au versus Zn, (F) Au versus Mo, (G) Au versus Sb, (H) Au versus Ag, (I) Au versus Pd, (J) Au versus Pt, (K) Au versus Se, and (L) Au versus Te. The bulk-rock chemical data for the Nambonga North porphyry is also plotted.
Geosciences 11 00335 g011
Figure 12. Log-plot of pyrite versus Au in the bulk-rock sample from the Main Golpu, Golpu West, Golpu North and Nambonga North porphyries.
Geosciences 11 00335 g012
Figure 13. Contents of Au and Cu for the largest Au-rich porphyry Cu deposits in the Circum-Pacific region (Slightly modified after Sillitoe, 1997). All deposits contain >200 t of Au.
Geosciences 11 00335 g013
Figure 14. Interpreted paragenesis of the porphyry-related alteration and mineralization (from Lunge, 2013). (A) Golpu porphyry Cu-Au deposit, and (B) Nambonga North porphyry Cu–Au deposit.
Geosciences 11 00335 g014
Publisher’s Note: MDPI stays neutral with regard to jurisdictional claims in published maps and institutional affiliations.

