Abstract
A recent increase in frequency and severity of exceptional climatic events is of concern for the stability of natural and artificial slopes. These undergo continuous evaporation and infiltration cycles, which change the suction distribution and trigger shrinkage, swelling, cracking, and surficial erosion, overall decreasing the soil strength. To assess the impact of these climatic stresses, the determination of water retention properties is a priority. Although advanced techniques have been proposed in the last few decades to this end, simpler commercially available techniques allow collecting data for a larger number of samples in a shorter time, thus enabling a basic description of the water retention properties for a larger database of soils. Data on two silty sands, coming from very different climatic environments in Europe, were collected with a combination of two simple commercial devices, and the results were modelled with a van Genuchten’s law. The fitted parameters were found to correlate well with the amount of fines, irrespective of the different origin and composition of the two soils. Eventually, the limitation of the approach is discussed based on the results of cyclic drying–wetting tests.
1. Introduction
Slope stability analyses involve the identification of the different mechanisms that might trigger failure no matter whether an artificial or a natural slope is involved. A recent increase in the severity of climatic events suggests that the influence of evaporation and infiltration on the mechanical behaviour of soils must be considered carefully among other factors. Two recent case histories, very different from each other, promoted the investigation presented in the following. The first one refers to the stability of regional dykes in The Netherlands, which are experiencing droughts due to substantial increase in summer temperatures in the recent years [1]. The second case refers to natural cliffs made of carbonate sand at Agrigento in Italy, where local collapses have been observed following heavy rainfalls [2,3,4,5]. Both cases involve large areas, for which management decisions have to be taken based on a relatively small amount of data, as advanced lengthy laboratory investigation cannot be afforded.
The hydromechanical response of dykes under unsaturated conditions has been tackled by many researchers, who highlighted the role of unsaturated conditions on their response. Among others, Schmertmann (2006) and Calabresi et al. (2013) [6,7] highlighted that partial saturation is largely prevailing in silty dykes. As a consequence, the current guidelines, which suggest assessing slope stability assuming a steady state pore pressure distribution following the design high-water event, are largely over conservative. As pointed out by Jommi and Della Vecchia (2013) [8], the steady state assumption leads to an overestimation of the dimensions of the embankment, hence of the amount of soil, needed to guarantee a sufficient factor of safety during the working life of the structure. As is well-known from the literature, modelling time dependent unsaturated flow better allows assessing the change in the pore water pressure and in the soil shear strength [9].
Things are not less complex for natural slopes. Of interest for the following, it is worth noting that Ercoli et al. (2015) [3] suggested that monitoring the change in water content in the sand is fundamental to appreciate its main role in the retrogression collapse mechanisms of the Valle dei Templi cliffs at Agrigento.
The water retention properties are fundamental in this respect, not only because they govern the hydraulic conductivity and seepage, but eventually for their role in governing changes in stiffness and strength of the soil. Many factors affect the water retention, including the void ratio, the activity of the clay fraction, the fabric of the soil [10,11,12,13,14,15,16,17,18]. Among them, the particle size distribution may become the dominant one for non-plastic mixtures of silty sands [19,20].
Although advanced techniques have been proposed in the last few decades to study the water retention behaviour of soils, simpler commercially available techniques allow collecting data for a larger number of samples in a shorter time, thus enabling a basic description of the water retention properties for a larger database of soils. Following this consideration, two non-plastic soils were investigated over drying and wetting combining the data from two commercially available devices: the Hyprop® and the Dew Point Potentiometer WP4C®. The results are modelled with a simple van Genuchten’s model (1980) [21], in an attempt to derive correlations to be used as a first approximation in the assessment of natural and artificial slopes.
2. Materials and Methods
Two different soils were investigated: a sandy silt from a dyke at the Leendert de Boerspolder (South Holland, The Netherlands) and a silty carbonate sand from a natural cliff in the “Valle dei Templi” at Agrigento (Sicily, Italy). Relevant information on the samples tested are collected in Table 1. The dyke silty material goes from a silty sand with traces of gravel and clay to a clayey silt with traces of sand. The void ratio, e, of the samples investigated is almost constant, to better highlight the influence of grain size distribution on the water retention properties. Both natural and reconstituted samples were investigated to assess the influence of fabric on the response. The material from the Valle dei Templi is a carbonate fine and medium sand with a clay fraction up to 10% and a silt content slightly less than 20%, characterised by a quite high uniformity coefficient, U, of about 5 [22]. For the Agrigento sand the values reported are the average of the three samples. For both materials the amount of clay is below 8%.

Table 1.
Samples investigated for water retention. In the table, r stands for reconstituted.
The water retention behaviour was investigated by combining data from two commercial apparatuses (Figure 1) available at TU Delft (NL), namely the Hyprop® and the Dew Point Potentiometer WP4C®. The HYPROP® device (HYdraulic PROPerty analyser, constructed in Munich, Germany) was developed by UMS to determine the water retention curve and the unsaturated conductivity over drying from the top surface of the sample at room temperature and relative humidity. Over the testing period the total mass of the sample is measured, as well as the temperature at the bottom of the sample. The sensor placed at the bottom of the sample can measure temperature between −30 and 70 °C, with a tolerance of ±0.2 °C in the range of −10 to 30 °C. Two tensiometers, having a porous stone with a high entry value (880 kPa), allow direct measurement of suction at two different heights, with an accuracy of 0.15 kPa. The range of suctions typically covered by the tensiometers goes from zero to about 100 kPa, depending on the saturation achieved by the suction measurement system before the start of the test. Actually, although the porous stone in contact with the soil guarantees no cavitation of the tip, the longer the tests the more likely is cavitation of the measuring system behind the tip. Water mass changes are measured by a scale (accuracy of 0.1 g) at the bottom of the system, which allows estimating the average water ratio of the sample at any time. The water content at the end of each test was double checked by oven drying.
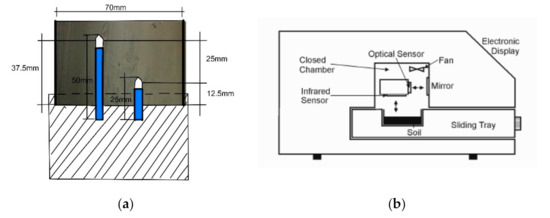
Figure 1.
Geometry and cross section of (a) the Hyprop device edited from the User Manual Hyprop, 2012 [23], and (b) The Decagon dew point potentiometer WP4C® Cross Section [24].
The Dew Point Potentiometer, constructed in Munich, Germany, uses the chilled mirror dew point technique to measure the water potential of the soil, through the vapour pressure of the air in equilibrium with the sample in a sealed measurement chamber. Although the measurement range theoretically goes from 0 to 300 MPa, the accuracy of the device below 1MPa is extremely low, which does not guarantee the reliability of the measurement. From 10 to 300 MPa the accuracy is ±1%.
Although both techniques have been designed to investigate the water retention properties over drying, an attempt was made to conduct the tests in order to investigate also the response of the samples over wetting. However, it is worth noting that the data obtained from the Dew Point Potentiometer after wetting the samples cannot be interpreted as lying on a main wetting curve, as equilibrium is achieved in the chamber due to an evaporation process [25]. In the Hyprop, wetting stages were controlled by protecting the samples from evaporation after adding a controlled amount of water on the top. The recorded data over drying and wetting will be commented later in Section 4.
3. Results
The mass of water contained in a soil samples allows determining directly the water content of the soil, w
where and are the mass of water and solid particles, respectively.
Following the discussion by Romero and Vaunat (2000) [26], water ratio, ew, is used instead of water content in the presentation of the results, as it better normalises the results for soils having different specific gravity, :
For soils having low deformability like those tested, volumetric strains over drying in the range of suctions investigated in the Hyprop can be disregarded as a first approximation, thereby allowing a sufficiently reliable estimate of the current average degree of saturation of the sample assuming constant void ratio over the test (e = e0).
Typical data for the two materials over main drying are reported in Figure 2. During the Hyprop test water tension readings (suction) are taken continuously by the two tensiometers. The suction in the upper part of the sample is measured by the tensiometers having the longer shaft and that in the lower part of the sample by the tensiometers mounted on the shorter shaft. Both shafts are schematized in Figure 1a. By contrast, the discrete measurements taken with the WP4C are represented by symbols in the figures.
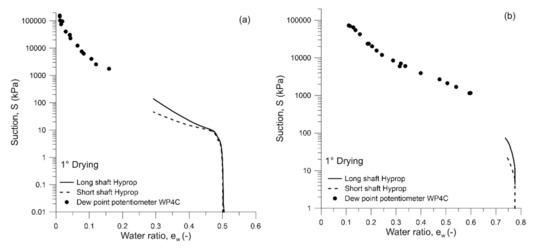
Figure 2.
Water retention data of (a) Agrigento sand and (b) Leendert de Boerspolder silt.
Figure 2 highlights that combining the two techniques allows covering the entire range of suction expected for these soils, although the suction range from about 100 kPa to 1 MPa is not covered by any of the two techniques. Nonetheless, the lower suction and higher suction ranges are accurately described, which allows including the entire suction range in a model.
It is worth noting that the suction at the bottom and at the top of the samples are different, as the measurements are taken over a time-dependent process characterised by vertical flow. Moreover, the two measurement are related to a water ratio, which actually measures the average water mass on the entire sample coming from a non-uniform distribution over sample height. Nevertheless, for rather pervious almost undeformable soils the average suction over height and the average water ratio over the volume of the sample are well correlated to each other because their gradients are not high. This is not the case for more impervious and deformable clay samples, which present steep gradients of water content and suction over height due to the preferential flow direction in time [27]. Assuming that the average values are representative of the “material” behaviour, the water retention data can be elaborated to derive a degree of saturation–suction relationship for each sample, as shown in Figure 3.
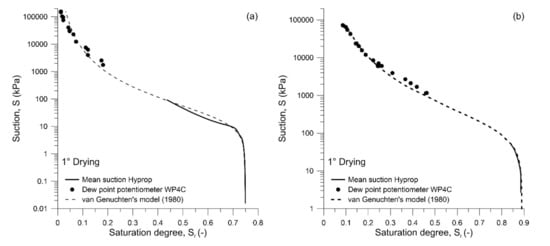
Figure 3.
Elaboration of water retention data of (a) Agrigento sand and (b) Leendert de Boerspolder silt.
The elaborated data are interpolated with a simple van Genuchten’s model (1980):
drawn as a dotted line in the figure. In the previous expression, S is the suction, Sr is the degree of saturation, Srmax is the maximum attainable degree of saturation over wetting at the atmospheric pressure, and Srres is the residual degree of saturation at high suctions. The curve depends on two parameters, p linked to the air entry value and λ, ruling the average slope of the curve. For the samples investigated, the residual saturation is almost null, while the maximum attainable saturation at the atmospheric pressure corresponds with the air occlusion value, as the samples did not undergo saturation under back pressure. Strictly speaking, the initial part of the plotted drying curve for Agrigento’s soil (until the air entry value) is not the “main drying” because the soil sample did not start from full saturation. However, it is equally representative of the response of the soil. The parameters of the fitted van Genuchten’s curve for the different samples are summarised in Table 2, where p has been normalised to the atmospheric pressure.

Table 2.
Parameters of the van Genuchten’s model for the samples investigated.
The calibrated parameters are very well correlated with the fine content, including the silt and the clay fraction, of each sample. The correlations are reported in Figure 4, and the curves fitting the available experimental data, starting from the experimental Srmax, are depicted in Figure 5.
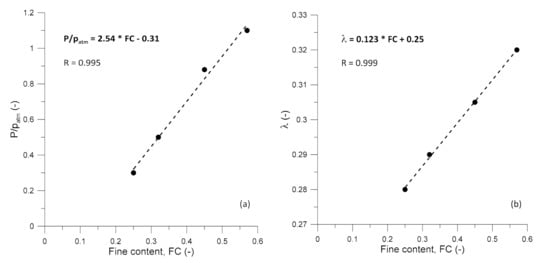
Figure 4.
Fitting curves of the water retention model parameters as a function of the fine content, FC: (a) p/patm, and (b) λ.
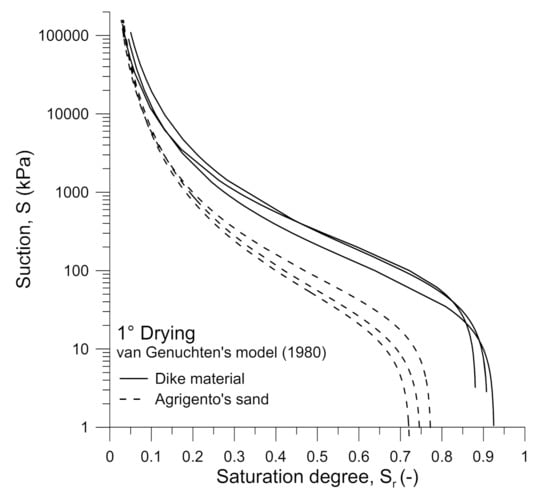
Figure 5.
Fitting curves of the samples investigated.
Although the amount of data is limited, the correlations seem to suggest few conclusions: (i) the fabric does not play a relevant role for these samples, as both natural and reconstituted samples follow the same trend; (ii) as expected, the air entry value increases with the amount of fine, irrespective of the mineralogical composition of the two soils, which in both case is non-active; (iii) the slope of the water retention curves also depends on the amount of fines, as it rules the coefficient of uniformity. Given the very different origin of the two soils, it is expected that the conclusions may be valid for non-active silty sands in general, although validation is still needed.
4. Time-Dependent Data and Hysteresis
Although the Hyprop system is designed to determine the water retention curve over drying at atmospheric boundary conditions, an attempt was made to investigate the soil water retention branch. As suggested by Schindler et al. (2015) [28], water can be added to the surface of the Hyprop sample simulating a precipitation event in order to quantify hysteresis due to cycles of drying and wetting.
The data recorded over time over a number of drying and wetting cycles on a sample of the dyke silty material are reported in Figure 6, as a function of the current degree of saturation. The shape of the curves obtained by averaging the negative pore pressure recorded by the two tensiometers clearly highlight the transient response of the system, especially over the first cycles, and hardly allows determining the separate main drying and main wetting branches of the water retention domain. Actually, whenever forced infiltration is stopped, the upper part of the samples undergoes a new drying stage due to evaporation from the top, while the bottom part of the sample is still wetting due to previous infiltration.
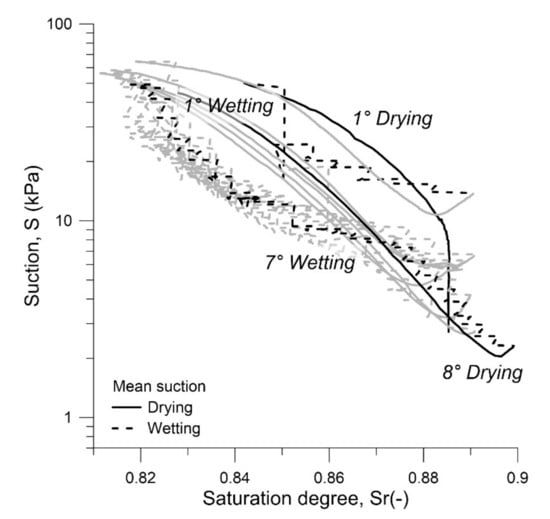
Figure 6.
Suction measurements during drying–wetting cycles in Hyprop on a sample of the dyke silty material as a function of the average degree of saturation of the sample.
Therefore, it was decided to adopt a slightly different strategy, which could help in the interpretation of the data. After adding water on the top of the sample, an impervious plastic cover was placed, and kept until the tensiometers measurement reached an almost asymptotic value of suction, indicating equalisation, before letting the sample evaporate again. An example of the entire data set logged during evaporation and infiltration cycles is provided in Figure 7 for another sample of the dyke silty sand. In Figure 7a the inner and outer temperature are plotted against time. The term “inner” indicates the temperature recorded at the base of the sample from the sensor placed in the Hyprop unit, whereas “outer” indicates the ambient temperature of the laboratory. Figure 7b shows the mass change of the sample over time. Its rate is plotted as a function of the two variables ruling the exchanges, temperature and relative humidity, in Figure 7c.
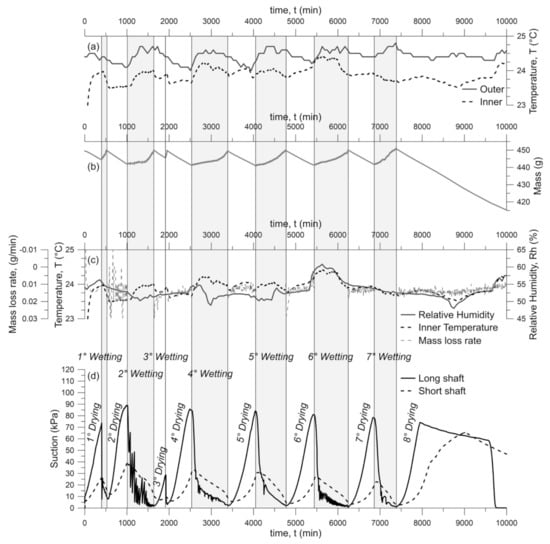
Figure 7.
Data logged during drying and wetting cycles on a sample of the dyke silty material: (a) inner and outer temperature, (b) temperature, Rh and mass loss rate, (c) net sample mass and (d) suction readings as a function of time.
Of relevance for the present discussion, the suction measured on the upper part of the soil sample (long shaft) and in the lower one (short shaft) are reported in Figure 7d. The measurements clearly show the substantial difference between the suction at the two heights over time during drying, when equalisation was not forced. The maximum suction over drying is reached in the lower part of the sample shortly after the peak value at the top. If equalisation is forced, as it was done over the wetting stages here, the two tensiometers reach almost the same value (with a difference due to the gravitational potential, which can be disregarded) and allow for the determination of a clear value for the suction in equilibrium with a given water content, to be used in a water retention model. The decrease in the measured suction on the long shaft tensiometer during the 8th drying stage is due to cavitation of the instrument.
The latter data were elaborated to identify the wetting branch of the water retention curve of the sample, which is plotted in Figure 8, together with the drying data, which were already used as example in Figure 2b. The hysteretic cycles could be well identified, as shown in Figure 8b, with the procedure adopted, with the scanning paths that tend to overlap to each other after the first cycle, as expected.
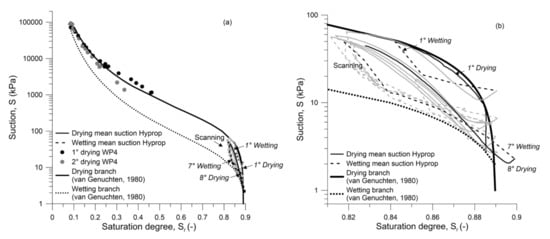
Figure 8.
Drying and wetting branches of the water retention domain, as elaborated from the Hyprop data in Figure 7 on a sample of dyke silty material: (a) full suction range, and (b) 0 < S < 100 kPa.
5. Conclusions
Soil water retention properties over drying were investigated on a sandy silt from a dyke at the Leendert de Boerspolder (NL) and for a carbonate silty sand from the Valle dei Templi in Agrigento (IT), with a combination of data obtained from two commercially available devices, namely the Hyprop® and the Dew Point Potentiometer WP4C®. The scope of the work was to investigate the possibility for a rather cheap characterisation of the retention properties of soils of concern for the assessment of climate impact on the stability of slopes, even in very different contexts.
The results demonstrate the feasibility of the approach, and provided careful evaluation and elaboration of the results. Classical water retention models are conceived to describe steady equilibrium states, while in the popular devices chosen for the investigation, data are continuously recorded over time during time-dependent dynamic processes. Using the average over a given time interval of the suction measurements taken at two different heights in the sample may work for the first drying stage of non-active silty sands and sandy silts. However, to obtain reliable information on the hysteretic response over the drying–wetting cycles expected on site, the standard procedures must be amended.
An advantage of the technique is that it reproduces evaporation and infiltration naturally occurring in the soil at the environmental conditions of the laboratory, which can be controlled if necessary. However, the way in which the Hyprop device was designed implies measuring suction during a transient process, which might even be non-monotonic over the sample height in case wetting stages were added during the test. With minor changes to the set up and the test protocol of the Hyprop device, data at suction equalisation can be obtained, creating the possibility to investigate both the drying and the wetting branches of the water retention domain of non-active soils. Soils experiencing relevant volume changes over drying and wetting are much less suitable for testing with the technique and the coupled hydromechanical response of the soil requires careful investigation.
Author Contributions
Conceptualization, A.N.; Investigation, E.P.; Methodology, C.J.; Writing—original draft, A.N., E.P.; Writing—review & editing, A.N., C.J. All authors have read and agreed to the published version of the manuscript.
Funding
The financial support on the experimental equipment of the perspective program BioGeoCivil (grant 11344) and CEAMaS (Civil Engineering Applications for Marine Sediments), supported by the European Regional Development Funding through INTERREG IV B, is gratefully acknowledged.
Institutional Review Board Statement
Not applicable.
Informed Consent Statement
Not applicable.
Data Availability Statement
Not applicable.
Acknowledgments
The authors acknowledge Margherita Zimbardo of the University of Palermo and the “Ente Parco Archeologico della Valle dei Templi” at Agrigento (Sicily, Italy) for providing the Agrigento sand specimens.
Conflicts of Interest
The authors declare no conflict of interest.
References
- Chao, C.Y.; Bakker, M.; Jommi, C. Calibration of a Simple 1D Model for the Hydraulic Response of Regional Dykes in The Netherlands; Cardoso, R., Jommi, C., Romero, E., Eds.; E-UNSAT: Amsterdam, The Netherlands, 2020; Volume 195, pp. 1–6. [Google Scholar]
- Cotecchia, V. Geotechnical degradation of the archaelogical site of Agrigento. In Arrigo Croce Memorial Symposium; Balkema: Kalamazoo, MI, USA, 1996. [Google Scholar]
- Ercoli, L.; Zimbardo, M.; Nocilla, N.; Nocilla, A.; Ponzoni, E. Evaluation of cliff recession in the Valle dei Templi in Agrigento (Sicily). Eng. Geol. 2015, 192, 129–138. [Google Scholar] [CrossRef]
- Zimbardo, M.; Ercoli, L.; Megna, B. The open metastable structure of a collapsible sand: Fabric and bonding. Bull. Int. Assoc. Eng. Geol. 2015, 75, 125–139. [Google Scholar] [CrossRef]
- Nocilla, A.; Grossi, G.; Ponzoni, E. Influence of the soil-atmosphere interaction on the collapse of sand in the Valle dei Templi in Agrigento. In Proceedings of the VI Italian Conference of Researchers in Geotechnical Engineering CNRIG 2016 “Geotechnical Engineering in multidisciplinary research: From microscale to regional scale”, Bologna, Italy, 22–23 September 2016; Volume 158, pp. 386–391. [Google Scholar]
- Schmertmann, J.H. Estimating Slope Stability Reduction due to Rain Infiltration Mounding. J. Geotech. Geoenviron. Eng. 2006, 132, 1219–1228. [Google Scholar] [CrossRef]
- Calabresi, G.; Colleselli, F.; Danese, D.; Giani, G.; Mancuso, C.; Montrasio, L.; Nocilla, A.; Pagano, L.; Reali, E.; Sciotti, A. Research study of the hydraulic behaviour of the Po River embankments. Can. Geotech. J. 2013, 50, 947–960. [Google Scholar] [CrossRef]
- Jommi, C.; Della Vecchia, G. Geomechanical analysis of river embankments. In Mechanics of Unsaturated, Geomaterials; Laloui, L., Ed.; John Wiley & Sons: Hoboken, NJ, USA, 2013; pp. 353–373. [Google Scholar]
- Fredlund, D.G.; Rahardjo, H. Soil Mechanics for Unsaturated Soils; John Wiley & Sons: Hoboken, NJ, USA, 1993. [Google Scholar] [CrossRef]
- Vanapalli, S.K.; Fredlund, D.G.; Pufahl, D.E. The influence of soil structure and stress history on the soil–water characteristics of a compacted till. Geotechnique 1999, 49, 143–159. [Google Scholar] [CrossRef] [Green Version]
- Fredlund, M.D.; Fredlund, D.G.; Wilson, G.W. Estimation of volume change functions for unsaturated soils. In Unsaturated Soils for Asia; Rahardjo, H., Toll, D.G., Leong, E.C., Eds.; CRC Press: Boca Raton, FL, USA, 2000; pp. 663–668. [Google Scholar]
- Kawai, K.; Kato, S.; Karube, D. The model of water retention curve considering effects of void ratio. In Unsaturated Soil for Asia; Rahardjo, H., Toll, D.G., Leong, E.C., Eds.; CRC Press: Boca Raton, FL, USA, 2000; pp. 329–334. [Google Scholar]
- Cafaro, F. Metastable states of silty clays during drying. Can. Geotech. J. 2002, 39, 992–999. [Google Scholar] [CrossRef]
- Gallipoli, D.; Wheeler, S.; Karstunen, M. Modelling the variation of degree of saturation in a deformable unsaturated soil. Geotechnique 2003, 53, 105–112. [Google Scholar] [CrossRef]
- Tarantino, A.; Tombolato, S. Coupling of hydraulic and mechanical behaviour in unsaturated compacted clay. Geotechnique 2005, 55, 307–317. [Google Scholar] [CrossRef]
- Romero, E.; DELLA Vecchia, G.; Jommi, C. An insight into the water retention properties of compacted clayey soils. Geotechnique 2011, 61, 313–328. [Google Scholar] [CrossRef]
- Casini, F.; Vaunat, J.; Romero, E.; Desideri, A. Consequences on water retention properties of double-porosity features in a compacted silt. Acta Geotech. 2012, 7, 139–150. [Google Scholar] [CrossRef] [Green Version]
- Gomez, R.; Romero, E.; Della Vecchia, G.; Jommi, C.; Suriol, J.; Lloret, A. Water Retention Properties of a Compacted Clayey Silt Including Void Ratio Dependency and Microstructural Features. In Unsaturated Soils: Research and Applications; Mancuso, C., Jommi, C., D’Onza, F., Eds.; Springer: Berlin/Heidelberg, Germany, 2012; pp. 153–158. [Google Scholar] [CrossRef]
- Cafaro, F.; Hoffmann, C.; Cotecchia, F.; Buscemi, A.; Bottiglieri, O.; Tarantino, A. Modellazione del comportamento idraulico di terreni parzialmente saturi a grana media e grossa. Riv. Ital. Geotec. 2008, 3, 54–72. [Google Scholar]
- Wang, M.; Pande, G.; Pietruszczak, S.; Zeng, Z. Determination of strain-dependent soil water retention characteristics from gradation curve. J. Rock Mech. Geotech. Eng. 2020, 12, 1356–1360. [Google Scholar] [CrossRef]
- Van Genuchten, M.T. A Closed-form Equation for Predicting the Hydraulic Conductivity of Unsaturated Soils. Soil Sci. Soc. Am. J. 1980, 44, 892–898. [Google Scholar] [CrossRef] [Green Version]
- Nocilla, N.; Ercoli, L.; Zimbardo, M.; Nocilla, A.; Meli, P.; Grado, G.; Parello, G.; Presti, G. Unsaturated sand in the stability of the cuesta of the Temple of Hera (Agrigento). In Geotechnical Engineering for the Preservation of Monuments and Historic Sites; Bilotta, E., Flora, A., Lirer, S., Viggiani, C., Eds.; Taylor and Francis: London, UK, 2013; Volume 1, pp. 603–612. [Google Scholar] [CrossRef]
- HYPROP© UMS GMBH MUNICH. User Manual Hyprop. Available online: www.ums-muc.de (accessed on 1 June 2015).
- Bulut, R.; Hineidi, S.M.; Bailey, B. Suction measurements—Filter paper and chilled mirror psychrometer. In Proceedings of the Texas Section American Society of Civil Engineers, Fall Meeting, Waco, TX, USA, 2–5 October 2002. [Google Scholar]
- Cardoso, R.; Romero, E.; Lima, A.; Ferrari, A. A Comparative Study of Soil Suction Measurement Using Two Different High-Range Psychrometers. In Experimental Unsaturated Soil Mechanics; Schanz, T., Ed.; Springer: Berlin/Heidelberg, Gernamy, 2007; Volume 112, pp. 79–93. [Google Scholar] [CrossRef]
- Romero, E.; Vaunat, J. Retention curves of deformable clays. In Experimental Evidence and Theoretical Approaches in Unsaturated Soils; Tarantino, A., Mancuso, C., Eds.; CRC Press: Boca Raton, FL, USA, 2000; pp. 91–106. [Google Scholar]
- Tollenaar, R.N.; van Paassen, L.; Jommi, C. Small-scale evaporation tests on clay: Influence of drying rate on clayey soil layer. Can. Geotech. J. 2018, 55, 437–445. [Google Scholar] [CrossRef]
- Schindler, U.; von Unold, G.; Müller, L. Laboratory measurement of soil hydraulic functions in a cycle of drying and rewetting. Int. J. Emerg. Technol. Adv. Eng. 2015, 5, 282–286. [Google Scholar]
Publisher’s Note: MDPI stays neutral with regard to jurisdictional claims in published maps and institutional affiliations. |
© 2021 by the authors. Licensee MDPI, Basel, Switzerland. This article is an open access article distributed under the terms and conditions of the Creative Commons Attribution (CC BY) license (https://creativecommons.org/licenses/by/4.0/).