Article

Distributed Fiber Optic Strain Sensing for Geomechanical Monitoring: Insights from Field Measurements of Ground Surface Deformation

1
Geological Carbon Dioxide Storage Technology Research Association, 9-2 Kizugawadai, Kizugawa-shi, Kyoto 619-0292, Japan
2
Research Institute of Innovative Technology for the Earth, 9-2 Kizugawadai, Kizugawa-shi, Kyoto 619-0292, Japan
*
Author to whom correspondence should be addressed.
Geosciences 2021, 11(7), 285; https://doi.org/10.3390/geosciences11070285
Submission received: 9 May 2021 / Revised: 27 June 2021 / Accepted: 2 July 2021 / Published: 8 July 2021
(This article belongs to the Special Issue Mechanical Integrity of CO2 Storage Sites)

Abstract

:
In recent years, distributed fiber optic strain sensing (DFOSS) technology has demonstrated a solution for continuous deformation monitoring from subsurface to surface along the wellbore. In this study, we installed a single-mode optical fiber cable in a shallow trench to establish an effective technique for ground surface deformation mapping. We conducted three experimental field tests (iron plate load, water tank filling up load, and airbag inflation) in order to confirm the strain sensitivity of DFOSS for static loads, dynamic overload, excavation, subsidence, and uplift. This paper also presents two installation methods to couple the fiber cable with the ground under various environmental conditions; here, the fiber cable was installed in a shallow trench with one part buried in the soil and another part covered with cement. Our results suggest that covering the cable with cement is a practical approach for installing a fiber cable for ground surface deformation monitoring. By combining this approach with wellbore DFOSS, accurate surface–subsurface deformation measurements can be obtained for three-dimensional geomechanical monitoring of CO2 storage and oil and gas fields in the future.

1. Introduction

The Earth’s surface is subject to deformation generated by tectonic processes, human activity, or the interaction between these activities and surface processes. Vertical deformations can vary considerably in magnitude and can occur on a wide range of timescales. Ground surface deformation includes dynamic overload due to sediment loading and glacial isostatic adjustment, in addition to solid Earth processes, such as earthquakes and volcanoes, groundwater movements in the porous uppermost continental crust, and human activity. Widespread surface deformation (e.g., subsidence, uplift) can also occur when a large volume of fluid is withdrawn from or reintroduced to an underground reservoir system [1,2,3].
The most prominent difference between natural and human-induced geohazards lies in the correlation between surface instability and anthropogenic activities. Although there can be a time delay of ground deformation after human activity, human-induced geohazards show rapid growth (up to tens of cm/yr) and encompass a varying but generally small area [4], thus increasing critical risks and highlighting the importance of relevant monitoring. Surface deformation measurements, including measurements of subsidence and uplift caused by human activities, have indicated the strong correlation between pressure changes in subsurface and surface uplift or subsidence. In this context, continuous spatiotemporal strain data from deep deformations to the surface and continuous spatiotemporal surface strain measurements at a small scale might be required to correlate subsurface pressure changes with surface deformation.
To date, various monitoring methods and sensors have been used in surface deformation monitoring (e.g., GPS, tiltmeter) [5,6], and satellite interferometric synthetic aperture radar [7,8,9] has provided essentially global observations, with corresponding opportunities to study elastic responses to surface loading. These techniques are also useful for measuring poroelastic and unrecoverable (inelastic) deformation associated with hydrologic phenomena [10]. However, these technologies do not provide a complete solution to the issues involved in deformation measurement. One of the major limitations of these methods is an insufficient number of coherent points due to decorrelation.
In recent years, distributed fiber optic strain sensing (DFOSS) has been introduced as an effective tool to continuously detect subsurface deformation, providing a creative solution for the limitations of conventional methods. This technique is based on a shift in the Brillouin and Rayleigh backscattering frequency, which reflects the magnitude of change in environmental parameters, such as strain or temperature. The location of these changes can be estimated from the travel time of the scattered light [11]. Sun et al. [12,13] applied the DFOSS technique with a fiber optic cable installed behind a well casing and successfully measured geomechanical deformation of a reservoir in water injection tests. The authors concentrated on the induced strain and characterization to account for the magnitude and range of the geomechanical deformation profile along the entire well depth direction. For surface deformation, continuous surface points are needed for deformation mapping; therefore, installing optical fiber cables in the surface could be an effective method because it would enable one to detect deformation along the cable. Additionally, surface-based strain monitoring may be valuable when combined with subsurface-based strain monitoring (wellbore DFOSS) because these two methods complement each other and compensate for the limitations encountered when using a single monitoring method. Moreover, surface and/or subsurface dynamics can be monitored in a three-dimensional manner by using vertical and horizontal installation technology together.
To successfully implement fiber optic sensing, the installation method must be carefully considered. There are a variety of methods for installing fiber; the installation method to be used is flexibly selected depending on each property and target. For surface deformation monitoring, the fiber cable must be installed horizontally in the surface, and an installation method must be chosen to avoid environmental effects, protect the cable to enhance the fiber lifetime, avoid soil heterogeneity effects, and achieve cable coupling with the ground while maintaining a high strain sensitivity.
In this study, we performed three field experiments for ground surface deformation monitoring using fiber optic strain sensing technology. A single-mode fiber cable was installed in a shallow trench, with one part covered by soil and the other part covered by cement. The first test was conducted by applying a static weight load (iron plates) that increased in five stages. The DFOSS response was recorded for both the soil part and the cement part in order to confirm the best method for cable installation. In the second test, the DFOSS response was examined under continual deformation caused by a dynamic load produced by gradually filling a water tank placed above the fiber covered by cement. For the third test, the soil under the cable was excavated, and the DFOSS response to the cavern caused by this process was recorded. Subsequently, two airbags were inserted into the cavern under the fiber cable, and an airbag inflation/deflation experiment was performed. In this experiment, the air pressure in the bag was gradually increased and then decreased, and the deformation was recorded by DFOSS for both steps to confirm the ability of DFOSS to monitor uplift and subsidence.

2. Optical Fiber Strain Measurement and Cable Installation

DFOSS is effective for surface deformation monitoring due to its high sensitivity of approximately 0.5 με [11]. Compared with conventional methods, DFOSS has many advantages for surface monitoring, including its safe application under electromagnetic interference, waterproof characteristics, high durability, small size, and passive mechanism [14]. Importantly, by using a single-mode fiber, distributed sensing can monitor deformations along the entire length of the optical fiber (at fixed spatial intervals), providing accurate high-resolution data to clarify the deformation of a structure [15].
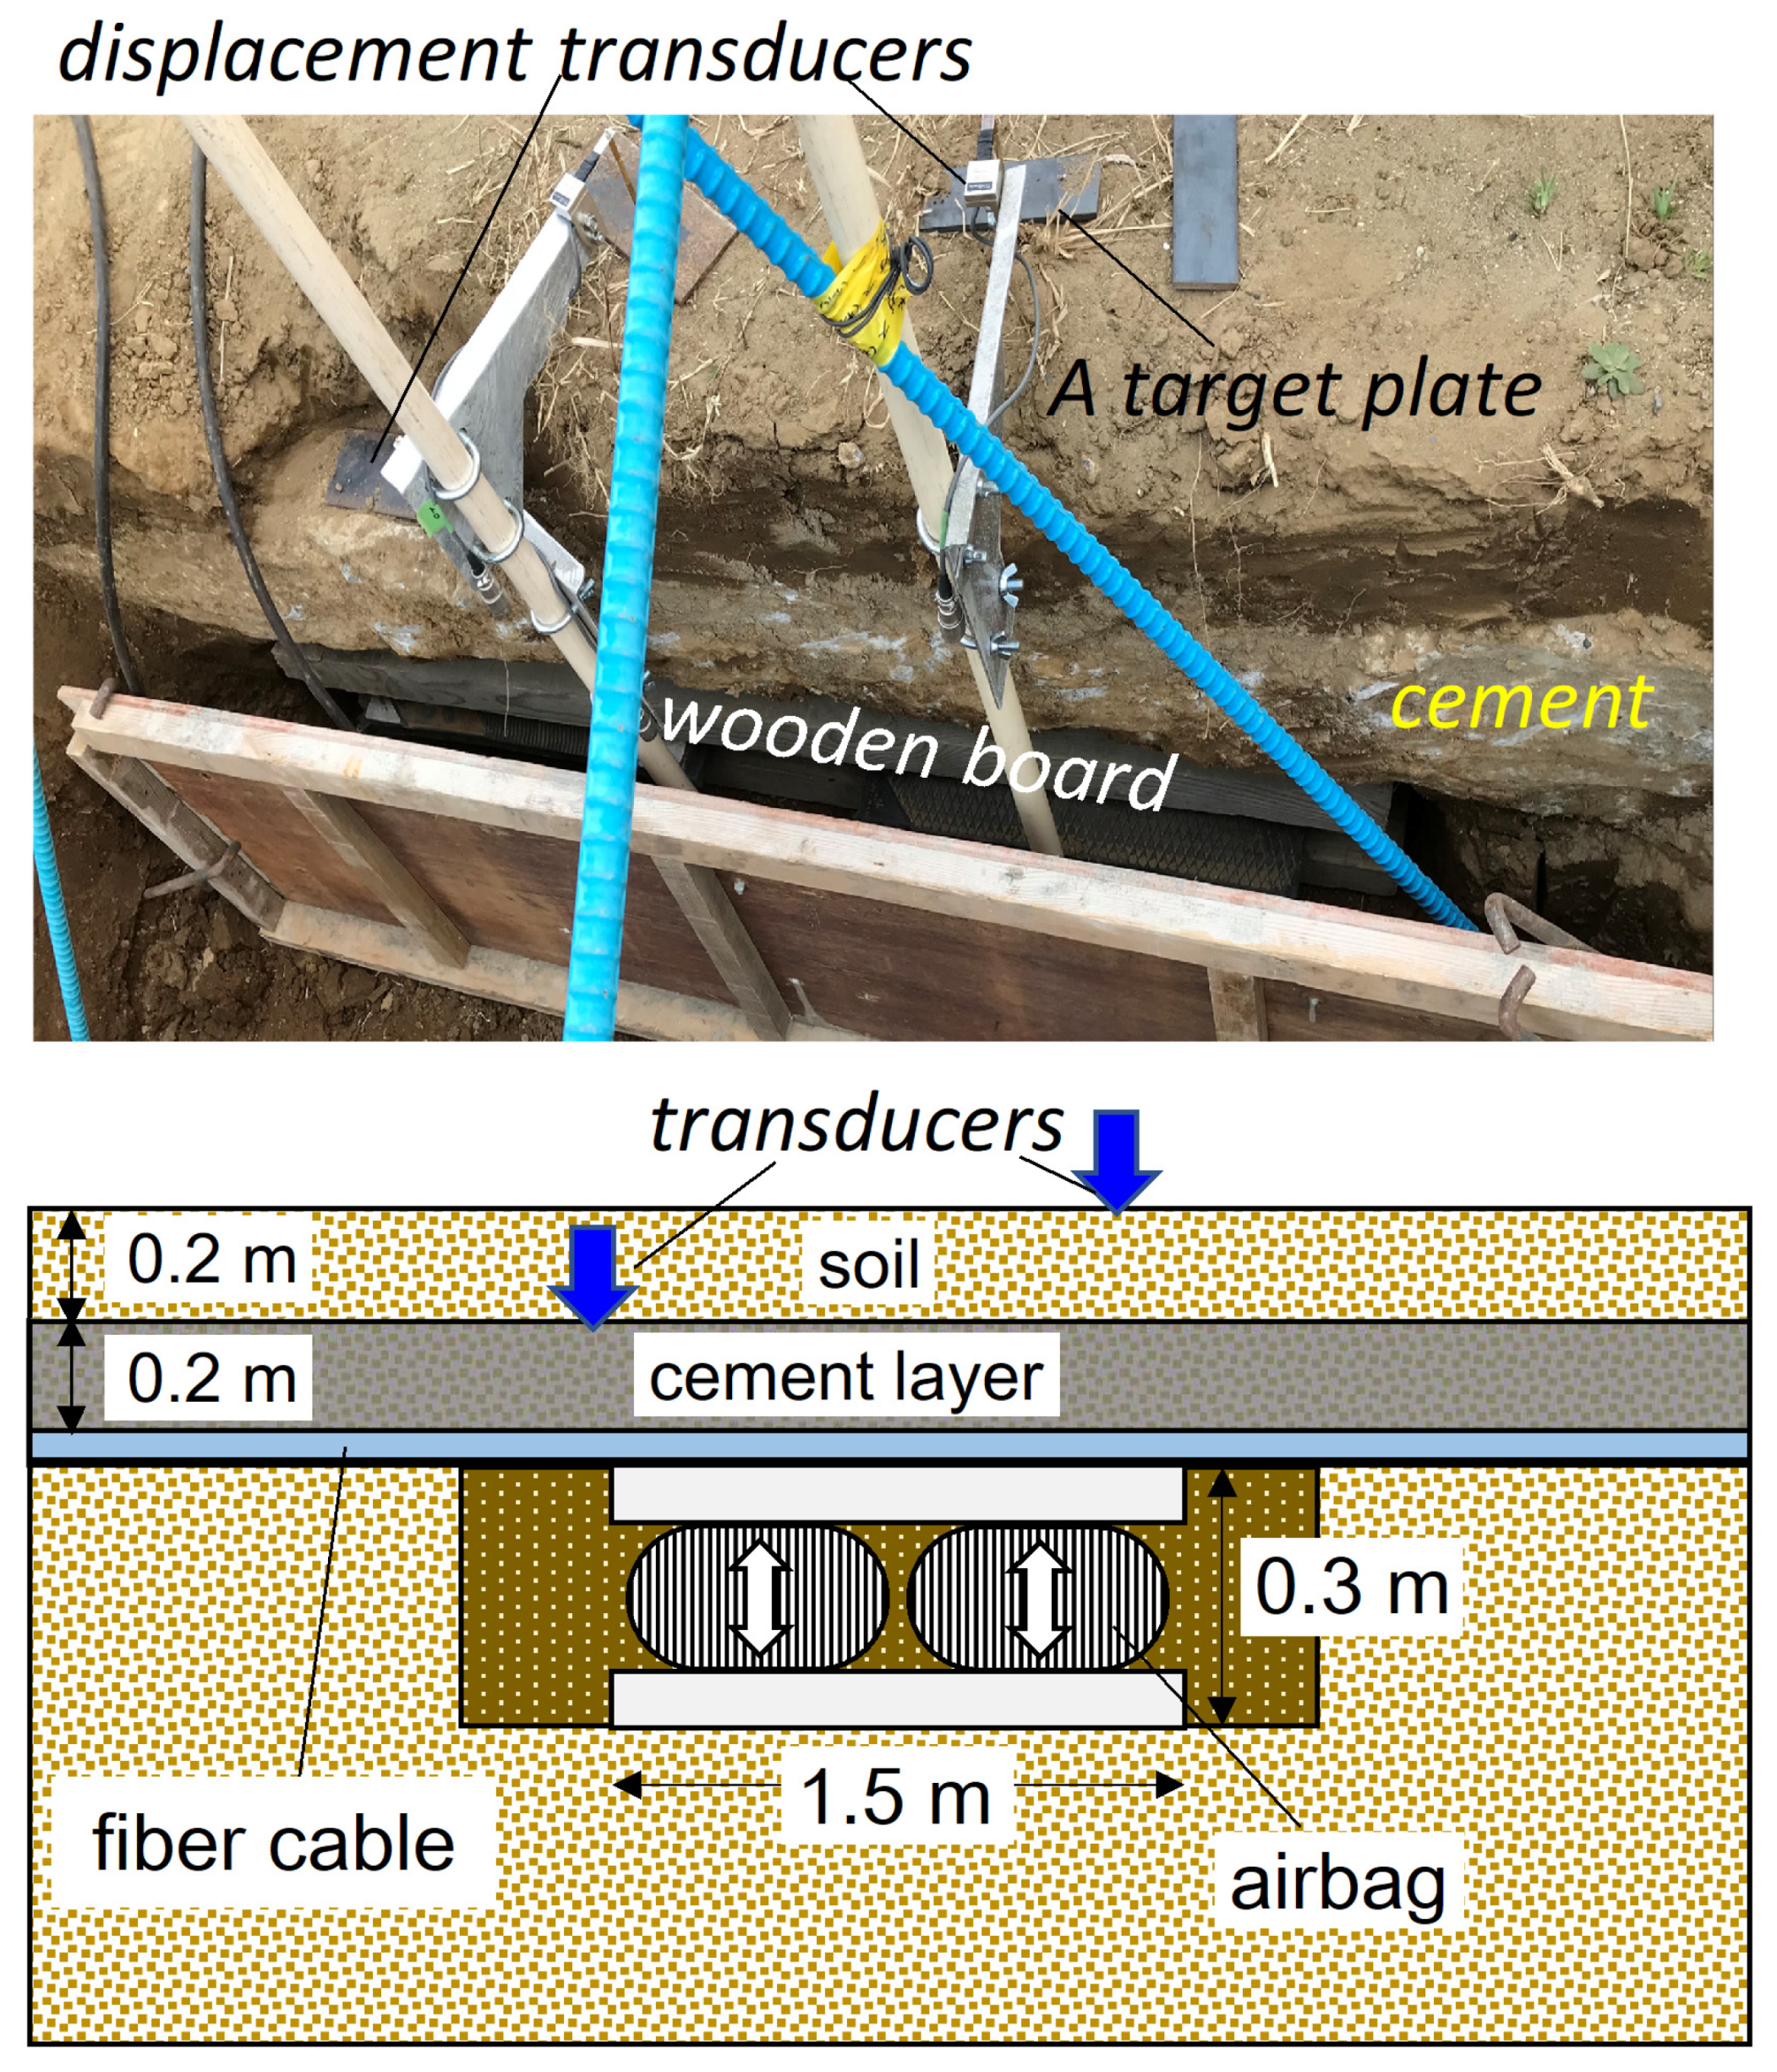
To achieve a high strain sensitivity, the method of cable installation must be carefully considered to avoid environmental effects. In this case, a fiber cable with a total length of approximately 2.9 km was installed in a shallow trench less than 50 cm deep. One part of the cable was covered with soil, while the other part was covered with cement. The first test was performed with the same load weight conditions for the two sections, and the strains were measured separately to confirm the best surface installation method.
In the previous studies strain was converted from Rayleigh frequency shifts recorded by a tunable-wavelength coherent optical time-domain reflectometer utilizing Rayleigh backscattered signals to detect deformation in the direction of length of the fiber cable [13,16,17] and the conversion coefficient is 0.130 ± 0.0096 GHz/με (1 GHz ≈ 7 με) [17,18]. In this study ground deformation occurs in a direction perpendicular to the fiber cable and Rayleigh frequency shifts can be converted to strain but strain cannot be explained directly as a vertical deformation of the ground surface. Surface deformations resulting from the static and dynamic loading, and airbag inflation/deflation tests were observed from Rayleigh frequency shifts recorded by the NBX-8000 interrogator produced by Neubrex Co., Ltd., Kobe, Japan. A single-mode embossed strain sensing fiber cable (FN-SILL-3, Neubrex Co., Ltd., Kobe, Japan) offers linear responses to 5000 με strain and long-term heat resistance up to 80 °C.

3. Field Testing for Monitoring Surface Deformation

3.1. Site Description

A shallow trench was excavated at the test site to install the fiber cable for the ground surface deformation monitoring. Figure 1 shows the fiber installation location at the test site, along with the locations for three tests at the soil-buried (red) and the cement-covered (black) segments.

3.2. Field Test Procedures and Results

3.2.1. First Test (Static Load): Iron Plate Loading Test

The first test was conducted by applying a static load. Iron plates were loaded above the fiber cable covered by soil, and the strain response was recorded over time. The iron plates had dimensions of 3 × 1.5 m, with a weight of 800 kg. In each stage, three plates (2.4 ton) were loaded, with a time interval of approximately 40 min between each stage. A total of five stages were applied for fifteen plates with a total weight of 12 tons. The same experiment was conducted again under the same conditions for the cable covered by cement, and the Rayleigh frequency shift was recorded as this section was loaded. A thermometer was installed at a location and the soil temperature near the fiber depth in the ground was continuously measured in order to assess the effect of environmental temperature on the strain measurements.
For this test, Figure 2 shows the Rayleigh frequency shifts over cable length for the fiber covered by soil (a, b) and by cement (c, d). Figure 2a shows the Rayleigh frequency shifts for the first three stages (2.4 ton, 4.8 ton, and 7.2 ton shown in blue, green, and black, respectively), while Figure 2b shows the Rayleigh frequency shifts for the last three stages (7.2 ton, 9.6 ton, and 12 ton shown in black, purple, and pink, respectively). In both panels, at the plate position (2152.5–2155.5 m), the frequency shifts alternated between negative (indicating subsidence) and positive (indicating uplift). The frequency increased as the load increased on both sides during the last three stages, reaching +2.5 GHz and +3 GHz, as shown in Figure 2b.
Figure 2c,d show the Rayleigh frequency shift as a function of cable length for the fiber covered with cement. The results for the first three stages (blue, green, and black lines shown for 2.4 ton, 4.8 ton, and 7.2 ton, respectively) are shown in Figure 2c, while Figure 2d shows the Rayleigh frequency shift with the cable length for the last three stages (black, purple, and pink lines shown for 7.2 ton, 9.6 ton, and 12 ton, respectively).
For both figures, positive frequency peaks can be clearly observed on both sides of the plate position (indicating uplift), with negative frequency values at the plate position (indicating subsidence). The frequency shifts increased in both directions in the (negative, positive) direction as the load increased, especially during the last three stages, reaching +2 GHz (uplift) and -7 GHz (subsidence), as shown in Figure 2d.
Two T-type thermocouples connected to a data logger (Tokyo Measuring Instruments Laboratory, Tokyo, Japan) were used to monitor air and soil temperature change in this study. Figure 3 shows the air and soil temperature measurement result from 9:00 am to 4:30 pm during the iron plate loading test. The air temperature increased by roughly 4 °C by 1:00 pm due to exposure to sunlight and decreased gradually to about 10 °C until 4:30 pm. In spite of the air temperature variation the soil temperature (red line) was almost constant roughly 7 °C throughout the loading test period. This result suggests there is no temperature effect on the Rayleigh frequency shift in ground surface measurement.

3.2.2. Second Test (Dynamic Load): Water Tank Filling Up Loading Test

This test was conducted by filling water into a tank with dimensions of 3.3 m × 1.5 m, an original weight of 1.7 ton, and a total water capacity of 8 m³. The tank was placed on the fiber cable covered with cement (Figure 1). The water filling started on 17 February 2021 at 9:30 am and gradually increased to reach roughly 7 m³, with the filling ending at 16:00 (for totally 6 and half hours). The Rayleigh frequency shift was continuously monitored by recording time-lapse changes during the filling step and after the filling step. Two thermometers were also installed at the experimental location, and the soil temperature was continuously measured to determine the effect of the environmental temperature on the strain measurements.
Figure 4a presents the Rayleigh frequency shift along the cable during filling (dashed line) and after filling (red line). The two lines show two positive peaks around the tank sides with different magnitudes, indicating uplift, and negative values in the middle (at the tank position), indicating subsidence, with respect to the different magnitudes in each stage. During the filling process, the positive frequency reached a maximum of +3 GHz for both sides (2068 m, 2073 m) and a minimum of −3 GHz at 2071.4 m. After the filling process, the magnitude increased on both sides at the same positions, reaching +3.9 GHz, +5 GHz, and −5 GHz, respectively.
Figure 4b shows the relation between the water filling level (black dashed line) and frequency shift as a function of time at 2071.4 m (corresponding to the maximum frequency shift during and after filling), which is represented by a red line. The filling increased gradually, and the frequency decreased over time, reaching −3 GHz by the end of this process, which indicates subsidence during the water loading process.

3.2.3. Third Test (Substance and Uplifting): Airbag Test

This test was conducted in two parts. The first part was performed during preparatory work when a power shovel was placed above the cable covered by cement. After a trench was dug next to the buried cable the power shovel was removed. Then, the soil under the cable was removed for the airbag test. The Rayleigh frequency shift of the fiber cable was monitored during this excavation process.
In the second part of the experiment, two airbags were deployed in an open space excavated by removing soils carefully from underneath the cement layer without damaging the fiber cable, as shown in Figure 5. For this experiment, two steps were performed. First, the bags were filled with air, with the airbag pressure gradually increasing from 25 kPa to 125 kPa in five stages. In each stage, the pressure increased by 25 kPa. The Rayleigh frequency shift was measured during this process and displacements of the cement layer and ground surface were measured by the cantilever type displacement transducers (strain gauges mounted on a cantilever), shown as two thick blue arrows in Figure 5. Second, the airbag pressure was gradually reduced in the same stepwise manner to return to 0, and the Rayleigh frequency shift response to the pressure reduction was recorded.
The DFOSS results clearly show subsidence at the shovel position and the excavation position. Figure 6 shows that the Rayleigh frequency shift changed from 0 to −1 GHz, suggesting subsidence under the power shovel and small deformation (uplift) also observed at both sides of the shovel position. Excavation of soil from underneath of the cement layer caused much larger deformations as evidenced by the Rayleigh frequency shift up to approximately −2.5 GHz at the excavation position. The right side close to the excavation position showed a larger frequency shift than the left side due the interaction between the shovel weight loading and the excavation. The frequency shift returned to nearly 0 after the shovel was removed (Figure 6d), excepting the interaction portion caused by the excavation.
For the second part (airbag test), the change in Rayleigh frequency shift due to the increased pressure (airbag inflation) is shown in Figure 7a as a function of the cable length. The Rayleigh shift increased as the air pressure gradually increased, reached +16 GHz for a pressure of 125 kPa, indicating uplift above the two airbags. For the air pressure reduction, Figure 7b shows the Rayleigh frequency shift as a function of the cable length for each stage. The frequency shift changed from +16 GHz for a pressure of 125 kPa and gradually decreased to approximately 2 GHz for a pressure of 0 kPa.
The Rayleigh frequency shifts also observed at both sides of the airbag position during the inflation and deflation process. In Figure 7 the frequency shift reached -7 GHz for the air pressure of 125 kPa, indicating subsidence. The frequency shift reduced to nearly 0 GHz, indicating subsidence almost recovered when the air pressure decreased to 0 kPa. However, the frequency shift remained approximately 2 GHz at the airbag position, suggesting the residual deformation (uplift) caused by the air pressure changes.
For comparison, deformations of the ground surface and the cement layer are shown in Figure 8. The uplift displacements of the ground surface and the cement layer agreed well in the three early steps as the airbag pressure increased to 75 kPa. At the two late steps the ground surface uplift is a little larger than that of the cement layer and the uplift is less than 2 mm for the pressure of 125 kPa. When decreasing the pressure from 125 kPa to 0 kPa in five steps, the ground surface displacement is larger than that of the cement layer at all steps. For the pressure of 0 kPa the cement layer displacement retained a small uplift but the ground surface showed slight subsidence compared to the original conditions.

4. Discussion

Based on previous studies on fiber strain sensing, e.g., [13,17,18,19], DFOSS can successfully monitor geomechanical deformations caused by fluid injection. These deformations can be continuously monitored along a wellbore. To correlate subsurface deformation with ground surface deformation, fiber optic strain sensing must be combined with other conventional surface monitoring methods. Although considerable achievements have been reported, challenges remain in detecting localized deformation, in addition to limitations regarding continuous temporal monitoring for cases of fluid injection-induced deformation. Surface deformation mapping requires continuous spatiotemporal monitoring points on the surface, which cannot be achieved by DFOSS wellbore installation alone. Therefore, the installation of DFOSS in the surface to monitor ground deformation along the cable could be an effective approach, especially when combined with well-based strain sensing.
This study indicates that DFOSS is a valuable technique for surface deformation monitoring. We aimed to determine a practical method for fiber installation and then to confirm DFOSS as a surface deformation technology via pilot field tests, using several experiments to test the sensitivity of DFOSS for different cases of surface deformation.

4.1. Fiber Installation for Surface Ground Deformation Monitoring

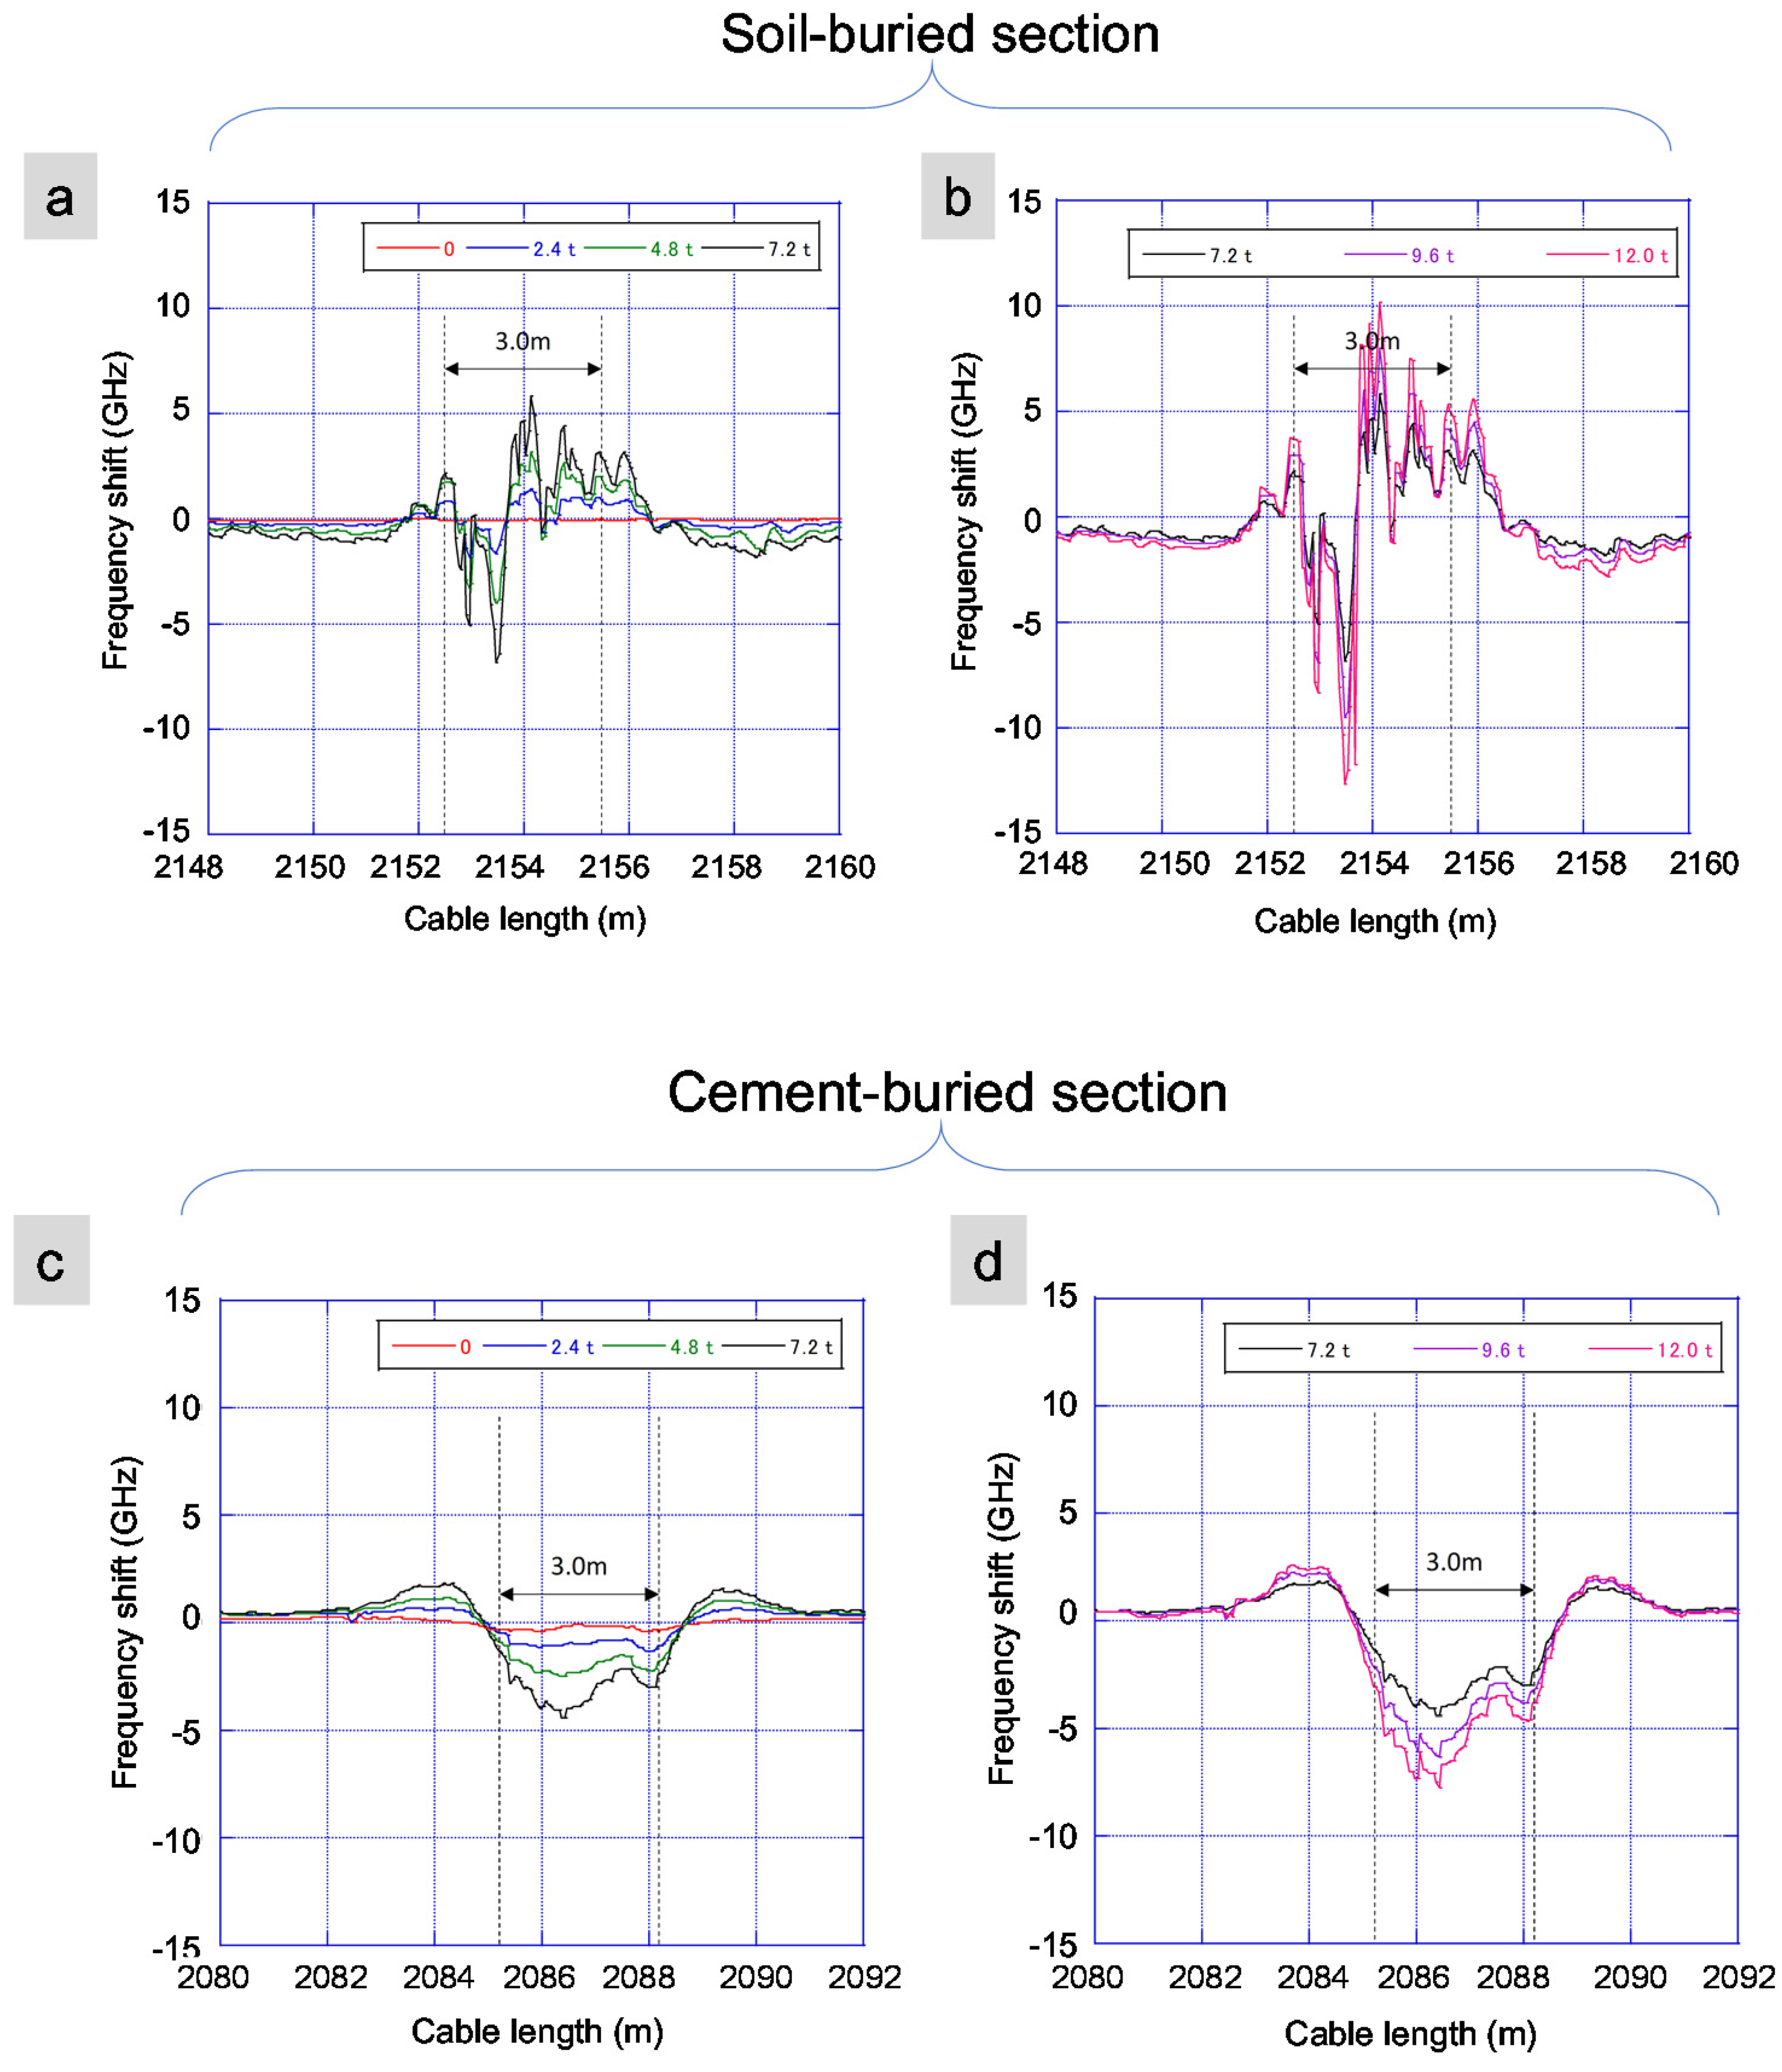
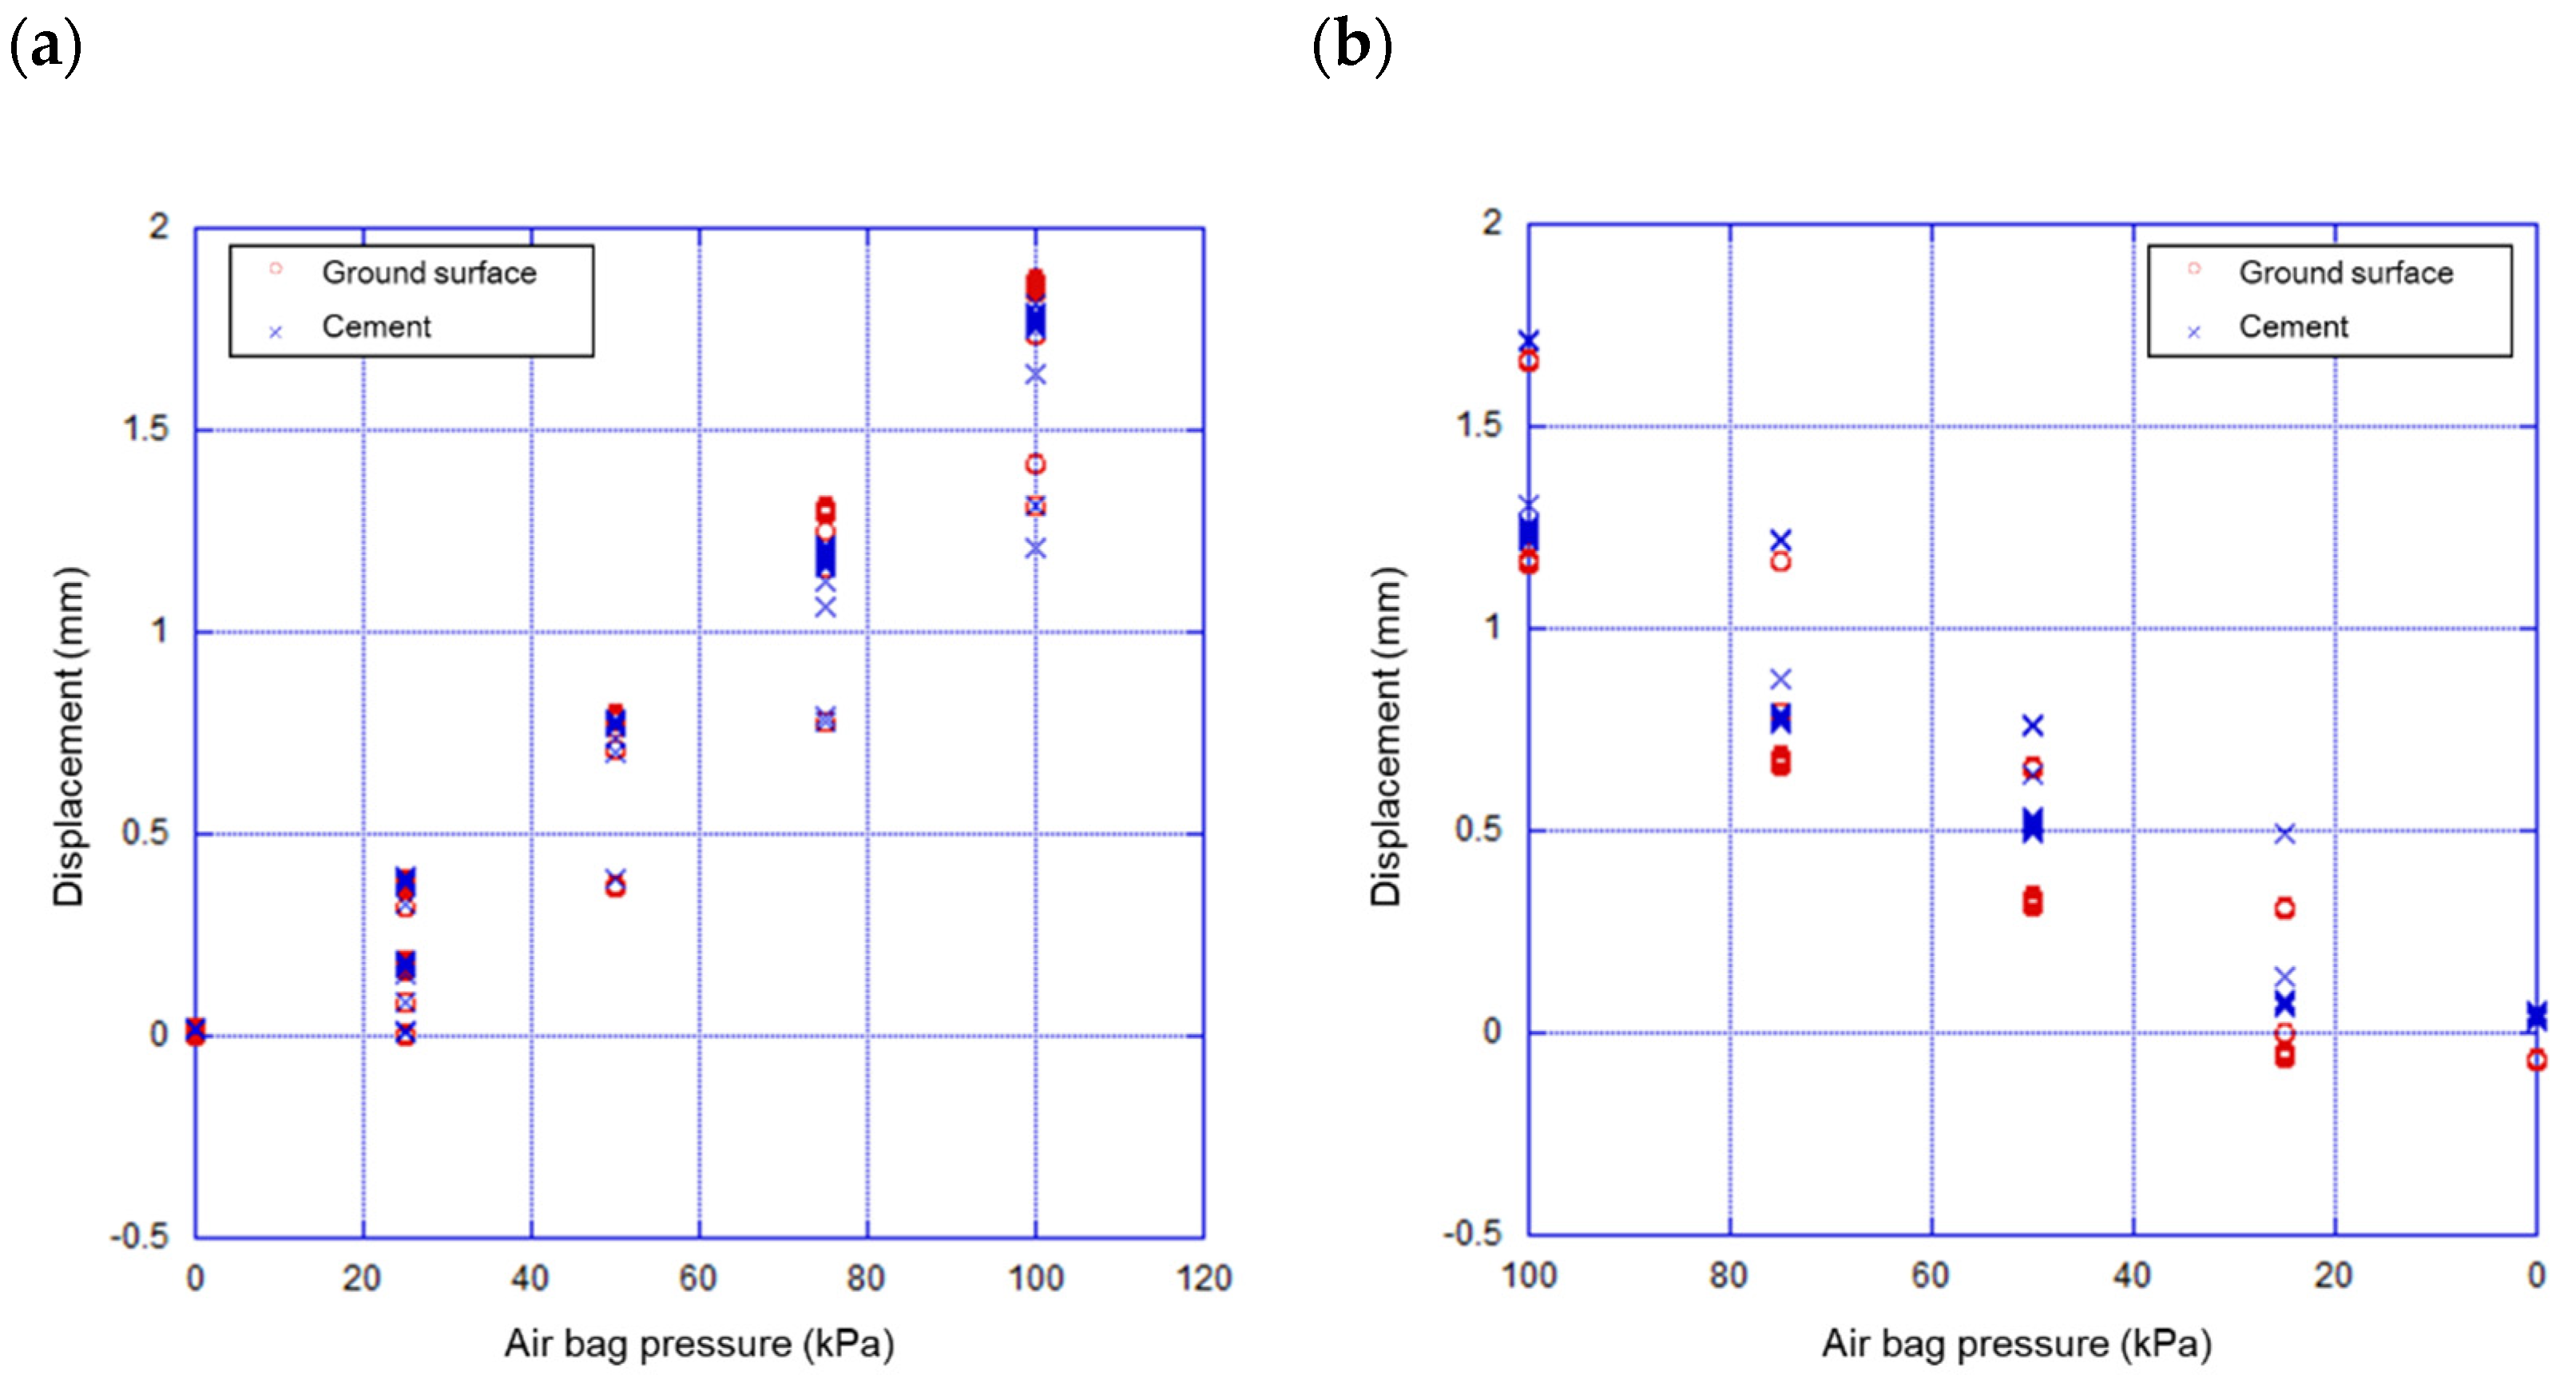
Based on the results from the first static loading test for the fiber covered with soil, the subsidence and uplift obtained together at the plate position indicated that the soil had loosened and then compacted under the load, causing weak coupling of the cable with the ground, as shown in Figure 9a. This result suggests that the deformation strongly depends on the soil conditions in this case. Therefore, for long-term (permanent) monitoring, baseline data monitoring results may change due to weather conditions (rainy, dry). For the cement-covered fiber, the negative Rayleigh frequency shifts indicated subsidence induced by loading at the plate position, with an area of uplift on each side, as shown in Figure 9b.
This result indicates that the baseline is stable, with limited environmental effects. Hence, for long-term monitoring, this method will be suitable for obtaining stable baseline conditions and for accurately detecting deformations. The same results were observed for the final stage of iron plate loading. The deformation due to loading is clearer for the cable covered with cement compared with the cable covered by soil. The results also suggest that the cement-covered fiber more rapidly recorded the strain, with greater sensitivity at the plate position. In addition, uplifting is also observed on the sides of the plates around the subsidence. Based on our results, the cement-covered method of fiber installation is recommended for long-term ground surface deformation monitoring.

4.2. Locating of the Deformed Position and Subsidence-Uplift Monitoring

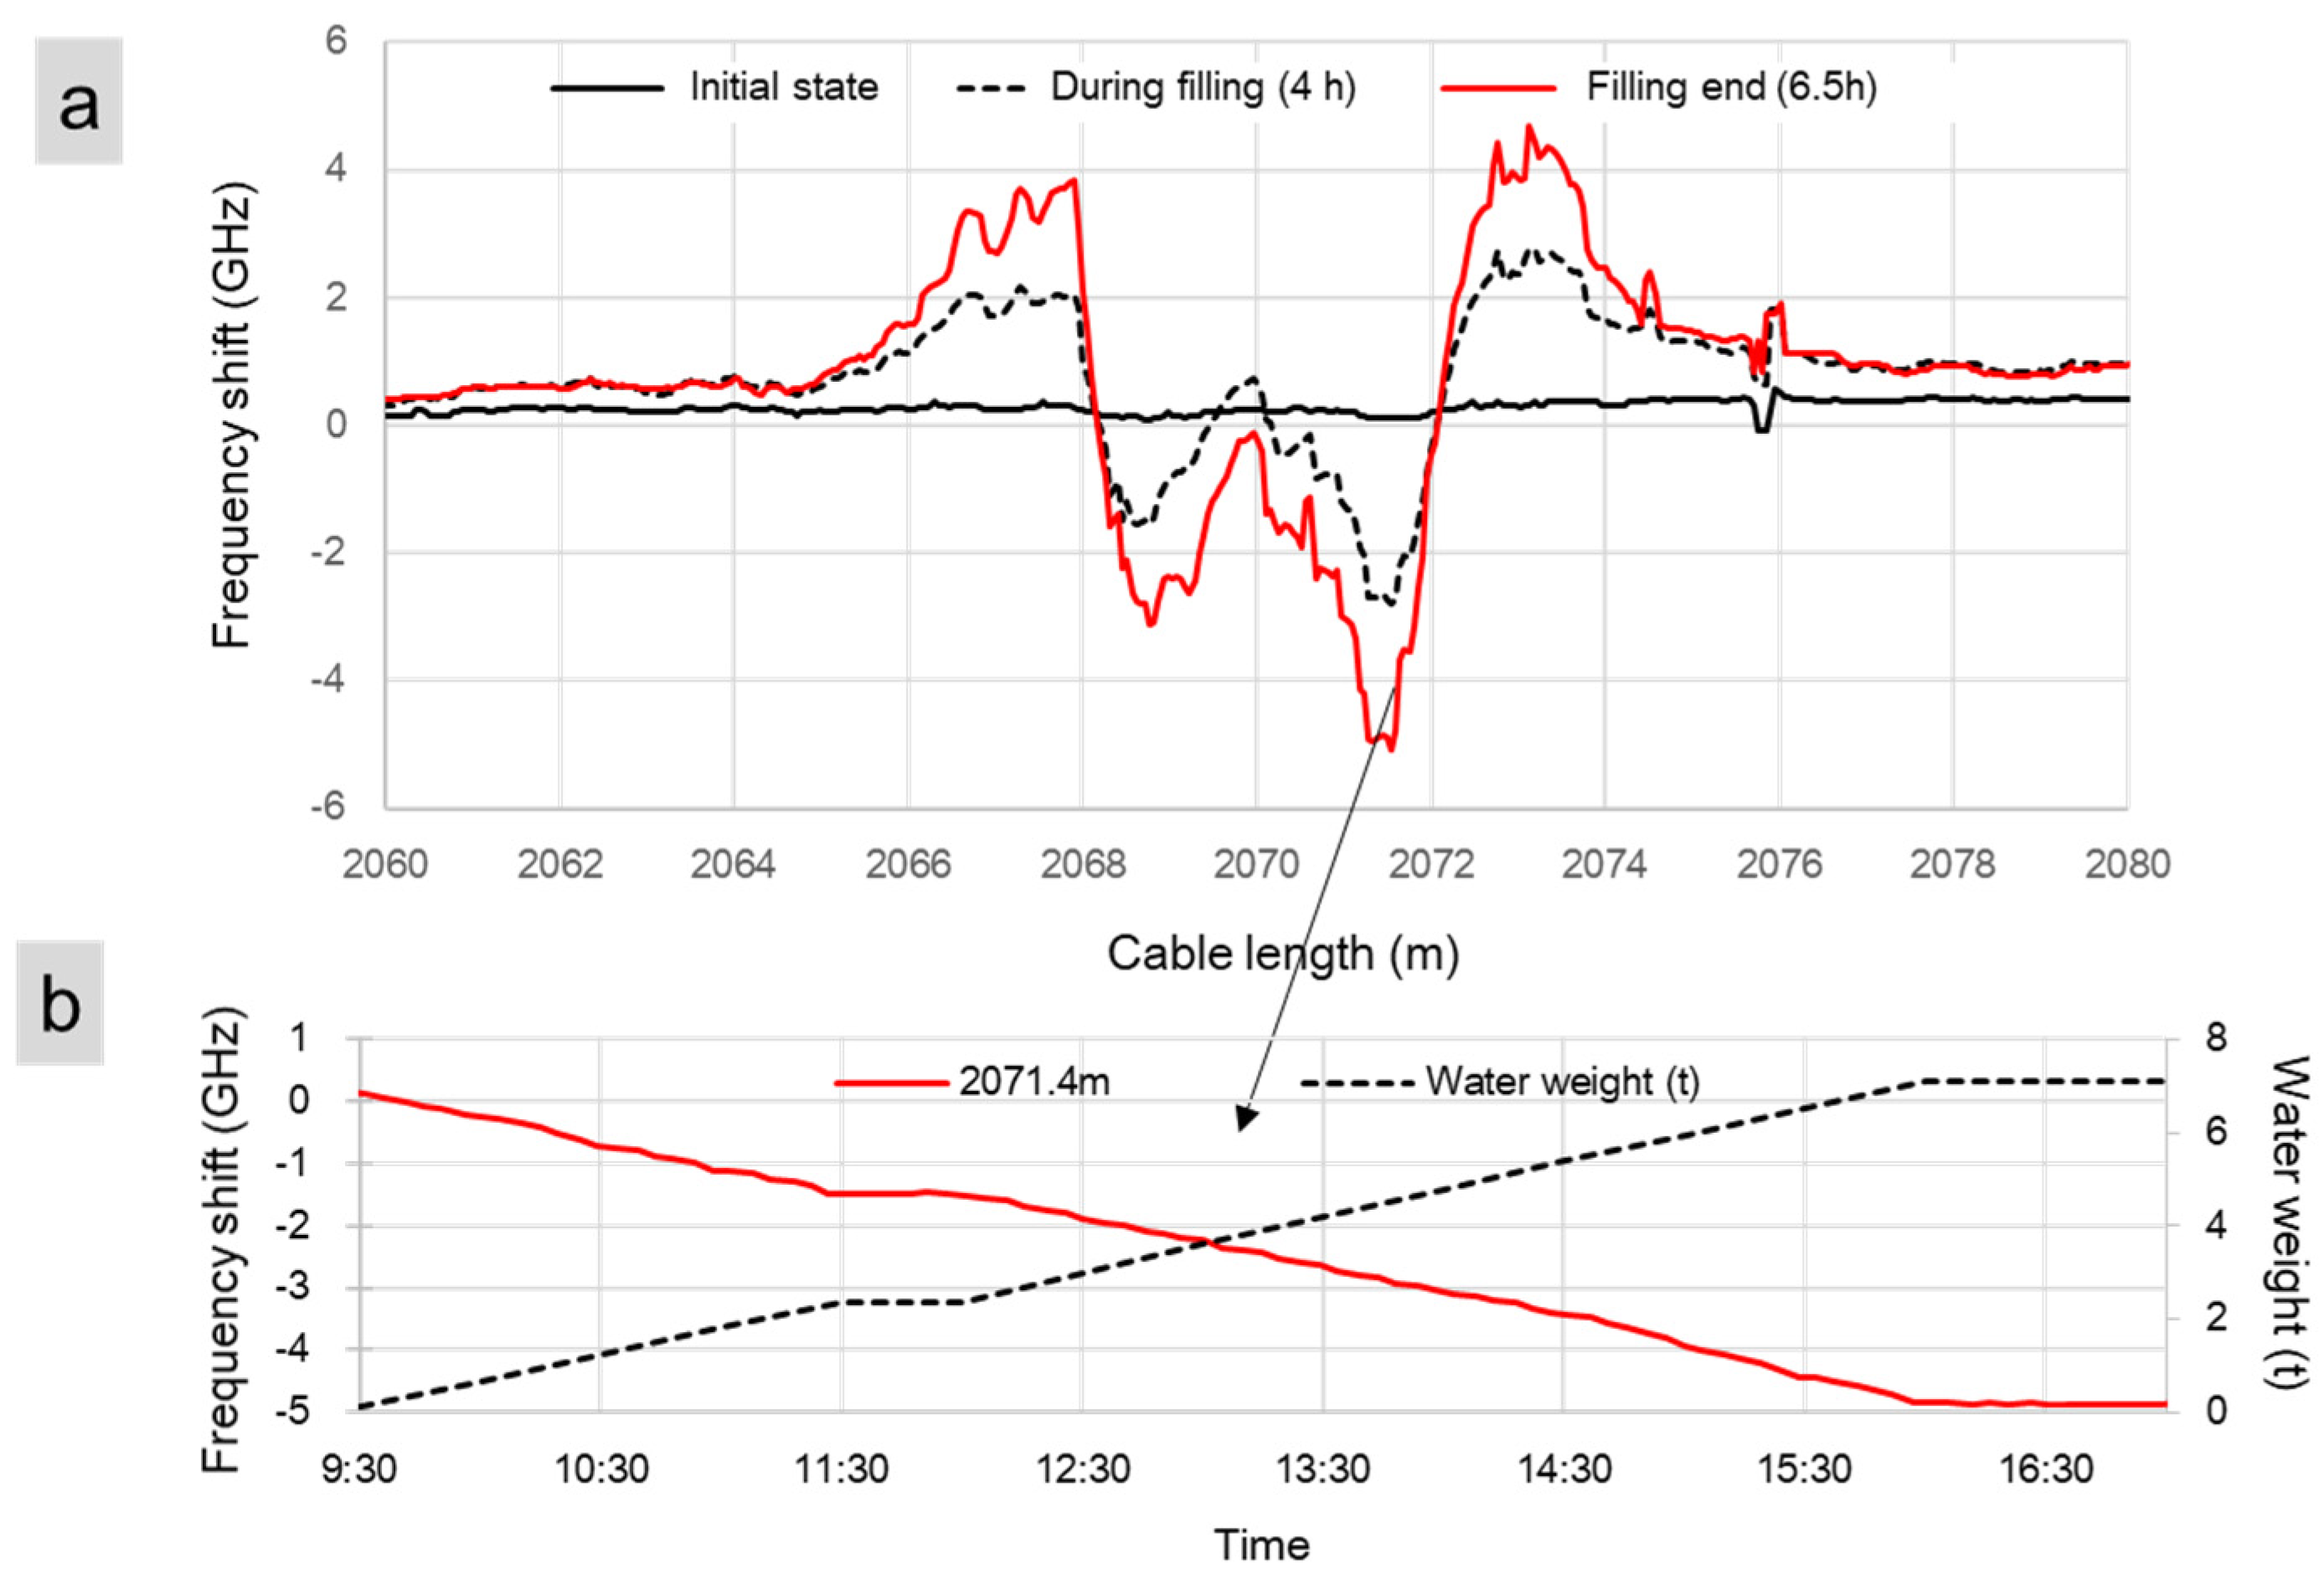
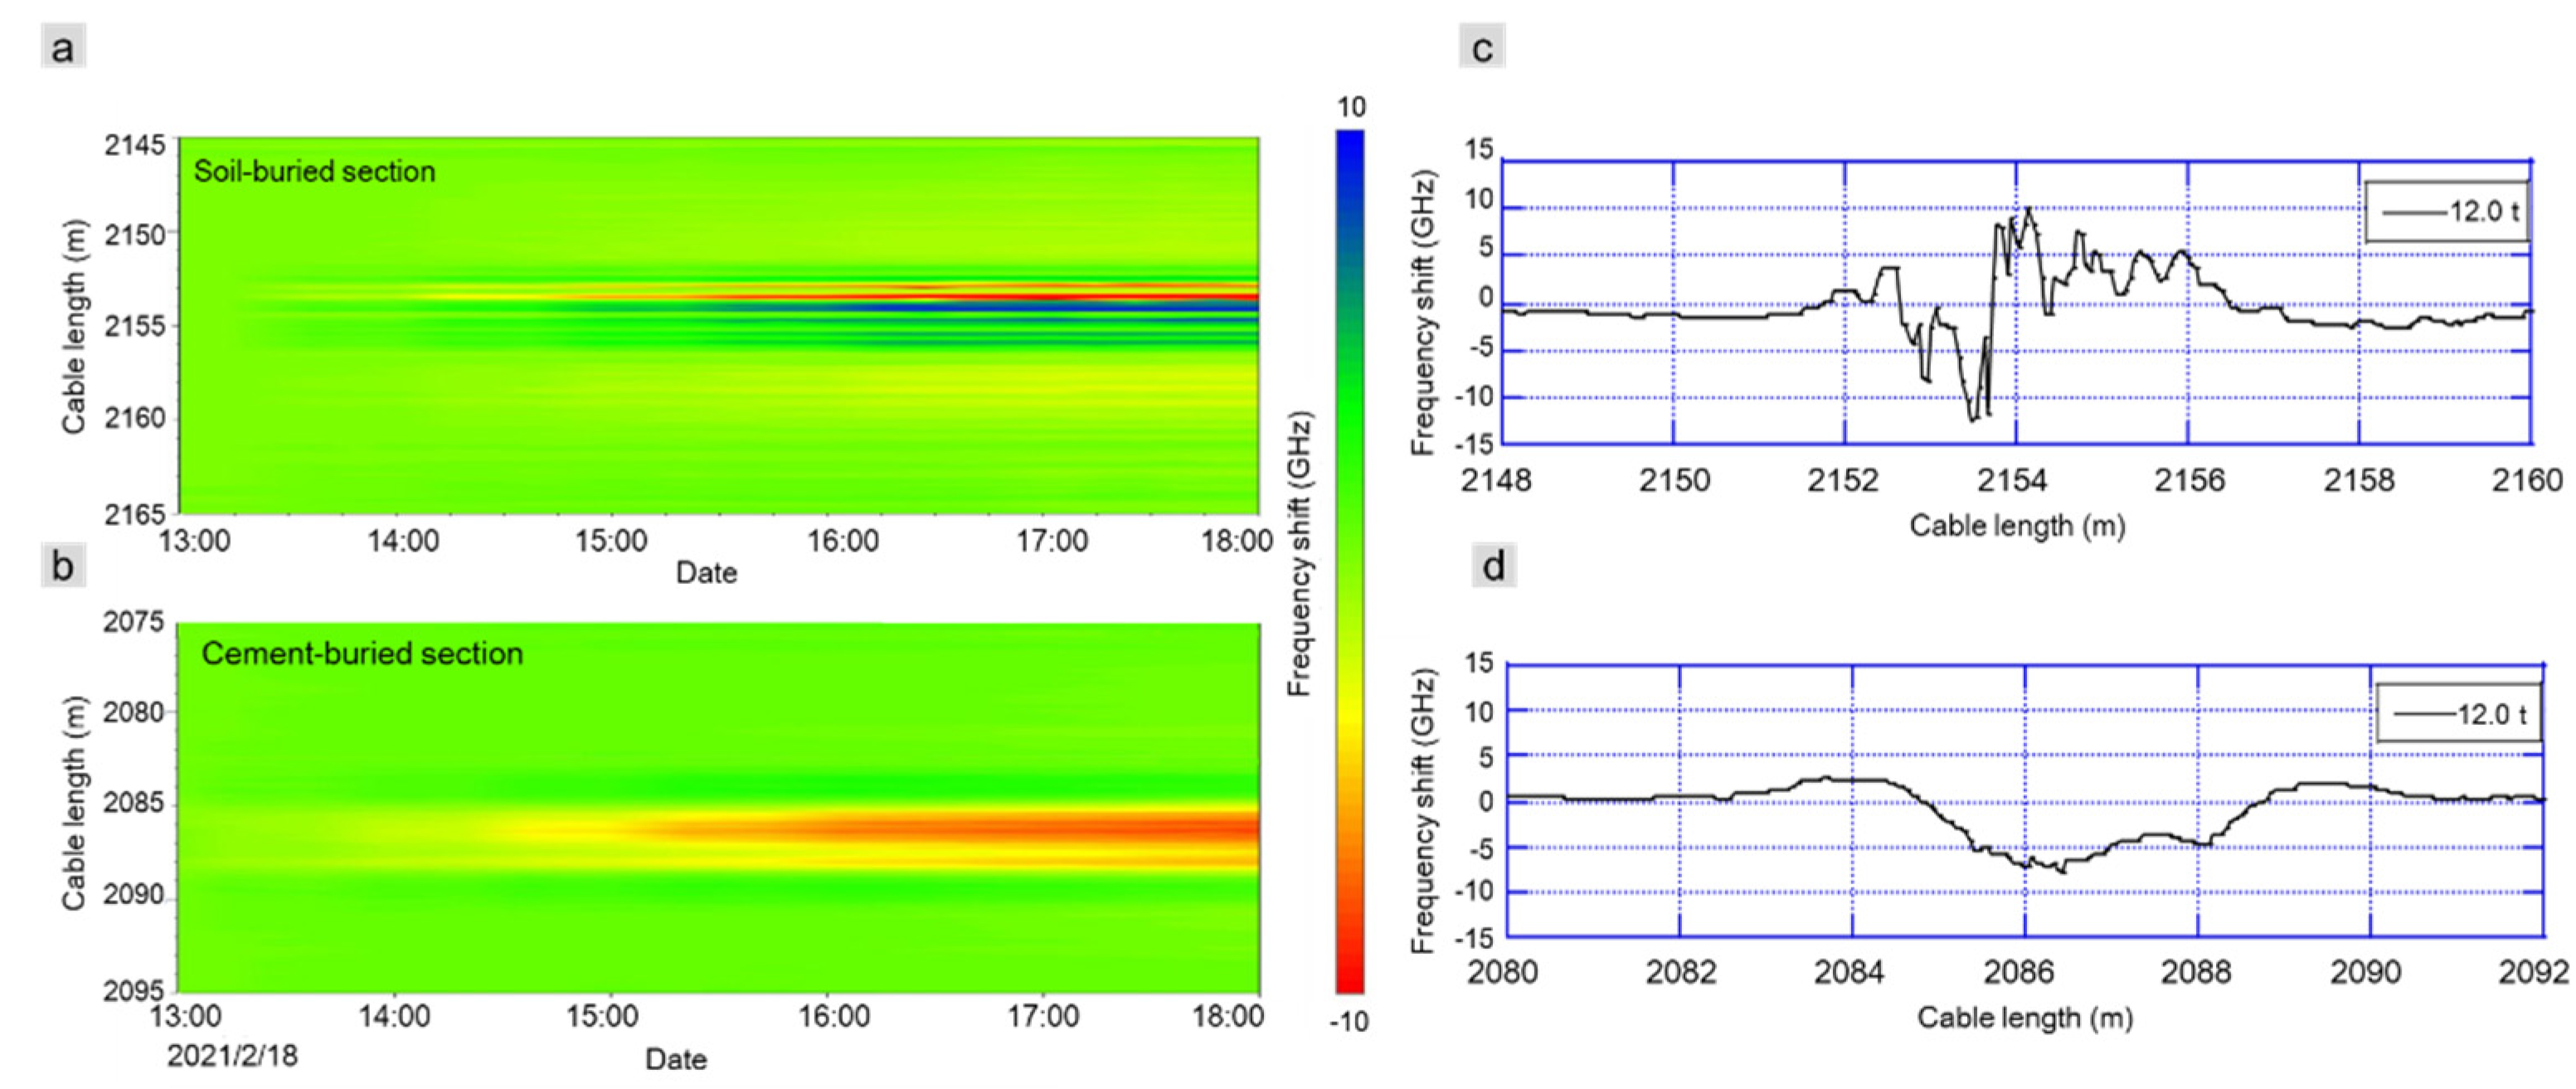
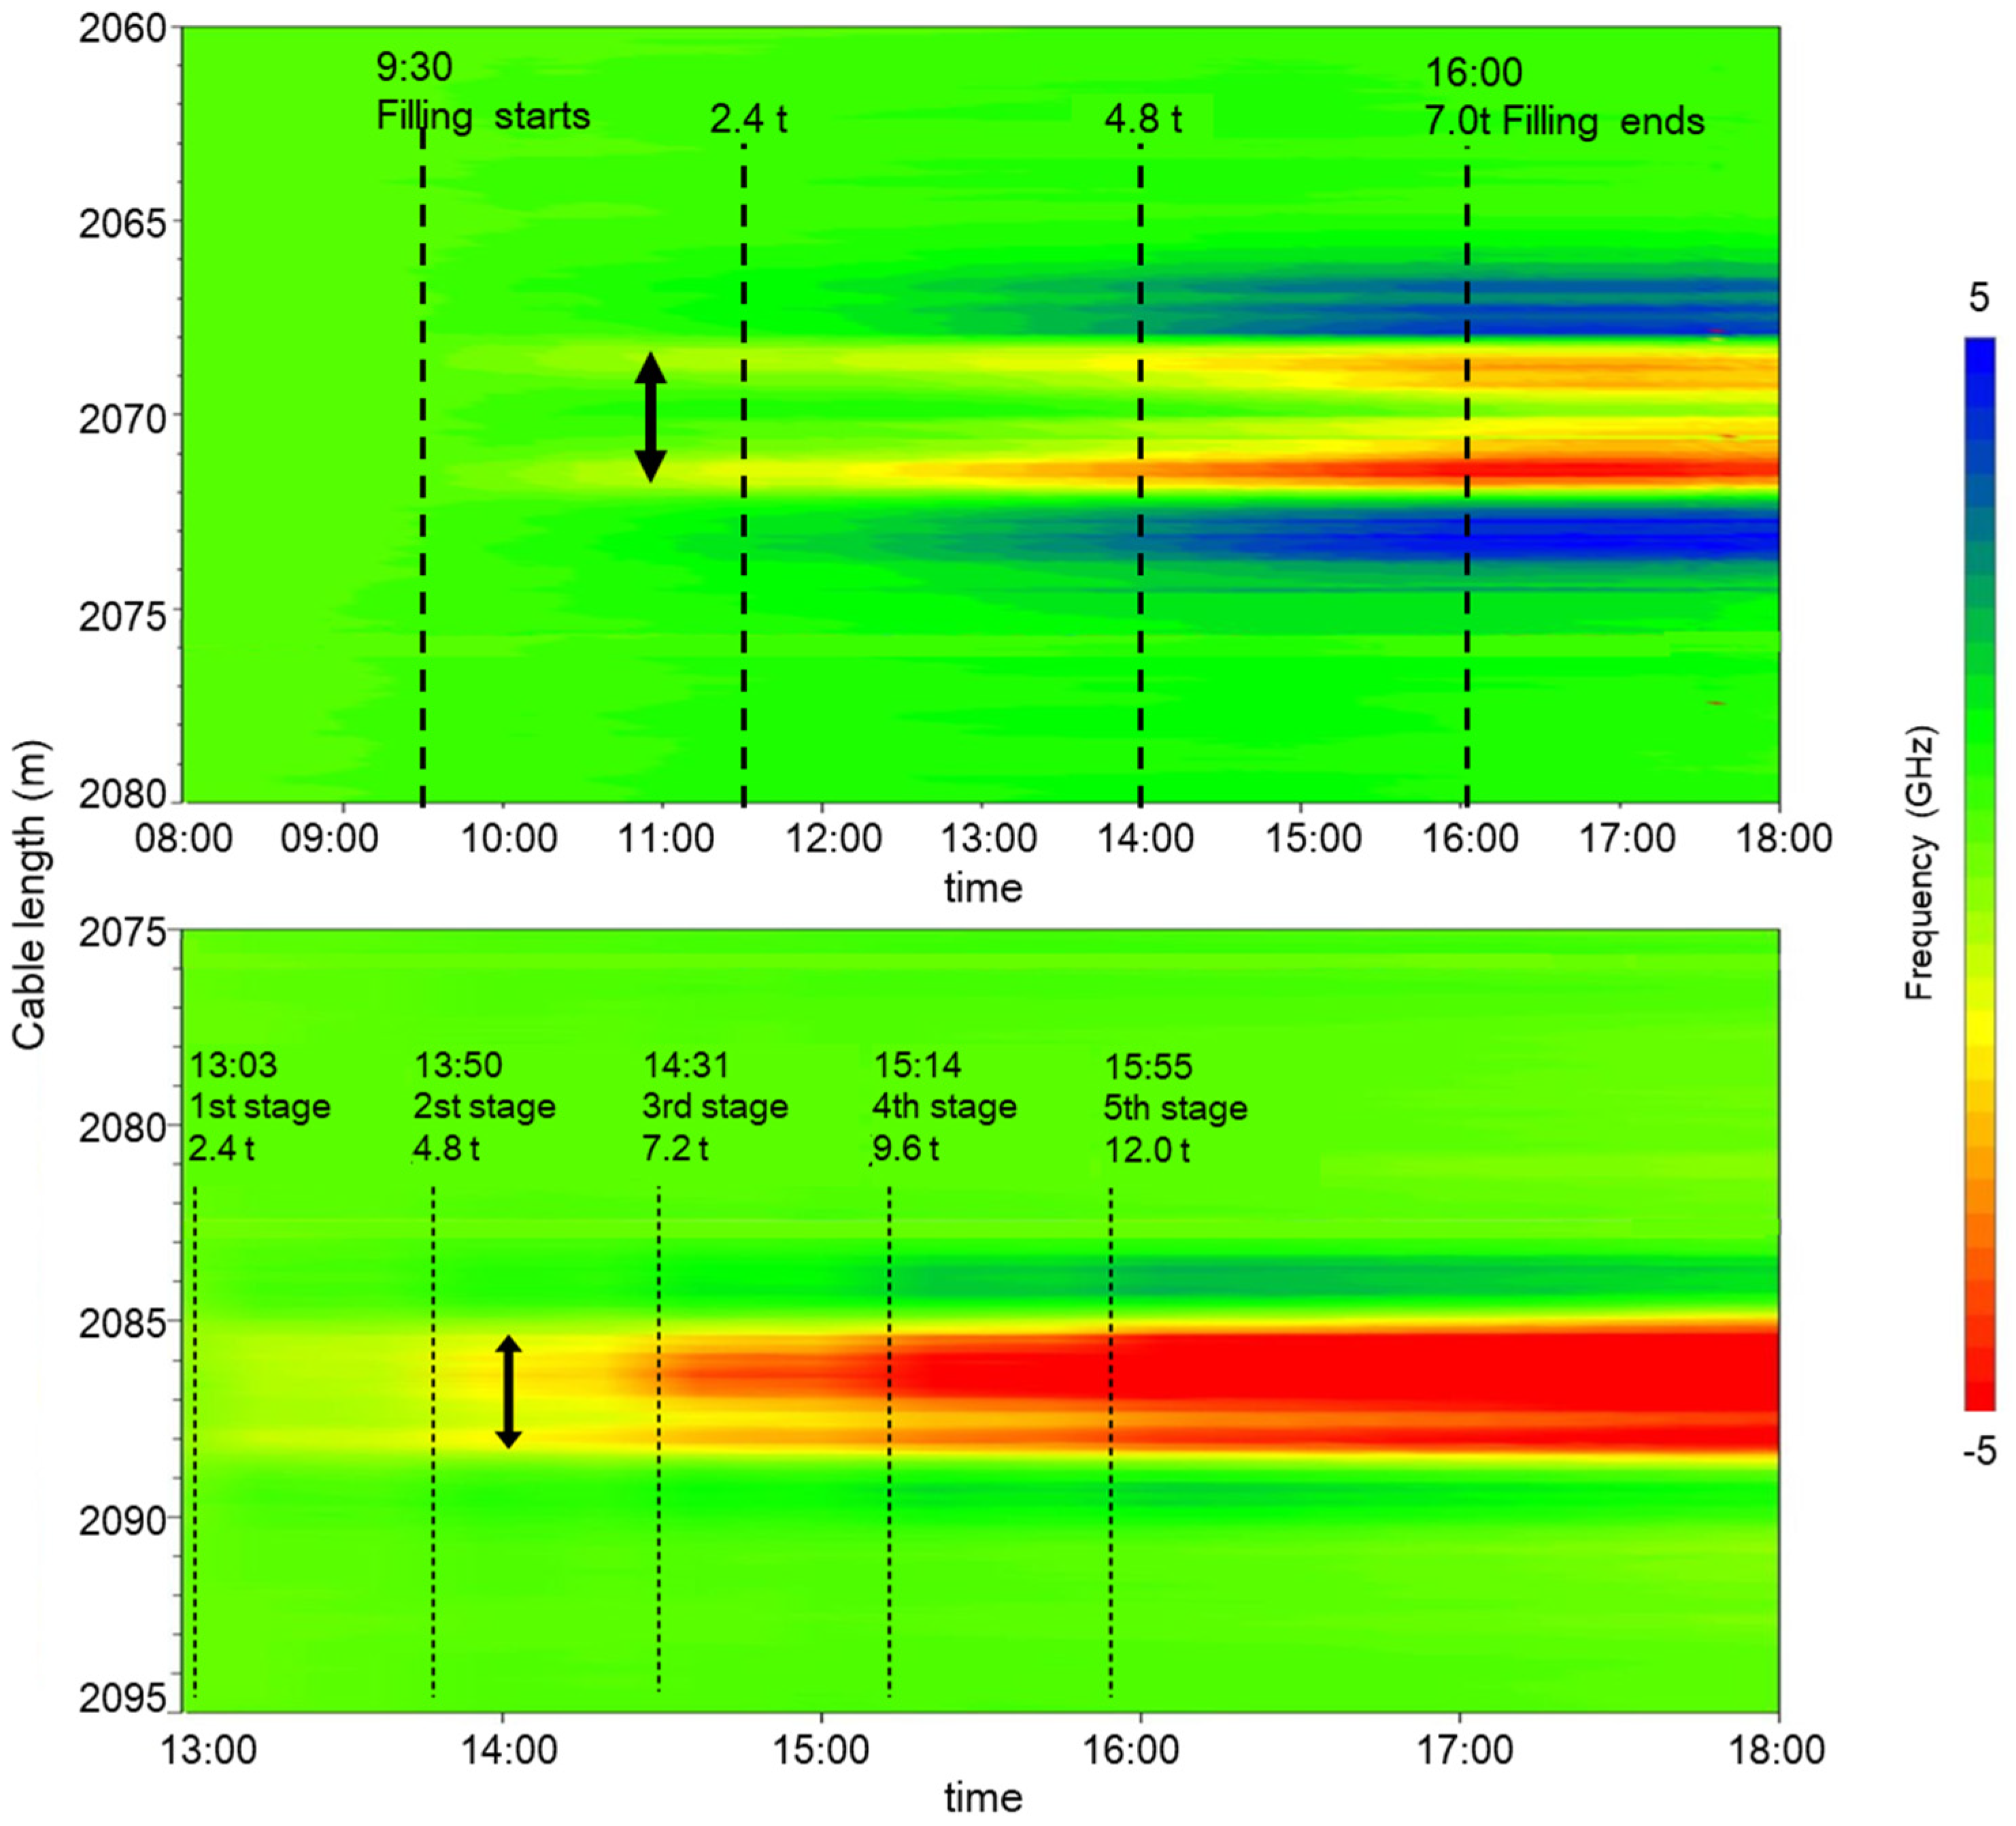
The results of the second test show a clear profile, with subsidence appearing under the tank due to the dynamic water filling up loading. Uplift was observed at the two sides approximately 1.5 h after the water filling process started. In Figure 10, the upper panel shows the time-lapse change in the frequency shit over the cable length for the fiber covered by cement, and water level changes are shown in the lower panel. The deformation magnitude increased over time as the water level increased, reaching a maximum when the filling stopped. The deformation maintained a constant magnitude, with the red color in the figure indicating subsidence and the blue color indicating uplift on the two sides. This result suggests that DFOSS can accurately detect deformations and anomalies along the cable for a long-term spatiotemporal surface deformation monitoring.
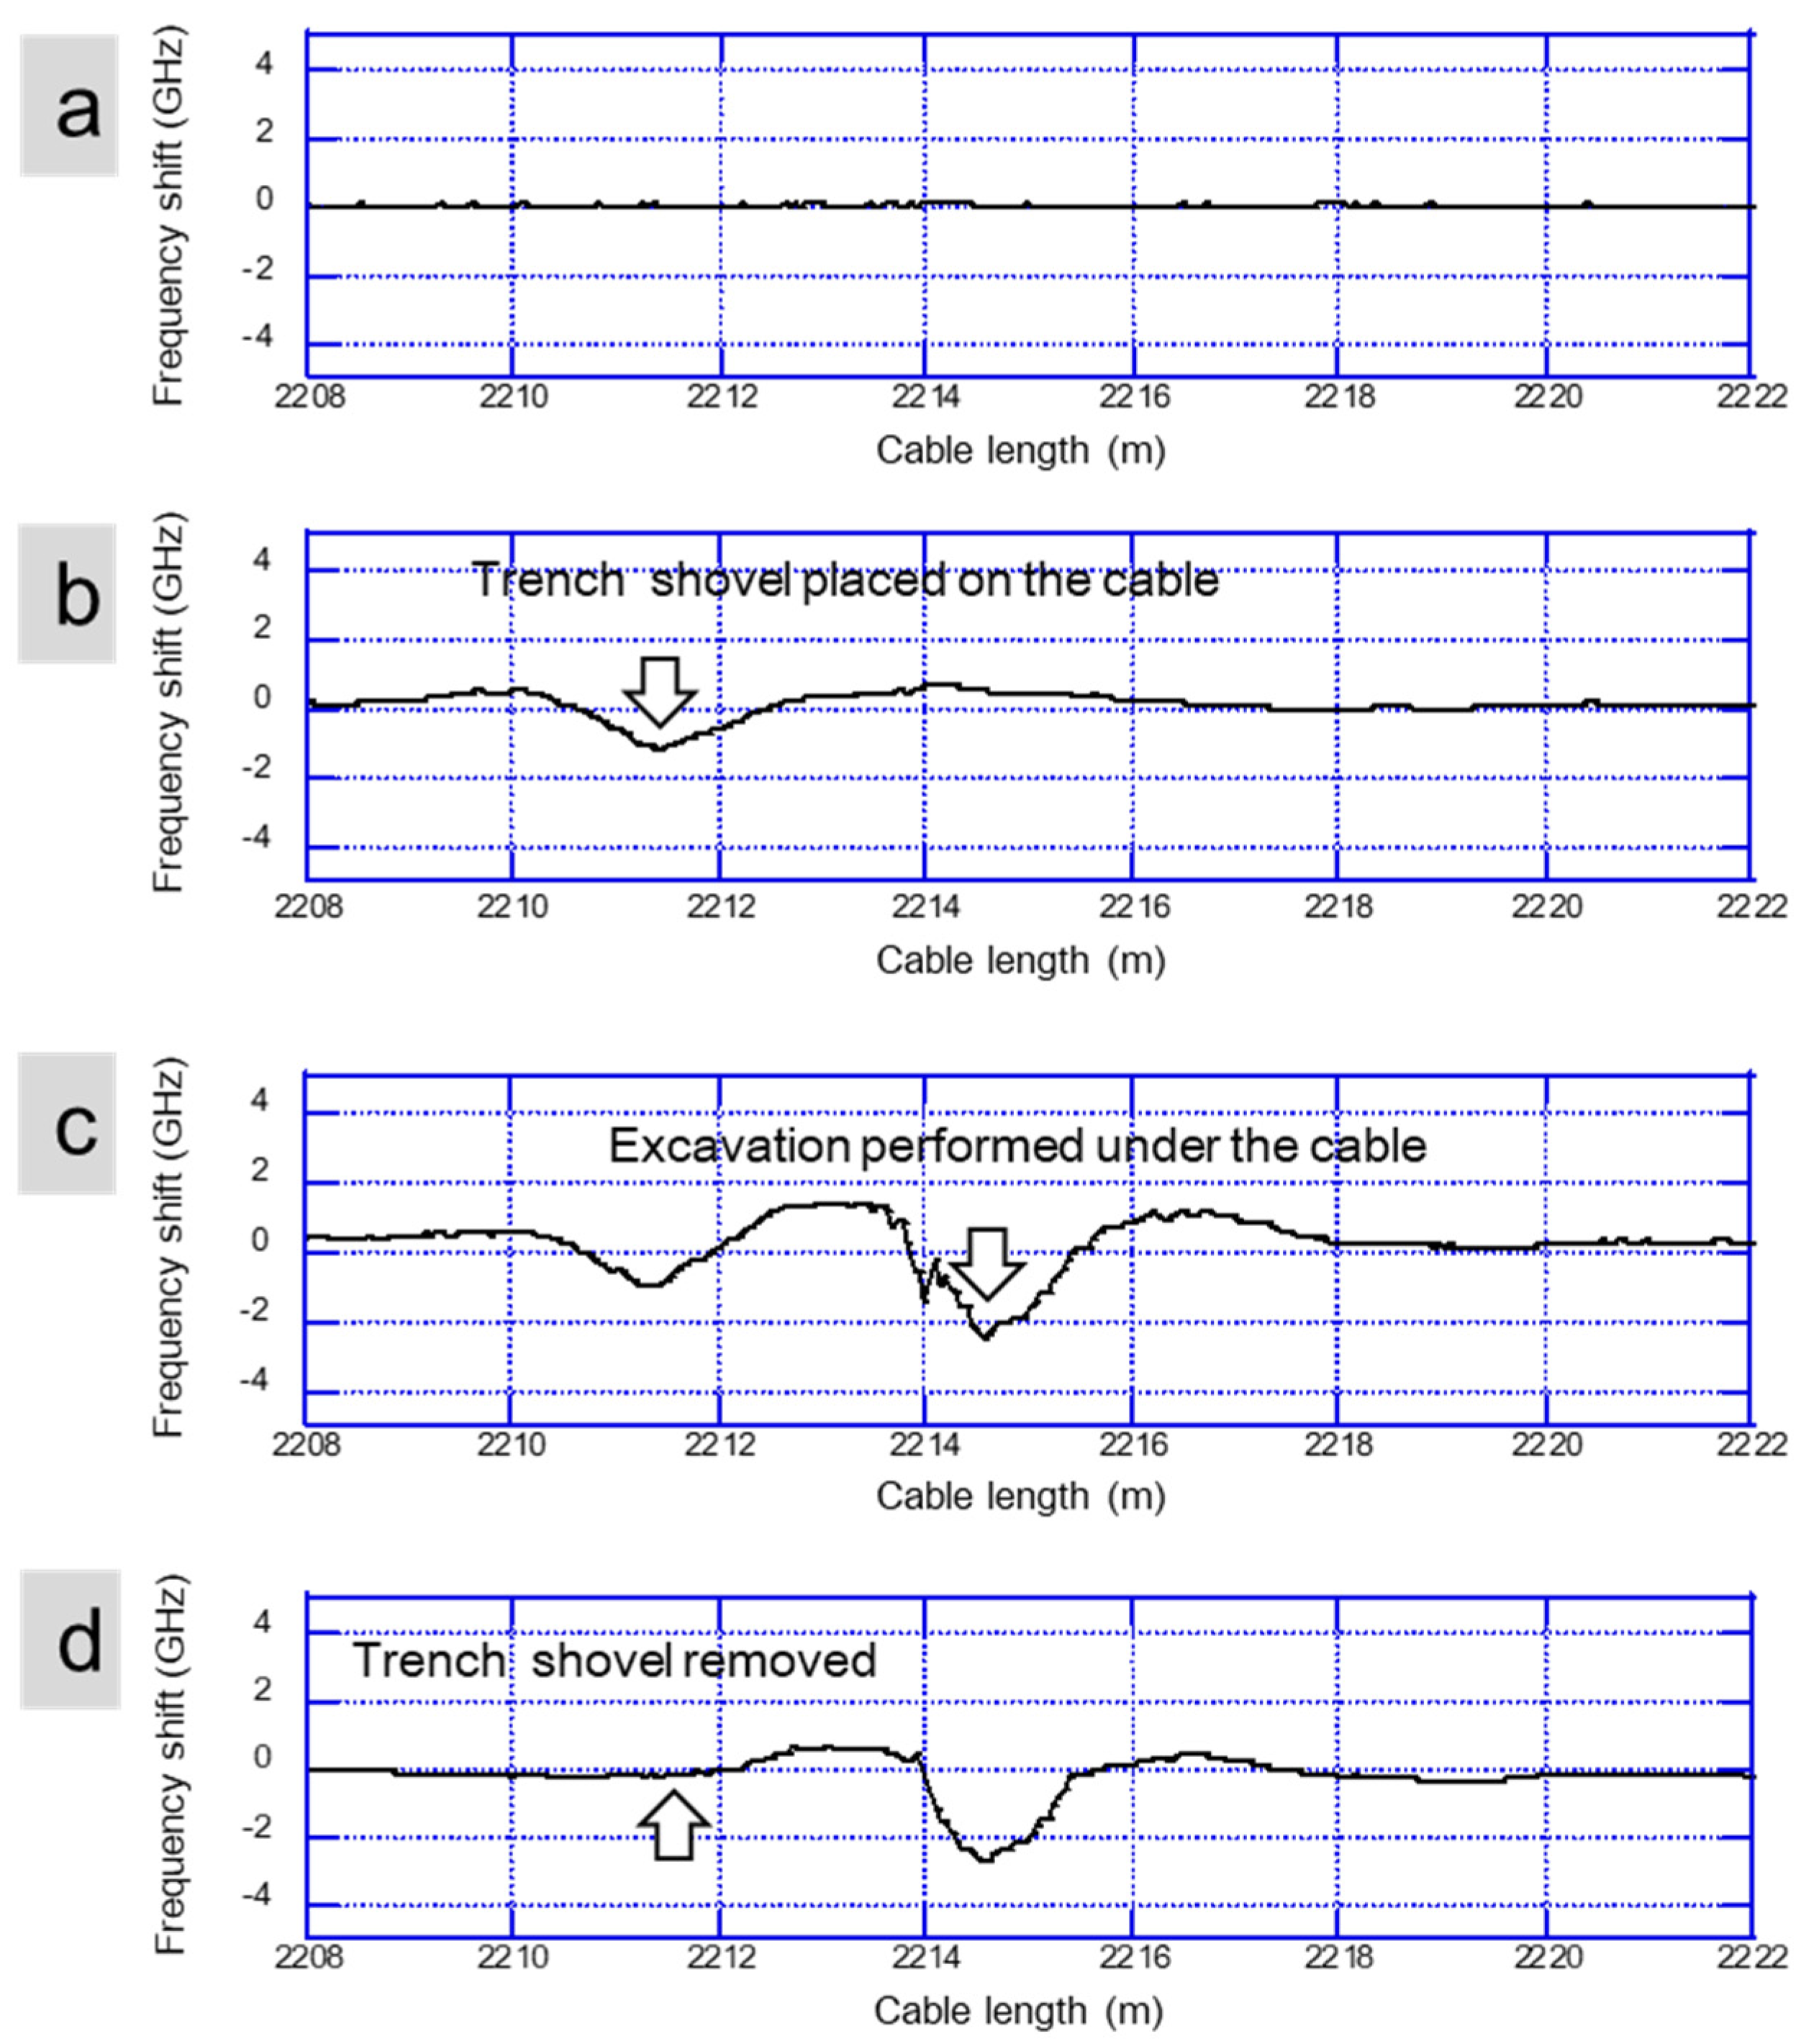
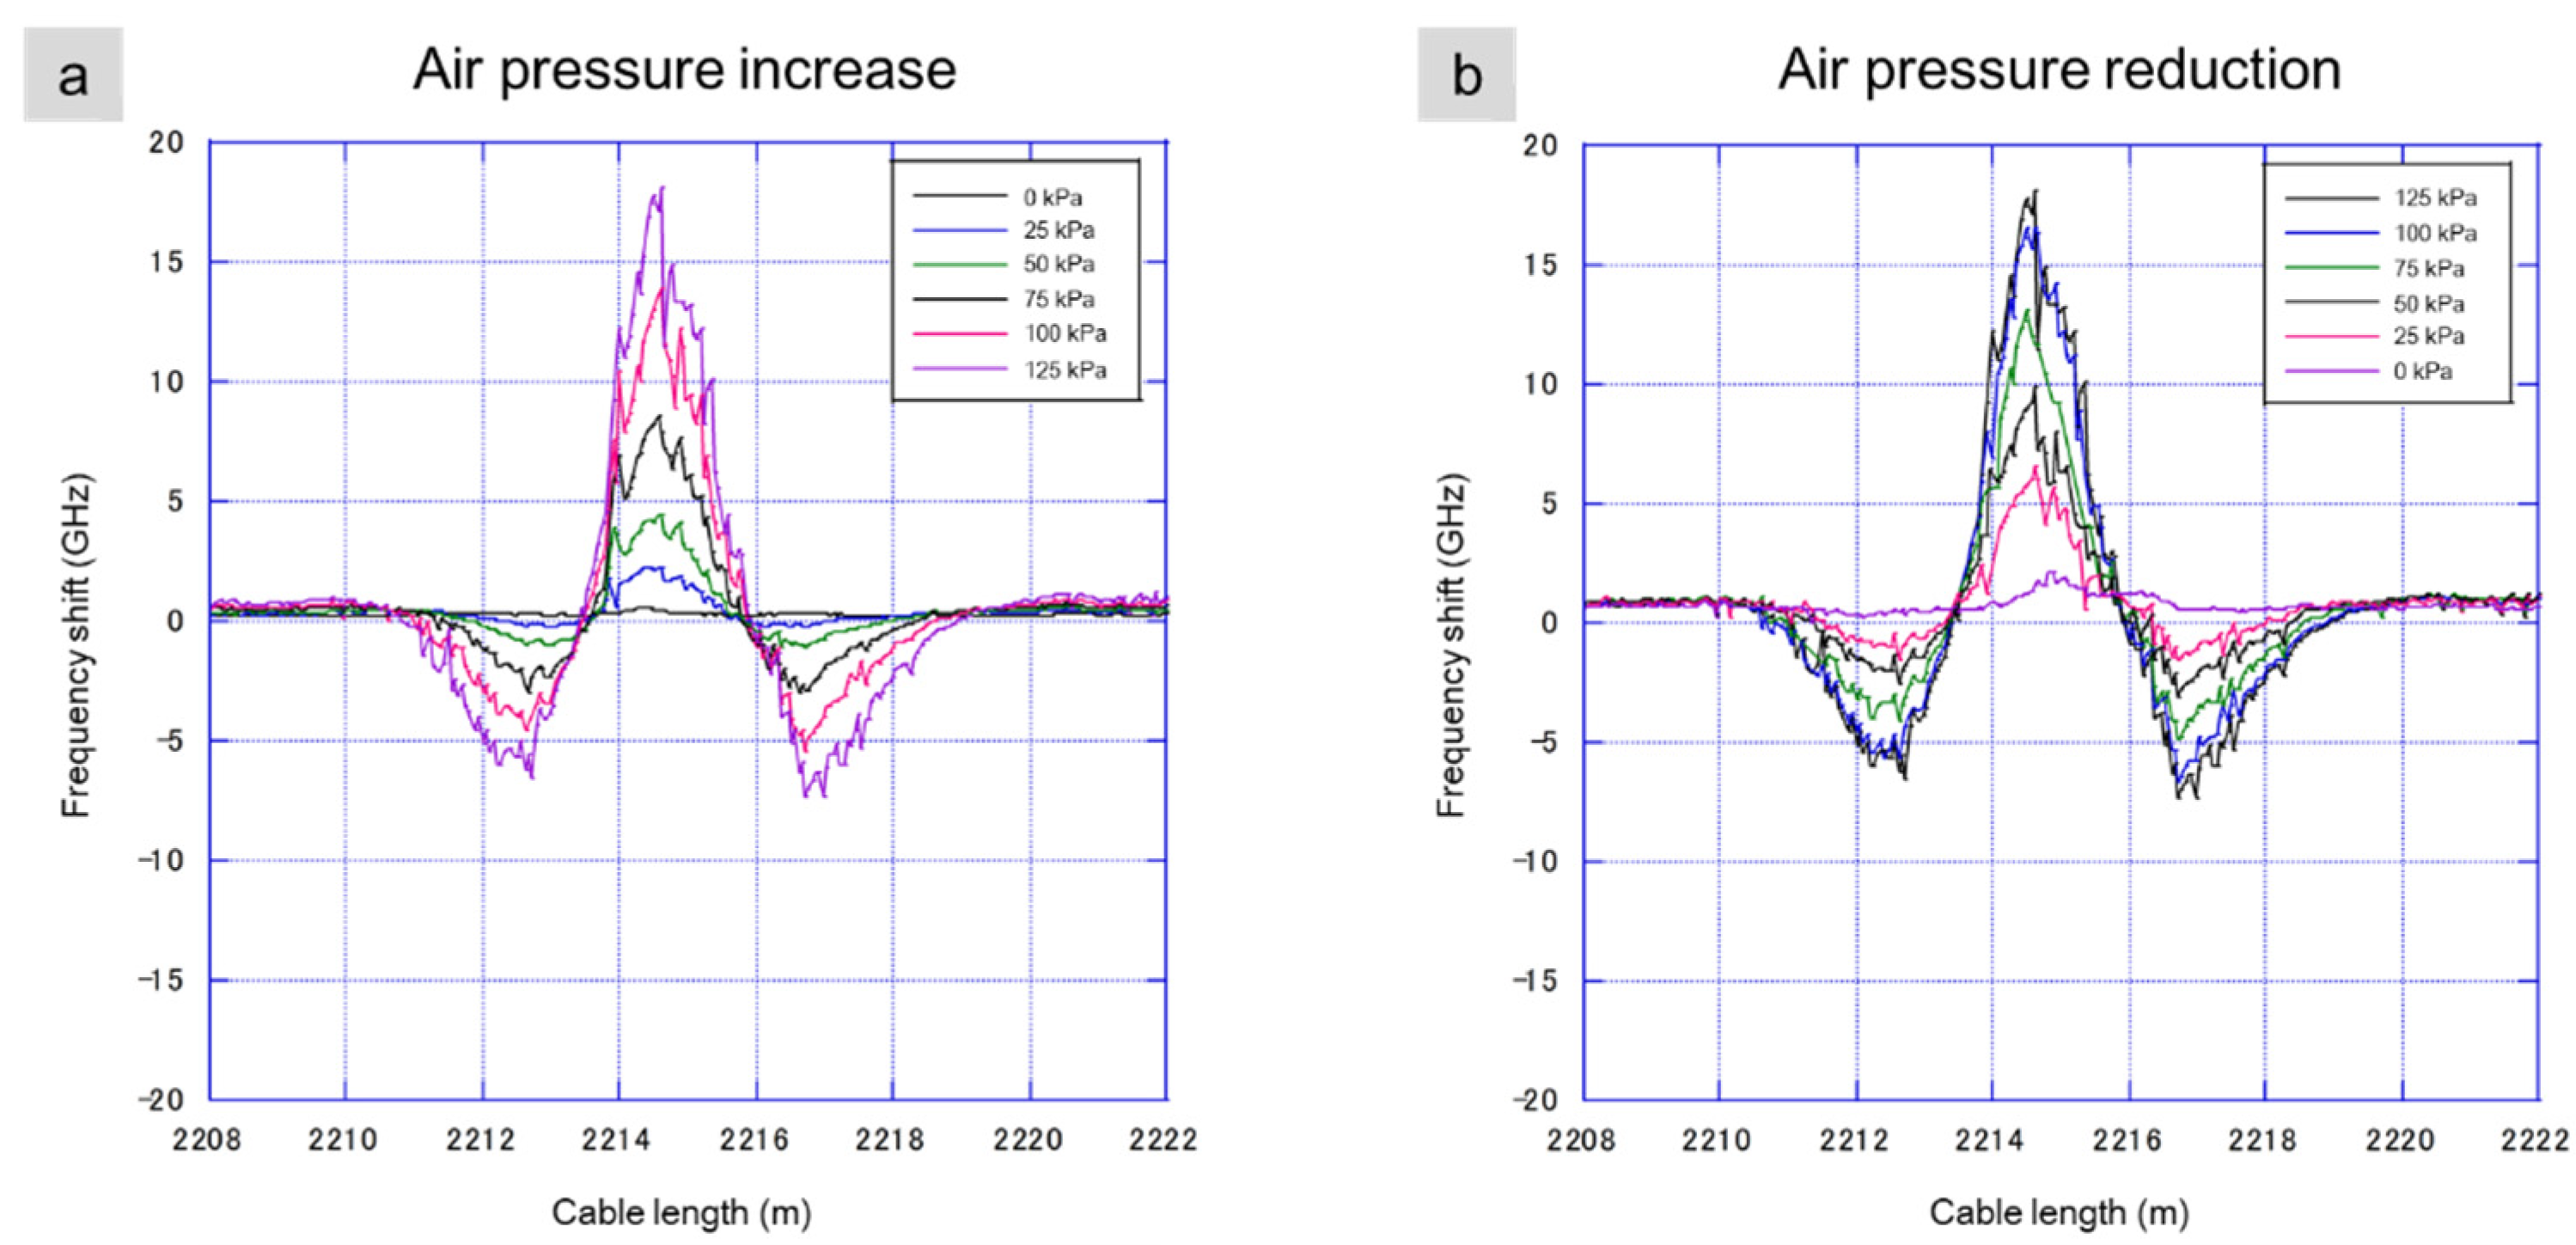
The results from the third test confirm the high sensitivity of DFOSS for ground uplift-subsidence monitoring. The ground subsidence caused by soil removal was clearly detected by DFOSS, suggesting that DFOSS is useful for structural health monitoring as well as road collapses associated with underground excavations in the near future. Moreover, DFOSS is sufficiently sensitive to detect subsidence caused at the trench shovel position at a high resolution. DFOSS also detected the uplift caused by increased airbag pressure and the subsidence caused by a reduced airbag pressure. These results indicate that DFOSS can be utilized as an accurate ground surface deformation monitoring technology with high spatiotemporal resolution.

4.3. Imaging Distributed Deformation Profiles on the Surface Caused by Vertical Dynamics (Natural Dynamics and Anthropogenic Activities)

The results from the first and second test (dynamic continuous load and static intermittent load) are compared in Figure 11. Although the total load in the water filling up test and the fourth iron plate step were almost the same (9.6 ton) and the Rayleigh frequency shifts at the end of the filling process and after the fourth step were the same (−5 to −6 GHz). This dynamic water filling test result suggests that fiber optic strain sensing could be used to design an alarm system providing advance warning of potentially dangerous deformation. In addition, the dynamic water load caused larger uplift magnitudes on both sides of the tank (+4 GHz, +5 GHz) compared with the static iron plate load, which cased uplift on the two sides of the plates (+2.5 GHz, +2 GHz). The dynamic water load also caused uplift over a larger distance of approximately about 5 m on each side versus 2.5 m for each side in the static test.
However, in the final stage of the static test, the load increased to 12 tons, and the subsidence deformation increased (Rayleigh frequency shift reached −7.5 GHz) at the plate position. The uplift on the two sides did not increase compared with the previous step, confirming that DFOSS can accurately detect these details over time and space and can differentiate the risk of deformation due to human activity (e.g., fluid injection), which grows continuously over time in contrast to deformations caused by natural tectonic events.
For cases of fluid injection, the pressure change starts slowly but can grow rapidly and migrate over large distances (horizontally) and depths (vertically). This behavior highlights the importance of continued spatiotemporal vertical and horizontal monitoring at injection sites, to enable early warnings via strain sensing technology. Additionally, we noticed that some responses appeared before reaching the final load for each stage in Figure 11; this is because we placed the iron plate (weight: 800 kg) by a rafter crane and it took a little time to pile up the plates to reach the total weight for each stage.

5. Conclusions

In this study, we installed a single-mode optical fiber cable in a shallow trench for the ground surface deformation monitoring with the distributed fiber optic strain sensing (DFOSS) technique. We conducted three field experimental tests (iron plate load, water tank filling up load, and airbag inflation) in order to confirm the strain sensitivity of DFOSS for static loads, dynamic overload, excavation, subsidence, and uplift. Based on the three experimental tests, our results confirm that DFOSS can monitor ground surface deformation in both subsidence and uplift at CO2 storage or oil and gas production fields. It is also can be utilized for structural health monitoring for detecting anomalies and locating their positions along the fiber cable. The following conclusions can be drawn from the results of this study.
(1)
For ground surface deformation monitoring, cement-buried fiber installation in the surface is a practical installation method to obtain clear ground surface movement.
(2)
DFOSS is suitable as a monitoring technology with high accuracy and reliability for locating anomalies along a fiber optic cable.
(3)
DFOSS is a high-sensitivity technology for monitoring subsidence and uplift and can thus be applied for both onshore and offshore CO2 storage or oil and gas production fields.
(4)
Ideal surface monitoring can be achieved with DFOSS by incorporating well-based strain sensing, allowing ground deformation (horizontal in the surface and vertical in the subsurface) to be monitored in three dimensions.

Author Contributions

Z.X. and T.H. designed the field experiments, and T.N. was involved in data acquisition. R.A. and Z.X. prepared the manuscript. All authors participated in the interpretation of experimental results. All authors have read and agreed to the published version of the manuscript.

Funding

This research was founded by the New Energy and Industrial Technology Development Organization (NEDO) and the Ministry of Economy, Trade, and Industry (METI) of Japan, JPNP18006.

Institutional Review Board Statement

Not applicable.

Informed Consent Statement

Not applicable.

Data Availability Statement

Data Availability Statements in section “MDPI Research Data Policies” at https://www.mdpi.com/ethics.

Acknowledgments

This paper is based on results obtained from a project (JPNP18006) commissioned by the New Energy and Industrial Technology Development Organization (NEDO) and the Ministry of Economy, Trade, and Industry (METI) of Japan.

Conflicts of Interest

The authors declare no conflict of interest.

References

  1. Teatini, P.; Gambolati, G.; Ferronato, M.; Settari, A.T.; Walters, D. Land uplift due to subsurface fluid injection. J. Geodyn. 2011, 51, 1–16. [Google Scholar] [CrossRef] [Green Version]
  2. Fielding, E.J.; Blom, R.G.; Goldstein, R.M. Rapid subsidence over oil fields measured by SAR interferometry. Geophys. Res. Lett. 1998, 25, 3215–3218. [Google Scholar] [CrossRef]
  3. Holzer, L.T.; Galloway, D.L. Impacts of land subsidence caused by withdrawal of underground fluids in the United States. In Humans as Geologic Agents; Reviews in Engineering Geology XVI; Ehlen, J., Haneberg, W.C., Larson, R., Eds.; The Geological Society of America: Boulder, CO, USA, 2005; Volume 16, pp. 87–99. [Google Scholar]
  4. Kim, J.W.; Lu, Z. Association between localized geohazards in West Texas and human activities, recognized by Sentinel-1A/B satellite radar imagery. Sci. Rep. 2018, 8, 4727. [Google Scholar] [CrossRef] [PubMed]
  5. Karegar, M.A.; Dixon, T.H.; Malservisi, R.; Yang, Q.; Hossaini, S.A.; Hovorka, S.D. GPS-based monitoring of surface deformation associated with CO2 injection at an enhanced oil recovery site. Int. J. Greenh. Gas Control 2015, 41, 116–126. [Google Scholar] [CrossRef] [Green Version]
  6. Siriwardane, H.J.; Gondle, R.K.; Bromhal, G.S. Coupled flow and deformation modeling of carbon dioxide. migration in the presence of a caprock fracture during injection. Energy Fuels 2013, 27, 4232–4243. [Google Scholar] [CrossRef]
  7. Onuma, T.; Okada, K.; Ohkawa, S. Surface Heave Detection related with CO2 Injection by DInSAR at In Salah, Algeria. In Proceedings of the International Petroleum Technology Conference, Kuala Lumpur, Malaysia, 3–5 December 2008; Japan Petroleum Exploration Co., Ltd.: Tokyo, Japan. [Google Scholar] [CrossRef]
  8. Bell, W.J.; Amelung, F.; Ferretti, A.; Bianchi, M.; Novali, F. Permanent scatterer InSAR reveals.seasonal and long-term aquifer system response to groundwater pumping and artificial recharge. Water Resour. Res. 2008, 44, W02407. [Google Scholar] [CrossRef] [Green Version]
  9. Miller, M.M.; Shirzaei, M. Spatiotemporal characterization of land subsidence and uplift in Phoenix using InSAR time series and wavelet transforms. J. Geophys. Res. Solid Earth 2015, 120. [Google Scholar] [CrossRef] [Green Version]
  10. Karegar, M.A.; Dixon, T.H.; Kusche, J.; Chambers, D.P. A new hybrid method for estimating hydrologically induced vertical deformation from GRACE and a hydrological model: An example from Central North America. J. Adv. Modeling Earth Syst. 2018, 10. [Google Scholar] [CrossRef]
  11. Kishida, K.; Yamauchi, Y.; Guzik, A. Study of optical fibers strain-temperature sensitivities using hybrid Brillouin-Rayleigh System. Photonic Sens. 2014, 4, 1–11. [Google Scholar] [CrossRef] [Green Version]
  12. Sun, Y.; Xue, Z.; Hashimoto, T. Fiber optic distributed sensing technology for real-time monitoring water jet tests: Implications for wellbore integrity diagnostics. J. Nat. Gas Sci. Eng. 2018, 58, 241–250. [Google Scholar] [CrossRef]
  13. Sun, Y.; Xue, Z.; Hashimoto, T.; Lei, X.; Zhang, Y. Distributed fiber optic sensing system for well-based monitoring water injection tests-A geomechanical responses perspective. Water Resour. Res. 2020, 56. [Google Scholar] [CrossRef]
  14. Barrias, A.; Casas, J.; Villalba, S. A review of distributed optical fiber sensors for civil 606 engineering applications. Sensors 2016, 16, 748. [Google Scholar] [CrossRef] [PubMed] [Green Version]
  15. Zhang, Y.; Xue, Z. Deformation- Deformation-Based Monitoring of Water Migration in Rocks Using Distributed Fiber Optic Strain Sensing: A Laboratory Study. Water Resour. Res. 2019, 55. [Google Scholar] [CrossRef]
  16. Lei, X.; Xue, Z.; Hashimoto, T. Fiber Optic Sensing for Geomechanical Monitoring: (2)- Distributed Strain Measurements at a Pumping Test and Geomechanical Modeling of Deformation of Reservoir Rocks. Appl. Sci. 2019, 9, 417. [Google Scholar] [CrossRef] [Green Version]
  17. Kogure, T.; Horiuchi, Y.; Kiyama, T.; Nishizawa, O.; Xue, Z.; Matsuoka, T. Fiber optic strain measurements using distributed sensor system under static pressure conditions. BUTSURI-TANSA (Exploration Geophysics) 2015, 68, 8–27. [Google Scholar]
  18. Xue, Z.; Shi, J.-Q.; Yamauchi, Y.; Durucan, S. Fiber optic sensing for geomechanical monitoring: (1) Distributed strain measurements of two sandstones under hydrostatic confining and pore pressure. conditions. Appl. Sci. 2018, 8, 2103. [Google Scholar] [CrossRef] [Green Version]
  19. Zhang, C.-C.; Shi, B.; Gu, K.; Liu, S.-P.; Wu, J.-H.; Zhang, S.; Zhang, L.; Jiang, H.-T.; Wei, G.-Q. Vertically distributed sensing of deformation using fiber optic sensing. Geophys. Res. Lett. 2018, 45, 11732–11741. [Google Scholar] [CrossRef]
Figure 1. Test site schematic of the experiments. The fiber cable was installed in a shallow trench (green line) and the red and black segments indicate the sections covered by soil and cement, respectively. Four colored rectangles along the red and black segments show the test positions and the iron plate loading test was performed at both the soil and cement sections for comparison. The water tank loading and airbag tests were carried out only at the cement section.
Geosciences 11 00285 g001
Figure 2. Rayleigh frequency shift results for the static load test. The black arrow indicates the position of iron plates (length: 3 m) along the fiber cable. (a) and (b) show the DFOSS responses for the cable covered by soil for baseline, 2.4-ton, 4.8-ton, and 7.2-ton loads (red, blue, green, and black lines, respectively. (c) and (d) show the DFOSS responses for the cable covered by cement for 7.2-ton, 9.8-ton, and 12-ton loads (black, purple, and pink lines, respectively).
Geosciences 11 00285 g002
Figure 3. Air and soil temperature changes during the iron plate loading period. Air temperature (blue color) measured by the thermocouple exposed to air and soil temperature (red color) measured by the thermocouple buried at same depth of the fiber cable.
Geosciences 11 00285 g003
Figure 4. Rayleigh frequency shift for the dynamic water tank loading test. (a) Rayleigh frequency shift as a function of distance for the initial state, during filling and after filling (black, dashed and red lines, respectively). (b) Rayleigh frequency shift as a function of time at 2071.4 m (corresponding to the maximum subsidence in the upper panel) shown as a red solid line, with the filled water weight shown as a dashed black line.
Geosciences 11 00285 g004
Figure 5. Schematic of the airbag test. Displacements of the cement layer and the ground surface were measured by the two cantilever type displacement transducers during the airbag test.
Geosciences 11 00285 g005
Figure 6. Results for the third test: DFOSS Rayleigh frequency responses when the trench shovel was placed on the cable, excavation was performed under the cable, and the shovel was removed. (a) Initial status, (b) Trench shovel placed on the cable, (c) Excavation performed under the cable and (d)Trench shovel removed.
Geosciences 11 00285 g006
Figure 7. Rayleigh frequency responses for the third test. (a) The airbag pressure was increased in five steps. (b) The airbag pressure was decreased from 125 kPa to 0 kPa.
Geosciences 11 00285 g007
Figure 8. Ground surface and the cement layer deformation for the airbag test. (a) Displacements measured by the cantilever transducers when increasing the airbag pressure up to 125 kPa in five steps. (b) Displacements for the airbag pressure decreased from 125 kPa to 0 kPa.
Geosciences 11 00285 g008
Figure 9. Comparison of the Rayleigh frequency shift response to a static load for the fiber cable covered by soil (a, c) versus the fiber cable covered by cement (b, d). Panels (a) and (b) present spatiotemporal frequency shifts. The yellow and red colors indicate the ground subsidence while the blue color indicates the ground uplift. Panels (c) and (d) present the frequency shifts at the last load step (12 ton) as a function of distance.
Geosciences 11 00285 g009
Figure 10. Spatiotemporal Rayleigh frequency shift due to a dynamic water filling up load. In the upper panel, the colors indicate the magnitude of deformation (blue: uplift; yellow–red: subsidence). The lower panel presents the water filling up over time.
Geosciences 11 00285 g010
Figure 11. Comparison between the spatiotemporal Rayleigh shifts in the first test (static load) in the lower panel and in the second test (dynamic load) in the upper panel. The two dark arrows indicate the loading intervals in the tests.
Geosciences 11 00285 g011
Publisher’s Note: MDPI stays neutral with regard to jurisdictional claims in published maps and institutional affiliations.

