
Geochemistry of Pyritic Mudstones from the Singa Formation, Malaysia: Insights into Gold Potential, Source of Sulfur and Organic Matter

 ,
, 


Abstract
:1. Introduction
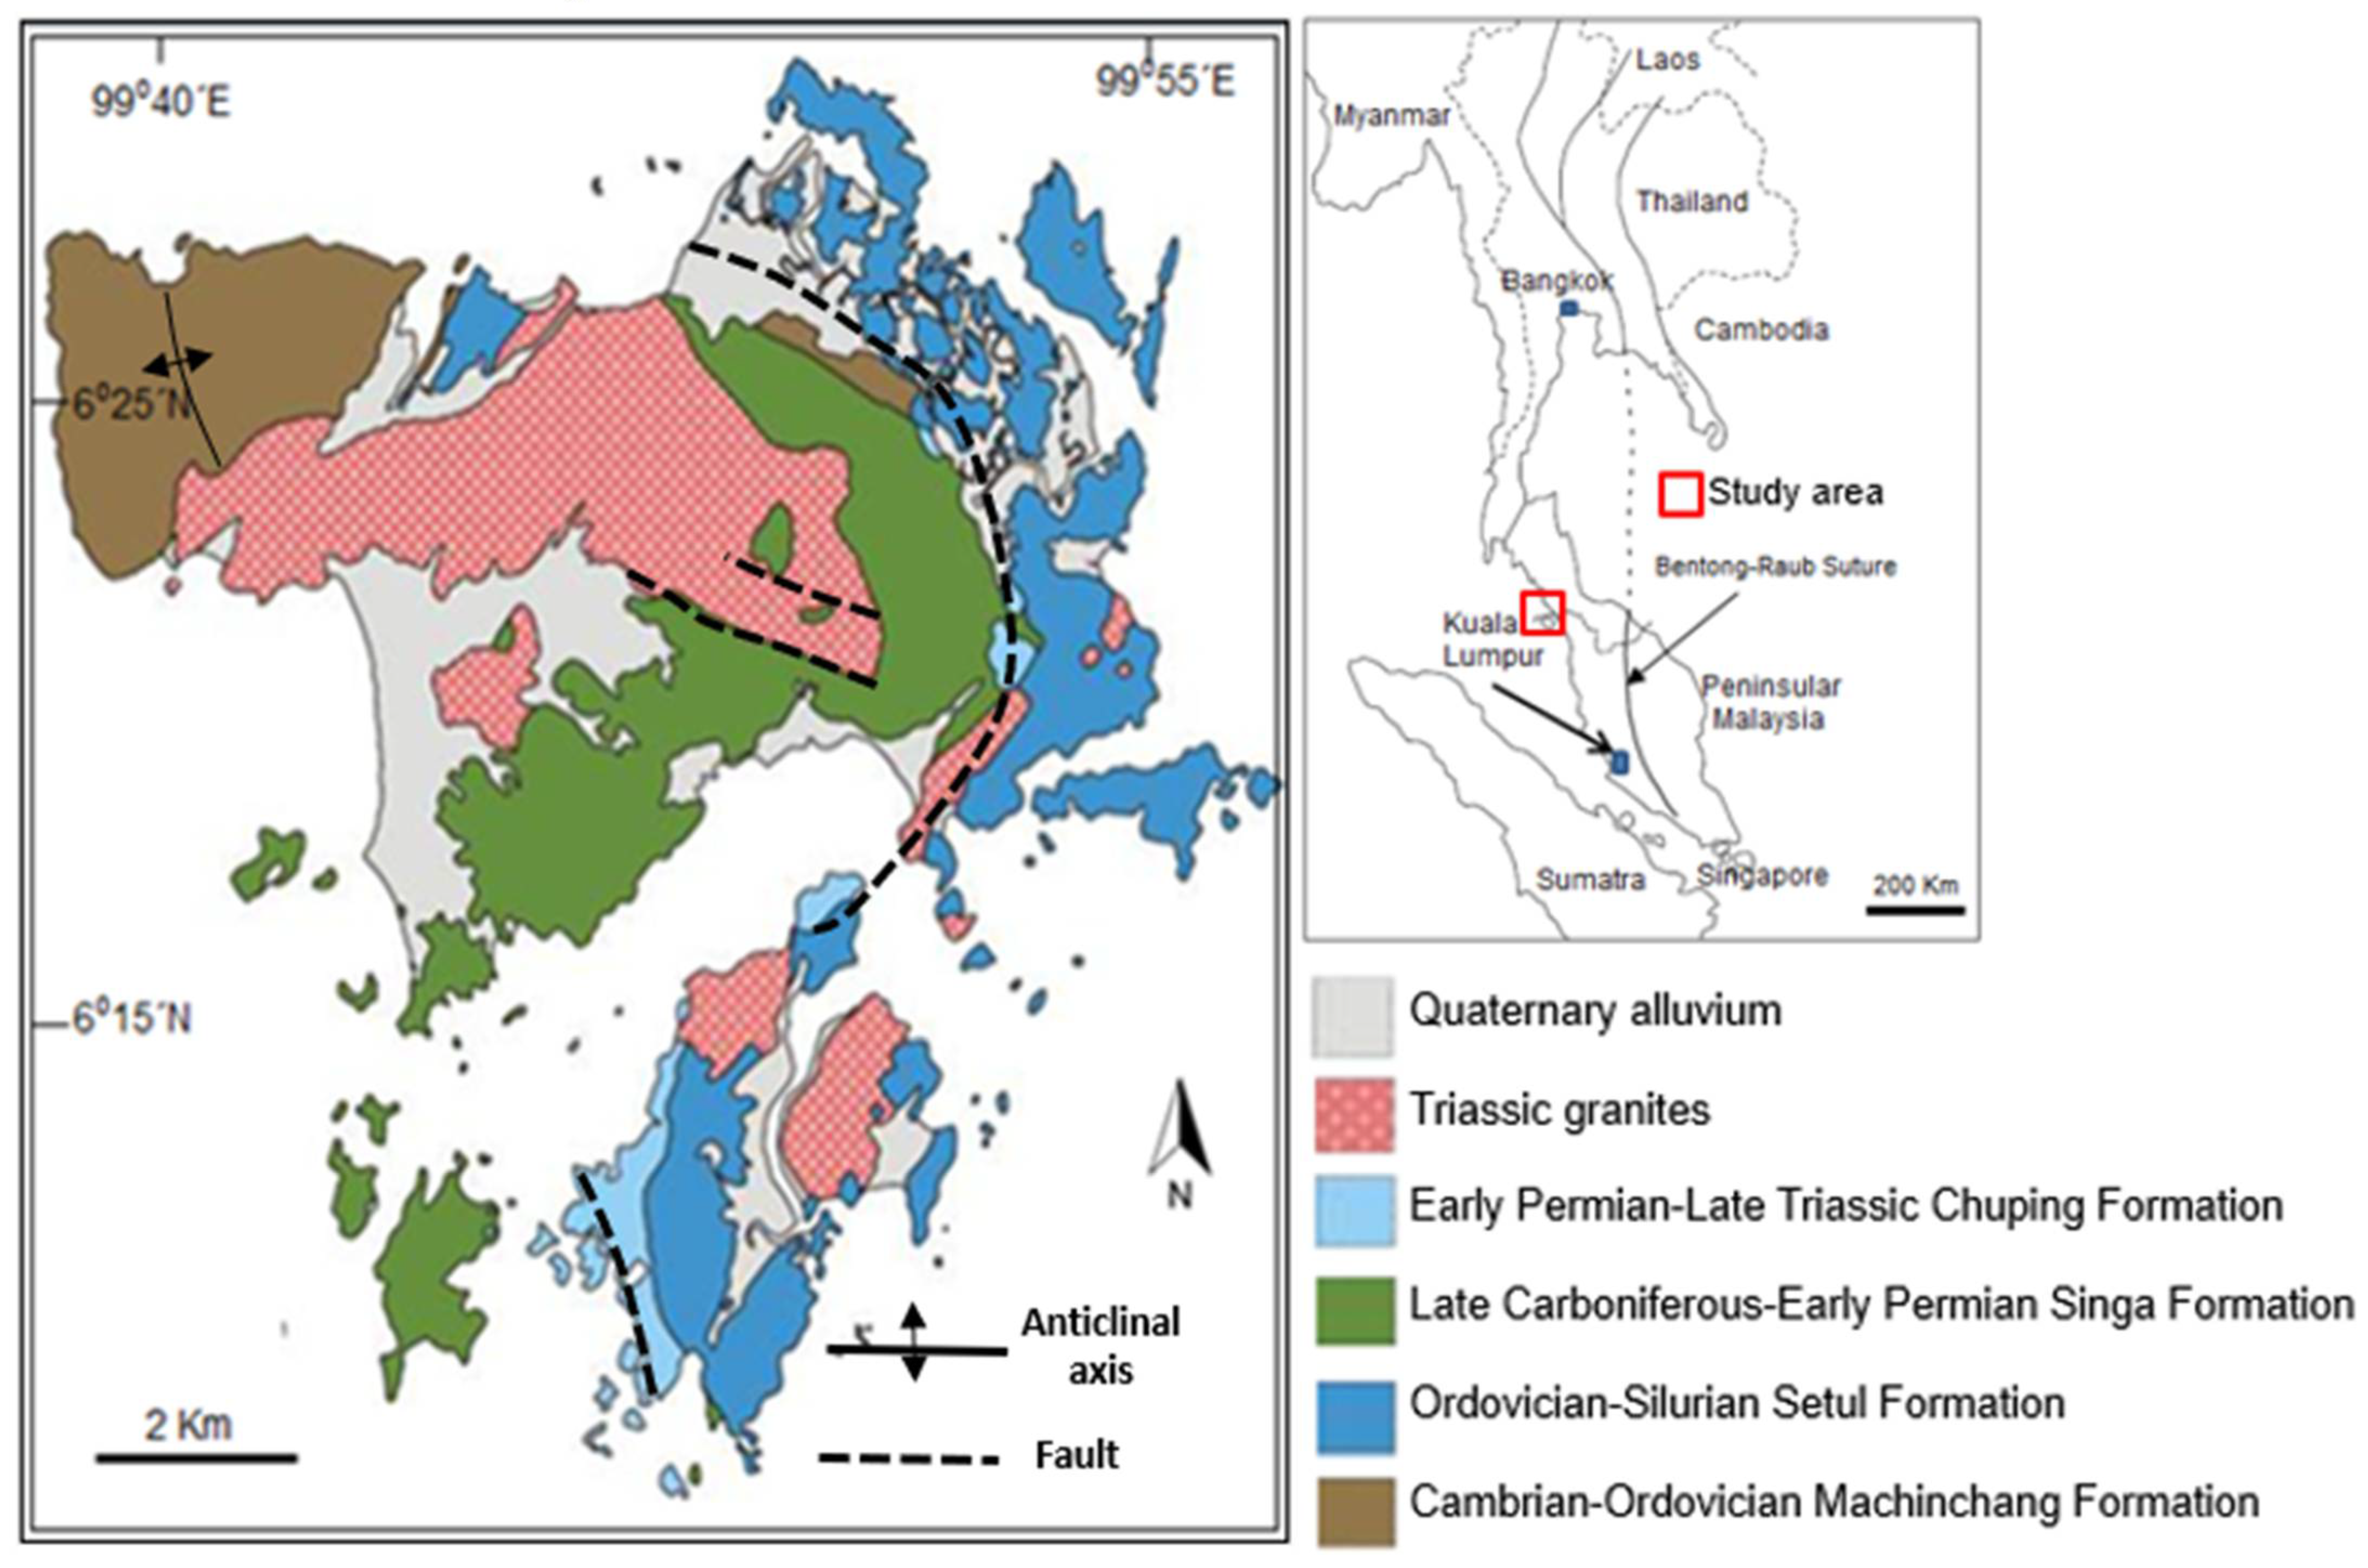
2. Geological Setting
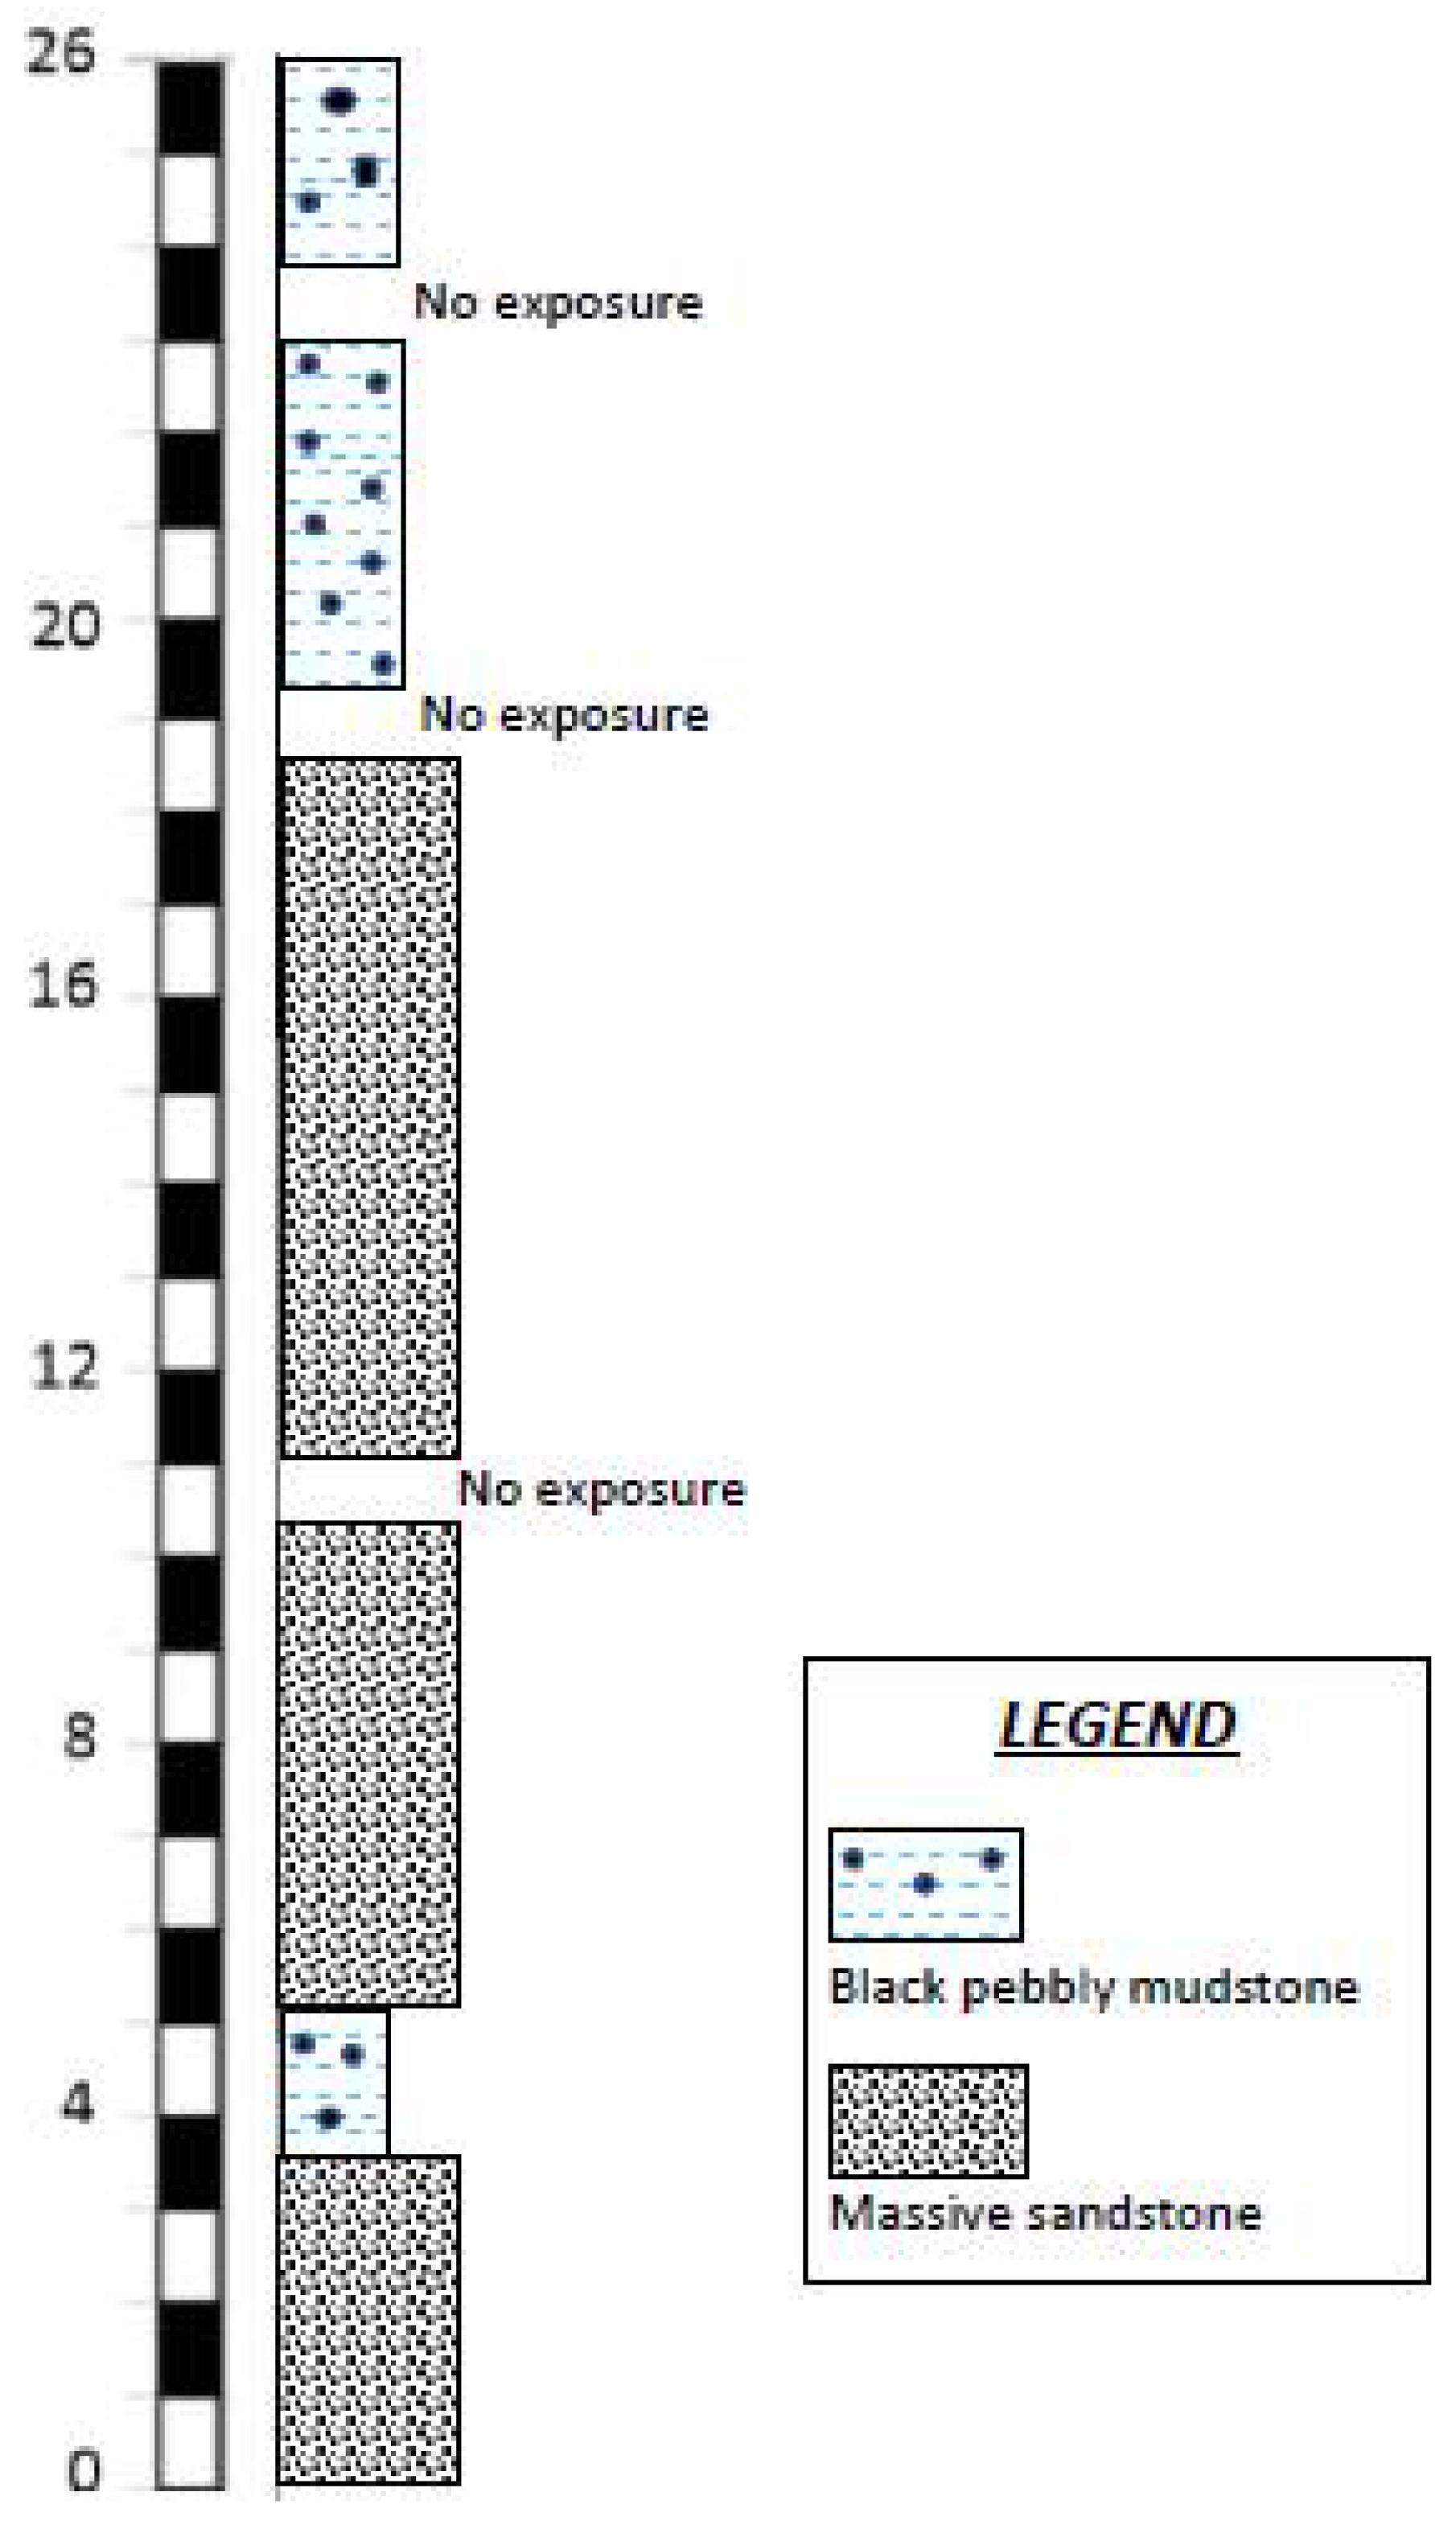
3. Singa Formation
4. Methods of Study
4.1. X-ray Fluorescence Analysis (XRF)
4.2. Total Organic Carbon (TOC) and Isotope Determination
4.3. Laser Ablation Inductively Coupled Mass Spectrometry (LA ICP-MS)
4.4. Sulfur Isotope Analysis
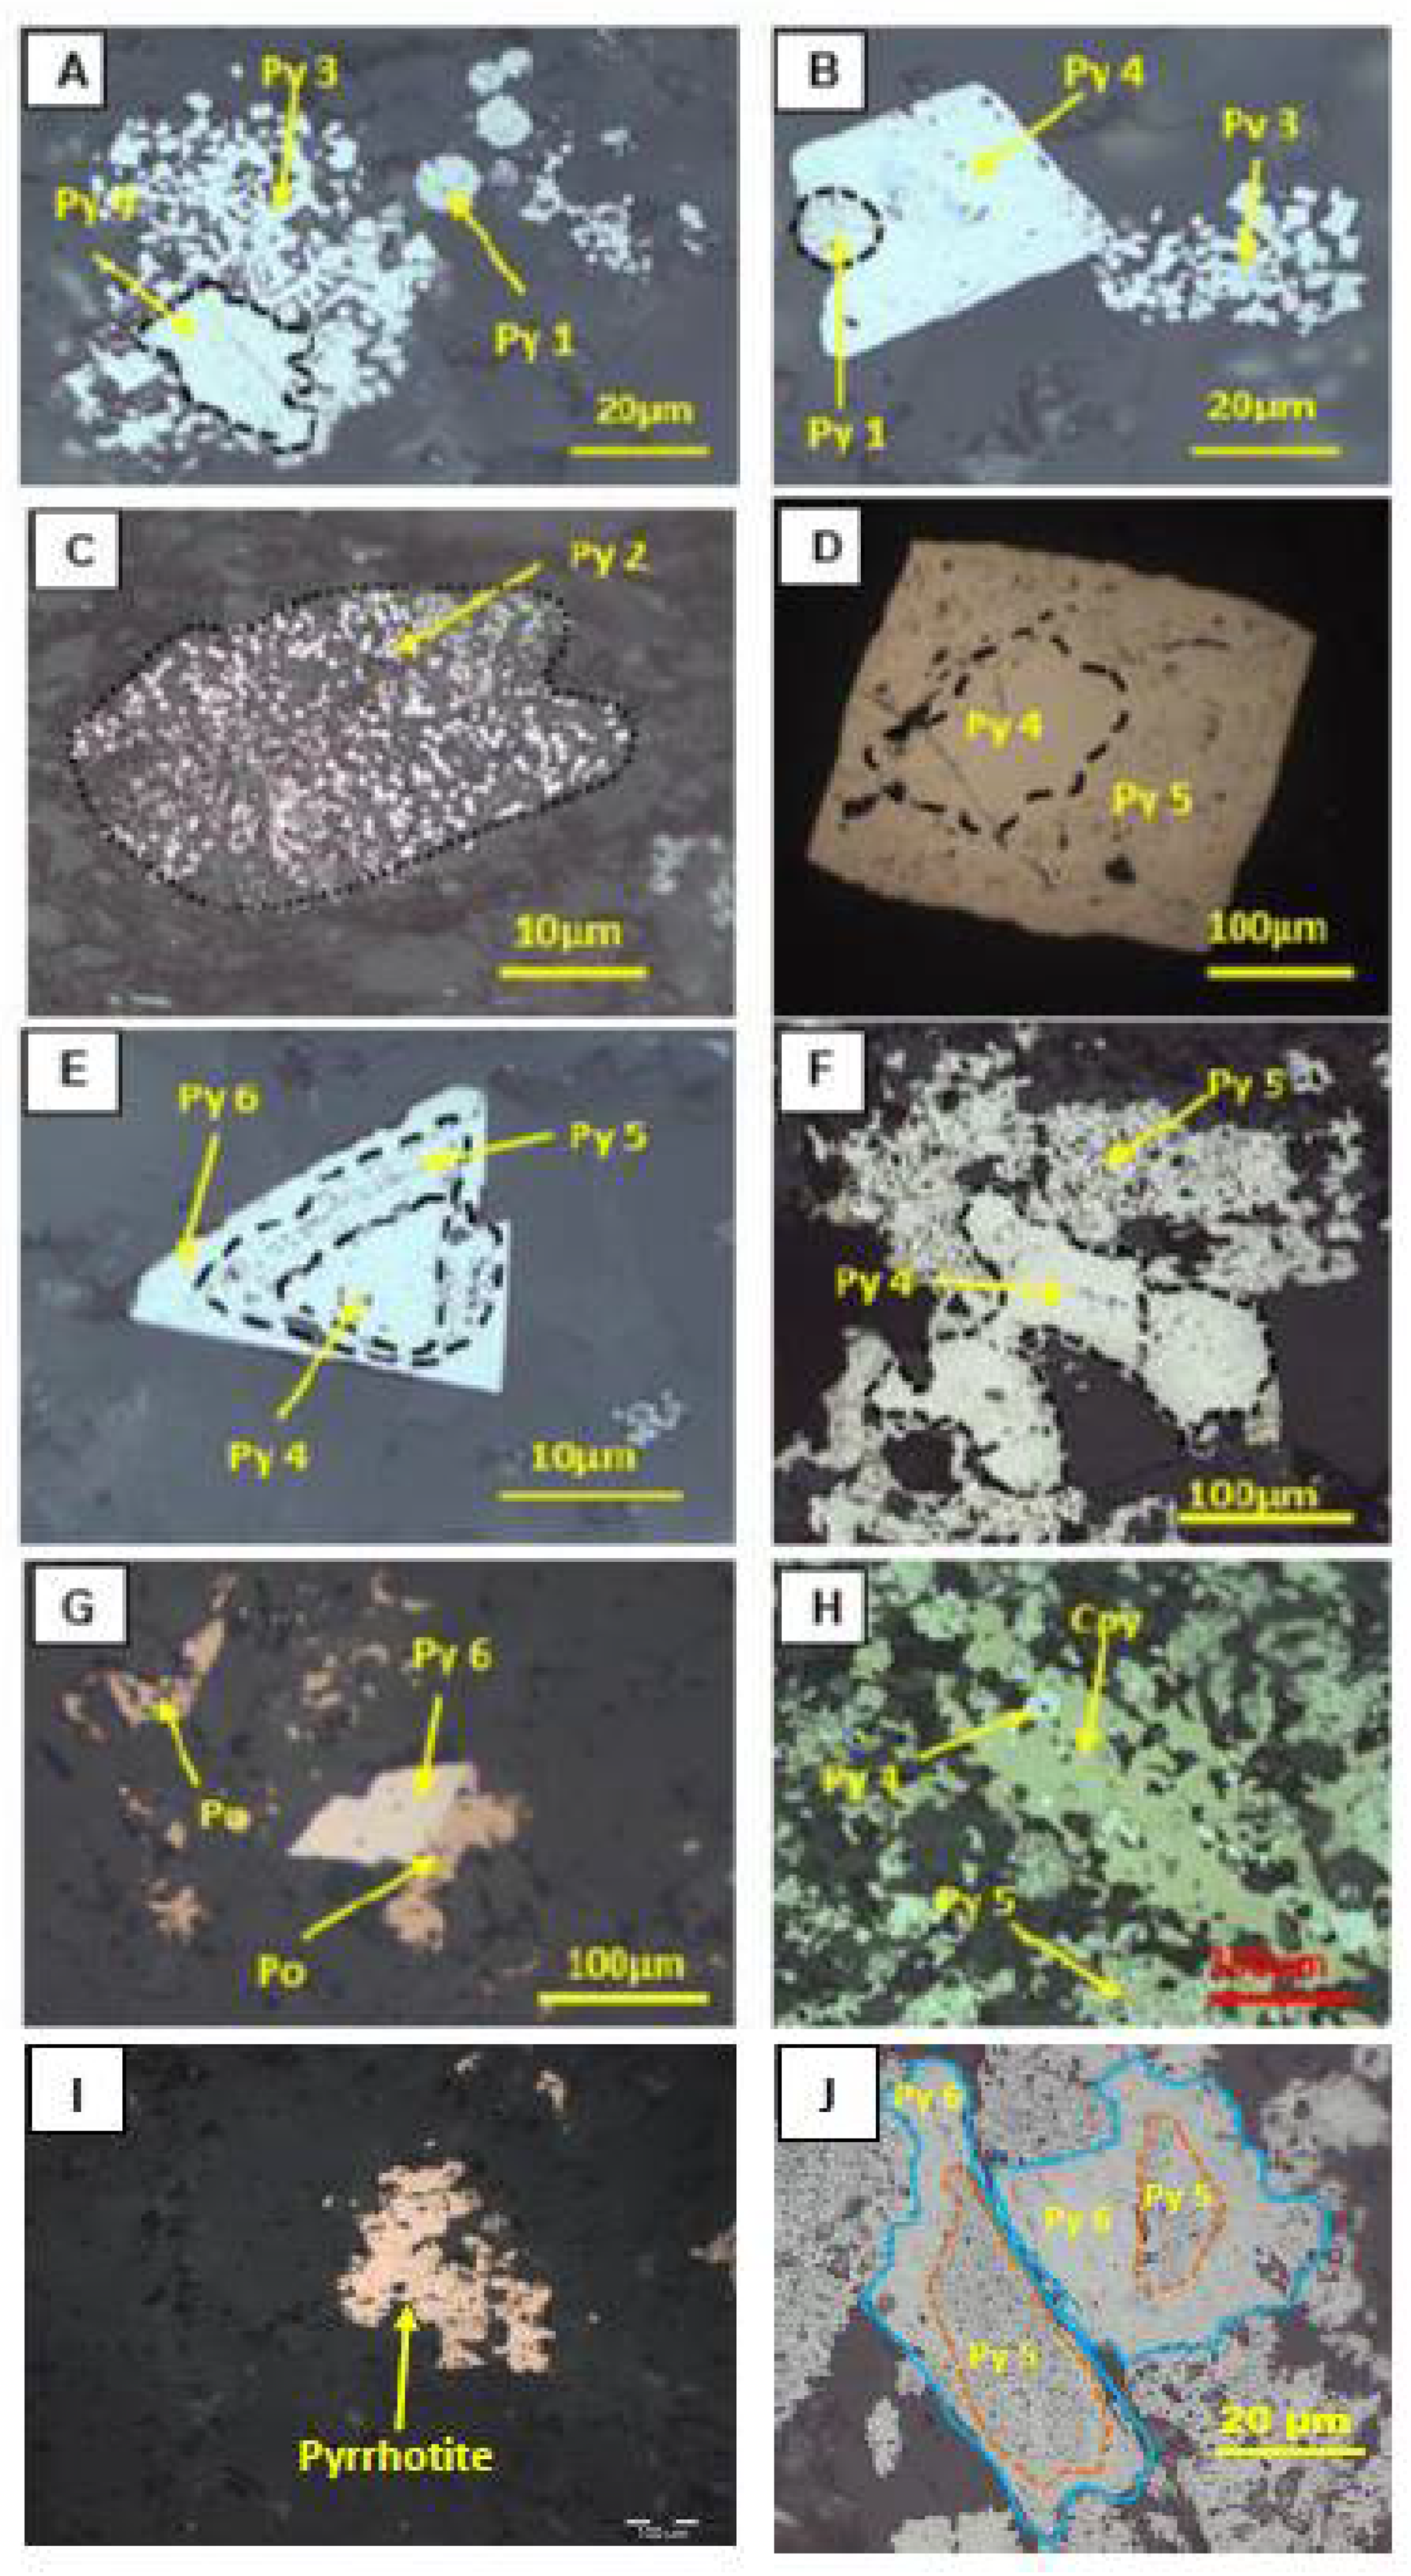
5. Textures of Pyrite and Associated Minerals
6. Results
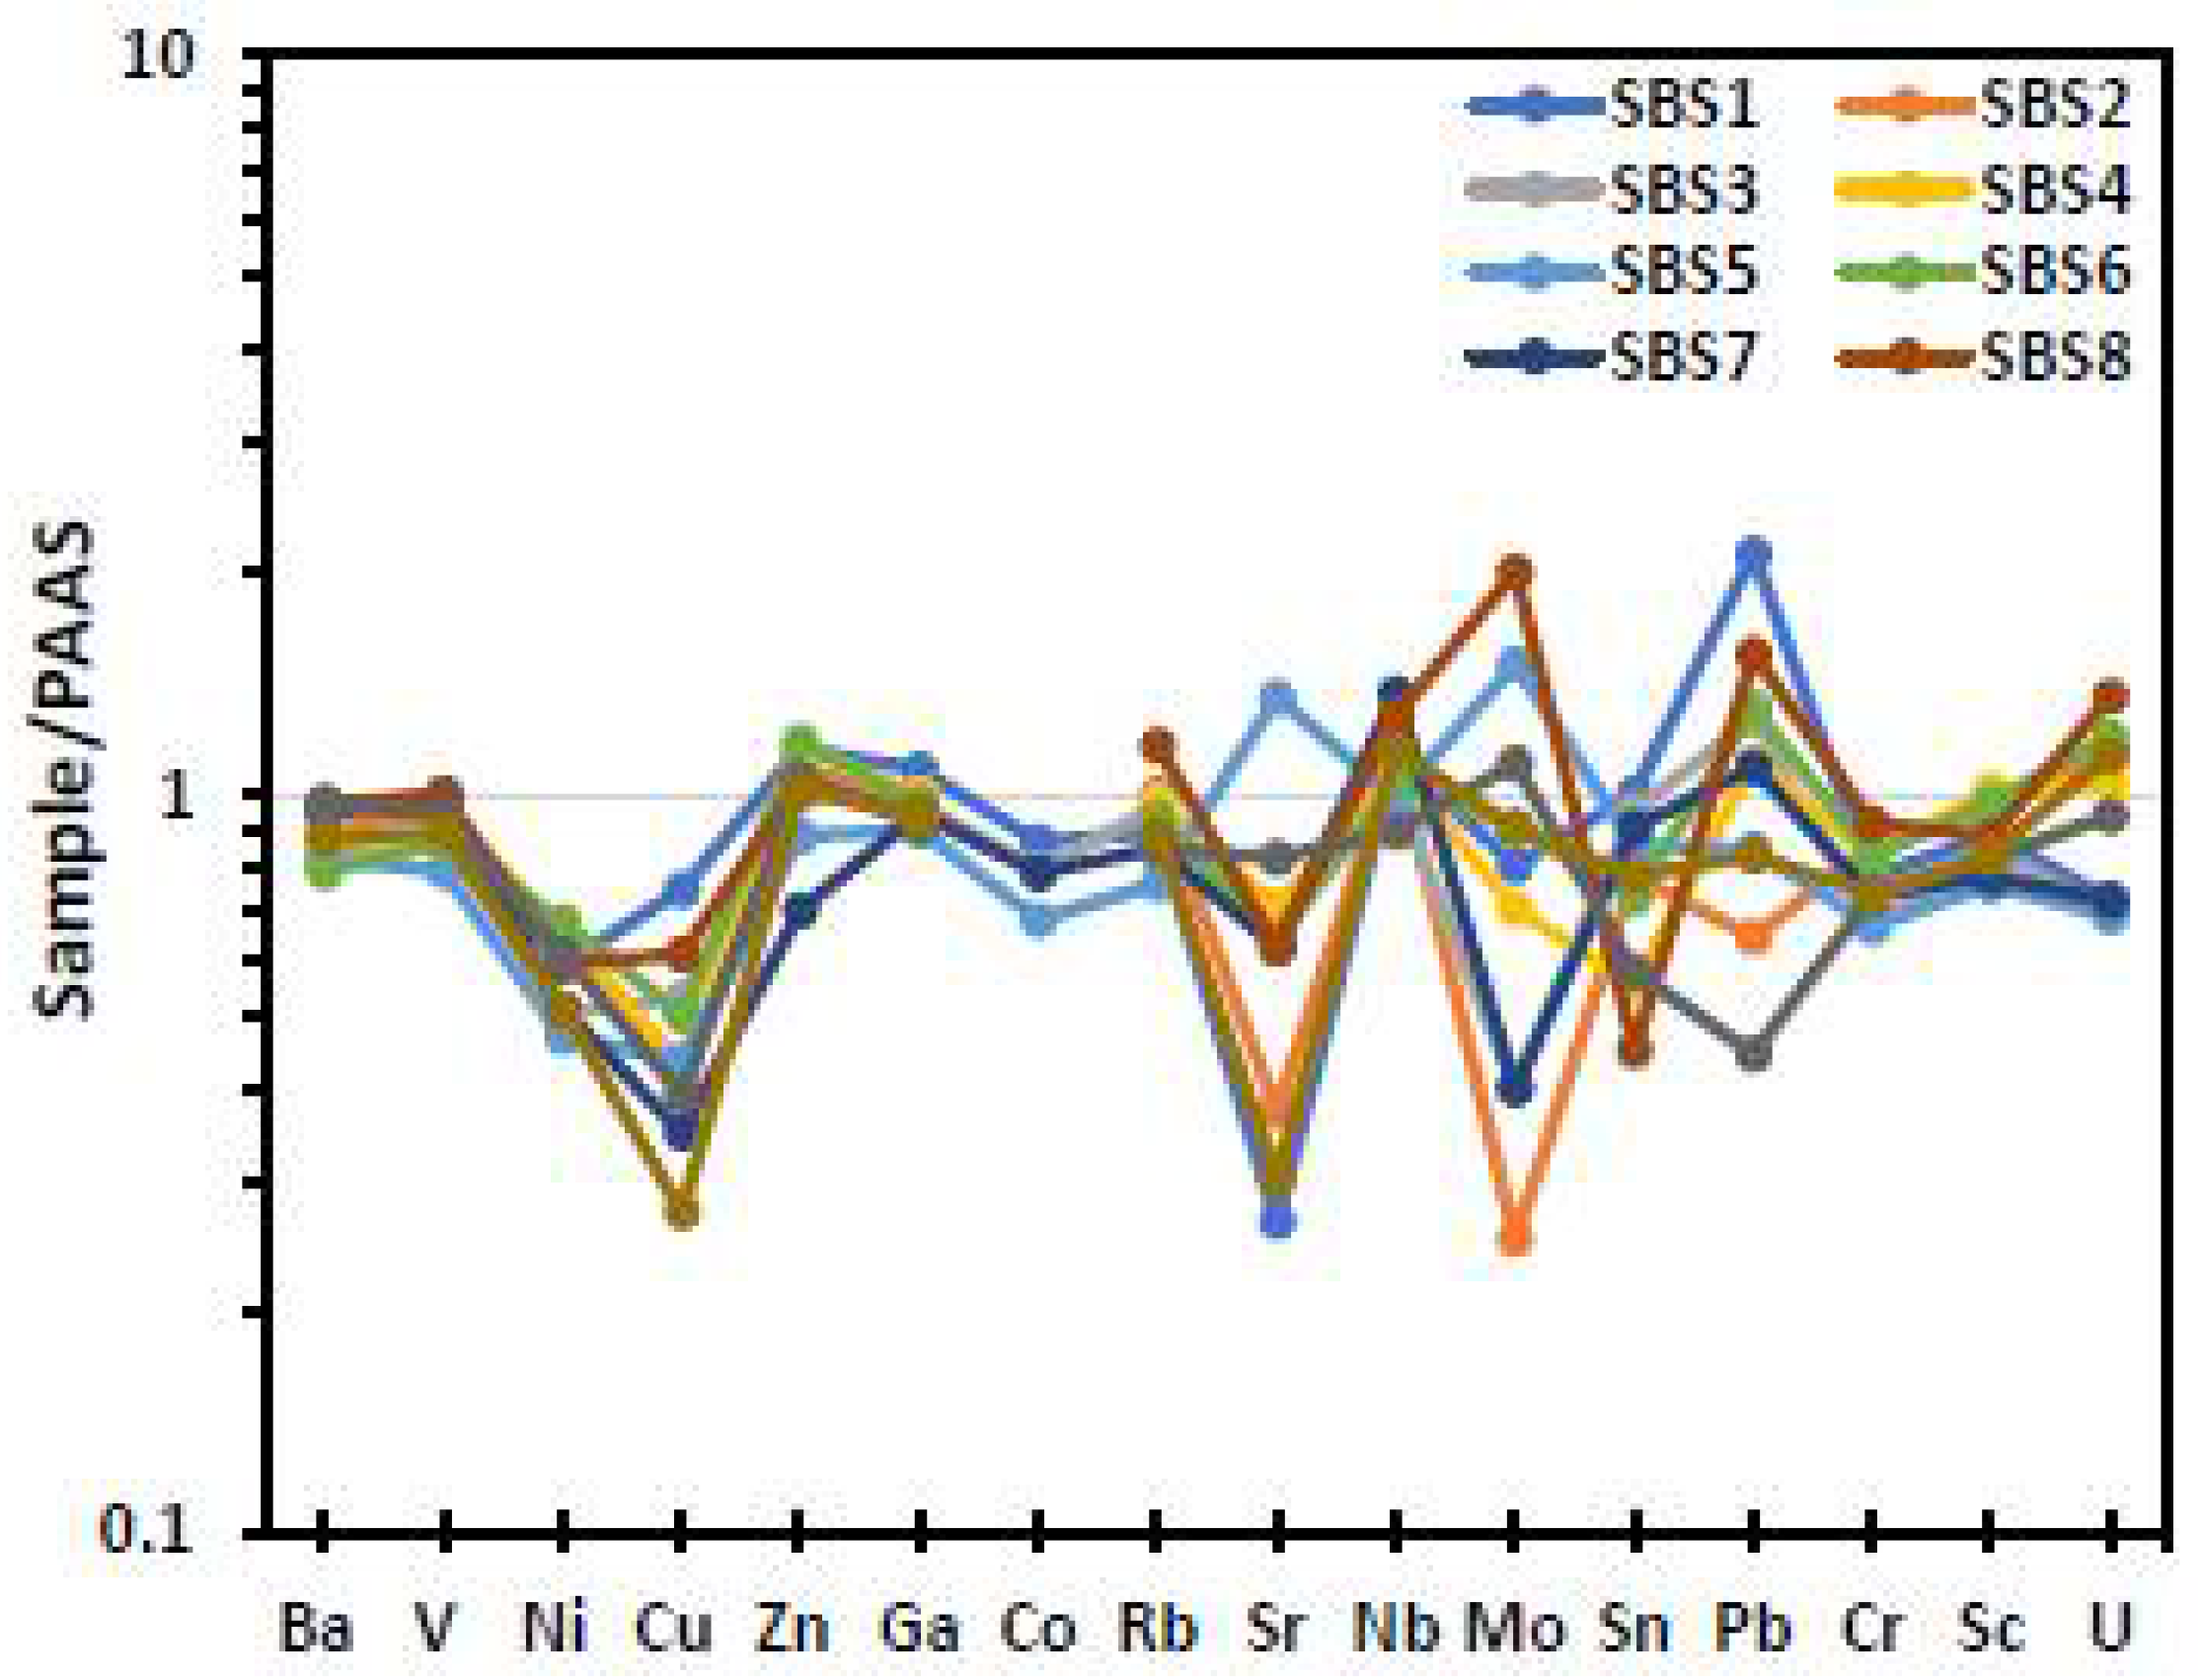
6.1. Major and Trace Element Composition
6.2. Pyrite Composition, Organic Carbon, and Sulfur Isotopes
7. Discussion
7.1. Gold Source Rock Characteristics
7.2. Redox Conditions
7.3. Characterisation of Pyrite Generations
7.4. Trace Element Deportment in Pyrite
7.5. Sulfur and Carbon Isotope Compositions
8. Conclusions
Author Contributions
Funding
Data Availability Statement
Acknowledgments
Conflicts of Interest
References
- Pašava, J.; Sulovsky, P.; Kovalova, M. Geochemistry and mineralogy of Proterozoic metal-rich black shales from the Bohemian massif Czech Republic with a description of possible new Molybdenum selenide and Telluride phases. Can. Mineral. 1993, 31, 745–754. [Google Scholar]
- Rimmer, S.M. Geochemical paleoredox indicators in Devonian–Mississippian black shales, Central Appalachian Basin (USA) Department of Geological Sciences, University of Kentucky, Lexington, KY 40506-0053, USA. Chem. Geol. 2004, 206, 373–391. [Google Scholar] [CrossRef]
- Tribovillard, N.; Algeo, T.J.; Lyons, T.; Riboulleau, A. Trace metals as paleoredox and paleoproductivity proxies: An update. Chem. Geol. 2006, 232, 12–32. [Google Scholar] [CrossRef]
- Pi, D.H.; Cong-Qiang, A.G.L.; Zhoud, S.; Shao-Yong, J. Trace and rare earth element geochemistry of black shale and kerogen in the early Cambrian Niutitang Formation in Guizhou province, South China: Constraints for redox environments and origin of metal enrichments. Precambrian Res. 2013, 225, 218–229. [Google Scholar] [CrossRef]
- Bloomstein, E.I.; Clark, J.B. Geochemistry of the Ordovician High-Calcium Black Shales Hosting Major Gold Deposits of the Getchell Trend in Nevada; U.S. Geological Survey Circular: Reston, VA, USA, 1991; 1058, pp. 1–5.
- Makoundi, C.; Khin Zaw Large, R.R.; Meffre, S.; Chun-Kit, L.; Guan, H.T. Geology, geochemistry and metallogenesis of the Selinsing gold deposit, Central Malaysia. Gondwana Res. 2014, 26, 241–261. [Google Scholar] [CrossRef]
- Endut, Z.; Tham Fatt, N.G.; Abdul Aziz, J.H.; Meffre, S.; Makoundi, C. Characterization of Galena and Vein Paragenesis in the Penjom Gold Mine, Malaysia: Trace Elements, Lead Isotope Study and Relationship to Gold Mineralization Episodes. Acta Geol. Sin. 2015, 89, 1801–1840. [Google Scholar]
- Makoundi, C. Geochemistry of Black Shales, Sandstones, and Chert in Malaysia: Insights into Gold Source Rocks. Ph.D. Thesis, University of Tasmania, Hobart, Australia, 2016; 383p. [Google Scholar]
- Cromie, P.; Makoundi, C.; Zaw, K.; Cooke, D.R.; White, N.; Ryan, C. Geochemistry of Au-bearing pyrite from the Sepon Mineral District, Laos DPR, Southeast Asia: Implications for ore genesis. J. Asian Earth Sci. 2018, 164, 194–218. [Google Scholar] [CrossRef]
- Stauffer, P.H.; Lee, C.P. Late Palaeozoic glacial marine facies in Southeast Asia and its implications. Bull. Geol. Soc. Malays. 1986, 20, 363–397. [Google Scholar] [CrossRef]
- Ali, C.A.; Mohamed, K.R.; Leman, M.S.; Komoo, I.; Unjah, T. Field Guide to Geology of Langkawi Geopark; Institut Alam Sekitar dan Pembangunan, Universiti Kebangsaan Malaysia: Selangor, Malaysia, 2008; pp. 1–82. ISBN 9839444891/9789839444896. [Google Scholar]
- Ali, C.A.; Mohamed, K.R.; Leman, M.S.; Komoo, I.; Tanut Cocks, L.R.M.; Fortey, R.A.; Lee, C.P. A Review of Lower and Middle Palaeozoic biostratigraphy in west Peninsular Malaysia and southern Thailand in its context within Sibumasu terrane. J. Asian Earth Sci. 2005, 24, 703–717. [Google Scholar]
- Liew, T.C.; McCulloch, M.T. Genesis of granitoid batholiths of Peninsular Malaysia and implications for models of crustal evolution: Evidence from Nd-Sr isotopic and U-Pb zircon study. Geochim. Cosmochim. Acta 1985, 49, 587–600. [Google Scholar] [CrossRef]
- Jones, C.R. Lower Paleozoic. In Geology of the Malay Peninsula; Gobbett, D.J., Hutchison, C.S., Eds.; Wiley-Interscience: New York, NY, USA, 1973; pp. 25–60. [Google Scholar]
- Ong, S.S. Geology of the Muda Dam Area, Kedah, West Malaysia. Bachelor’s Thesis, University of Malaya, Kuala Lumpur, Malaysia, 1969. [Google Scholar]
- Metcalfe, I. Tectonic evolution of the Malay Peninsula. J. Asian Earth Sci. 2013, 76, 195–213. [Google Scholar] [CrossRef]
- Metcalfe, I. Tectonic evolution of Sundaland. Bull. Geol. Soc. Malays. 2017, 63, 27–60. [Google Scholar] [CrossRef] [Green Version]
- Leman, M.S.; Yop, A. Early Permian sequence from Sungai Itau quarry, Langkawi: Its age, depositional environment and paleoclimatic implication. Geol. Soc. Malays. 2002, 46, 163–170. [Google Scholar]
- Basir, J.; Harun, Z.; Hassan, S.N. Black siliceous deposits in Peninsular Malaysia: Their occurrence and significance. Bull. Geol. Soc. Malays. 2003, 46, 149–154. [Google Scholar] [CrossRef] [Green Version]
- Mitchell, A.H.G.; Young, B.; Jantaranipa, W. The Phuket group, Peninsular Thailand: A Palaeozoic Geosynclinal deposit. Geol. Mag. 1970, 107, 411–428. [Google Scholar] [CrossRef]
- Waterhouse, J.B. An early Permian cool-water fauna from pebbly mudstones in south Thailand. Geol. Mag. 1982, 119, 337–354. [Google Scholar] [CrossRef]
- Allman, R.; Crocket, J.H. Handbook of Geochemistry; Wedepohl, K.H., Ed.; Springer: New York, NY, USA, 1978; p. 79. [Google Scholar]
- Boyle, R.W. The geochemistry of gold and its deposits. Geol. Surv. Can. Bull. 1979, 280, 584p. [Google Scholar]
- Shawe, D.R. Geology and Resources of Gold in the United States; U.S. Government Printing Office: Washington, DC, USA, 1988; pp. A1–A8.
- Krom, M.D.; Berner, R.A. A rapid method for the determination of organic and carbonate carbon in geological samples. J. Sediment. Res. 1983, 53, 600–663. [Google Scholar] [CrossRef]
- Danyushevsky, L.V.; Robinson, P.; Gilbert, S.; Norman, M.; Large, R.R.; McGoldrick, P.; Shelley, J.M.G. Routine quantitative multi-element analysis of sulfide minerals by laser ablation ICP-MS: Standard development and consideration of matrix effects. Geochem. Explor. Environ. Anal. 2011, 11, 51–60. [Google Scholar] [CrossRef]
- Belousov, I. New Calibration Standard for LA-ICPMS Analysis of Sulphides. AGU, 2014 Fall Meeting. 2014. Available online: https://agu. confex.com/agu/fm14/webprogram/Paper19453.html (accessed on 5 April 2021).
- Belousov, I.A.; Danyushevsky, L.V.; Olin, P.H.; Gilbert, S.E.; Thompson, J. STDGL3: A new calibration standard for sulphide analysis by LAICP-MS. In Proceedings of the 25th Goldschmidt Conference, Prague, Czech Republic, 16–21 August 2015. [Google Scholar]
- Jochum, K.P. Reference Materials in Geochemical and Environmental Research. Analytical Geochemistry/Inorganic Instrumental Analysis, 2nd ed.; Elsevier Ltd.: Amsterdam, The Netherlands, 2014; Volume 15. [Google Scholar] [CrossRef]
- Gilbert, S.E.; Danyushevsky, L.V.; Rodemann, T.; Shimizu, N.; Gurenko, A.; Meffre, S.; Thomas, H. Optimisation of laser parameters for the analysis of sulphur isotopes in sulphide minerals by laser ablation ICP-MS. J. Anal. At. Spectrom. 2014, 29, 1042. [Google Scholar] [CrossRef]
- Large, R.R.; Danyushevsky, L.; Hollit, C.; Maslennikov, V.; Meffre, S.; Gilbert, S.; Bull, S.; Bull, S.; Scott, R.; Emsbo, P.; et al. Gold and Trace element zonation in pyrite using a laser imaging technique: Implications for the timing of gold in orogenic and Carlin-style sediment-hosted deposits. Econ. Geol. 2009, 104, 635–668. [Google Scholar] [CrossRef]
- Robinson, B.W.; Kusakabe, M. Quantitative preparation of SO2 for 34S/32S analyses from sulphides by combustion. Anal. Chem. 1975, 47, 1179–1181. [Google Scholar] [CrossRef]
- Gregory, D.; Large, R.R.; Halpin, J.A.; Baturina, E.L.; Lyons, T.W.; Wu, S.; Sack, P.J.; Chappaz, A.; Maslennikov, V.V.; Bull, S.W. Trace element content of background sedimentary pyrite in black shales. Econ. Geol. 2015, 110, 1389–1410. [Google Scholar] [CrossRef]
- Crocket, J.H. Distribution of gold in the Earth’s crust. In Gold Metallogeny and Exploration; Foster, R.P., Ed.; Chapman and Hall: London, UK; New York, NY, USA, 1991; pp. 1–36. [Google Scholar]
- Ketris, M.P.; Yudovitch, Y.E. Estimations of Clarkes for Carbonaceous bioliths: World averages for trace element contents in black shales and coals. Int. J. Coal Geol. 2009, 78, 135–148. [Google Scholar] [CrossRef]
- Huyck, H.L.O. When is a metalliferous black shale not a black shale? U.S. Geol. Survev Circ. 1989, 1058, 42–56. [Google Scholar]
- Large, R.R.; Bull, S.W.; Maslennikov, V.V. A carbonaceous sedimentary source-rock model for Carlin-type and orogenic gold deposits. Soc. Econ. Geol. 2011, 106, 331–358. [Google Scholar] [CrossRef]
- Brumsack, H.J. Geochemistry of recent TOC-rich sediments from the Gulf of California and Black Sea. Geol. Rundsch. 1989, 78, 851–882. [Google Scholar] [CrossRef]
- Calvert, S.E.; Pedersen, T.F. Geochemistry of recent oxic and anoxic marine sediments: Implications for the geological record. Mar. Geol. 1993, 113, 67–88. [Google Scholar] [CrossRef]
- Piper, D.Z.; Perkins, R.B. A modern vs. Permian black shales-the hydrography, primary, productivity and water-column chemistry of deposition. Chem. Geol. 2004, 206, 177–197. [Google Scholar] [CrossRef]
- Hanlie, H.; Qinyan, W.; Jiampin, C. Occurrence and distribution of invisible gold in the Shewushan supergene gold deposit, Southeastern Hubei, China. Can. Mineral. 1999, 37, 1525–1531. [Google Scholar]
- Thomas, H.V.; Large, R.R.; Bull, S.W.; Maslennikov, V.; Berry, R.F.; Fraser, R.; Froud, S.; Moye, R. Pyrite and pyrrhotite textures and composition in sediments, laminated quartz veins and reefs, at Bendigo Gold Mine, Australia; Insights for orogenesis. Econ. Geol. 2011, 106, 1–31. [Google Scholar] [CrossRef]
- Slingerland, R.; Smith, N. Occurrence, and formation of water-laid placers. Annu. Rev. Earth Planet. Sci. 1986, 14, 113–147. [Google Scholar] [CrossRef]
- René, M. Distribution and Origin of Clay Minerals during Hydrothermal Alteration of Ore Deposits. In Clay Minerals in Nature—Their Characterization, Modification and Application; Valášková, M., Martynkova, S.G., Eds.; InTech: Libchavy, Czech Republic, 2012; pp. 81–100. [Google Scholar] [CrossRef]
- Wood, S.A. The role of humic substances in the transport and fixation of metals of economic interest (Au, Pt, Pd, U, V). Ore Geol. Rev. 1996, 11, 1–33. [Google Scholar] [CrossRef]
- Sageman, B.B.; Lyons, T.W. Geochemistry of fine-grained sediments and sedimentary rocks. In Sediments, Diagenesis, and Sedimentary Rocks, Treatise on Geochemistry; MacKenzie, F., Ed.; Elsevier Publication: New York, NY, USA, 2004; Volume 7, pp. 115–158. [Google Scholar]
- Clarkson, M.O.; Wood, R.A.; Poulton, S.W.; Richoz Newton, R.J.; Kasemann, S.A.; Bowyer, F.; Krystyn, L. Dynamic anoxic ferruginous conditions during the end-Permian mass extinction and recovery. Nat. Commun. 2016, 7, 1–9. [Google Scholar] [CrossRef]
- Raiswell, R.; Hardisty, D.S.; Lyons, T.W.; Canfield, D.E.; Owens, J.D.; Planavsky, N.J.; Poulton, S.W.; Reinhard, C.T. The iron paleoredox proxies: A guide to the pitfalls, problems, and proper practice. Am. J. Sci. 2018, 318, 491–526. [Google Scholar] [CrossRef] [Green Version]
- Taylor, S.R.; McLennan, S.M. The Continental Crust: Its Composition and Evolution; Blackwell Malden Mass: Malden, MA, USA, 1985; p. 312. [Google Scholar]
- Huerta-Diaz, M.A.; Morse, J.W. A quantitative method for determination of trace metal concentrations in sedimentary pyrite. Mar. Chem. 1990, 29, 119–144. [Google Scholar] [CrossRef]
- Large, R.R.; Halpin, J.A.; Danyushevsky, L.V.; Maslennikov, V.V.; Bull, S.W.; Long, J.A.; Gregory, D.D.; Elena Lounejeva Lyons, T.W.; Sack, P.J.; McGoldrick, P.J.; et al. Trace element content of sedimentary pyrite as a new proxy for deep-time ocean–atmosphere evolution. Earth Planet. Sci. Lett. 2014, 389, 209–220. [Google Scholar] [CrossRef]
- Cavalazzi, B.; Agangi, A.; Barbieri, R.; Gasparotto, G. The formation of low-temperature sedimentary pyrite and its relationship with biologically induced processes. Geol. Ore Depos. 2014, 56, 395–408. [Google Scholar] [CrossRef]
- Wilkin, R.T.; Barnes, H.L.; Brantley, S.L. The size distribution of framboidal pyrite in modern sediments: An indicator of redox conditions. Geochim. Cosmochim. Acta 1996, 60, 3897–3912. [Google Scholar] [CrossRef]
- Raiswell, R. Pyrite texture, isotopic, composition and the availability of iron. Am. J. Sci. 1982, 82, 1244–1263. [Google Scholar] [CrossRef]
- Coleman, M.; Raiswell, R. Source of carbonate and origin of zonation in pyritiferous carbonate concretions: Evaluation of a dynamic model. Am. J. Sci. 1995, 295, 282–308. [Google Scholar] [CrossRef]
- Large, R.R. Helen Thomas, Dave Craw, Anicia Henne and Simon Henderson. Diagenetic pyrite as a source for metals in orogenic gold deposits, Otago Schist, New Zealand. N. Z. J. Geol. Geophys. 2012, 55, 137–149. [Google Scholar] [CrossRef] [Green Version]
- Large, R.R.; Maslennikov, V.V.; Robert, F.; Danyushevsky, L.V.; Chang, Z. Multistage sedimentary and metamorphic origin of pyrite and gold in the Giant Sukhoi log deposit, Lena Gold Province, Russia. Econ. Geol. 2007, 102, 1233–1267. [Google Scholar] [CrossRef]
- Fleet, M.E.; Chryssoulis, S.L.; MacLean, P.J.; Davidson, R.; Weisener, C.G. Arsenian pyrite fom gold deposits: Au and As distribution investigated by SIMS and EMF, and color staining and surface oxidation by XPS and LIMS. Can. Mineral. 1993, 31, 1–17. [Google Scholar]
- Reich, M.; Kesler, S.E.; Utsunomiya, S.; Palenik, C.S.; Chryssoulis, S.L.; Ewing, R. Solubility of gold in arsenian pyrite. Geochim. Cosmochim. Acta 2005, 69, 2781–2796. [Google Scholar] [CrossRef]
- Rye, R.O.; Ohmoto, H. Sulphur and carbon isotopes and ore genesis: A review. Econ. Geol. 1974, 69, 826–842. [Google Scholar] [CrossRef]
- Rollinson, H.R. Using Geochemical Data: Evaluation, Presentation, Interpretation; Longman: Singapore, 1996; pp. 1–314. [Google Scholar]
- Ohmoto, H.; Rye, R.O. Isotopes of sulphur and carbon. In Geochemistry of Hydrothermal Ore Deposits; Barnes, H.L., Ed.; Wiley: New York, NY, USA, 1979; pp. 509–567. [Google Scholar]
- Sangster, A.L. Light stable isotope evidence for a metamorphogenic orogen for bedding-parallel, gold-bearing veins in Cambrian flysch, Meguma Group. Explor. Min. Geol. 1992, 1, 69–79. [Google Scholar]
- Goldfarb, R.J.; Miller, L.D.; Leach, D.L.; Snee, L.W. Gold deposits in metamorphic rocks of Alaska. Econ. Geol. 1997, 9, 151–190. [Google Scholar]
- Phillips, G.N.; Groves, D.I.; Brown, I.J. Source requirements for the Golden Mile, Kalgoorie: Significance to the metamorphic replacement model for Archean gold deposits. Can. J. Earth Sci. 1987, 24, 1643–1651. [Google Scholar] [CrossRef]
- Oppenheimer, C.; Fischer, T.B.; Scaillet, B. Volcanic degassing: Process and impact. In Treatise on Geochemistry, 2nd ed.; Heinrich, D.H., Turekian, K., Eds.; Elsevier: Amsterdam, The Netherlands, 2014; pp. 111–179. [Google Scholar]
- Bowman, J.R. Stable-isotope systematics of skarns. In Mineralised Intrusion-Related Skarn Systems; Lentz, D.R., Ed.; Mineralogical Association of Canada: Ottawa, ON, Canada, 1998; Volume 26, pp. 59–414. [Google Scholar]
- Parnell, J.; Perez, M.; Armstrong, J.; Bullock, L.; Feldmann, J.; Boyce, A.J. A black shale protolith for gold-tellurium mineralisation in the Dalradian Supergroup (Neoproterozoic) of Britain and Ireland. Appl. Earth Sci. 2017, 126, 161–175. [Google Scholar] [CrossRef] [Green Version]
- Craig, H. The geochemistry of the stable carbon isotopes. Geochim. Cosmochim. Acta 1953, 3, 53–92. [Google Scholar] [CrossRef]
- Sackett, W.M. The depositional history and isotopic organic carbon composition of marine sediments. Mar. Geol. 1964, 2, 173–185. [Google Scholar] [CrossRef]
- Degens, E.T. Biogeochemistry of stable carbon isotopes. In Organic Geochemistry Methods and Results; Eglinton, G., Murphy, M.T.J., Eds.; Springer: Berlin/Heidelberg, Germany, 1969; pp. 304–329. [Google Scholar]
- Schidlowski, M.; Hayes, J.M.; Kaplan, I.R. Isotopic inferences of ancient biochemistries: Carbon, sulphur, hydrogen, and nitrogen. In Earth’s Earliest Biosphere: Its Origin and Evolution; Schopf, J.W., Ed.; Princeton University Press: Princeton, NJ, USA, 1983; pp. 149–187. [Google Scholar]


| Element | SMS1 | SMS2 | SMS3 | SMS4 | SMS5 | SMS6 | SMS7 | SMS8 | SMS9 | SMS10 |
|---|---|---|---|---|---|---|---|---|---|---|
| Al | 8.50 | 8.19 | 8.02 | 8.29 | 7.71 | 8.16 | 7.41 | 7.84 | 7.92 | 7.76 |
| Au | 46.30 | 47.58 | 61.65 | 53.25 | 45.76 | 47.76 | 65.28 | 57.08 | 41.70 | 39.63 |
| TOC | 0.20 | 0.23 | 0.37 | 0.24 | 0.25 | 0.35 | 0.10 | 0.11 | 0.02 | 0.13 |
| S | 0.03 | 0.005 | 0.01 | 0.09 | 0.08 | 0.06 | 0.005 | 0.39 | 0.005 | 0.005 |
| Ba | 604.00 | 581.00 | 542.00 | 573.00 | 530.00 | 511.00 | 621.00 | 631.00 | 632.00 | 566.00 |
| V | 143.00 | 142.00 | 129.00 | 129.00 | 118.00 | 129.00 | 150.00 | 149.00 | 140.00 | 133.00 |
| Ni | 32.18 | 35.70 | 27.92 | 34.90 | 25.79 | 36.90 | 28.07 | 32.40 | 33.40 | 28.10 |
| Cu | 37.09 | 21.30 | 26.40 | 21.50 | 21.76 | 25.10 | 17.39 | 30.30 | 19.60 | 13.60 |
| Zn | 97.67 | 91.90 | 85.34 | 97.90 | 74.57 | 100.00 | 59.19 | 88.20 | 89.20 | 85.90 |
| Ga | 21.57 | 19.80 | 19.35 | 19.90 | 17.88 | 19.40 | 18.82 | 18.80 | 18.20 | 18.70 |
| As | 54.70 | 26.20 | 13.00 | 12.50 | 6.70 | 12.00 | 10.00 | 17.20 | 11.80 | 15.60 |
| Co | 19.80 | BDL | 18.14 | BDL | 15.55 | BDL | 17.96 | BDL | BDL | BDL |
| Rb | 142.14 | 160.00 | 153.67 | 156.00 | 120.90 | 149.00 | 135.15 | 186.00 | 135.00 | 141.00 |
| Sr | 52.70 | 74.40 | 131.68 | 141.00 | 270.25 | 127.00 | 124.19 | 124.00 | 164.00 | 60.50 |
| Y | 33.25 | 34.30 | 31.40 | 30.80 | 30.30 | 32.20 | 30.98 | 28.10 | 29.90 | 32.50 |
| Zr | 225.00 | 251.00 | 250.20 | 234.00 | 241.30 | 228.00 | 282.30 | 229.00 | 228.00 | 278.00 |
| Nb | 21.40 | 21.90 | 19.10 | 20.60 | 18.70 | 19.90 | 26.00 | 24.20 | 16.90 | 21.80 |
| Mo | 0.80 | 0.25 | 0.40 | 0.70 | 1.50 | 0.90 | 0.40 | 2.00 | 1.10 | 0.90 |
| Ag | 0.15 | 1.00 | 0.15 | 1.00 | 0.15 | 1.00 | 0.15 | 1.00 | 1.00 | 1.00 |
| Sn | 4.00 | 3.10 | 3.80 | 2.20 | 3.40 | 2.90 | 3.60 | 1.80 | 2.30 | 3.10 |
| Sb | 6.70 | 4.20 | 0.60 | 1.00 | 0.60 | 1.00 | 0.40 | 1.00 | 1.00 | 1.00 |
| Te | 0.10 | 1.00 | 0.05 | 1.00 | 0.05 | 1.00 | 0.10 | 1.00 | 1.00 | 1.00 |
| Th | 19.36 | 21.40 | 17.01 | 18.60 | 15.89 | 19.50 | 19.87 | 20.20 | 14.10 | 15.70 |
| Pb | 42.30 | 12.80 | 25.25 | 22.10 | 16.81 | 26.10 | 21.73 | 30.90 | 8.90 | 16.50 |
| Bi | 0.60 | 1.00 | 0.30 | 1.00 | 0.30 | 1.00 | 0.20 | 1.00 | 1.00 | 1.00 |
| Cr | 84.70 | 93.60 | 72.70 | 90.40 | 72.90 | 90.60 | 80.10 | 100.40 | 80.00 | 80.50 |
| Th | 19.36 | 21.40 | 17.01 | 18.60 | 15.89 | 19.50 | 19.87 | 20.20 | 14.10 | 15.70 |
| Sc | 14.06 | 15.20 | 13.43 | 16.20 | 12.05 | 15.60 | 12.35 | 14.00 | 13.10 | 13.30 |
| La | 46.67 | 36.60 | 43.75 | 46.30 | 45.23 | 44.90 | 49.34 | 46.80 | 33.90 | 39.90 |
| U | 2.23 | 3.50 | 2.15 | 3.20 | 2.12 | 3.70 | 2.22 | 4.20 | 2.90 | 3.50 |
| Nd | 41.07 | 31.40 | 37.70 | 41.20 | 39.41 | 37.30 | 40.16 | 35.70 | 31.30 | 35.30 |
| Lithology | Sample | SiO2 | Al2O3 | Fe2O3 | MgO | CaO | Na2O | K2O | TiO2 | P2O5 | Loss | Total |
|---|---|---|---|---|---|---|---|---|---|---|---|---|
| Mudstone | SMS1 | 64.16 | 16.07 | 6.85 | 2.46 | 0.25 | 2.32 | 3.29 | 0.83 | 0.18 | 3.59 | 100 |
| Mudstone | SMS2 | 64.53 | 15.49 | 6.05 | 2.49 | 0.81 | 1.96 | 3.7 | 0.771 | 0.168 | 3.7 | 99.669 |
| Mudstone | SMS3 | 63.86 | 15.17 | 5.79 | 2.52 | 1.83 | 1.87 | 3.54 | 0.83 | 0.17 | 4.32 | 99.9 |
| Mudstone | SMS4 | 62.58 | 15.67 | 6.15 | 2.43 | 1.6 | 2.22 | 3.63 | 0.811 | 0.149 | 4.25 | 99.49 |
| Mudstone | SMS5 | 61.57 | 14.58 | 5.28 | 2.05 | 3.92 | 2.38 | 3.19 | 0.75 | 0.13 | 5.75 | 99.6 |
| Mudstone | SMS6 | 62.55 | 15.43 | 6.74 | 2.79 | 1.57 | 1.96 | 3.38 | 0.787 | 0.17 | 4.32 | 99.697 |
| Mudstone | SMS7 | 66.72 | 14.01 | 5.44 | 2.5 | 1.63 | 1.71 | 4.2 | 0.75 | 0.18 | 2.57 | 99.71 |
| Mudstone | SMS8 | 64.77 | 14.82 | 5.64 | 3.09 | 1.59 | 1.35 | 4.86 | 0.764 | 0.104 | 2.42 | 99.408 |
| Mudstone | SMS9 | 65.59 | 14.97 | 5.87 | 2.61 | 1.66 | 2.96 | 3.28 | 0.765 | 0.187 | 1.48 | 99.372 |
| Mudstone | SMS10 | 65.81 | 14.66 | 5.38 | 2.81 | 1.02 | 1.94 | 3.48 | 0.821 | 0.193 | 1.86 | 97.974 |
| Shale | PAAS | 62.8 | 18.9 | 7.22 | 2.2 | 1.3 | 1.2 | 3.7 | 1 | 0.16 |
| Pyrite ID | V | Co | Ni | Cu | Zn | As | Se | Mo | Ag | Sb | Te | Au | Tl | Pb | Cd | Bi |
|---|---|---|---|---|---|---|---|---|---|---|---|---|---|---|---|---|
| Py 1_A | 4.1 | 3767 | 956 | 775 | 107 | 3643 | 67 | 76.38 | 12 | 221 | 38 | 0.9 | 2.8 | 977 | 1.7 | 234 |
| Py 1_B | 3.9 | 2714 | 903 | 293 | 146 | 3552 | BDL | 66.52 | 11 | 184 | 30 | 0.72 | 1.9 | 664 | 1.6 | 178 |
| Py 1_C | 2 | 2296 | 1720 | 8325 | 1331 | 2330 | BDL | 48.07 | 11 | 131 | 25 | 0.17 | 2.15 | 1635 | 2.8 | 119 |
| Py 1_D | 21.4 | 4193 | 765 | 315 | 125 | 3516 | BDL | 105.01 | 20 | 214 | 36 | 1.61 | 0.522 | 992 | 0.5 | 237 |
| Py 1_E | 1.6 | 1095 | 663 | 145 | 182 | 1063 | 68 | 43.56 | 3 | 53 | 15 | 0.07 | 0.34 | 604 | 2 | 57 |
| Py 1_F | 13.6 | 5344 | 720 | 4341 | 687 | 5033 | BDL | 41.69 | 14 | 215 | 37 | 0.59 | 2.24 | 1738 | 4 | 211 |
| Py 1_G | 3.5 | 2116 | 17,721 | 311 | 1432 | 1461 | 99 | 34.4 | 10 | 218 | 23 | 0.24 | 1.62 | 8903 | 4 | 100 |
| Py 1_H | 1.6 | 1788 | 13,812 | 244 | 1461 | 2138 | 72 | 26.8 | 4 | 197 | 15 | 0.1 | 1.15 | 6309 | 22 | 91 |
| Py 1_I | 1.1 | 650 | 13,551 | 334 | 538 | 993 | 60 | 40.95 | 5 | 266 | 8 | 0.24 | 1.28 | 2269 | 1.68 | 46 |
| Py 1_J | 3.3 | 2860 | 413 | 428 | 2282 | 3351 | BDL | 78.01 | 8 | 247 | 43 | 0.33 | 1.94 | 908 | 19 | 226 |
| Py 1_K | 0 | 787 | 7046 | 280 | 460 | 1747 | 50 | 23.1 | 3 | 295 | 22 | 0.26 | 1.44 | 2166 | 2 | 104 |
| Py 1_L | 2.4 | 1121 | 323 | 206 | 475 | 4226 | BDL | 28.66 | 5 | 89 | 7 | 0.31 | 0.57 | 600 | 1.84 | 58 |
| Py 1_M | 1.9 | 4764 | 910 | 691 | 1990 | 2605 | BDL | 40.23 | 4 | 146 | 17 | 0.34 | 0.62 | 1149 | 7 | 108 |
| Py 1_N | 1.2 | 413 | 115 | 90 | 329 | 4790 | BDL | 28.69 | 4 | 51 | 3.85 | 0.14 | 0.211 | 242 | 2.17 | 35 |
| Py 1_O | 0.7 | 3182 | 1022 | 371 | 342 | 3427 | BDL | 95.05 | 6 | 245 | 26 | 0.58 | 1.29 | 784 | 1.84 | 84 |
| Py 1_P | 0 | 296 | 97 | 85 | 198 | 454 | 66 | 216.78 | 3 | 46 | 3.38 | 0.13 | 0.185 | 1515 | 1.91 | 33 |
| Py 1_Q | 0 | 380 | 150 | 68 | 79 | 413 | 42 | 33.98 | 1 | 42 | 7 | 0.06 | 0.17 | 937 | 0.77 | 28 |
| Py 1_R | 1.2 | 885 | 480 | 150 | 343 | 800 | 72 | 12.22 | 3 | 63 | 9 | 0.13 | 0.18 | 748 | 1.88 | 50 |
| Py 1_S | 3.4 | 137 | 148 | 46 | 167 | 470 | BDL | 5.53 | 0.5 | 34 | 3.52 | 0.13 | 0.19 | 722 | 1.98 | 12 |
| Py 1_T | 0.1 | 128 | 46 | 66 | 461 | 298 | BDL | 9.78 | 0.5 | 32 | 3.61 | 0.14 | 0.2 | 785 | 2.04 | 7 |
| Py 1_U | 0.9 | 791 | 234 | 218 | 1049 | 832 | BDL | 41.47 | 4 | 86 | 3.23 | 0.12 | 0.18 | 795 | 1.82 | 31 |
| Py 1_V | 0 | 232 | 116 | 110 | 474 | 435 | BDL | 19.75 | 2 | 65 | 3.35 | 0.13 | 0.18 | 591 | 1.89 | 19 |
| Py 1_W | 4.2 | 269 | 371 | 130 | 784 | 682 | 65 | 27.05 | 1 | 42 | 6 | 0.05 | 0.07 | 779 | 1 | 35 |
| Py 1_X | 1.1 | 3654 | 939 | 307 | 114 | 3716 | 14 | 113.19 | 13 | 237 | 44 | 0.69 | 2.79 | 0.4 | 0 | 213 |
| Py 1_Y | 5.8 | 2875 | 664 | 12,574 | 1592 | 2800 | 42 | 56.56 | 12 | 216 | 38 | 0.65 | 1.8 | 3.3 | 3 | 166 |
| Py 1_Z | 10.4 | 3572 | 898 | 299 | 352 | 3834 | BDL | 126.63 | 12 | 240 | 41 | 0.83 | 1.62 | 0.7 | 3.33 | 185 |
| Py 1_A2 | 3 | 412 | 145 | 79 | 5599 | 2532 | BDL | 32.63 | 1.2 | 58 | 0 | 0.41 | 0.38 | 26.1 | 26 | 27 |
| Py 1_A3 | 6.7 | 2483 | 695 | 223 | 76 | 2655 | BDL | 61.23 | 8 | 164 | 35 | 0.43 | 1.72 | 0.6 | 7.57 | 153 |
| Py 1_A4 | 0.5 | 5162 | 1557 | 973 | 1165 | 4555 | BDL | 80.24 | 13 | 227 | 60 | 0.28 | 0.85 | 9.7 | 10 | 198 |
| Py 1_A5 | 2.8 | 1975 | 742 | 409 | 747 | 1992 | BDL | 54.4 | 8 | 21 | 24 | 0.41 | 0.78 | 0.2 | 3.6 | 215 |
| Py 1_A6 | 1.7 | 3859 | 994 | 6317 | 30,925 | 3538 | 545 | 60.59 | 15 | 140 | 34 | 0.38 | 1.07 | 71.8 | 72 | 180 |
| Py 1_A7 | 32.5 | 6558 | 2182 | 480 | 141 | 6485 | BDL | 82.49 | 16 | 209 | 43 | 1.29 | 0.97 | 0.1 | 4.07 | 234 |
| Py 1_A8 | 0 | 578 | 153 | 114 | 515 | 568 | BDL | 47.29 | 1.6 | 157 | 0 | 0.52 | 0.48 | 0.1 | 4.57 | 15 |
| Py 1_A9 | 3.2 | 3495 | 899 | 363 | 3725 | 3674 | BDL | 58.25 | 11 | 38 | 44 | 0.41 | 1.07 | 9.5 | 10 | 200 |
| Py2_A | 20 | 1887 | 389 | 217 | 149 | 6111 | BDL | 12.86 | 4 | 349 | 63 | 0.29 | 2.85 | 620 | 2.02 | 295 |
| Py2_B | 13.1 | 971 | 233 | 178 | 158 | 8819 | BDL | 6.38 | 2 | 154 | 30 | 0.11 | 1.24 | 413 | 1.83 | 160 |
| Py2_C | 7.1 | 1452 | 265 | 380 | 85 | 5979 | BDL | 10.2 | 4 | 225 | 31 | 0.11 | 1.19 | 463 | 1.8 | 201 |
| Py2_D | 7.5 | 1971 | 335 | 181 | 559 | 6189 | BDL | 5.61 | 4 | 303 | 55 | 0.11 | 1.53 | 682 | 1.8 | 312 |
| Py2_E | 12.8 | 1510 | 258 | 174 | 100 | 5703 | BDL | 6.83 | 3 | 239 | 37 | 0.24 | 1.77 | 660 | 1.92 | 231 |
| Py3_A | 2.6 | 1838 | 402 | 415 | 457 | 10,671 | BDL | 29.83 | 7 | 233 | 58 | 0.32 | 1.94 | 901 | 1.57 | 288 |
| Py3_B | 1.4 | 333 | 234 | 121 | 540 | 562 | 51 | 35.19 | 2 | 49 | 10 | 0.12 | 0.18 | 341 | 1.83 | 32 |
| Py3_C | 0.2 | 266 | 199 | 139 | 779 | 549 | 61 | 36.62 | 1 | 54 | 8 | 0.13 | 0.19 | 483 | 1.92 | 32 |
| Py3_D | 0 | 271 | 193 | 132 | 752 | 520 | 80 | 40.1 | 1 | 39 | 6 | 0.06 | 0.07 | 382 | 0.735 | 27 |
| Py3_E | 15.3 | 270 | 102 | 87 | 704 | 434 | 73 | 29.37 | 0.5 | 36 | 3.54 | 0.13 | 0.19 | 476 | 1.995 | 11 |
| Py3_F | 10.5 | 259 | 137 | 40 | 394 | 700 | 53 | 19.35 | 0.5 | 28 | 3.5 | 0.13 | 0.19 | 232 | 1.97 | 6 |
| Py3_G | 13.1 | 366 | 314 | 145 | 634 | 650 | 49 | 17.38 | 2 | 45 | 7 | 0.11 | 0.12 | 730 | 3 | 36 |
| Py3_H | 0.5 | 1465 | 674 | 508 | 1301 | 1514 | 68 | 31.25 | 5 | 117 | 14 | 0.33 | 0.19 | 1245 | 1 | 95 |
| Py3_I | 1.3 | 345 | 347 | 141 | 400 | 746 | 77 | 154.53 | 3 | 59 | 11 | 0.18 | 0.11 | 2812 | 1 | 64 |
| Py3_J | 0.8 | 617 | 397 | 116 | 290 | 767 | 77 | 23.25 | 3 | 54 | 13 | 0.23 | 0.1255 | 0.248 | 1.6 | 51 |
| Py3_K | 0 | 687 | 301 | 143 | 198 | 687 | 72 | 11.92 | 3 | 42 | 13 | 0.25 | 0.121 | 0.123 | 1.6 | 42 |
| Py3_L | 0 | 625 | 801 | 275 | 1210 | 1029 | 66 | 33.31 | 3 | 65 | 11 | 0.18 | 0.18 | 913 | 8 | 54 |
| Py3_M | 0 | 811 | 472 | 148 | 1146 | 914 | 56 | 64.53 | 5 | 66 | 13 | 0.17 | 0.19 | 1.01 | 1 | 63 |
| Py3_N | 0.1 | 642 | 384 | 135 | 782 | 853 | 62 | 24.66 | 2 | 47 | 8 | 0.12 | 0.09 | 416 | 1 | 44 |
| Py3_O | 2.9 | 239 | 349 | 115 | 535 | 493 | 57 | 15.85 | 2 | 44 | 7 | 0.11 | 0.15 | 505 | 1 | 35 |
| Py4_A | 0 | 467 | 138 | 145 | 1117 | 1166 | 48 | 54.89 | 1 | 60 | 3.22 | 0.12 | 0.176 | 688 | 1.8 | 19 |
| Py4_B | 0.1 | 357 | 105 | 99 | 903 | 1146 | 53 | 65.3 | 0.4 | 56 | 3.24 | 0.12 | 0.177 | 580 | 1.8 | 17 |
| Py4_C | 0.4 | 366 | 129 | 69 | 220 | 423 | 55 | 6.71 | 1 | 32 | 3.46 | 0.13 | 0.1895 | 203 | 2 | 22 |
| Py4_D | 9.4 | 135 | 888 | 60 | 368 | 565 | 51 | 8 | 2 | 53 | 4 | 0 | 0.02 | 563 | 0 | 26 |
| Py4_E | 0.1 | 341 | 166 | 140 | 645 | 587 | 53 | 26.25 | 2 | 59 | 10 | 0.19 | 0.12 | 649 | 1 | 49 |
| Py4_F | 1 | 408 | 580 | 90 | 436 | 646 | 80 | 21.62 | 2 | 46 | 9 | 0.11 | 0.1 | 756 | 2 | 33 |
| Py4_G | 0.2 | 515 | 686 | 93 | 406 | 774 | 72 | 62.21 | 3 | 62 | 14 | 0.12 | 0.16 | 0.55 | 1 | 50 |
| Py4_H | 20.2 | 1127 | 974 | 319 | 58 | 1970 | BDL | 23.08 | 4 | 139 | 25 | 0.53 | 1.02 | 1.837 | 1.835 | 122 |
| Py4_I | 0.1 | 0 | 10.6 | 1.58 | 0.21 | 19.17 | 13.17 | 0.09 | 0 | 0.01 | 0.1 | 0 | 0.15 | 1.05 | 0 | 0 |
| Py5_A | 5.6 | 125 | 20 | 9 | 0.715 | 102 | BDL | 1.1 | 0.3345 | 25 | 2.28 | 0.09 | 0.39 | 66 | 1.465 | 1 |
| Py5_B | 11.5 | 68 | 25 | 20 | BDL | 74 | BDL | 3.26 | 0.358 | 46 | 2.435 | 0.1 | 0.87 | 79 | 1.57 | 2 |
| Py5_C | 0.4 | 26 | 51 | 12 | BDL | 100 | 19 | 0.05 | 0 | 58 | 0.18 | 0.07 | 0.16 | 84 | 0.29 | 3 |
| Py5_D | 1.2 | 26 | 257 | 24 | 3 | 97 | 20 | 0 | 0 | 23 | 1 | 0.01 | 0.11 | 0.3 | 0 | 3 |
| Py5_E | 0.3 | 152 | 611 | BDL | BDL | 810 | BDL | 1.213 | 1.1 | 211 | 0 | 0.36 | 0.33 | 0.3 | 3.13 | 1 |
| Py5_F | 2.9 | 37 | 45 | 35 | BDL | 201 | BDL | 1.2335 | 1.1 | 35 | 0 | 0.36 | 1.12 | 0.4 | 3.185 | 2 |
| Py5_G | 9.2 | 55 | 312 | BDL | 3.3 | 488 | BDL | 1.403 | 1.2 | 3 | 0 | 0.41 | 0.3815 | 0.2 | 3.62 | 4 |
| Py5_H | 2.3 | 666 | 2214.2 | 27.44 | 15.38 | 0.88 | 44.86 | 630.06 | 6.7 | 103.78 | 11.65 | 0.11 | 1.5 | 1004 | 0.1 | 83.98 |
| Py5_I | 17.8 | 566 | 1081.5 | 115.99 | 18.57 | 1.98 | 33.46 | 0.52 | 3 | 70.96 | 3.64 | 0.04 | 1.59 | 511.6 | 0.05 | 9.76 |
| Py5_J | 26.7 | 499 | 1394.2 | 12.37 | 7.81 | 1.03 | 37.99 | 5.73 | 5.8 | 56.63 | 9.02 | 0.08 | 1.69 | 679.9 | 0.03 | 75.45 |
| Py5_K | 5.1 | 586 | 2504.9 | 253.38 | 3.59 | 1.65 | 42.16 | 346.54 | 13.4 | 114.71 | 11.56 | 0.09 | 2.36 | 1125.4 | 0.06 | 104.48 |
| Py5_L | 1 | 608 | 1450 | 65.84 | 2 | 0.95 | 38.15 | 0.52 | 2 | 68.65 | 1.6 | 0.02 | 1.49 | 320 | 0 | 11.03 |
| Py5_M | 14.5 | 2.7 | 65.4 | 12.79 | 0.69 | 28.86 | 12.23 | 2.52 | 0 | 1.46 | 0.14 | 0 | 0.98 | 11.2 | 0.16 | 0.01 |
| Py5_N | 14.8 | 2 | 65.1 | 25.48 | 1.28 | 50.43 | 13.67 | 2.04 | 0.1 | 1.86 | 0.1 | 0 | 1.65 | 17.9 | 0.15 | 0.02 |
| Py5_O | 5 | 2.4 | 199.5 | 16.33 | 1.17 | 60.08 | 11.74 | 2.42 | 0 | 1.51 | 0.09 | 0 | 0.85 | 11.5 | 0.16 | 0.03 |
| Py5_P | 0.7 | 2.3 | 29 | 55.21 | 0.84 | 115.04 | 27.5 | 45.34 | 0 | 0.58 | 0.19 | 0.01 | 0.07 | 2.8 | 0.03 | 0 |
| Py5_Q | 3.1 | 8.5 | 408.9 | 29.2 | 6.15 | 576.22 | 48.32 | 17.28 | 0.2 | 1.87 | 0 | 0 | 0.08 | 4.2 | 0.06 | 0.01 |
| Py5_R | 23.5 | 1.8 | 24.4 | 34.28 | 2.34 | 57.32 | 13.21 | 3.27 | 0.1 | 2 | 0.51 | 0.01 | 1.15 | 20.5 | 0.24 | 0.03 |
| Py5_S | 19.5 | 2 | 19.4 | 20.34 | 0.89 | 22.61 | 10.89 | 5.75 | 0.1 | 0.39 | 0.09 | 0 | 1.28 | 16.8 | 0.07 | 0.02 |
| Py5_T | 9.3 | 2.7 | 36.9 | 25.38 | 1.15 | 31.81 | 9.26 | 3.36 | 0.1 | 0.75 | 0.09 | 0.01 | 1.14 | 13.7 | 0.1 | 0.03 |
| Py5_U | 7 | 143 | 73 | 78 | BDL | 353 | BDL | 2.86 | 1 | 174 | 2.43 | 0.1 | 0.84 | 699 | 1.645 | 31 |
| Py5_V | 0.5 | 124 | 95 | 93 | 1.925 | 539 | BDL | 0.495 | 1 | 184 | 2.275 | 0.09 | 0.94 | 784 | 1.535 | 24 |
| Py6_A | 4.2 | 48 | 24 | 25 | 0.705 | 68 | BDL | 0.513 | 0.4 | 64 | 2.35 | 0.1 | 0.87 | 221 | 1.59 | 9 |
| Py6_B | 0.3 | 39 | 22 | 45 | 2.545 | 208 | BDL | 0.4885 | 2 | 136 | 2.235 | 0.09 | 1.07 | 545 | 1.535 | 8 |
| Py6_C | 4.8 | 62 | 92 | 73 | 1.875 | 143 | BDL | 0.4975 | 2 | 151 | 2.275 | 0.09 | 1.84 | 506 | 1.54 | 15 |
| Py6_D | 1.9 | 100 | 46 | 9 | 1.685 | 93 | BDL | 0.434 | 0.3 | 25 | 2.22 | 0.09 | 0.1255 | 105 | 1.43 | 2 |
| Py6_E | 0.9 | 49 | 50 | 22 | BDL | 117 | BDL | 1.69 | 0.3 | 77 | 2.36 | 0.1 | 2.44 | 174 | 1.52 | 1 |
| Py6_F | 0 | 112 | 19 | 4.655 | 1.895 | 140 | BDL | 0.714 | 0.4 | 25 | 3.195 | 0.12 | 0.84 | 29 | 1.8 | 0 |
| Py6_G | 2.3 | 12 | 42 | 24 | 2.1665 | 74 | BDL | 0.7085 | 0.4 | 72 | 3.17 | 0.12 | 1.67 | 90 | 1.79 | 17 |
| Py6_H | 0.4 | 26 | 764 | 47 | BDL | 729 | 107 | 0.09 | 0 | 59 | 8 | 0 | 0.04 | 273 | 0 | 12 |
| Py6_I | 2.1 | 61 | 57 | 117 | 11 | 1115 | 65 | 2.16 | 1 | 167 | 7 | 0.08 | 0.23 | 1423 | 0 | 34 |
| Py6_J | 0 | 679 | 119 | 6 | 2 | 303 | 24 | 0.05 | 0 | 1 | 0 | 0 | 0.03 | 0.03 | 0 | 1 |
| Py6_K | 0.2 | 127 | 147 | 20 | 30 | 204 | 5 | 5.02 | 0 | 55 | 0 | 0.03 | 0.16 | 0 | 0 | 3 |
| Py6_L | 1.7 | 64 | 49 | 8 | 2 | 354 | 33 | 0.15 | 0 | 9 | 1 | 0 | 0.25 | 0.7 | 1 | 6 |
| Py6_M | 5.6 | 507.9 | 991 | 106.81 | 2.57 | 1.1 | 32.27 | 0.17 | 2.3 | 27.36 | 1.44 | 0.01 | 1.84 | 172.1 | 0.06 | 7.36 |
| Py6_N | 7 | 500.4 | 1187.9 | 120.09 | 2.51 | 2.34 | 25.43 | 0.09 | 3.3 | 211.02 | 1.72 | 0.02 | 7.95 | 324.4 | 0.04 | 5.03 |
| Py6_O | 0.1 | 384.9 | 743.18 | 5.55 | 0.78 | 0 | 25.8 | 0.03 | 0.1 | 72.66 | 0.29 | 0 | 1.64 | 42.7 | 0 | 0.45 |
| Py6_P | 8.2 | 498.5 | 1151.4 | 12.91 | 10.85 | 3.9 | 36.93 | 0.35 | 3.1 | 78.45 | 2.14 | 0.01 | 1.71 | 282.4 | 0.05 | 8.07 |
| Py6_Q | 1.8 | 591.4 | 1363.3 | 4.71 | 1.65 | 1.04 | 45.16 | 0.04 | 0.5 | 24.95 | 0.28 | 0 | 0.82 | 80.7 | 0 | 1.03 |
| Sample | Formation | Weight | δ13Corg | Corrected δ13CPDB | δ34S | Source |
|---|---|---|---|---|---|---|
| LA-3412 | Singa | 30.493 | −23.4 | −23.94 | −21.61 | Terrestrial |
| LA-3512 | Singa | 21.0176 | −17.8 | −18.21 | −19.69 | Terrestrial |
| LA-3612 | Singa | 14.8908 | −9.22 | −9.46 | −7.47 | Marine |
| LA-3712 | Singa | 11.0084 | −11.31 | −11.59 | −8.44 | Marine |
| LA-3812 | Singa | 7.9452 | −5.69 | −5.85 | 6.24 | Marine |
| LA-3912 | Singa | 14.1708 | −8.17 | −8.38 | −4.19 | Marine |
| LA-4012 | Singa | 24.8003 | −21.89 | −22.4 | −1.41 | Terrestrial |
| LA-4112 | Singa | 22.6723 | −21.47 | −21.97 | −24.64 | Terrestrial |
| LA-4212 | Singa | 30.0938 | −18.19 | −18.62 | −5.15 | Terrestrial |
| LA-4312 | Singa | 29.3079 | −17.62 | −18.03 | 2.88 | Terrestrial |
| LA-4412 | Singa | 28.1086 | −6.72 | −6.9 | −2.34 | Marine |
| LA-5712 | Singa | 16.7783 | −9.2 | −9.44 | −13.86 | Marine |
| Element | Al2O3 | Org.C | S | V | Cr | Ni | Cu | Zn | As | Mo | Sn | Sb | U |
|---|---|---|---|---|---|---|---|---|---|---|---|---|---|
| Al2O3 | 1 | ||||||||||||
| Org.C | 0.44 | 1 | |||||||||||
| S | −0.074 | −0.15 | 1 | ||||||||||
| V | −0.11 | −0.62 | 0.25 | 1 | |||||||||
| Cr | 0.35 | −0.1 | 0.62 | 0.48 | 1 | ||||||||
| Ni | 0.65 | 0.1 | 0.12 | 0.22 | 0.75 | 1 | |||||||
| Cu | 0.62 | 0.28 | 0.4 | 0.18 | 0.29 | 0.24 | 1 | ||||||
| Zn | 0.89 | 0.34 | 0.11 | −0.17 | 0.49 | 0.75 | 0.45 | 1 | |||||
| As | 0.66 | −0.0082 | −0.071 | 0.38 | 0.23 | 0.24 | 0.69 | 0.42 | 1 | ||||
| Mo | −0.21 | −0.31 | 0.79 | −0.048 | 0.24 | −0.11 | 0.24 | 0.044 | −0.15 | 1 | |||
| Sn | 0.025 | 0.37 | −0.63 | −0.14 | −0.63 | −0.48 | 0.15 | −0.31 | 0.38 | −0.55 | 1 | ||
| Sb | 0.69 | 0.032 | −0.17 | 0.31 | 0.25 | 0.32 | 0.6 | 0.44 | 0.96 | −0.24 | 0.38 | 1 | |
| U | 0.12 | −0.13 | 0.55 | 0.23 | 0.83 | 0.61 | −0.076 | 0.48 | −0.11 | 0.36 | −0.76 | −0.1 | 1 |
| Element | V | Co | Ni | Cu | Zn | As | Se | Mo | Ag | Cd | Sb | Te | Au | Tl | Pb | Bi |
|---|---|---|---|---|---|---|---|---|---|---|---|---|---|---|---|---|
| Mn | ||||||||||||||||
| V | 1 | |||||||||||||||
| Co | 0.43 | 1 | ||||||||||||||
| Ni | −0.083 | 0.054 | 1 | |||||||||||||
| Cu | −0.0013 | 0.35 | −0.0013 | 1 | ||||||||||||
| Zn | −0.099 | 0.22 | 0.0098 | 0.56 | 1 | |||||||||||
| As | 0.45 | 0.52 | −0.087 | 0.12 | 0.041 | 1 | ||||||||||
| Se | −0.042 | 0.49 | −0.0058 | 0.98 | 0.99 | 0.43 | 1 | |||||||||
| Mo | 0.0044 | 0.35 | −0.058 | 0.051 | 0.045 | −0.027 | 0.04 | 1 | ||||||||
| Ag | 0.36 | 0.87 | 0.12 | 0.44 | 0.29 | 0.43 | 0.54 | 0.45 | 1 | |||||||
| Cd | −0.077 | 0.29 | 0.11 | 0.51 | 0.94 | 0.082 | 0.95 | 0.062 | 0.32 | 1 | ||||||
| Sb | 0.35 | 0.57 | 0.35 | 0.12 | −0.0013 | 0.64 | 0.078 | 0.1 | 0.49 | 0.089 | 1 | |||||
| Te | 0.4 | 0.72 | −0.018 | 0.2 | 0.11 | 0.78 | 0.35 | 0.16 | 0.65 | 0.18 | 0.77 | 1 | ||||
| Au | 0.56 | 0.75 | −0.019 | 0.076 | 0.012 | 0.35 | 0.13 | 0.44 | 0.82 | 0.023 | 0.43 | 0.49 | 1 | |||
| Tl | 0.26 | 0.57 | 0.22 | 0.32 | 0.029 | 0.63 | 0.08 | 0.13 | 0.55 | 0.1 | 0.81 | 0.78 | 0.4 | 1 | ||
| Pb | −0.071 | 0.031 | 0.87 | 0.013 | −0.072 | −0.12 | −0.049 | 0.042 | 0.091 | 0.043 | 0.24 | −0.062 | −0.037 | 0.17 | 1 | |
| Bi | 0.46 | 0.7 | −0.035 | 0.19 | 0.11 | 0.8 | 0.35 | 0.15 | 0.66 | 0.17 | 0.75 | 0.95 | 0.55 | 0.78 | −0.047 | 1 |
| Element | V | Co | Ni | Cu | Zn | As | Se | Mo | Ag | Cd | Sb | Te | Au | Tl | Pb | Bi |
|---|---|---|---|---|---|---|---|---|---|---|---|---|---|---|---|---|
| Mn | ||||||||||||||||
| V | 1 | |||||||||||||||
| Co | 0.12 | 1 | ||||||||||||||
| Ni | 0.12 | 0.74 | 1 | |||||||||||||
| Cu | 0.082 | 0.63 | 0.36 | 1 | ||||||||||||
| Zn | −0.28 | 0.2 | −0.13 | 0.31 | 1 | |||||||||||
| As | −0.087 | 0.35 | −0.11 | 0.64 | 0.59 | 1 | ||||||||||
| Se | −0.46 | 0.31 | 0.21 | 0.35 | 0.53 | 0.67 | 1 | |||||||||
| Mo | −0.11 | 0.36 | 0.62 | 0.21 | 0.029 | −0.057 | 0.11 | 1 | ||||||||
| Ag | 0.16 | 0.61 | 0.82 | 0.57 | −0.047 | −0.0046 | 0.16 | 0.67 | 1 | |||||||
| Cd | −0.28 | −0.024 | −0.46 | 0.16 | 0.41 | 0.41 | 0.4 | −0.15 | −0.17 | 1 | ||||||
| Sb | −0.14 | 0.3 | 0.25 | 0.49 | −0.036 | 0.29 | 0.34 | 0.16 | 0.38 | 0.19 | 1 | |||||
| Te | 0.13 | 0.66 | 0.44 | 0.71 | 0.2 | 0.64 | 0.69 | 0.39 | 0.58 | 0.2 | 0.34 | 1 | ||||
| Au | 0.08 | 0.5 | 0.013 | 0.66 | 0.24 | 0.69 | 0.44 | 0.12 | 0.24 | 0.6 | 0.35 | 0.78 | 1 | |||
| Tl | 0.21 | 0.23 | 0.36 | 0.14 | −0.31 | −0.33 | −0.3 | 0.076 | 0.32 | −0.23 | 0.46 | −0.078 | −0.11 | 1 | ||
| Pb | −0.15 | 0.23 | 0.36 | 0.41 | 0.27 | 0.26 | 0.47 | 0.45 | 0.55 | 0.011 | 0.61 | 0.32 | 0.12 | 0.016 | 1 | |
| Bi | 0.19 | 0.67 | 0.59 | 0.71 | 0.13 | 0.47 | 0.4 | 0.57 | 0.79 | 0.088 | 0.41 | 0.9 | 0.68 | 0.0083 | 0.51 | 1 |
Publisher’s Note: MDPI stays neutral with regard to jurisdictional claims in published maps and institutional affiliations. |
© 2021 by the authors. Licensee MDPI, Basel, Switzerland. This article is an open access article distributed under the terms and conditions of the Creative Commons Attribution (CC BY) license (https://creativecommons.org/licenses/by/4.0/).
Share and Cite
Makoundi, C.; Endut, Z.; Large, R.R.; Zaw, K.; Lounejeva, E.; Leman, M.S.; Mohamed, K.R.; Basori, M.B.I. Geochemistry of Pyritic Mudstones from the Singa Formation, Malaysia: Insights into Gold Potential, Source of Sulfur and Organic Matter. Geosciences 2021, 11, 279. https://doi.org/10.3390/geosciences11070279
Makoundi C, Endut Z, Large RR, Zaw K, Lounejeva E, Leman MS, Mohamed KR, Basori MBI. Geochemistry of Pyritic Mudstones from the Singa Formation, Malaysia: Insights into Gold Potential, Source of Sulfur and Organic Matter. Geosciences. 2021; 11(7):279. https://doi.org/10.3390/geosciences11070279
Chicago/Turabian StyleMakoundi, Charles, Zakaria Endut, Ross R. Large, Khin Zaw, Elena Lounejeva, Mohd Shafeea Leman, Kamal Roslan Mohamed, and Mohd Basril Iswadi Basori. 2021. "Geochemistry of Pyritic Mudstones from the Singa Formation, Malaysia: Insights into Gold Potential, Source of Sulfur and Organic Matter" Geosciences 11, no. 7: 279. https://doi.org/10.3390/geosciences11070279
APA StyleMakoundi, C., Endut, Z., Large, R. R., Zaw, K., Lounejeva, E., Leman, M. S., Mohamed, K. R., & Basori, M. B. I. (2021). Geochemistry of Pyritic Mudstones from the Singa Formation, Malaysia: Insights into Gold Potential, Source of Sulfur and Organic Matter. Geosciences, 11(7), 279. https://doi.org/10.3390/geosciences11070279