
Hydrochemistry and Evolution of Water Quality in a Context of Aridity and Increasing Agriculture in Three River Sub-Basins of Santiago Island (Cape Verde)


Abstract
:1. Introduction
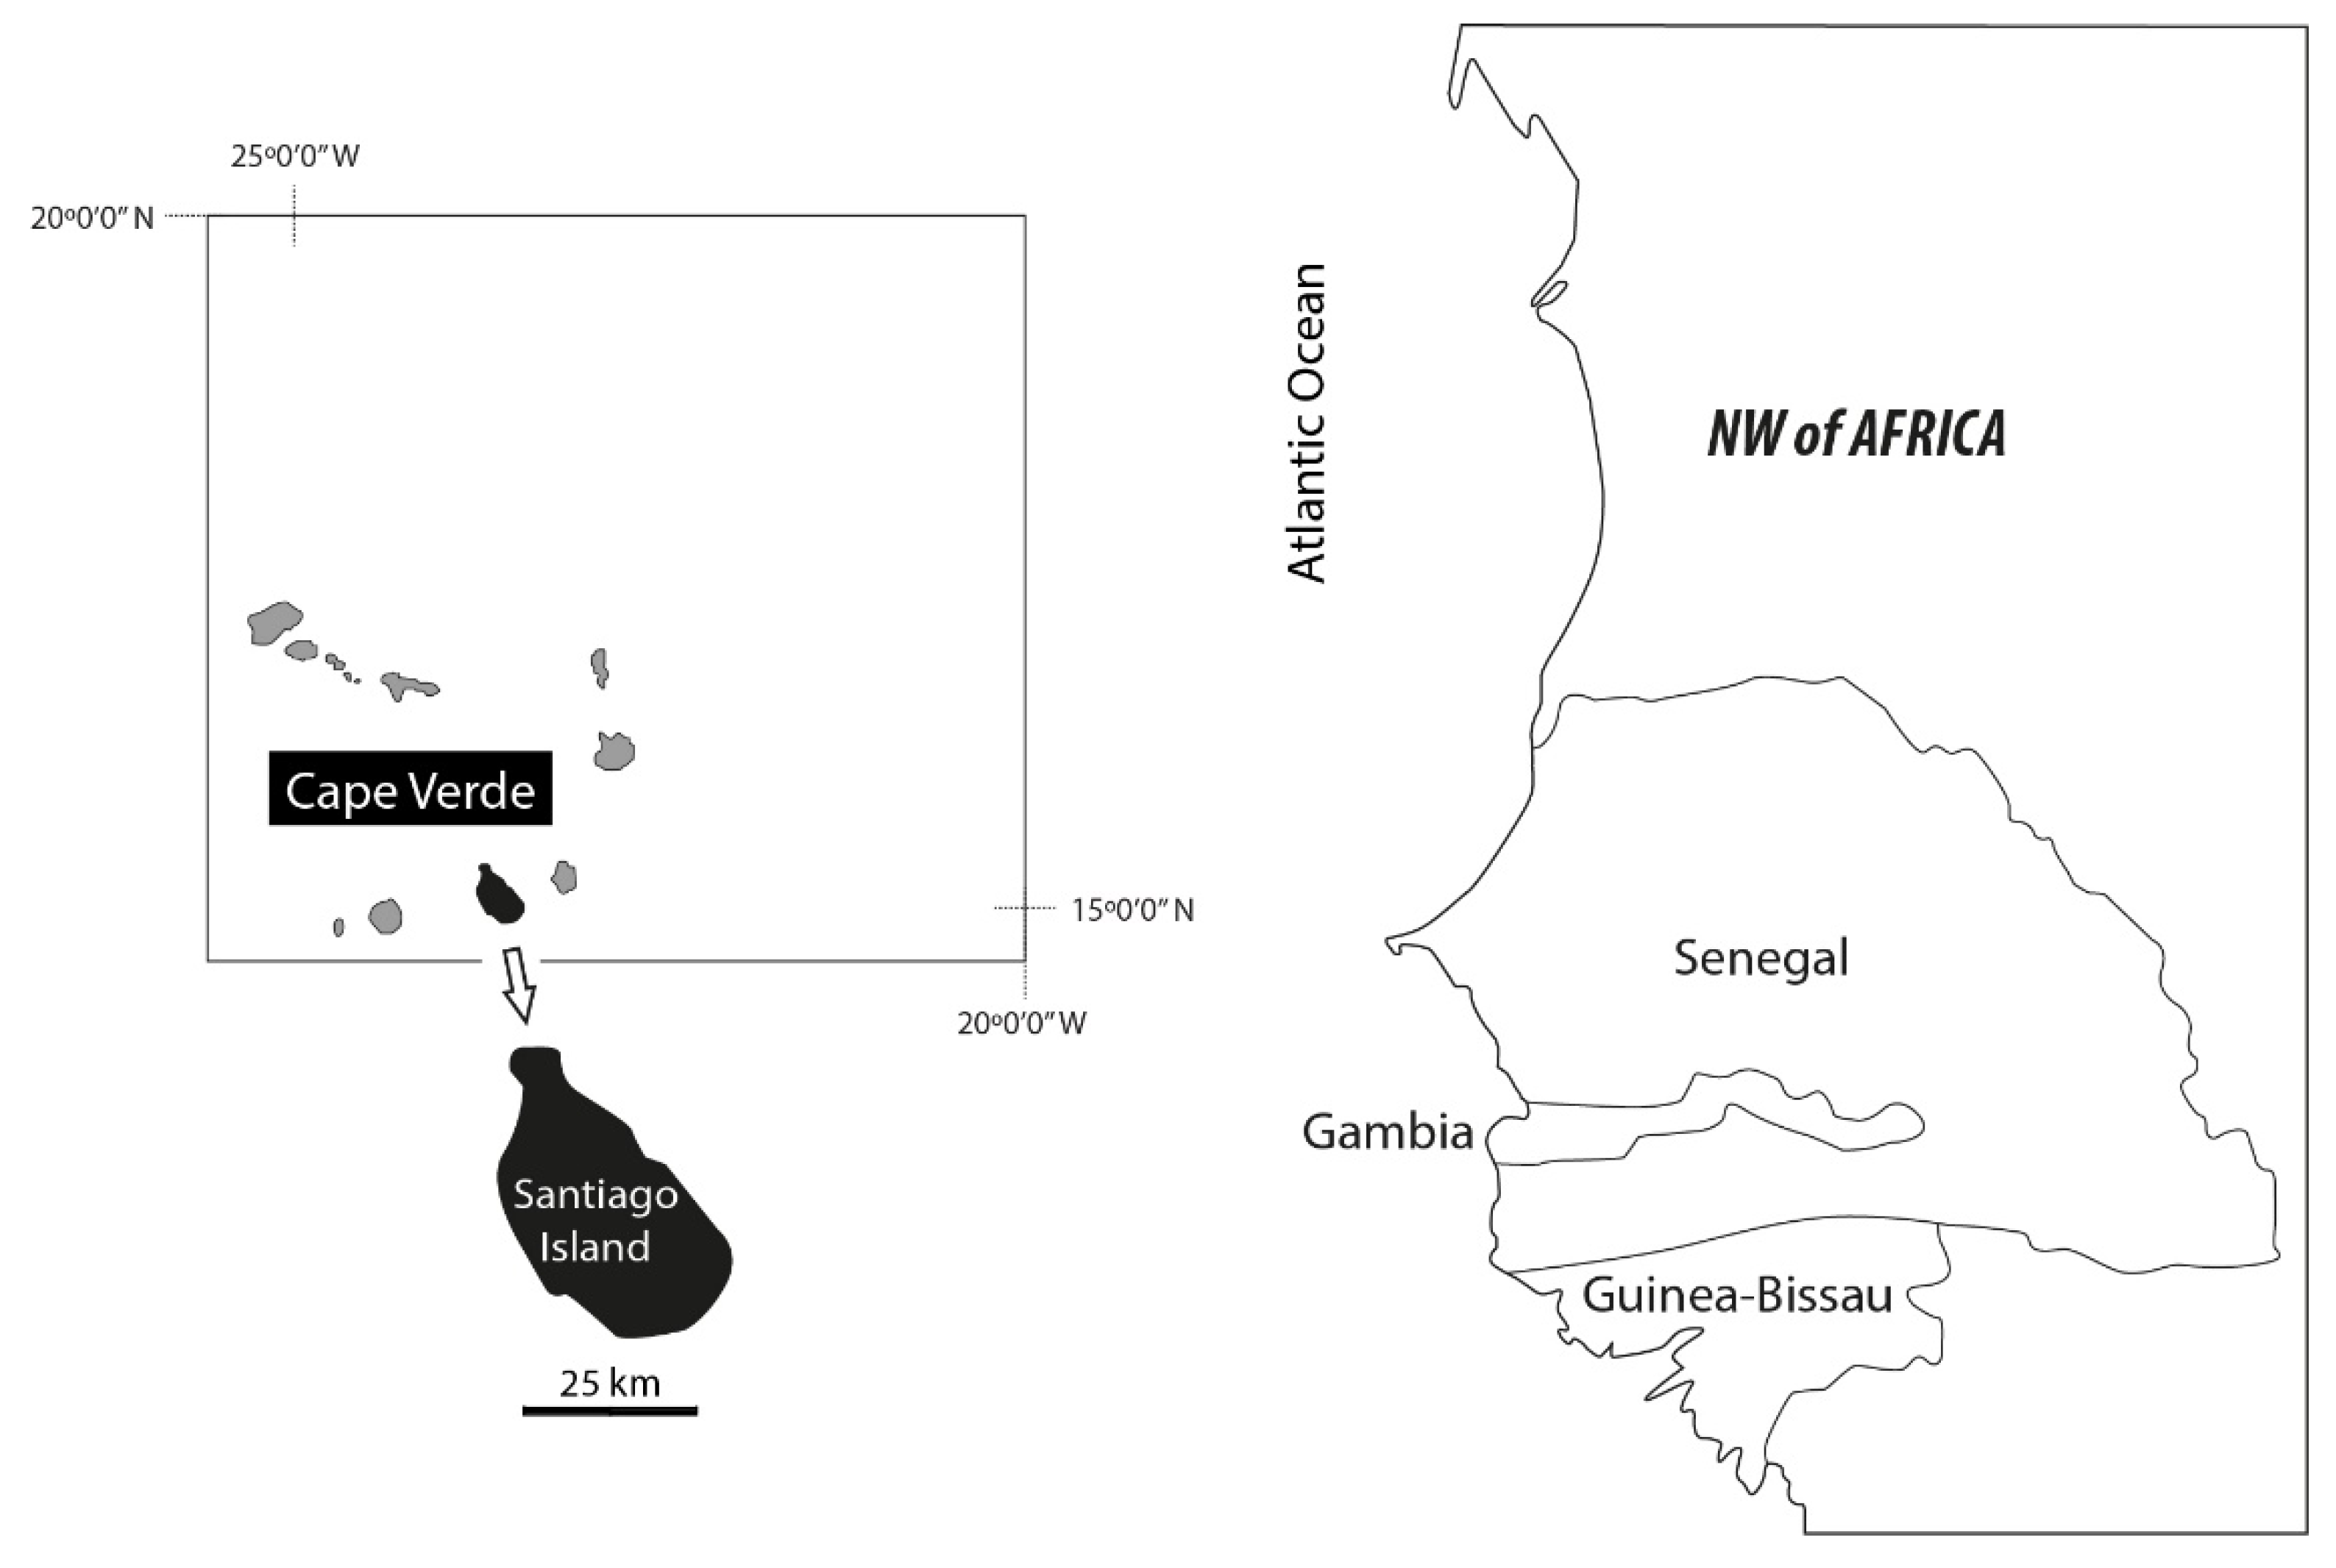
2. General Characterization of Santiago Island
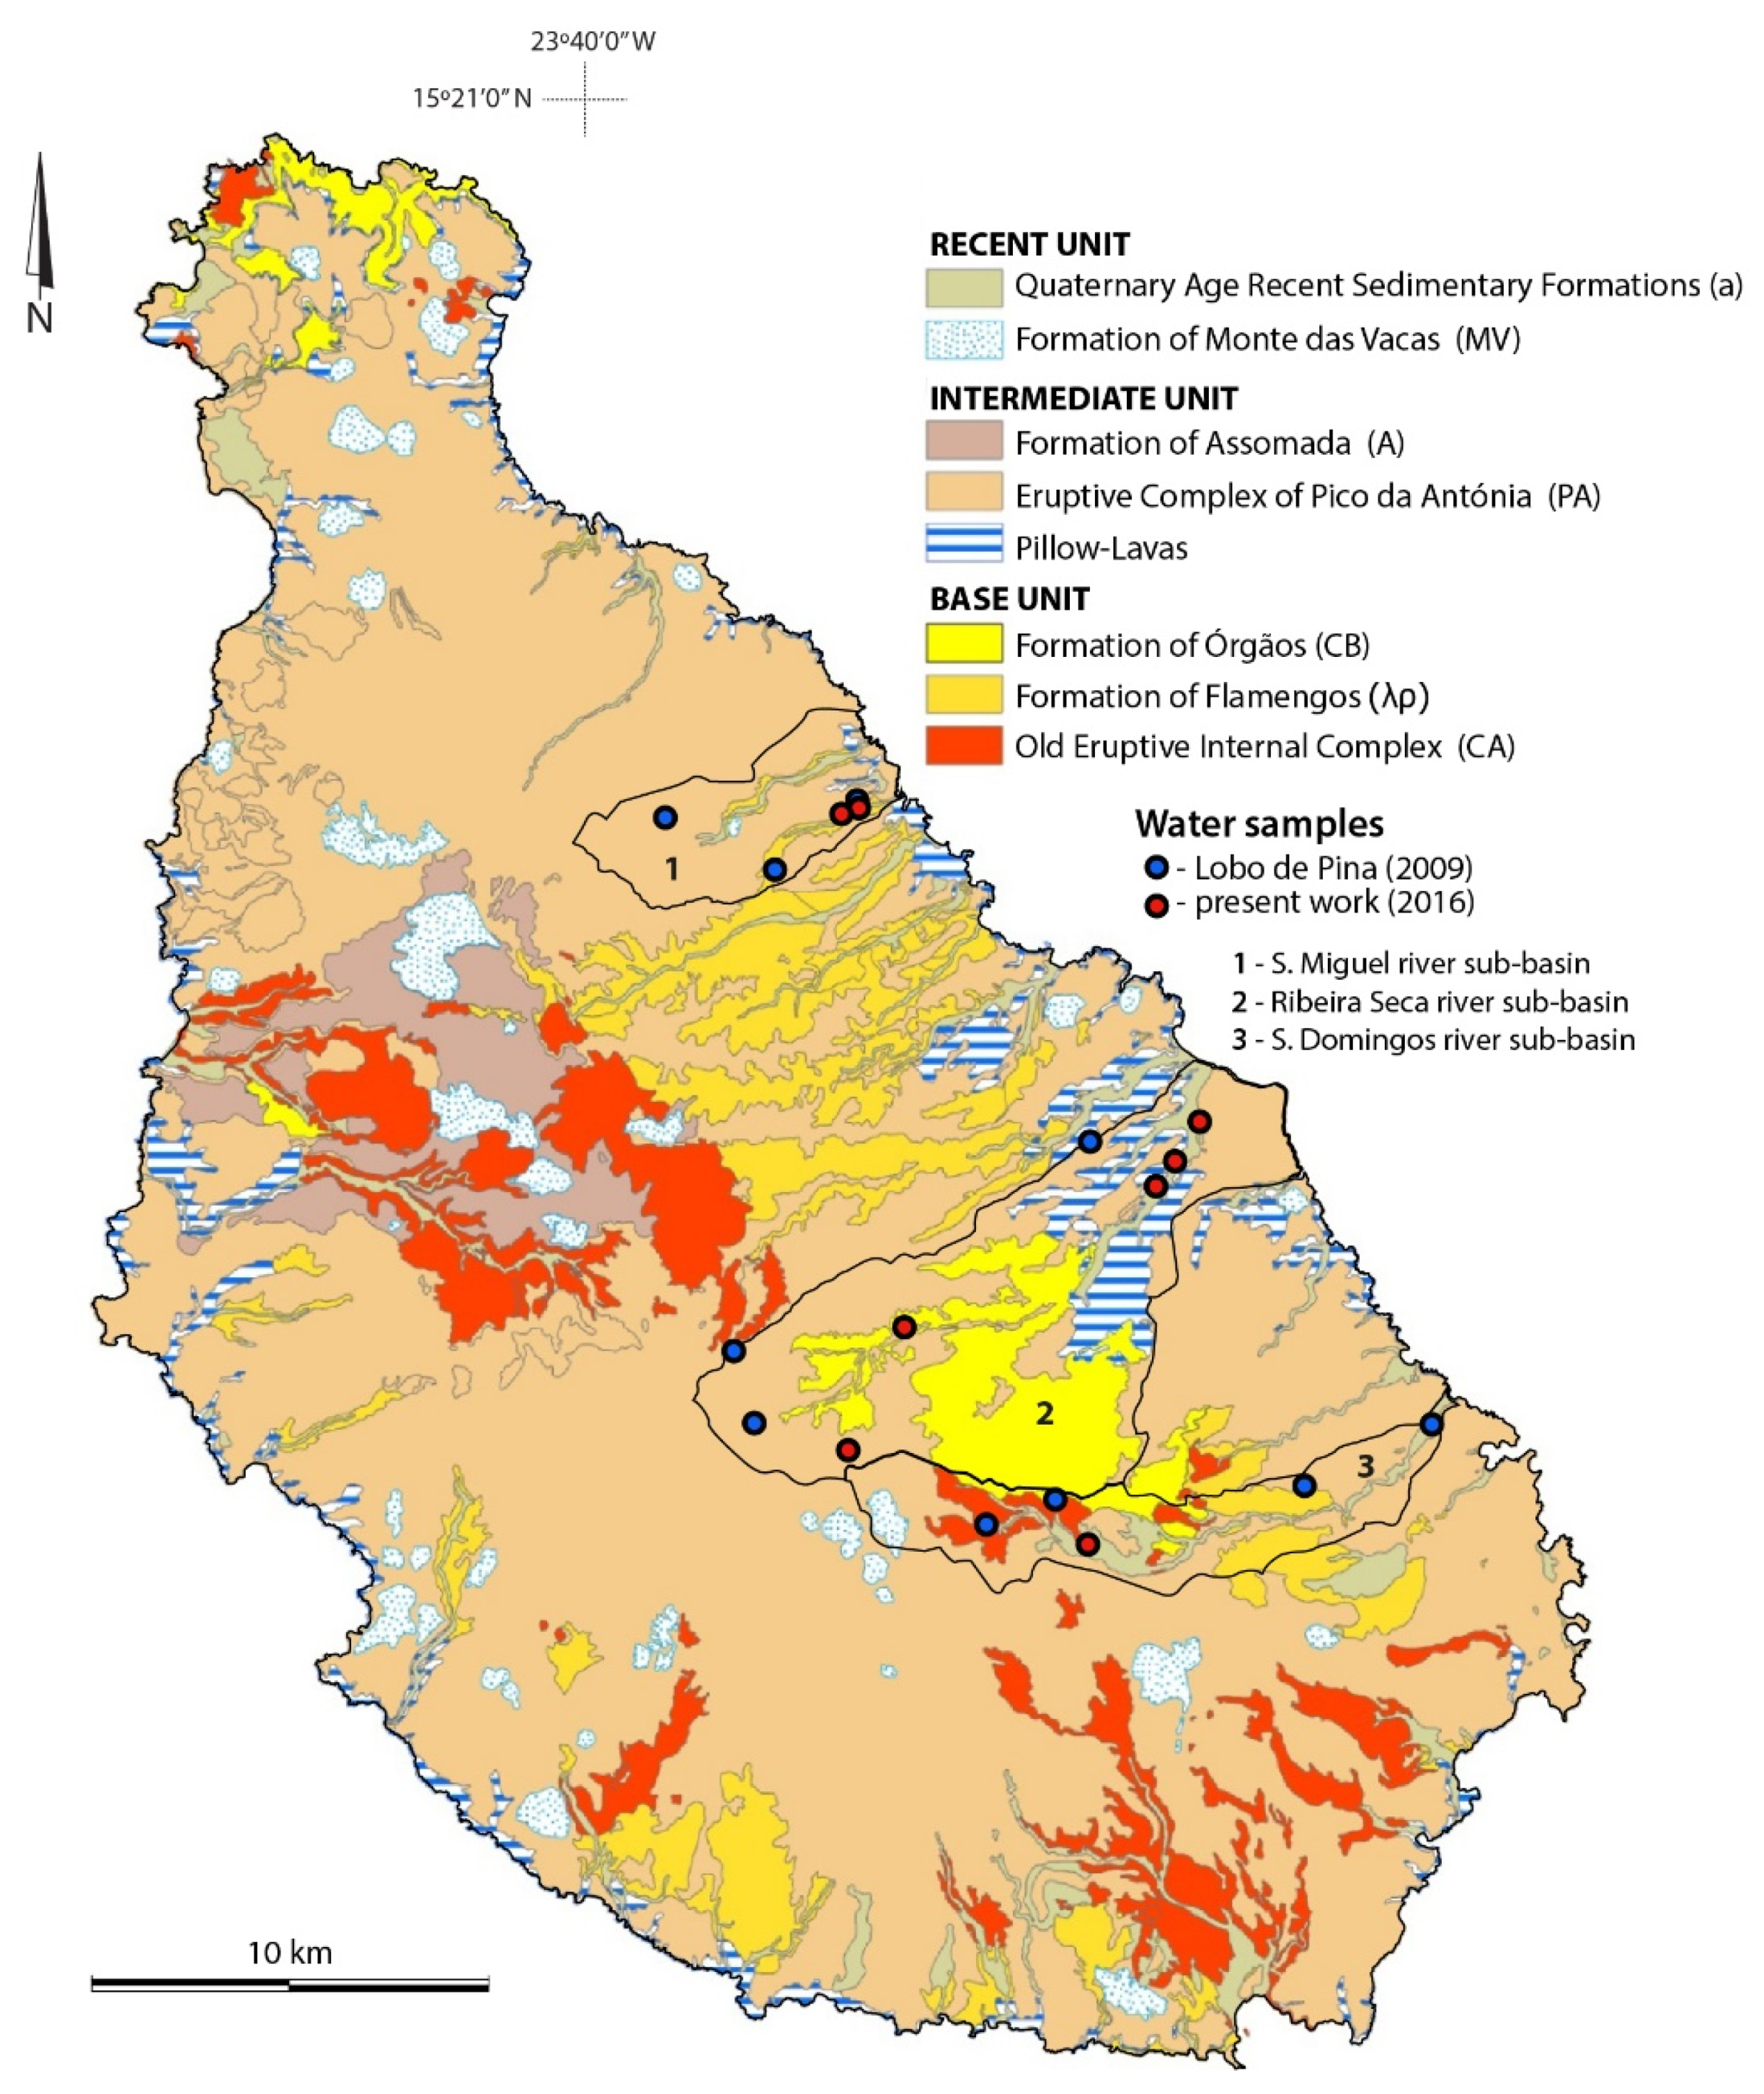
2.1. Geomorphology and Geology
2.2. Climate
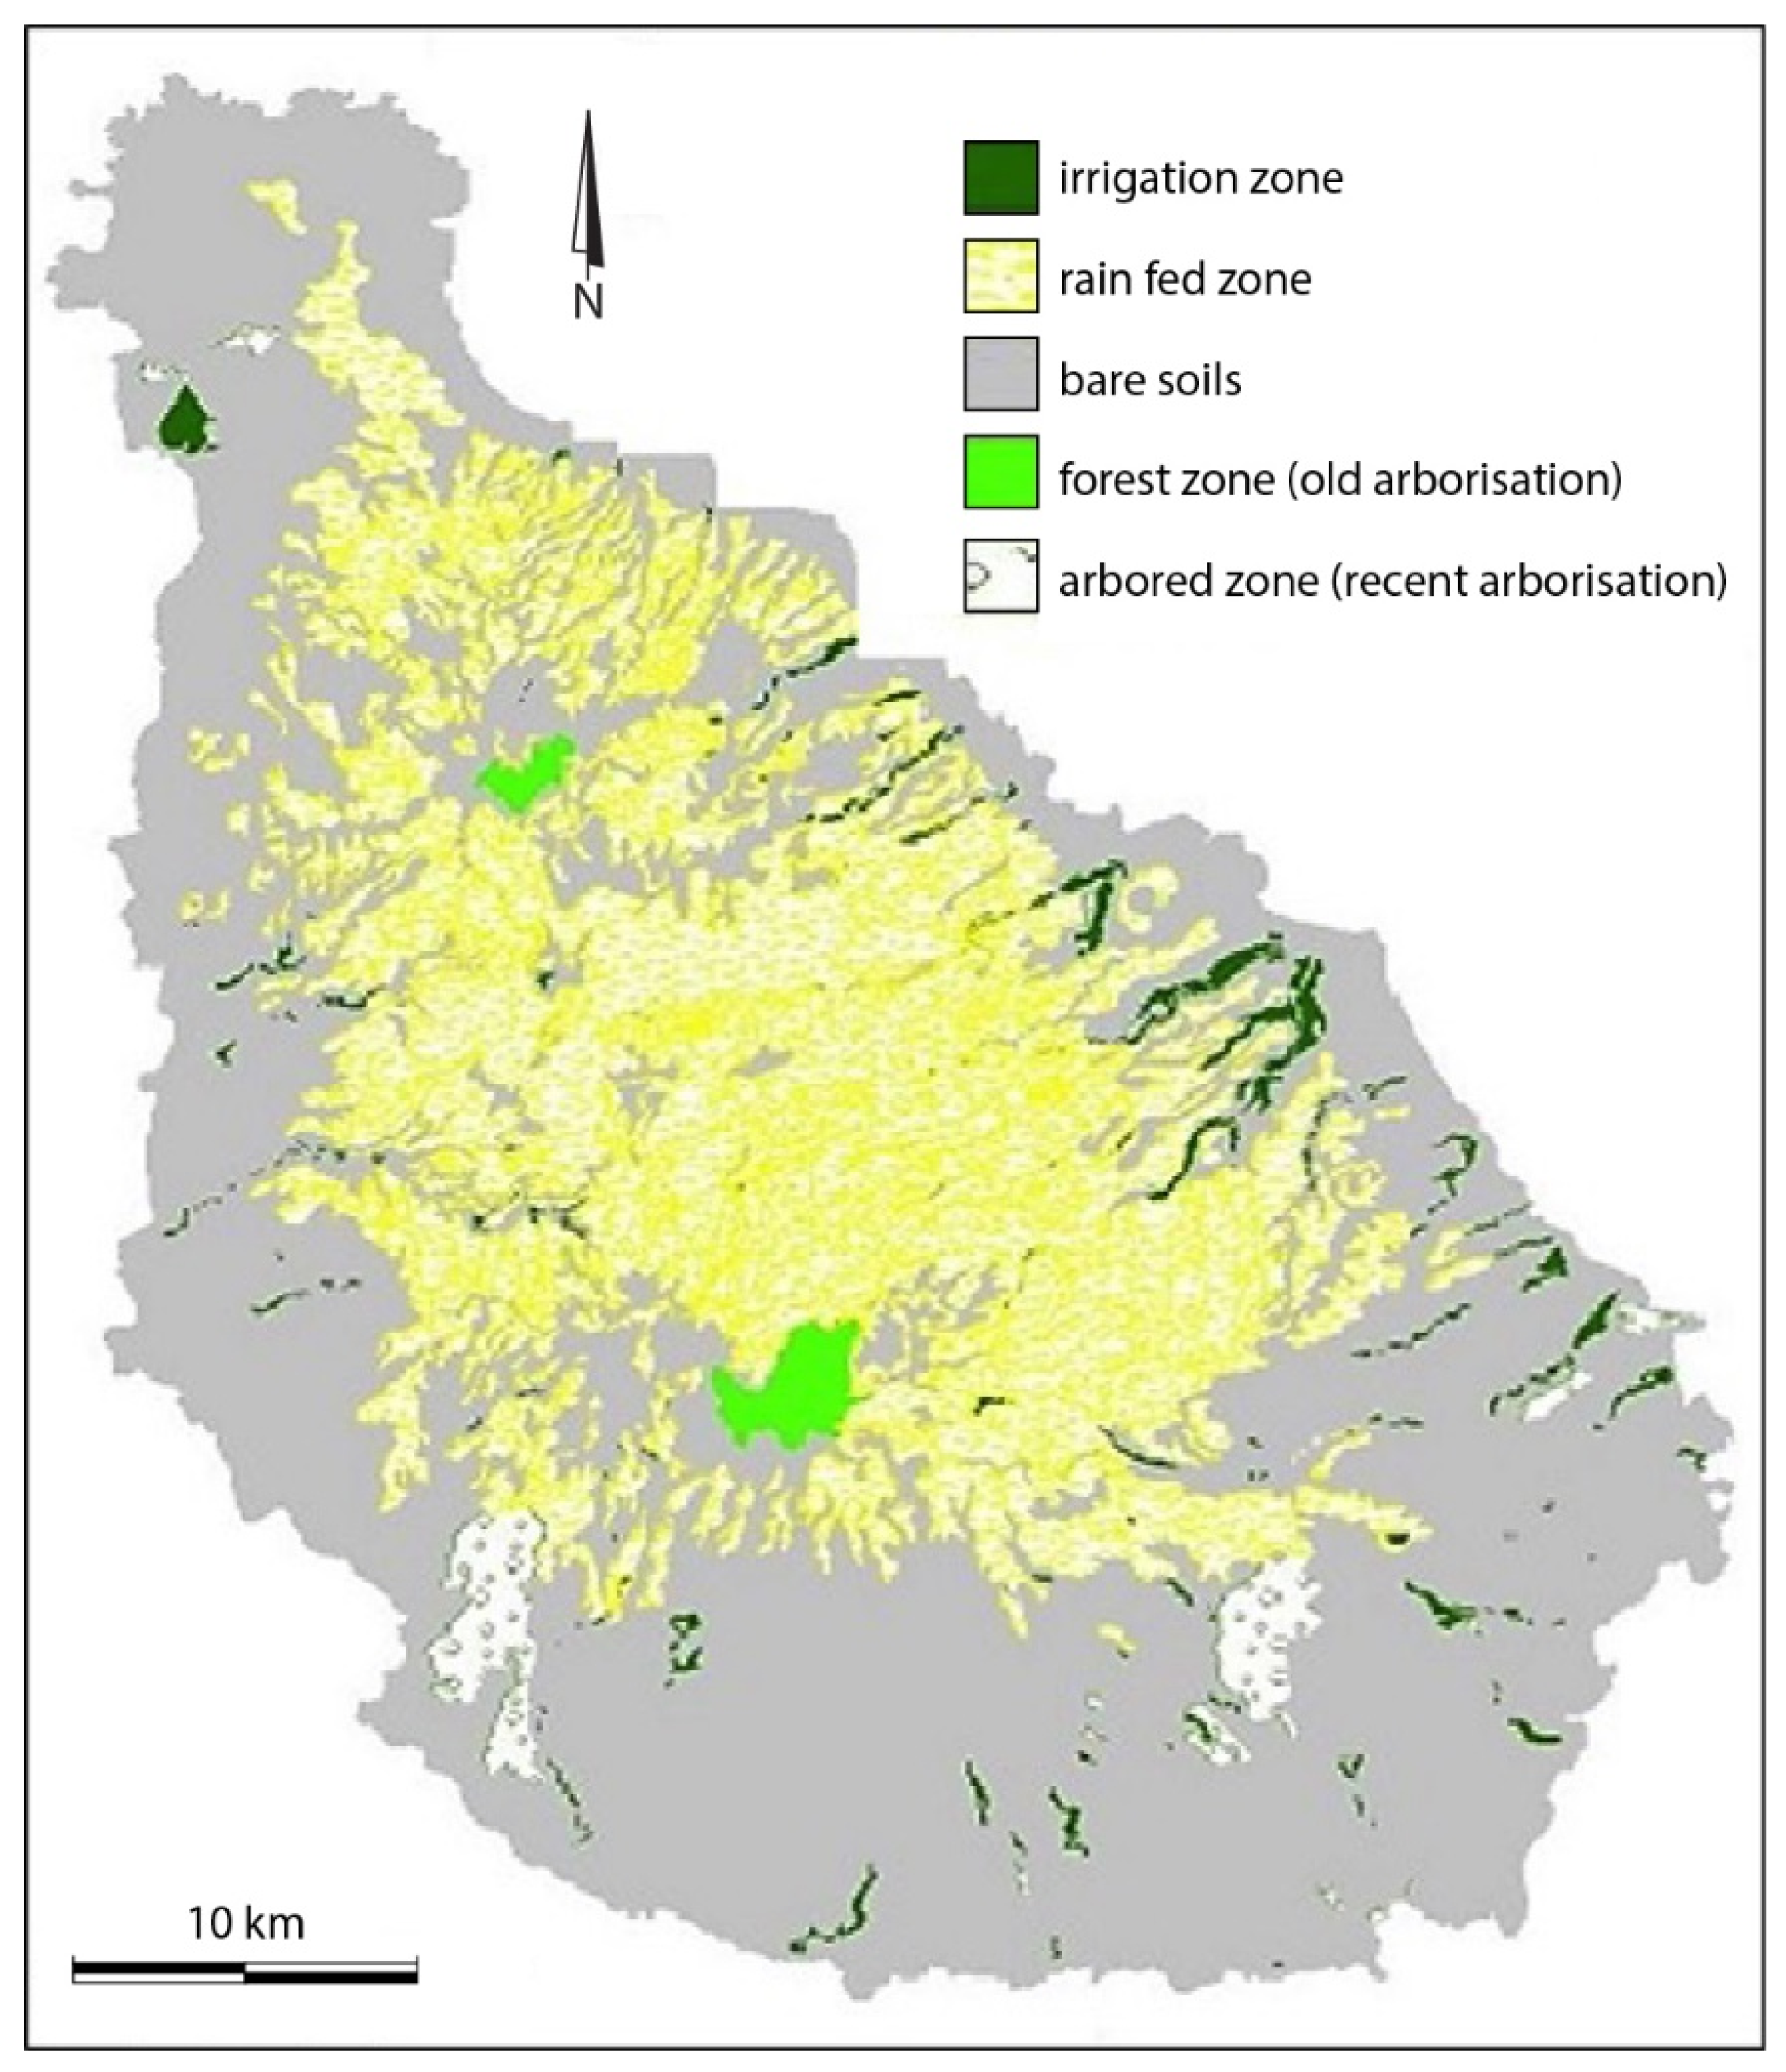
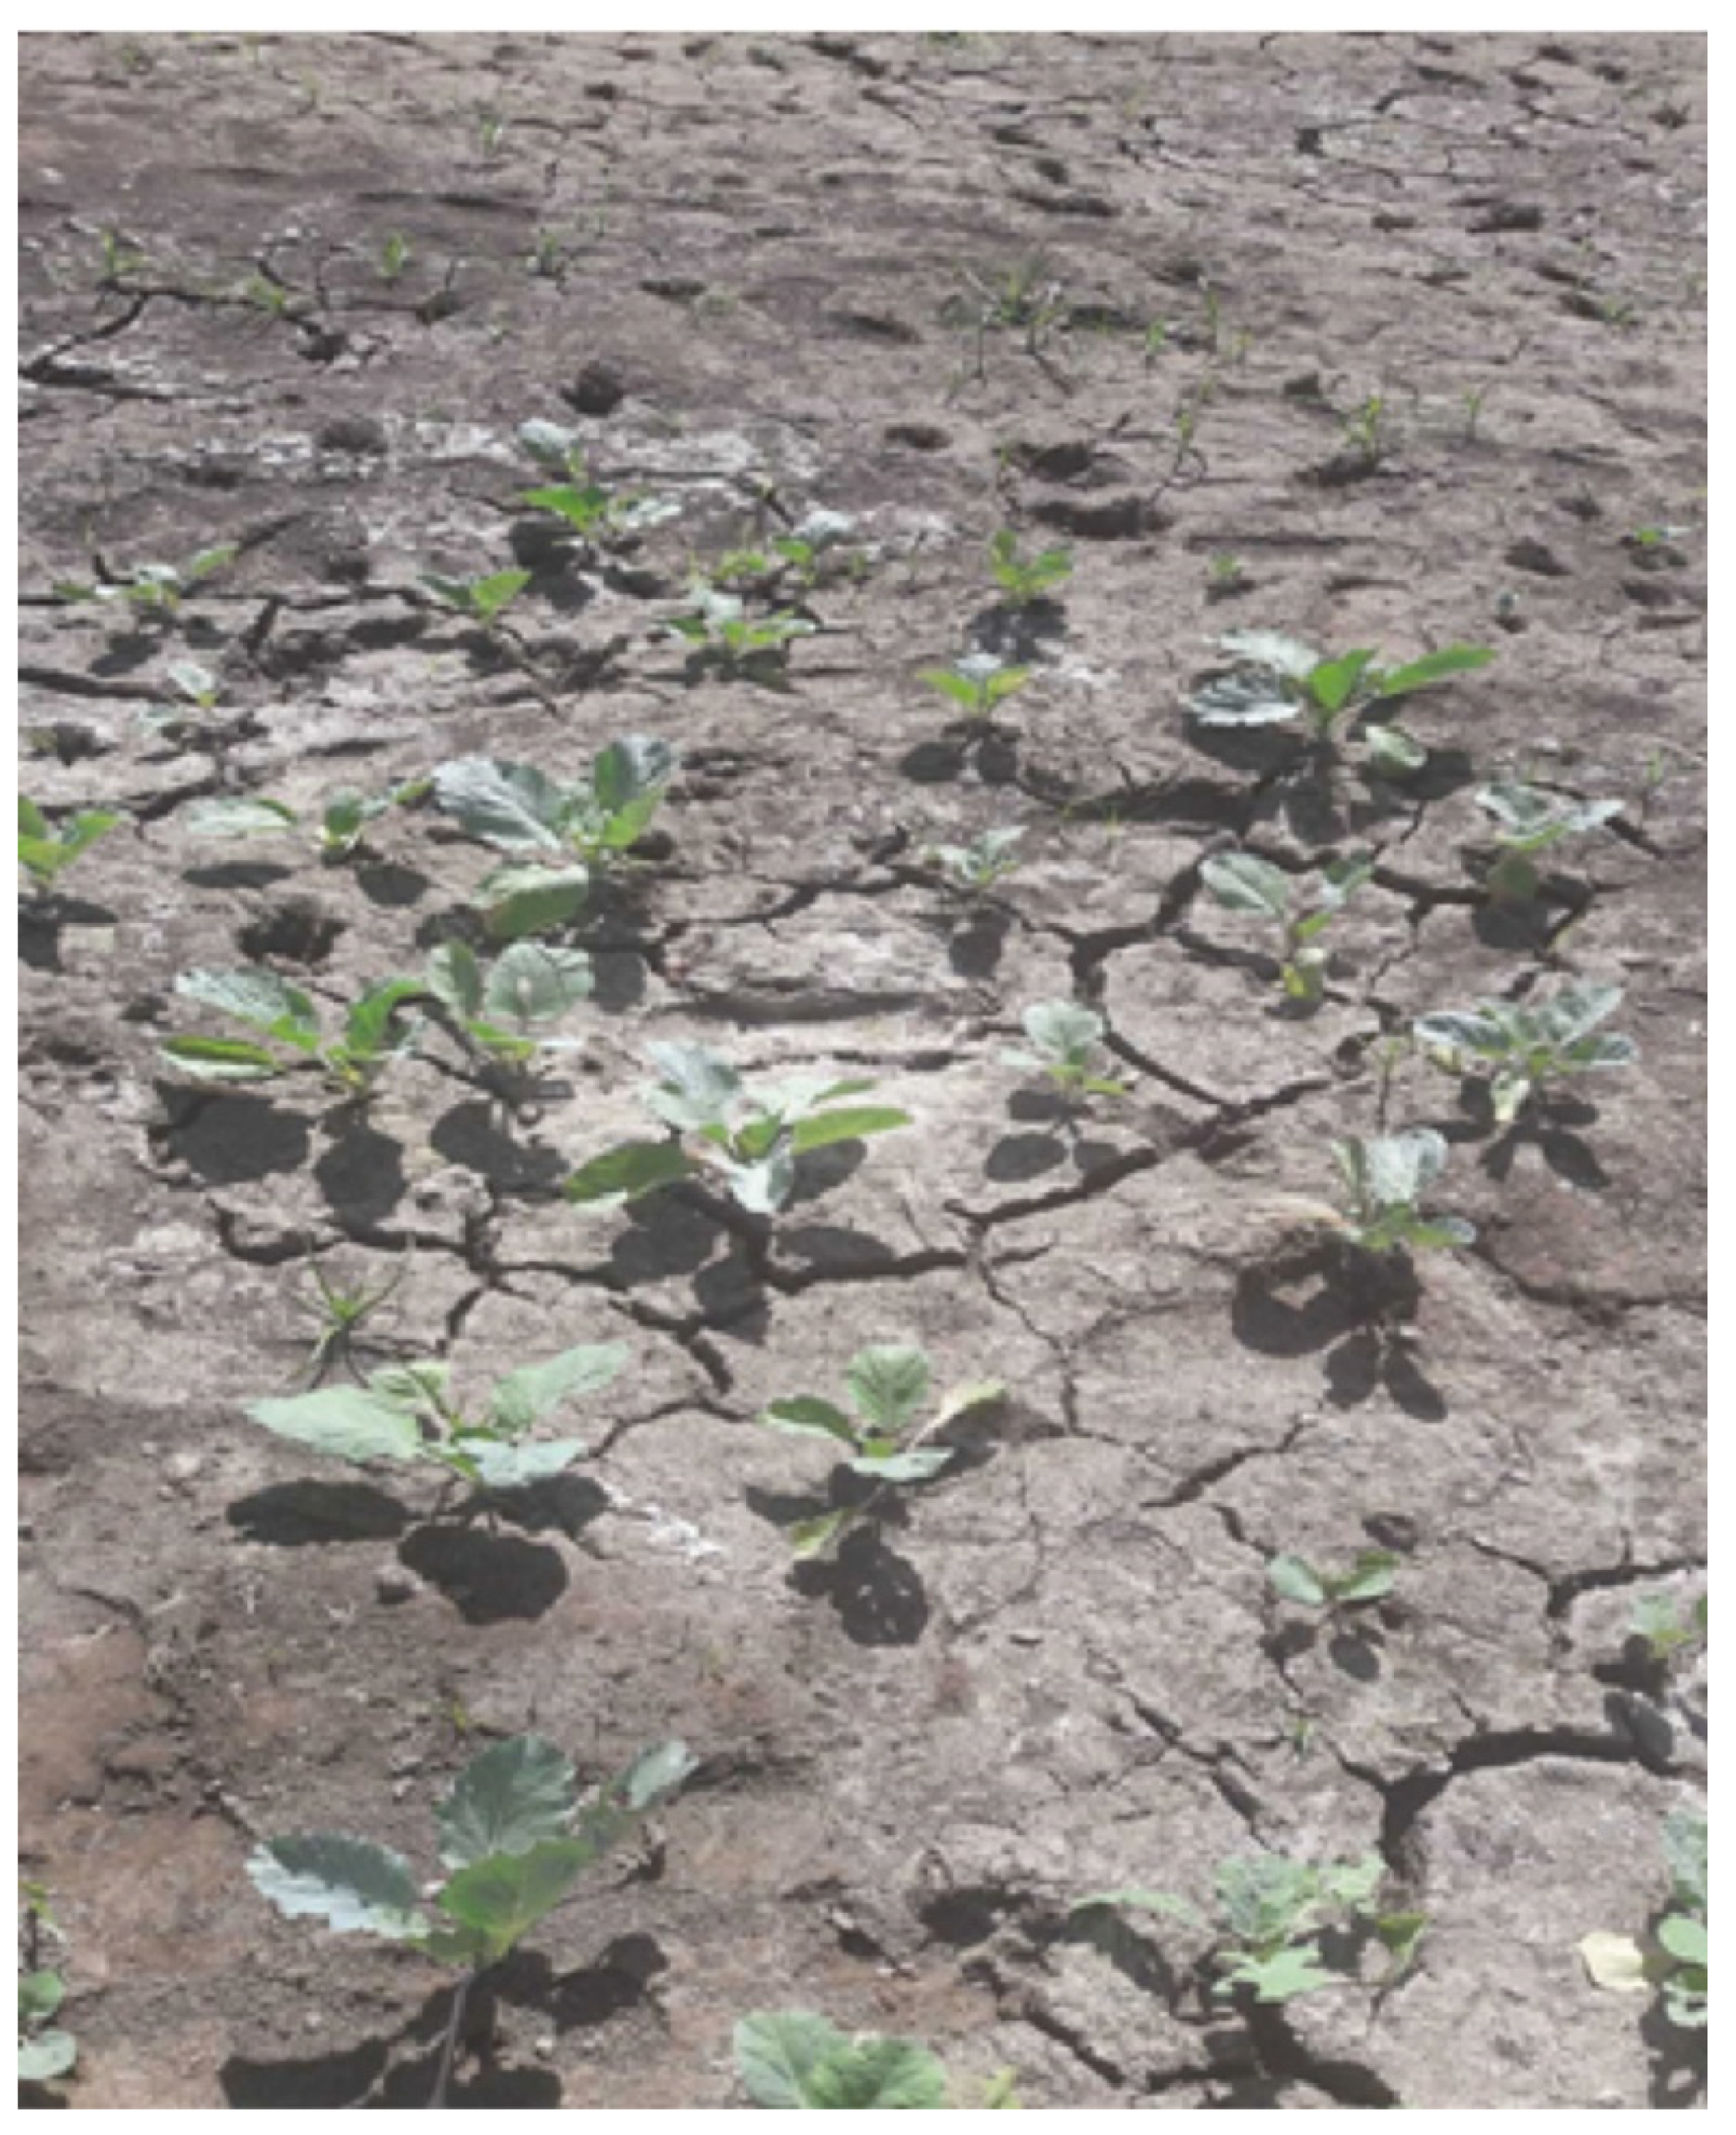
2.3. Land Use
- Irrigation zone—low erosion rate;
- Rain-fed zone—rain-fed agricultural activities (essentially maize and beans);
- Bare soils;
- Forest zone (old trees)—low erosion rate except in cases of steep slopes. The vegetal cover generates organic matter and, also, a root mechanical action, which gives structure and cohesion to the soil;
- Arbored zone (recent arborization).
3. River Basins
3.1. General Description of the River Sub-Basins
3.2. Hydrochemistry and Water Quality
3.2.1. Methodological Approach
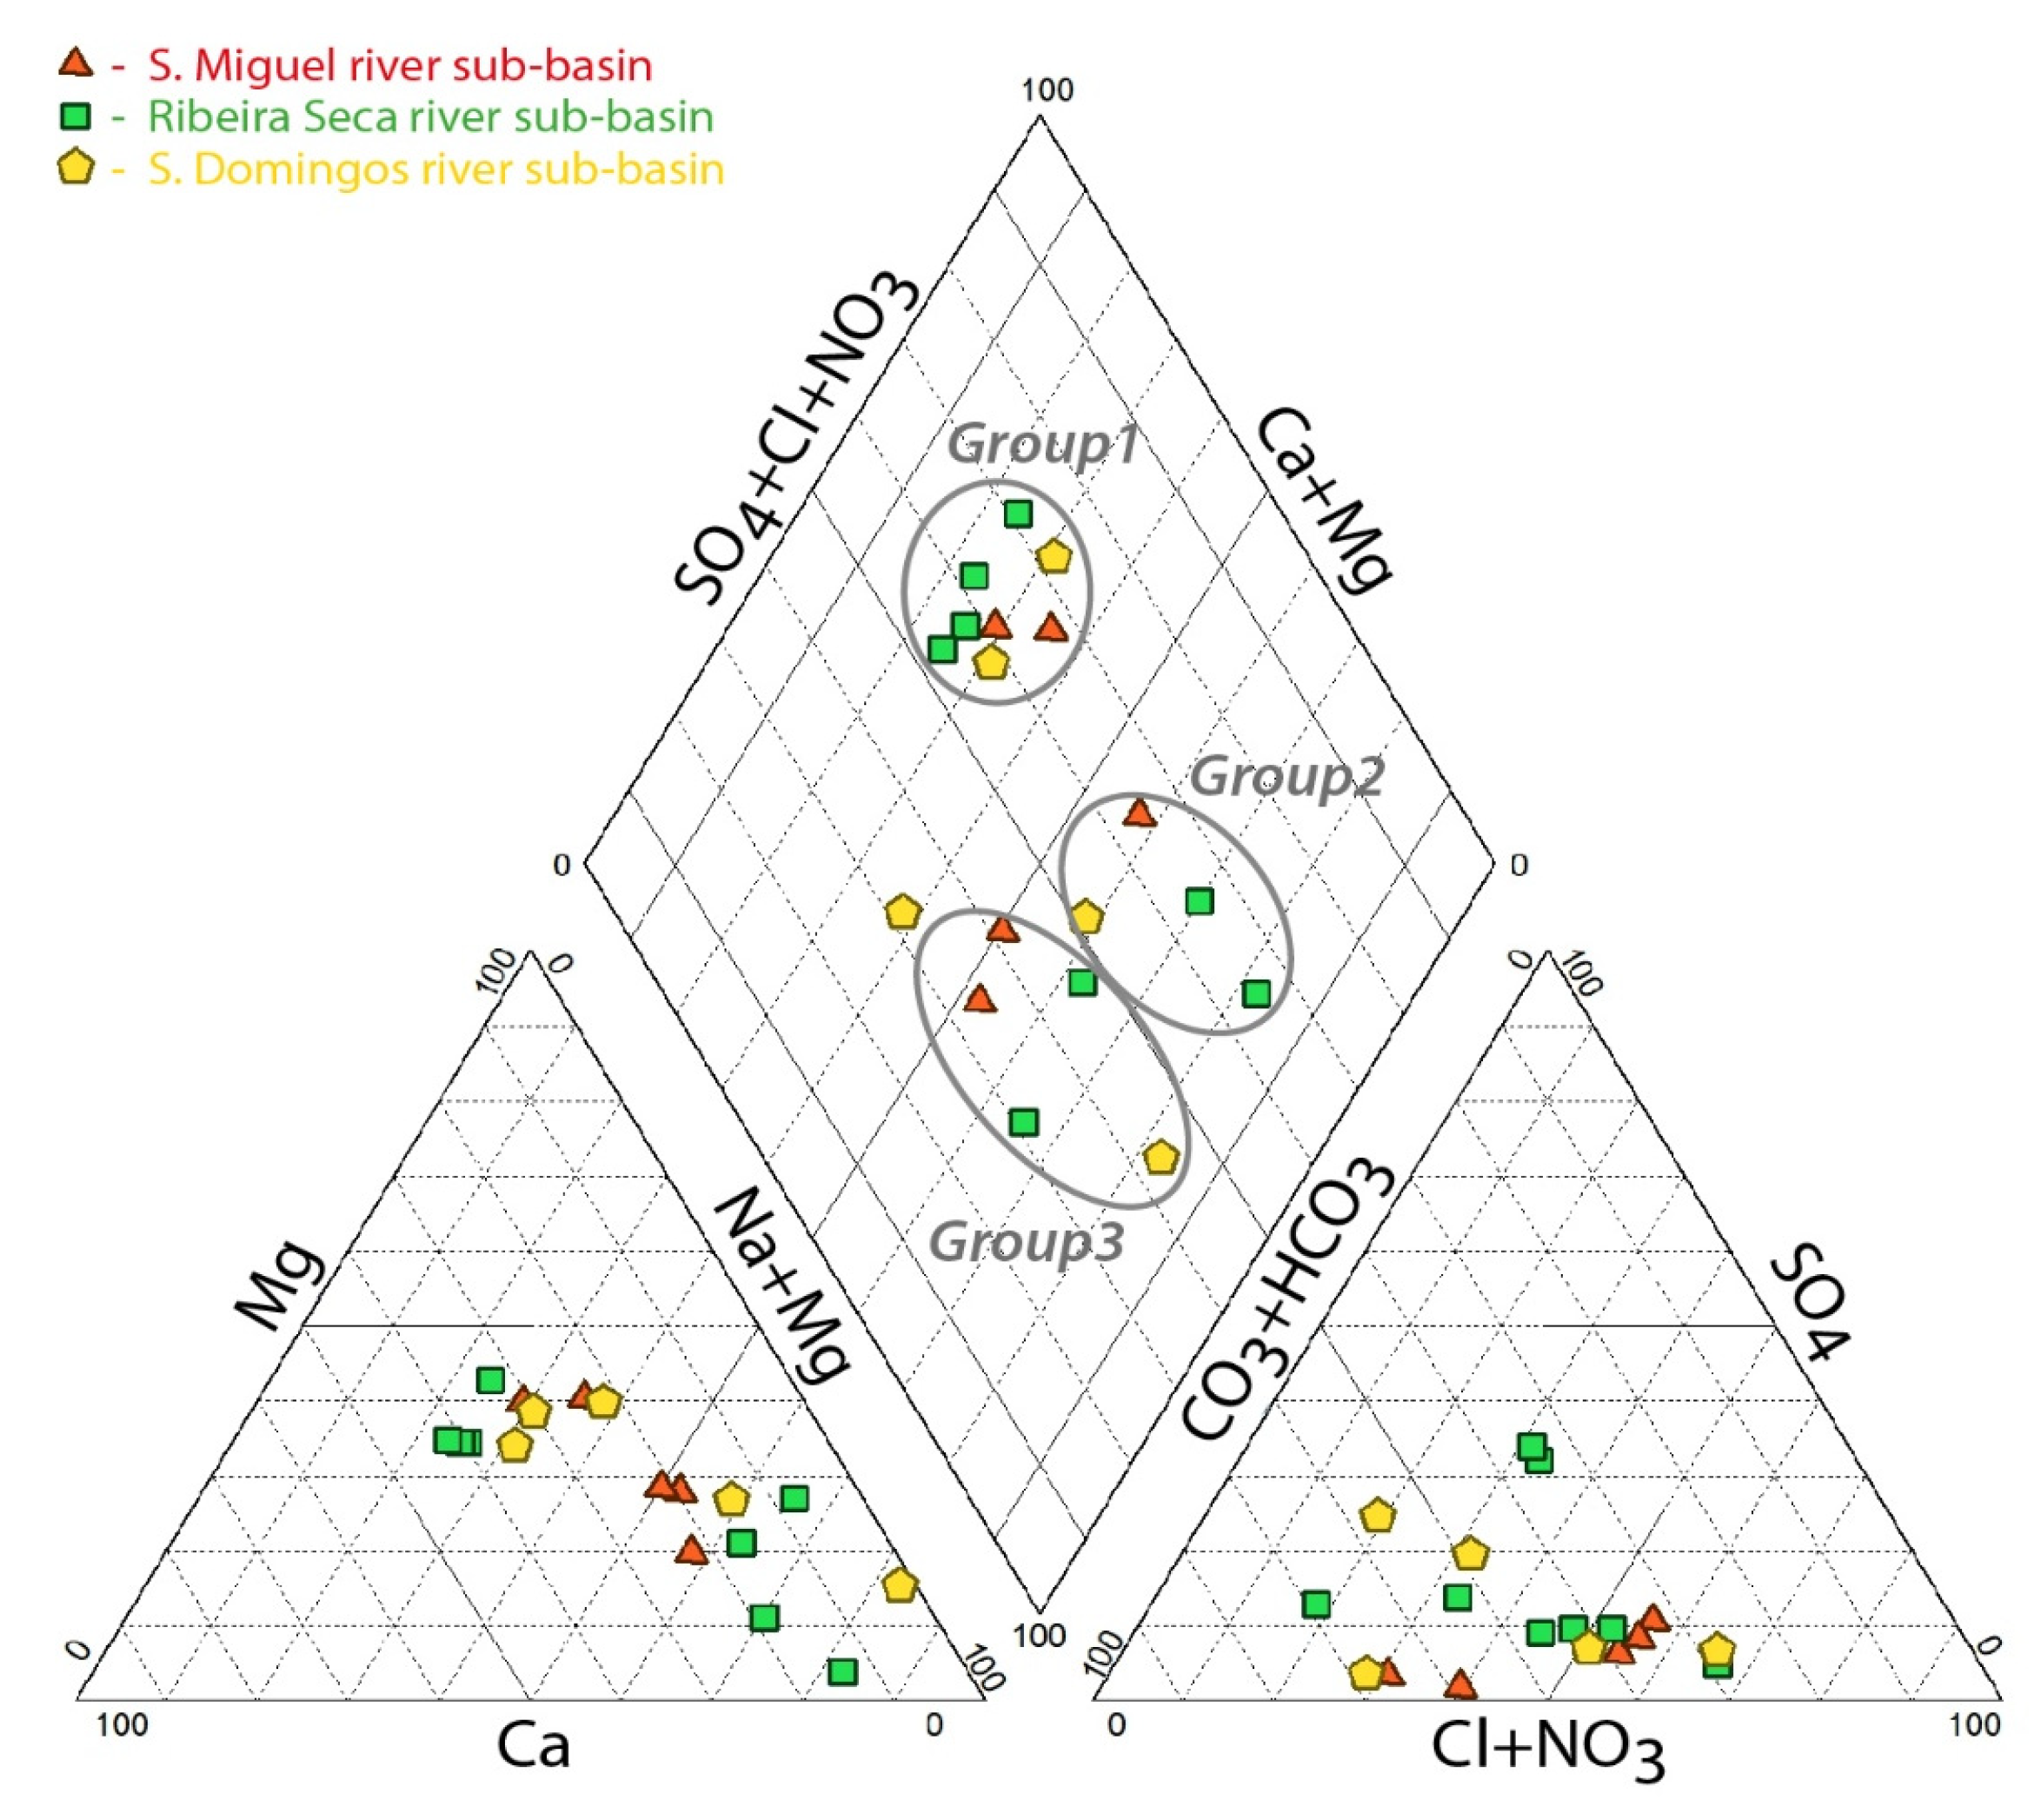
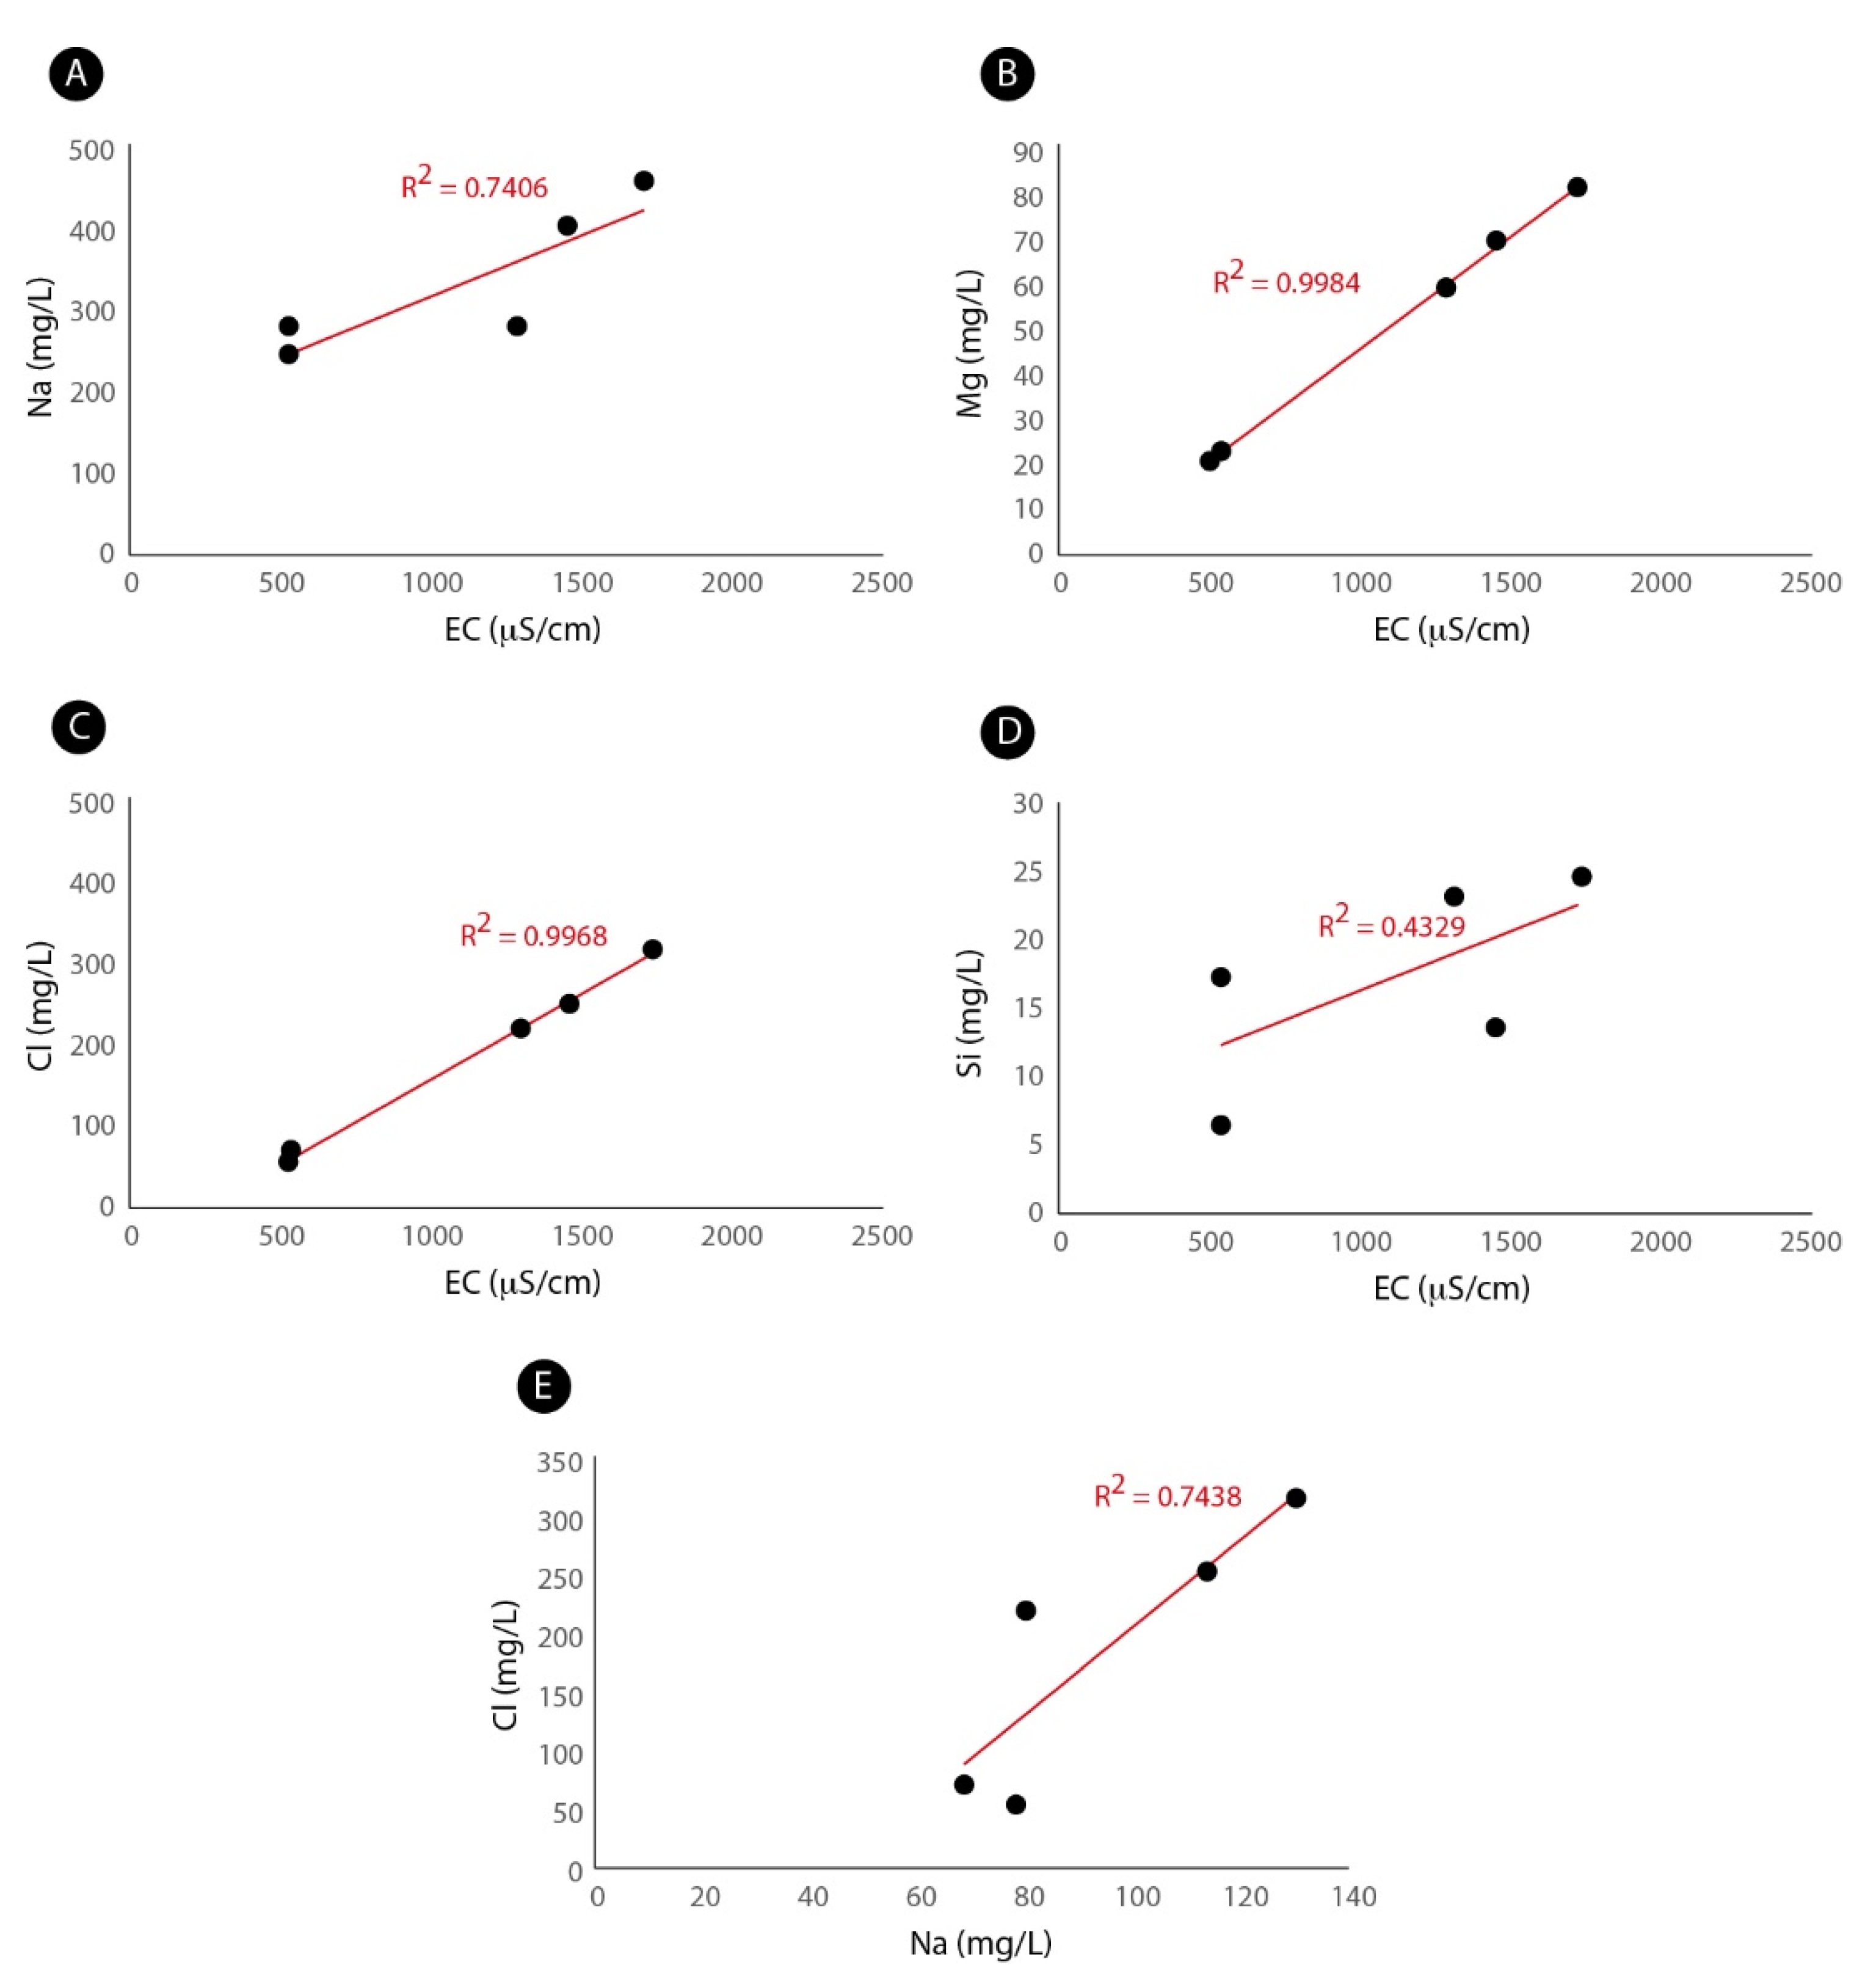
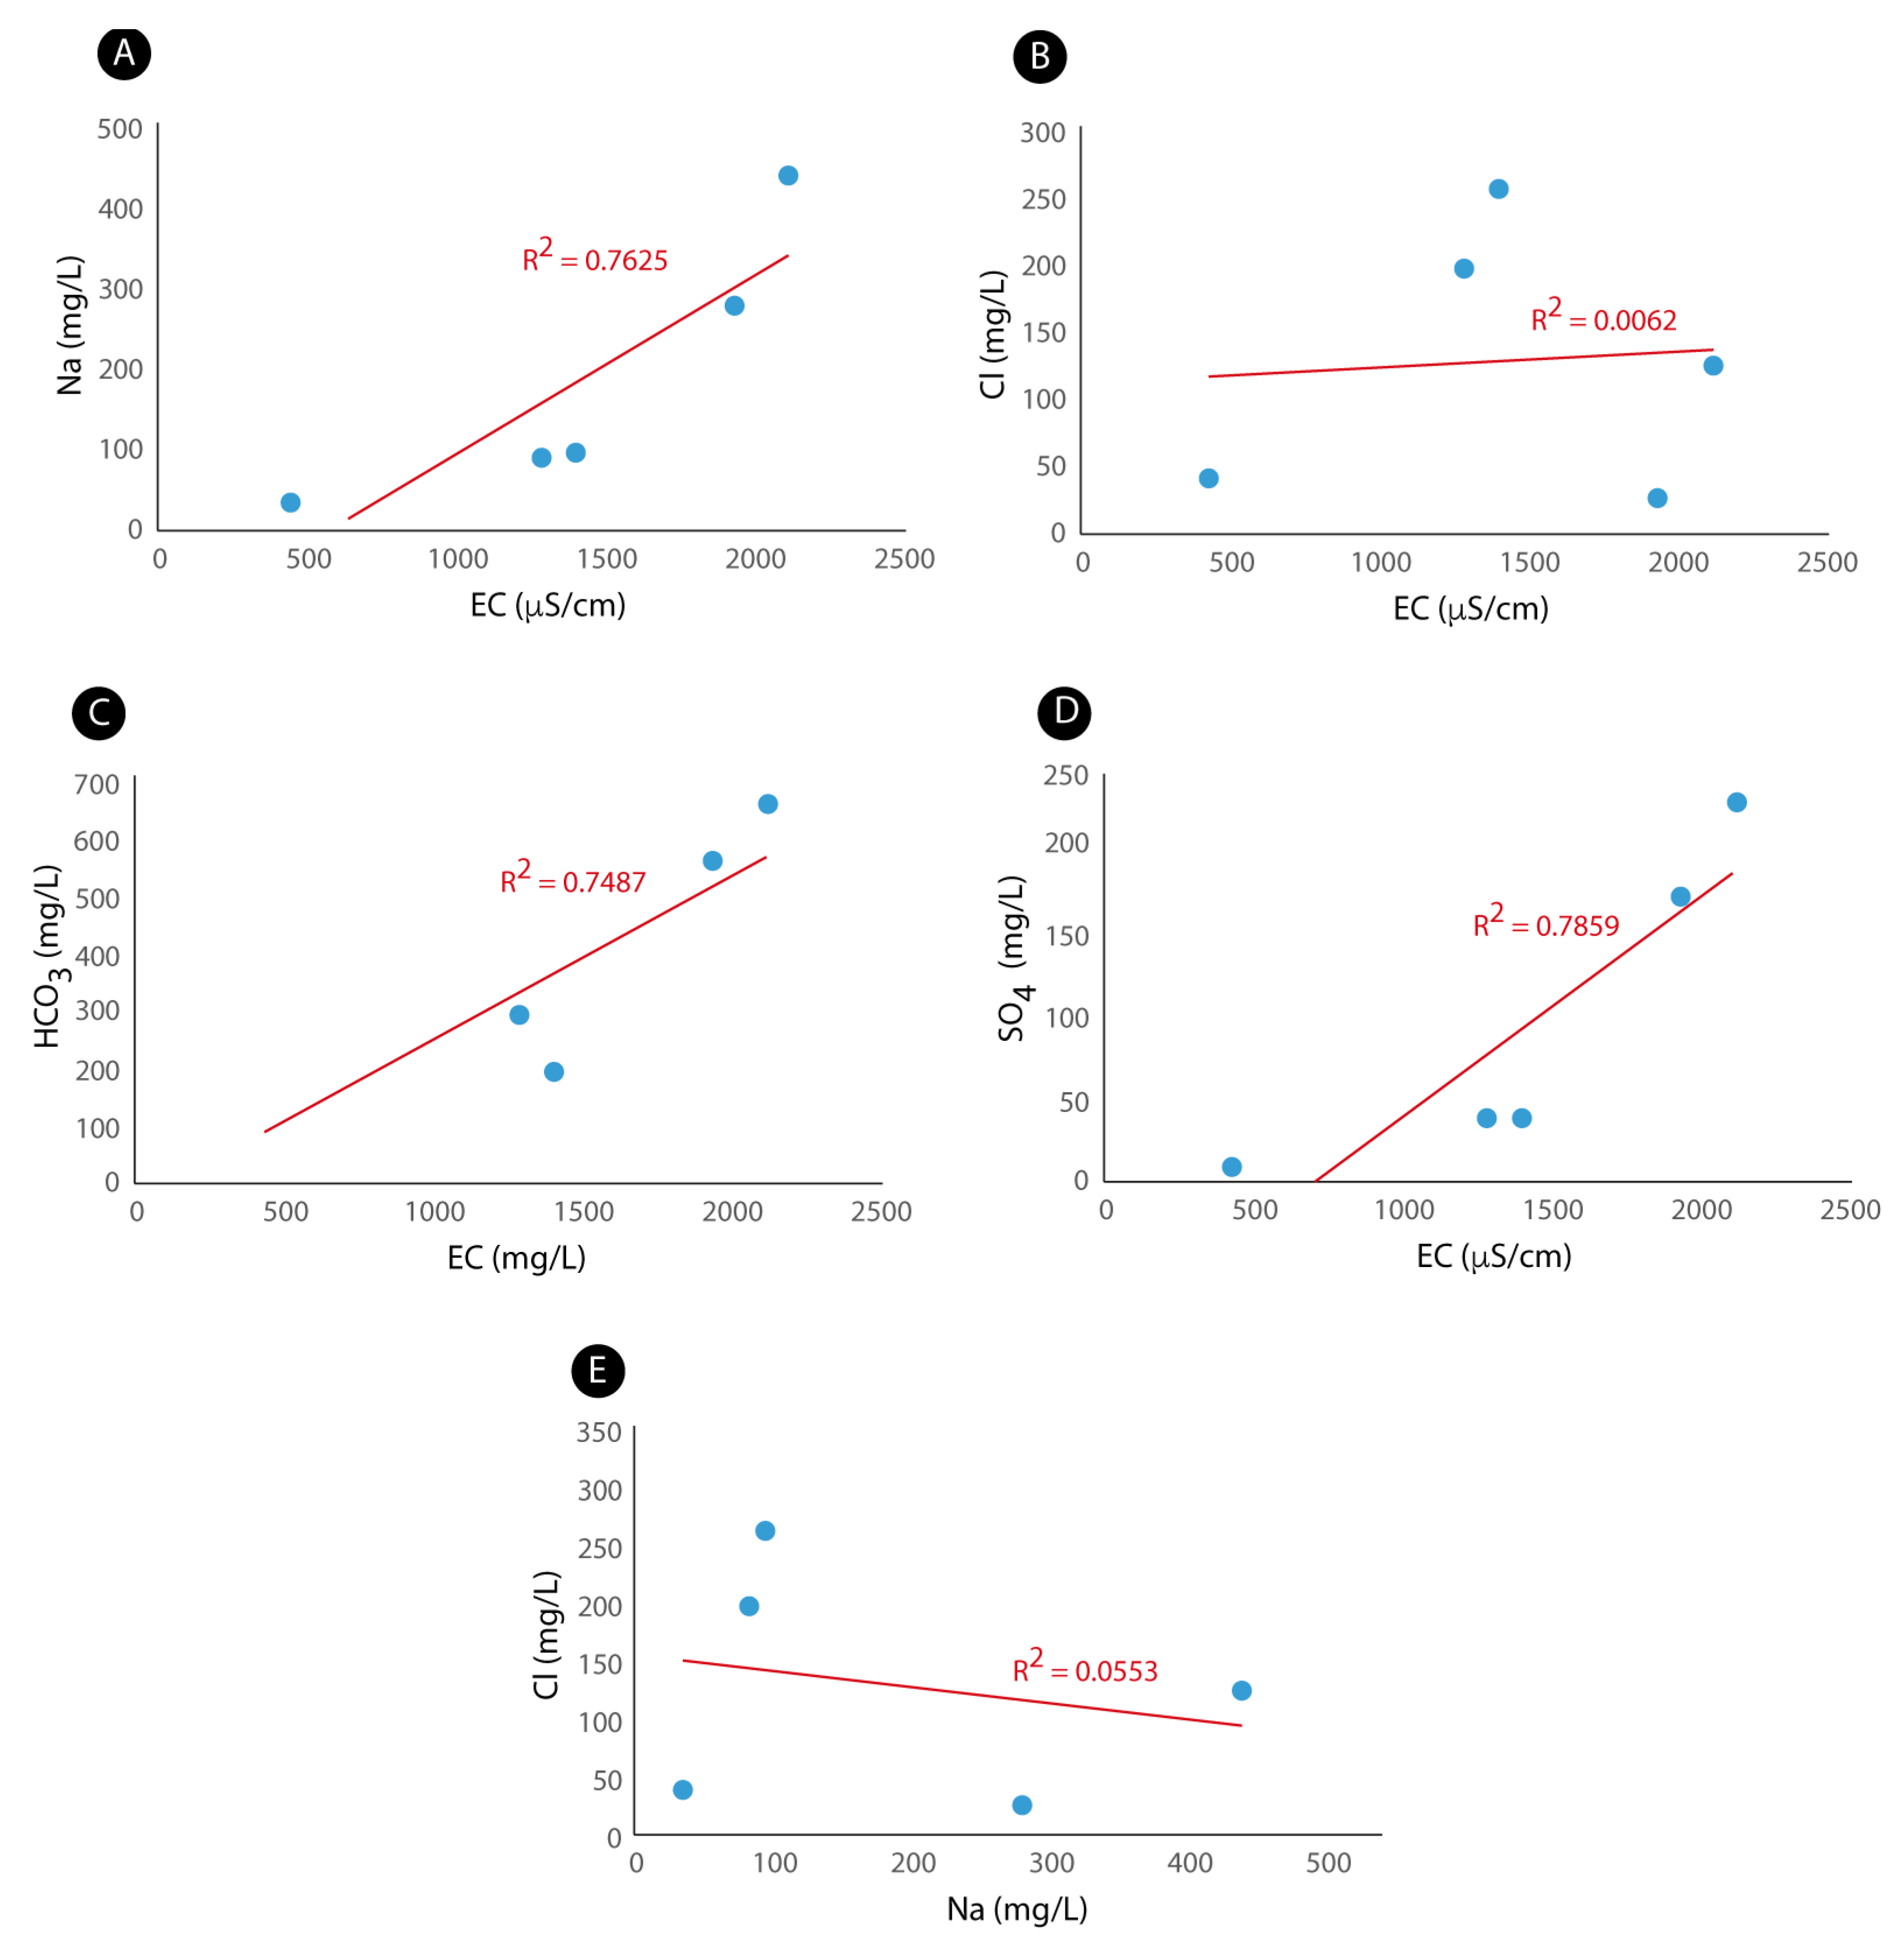
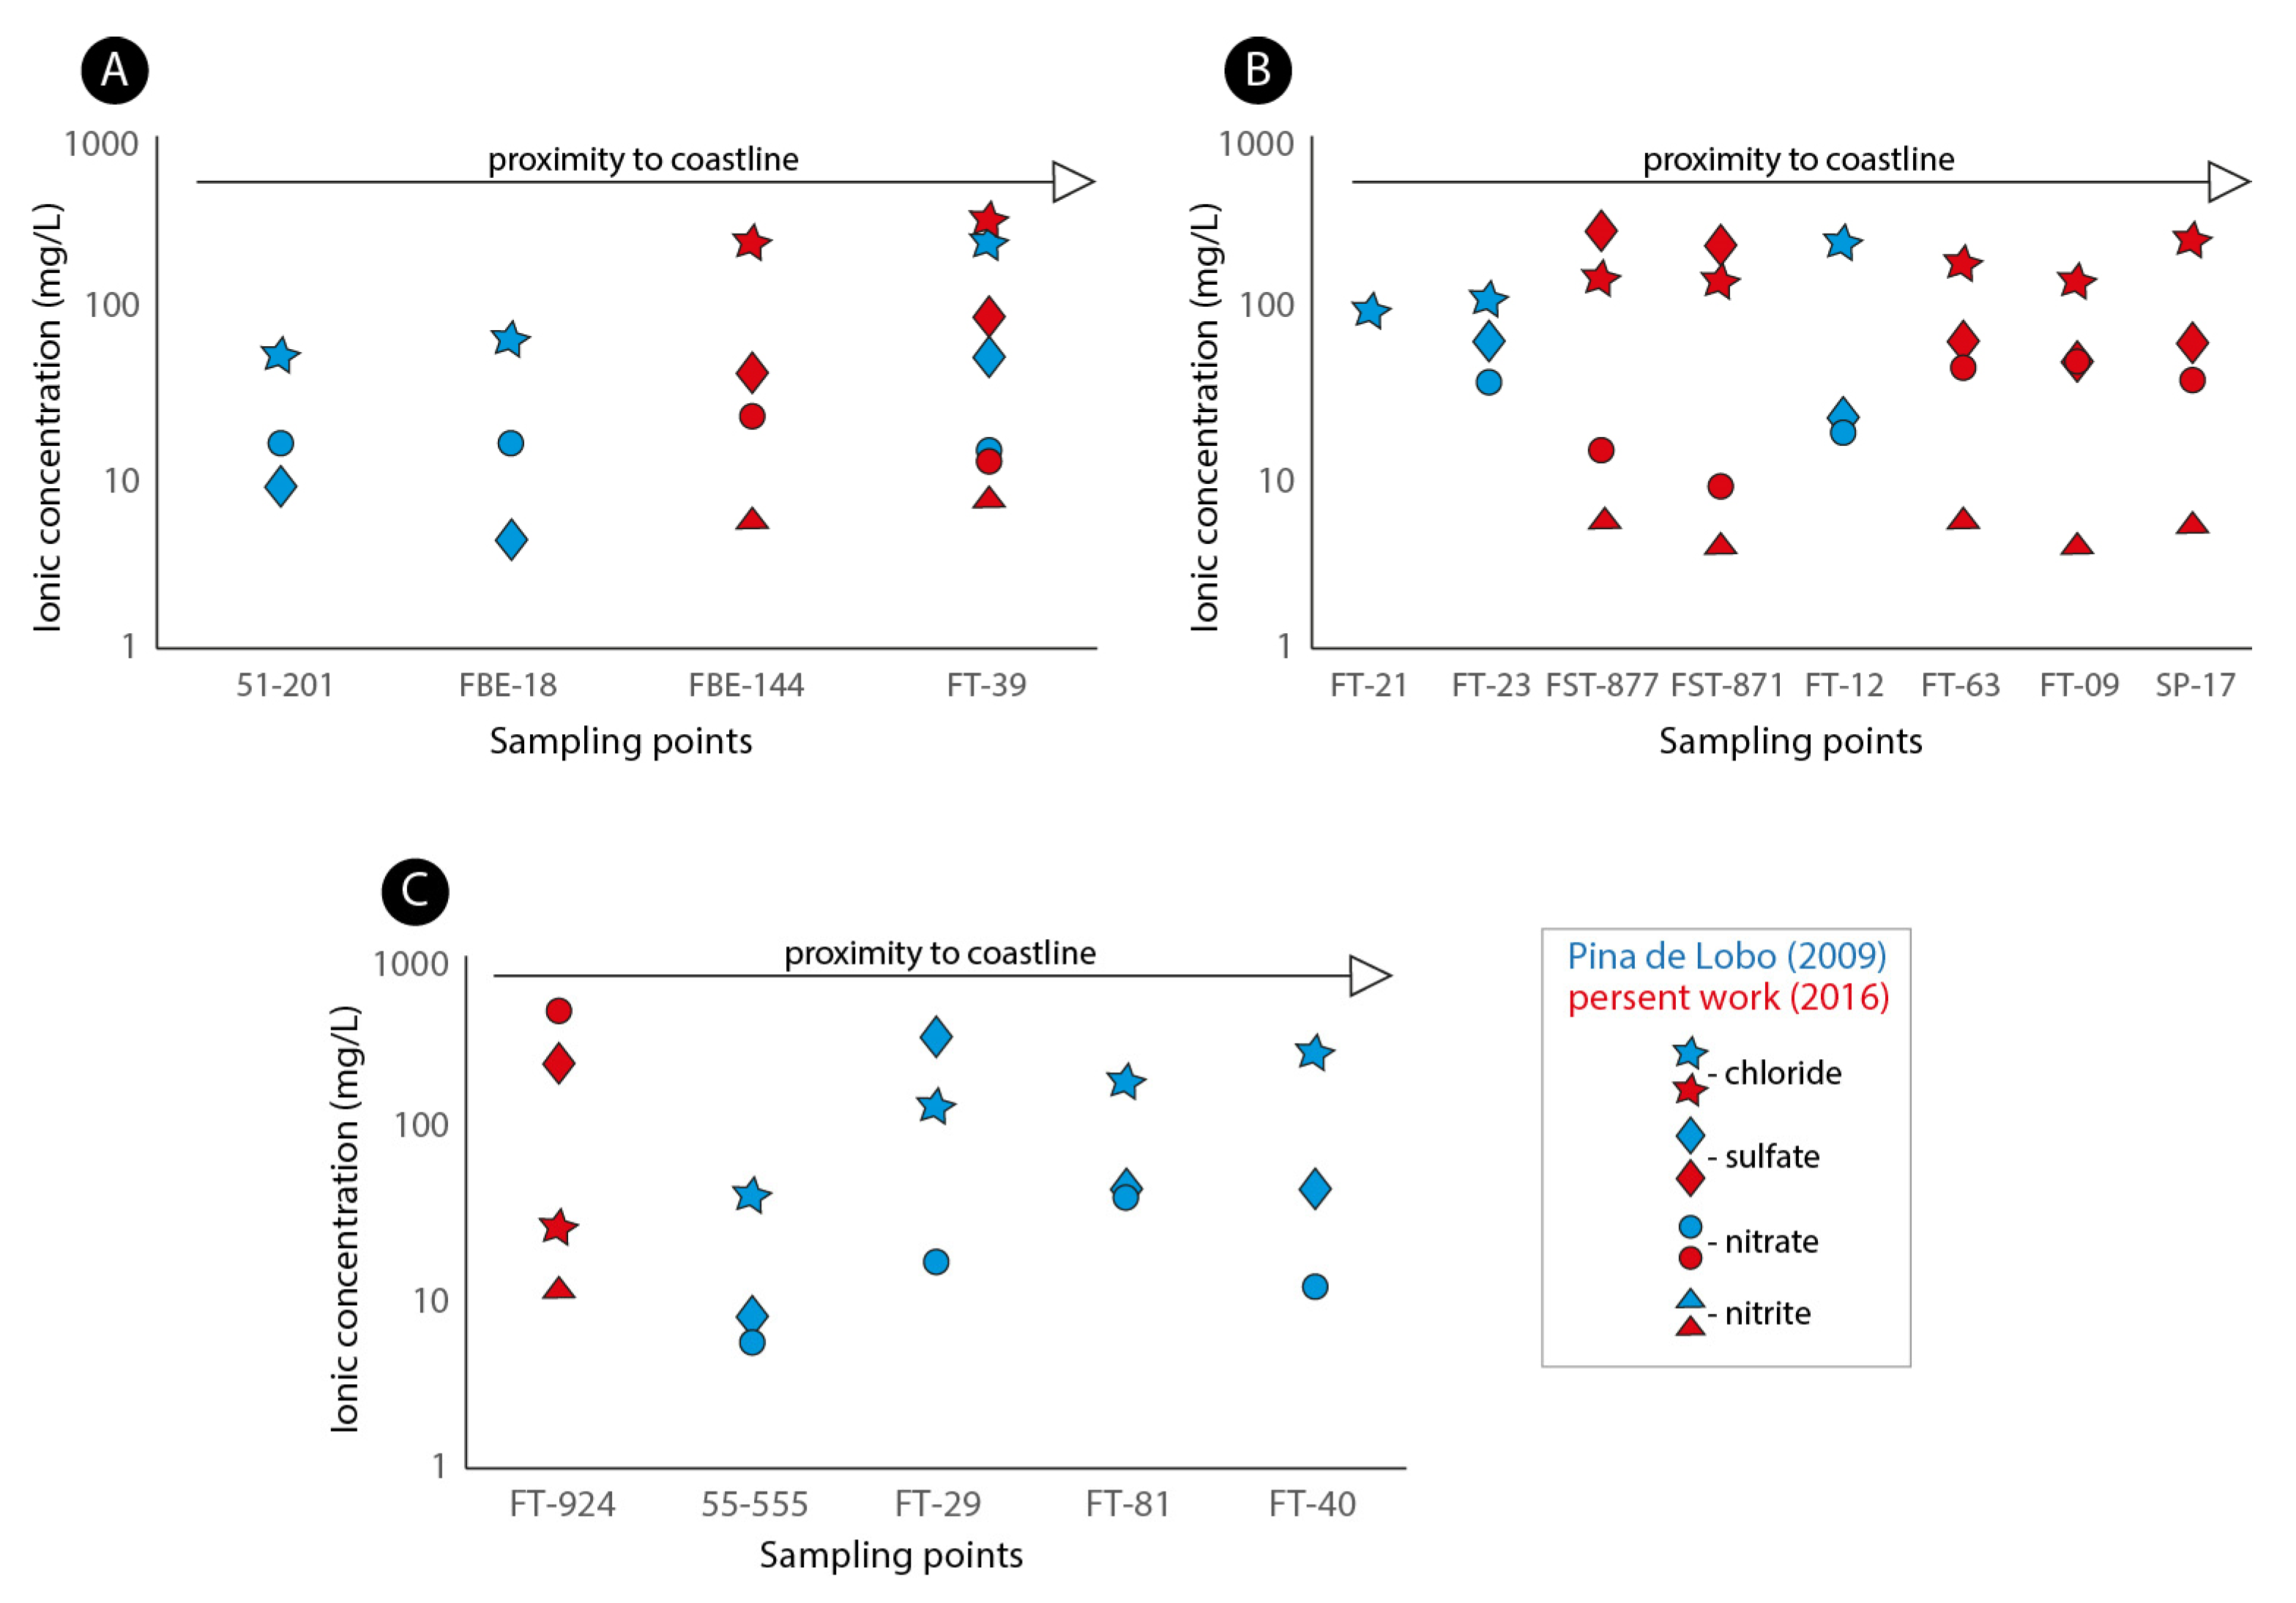
3.2.2. Hydrochemical Classification
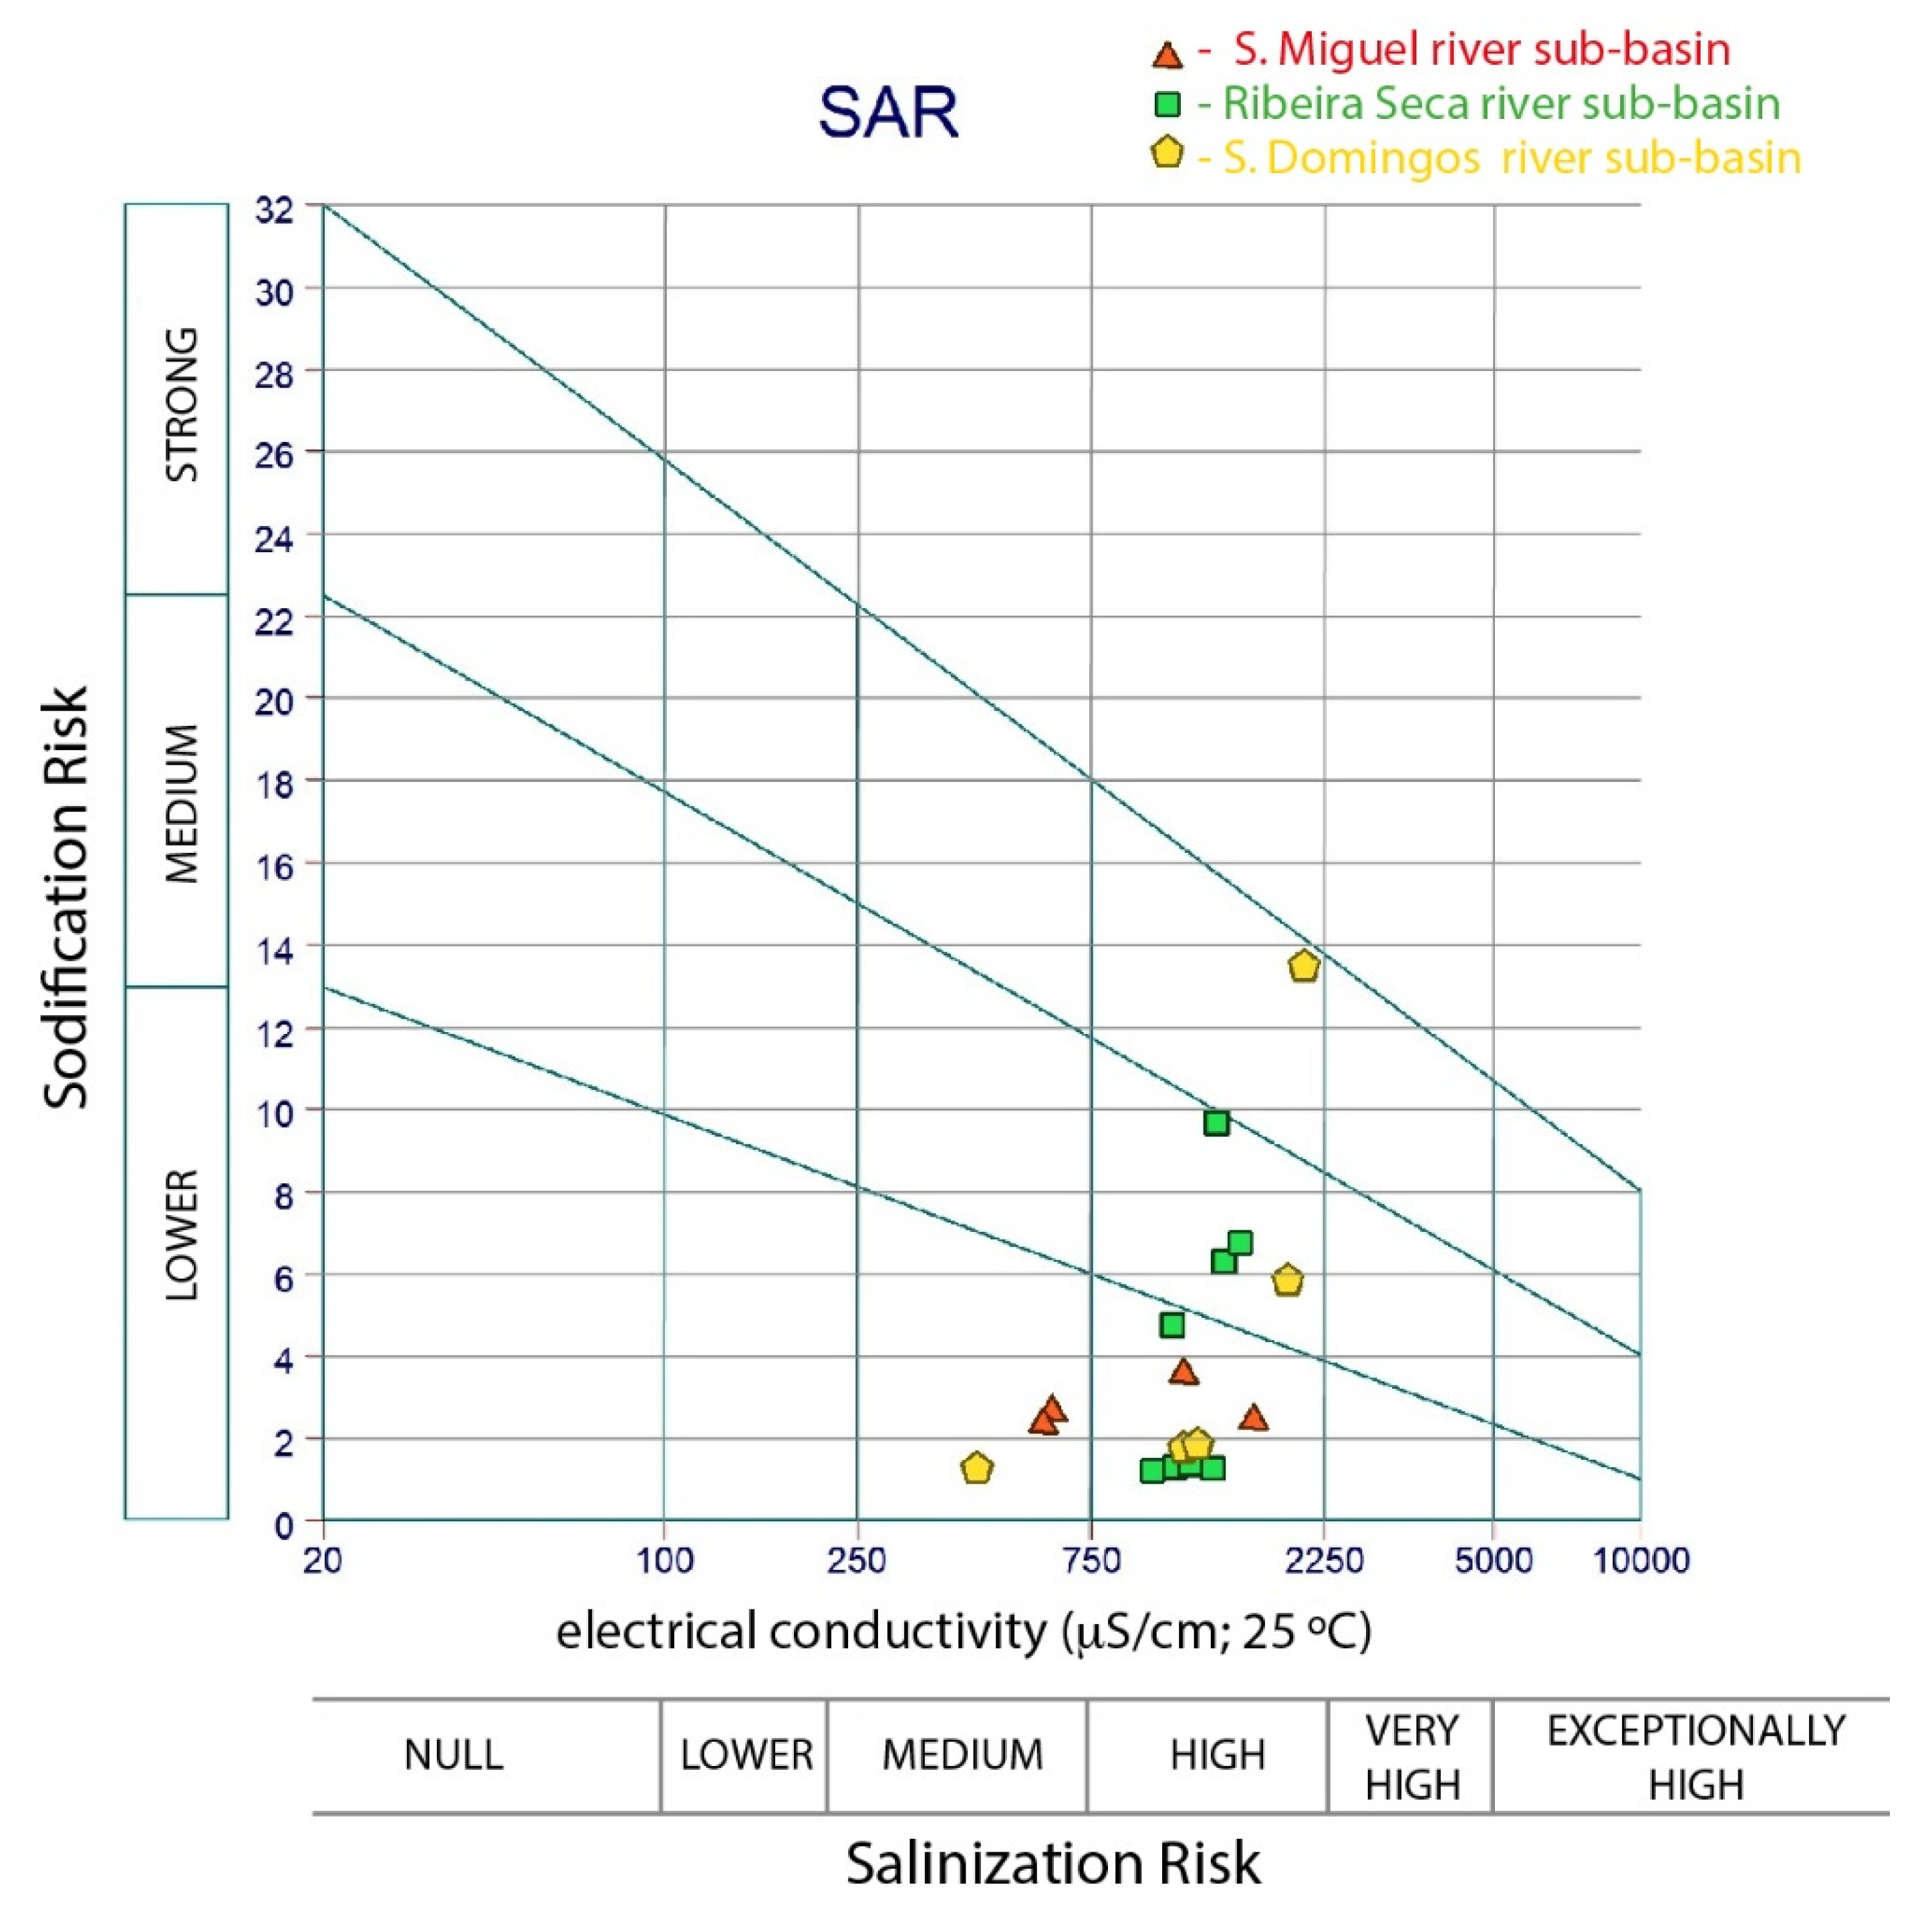
3.2.3. Water Quality and Risk of Soil Salinization
4. Conclusions
Author Contributions
Funding
Institutional Review Board Statement
Informed Consent Statement
Data Availability Statement
Acknowledgments
Conflicts of Interest
References
- Quevauvillier, P. Quality Assurance for Water Analysis; John Wiley & Sons: Hoboken, NJ, USA, 2002. [Google Scholar]
- Robinson, H. Biogeography; McDonald and Evans: London, UK, 1972. [Google Scholar]
- Santamarta-Cerezal, J.C.; Rodríguez-Martín, J. Introduction to water problems in Canary Islands. In Environmental Security, Geological Hazards and Management; Universidad de La Laguna: Tenerife, Spain, 2013; pp. 169–179. [Google Scholar]
- Custodio, E.; Cabrera, M.C.; Poncela, R.; Puga, L.O. Groundwater intensive exploitation and mining in Gran Canaria and Tenerife, Canary Islands, Spain: Hydrogeological, environmental, economic and social aspects. Sci. Total Environ. 2016, 557–558, 425–437. [Google Scholar] [CrossRef]
- Mendoza-Grimón, V.; Fernández-Vera, J.R.; Hernández-Moreno, J.M.; Palacios-Díaz, M.P. Sustainable irrigation using non-conventional resources: What has happened after 30 years regarding boron phytotoxicity? Water 2019, 11, 1952. [Google Scholar] [CrossRef] [Green Version]
- Ruiz-García, A.; Carrascosa-Chisvert, M.D.; Mena, V.; Souto, R.M.; Santana, J.J.; Nuez, I. Groundwater Quality Assessment in a Volcanic Mountain Range (South of Gran Canaria Island, Spain). Water 2019, 11, 754. [Google Scholar] [CrossRef] [Green Version]
- Cruz, J.V.; Andrade, C. Groundwater salinization in Graciosa and Pico islands (Azores archipelago, Portugal): Processes and impacts. J. Hydrol. Reg. Stud. 2017, 12, 69–87. [Google Scholar] [CrossRef]
- Cruz, J.V.; Soares, N. Groundwater Governance in the Azores Archipelago (Portugal): Valuing and protecting a strategic resource in small islands. Water 2018, 10, 408. [Google Scholar] [CrossRef] [Green Version]
- Andrade, C.; Viveiros, F.; Cruz, J.; Coutinho, R. CO2 fluxes of two lakes in volcanic caves in the Azores. Portugal. Appl. Geochem. 2019, 102, 218–228. [Google Scholar] [CrossRef]
- Cruz, J.V.; Coutinho, R.; Pacheco, D.; Cymbron, R.; Antunes, P.; Freire, P.; Mendes, S. Groundwater salinization in the Azores archipelago (Portugal). Environ. Earth Sci. 2011, 62, 1273–1285. [Google Scholar] [CrossRef]
- INE. Projecções Demográficas; INE: Santiago, Cabo Verde, 2018. [Google Scholar]
- Vailleux, Y.; Bourguet, L. La Mise en Valeur des Eaux Souterraines Dans L’archipel du Cap Vert (The Development of Groundwater in The Archipelago of Cape Verde); Report of End of Mission; Ministério de Coordenação Interterritorial, Brigada de Águas Subterrâneas de Cabo Verde: Paris, France, 1974. [Google Scholar]
- Serralheiro, A. Santiago Island Geology (Cape Verde). Ph.D. Thesis, University of Lisbon, Lisboa, Portugal, 1976. [Google Scholar]
- Costa, M.A. Acerca do Reconhecimento Hidrogeológico do Arquipélago de Cabo Verde e Abastecimento de Água às Populações, Praia, Cabo Verde. 1962; (unpublished report).
- INGRH. Spanish Cooperation Síntesis Geo-Hidrologica de Cabo Verde; INGRH: Praia, Cabo Verde, 1994; pp. 1–51. [Google Scholar]
- INGRH. Japanese Agency for International Cooperation Estudo Sobre o Desenvolvimento das Águas Subterrâneas na Ilha de 1999; INGRH: Praia, Cape Verde, 1999. [Google Scholar]
- Fernandopullé, D. Aperçu sur Les Ressources en eau et Les Possibilités D’aménagementhydrauliques Iles du Cap Vert. Projet CTP-CVI/75/001, Praia, Cape Verde. 1977.
- Fernandopullé, D. Recherche et mise en valeur des eau souterraines. In Rapport Terminal. Projet CVI-75/001; PNUD-DTCD: Praia, Cape Verde, 1979. [Google Scholar]
- Mota Gomes, A. A Hidrogeologia de Santiago; DEGAS: Praia, Cape Verde, 1980. [Google Scholar]
- Barmen, G.; Josefsson, G.; Magnusson, M.; Wernersson, H. A Hydrogeological Investigation on Santiago, Cape Verde Islands. A Project within the Bilateral Programme of SAREC between Cape Verde and Sweden; Report; Lund Institute of Technology in Cooperation with the National Technical Institute of Cape Verde: Lund, Sweden, 1984; p. 43. [Google Scholar]
- Akiti, T. Environmental Isotope Study of the Groundwaters of the Island of Santiago, Cape Verde; Report; International Atomic Energy Agency, Section of Isotope Hydrology: Vienna, Austria, 1985; p. 54. [Google Scholar]
- Dahlin, T.; Ferreira, A.; Persson, P.-G. Resistivity Measurements in Arid Areas and Volcanic Formations. A Field Study on Santiago Cape Verde Islands; The Swedish Agency for Research and Cooperation with Developing Countries: Stockholm, Sweden, 1986; p. 49. [Google Scholar]
- Poitrinal, P. Assistência à Junta dos Recursos Hídricos (JRH) Para a Avaliação e Gestão dos Recursos em Água, Incluindo Informações dos Projectos—Projet CVI 75/001, Projet CVI 79/001, Projet CVI 82/001 and Projet CVI 86/001 (Projet PNUD/DCTD CVI 87/001); APA: Praia, Cape Verde, 1991. [Google Scholar]
- Heitor, A.M.; Pina, A.P. Águas subterrâneas em Cabo Verde, qualidade da água na ilha de Santiago. In Proceedings of the 6th Simpósio de Hidráulica e Recursos Hídricos dos PALOP, Praia, Cape Verde, 10–13 November 2003; pp. 819–827. [Google Scholar]
- Mota Gomes, A.; Lobo de Pina, A.F.; Condessa de Melo, M.T.; Silva, A. The importance of groundwater resources for the sustainable development of the Santiago Island (Cape Verde). In Proceedings of the 32nd International Geological Congress, Florence, Italy, 20–28 August 2004. [Google Scholar]
- Lobo de Pina, A.F.; Mota Gomes, A.; Condesso de Melo, M.T.; Marques da Silva, M.A. The impact of salt water intrusion on groundwater quality and on the social and economical development of the Santiago Island (Cape Verde). In Proceedings of the 18th Salt Water Intrusion Meeting, Cartagena, Spain, 31 May–3 June 2004. [Google Scholar]
- Lobo de Pina, A.F.; Mota Gomes, A.; Condesso de Melo, M.T.; Marques da Silva, M.A. Hydrogeochemical characterization of the main aquifers units of Santiago Island, Cabo Verde. In Proceedings of the XIV Semana de Geoquímica/VIII Congresso de Geoquímica dos Países de Língua Portuguesa, Aveiro, Portugal, 11–16 July 2005; pp. 379–382. [Google Scholar]
- Lobo de Pina, A.F.; Gomes, M.; Santos, F.; Almeida, E. Caracterização Geoeléctrica da Zona Este (Santa Cruz) da Ilha de Santiago, Cabo Verde. Rev. Científica 2006, 2, 143–151. [Google Scholar]
- Lobo de Pina, A.F. Hidroquímica e Qualidade das Águas da Ilha de Santiago. Ph.D. Thesis, University of Aveiro, Aveiro, Portugal, 2009. [Google Scholar]
- Carreira, P.M.; Marques, J.M.; Pina, A.; Mota Gomes, A.; Nunes, D.; Monteiro Santos, F.A. Characterization of groundwater resources degradation at Santiago Island (Cabo Verde) ascribed to isotopic and geochemical signatures. WIT Trans. Ecol. Environ. 2008, 111, 139–148. [Google Scholar]
- Mota Gomes, A. Hidrogeologia e Recursos Hídricos da Ilha de Santiago (Cabo Verde). Ph.D. Thesis, University of Aveiro, Aveiro, Portugal, 2007. [Google Scholar]
- Condesso de Melo, M.T.; Silva, J.; Lobo de Pina, A.; Mota Gomes, A.; Almeida, F.; Moura, R.; Silva, M.A. Use of geochemical tools to study groundwater salinization in volcanic islands: A case study in the Porto Santo (Portugal) and Santiago (Cape Verde) islands. In Proceedings of the of 20th Salt Water Intrusion Meeting, Naples, FL, USA, 23–27 June 2008. [Google Scholar]
- Shahidian, S.; Serralheiro, R.; Serrano, J.; Sousa, A. O Desafio dos Recursos Hídricos em Cabo Verde. In CaboVerde—Agronomia e Recursos Naturais; Pinto, F.C., Ed.; ISA-Press: Lisboa, Portugal, 2014; pp. 217–236. [Google Scholar]
- Gonçalves, N.; Valente, T.; Grande, J.A. Water quality in the municipality of São Domingos (Santiago Island, Cape Verde). Comun. Geol. 2015, 102, 119–123. [Google Scholar]
- Carreira, P.M.; Bahir, M.; Ouhamdouch, S.; Fernandes, P.G.; Nunes, D. Tracing salinization processes in coastal aquifers using an isotopic and geochemical approach: Comparative studies in western Morocco and southwest Portugal. Hydrogeol. J. 2018, 26, 2595–2615. [Google Scholar] [CrossRef]
- Faria, X. Os Solos da ilha de Santiago. In Estudos, Ensaios e Documentos; Junta de Investigações do Ultramar: Lisboa, Portugal, 1970. [Google Scholar]
- Amaral, I. Santiago de Cabo Verde: A Terra e os Homens; Junta de Investigações do Ultramar: Lisboa, Portugal, 1964. [Google Scholar]
- Marques, M.M. Caracterização das grandes unidades geomorfológicas da ilha de Santiago (República de Cabo Verde). In Contribuição Para o Estudo da Compartimentação da Paisagem; Centro de Estudos de Pedologia: Lisboa, Portugal, 1990. [Google Scholar]
- Neves, L.; Esperança, A.; Ferreira, C.; Ordens, C.; Pinto, I.; Silva, S.; Pereira, A. A GIS model for the Island of Santiago (Cape Verde). In Proceedings of the VII Congresso Nacional de Geologia, Estremoz, Portugal, 29 June–13 July 2006; pp. 1107–1110. [Google Scholar]
- Carreira, P.M.; Marques, J.M.; Pina, A.; Mota Gomes, A.; Fernandes, P.A.; Monteiro Santos, F. Groundwater assessment at Santiago Island (Cabo Verde): A multidisciplinary approach to a recurring source of water supply. Water Resour. Manag. 2010, 24, 1139–1159. [Google Scholar] [CrossRef]
- Exército, S.C. Carta Militar de Portugal na escala 1:25000. In Província de Cabo Verde. Ilha de Santiago; Serviços Cartográficos do Exército: Lisboa, Portugal, 1969. [Google Scholar]
- Serralheiro, A. Carta Geológica da Ilha de Santiago (Cabo Verde) na escala 1:25 000 (folhas 48 a 59). In Junta de Investigações Científicas do Ultramar; Laboratório de Estudos Petrológicos e Paleontológicos do Ultramar: Lisboa, Portugal, 1976. [Google Scholar]
- Victória, S.M. Condicionantes Geológicas ao Ordenamento do Território: Uma Aplicação na Região da Praia, Santiago-Cabo Verde. Master’s Thesis, University of Coimbra, Coimbra, Portugal, 2006. [Google Scholar]
- Monteiro, F.; Fortes, A.; Ferreira, V.; Essoh, A.; Gomes, I.; Correia, A.; Romeiras, M. Current status and trends in cabo verde agriculture. Agronomy 2020, 10, 74. [Google Scholar] [CrossRef] [Green Version]
- Baptista, I.; Fleskens, L.; Ritsema, C.; Querido, A.; Tavares, T.; Ferreira, A.; Reis, E.A.; Gomes, S.; Varela, A. Soil and water conservation strategies in Cape Verde and their impacts on livelihoods: An overview from the Ribeira Seca Watershed. Land 2015, 4, 22–44. [Google Scholar] [CrossRef] [Green Version]
- RGA. Cabo Verde—Recenseamento Geral da Agricultura 2015—Nota Metodológica; INA: Santiago, Cape Verde, 2015. [Google Scholar]
- SCETAGRI. Carta de Ocupação dos Solos na Escala de 1/25.000, (Praia); Ministério do Desenvolvimento Rural/SCETAGRI: Praia, Cape Verde, 1981.
- Tavares, J.P.; Amiotte-Suchet, P. Rainfall erosion risk mapping in volcanic soils of Santiago Island, Cape Verde Archipelago. Afr. Geosci. Rev. 2007, 14, 399–414. [Google Scholar]
- Christofoletti, A. Geomorfologia Fluvial, 2nd ed.; Oficina de Textos: São Paulo, Brazil, 1980. [Google Scholar]
- Bormann, F.H.; Likens, G.E. Nutrient cycling. Science 1967, 155, 424–429. [Google Scholar] [CrossRef]
- Pina, A. O semiárido Cabo-verdiano e a sua experiência. In Proceedings of the VIII Simpósio de Recursos Hídricos do Nordeste, Gravata, Brazil, 17–20 October 2006. [Google Scholar]
- Pina, A. As Águas Subterrâneas e a Vulnerabilidade Aquífera na Ilha de Santiago—Cabo Verde; Universidade Federal do Ceará: Fortaleza, Brazil, 2014. [Google Scholar]
- Ventura, J.E. A problemática dos recursos hídricos em Santiago. In Proceedings of the 1 Congresso de Desenvolvimento Regional de Cabo Verde, Praia, Cape Verde, 6–11 July 2009. [Google Scholar]
- Menegatto, M. Distribuição espacial dos solos em Cabo Verde: Uma análise da aridez e do balanço pedogenético em ilhas vulcânicas. In Proceedings of the Anais do VII Congresso Brasileiro de geógrafos, Vitoria, Brazil, 10–16 August 2014; ISBN 978–85–98539–04–1. [Google Scholar]
- Diniz, A.C.; Matos, G.C. Carta de zonagem agro-ecológica e da vegetação de Cabo Verde. I—Ilha de Santiago. Garcia de Orta. Série Botânica 1986, 8, 39–82. [Google Scholar]
- NIODA., I.N.; Agrário, D.I. Manual de Fertilidade do Solo e Fertilização das Culturas. In São Jorge dos Órgãos—República de Cabo Verde; Instituto Nacional de Investigação e Desenvolvimento Agrário: São Jorge dos Órgãos, Capo Verde, 1997. [Google Scholar]
- Madeira, M.; Ricardo, R. Soils of Cape Vert and their classification according to the world reference soil base. Rev. Ciências Agrárias 2013, 36, 377–392. [Google Scholar]
- JICA. Water Supply System Development Project; JICA: Santiago Island, Cape Verde, 2010. [Google Scholar]
- Pina, A. Fundamentos Hidrogeoquímicos Aplicados na Bacia Hidrográfica de Santa Cruz, Ilha De Santiago—Cabo Verde, Como Instrumentos Para a Gestão de Recursos Hídricos; Universidade Federal do Ceará: Fortaleza, Brazil, 2011; p. 153. [Google Scholar]
- Custodio, E.; Llamas, M.R. Hidrologia Subterránea; Ediciones Omega, S.A: Barcelona, Spain, 1983; Volume 1/2. [Google Scholar]
- Gonçalves, N.; Valente, T.; Pamplona, J. Water supply and access to safe water in developing arid countries. J. Earth Sci. Environ. Stud. 2019, 4, 589–599. [Google Scholar] [CrossRef]
- Qadir, M.; Quillérou, E.; Nangia, V.; Muratza, G.; Singh, M.; Thomas, R.J.; Drechsel, P.; Noble, A.D. Economics of salt-induced land degradation and restoration. Nat. Resour. Forum 2014, 28, 282–295. [Google Scholar] [CrossRef]
- Qadir, M.; Schubert, S. Degradation processes and nutrient constraints in sodic soils. LDD-Land Degrad. Dev. 2002, 13, 275–294. [Google Scholar] [CrossRef]


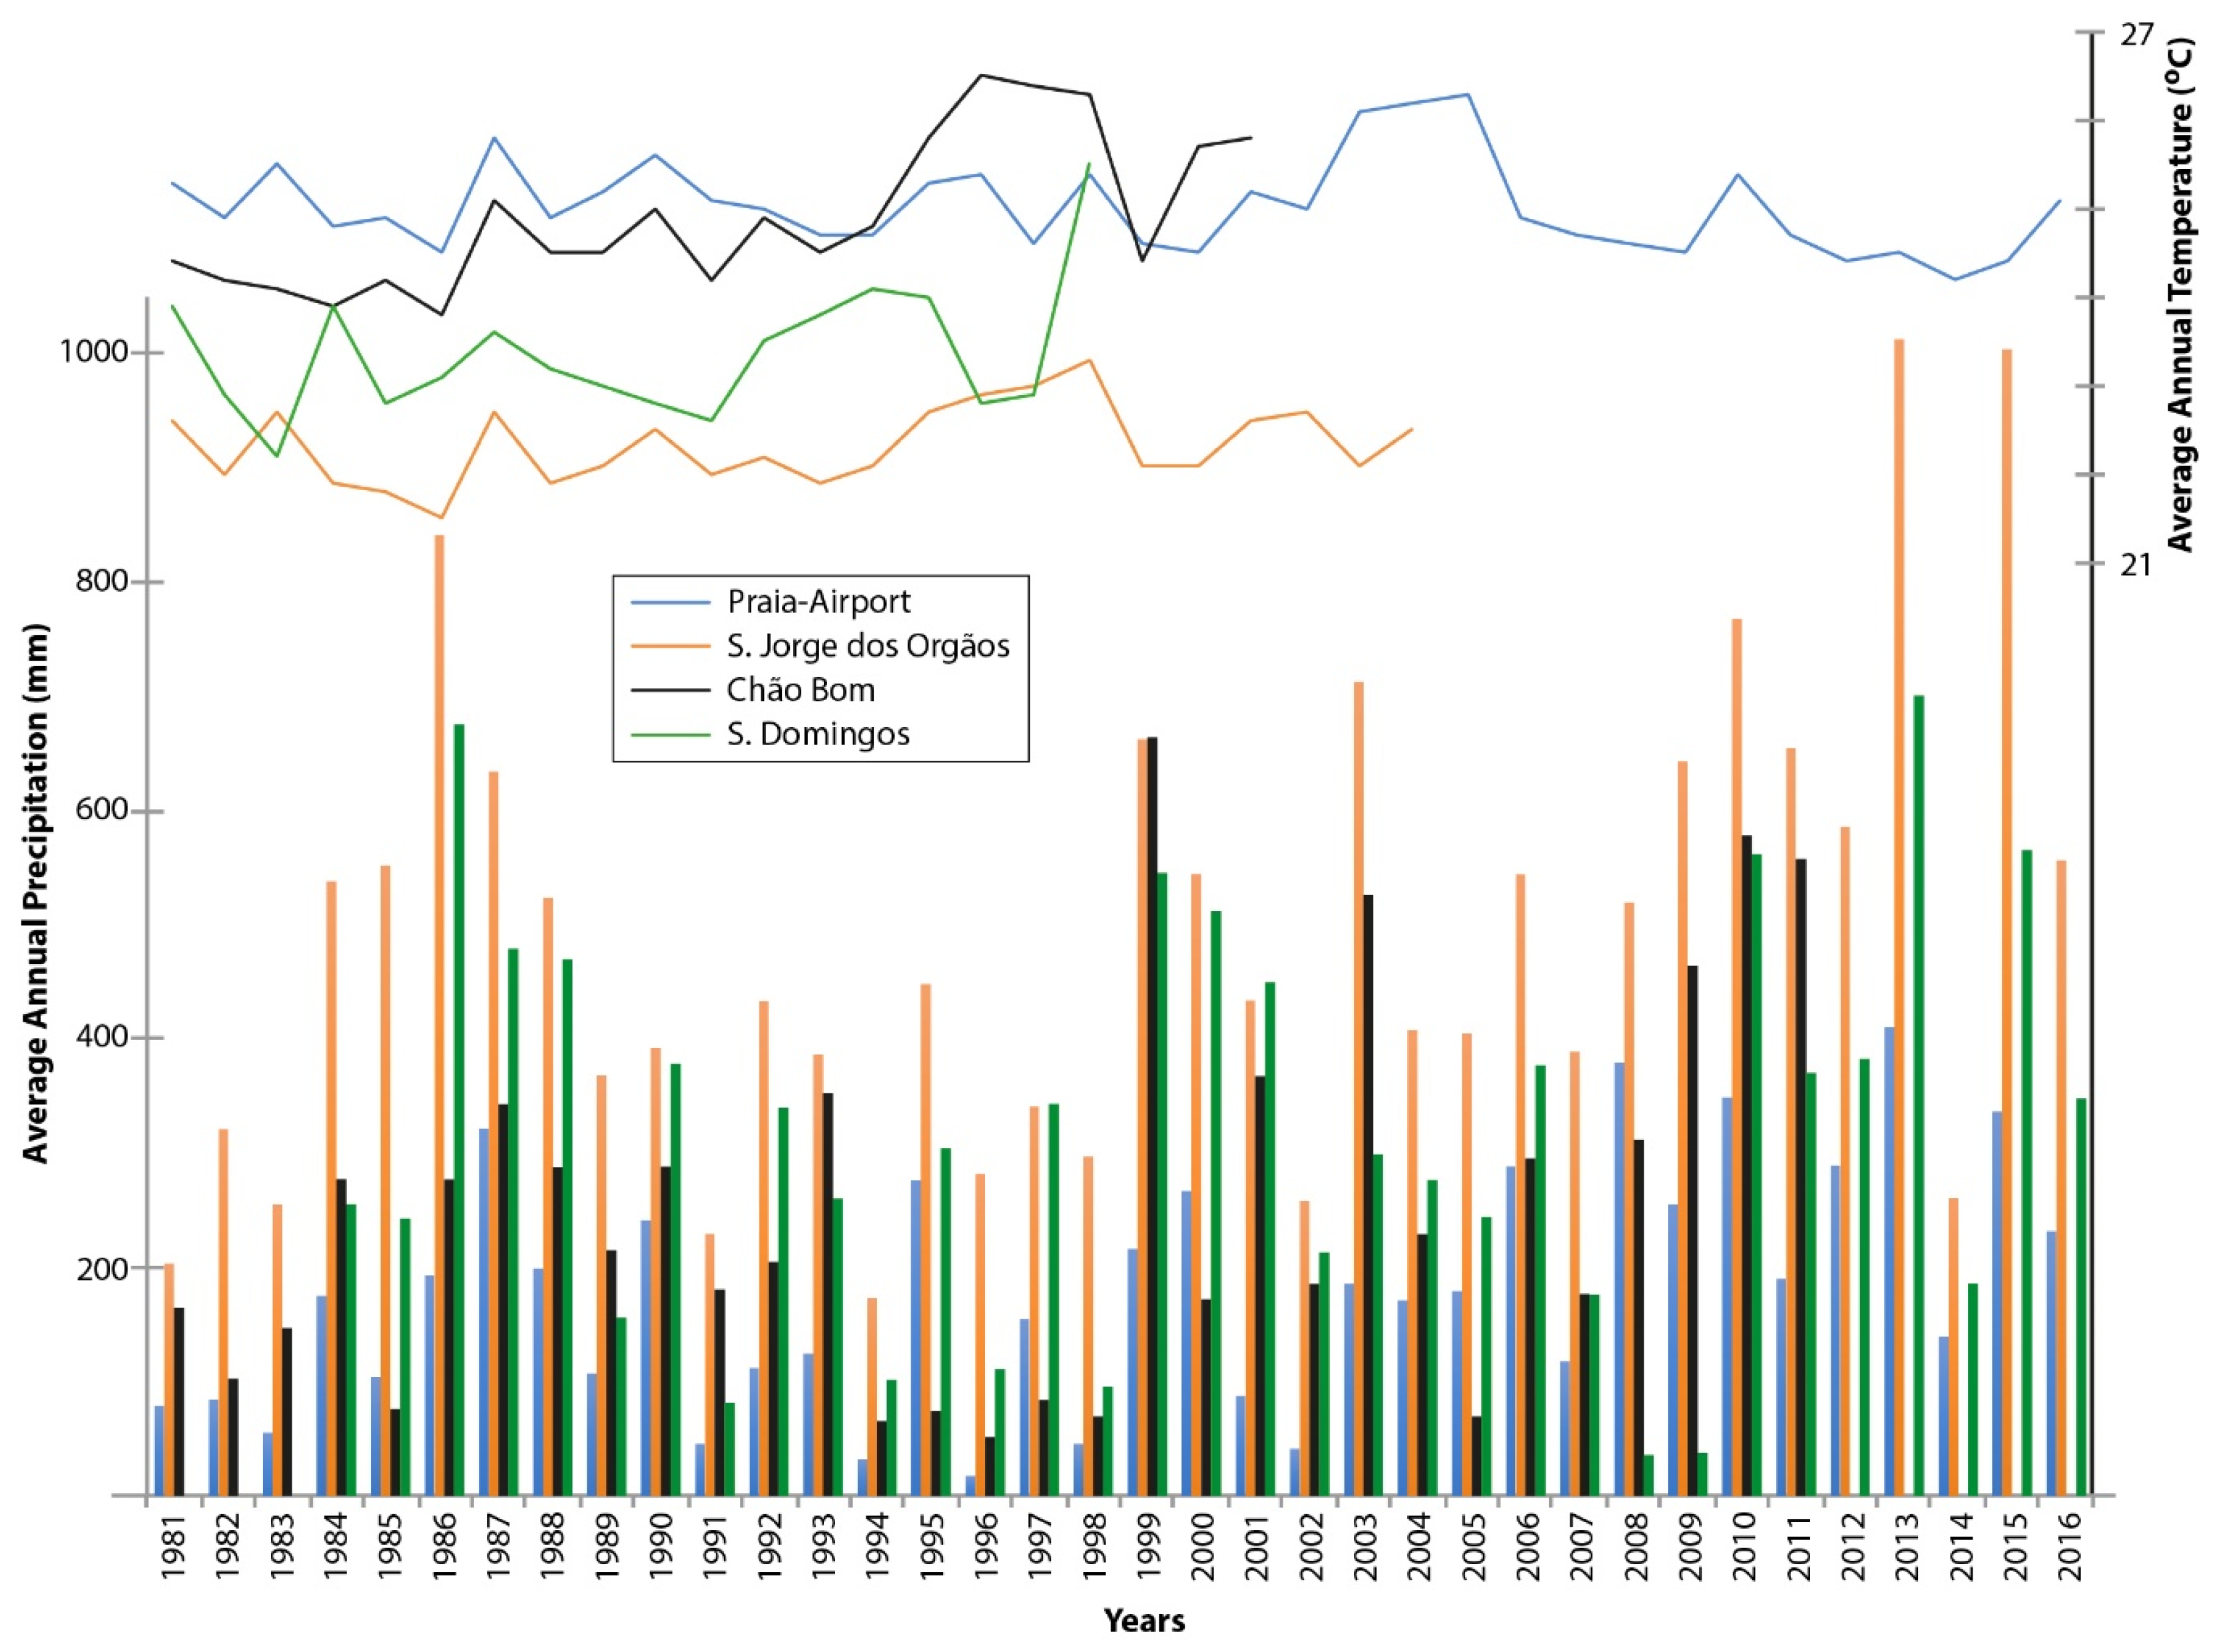
| Meteorological Station | Annual Precipitation (mm) | Annual Temperature (°C) | ||
|---|---|---|---|---|
| Maximum | Minimum | Maximum | Minimum | |
| Praia-Airport | 410 | 17.8 | 26.3 | 24.2 |
| S. Jorge dos Órgãos | 1013 | 174 | 23.3 | 21.5 |
| Chão Bom | 664 | 51,3 | 26.5 | 23.8 |
| S. Domingos | 707 | 35.8 | 25.5 | 22.2 |
| River Basin | Basin Area (km2) | Precipitation Total Volume (hm3) |
|---|---|---|
| Tarrafal | 188 | 45 |
| Santa Cruz | 355 | 121 |
| Santa Catarina | 128 | 62 |
| S. João Batista | 155 | 47 |
| Praia | 179 | 33 |
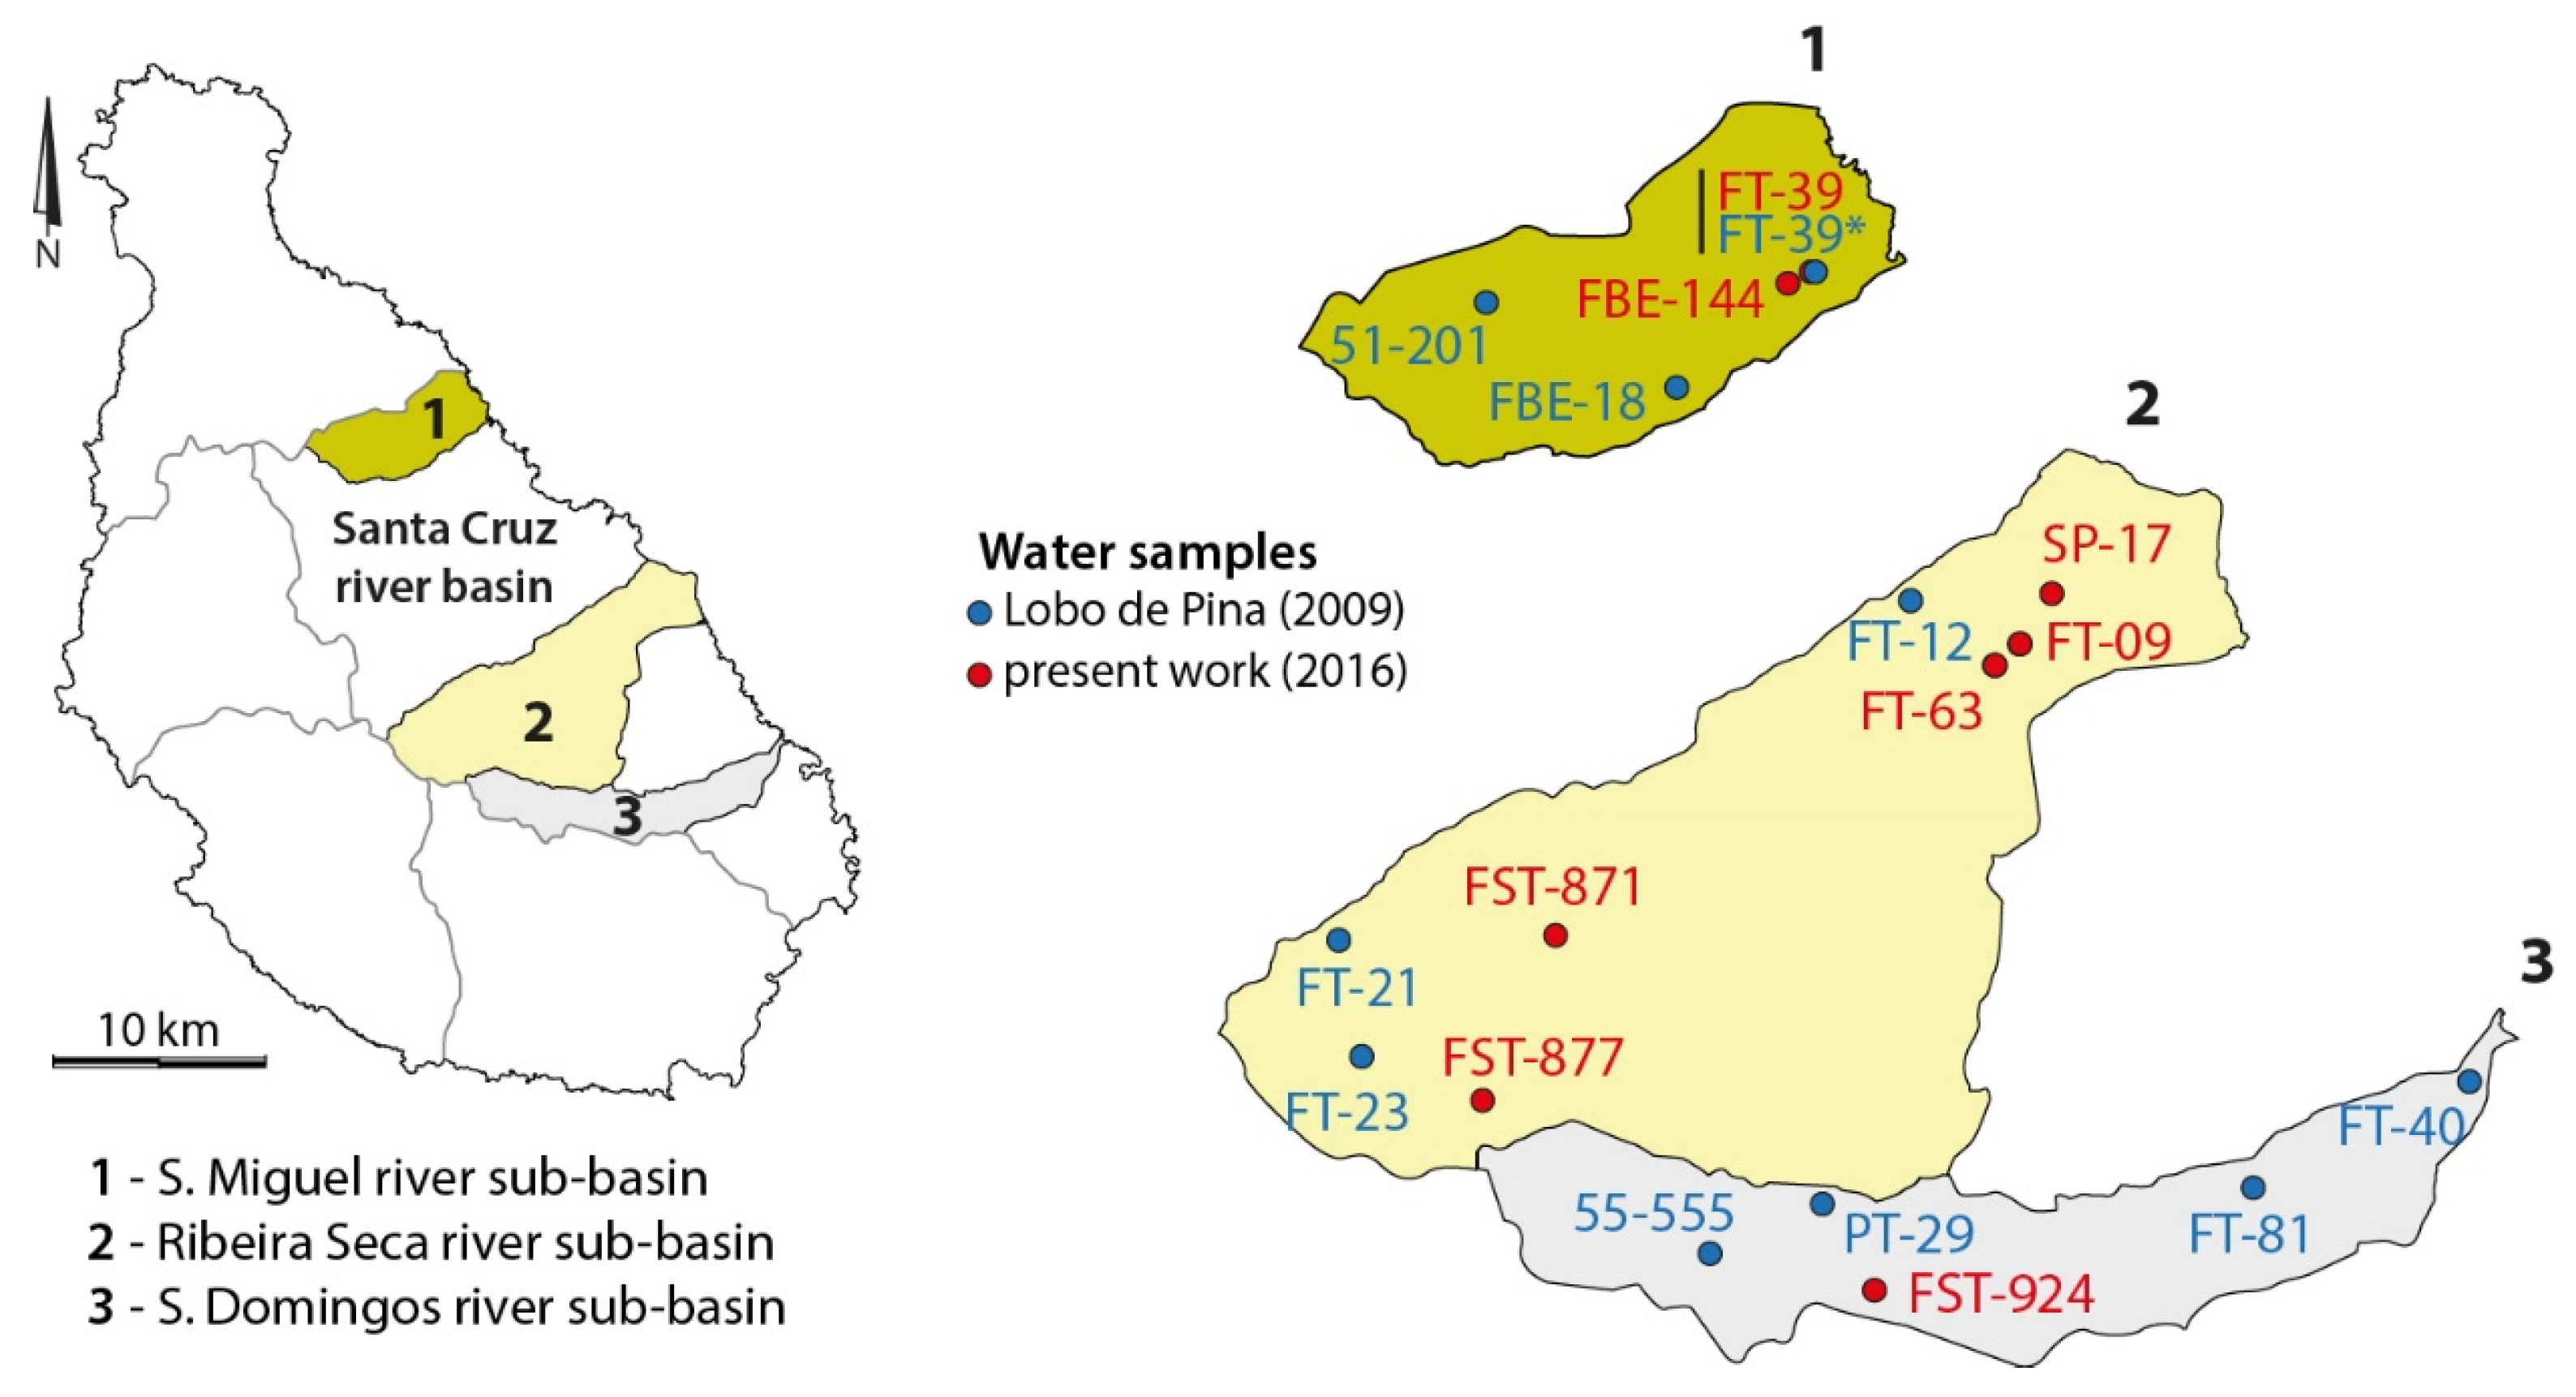
| S. Miguel | |||||||||||||
|---|---|---|---|---|---|---|---|---|---|---|---|---|---|
| Samples | T | pH | CE | Na | K | Ca | Mg | Si | Cl | HCO3 | SO4 | NO3 | NO2 |
| 51-201 | 24.2 | 7.2 | 527 | 77.9 | 8.9 | 27.2 | 23.3 | 16.9 | 56.7 | 220.0 | 9.1 | 21.7 | <DL |
| FBE-18 | 27.5 | 7.1 | 525 | 68.1 | 9.9 | 27.2 | 22.0 | 17.3 | 70.9 | 188.0 | 4.6 | 21.7 | <DL |
| FBE-144 | 27.8 | 7.4 | 1289 | 78.8 | 8.8 | 77.1 | 60.3 | 23.1 | 218.8 | 285.8 | 35.7 | 23.6 | <DL |
| FT-39 | 27.0 | 7.8 | 1711 | 130.0 | 12.7 | 79.5 | 82.3 | 24.7 | 315.1 | 327.5 | 82.8 | 13.6 | <DL |
| FT-39* | 26.0 | 6.9 | 1439 | 113.0 | 9.9 | 57.0 | 70.7 | 30.0 | 248.7 | 276.0 | 50.3 | 16.8 | <DL |
| Ribeira Seca | |||||||||||||
| FT-21 | 26.7 | 7.1 | 1351 | 243.0 | 6.4 | 24.8 | 53.5 | 16.9 | 85.1 | 556.0 | 81.9 | <DL | <DL |
| FT-23 | 26.7 | 7.2 | 1041 | 166.0 | 17.9 | 40.0 | 31.3 | 16.7 | 106.4 | 312.0 | 63.7 | 53.6 | <DL |
| FST-877 | 27.9 | 7.8 | 1467 | 230.0 | 8.4 | 54.7 | 19.7 | 11.8 | 168.1 | 321.5 | 230.9 | 14.8 | 6.17 |
| FST-871 | 32.0 | 7.3 | 1311 | 232.0 | 4.8 | 34.1 | 5.7 | 12.3 | 144.5 | 286.1 | 218.2 | 8.73 | 4.16 |
| FT-12 | 25.2 | 7.1 | 1311 | 66.4 | 5.9 | 82.8 | 64.7 | 23.3 | 229.3 | 176.0 | 23.1 | 25.9 | <DL |
| FT-63 | 28.6 | 7.9 | 1213 | 67.0 | 7.3 | 95.5 | 49.9 | 20.1 | 185.9 | 320.9 | 57.5 | 45.5 | 5.6 |
| FT-09 | 27.9 | 7.9 | 975 | 54.7 | 5.7 | 82.0 | 42.0 | 19.5 | 134.0 | 286.2 | 44.4 | 46.9 | 3.9 |
| SP-17 | 28.2 | 8.0 | 1370 | 67.2 | 7.4 | 111.0 | 56.2 | 19.0 | 232.7 | 320.9 | 63.7 | 41.5 | 5.8 |
| S. Domingos | |||||||||||||
| FST-924 | 30.7 | 7.1 | 1927 | 281.0 | 8.7 | 61.5 | 69.2 | 17.6 | 26.3 | 546.1 | 172.9 | 317.0 | 9.8 |
| 55-555 | 22.8 | 8.0 | 433 | 34.2 | 6.6 | 19.3 | 21.0 | 20.8 | 41.2 | 176.0 | 7.2 | 7.5 | <DL |
| PT-29 | 24.6 | 7.0 | 2110 | 438.0 | 9.9 | 8.0 | 43.7 | 21.7 | 127.6 | 661.0 | 227.6 | 21.7 | <DL |
| FT-81 | 25.5 | 6.9 | 1282 | 84.5 | 7.5 | 85.7 | 50.9 | 24.4 | 198.0 | 288.0 | 38.4 | 52.3 | <DL |
| FT-40 | 27.7 | 7.2 | 1394 | 93.0 | 5.7 | 82.2 | 63.3 | 22.6 | 259.3 | 193.0 | 36.8 | 15.9 | <DL |
Publisher’s Note: MDPI stays neutral with regard to jurisdictional claims in published maps and institutional affiliations. |
© 2021 by the authors. Licensee MDPI, Basel, Switzerland. This article is an open access article distributed under the terms and conditions of the Creative Commons Attribution (CC BY) license (https://creativecommons.org/licenses/by/4.0/).
Share and Cite
Gonçalves, N.; Valente, T.; Pamplona, J.; Antunes, I.M.H.R. Hydrochemistry and Evolution of Water Quality in a Context of Aridity and Increasing Agriculture in Three River Sub-Basins of Santiago Island (Cape Verde). Geosciences 2021, 11, 263. https://doi.org/10.3390/geosciences11060263
Gonçalves N, Valente T, Pamplona J, Antunes IMHR. Hydrochemistry and Evolution of Water Quality in a Context of Aridity and Increasing Agriculture in Three River Sub-Basins of Santiago Island (Cape Verde). Geosciences. 2021; 11(6):263. https://doi.org/10.3390/geosciences11060263
Chicago/Turabian StyleGonçalves, Nemias, Teresa Valente, Jorge Pamplona, and Isabel Margarida Horta Ribeiro Antunes. 2021. "Hydrochemistry and Evolution of Water Quality in a Context of Aridity and Increasing Agriculture in Three River Sub-Basins of Santiago Island (Cape Verde)" Geosciences 11, no. 6: 263. https://doi.org/10.3390/geosciences11060263
APA StyleGonçalves, N., Valente, T., Pamplona, J., & Antunes, I. M. H. R. (2021). Hydrochemistry and Evolution of Water Quality in a Context of Aridity and Increasing Agriculture in Three River Sub-Basins of Santiago Island (Cape Verde). Geosciences, 11(6), 263. https://doi.org/10.3390/geosciences11060263