Article

Experimental and Numerical Investigations of a River Embankment Model under Transient Seepage Conditions

1
Department of Civil, Building and Environmental Engineering, University of Napoli Federico II, 80125 Napoli, Italy
2
Department of Civil, Chemical, Environmental and Materials Engineering, University of Bologna, 40136 Bologna, Italy
3
ISMGEO srl, 24068 Seriate, Italy
*
Author to whom correspondence should be addressed.
Geosciences 2021, 11(5), 192; https://doi.org/10.3390/geosciences11050192
Submission received: 31 March 2021 / Revised: 24 April 2021 / Accepted: 25 April 2021 / Published: 29 April 2021
(This article belongs to the Special Issue Natural and Artificial Unsaturated Soil Slopes)

Abstract

:
The evaluation of riverbank stability often represents an underrated problem in engineering practice, but is also a topical geotechnical research issue. In fact, it is certainly true that soil water content and pore water pressure distributions in the riverbank materials vary with time, due to the changeable effects of hydrometric and climatic boundary conditions, strongly influencing the bank stability conditions. Nonetheless, the assessment of hydraulic and mechanical behavior of embankments are currently performed under the simplified hypothesis of steady-state seepage, generally neglecting the unsaturated soil related issues. In this paper, a comprehensive procedure for properly defining the key aspects of the problem is presented and, in particular, the soil characterization in partially saturated conditions of a suitably compacted mixture of sand and finer material, typical of flood embankments of the main river Po tributaries (Italy), is reported. The laboratory results have then been considered for modelling the embankment performance under transient seepage and following a set of possible hydrometric peaks. The outcome of the present contribution may provide meaningful geotechnical insights, for practitioners and researchers, in the flood risk assessment of river embankments.

1. Introduction

Riverbanks are passive defense works, consisting of earthen structures built along the edges of a stream or river channel to prevent flooding of the adjacent land. In recent years, the risk assessment of river embankments has received great attention as consequence of the considerable socio-economic damages caused by flooding. Since 2000, floods in Europe have caused at least 700 deaths, the evacuation of about half a million people, and at least 25 billion euro in insured economic losses [1]. The economic impact of climate-related events varies considerably across countries. In absolute terms, the highest economic losses in the period 1980–2019 were registered in Germany, followed by Italy, then France [2].
Nevertheless, investments in earth retaining structures are relatively limited compared to other hydraulic engineering works, such as water regulation and canalization. In many countries, including Italy, minor embankments are not even subjected to any formal legislation or published technical guidelines and this has a severe impact on the performance of levees and safety of territories [3].
The design of riverbanks and their individual components depends on many factors, including functionality under different hydraulic loadings, feasibility, but also environmental constraint and availability of the materials. Numerous cross-sectional variations exist, each with the primary objective of reducing flood risk within the surrounding area. The simplest type of section is the homogeneous earthfill, composed of granular and cohesive soil, obtained from site excavation or borrow sources, though riverbank may also present an impermeable core (zoned embankment) or be composite with superstructures, waterside or landside berm and internal structures [4].
Riverbank failure, defined as the inability to prevent the inundation of the area surrounding a watercourse, may occur due to various hydraulic and structural causes, such as overtopping, seepage flow through foundation layer, internal and external erosion, slopes instability, scour and liquefaction [5]. Some possible failure mechanisms are reported in Figure 1. One of the most critical is represented by the overall macro-instability of the slopes triggered by the unfavorable seepage of water through the riverbanks, due to rivers persistently running at unusually high levels. An increasing number of studies have recognized changes in pore water pressures within a riverbank as a fundamental factor in determining conditions of instability and in the triggering of bank failures [6,7,8,9]. Moreover, burrowing animals are acknowledged by agencies responsible for earthen dams and riverbanks to have a significant role in substantial and costly damages [10].
Figure 1. Overview of main riverbank failure mechanisms in earthen structures, modified from Kok et al. [11]: (a) Overtopping; (b) Uplift and piping; (c) Erosion of waterside slope; (d) Macro-instability in landside slope; (e) Macro-instability in waterside slope.
Geosciences 11 00192 g001
The development of high pore water pressures, due to a persistent groundwater flow, actually leads to a decrease in the soil shear resistance within the riverbank that may result in catastrophic slope failure on the landside [12,13]. This type of collapse strongly depends on the retention characteristics of the filling material such as suction variations with time, also due to seasonal variations of the meteorological conditions. In fact, the recurring soil water content variations in the embankment induced by hydrometric fluctuations and rainfalls occurrences may dramatically reduce the suction contribution to shear strength and eventually modify the microstructure of the soil, even creating a cracking state in the riverbank that could form preferential flow channels with general increase of the soil permeability and decrease of the shear strength [14]. As an example, the study of the breach that occurred along the river Secchia, Northern Italy, on 19 January 2014, provides clear evidence of a landside slope failure, caused by a series of simultaneous river stage raising combined to rainfall on the embankment surface and the wildlife activity along fluvial systems [15]. For the failure of the landslide, it is well known that toe drainage by gravelly materials is able to effectively lower the phreatic surface and to prevent water from seeping out of the ‘landslide slope’.
The failure of the riverside is relatively different and could be triggered by external erosion of the toe and foundation of the embankment, primarily due to the action of waves, currents or turbulence; filling material is so removed from the waterside surface, leading to loss of stability and consequently to deep or shallow slope failure. A recurrent phenomenon causing riverside slope failure is also the rapid drawdown, typically occurring when the hydrometric level undergoes a rapid decrease, after a high stage, as the bank material is still near a saturated condition and the confining pressure of the river decreases to zero [8,16,17]. A frequently adopted solution for averting the aforesaid failure generally consists in protecting the riverside slope of the embankment using armourstone, gabions and concrete slabs. In general, different types of interventions, including the realization of components, such as impervious layers, cut-offs barriers, drains, and reinforcement layers within the embankment sections, are indeed considered by management and streambank control agencies to improve flood protection [4].
The identification of the main factors adversely affecting riverbank stability and triggering failure conditions is still a fundamental step for the optimal design and verification of these linear infrastructures, together with the individuation of those critical sectors, where structural improvements are mostly needed. The hydraulic and mechanical behavior of a riverbank during high water events can be generally investigated by a suitable combination of transient seepage and stability analyses, taking into account appropriate unsaturated soil geotechnical characteristics. In this framework, the assessment of hydromechanical parameters of the soil constituting the body of the embankment and foundation in partial and total saturated conditions is necessary in order to carry out proper predictive analyses of the collapse mechanism.
This paper describes a simple procedure for experimentally estimating optimal soil properties for riverbanks and their implementation in numerical analyses. The study case and materials are selected as representative for the riverbank systems of the alpine and Apennines tributaries of river Po (generally 5–10 m high above the ground level), which recently experienced various sudden overall collapses (Figure 2). Results hereafter discussed, besides constitutes a preliminary benchmark for the design of physical models that, in further studies, will be tested with the final aim to develop diagnostic and operational tools for the assessment of river embankments resistance to flood waves and support local governments to draw their resilience action plans.

2. Materials and Methods

2.1. Case Study

The geometry considered in present study has been defined as suitable for replicating a typical failure for the embankments of tributaries of the Po river and concurrently reproducible in scaled physical models. The case study is thus referred to a simplified geometry (sketched in Figure 3) where the riverside and landside are equally sloped (45°); the height of the embankment, which has a simple trapezoidal shape, is 7.5 m above the surrounding level and the crown is 3.0 m wide.
The embankments of tributaries of river Po are prevalently constituted by a heterogeneous mixture of sands and silt, sometimes clayey soils in the above ground part, while the subsoil frequently consists of clayey and silty deposits of floodplain environment. Similarly, the soil here selected for the earthfill is constituted by a compacted mixture of 70% Ticino sand (TS) and 30% Pontida clay (PON), while a foundation characterized by a homogeneous consolidated layer of Pontida clay is taken as reference.
The whole model is supposed to be contained in a rigid box and this leads to peculiar boundary conditions for the foundation layer, which will be detailed in Section 4.1.1.
Particular attention will be devoted to riverside slope instability due to rapid drawdown after high water stages and to the landside instability, due to a consistent saturation of the embankment body.

2.2. Soil Physical Properties

Ticino sand (TS) is a well-known Italian sand which has been subjected to intensive conventional and advanced laboratory tests [18,19,20,21,22]. It is a uniform coarse to medium sand made of angular to sub rounded particles and composed of 30% quartz, 65% feldspar and 5% mica [18,19,20,21,22,23]. Pontida Clay (PON) is a low plasticity kaolinitic clayey silt obtained from a quarry of fine material located in Pontida (Italy), deposited in a post-glacial lake environment. X-ray diffraction tests indicate the following mineralogical composition: 25–30% illite, 20–25% kaolinite, 20–25% quartz, 12% calcite and dolomite, less than 10% feldspar, and less than 5% chlorite.
The grain size distributions for each single component (TS and PON) and the considered mixture (TS70%-PON30%) are given in Figure 4. Following a preliminary stage of laboratory investigations, soil index and physical main properties have been determined and are listed in Table 1.

2.3. Specimen Preparation and Initial Condition

Soils commonly used as embankment fill are compacted to a dense state to obtain satisfactory engineering properties such as shear strength and/or permeability. The degree of compaction and the molding water content needed to achieve the required compaction degree can be determined through standard laboratory tests. Above all, the optimum water content and maximum dry unit weight values of a soil can be determined under standard Proctor energy (SPE) and modified Proctor energy (MPE), which represent a quite reproducible compaction procedure and typical for embankments and retaining structures. The SPE allows to obtain a degree of compaction substantially lower than the modified maximum dry unit weight. Since more energy is applied for compaction using MPE, the soil particles are more closely packed and the optimum moisture content is lower. Higher energy results in greater shear strength, lower air voids and decreased permeability. Here, the modified Proctor compaction test has been performed on TS70%-PON30% following ASTM standard [24] using an automatic compactor. The specimen properties so obtained are reported in Table 2.
Compacted soils used in earth structures are often in unsaturated conditions. Since the Modified Proctor compaction test reproduces the staged construction of earth embankments that is expected to be in unsaturated conditions, thus, immediately after this test the matric suction was measured in order to check the initial conditions (Table 2).
After instrument saturation, the porous stone of a small-tip tensiometer (Figure 5a) was coated with a slurry of Pontida clay, to provide adhesion between the ceramic cup and the soil in which it was inserted. Then, with the help of a screw of the same diameter of the porous cup, a hole was created into the soil contained into the Proctor mold. The bottom of the hole laid at a distance of 5 cm from the surface of the material, then, when the porous cup was finally inserted into the soil, the superficial and disturbed layer was removed and the measurement returned a suction value that can be assumed representative of the entire compacted material contained into the mold. When the hole was excavated and the porous cup inserted, the sample and the small-tip tensiometer were hermetically covered, to avoid any input of air that would compromise the accuracy of the measurements. Considering the grain size distributions involved and the type of the instrument used, the equilibrium was reached in few hours within 100 and 200 min. The tests have been carried out with two small-tip tensiometers to verify the reliability of the measurements. At the equilibrium, the two instruments gave two overlapping trends of the suction values for all the specimens, as shown in Figure 5b. The measured suction values are in general low, ranging between 4.5 kPa and 8 kPa, mainly due to high percentage of TS in the mixture.

3. Soil Hydro-Mechanical Characterization

3.1. TS70%-PON30%

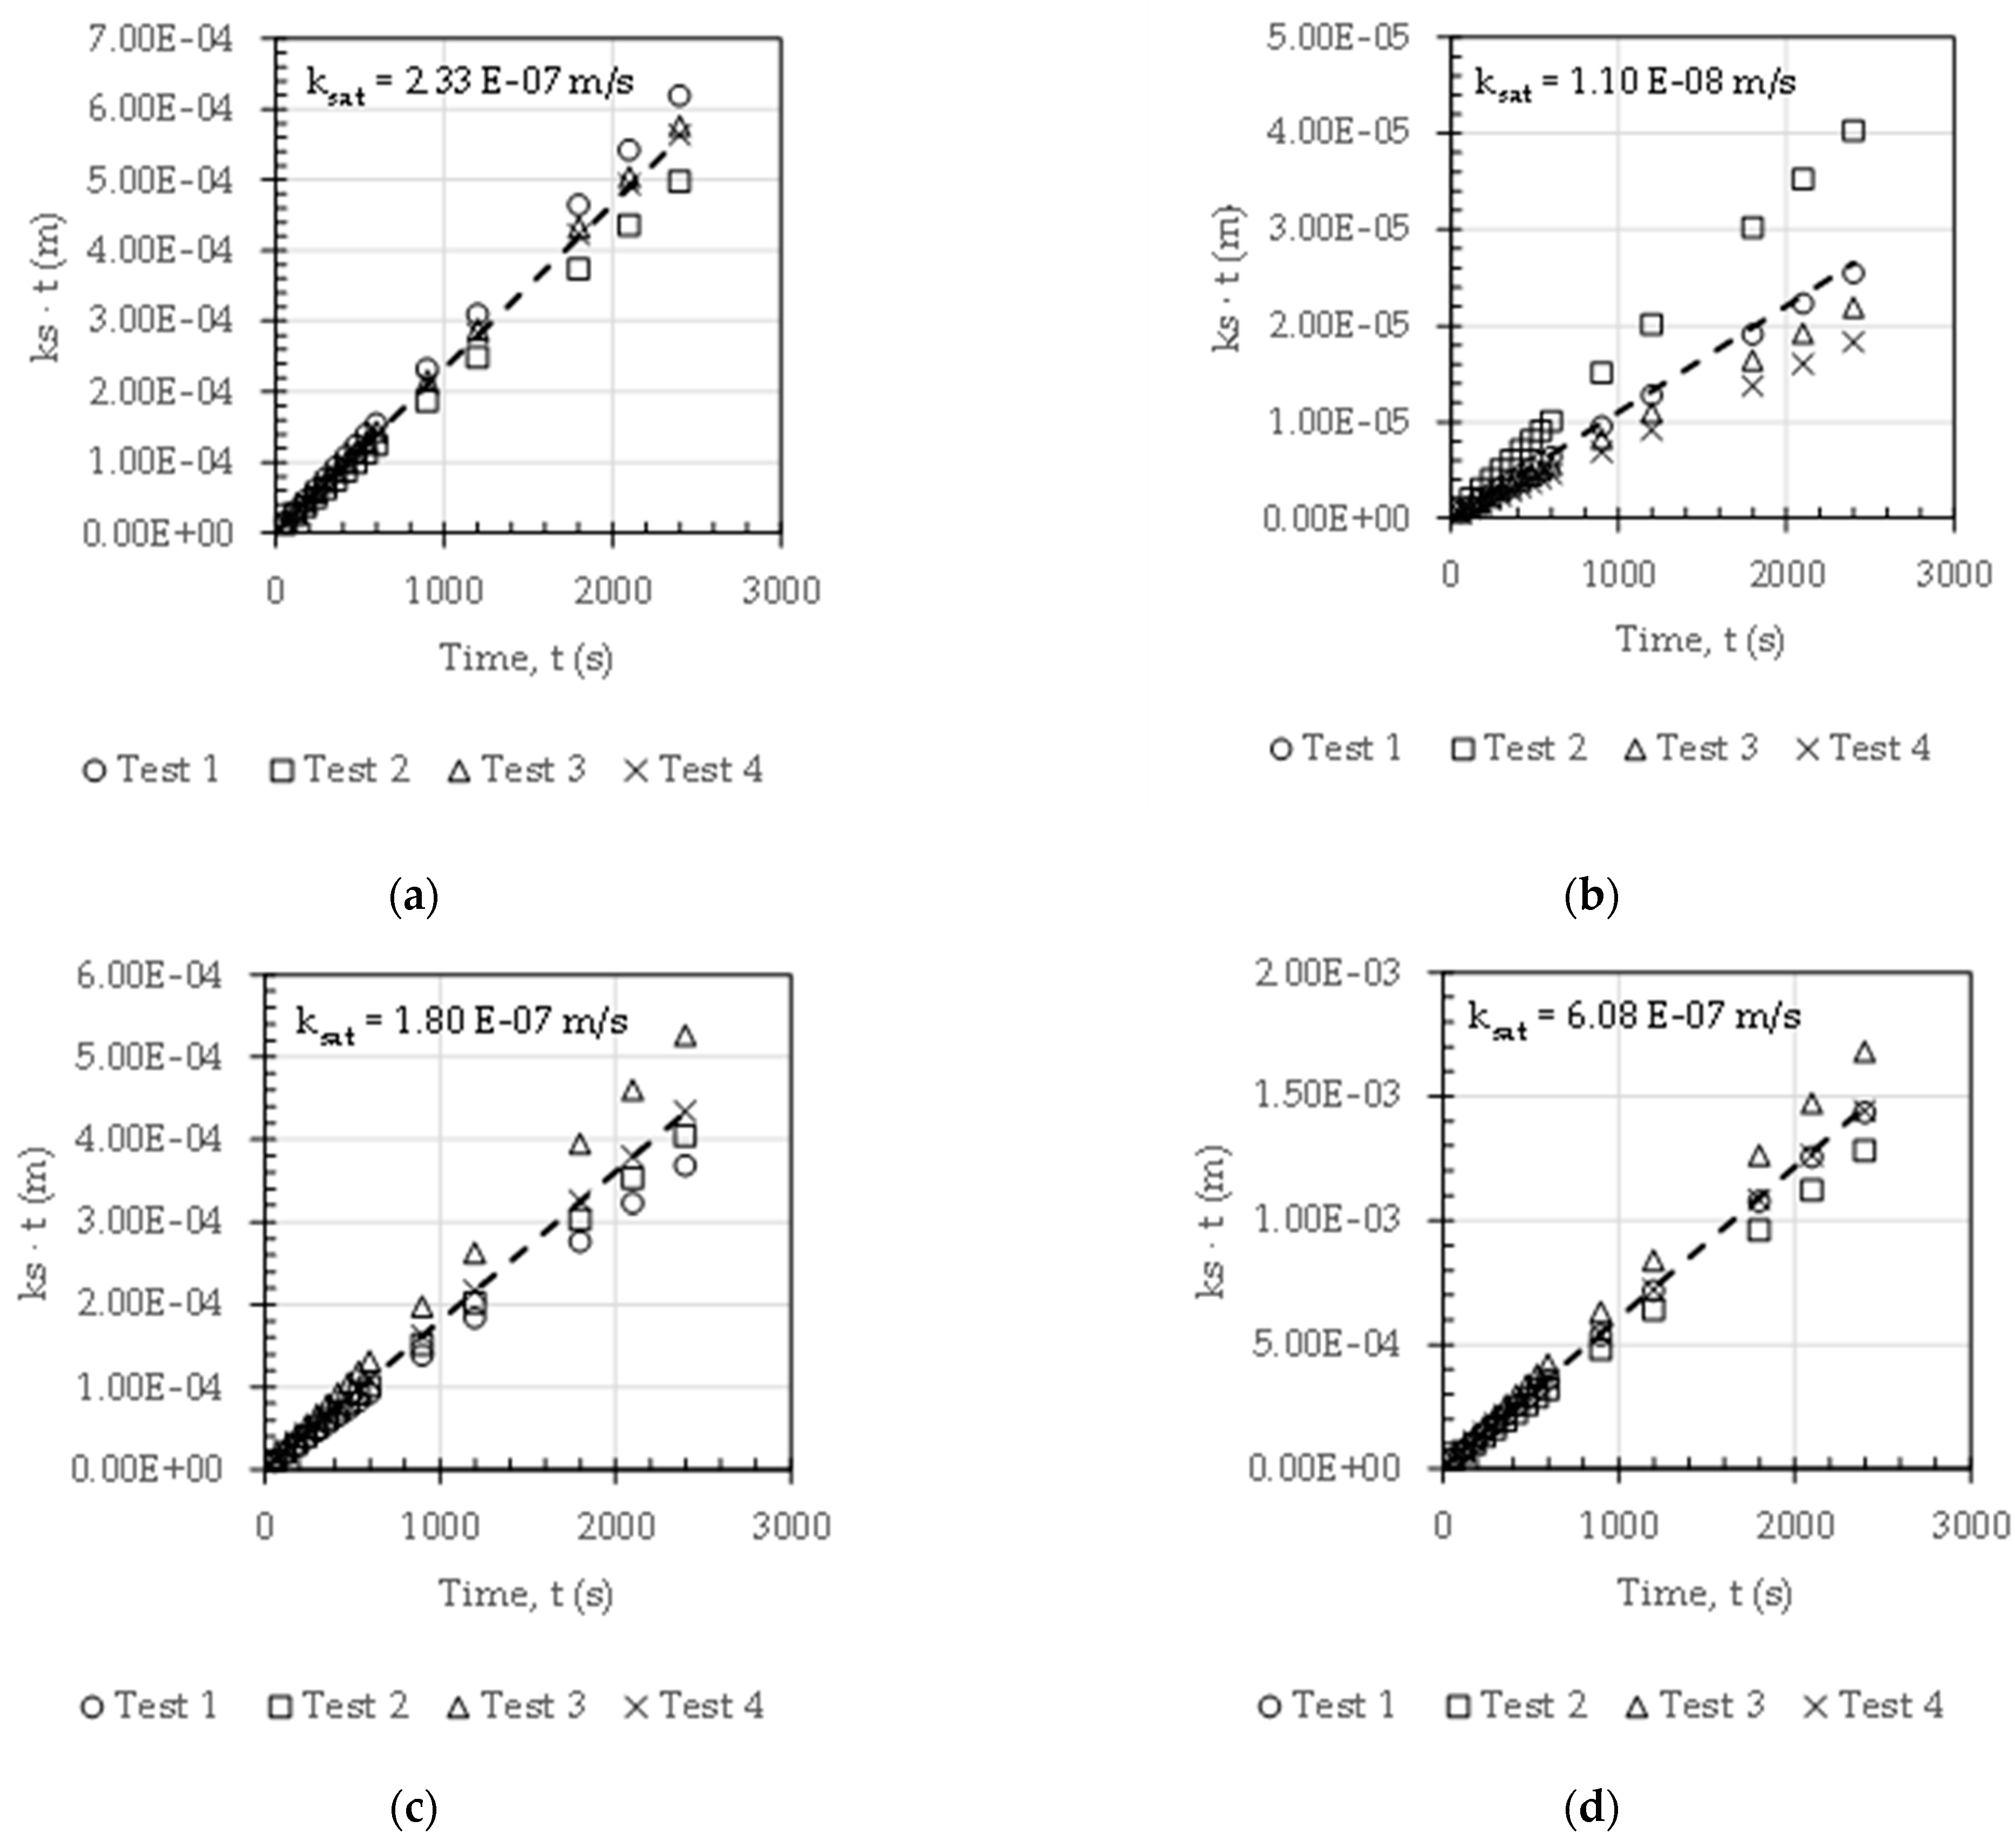
3.1.1. Saturated Permeability from Permeameter Test

The saturated permeability was determined through a constant head test in a permeameter by measuring the volumes of water exchanged by the saturated specimen. This test relies on the Darcy’s law [25], reported in Equation (1):
∆V/(i∙A) = ksat ∙ ∆t
where ksat is the saturated permeability, A is the cross-section area of the specimen, ∆V is the volume of water that flowed through the specimen in the time interval ∆t, and i is the hydraulic gradient. The volume ∆V is equal to the average of the volume of water flowing inside and outside of the specimen for each time step.
The test was performed on saturated soil specimens using the setup presented in [26]. The equipment is composed of a permeameter in which the sample is placed, two graduated burettes, two water reservoirs, two air pressure regulators and a pressure transducer. Two porous plates (previously saturated) are placed on the top and bottom of the specimen, connecting the soil water to the drainage grooves machined in the sealing acrylic caps. Two O-rings are used to seal the caps to prevent any leakage of water. For the same reason, the acrylic caps are tied together with a well tightened screw system. Finally, filter papers for sandy soils are placed on top and bottom of the specimen to avoid the blockage of the porous plates.
The soil specimen was taken from the Proctor mold immediately after suction measurements were carried out. The specimen is contained in a cylindrical steel ring 7.21 cm in diameter and 6.08 cm in height (total volume of about 248.7 cm3). The saturation is obtained by flushing distilled and deaerated water into the specimen. Then, a small and constant pressure head gradient (5 kPa between bottom and top) is applied to the specimens to induce a water flow in the upward direction. The saturation process is controlled by continuously monitoring the volumes of water coming in and out of the specimen; it is assumed that the saturation process is complete when a stationary condition is reached, and the incoming and outgoing flow rates become equal [26]. In order to quantify ksat, the variable E’ has been plotted against the time (Figure 6), with E’ defined as the volume of water discharge per unit bulk cross sectional area and hydraulic gradient (Equation (2) [25]):
E’ =∆V/(i∙A) = ksat ∙ t
where ksat is equal to the slope of the linear regression in the t–E’ space.
Since this type of test could be affected by random errors, due to the operator’s readiness during the readings from two burettes at a time, four measurements have been made for each of the four compacted specimens, as reported in Figure 6.
The values determined in permeameter evidence a strong variability in results, despite of similar porosities. Some dispersion can be surely related to heterogeneity that can occur during the compaction among all the sampled specimens. The saturated permeability values determined for each specimen of TS70%-PON30% mixture are reported in Table 3, with the mean logarithmic (of base 10) value equal to 1.29 × 10⁻⁷ m/s.

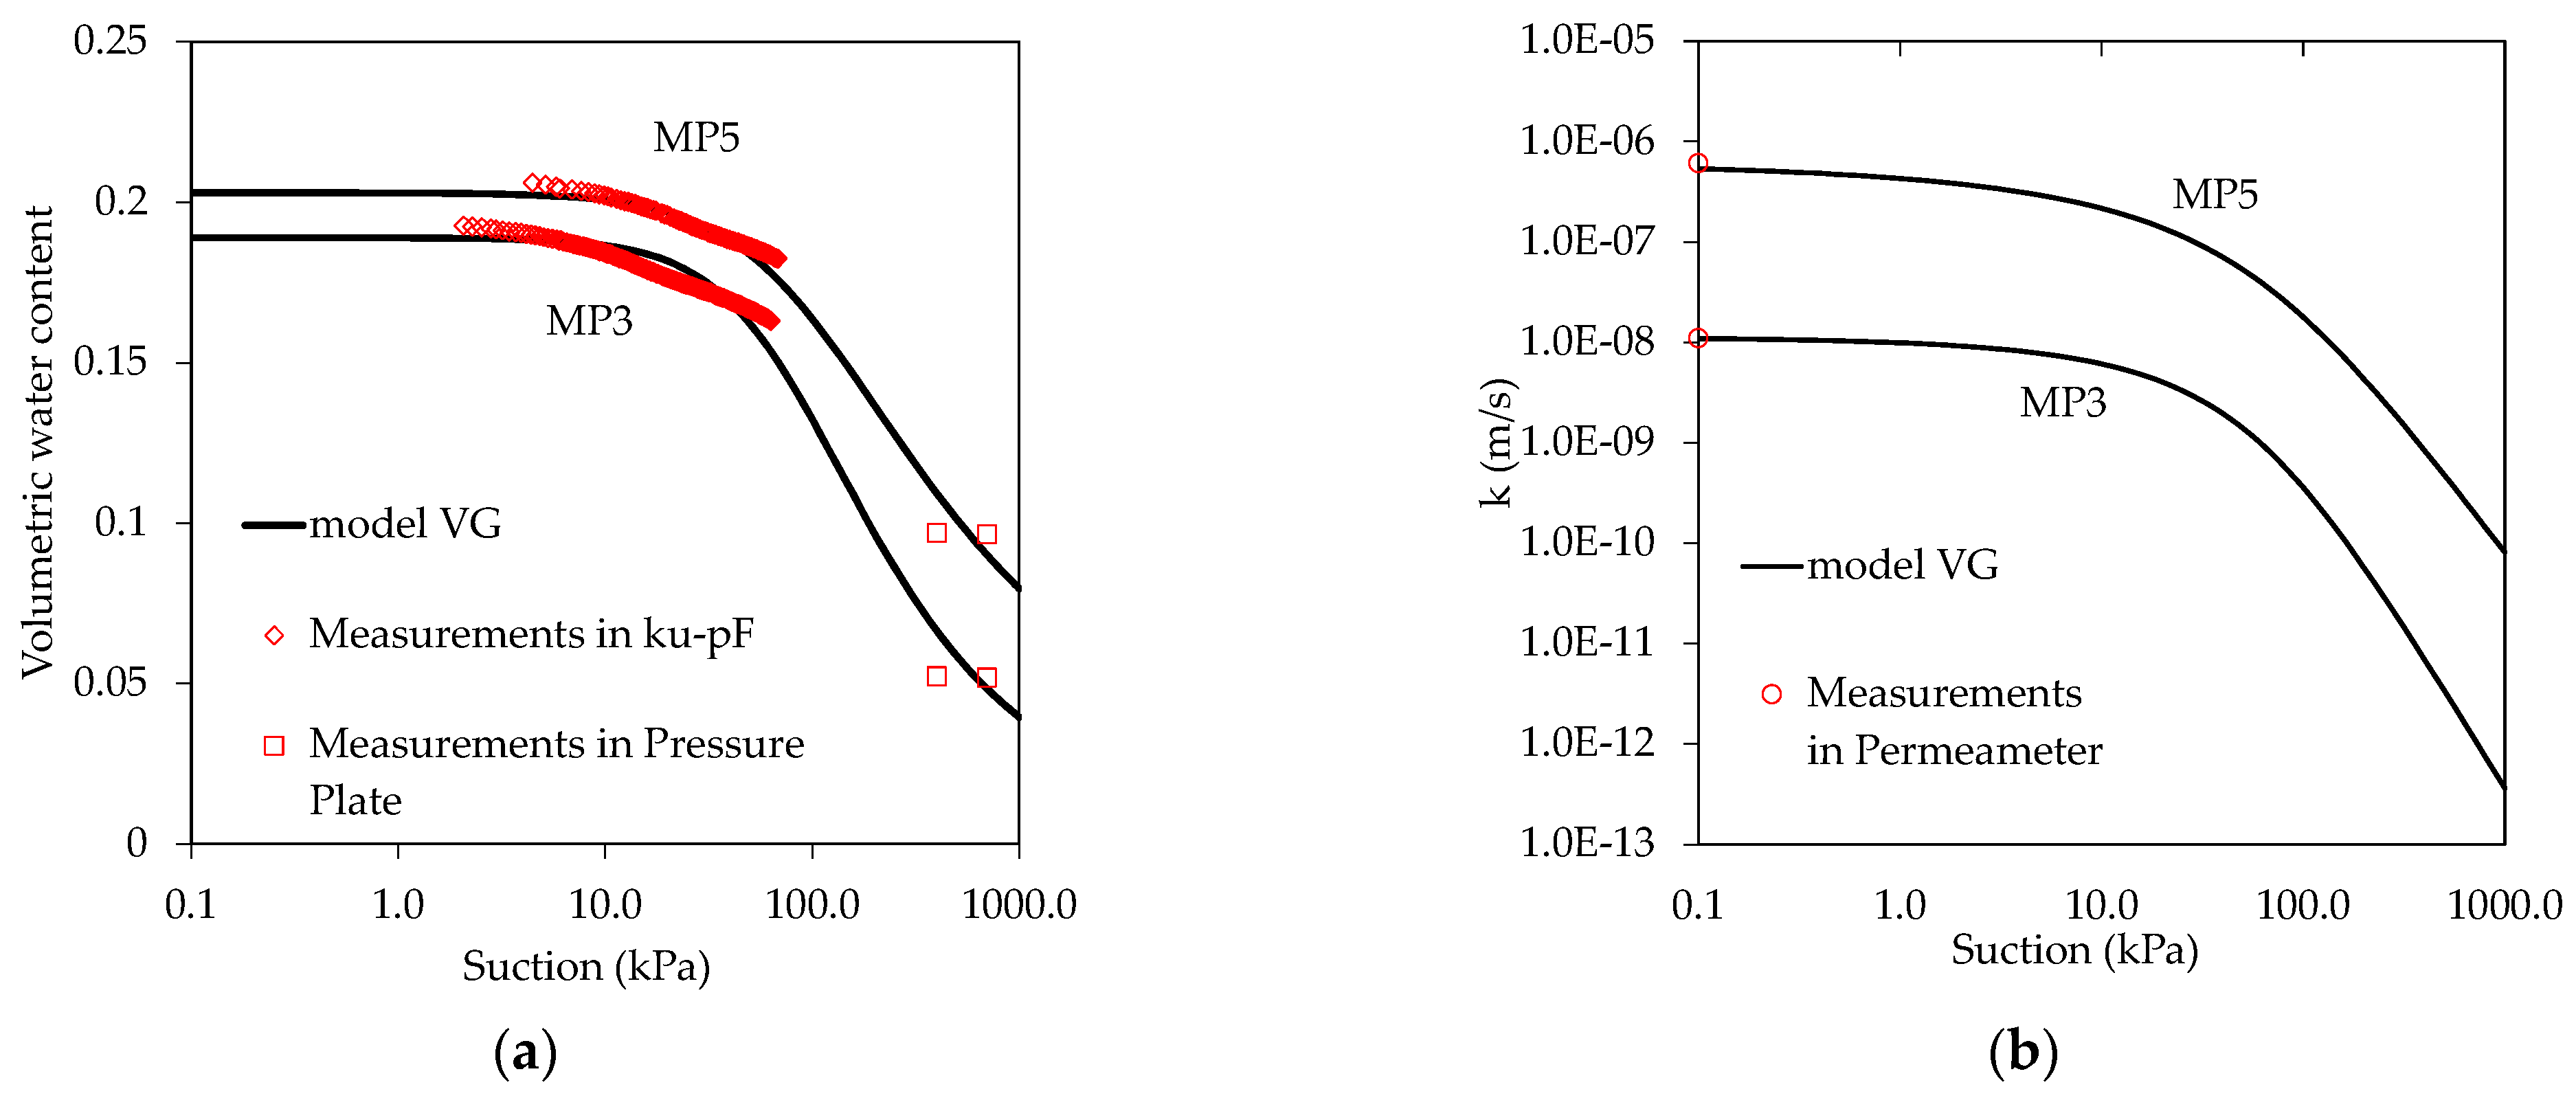
3.1.2. Soil Water Retention Curve (SWRC) and Hydraulic Conductivity Function (HCF)

In this study, the device described by [26] was used to identify the SWRC of the mixture along the main drying branch (Figure 7).
A commercial apparatus (ku-pF by Umwelt-Geräte-Technik GmbH) developed for performing evaporation tests according to the simplified procedure of [27] was adopted. After completely saturating the specimen in the permeameter, it was mounted in the ku-pF apparatus (Figure 7a) for carrying out the evaporation test. The specimen has been enclosed in a metallic ring which includes two holes to house the tensiometers installed 3 cm apart (respectively 1.5 and 4.5 cm from the top). Each pair of pressure sensors is connected to a conditioning unit arranged upon each sample holder (Figure 7b) that is fitted with an electronic assembly that digitalizes the tensiometer readings at selected intervals and sends them to the data logger via a two-wire line. The connection to the data logger takes place through contacts in the support rods on the rotating carrier.
The tensiometers were saturated before each test and the calibration checked. Once calibrated, the tensiometers were installed in the holes of the saturated specimen, previously made with a special guide. The material resulting from the drilling was kept aside, weighted, and then put into the stove for the evaluation of water content. Then, the specimen enclosed in the ring was placed on a perforated base covered with filter paper while the top was covered with clingfilm and a metal cup. At this point, the specimen was placed on the closed base of the basket of the ku-pF apparatus. The basket was installed in a rotating changer arm and was weighed every 10 min on a precision scale with a resolution of 0.01 g to register variations in water content.
At first, the test was conducted with top clingfilm and top cap still mounted on the specimen to reach the hydrostatic condition inside the specimen. The equilibrium was reached when the difference between the readings of top and bottom tensiometers was 0.3 kPa (the tensiometers are placed 3 cm apart). Then, when the equilibrium is reached, top clingfilm and top cap are removed and weighted. The actual evaporation process began and lasted until the tensiometers reached the cavitation value (about 80 kPa). During the evaporation test, the water content decrease of the sample was measured at set intervals by a digital balance logged into an acquisition system. After the evaporation test, the soil specimen was moved in the Pressure Plate apparatus [28,29] to determine additional experimental points for suction values between 90 kPa and 1 MPa. The results of tests on MP3 and MP5 specimens in the ku-pF apparatus are presented in Figure 8a on the soil water retention plane. In particular, the mean measured matric suction has been coupled to the average water content estimated by the measured variation in the soil weight during the evaporation test. On the same figure the points determined in the Pressure Plate at higher suction are overlapped.
The Mualem–van Genuchten (MVG) model [30,31] is then considered in the interpretation of laboratory data through the software HYDRUS-1D [32], which numerically solves the Richards’ equation using standard Galerkin-type linear finite element schemes. HYDRUS-1D is able to simulate the water movement in one-dimensional variably saturated media.
The relationship between the volumetric water content (θ) and the matric suction (s) in the MVG model is here described by Equation (3) [31], the relationship between the effective degree of saturation (Se) (Equation (4) [31]), and the hydraulic conductivity (k) is described by Equation (5) [30]:
θ = θ r + θ sat θ r · 1 1 + α · s n v m
S e = θ θ r θ sat θ r
k = k sat · S e l · 1 1 S s 1 / m m 2
where θr is the residual volumetric water content and θsat represents the volumetric water content at saturation; α, nv and l are fitting parameters of the models while m = 1 − 1/nv; ksat is the saturated permeability and Se is the effective degree of saturation.
The model parameters were estimated via inverse analysis of the experimental measurements by means HYDRUS-1D [32]. According to Nicotera et al. [26], application of the inverse method consists of a numerical analysis simulating a lab test, and of determination of the values of the model parameters for which differences between observed and simulated flow variables are minimized; the estimated values of the parameters are those that optimize the model response. Therefore, the best-fitting parameters of the MVG model were obtained by means of inverse analysis of the evaporation tests carried out in ku-pF apparatus. The parameter vector associated with the main drying (θd, θsat, α, n, l) was determined using the software HYDRUS-1D [32], in which the objective function used to fit the data was minimized using the Levenberg–Marquardt nonlinear minimization method [33,34]. The initial condition was fixed as the hydrostatic pressure distribution estimated from initial suction measurements. The water flow occurring within the specimen was vertical, with a null flux at the bottom and an upward flux at the upper boundary equal to the weight change in the specimen in the given time range. Data sets and respective weights in the objective function were composed of (i) matric suction measurements at the tensiometers during the monitoring time, with a weight of 1; (ii) the pair (s, θ) obtained from the pressure plate, with a weight of 1; and (iii) the pair (s, θ) corresponding to the AEV, with a weight of 1. The AEV was roughly identified as the point of maximum curvature on the SWRC curve, obtained by coupling the mean measured matric suction to the average water content estimated by the measured variation in the soil weight during the evaporation test.
Suction and water content numerically determined are overlapped to the experimental results in Figure 8a for tests on MP3 and on MP5 specimens. In Figure 8b, the permeability curve is shown where the value of saturated permeability measured is also overlapped. The fitting parameters of the MVG model determined by inverse analyses for each sample are reported in Table 3.
Lastly, it is important to keep in mind that, in this study, the hydraulic hysteresis is neglected and the hydraulic soil behavior has been modelled using a single branch (drying) of the SWRC. According to the literature [34,35], the main wetting branch and the scanning paths are located below the main drying curve on the SWR plane, these are characterized by hydraulic conductivities generally lower than those detected along drying curves. Therefore, neglecting hysteresis could cause errors in the mass flux calculations and soil shear strength determination.

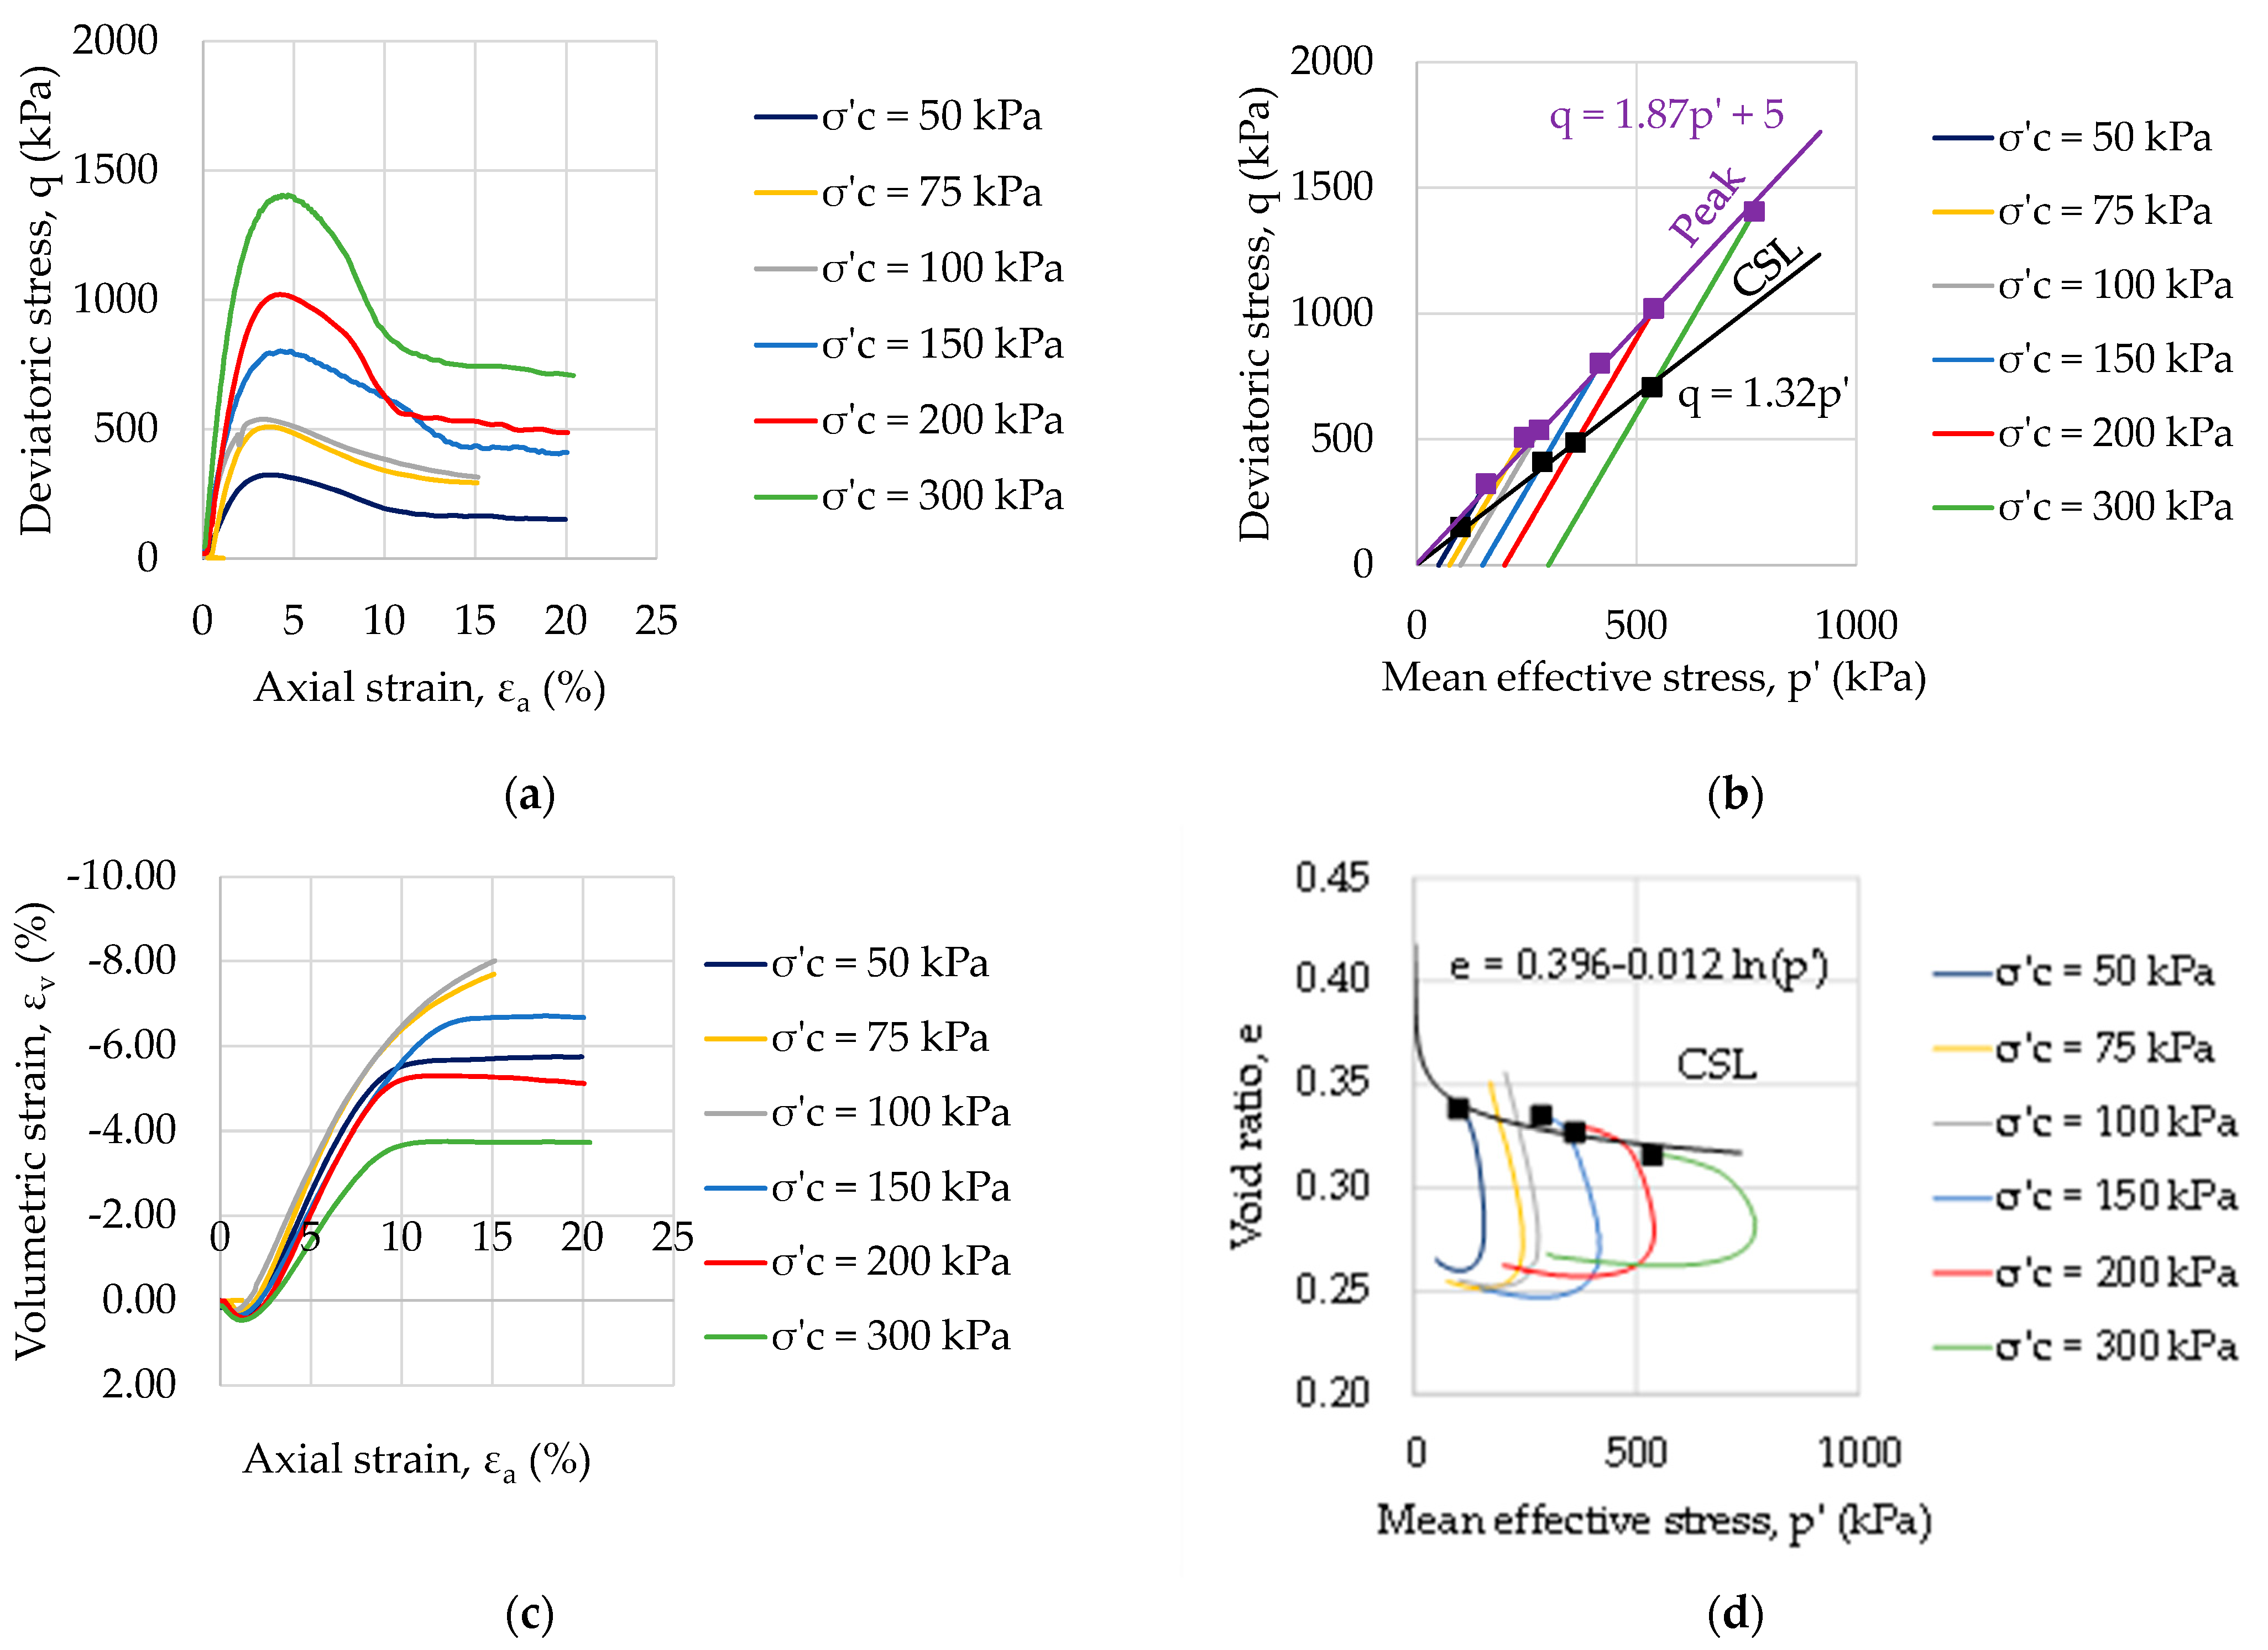
3.1.3. Mechanical Soil Properties at Full Saturation

Monotonic triaxial compression tests were performed to study the stress–strain-strength behavior of the TS70%-PON30% mixture. Six monotonic consolidated drained (CD) triaxial tests were carried out using different confining pressures (σ’c) on TS70%-PON30% specimens with 38 mm diameter and 76 mm height (Table 4). Specimens were compacted at the optimum modified Proctor (MPE). The weighed materials were moistened uniformly and then two modified Proctor compaction tests were done to prepare two sets of three specimens from each Proctor mold.
All monotonic tests were performed in drained conditions (CD) using a strain-controlled compression loading system. The prepared specimens have been saturated by adopting base-top drainage technique in the triaxial apparatus until Skempton’s B-value exceeded 0.98. After achieving full saturation, the specimens were subjected to the predefined confining pressures and then the axial load was applied up to an axial strain of about 20%. The imposed axial displacement rate was 0.05 mm per minute. During the tests, axial stresses, axial strains and volumetric strains were recorded.
Figure 9a,c show the variations of deviatoric stress and volumetric strain versus axial strain for tested material. As expected, the peak deviator stress increases with increasing applied confining pressure and the higher the value of confining pressure, the greater the axial strain corresponding at peak deviator stress. The rapid decrease in deviatoric stress after peak indicates the brittle response of the dense mixture. All specimens showed a dilating trend in their volume change, as evident also in Figure 9d. Only four specimens reached critical state condition (Figure 9a–c). The functions of the critical state line (CSL) in the q-p’ and e-p’ plane are also reported in Figure 9b,d while the peak strength envelope in the q-p’ plane is shown in Figure 9b.
By processing the experimental data from CD triaxial tests, the angle of shearing resistance and cohesion values obtained are 45.5° and 5 kPa in peak condition and 34° at critical state condition, respectively.

3.2. Pontida Clay

Pontida Clay has been extensively used in the past to investigate the effect of temperature on the stress-strain behaviour of the clay skeleton and clay-water system [36,37].
To reproduce the state of a foundation layer deposited in a floodplain environment, a slurry of Pontida Clay was prepared at a water content w = 43%, equal to 1.8 time its limit liquid, (distilled water and dried Pontida clay were mixed under vacuum) and one-dimensionally compressed under a maximum vertical effective stress of 200 kPa.
Saturated permeability of Pontida Clay was derived from an oedometer test at different vertical effective stress as a function of the primary consolidation coefficient cv and the compressibility coefficient mv, according to Terzaghi’s formulation of one-dimensional consolidation. Figure 10a,b show the computed permeability and the void ratio as a function of the applied vertical stress. Given the vertical overburden stress under the levee, ranging from about 100 to 150 kPa, a reference value ksat = 6.67 × 10⁻¹⁰ m/s, relating to last loading test of the oedometer test, has been assumed for simulating the state of the levee foundation layer.
The mechanical properties of PON have been obtained through a series of drained and undrained triaxial tests carried out on both isotropically and anisotropically consolidated samples. The samples were obtained from large specimens, 1-D compressed from a slurry in a consolidometer. At the end of consolidation in the triaxial cell, some samples were normally consolidated, some others had an over consolidation ratio in the range 1.5–16. All the samples reached the critical state (or constant volume conditions). The state of the samples at critical state, evidenced with black squares in the q-p’ (Figure 11a) and e-p’ (Figure 11b) planes, have been interpreted to derive the critical state line (CSL), which has a slope M = 1.33 (i.e., a shearing resistance angle at critical state ϕ’cs = 33°). The critical state conditions are also plotted in Figure 11b in the e-p’ plane and have been interpreted via the logarithmic equation reported in the figure.

4. Numerical Analysis on the Hydraulic Response and Stability Assessment

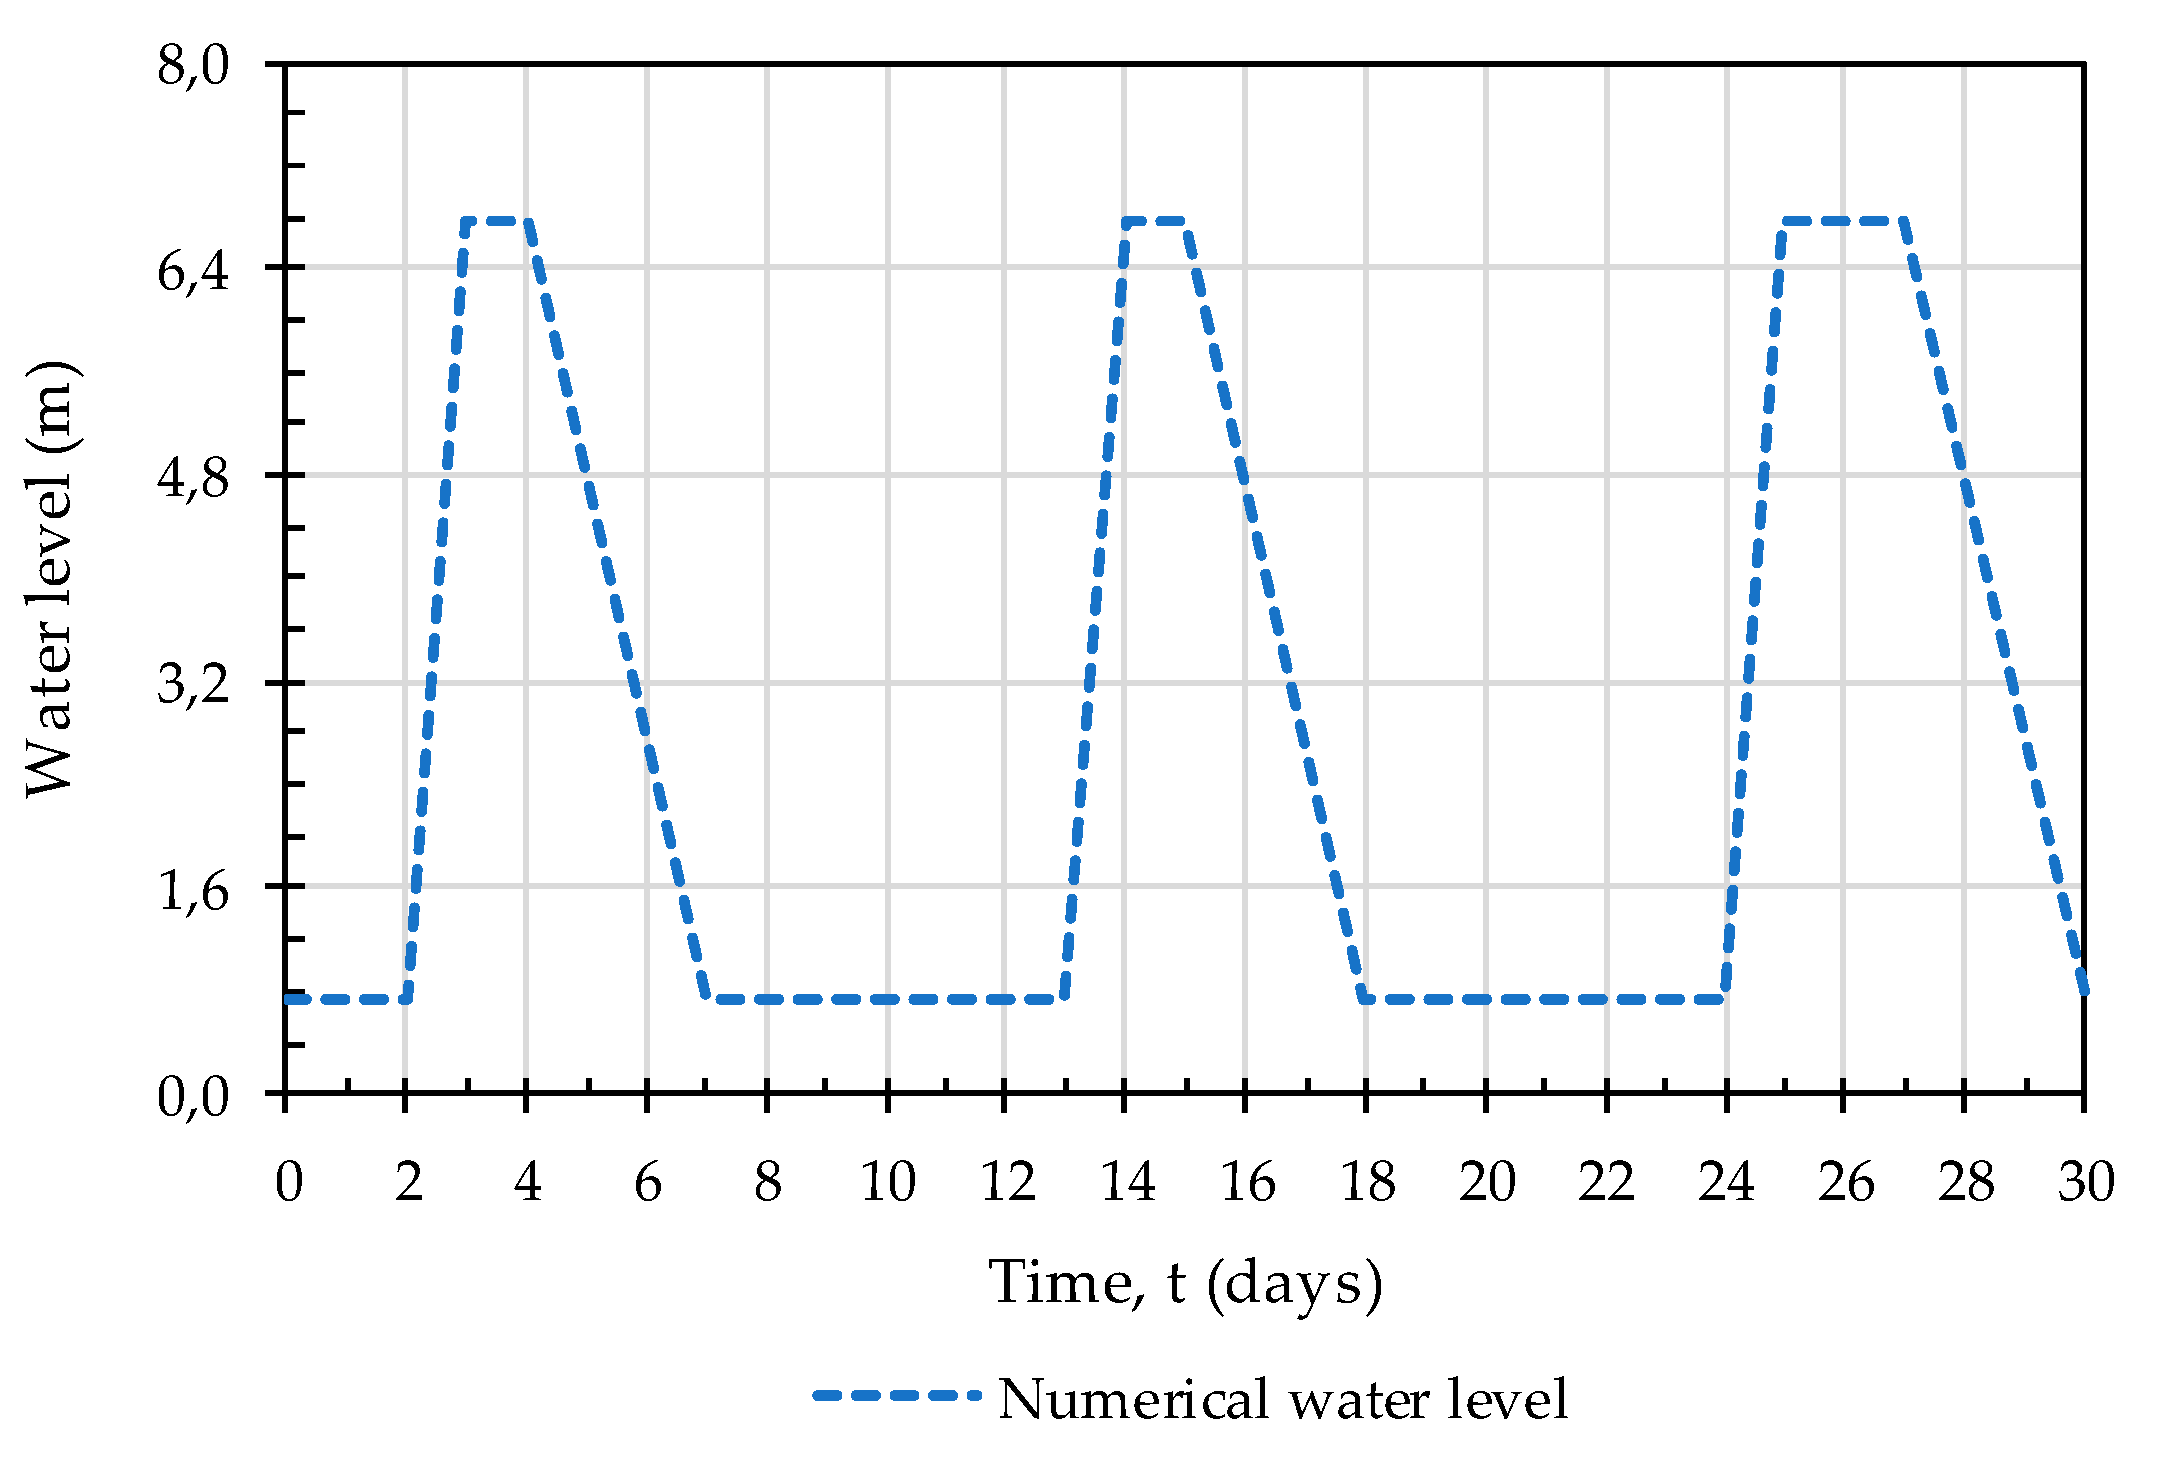
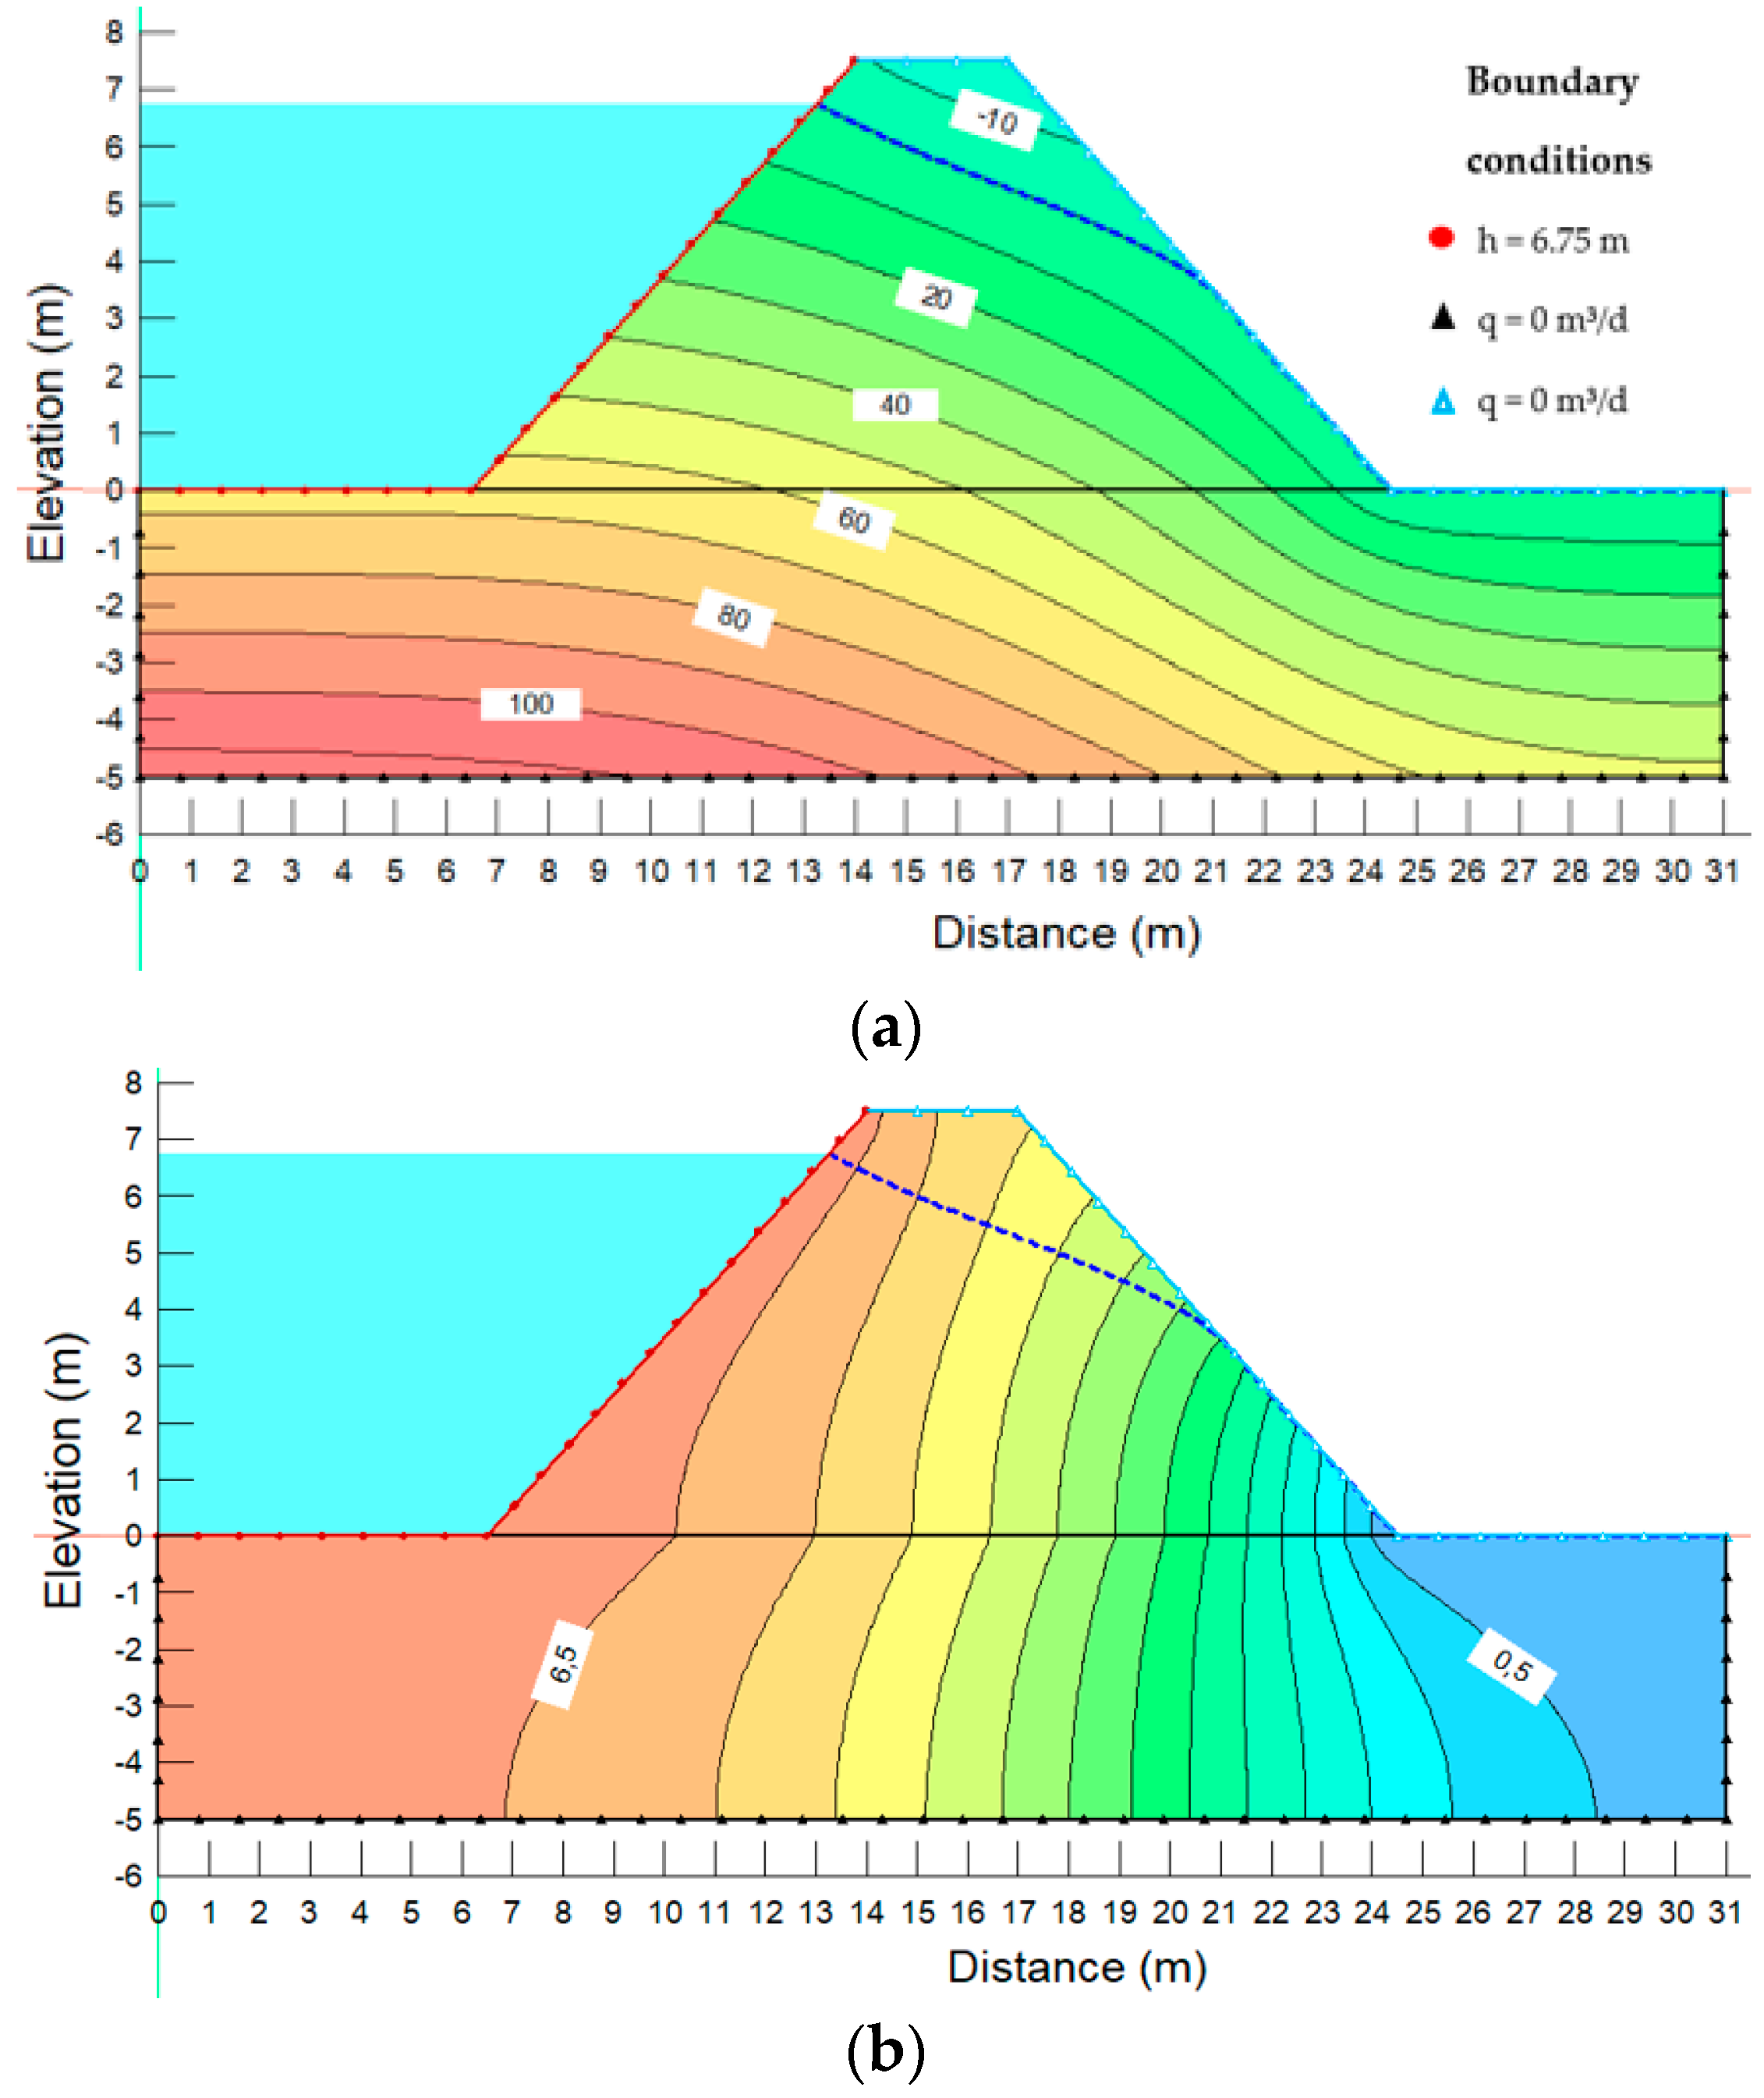
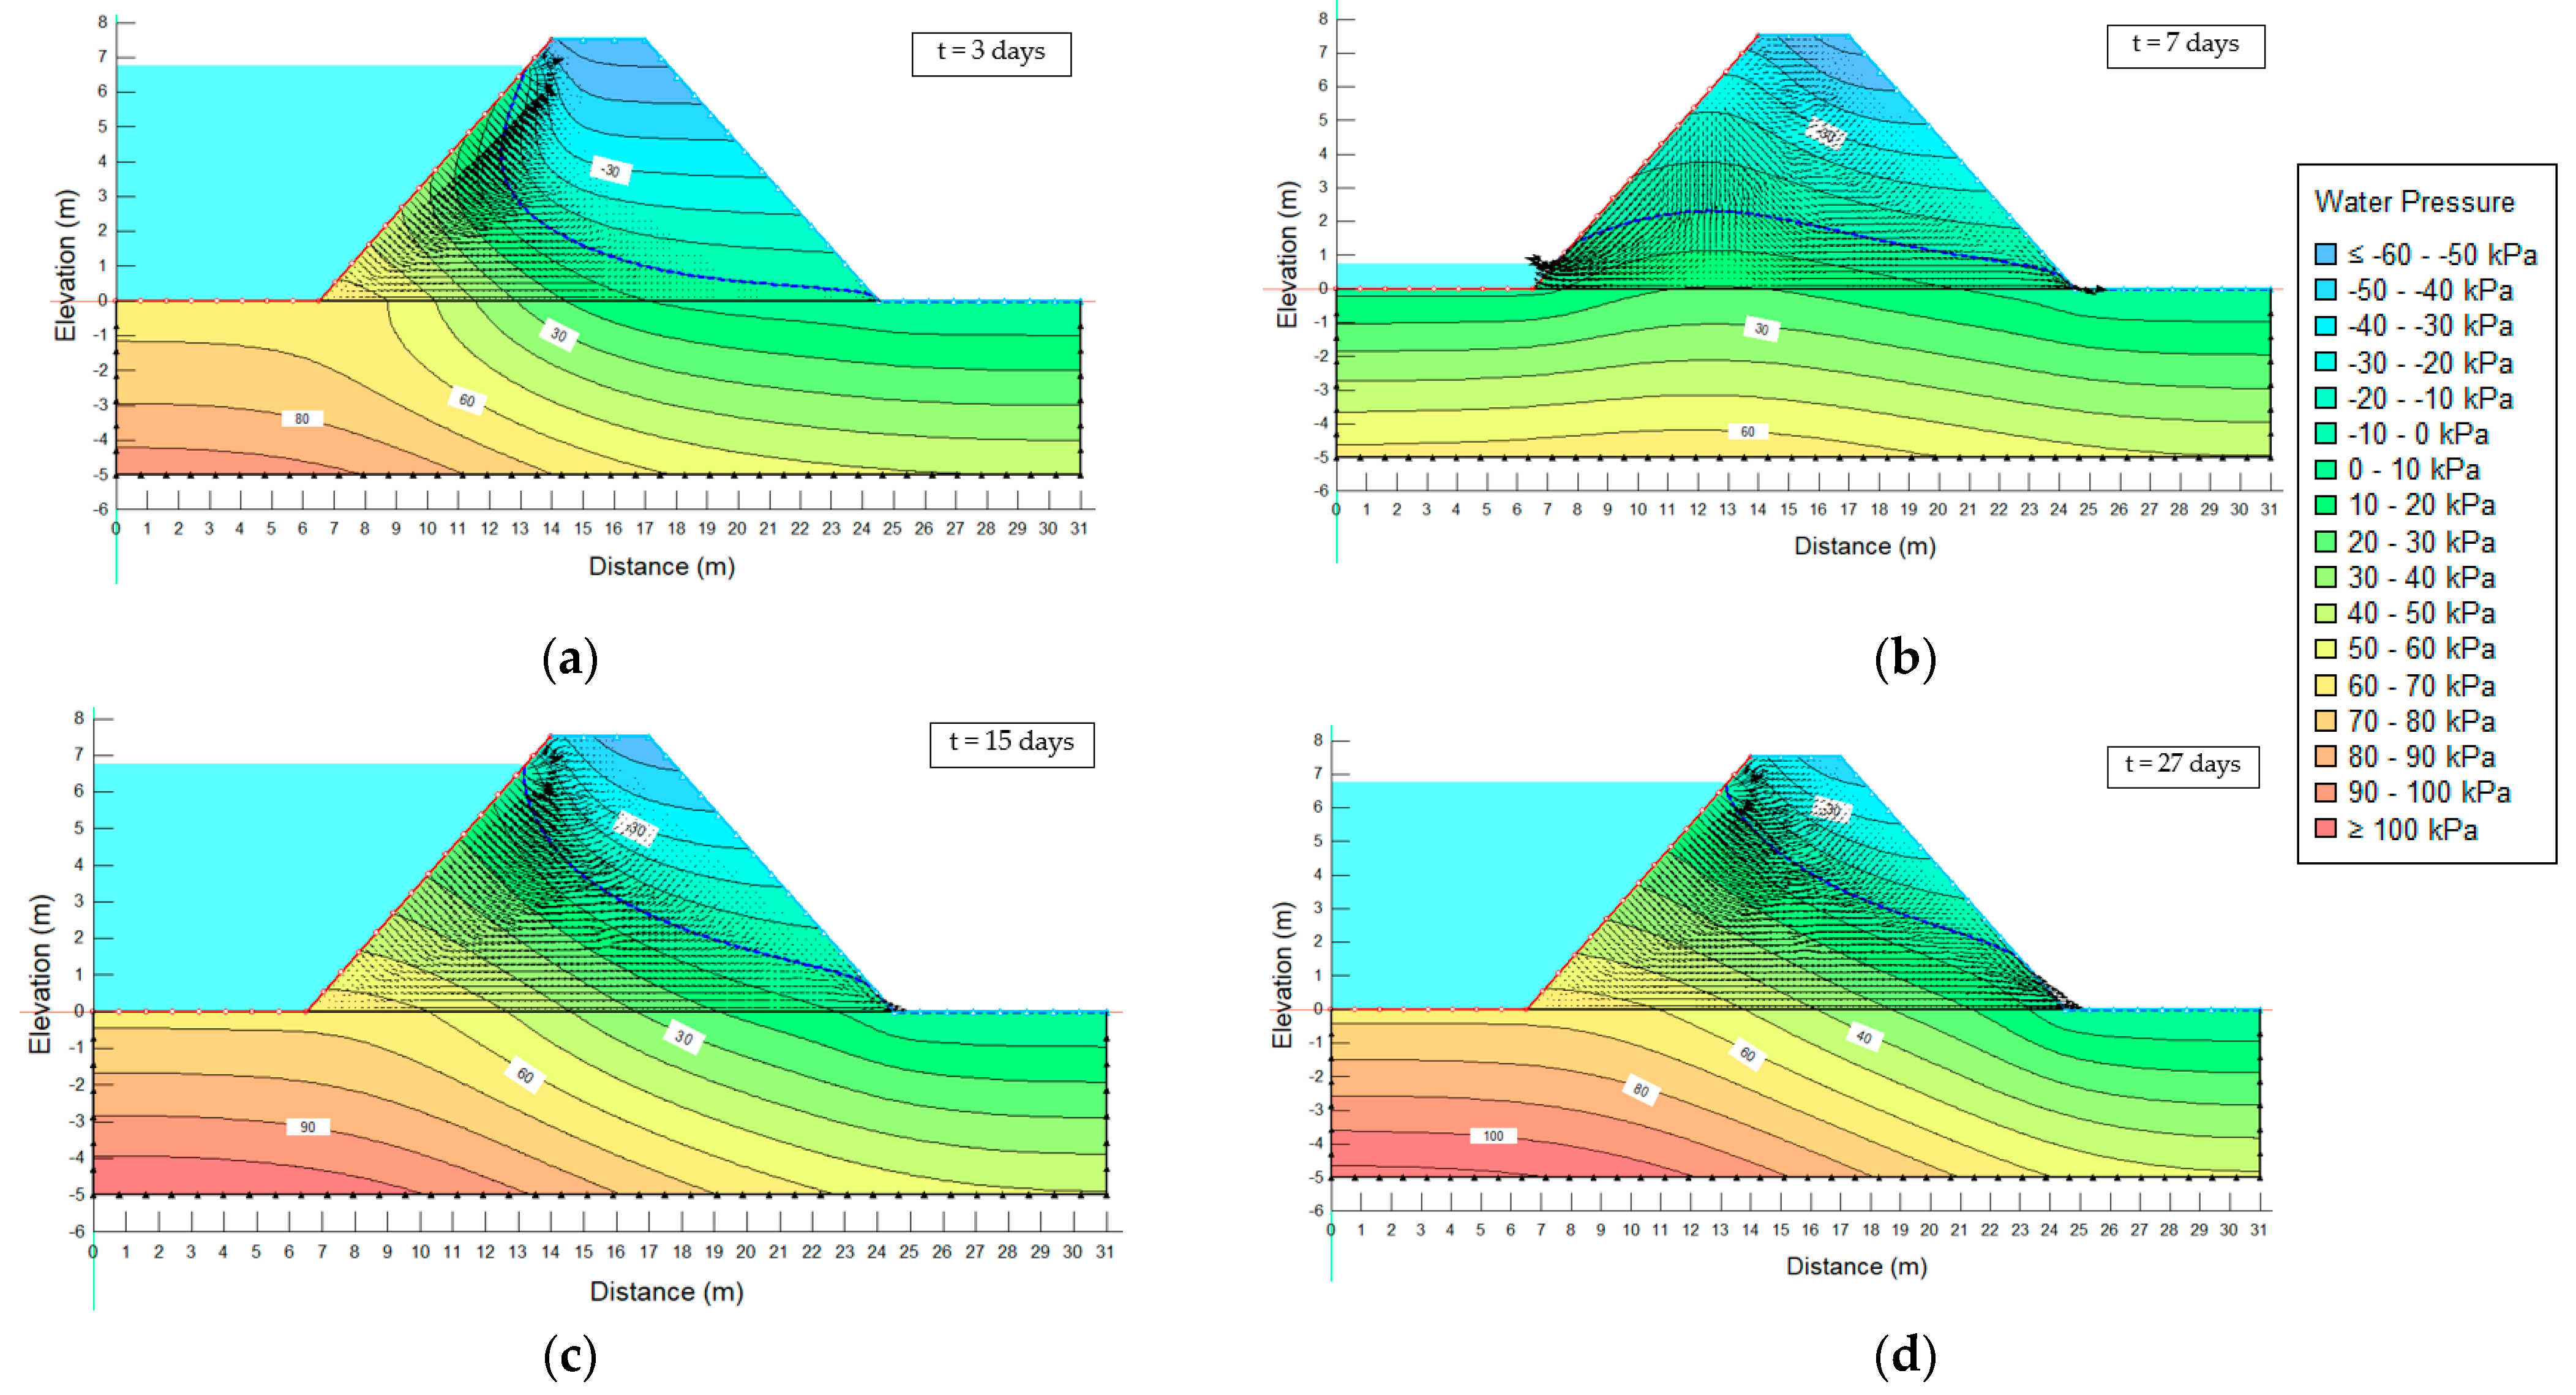
4.1. Seepage Analyses

The finite element software SEEP/W [38], capable of solving complex saturated and unsaturated groundwater flow problems, has been used to perform both steady-state and transient seepage analyses with reference to a bidimensional river embankment model, based on the simplified geometry sketched in Figure 3. The software calculation is formulated on the base of Darcy’s law [25], originally derived for saturated soil. In the case of unsaturated porous media, the hydraulic conductivity is assumed to be a function of volumetric water content and matric suction [39].
The partial differential equation governing two-dimensional transient unsaturated water flow through riverbank is the Richard’s mass conservation law, which states that the difference between the flux entering and leaving an elemental volume at any instant of time is equal to the change in storage of the system [39,40]. As implemented in the code, it is given by (Equation (6) [40]):
x k x h x + y k y h y + Q = θ t
where h is the total hydraulic head, kx and ky represent the hydraulic conductivities in the x and y direction respectively, Q is the sink term, θ is the volumetric water content and t is the time. For the present application, soil permeability has been assumed to be as isotropic. This model assumes that the soil porous medium is rigid under partially saturated conditions (no volume deformations, Equation (6)). However, SEEP/W is able to simulate bidimensional un-coupled consolidation in the fully saturated soil by specifying the coefficient of volume compressibility. When the hydraulic load is applied at soil surface, un-coupled approach could not result rigorous and a fully coupled stress/pore-water pressure analysis might be required. Especially in rapid drawdown phenomena, the un-coupled approach could overestimate pore water pressures respect to fully coupled analysis. This reflects in the prediction of lower safety factor, in favor of safety. Nevertheless, in this study, the coefficient of volume compressibility of mixture is set equal to zero; this hypothesis seems here reasonable due to the predominantly granular texture of the compacted mixture, which is characterized by significant stiffness. Therefore, the differences in terms of positive pore water pressures, and thus factor of safety, computed by the uncoupled approach, adopted here, and by the fully coupled one are expected to be small.
Furthermore, at the present stage of the analysis, soil-atmosphere interaction processes have been neglected in seepage modelling.
Under steady-state conditions, which may be reasonably referred to extended period of stationary river level, the water storage in the model is constant in time, so the right side of the differential Equation (6) reduces to zero.
An unstructured mesh, characterized by an irregular pattern, consisting of 5878 triangular and quadrangular elements, with an approximate element global size of 0.20 m, was adopted for the entire domain as shown in Figure 12. The mesh density was iteratively optimized by reducing the element size until no significant change in pore-water pressure was observed after refinement.
Soil permeability of the foundation layer was considered constant (only saturated conditions) and equal to its saturated value, while the soil forming the embankment was assumed as partially saturated considering the average parameters listed in Table 3 and Equations (3) and (5) as retention and hydraulic functions.

4.1.1. Boundary and Initial Conditions

To simulate a stationary flow through the embankment for a persistent retained high water level, a steady-state seepage analysis was performed assuming a maximum hydrometric height of 6.75 m (90% of the maximum embankment height) on the riverside, with the landside water table located at the ground level. As mentioned, since the model is supposed to be contained in a rigid box, the bottom horizontal, right, and left vertical outlines of the foundation layer were assumed to be impermeable. A no flow condition with a potential seepage face review has been assigned, instead, to the crest of the embankment and the landside slope; this implies that the water flow will remain zero until the pore water pressures computed by the code are not positive, otherwise the boundary condition will be reviewed to zero pressure head.
Concerning transient seepage analysis, the definition of initial condition in terms of suction and pore water pressure represents a crucial, preliminary, aspect. In the present study, a steady-state regime associated to a 0.75 m retained water level upon the riverside ground level and a hydrostatic suction pattern above the phreatic line, is assumed as starting condition. Suction distributions measured on site are generally different from the hydrostatic pattern, e.g., [9], especially during the wet period, nevertheless this hypothesis has been considered admissible for a preliminary model stability evaluation.
With regard to boundary conditions in transient seepage analysis, a variable hydrometric condition was imposed to model river level fluctuations on the surfaces potentially affected by water action. In order to simulate a realistic series of river flood events, data from the sudden collapse occurred on 19 January 2014 on river Secchia (Figure 2a) were taken as reference. In this particular case, the hydrograph recorded from 25 December 2013 to 19 January 2014 was characterized by a rapid series of three hydrometric peaks, which occurred in about one month [41]. Similarly, in the present analysis, a synthetic hydrograph is so characterized by a series of three hydrometric peaks. Starting from a river stage of 0.75 m in the first two days, each high water event reaches a maximum level of 6.75 m, raising in one day, then returning to the minimum water elevation in three days after a day of hydrometric peak persistence. The time between two following events is six days, while the final high-water level lasts for a longer period (two days). The water level was modelled as time-dependent boundary condition, expressed with linear variations of total hydraulic head (Figure 13) with a total elapsed time of 30 days. Moreover, rainfall infiltration fluxes have not been considered to specifically focus on the transient effects of hydrometric variations.

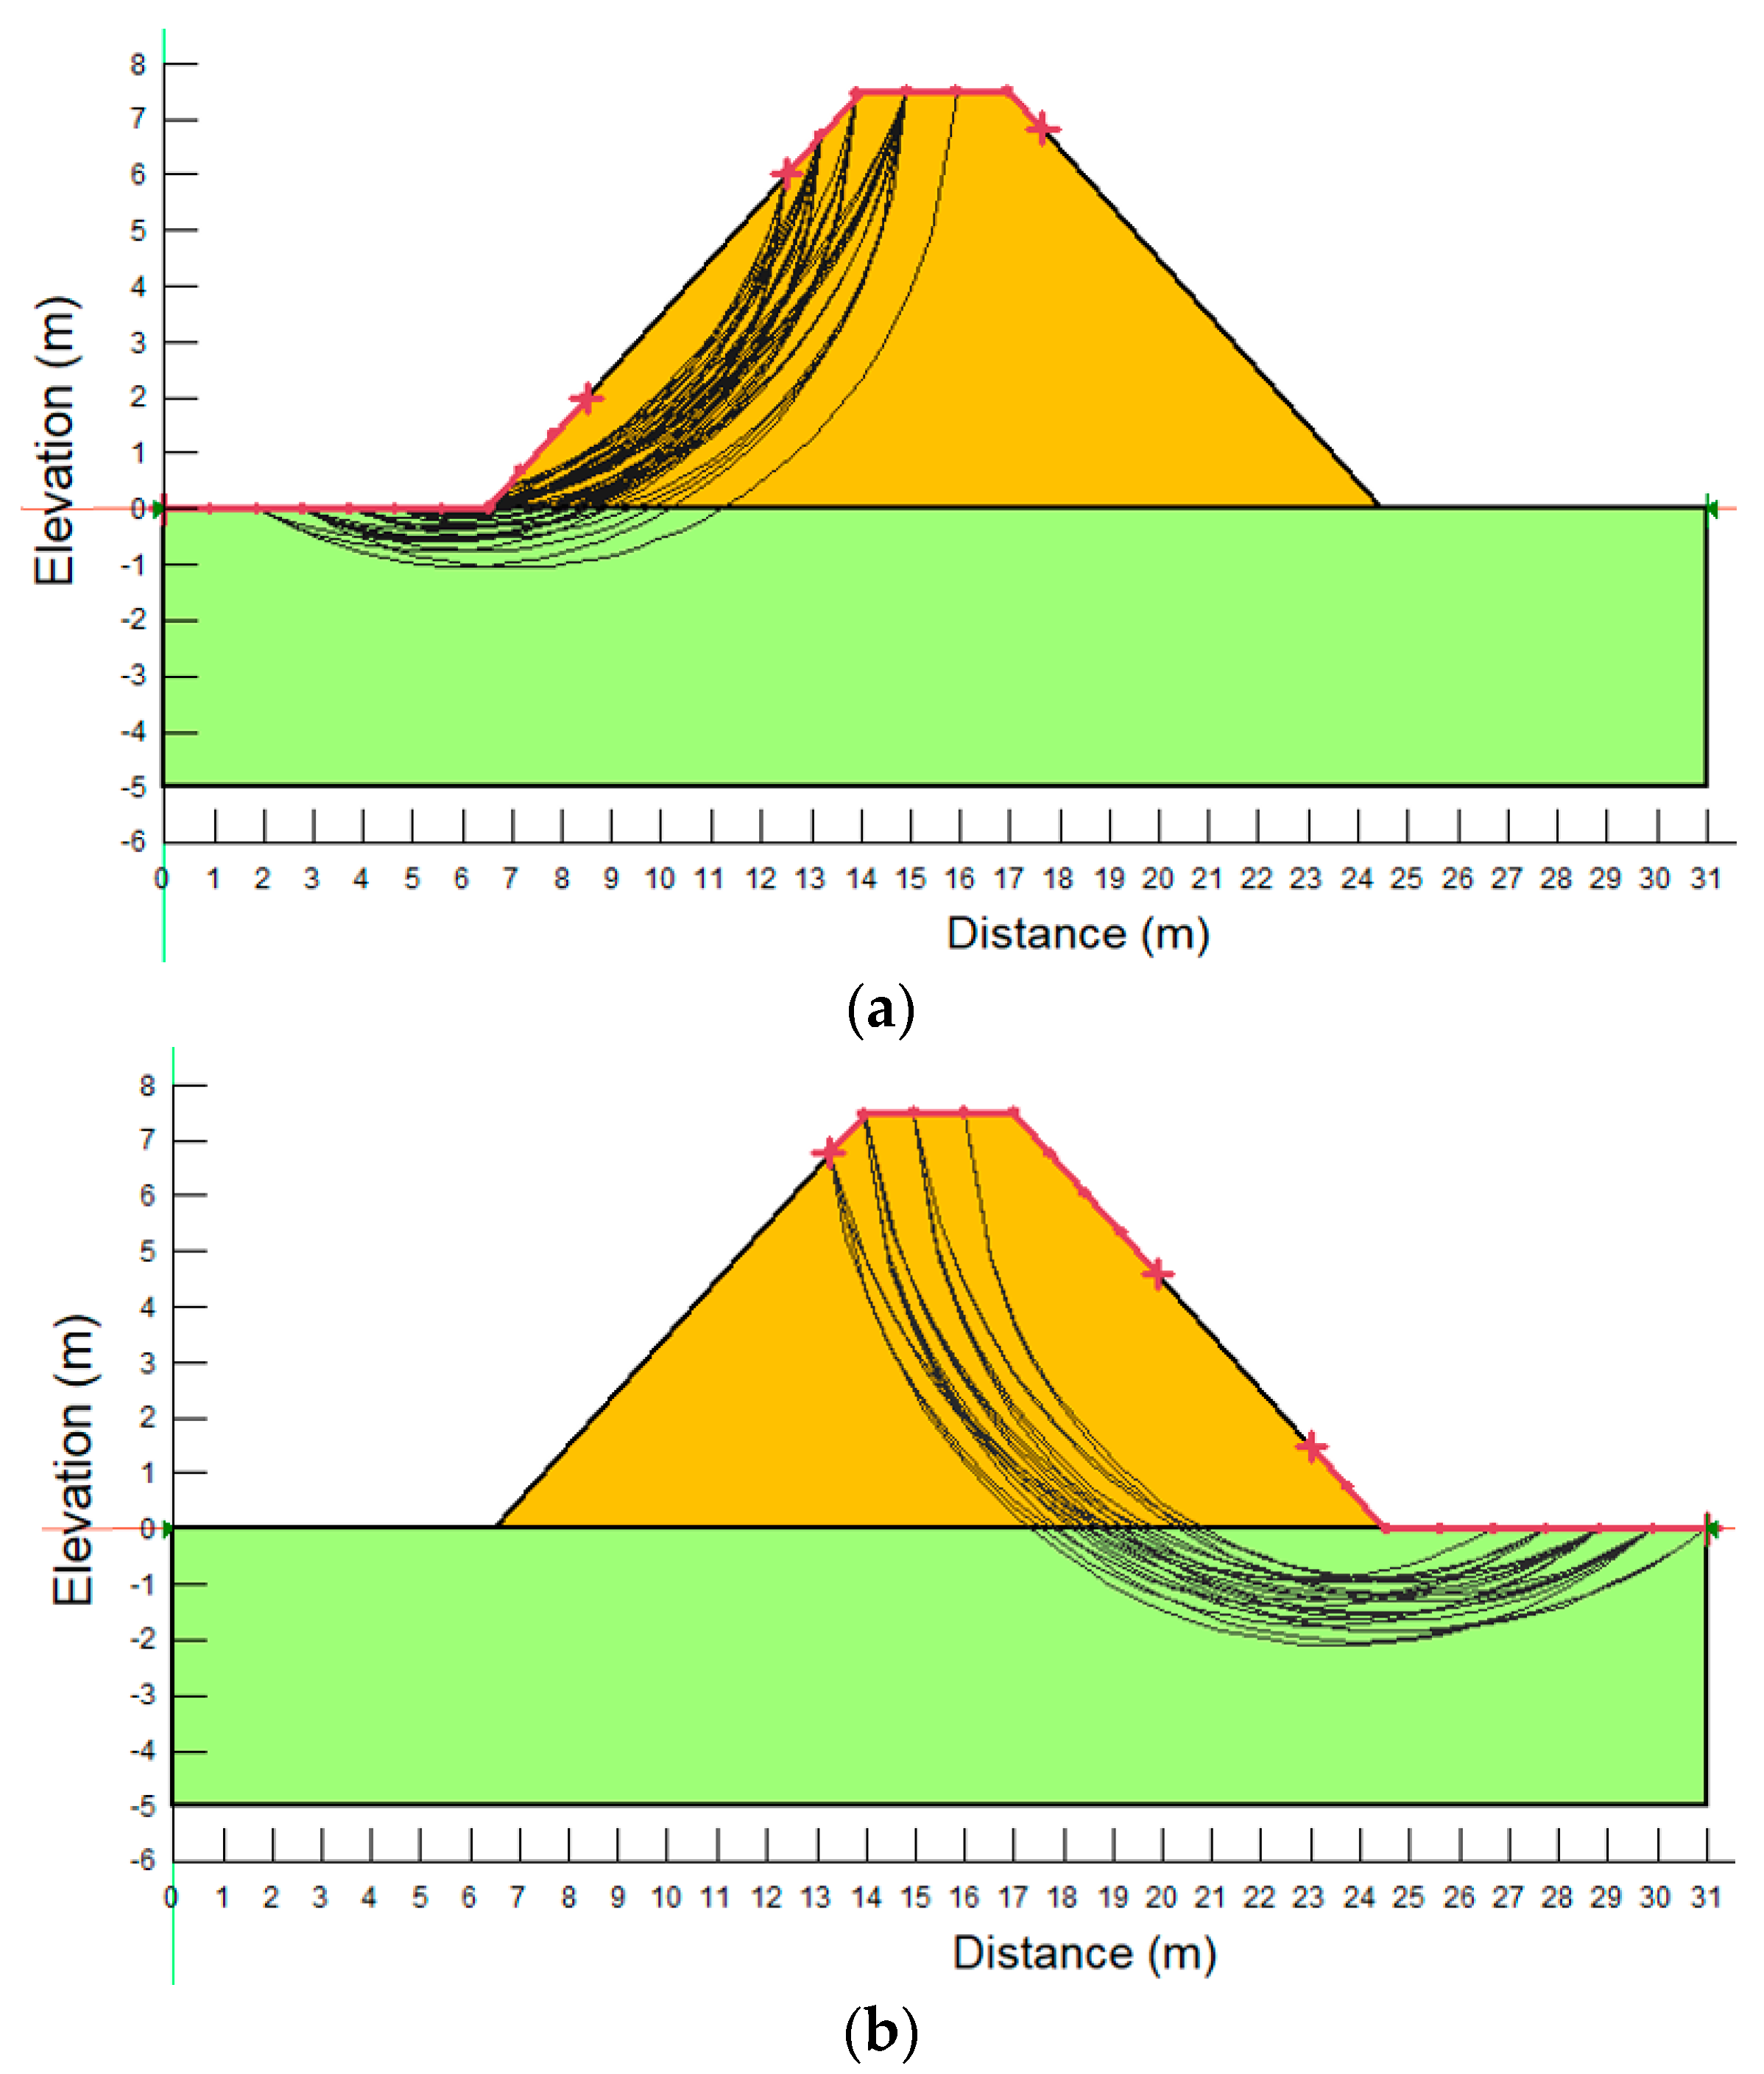
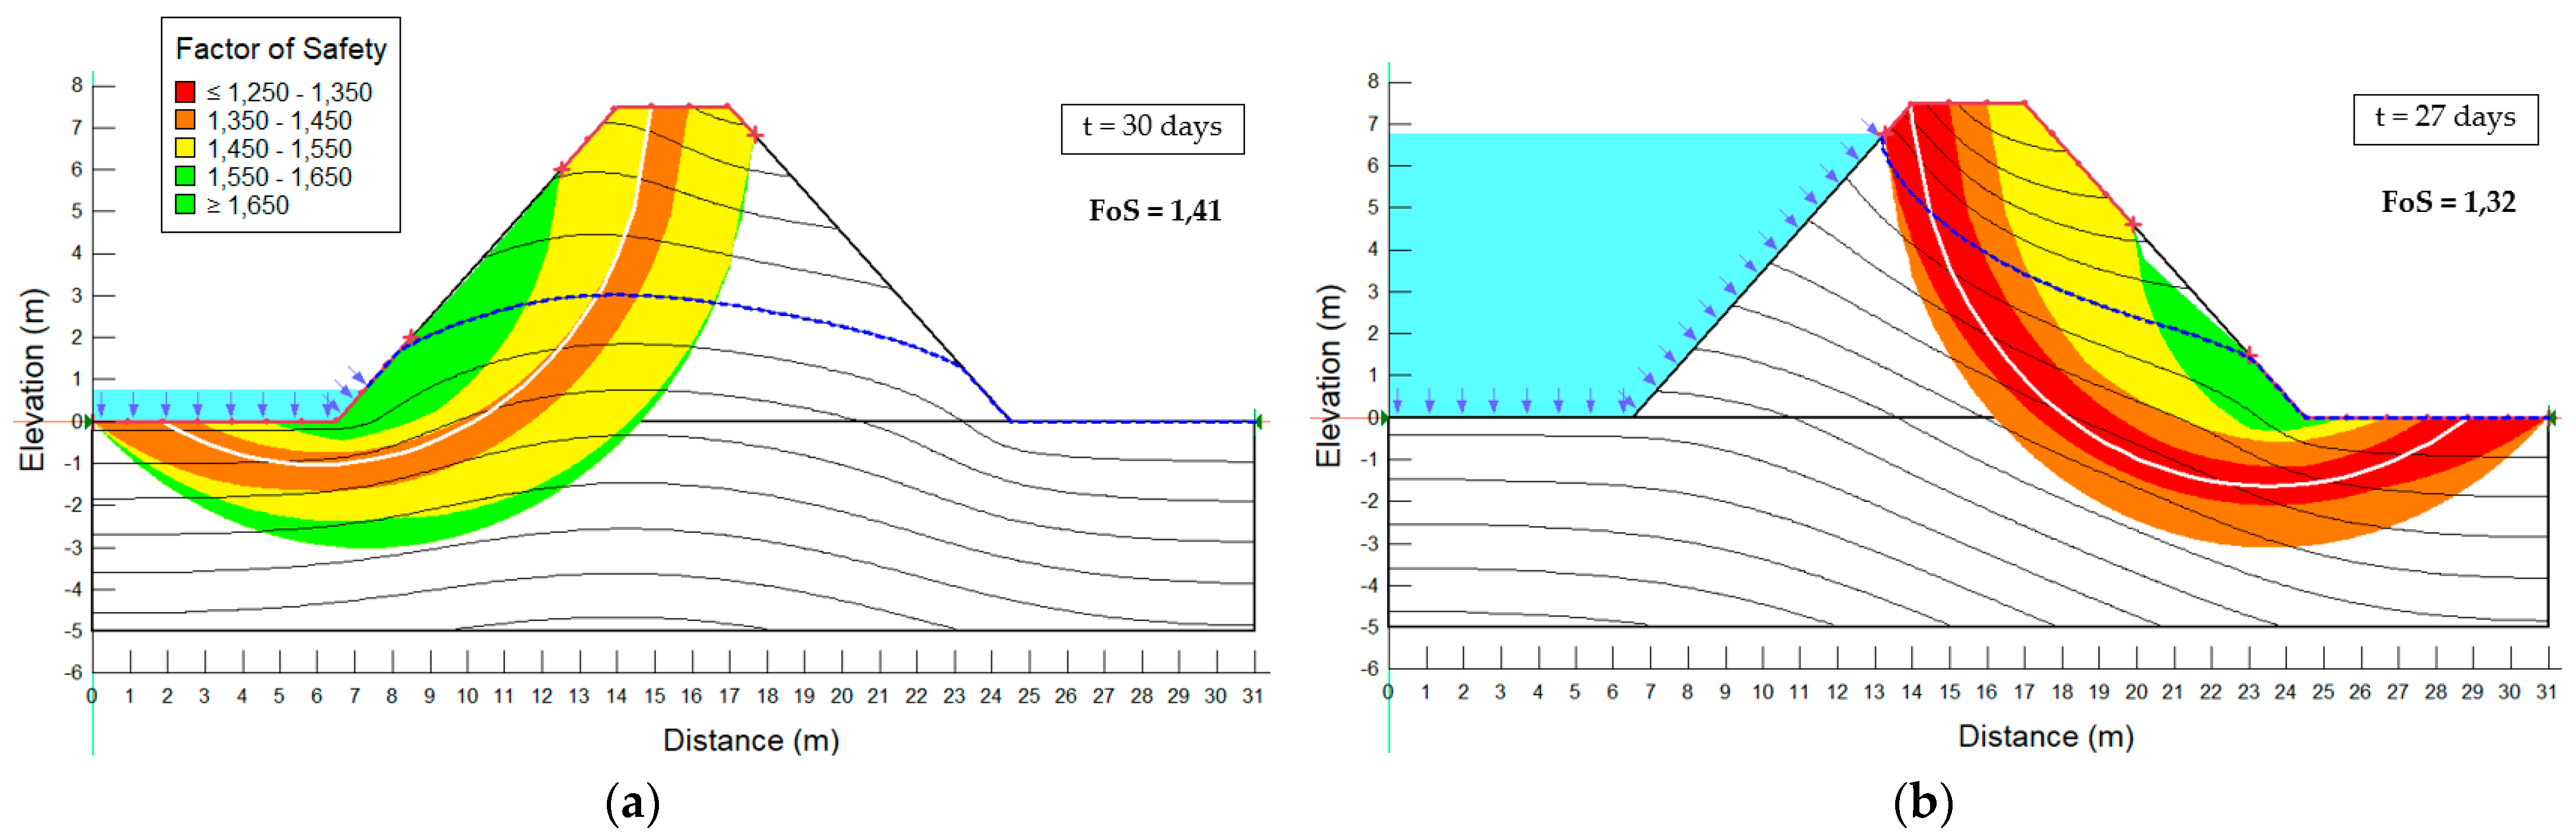
4.2. Stability Analyses

The pore water pressure distributions obtained from seepage analysis, both in transient and steady state conditions, were used to evaluate the stability of the embankment on both riverside and landside slopes, expressed in terms of Factor of Safety. Stability analyses were performed with the software SLOPE/W [42] and adopting the Morgenstern and price limit equilibrium method [43].
Circular slip surfaces were generated by setting geometric constraints, consisting in the ranges for the entry and the exit zones of the sliding mechanisms, selected at the top and the toes of the embankment (Figure 14).
The failure criterion of Vanapalli et al. [44], implemented in the software, was used for considering unsaturated shear strength contribution and it can be expressed in the form (Equation (7)):
τ = c + ( σ n u a ) tan φ + u a u w S e tan φ
where τ is the shear strength, σ n is the total normal stress, u a is the pore air pressure, u w is pore water pressure, c’ is the effective cohesion, φ is the friction angle in terms of effective stress, and S e is the effective degree of saturation. In saturated conditions, when the pore-air pressure, ua, is equal to the pore water pressure, uw, Equation (7) turns into the classical Mohr–Coulomb failure criterion and the shear strength is a function solely of the normal effective stress. The second part of the equation provides the shear strength contribution due to matric suction u a u w , that is correlated to the soil water retention curve by the term S e . The soil parameters adopted in the evaluation of the factors of safety, related to the sliding mechanisms hereafter investigated, are reported in Table 5.

4.3. Results and Discussion

The results of the steady-state analysis, performed taking the maximum hydrometric height, in terms of pore water pressure and total head distributions are showed in Figure 15. The phreatic surface reaches a considerable height on the landside slope (half of the overall embankment elevation) and the body of the embankment is almost fully saturated.
The factor of safety (FoS) associated to the steady-state regime investigated is just above one (1.05), which theoretically corresponds to an incipient condition of collapse. The fact that the FoS turned out to be slightly greater than one, despite the significant increase in pore water pressure and the substantial raise of the phreatic surface, is due to the high shear resistance of the TS70%-PON30% mixture, which constitutes the embankment body. It should be noted that the analyses in steady state seepage conditions, though not being representative for the specific case, may provide useful information with regard to the existing margin of safety of the river embankment, as the related FoS might be identified with the reference threshold for a limit condition. Nevertheless, only transient seepage analysis, taking into account the effective fluctuations of the river water level, can predict the actual safety conditions of an earthen retaining structure. Figure 16 summarizes the results of the transient seepage analysis in terms of pore water pressure contours, with reference to four significant time steps: (i) at the beginning of the first hydrometric peak (t = 3 days), (ii) after the first drawdown (t = 7 days), (iii) at the end of the second hydrometric peak (t = 15 days) and (iv) in correspondence of the end of the third peak (t = 27 days), while the hydrometric level is again at its maximum value.
In the light of the transient seepage results plotted above, some meaningful observations can be made. The groundwater flow predominantly develops in the body embankment, due to the remarkable difference in hydraulic conductivities between this unit and the foundation layer (1.29 × 10⁻⁷ m/s and 6.67 × 10⁻¹⁰ m/s respectively). During the first high water event, about a third of the embankment turns out to be already in saturated conditions. This outcome can be fairly attributable to the retention properties, the significant hydraulic permeability which characterizes the TS70%-PON30% mixture, as well as to the magnitude of the flooding event on the embankment.
After the first drawdown, the phreatic surface within the riverbank does not come back to its initial configuration, on the contrary it remains at a considerable height in correspondence of the toe of the embankment on the riverside. It is worth noting that, while the drawdown occurs, the groundwater flow reverses its motion, heading from the bank towards the river. The progression of hydrometric peaks results in a gradual advancement of the phreatic surface towards the landside slope, which leads to a significant increasing of the pore water pressure in the entire riverbank section.
The correlation between river stages, the associated pore water pressures and their effects in terms of bank stability is evident observing the evolutions of the factor of safety over time, both for the riverside and landside slopes, presented in the following diagram together with the hydrograph considered (Figure 17).
Following the first river stage rise, a reduction in the shear strength of the riverbank material is induced principally by the increasing of positive pore water pressures and the decrement in the resistance contribution related to soil suction. Hence, the FoS associated to the landside slope gradually decreases during the succession of hydrometric peaks, reaching a minimum value at last step of analysis.
With reference to the riverside slope, the stabilizing effect provided by the river water level prevails over the destabilizing forces generated by the build-up of pore water pressures when the water stage rises and, consequently, the FoS tends to increase. A significant decrease of the safety factor is however observed during the persistence of the hydrometric peaks, as a consequence of increasingly higher pore water pressures near the riverside slope. Then, when a rapid drawdown occurs, following a high water level stage, the embankment material is still close to a saturated condition, but the confining pressure is no longer present to counterbalance the shear strength reduction and this results in a fast decay of the safety factor.
Slip surfaces obtained by Limit Equilibrium stability analyses for both river embankment’s sides are reported in Figure 18, through a graphical representation called ‘safety map’ [45]. Considering all the valid trial slip surfaces determined by the numerical code, these can be grouped into homogeneous ranges of FoS identified by different colored bands in order to easily identify critical zones. The red color is here associated to the lowest factors of safety, while the green represents the sliding mechanisms related to the highest FoS values.
Since the most critical slip surfaces for both riverside and landside slopes involve the upper portion of the foundation layer, starting from the crest of the riverbank, the predominant failure mechanism for the present embankment section might be the macro-instability of the slopes.
However, as the minimum value of the safety factor is approximately equal to 1.32 for the landside slope and to 1.41 for the riverside slope, the embankment results to be in a stable condition for the whole elapsed period of time. Although both values are far from unity, the riverside zone appears quite more secure than the landside one, as suggested by the color maps. Moreover, it is noted that the minimum value of safety factors is not attained at the same time in both slopes. It corresponds to the third hydrometric peak for the landside slope and to the third short drawdown for the riverside slope, as expected.
Comparing the results in terms of factor of safety between the steady-state and the transient seepage analyses carried out, it is evident that the steady-state condition is associated to a safety margin even lower, frequently resulting in a highly conservative river embankment stability assessment and, generally, as an excessively prudential assumption.

5. Conclusions

In the present contribution, a methodological approach for the investigation of the hydraulic response and the stability assessment of fluvial embankments, based on laboratory testing and numerical modelling has been thoroughly described. The entire procedure takes its beginnings from the synthetic representation of the main characteristics of riverbanks subjected to frequent fluctuations of retained water levels, where consequent variation in the positive pore water pressure and suction distribution are typical. A simplified geometry, eventually reproducible in scaled physical models and characterized by a trapezoidal embankment lying on a finer grained soil foundation, has been so taken as reference.
The laboratory setup starts with the identification of the optimal physical properties and the retention behaviour of the unsaturated compacted earthfill material and includes the hydraulic characterization of both layers involved in the study, as well as a series of triaxial compression tests in saturated conditions. Seepage and stability numerical simulations have been carried out through a combination of FE (for pore water pressure computation) and LE (for stability evaluation) analyses, firstly considering both the stationary and transient flow conditions and then focusing on two main global failure mechanisms of the riverside and landside slopes. The importance of carrying out transient seepage analyses, in the case of succeeding river flood events, has been highlighted, since steady-state seepage analyses performed at the maximum hydrometric height recorded, frequently results in excessively conservative stability assessments. Factor of safety variations with time have been determined, with respect to all these aspects, gathering key information on the effects of river level fluctuations on the embankment stability conditions, which can turn out very useful for further detailed experimental and numerical investigations on the river embankment response.

Author Contributions

Conceptualization, R.V. and M.P.; Data curation, R.V., E.D., C.G.G. and D.G.; Formal analysis, R.V. and E.D.; Investigation, R.V.; Methodology, R.V., E.D., C.G.G. and M.P.; Project administration, R.V.; Software, E.D., C.G.G. and M.P.; Supervision, R.V. and M.P.; Validation, R.V. and M.P.; Writing—original draft, R.V., E.D. and M.P.; Writing—review & editing, R.V., E.D., C.G.G., D.G. and M.P. All authors have read and agreed to the published version of the manuscript.

Funding

This research was funded under the scheme for “Research Projects of National Relevance” (in Italian: Progetti di Ricerca di Rilevante Interesse Nazionale—PRIN), Bando 2017, grant number 2017YPMBWJt, promoted by the Italian Ministry of Education, University and Research (in Italian: Ministero dell’Istruzione, dell’Università e della Ricerca—MIUR).

Institutional Review Board Statement

Not applicable.

Informed Consent Statement

Not applicable.

Data Availability Statement

The authors confirm that all data used during the study appear in the submitted article.

Acknowledgments

This work has been supported by the project “REDREEF-Risk Assessment of Earth Dams and River Embankment to Earthquakes and Floods” funded by the MIUR Progetti di Ricerca di Rilevante Interesse Nazionale (PRIN) Bando 2017-grant 2017YPMBWJt.

Conflicts of Interest

The authors declare no conflict of interest.

References

  1. European Environment Agency. Floods. Available online: https://www.eea.europa.eu/archived/archived-content-water-topic/water-resources/floods (accessed on 23 April 2021).
  2. European Environment Agency. Economic Losses from Climate-Related Extremes in Europe. Available online: https://www.eea.europa.eu/data-and-maps/indicators/direct-losses-from-weather-disasters-4/assessment (accessed on 23 April 2021).
  3. Simonini, P.; Cola, S.; Bersan, S. Caratterizzazione Geotecnica, meccanismi di collasso e monitoraggio degli argini fluviali. In Proceedings of the XXV Convegno Nazionale di Geotecnica, Baveno, Italy, 4–6 June 2014; Volume 1, pp. 229–268. [Google Scholar]
  4. CIRIA; Ministry of Ecology of United Kingdom; USACE. The International Levee Handbook (C731); CIRIA: London, UK, 2013.
  5. Vannucchi, G.; Gottardi, G.; Madiai, C.; Marchi, M.; Tonni, L. Analisi della probabilità di collasso arginale dei grandi fiumi. In Proceedings of the XXV Convegno Nazionale di Geotecnica, Baveno, Italy, 4–6 June 2014; Volume 1, pp. 303–319. [Google Scholar]
  6. Wolman, M.G. Factors influencing the erosion of cohesive river banks. Am. J. Sci. 1959, 257, 204–216. [Google Scholar] [CrossRef]
  7. Hooke, J.M. An analysis of the processes of river bank erosion. J. Hydrol. 1979, 42, 39–62. [Google Scholar] [CrossRef]
  8. Thorne, C. Processes and mechanisms of river bank erosion. In Gravel-Bed Rivers: Fluvial Processes, Engineering and Management; John Wiley & Sons Inc.: Hoboken, NJ, USA, 1982; pp. 227–271. [Google Scholar]
  9. Rinaldi, M.; Casagli, N. Stability of streambanks formed in partially saturated soils and effects of negative pore water pressures: The Sieve River (Italy). Geomorphology 1999, 26, 253–277. [Google Scholar] [CrossRef]
  10. Federal Emergency Management Agency. Technical Manual for Dam Owners: Impacts of Animals on Earthen Dams; FEMA Rep. 47; FEMA: Washington, DC, USA, 2005.
  11. Kok, M.; TU Delft/HKV lijn in water; Jongejan, R.; Jongejan, R.M.C.; Nieuwjaar, M.; Waternet; Tánczos, I.; Ministerie van Infrastructuur en Milieu, Rijkswaterstaat, Expertise Netwerk Waterveiligheid (RWS, ENW). Fundamentals of Flood Protection; NPN Drukkers: Breda, The Netherlands, 2017. [Google Scholar]
  12. Lee, C.W.; Kim, Y.S.; Park, S.Y.; Kim, D.G.; Heo, G. The behavior characteristics of a reservoir levee subjected to increasing water levels. J. Civ. Eng. Manag. 2017, 23, 15–27. [Google Scholar] [CrossRef]
  13. Saran, R.K.; Viswanadham, B.V.S. Centrifuge model tests on the use of geosynthetic layer as an internal drain in levees. Geotext. Geomembr. 2018, 46, 257–276. [Google Scholar] [CrossRef]
  14. Wang, Z.F.; Li, J.H.; Zhang, L.M. Influence of cracks on the stability of a cracked soil slope. In Proceedings of the 5th Asia-Pacific Conference on Unsaturated Soils, Pattaya, Thailand, 29 February–2 March 2012; Volume 2, pp. 594–600. [Google Scholar]
  15. Orlandini, S.; Moretti, G.; Albertson, J.D. Evidence of an emerging levee failure mechanism causing disastrous floods in Italy. Water Resour. Res. 2015, 51, 7995–8011. [Google Scholar] [CrossRef] [Green Version]
  16. Springer, F.M., Jr.; Ullrich, C.R.; Hagerty, D.J. Streambank stability. J. Geotech. Eng. 1985, 111, 624–640. [Google Scholar] [CrossRef]
  17. Lawler, D.M.; Thorne, C.R.; Hooke, J.M. Bank erosion and instability. In Fluvial Geomorphology for River Engineering and Management; Thorne, C.R., Hey, R.D., Newson, M.D., Eds.; John Wiley & Sons: Chichester, UK, 1997; pp. 137–172. [Google Scholar]
  18. Baldi, G.; Bellotti, R.; Crippa, V.; Fretti, C.; Ghionna, V.N.; Jamiolkowski, M.; Ostricati, D.; Pasqualini, E.; Pedroni, S. Laboratory validation of in situ tests. In Proceedings of the 11th International Conference on Soil Mechanics and Foundation Engineering, San Francisco, CA, USA, 12–16 August 1985. [Google Scholar]
  19. Baldi, G.; Bellotti, R.; Ghionna, V.N.; Jamiolkowski, M.; Pasqualini, E. Interpretation of CPT’s and CPTU’s. In Proceedings of the 4th International Geotechnical Seminar, Balkema, Singapore, 27 November 1986; pp. 3–10. [Google Scholar]
  20. Bellotti, R.; Jamiolkowski, M.; Lo Presti, D.C.F.; O’Neill, D.A. Anisotropy of small strain stiffness in Ticino sand. Géotechnique 1996, 46, 115–131. [Google Scholar] [CrossRef]
  21. Fioravante, V. Anisotropy of small strain stiffness of Ticino and Kenya sands from seismic wave propagation measured in triaxial testing. Soils Found. 2000, 40, 129–142. [Google Scholar] [CrossRef] [Green Version]
  22. Fioravante, V.; Giretti, D. Unidirectional cyclic resistance of Ticino and Toyoura sands from centrifuge cone penetration tests. Acta Geotech. 2016, 11, 953–968. [Google Scholar] [CrossRef]
  23. Jamiolkowski, M.B.; Lo Presti, D.C.F.; Manassero, M. Evaluation of relative density and shear strength from CPT and DMT. In Proceedings of the Soil behavior and soft ground construction, Ladd symposium, Reston, VA, USA, 5–6 October 2001; Germaine, T.C., Sheahan, T.C., Whitman, R.V., Eds.; ASCE: Reston, VA, USA, 2001; Volume 119, pp. 201–238. [Google Scholar]
  24. ASTM D1557-12e1. Standard Test Methods for Laboratory Compaction Characteristics of Soil Using Modified Effort (56,000 ft-lbf/ft3 (2700 kN-m/m3)); ASTM International: West Conshohocken, PA, USA, 2012; Available online: http://www.astm.org (accessed on 23 April 2021).
  25. Darcy, H. Les Fontaines Publiques de la Ville de Dijon: Exposition et Application des Principes a Suivre et des Formules a Employer dans les Questions de Distribution d’eau; Dalmont: Paris, France, 1856. [Google Scholar]
  26. Nicotera, M.; Papa, R.; Urciuoli, G. An experimental technique for determining the hydraulic properties of unsaturated pyroclastic soils. Geotech. Test. J. 2010, 33. [Google Scholar] [CrossRef]
  27. Schindler, U. Ein schnellverfahren zur messung der wasserleitfähigkeit im teilgesättigten boden an stechz, Arch. Acker Pfla-zenbau Bodenkd 1980, 24, 1–7. [Google Scholar]
  28. Richards, L.A. Porous plate apparatus for measuring moisture retention and transmission by soils. Soil Sci. 1948, 66, 105–110. [Google Scholar] [CrossRef]
  29. Richards, L.A. Physical condition of water in soil. In Methods of Soil Analysis. Part 1. Agronomy Monograph; Black, C.A., Ed.; ASA, SSSA: Madison, WI, USA, 1965; pp. 128–152. [Google Scholar]
  30. Mualem, Y. A new model for predicting the hydraulic conductivity of unsaturated porous media. Water Resour. Res. 1976, 12, 513–522. [Google Scholar] [CrossRef] [Green Version]
  31. Van Genuchten, M.T. A closed-form equation for predicting the hydraulic conductivity of unsaturated soils. Soil Sci. Soc. Am. J. 1980, 4, 892–898. [Google Scholar] [CrossRef] [Green Version]
  32. Šimůnek, J.; Šejna, M.; Saito, H.; Sakai, M.; van Genuchten, M.T. HYDRUS Software Series 3, Version 4.0; The HYDRUS-1D Software Package for Simulating the Movement of Water, Heat, and Multiple Solutes in Variably Saturated Media; Department of Environmental Sciences, University of California Riverside: Riverside, CA, USA, 2008.
  33. Marquardt, D.W. An algorithm for least-squares estimation of nonlinear parameters. J. Soc. Ind. Appl. Math. 1963, 11, 431–441. [Google Scholar] [CrossRef]
  34. Pirone, M.; Reder, A.; Rianna, G.; Pagano, L.; Nicotera, M.V.; Urciuoli, G. Laboratory and physical prototype tests for the investigation of hydraulic hysteresis of pyroclastic soils. Geosciences 2020, 10, 320. [Google Scholar] [CrossRef]
  35. Rianna, G.; Comegna, L.; Pagano, L.; Picarelli, L.; Reder, A. The role of hydraulic hysteresis on the hydrological response of pyroclastic silty covers. Water 2019, 11, 628. [Google Scholar] [CrossRef] [Green Version]
  36. Hueckel, T.; Baldi, G. Thermoplasticity of saturated clays: Experimental constitutive study. J. Geotech. Eng. 1990, 116. [Google Scholar] [CrossRef]
  37. Hueckel, T.; Pellegrini, R. Thermoplastic modelling of undrained failure of saturated clay due to heating. Soils Found. 1991, 31, 11–16. [Google Scholar] [CrossRef] [Green Version]
  38. Geo-slope International Ltd. Seep/W, Groundwater Seepage Analysis; GEO-SLOPE International Ltd.: Calgary, AB, Canada, 2012. [Google Scholar]
  39. Fredlund, D.G.; Rahardjo, H. Soil Mechanics for Unsaturated Soils; John Wiley & Sons: New York, NY, USA, 1993. [Google Scholar]
  40. Richards, L.A. Capillary conduction of liquids through porous medium. Int. J. Appl. Phys. 1931, 1, 318–333. [Google Scholar] [CrossRef]
  41. Gottardi, G.; Gragnano, C.G.; Ranalli, M.; Tonni, L. Reliability analysis of riverbank stability accounting for the intrinsic variability of unsaturated soil parameters. Struct. Saf. 2020, 86, 01973. [Google Scholar] [CrossRef]
  42. Geo-slope International Ltd. Slope/W, Slope Stability Analysis; GEOSLOPE International Ltd.: Calgary, AB, Canada, 2012. [Google Scholar]
  43. Morgenstern, N.R.; Price, V.E. The analysis of the stability of general slip surfaces. Géotechnique 1965, 15, 79–93. [Google Scholar] [CrossRef]
  44. Vanapalli, S.K.; Fredlund, D.G.; Pufahl, D.E.; Clifton, A.W. Model for the prediction of shear strength with respect to soil suction. Can. Geotech. J. 1996, 33, 379–392. [Google Scholar] [CrossRef]
  45. Baker, R.; Leshchinsky, D. Spatial distribution of safety factors. J. Geotech. Geoenviron. 2001, 127, 135–145. [Google Scholar] [CrossRef]
Figure 2. Recent riverbank breaches occurred in: (a) San Matteo (MO), Secchia river, 2014; (b) Lentigione (RE), Enza river, 2017; (c) Villafranca (FC), Montone river, 2019; (d) Nonantola (MO), Panaro river, 2020.
Geosciences 11 00192 g002
Figure 3. Geometry of the section of the riverbank analyzed.
Geosciences 11 00192 g003
Figure 4. Grain size distributions of the tested materials.
Geosciences 11 00192 g004
Figure 5. Suction measurements in samples after compaction: (a) Soil moisture Probe Parts; (b) Matric suction vs. Time.
Geosciences 11 00192 g005
Figure 6. Saturated permeability measurements: (a) MP2; (b) MP3; (c) MP4; (d) MP5 specimens.
Geosciences 11 00192 g006
Figure 7. Apparatus for the evaporation tests, modified from Nicotera et al. [26]: (a) sampler changer; (b) specimen ring and sampler holder.
Geosciences 11 00192 g007
Figure 8. (a) Soil Water Retention Curves (SWRCs) and (b) Hydraulic Conductivity Functions (HCFs) determined by inverse analyses in Hydrus 1D (black continuous line) overlapped on measurements obtained in the ku-pF apparatus, in the Pressure Plate and in the permeameter (red symbols).
Geosciences 11 00192 g008
Figure 9. Stress-strain behavior of TS70%-PON30% mixture: (a) q-εa; (b) q-p’; (c) εva; (d) e-p’ planes.
Geosciences 11 00192 g009
Figure 10. Pontida clay (PON): (a) saturated permeability and (b) oedometric curve, from oedometer test.
Geosciences 11 00192 g010
Figure 11. Pontida clay (PON) mechanical properties: critical state conditions in the (a) q-p’ and (b) e-p’ planes from triaxial tests.
Geosciences 11 00192 g011
Figure 12. Initial pore water pressure distribution for transient seepage analysis (isoline increment = 10 kPa), boundary conditions and modelling mesh. Phreatic surface in blue bold line.
Geosciences 11 00192 g012
Figure 13. Numerical total hydraulic head boundary condition assumed in the transient seepage analysis.
Geosciences 11 00192 g013
Figure 14. Slip surfaces investigated for the riverside (a) and the landside slopes (b). Entry and exit ranges of sliding mechanism are drawn in red.
Geosciences 11 00192 g014
Figure 15. Results of the steady state seepage analysis: (a) pore water pressure distribution (isoline increment = 10 kPa) and (b) water total head distribution (isoline interval = 0.5 m). The blue bold line indicates the estimated location of the phreatic surface.
Geosciences 11 00192 g015
Figure 16. Pore water pressure distribution at different stages during the transient seepage analysis: (a) at the first peak of the hydrograph (t = 3 days), (b) after the first drawdown (t = 7 days), (c) during the second hydrometric peak (t = 15 days), (d) in correspondence of the end of the third peak (t = 27 days). The black arrows represent velocity vectors of the groundwater flow.
Geosciences 11 00192 g016
Figure 17. Variation over time of Factor of Safety computed at each time step for the critical slip surface of riverside and landside slopes, compared to the numerical water level assumed.
Geosciences 11 00192 g017
Figure 18. Riverbank safety maps for riverside (a) and landside (b) slopes, isolines of pore water pressure distribution for the most critical time steps and minimum FoS attained. The most critical slip surface is drawn in white.
Geosciences 11 00192 g018
Table 1. Average on index properties of the tested materials (γmin maximum value of soil unit weight, γmax minimum value of soil unit weight, emin minimum value of void ratio, emax maximum value of void ratio, Gs specific soil density, D50 mean particle size, Uc uniformity coefficient, LL limit liquid, PL plastic limit, PI plasticity index).
SoilɣminɣmaxeminemaxGsD50UcLLPLPI
kN/m3kN/m3---mm-%%%
TS13.6416.670.5740.9232.671 10.574 11.83 1---
PON----2.744 20.015 1-23.61 113.13 110.48 1
TS70%-PON30%13.4821.300.2360.9532.684 20.458 1246.0617.6610.237.42
1 Average of two measurements. 2 Average of three measurements.
Table 2. Index properties and initial suction of the TS70%-PON30% specimens compacted at the optimum Modified Proctor (γd dry unit weight, w natural water content, n soil porosity, e void ratio, Sr degree of saturation).
SpecimenɣdwneSrSuction
kN/m3%--%kPa
MP120.898.200.2070.26184.47-
MP221.247.390.1930.24082.72-
MP320.797.800.2110.26778.534.5
MP421.107.380.1990.24879.878
MP520.827.300.2090.26574.006
Average20.977.610.2040.25679.926.17
Standard Deviation0.170.340.010.013.621.43
Table 3. Saturated permeability (ksat) of the TS70%-PON30% specimens and hydraulic parameters of the Mualem–van Genuchten (MVG) retention model.
SpecimenksatθrθsatαnVlR2
m/s--1/kPa---
MP22.33 × 10−7------
MP31.10 × 10−80.0050.1900.0131.650-0.0300.920
MP41.80 × 10−7------
MP56.08 × 10−70.0170.2000.0111.400−0.3300.930
Logarithmic Mean1.29 × 10−70.0110.1950.0121.525−0.1800.925
Standard Deviation-0.0060.0050.0010.1250.1500.005
Table 4. Characteristics of TS70%-PON30% specimens used in triaxial testing.
SampleSpecimenγdwnσ’c
(kN/m3)(%)(-)(kPa)
MP6MP6_120.847.920.21050
MP6_221.017.540.203100
MP6_320.897.570.208200
MP7MP7_121.027.390.20375
MP7_221.077.400.201150
MP7_320.797.210.212300
Average 20.947.510.206
Standard Deviation 0.100.220.004
Table 5. Soil parameters adopted in the river embankment stability analyses.
Materialγsat (kN/m2)φ’ (°)c’ (kPa)
Embankment Body22.9645.505.00
Foundation Layer21.1433.002.00
Publisher’s Note: MDPI stays neutral with regard to jurisdictional claims in published maps and institutional affiliations.

